36
VIDEO MONETIZATION REPORT Q3 2015 Viewing Made to Order #FreeWheelVMR

VIDEOMONETIZATION
REPORT
Q3 2015
Viewing Made to Order
#FreeWheelVMR

The premium video economy continues to drive new scale
across a wider expanse of screens, content, and viewers
KEY OBSERVATIONSWith video ad views and video views each growing at a rate of 28% year-over-year, the premium video economy continues to drive new scale across a wider expanse of screens, content, and viewers.
Exploring the trends in premium video in the U.S. and Europe this quarter, we noted the following key observations:
• Long-form on-demand and live content, up 30% and 113% in Q3 2015 respectively, continued to drive overall industry growth
• While entertainment amassed the largest number of video ad views throughout a day on long-form content, news and sports win back share during the morning and primetime
• Almost 50% of ad views came from outside of desktop and laptop environments, with over-the-top (OTT) devices and smartphones leading that growth
• Programmers enabled for set-top-box video on demand (STB VOD) ad insertion saw an average of 18% of their volume come from this platform, making it the second largest device in video ad delivery
• Ad views from TV Everywhere (TVE) products continued to grow at a strong pace of 242%, with 65% of all ad views coming from behind the authentication wall
• For Programmers in Europe, inventory composition between OTT, smartphone, and tablet devices mirrored that of the U.S.
FreeWheel Video Monetization Report Q3 2015 3#FreeWheelVMR

Viewing Made to Order On-Demand or On-the-Go
EXECUTIVE SUMMARY
In an era of ever increasing personalization and mobility, whether temporal or spatial, consumption of premium video content is expanding in all directions. With each quarterly update of the Video Monetization Report we use data to confirm the trends that we see every day in our professional and personal lives and shed new light on the trends that may not have hit our individual radars. The Q3 2015 report is no exception.
New data shared in this quarter’s report are metrics on STB VOD devices, which became the second largest platform for enabled Programmers in terms of dynamic video ad delivery. Furthermore, expanding on analyses from Q2 2015, we took a deeper look at viewership by daypart to understand when viewers are consuming true TV-style content. Spoiler alert! It’s strikingly similar to traditional TV viewing. By adding a new metric to the oeuvre, we dove into the world of pre-roll and how likely viewers are to see one before sneaking in a quick clip at work (shhh, we won’t tell anyone). We observed that sports leads the pack in pre-roll monetization.
Riding the wave of the positive trends we’ve reported over the past five years, long-form on-demand and live streams were once again the two fastest growing content segments, increasing 30% and 113%, respectively. OTT streaming devices saw the strongest year-over-year growth of any platform with a noteworthy 157% increase, and now these devices account for 13% of total video ad views. Moving on to handheld devices, almost 30% of ad views were delivered across portable screens, with smartphones leading growth at a vigorous 67%. Furthermore, TVE adoption showed no sign of slowing down, with MVPD app viewership growing at 176%. In lock-step, viewers were utilizing their MVPD log-in credentials to access ever more premium digital video content, with 65% of Programmer long-form and live viewing coming via authenticated channels, driven by a 242% growth in authenticated video ad views.
There’s no question that viewers are finding premium content across an ever diversifying set of screens and wires, but how many ads are they seeing? We continue to observe TV
FreeWheel Video Monetization Report Q3 20154 #FreeWheelVMR

Programmers experimenting with movement towards the TV ad load. This is especially true on live content, where the average mid-roll break included 5.4 ads, but it’s early in the game for on-demand content. And where are these ads coming from? Direct sold deals continued to dominate the premium video market, with only 5.5% of Programmer ad views coming from secondary sales channels. As scale continues to grow in premium video, we expect that programmatic will play an increasing role in balancing supply and demand– we’re just not there yet.
As we look forward, we predict that increased viewership of premium video content across all screens, shaped mutually by consumer preference and Programmer development, will continue to reaffirm both the popularity of large screen, in-home viewing as well as underline the importance of anytime, anywhere access; or in other words, viewing on-demand or on-the-go.
#FreeWheelVMR FreeWheel Video Monetization Report Q3 2015 5

CON
TENT

7#FreeWheelVMR
Watching You Watching TV
Q3 2015 saw 28% year-over-year growth in both video views and in ad views [see chart 1]. Strong growth of each metric was driven by Programmers in video ad views and Digital Pure-Plays in video views. Looking back at this same time period last year, we saw very similar top-line trends in the market, pointing to the positive progression of the premium video economy.
VIDEOVIEWS
ADVIEWS
+28% +28%
1 Ad and Video View Growth | Q3 2015 vs. Q3 2014

+9%
+30%
+113%
Short-form Long-form Live
Building industry scale in premium digital video inventory ultimately depends on cultivating a diverse content mix among the following
content lengths and types:
Short-form (0-5 min.) video clips, music videos, made-for-web content
Mid-form (5-20 min.) web series, extended clips, interviews
Long-form (20+ min.) linear-style full-length programs, feature films
Live (All) live simulcasts, sporting events
FreeWheel Video Monetization Report Q3 20158 #FreeWheelVMR
Consumption of TV-style content continues to set the stage, with video ad views delivered across long-form and live content growing at 30% and 113% year-over-year, respectively [see chart 2]. Although the summer months tend to be lighter on inventory at the onset, they were not without their hits, and the start of the fall season spurred growth in both directions with the introduction of increased live sports and new season entertainment. The more mature,
2 Ad View Growth by Content Duration | Q3 2015 vs. Q3 2014

short-end of the collection didn’t disappoint in growth, with short-form showing a respectable 9% year-over-year increase.
Looking towards the Publishers, we are happy to report on the continuation of positive trends. Ultra-premium streaming content has fully cemented its share of the New Living Room, with 61% of video ad views coming from live and long-form viewing this quarter across Programmers [see chart 3]. Pushing the fold, live content across Programmers surpassed the share of long-form, now accounting for 32% of inventory, the largest portion we have ever measured. Live volume skews towards sports Programmers and, to a growing extent, news channels – the perishable content that you need to be in front of as it happens. Entertainment, with its suitability for catch-up and binge viewing, sees less of a use-case for live streaming over IP (at least for now) and many entertainment Programmers have yet to release online simulcasts of their linear feeds. Digital Pure-Plays, on the other hand, continue to see the majority of video ad views across short-form content, and have yet to build out a robust live streaming offering, with only 2% of delivery coming across this content type.
Ad View Share by Content Duration | Q3 20153
6%
Live
2%
Long-form
9%
Mid-form
8%
Short-form81%
DIGITALPURE-PLAY
Mid-formLong-form29%
PROGRAMMER
Live Short-form32% 33%
FreeWheel Video Monetization Report Q3 2015 9#FreeWheelVMR

Smells Like Television
This quarter we examined video monetization through a different lens, grouping content into five content verticals: entertainment, kids, news, sports, and music. Notable differences can be observed within these categories as they relate to monetization across content durations, with
FreeWheel Video Monetization Report Q3 201510 #FreeWheelVMR
entertainment and kids skewing towards long-form, news and music dominated by short-form, and sports skewing towards live streaming [see chart 4].
Entertainment
60%
4%
30%
6%
MID
LIVE
SHO
RT
LON
G
3%
MID
LIVE
Kids
59%
30%
8%
SHO
RT
LON
G
2%
76%
17%
5%
LIVE
MID
LON
G
SHO
RT
News
2%
Sports
LON
G
63%
31%
4%
MID
SHO
RT
LIVE
0%
LON
G
LIVE
Music
89%
11%
.04%
MID
SHO
RT
Ad View Share by Content Vertical and Content Duration | Q3 20154

Diving deeper into our new categorization, we further break out the five verticals into ten content segments, which blend genre with content duration. Entertainment had the largest piece of total video ad views delivery at 37%, the summation of four categories: full episode entertainment, entertainment clips, movies, and entertainment simulcast [see chart 5]. Live sports saw the largest single delivery
slice at 20%, bringing the total for sports content to 33%. Next we see news with the majority of ad views delivered on-demand at 11% and a minority stake with live at 2%. Finally, consumption of ad views across kids content translated to 4% of the total.
Considering these two analyses together, ultra-premium, high-CPM ad inventory, as defined by TV-style content, is not only available, but also being monetized across Programmers as well as digital-first Publishers.
FreeWheel Video Monetization Report Q3 2015 11#FreeWheelVMR
MoviesEntertainment Simulcast
Full Episode EntertainmentEpisode Clips
On-Demand NewsLive News
Live SportsOn-Demand Sports
MUSIC
NEWS
SPORTSKIDS
ENTERTAINMENT
14%
13%
11%
20%
17%
4%
4% 2%
13%
2%
Ad View Share by Content Segment | Q3 20155
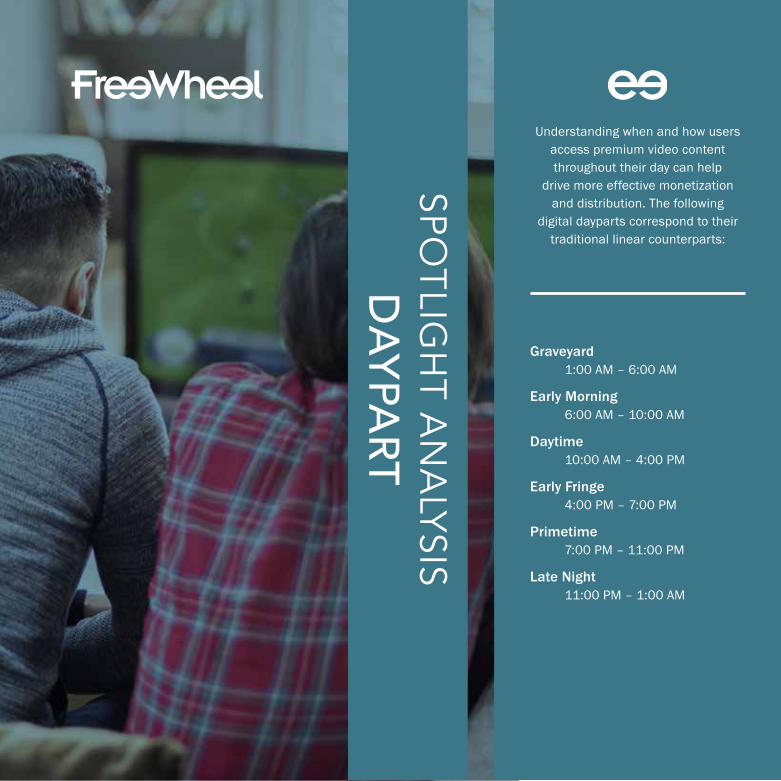
Understanding when and how users access premium video content throughout their day can help
drive more effective monetization and distribution. The following
digital dayparts correspond to their traditional linear counterparts:
Graveyard1:00 AM – 6:00 AM
Early Morning6:00 AM – 10:00 AM
Daytime10:00 AM – 4:00 PM
Early Fringe4:00 PM – 7:00 PM
Primetime7:00 PM – 11:00 PM
Late Night11:00 PM – 1:00 AM
SPOTLIG
HT A
NA
LYSISDAYPART
You Can Always Get What You Want
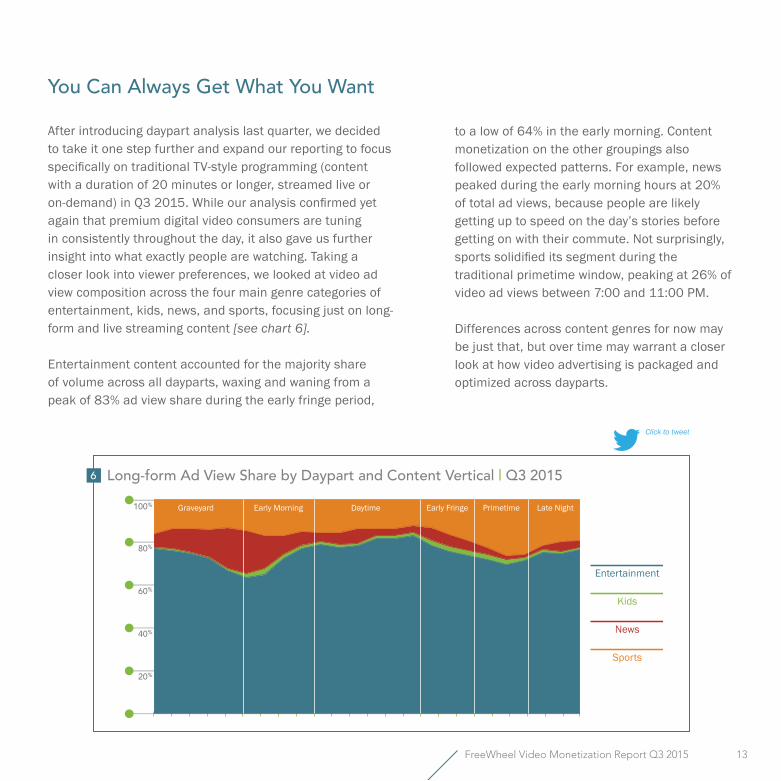
After introducing daypart analysis last quarter, we decided to take it one step further and expand our reporting to focus specifically on traditional TV-style programming (content with a duration of 20 minutes or longer, streamed live or on-demand) in Q3 2015. While our analysis confirmed yet again that premium digital video consumers are tuning in consistently throughout the day, it also gave us further insight into what exactly people are watching. Taking a closer look into viewer preferences, we looked at video ad view composition across the four main genre categories of entertainment, kids, news, and sports, focusing just on long-form and live streaming content [see chart 6].
Entertainment content accounted for the majority share of volume across all dayparts, waxing and waning from a peak of 83% ad view share during the early fringe period,
FreeWheel Video Monetization Report Q3 2015 13#FreeWheelVMR
Long-form Ad View Share by Daypart and Content Vertical | Q3 20156
100%
80%
60%
40%
20%
Early MorningGraveyard Primetime Late NightEarly FringeDaytime
Kids
Entertainment
News
Sports
to a low of 64% in the early morning. Content monetization on the other groupings also followed expected patterns. For example, news peaked during the early morning hours at 20% of total ad views, because people are likely getting up to speed on the day’s stories before getting on with their commute. Not surprisingly, sports solidified its segment during the traditional primetime window, peaking at 26% of video ad views between 7:00 and 11:00 PM.
Differences across content genres for now may be just that, but over time may warrant a closer look at how video advertising is packaged and optimized across dayparts.

DEVICE

FreeWheel Video Monetization Report Q2 2015 15FreeWheel Video Monetization Report Q3 2015 15#FreeWheelVMR
My Stream Will Go On
Digital video is decidedly a cross-screen medium, as our data consistently proves. Monetization of digital content across devices outside of desktop and laptop environments reached nearly 50% of video ad views in Q3 2015.
This trend was driven by strong growth across OTT (Roku, Apple TV, Chromecast, Gaming Consoles, and Smart TVs) and smartphone devices, at 157% and 67% respectively, as well as the premier inclusion of STB VOD, which amounted to 6% of total delivery [see chart 7].
For those Programmers that have enabled STB VOD environments, we saw the box in the living room account for 18% of total video ad views, making it the second largest device following desktop and laptop. To be sure, there is significant scale to be tapped in the STB environment and Publishers and cable/satellite operators are only scratching the surface. The volume we see here represents another step towards truly unified, full screen, fully viewable, and fraud-free television.
+3%
OTT Device
Smartphone
+157%
Tablet
+42%
Desktop/Laptop
+67%
52%
6%
13%
10%
19%
STB VOD
Ad View Share by Device | Q3 20157
STB VOD
of enabledprogrammed
volume
18%

FreeWheel Video Monetization Report Q3 201516 #FreeWheelVMR
While growth in ad views across the mature desktop and laptop environments remains relatively flat at 3% this quarter, all other devices experienced a significant lift. Across handheld devices, smartphones saw another quarter of impressive growth in video ad views at 67% year-over-year, while tablets lagged behind with a 42% lift. As screen sizes continue to increase on smartphone devices, we expect growth across tablets to slow down, a trend that’s already becoming apparent in units sold. Based on data from the IDC, Statista reports that for the last four quarters, starting in Q4 2014, overall sales have been down on tablets from the previous quarter.*
Finally, across the OTT market in Q3 2015, Apple TV and Roku continued to take significant share of the pie, comprising 38% and 31% of total ad views, respectively [see chart 8]. While hurdles like co-viewing and audience measurement have historically prevented strong growth in OTT, the wealth of consumer choice seems to be driving adoption and monetization is quickly following.
We are very encouraged by the STB and OTT numbers this quarter – a strong indication that premium content is now finding its way back into the living room but with all the benefits of the digital world.
AmazonSmart TV
Gaming Console
Roku
Chromecast
Apple TV
38%
1% 1%
20%
9%
31%
OTT Ad View Share by Device | Q3 20158
* Source: Rosoff, Matt. “It’s Not Just the iPad - the Entire Tablet Market Is in Decline.” Business Insider. Business Insider, Inc, 29 Oct. 2015.
Web. 06 Nov. 2015. http://www.businessinsider.com/tablet-sales-down-in-addition-to-ipad-2015-10

FreeWheel Video Monetization Report Q3 2015 17#FreeWheelVMR
FreeWheel Video Monetization Report Q3 201518 #FreeWheelVMR
Desktop/Laptop
20%
59%
21%
43%
16%
41%
Tablet
Live< 20 m
in.20+ m
in.
25%
13%
OTT DevicesSmartphone
10%
21%
69%
61%
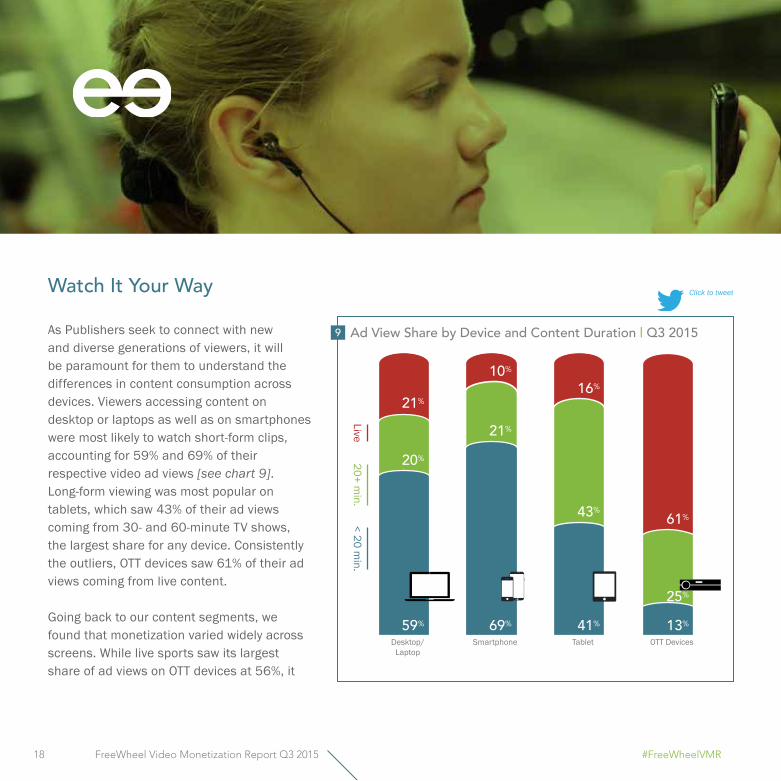
Ad View Share by Device and Content Duration | Q3 20159
Watch It Your Way
As Publishers seek to connect with new and diverse generations of viewers, it will be paramount for them to understand the differences in content consumption across devices. Viewers accessing content on desktop or laptops as well as on smartphones were most likely to watch short-form clips, accounting for 59% and 69% of their respective video ad views [see chart 9]. Long-form viewing was most popular on tablets, which saw 43% of their ad views coming from 30- and 60-minute TV shows, the largest share for any device. Consistently the outliers, OTT devices saw 61% of their ad views coming from live content.
Going back to our content segments, we found that monetization varied widely across screens. While live sports saw its largest share of ad views on OTT devices at 56%, it

was less prevalent on other platforms, and the least on mobile [see chart 10]. On the other hand, share of entertainment category video ad views, as well as kids content, across smartphone devices is very similar to that on OTT. While this might seem unexpected, in a recent study, Adobe found that in the U.S. 63% of Millennials, 48% of Gen X, 27% of Baby Boomers, and 14% of people over the age of 70 are streaming television content to their mobile devices.*
The complex relationship between device and content type consumption will require Publishers to think strategically about distribution, monetization, and user experience, in order to maintain audience and maximize revenue.
FreeWheel Video Monetization Report Q3 2015 19#FreeWheelVMR
Ad View Share by Content Segment and Device Type | Q3 201510
Desktop/Laptop
17%
17%
14%
10%
7%
7%
19%
31%
5%
13%
9%
12%
2%
3%
56%
OTT DevicesTabletSmartphone
1%2%
2%
2%
2%
3%
On-DemandNews
Live SportsMusic
Kids
On-DemandSports
Live News
EntertainmentClips
Full EpisodeEntertainment
EntertainmentSimulcast
Movies
17%
17%
4%
11%
15%
1%
2%
3%
4%
9%
17%
28%
1%
2%
7%
10%
14%
3%
1%
* Source: Adobe Mobile Consumer Report – Mastering the Complexity of Mobile With Simplicity, October 2015.

DISTRIBUTION

Like a Login Stored
Authenticated viewing (defined as viewing that occurs after viewers enter their MVPD subscription credentials) for long-form and live content accounted for 65% of monetization this quarter, up from 46% in Q3 2014 [see chart 11]. While this is a positive trend underscoring that viewers are still being drawn into TVE offerings, it does not necessarily mean that Programmers are successfully navigating the outfalls of “cord-cutters” or even “cord-nevers.” A recent study by Altman Vilandrie & Company and EPIX found that not only were Millennials significantly less likely to be pay TV subscribers, but that they also made up an even larger percentage of users who had dropped their service. Nonetheless, the study noted that this same group was 23% less likely to drop their service if they were aware TVE services were available to them, and, for those who were not subscribed to any pay TV service, over 50% said they would consider subscribing to pay TV if they could access content outside of a TV set.* So, as the value proposition of ad supported TVE continues to grow, Programmers should continue their efforts in both educating their customers and expanding viewer access.
FreeWheel Video Monetization Report Q3 2015 21#FreeWheelVMR
Q32014
Q32015
Q22015
Q12015
Q42014
60%57%57%
65%
46%
+242%
Long-form Authenticated Ad Views and Authentication Rate, Programmers | Q3 2014 – Q3 201511
* Source: Altman Vilandrie & Company. TV Everywhere: It’s All About Millennials, October 2015.
Born to Serve
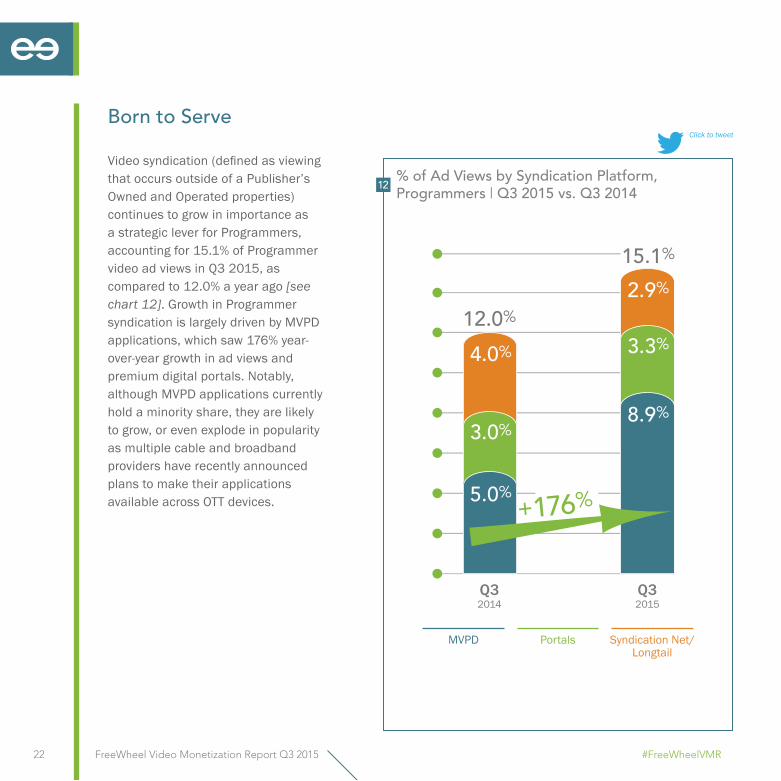
Video syndication (defined as viewing that occurs outside of a Publisher’s Owned and Operated properties) continues to grow in importance as a strategic lever for Programmers, accounting for 15.1% of Programmer video ad views in Q3 2015, as compared to 12.0% a year ago [see chart 12]. Growth in Programmer syndication is largely driven by MVPD applications, which saw 176% year-over-year growth in ad views and premium digital portals. Notably, although MVPD applications currently hold a minority share, they are likely to grow, or even explode in popularity as multiple cable and broadband providers have recently announced plans to make their applications available across OTT devices.
FreeWheel Video Monetization Report Q3 201522 #FreeWheelVMR
Q32014
Q32015
2.9%
4.0%
3.0%
5.0%
3.3%
8.9%
+176%
15.1%
12.0%
PortalsMVPD Syndication Net/Longtail
% of Ad Views by Syndication Platform, Programmers | Q3 2015 vs. Q3 201412
Direct State of Mind
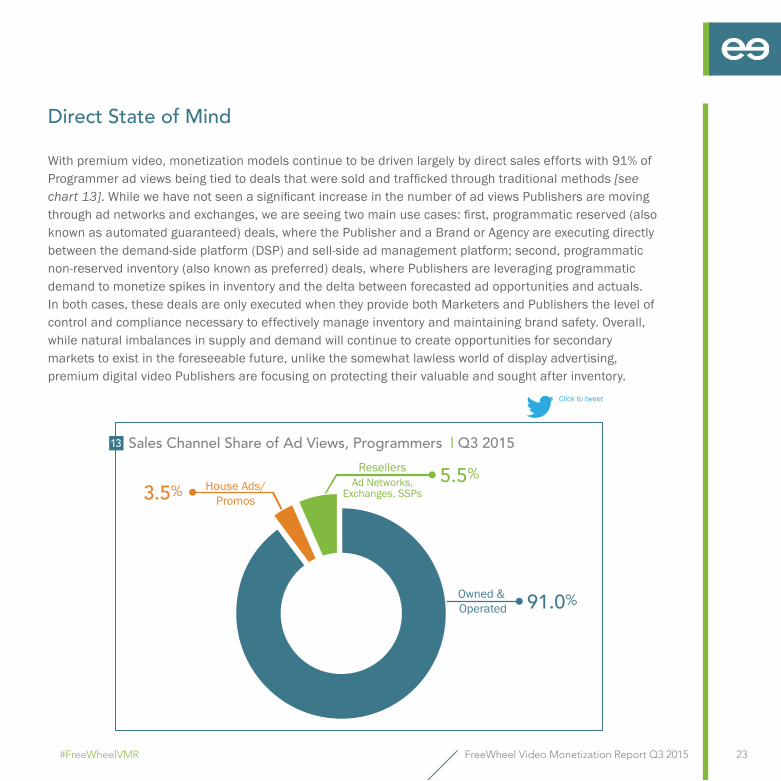
With premium video, monetization models continue to be driven largely by direct sales efforts with 91% of Programmer ad views being tied to deals that were sold and trafficked through traditional methods [see chart 13]. While we have not seen a significant increase in the number of ad views Publishers are moving through ad networks and exchanges, we are seeing two main use cases: first, programmatic reserved (also known as automated guaranteed) deals, where the Publisher and a Brand or Agency are executing directly between the demand-side platform (DSP) and sell-side ad management platform; second, programmatic non-reserved inventory (also known as preferred) deals, where Publishers are leveraging programmatic demand to monetize spikes in inventory and the delta between forecasted ad opportunities and actuals. In both cases, these deals are only executed when they provide both Marketers and Publishers the level of control and compliance necessary to effectively manage inventory and maintaining brand safety. Overall, while natural imbalances in supply and demand will continue to create opportunities for secondary markets to exist in the foreseeable future, unlike the somewhat lawless world of display advertising, premium digital video Publishers are focusing on protecting their valuable and sought after inventory.
FreeWheel Video Monetization Report Q3 2015 23#FreeWheelVMR
ResellersAd Networks,
Exchanges, SSPs5.5%
House Ads/Promos
Owned & Operated 91.0%
3.5%
Sales Channel Share of Ad Views, Programmers | Q3 201513
VIEWER EXPERIEN
CE

Got to Ad it Up
Digital Programmers continue to push ad loads towards linear standards with an average of 4.1 ads per mid-roll break, with breaks lasting 98 seconds on average. It’s important to remember that this is an average, and we continue to see experimentation on a part of the Programmers to arrive at the optimal ad experience. Live content saw the longest total break time, with an average of 5.4 ads per pod, lasting an average of 112 seconds [see chart 14]. On the shorter end, on-demand content had slightly less than four ads per break, lasting an average of 91 seconds. On the linear side, according to research by Kantar Media, broadcast and cable networks have increased paid commercial time in programming to drive higher revenues in the face of lower adverting spend and smaller audience ratings.*
FreeWheel Video Monetization Report Q3 2015 25#FreeWheelVMR
Ads per Mid-roll Break by Request Type | Q3 201514
5.40Adsper
break
112seconds
Averagead break length
3.96Adsper
break
91seconds
Averagead break length
Live On-DemandLive On-Demand
* Source: “U.S. Ad Expenditures Declined 3.9% In Q2 2015 To $38 Billion16.” Kantar Media. N.p., 16 Sept. 2015. Web. 06 Nov. 2015. http://kantarmedia.us/insight-center/reports/us-ad-expenditures-declined-39-q2-2015-38-billion
FreeWheel Video Monetization Report Q3 201526 #FreeWheelVMR
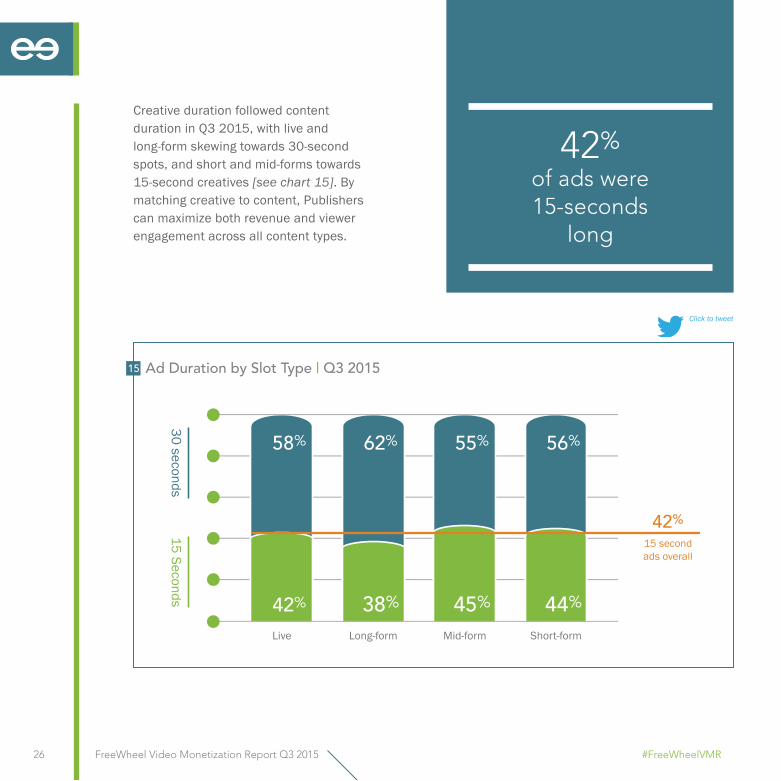
Creative duration followed content duration in Q3 2015, with live and long-form skewing towards 30-second spots, and short and mid-forms towards 15-second creatives [see chart 15]. By matching creative to content, Publishers can maximize both revenue and viewer engagement across all content types.
Ad Duration by Slot Type | Q3 201515
Live Short-formMid-formLong-form
30 seconds15 Seconds 42% 38% 45%
58% 62% 55% 56%
44%
42%15 secondads overall
42% of ads were 15-seconds
long

Introducing a brand new metric this quarter, we looked at pre-roll monetization (defined as the percentage of videos that had at least one ad play during the pre-roll slot) across short-form content by genre type [see chart 16].* Viewers were most likely to see an ad before a sports clip at 92% of the time, and least likely to see an ad before a music video at 34%. Entertainment and kids content
segments were monetized slightly over half the time at 53% and 59%, respectively, while news was monetized during a pre-roll at a rate of 66%. These differences are driven by a combination of user experience settings and sell-through.
To grow and maintain both audience and revenue, given the increasing popularity of ad-blockers, it will be essential for Publishers to deliver the optimal viewer experiences through a combination of ad load and total ad minutes.
16 Short-form Pre-roll Monetization* by Content Vertical | Q3 2015
53%
92%
34%
59%
66%
ENTERTAINMENT
KIDS
NEWS
SPORTS
MUSIC
FreeWheel Video Monetization Report Q3 2015 27#FreeWheelVMR
* The percentage of videos that had at least one ad play during the pre-roll slot

ADVERTISING

FreeWheel Video Monetization Report Q3 2015 29#FreeWheelVMR
Push It
Consumer Packaged Goods (CPG) and Retail industries led advertiser verticals in Q3 2015 in share of video ads, each yielding 21% of total monetization [see chart 17]. While we usually do not see large movements in industry shares, back-to-school season clearly drove retailer ad views this quarter, up from 18% in Q2 and 17% in Q3 2014. The mix of industries aligns with the same content on linear, as advertisers continue to diversify their screen mix to reach their target audience in multiple ways.
Other
Financial Services
Auto / Gas /Manuf / Utility
Retail
Entertainment/Media
ComputingProducts
ConsumerPackaged Goods
Telecom
21%
6%
6%
9%
12%
12%
21%
13%
Ad View Share by Advertiser Vertical | Q3 201517

EUROPEAN
MARKET AN
ALYSIS

A Change is Gonna Come
European Programmers monetized a majority of their dynamically served content across long-form on-demand, accounting for 87% of total video ad views, compared to just 29% in the U.S. [see chart 18]. While the share of mid-form ad views looked relatively equal across both continents, Europe trailed behind the U.S., rendering live and short-form content at 0.4% and 9% respectively, compared to the American 32% and 33%. As we have reported in previous quarters, the reasons behind this discrepancy are tied to the enduring predominance of pre-stitched linear ad loads and the generally less mature DAI tech stack.
Live
32%
Long-form
29%
Mid-form
6%
Short-form
33%
%
Mid-form
4%
Long-form
87%
Live
0.4%
Short-form
9%
%
18 Programmer Ad View Share by Content Duration | USA vs. Europe | Q3 2015
FreeWheel Video Monetization Report Q3 2015 31#FreeWheelVMR


As FreeWheel’s reach across Europe continues to grow, and Publishers’ distribution strategies evolve, we expect to see a transition in top-line trends. In Q3 2015, the shift most notable was the share of delivered ad views across devices. European Publishers saw almost the same share of ad views coming outside of desktop and laptop environments as their American counterparts at 46% of delivered video ad views [see chart 19]. Similar to the U.S., smartphones held the second largest share with 29% of ad views followed by OTT at 10%.
FreeWheel Video Monetization Report Q3 2015 33#FreeWheelVMR
Desktop/Laptop
54%
Smartphone
29%
OTT Device
10%
Tablet
7%
54
19 Ad View Share by Device Type | Europe | Q3 2015
Europe sees almost half of its ad views
outside desktop/laptop environments, in line
with the U.S.

Massive shifts in consumer viewing habits, rapid changes in technology, and the importance of quality, premium content have created the new Premium Video Economy. FreeWheel’s platform for video ad management and monetization powers the advertising businesses of the world’s largest media companies, generating revenue for their ad-supported content on desktop, mobile, OTT, and traditional STB devices. The dataset used for this report is one of the largest available on the usage and monetization of professional, rights managed video content, and comprised over 160 billion global video views in 2015.
The FreeWheel Video Monetization Report is released quarterly and highlights the changing dynamics of how enterprise-class content owners and distributors are monetizing premium digital video content.
As part of this analysis, we grouped Publishers into two categories:
Programmers and Multichannel Video Programming Distributors (MVPDs)
• Generate the majority of their advertising revenue from linear TV services• Offer diverse content mix on IP-based environments
Digital Pure-Play Publishers
• Generate majority of revenue from IP-based environments • Aggregate third-party content and/or are developing original content
FreeWheel Video Monetization Report Q3 201534 #FreeWheelVMR
ABOUT THIS REPORT

The FreeWheel Video Monetization Report is released quarterly and
highlights the changing dynamics of how enterprise-class content owners and
distributors are monetizing premium digital video content

Q3 2015 Video Monetization Report
MEDIA INQUIRIESLaura Colona
Director, Public Relations and Corporate Communications
FOR MORE INFORMATIONBrian Dutt
Vice President, Strategic Development
©2015 FreeWheel. All Rights Reserved.
FreeWheel.tv @FreeWheel


