PAY FOR PERFORMANCE ..................................................................................................................................................... 5
ISS Pay for Performance Methodology ........................................................................................................................ 5
Definition of Compensation ........................................................................................................................................ 6
1. How does ISS define Total Compensation (Pay) for the pay for performance methodology? .............................. 6
2. Why does ISS focus on the CEO's pay to determine pay for performance alignment? ......................................... 7
3. Why does ISS use granted values for equity based long term incentive awards instead of using realizable/realized values for such awards? .................................................................................................................. 7
4. How does ISS treat negative pension values in the Summary Compensation Table? ........................................... 7
5. How does ISS account for more than one CEO in a given fiscal year? ................................................................... 8
6. If the company has transitioned to a new CEO in a particular fiscal year, how does ISS compute total compensation for the new CEO? ................................................................................................................................... 8
7. For pay for performance alignment, how will ISS treat CEOs who have not been in the position for three years? ............................................................................................................................................................................ 8
9. What pay data does ISS use for companies with meetings early in the year whose peer CEO pay information has not yet been released? ........................................................................................................................................... 9
10. How are peer medians calculated for the Components of Pay Table? .................................................................. 9
Definition of Performance ........................................................................................................................................... 9
11. How does ISS measure the performance of a company for the quantitative section of the pay for performance methodology? ............................................................................................................................................................... 9
12. Does ISS's pay for performance analysis only use TSR to gauge company performance? .................................... 9
14. How does Research Insight calculate 1-, 3-, and 5-year TSR? .............................................................................. 10
ISS Quantitative Pay for Performance Evaluation...................................................................................................... 10
Relative Degree of Alignment (RDA) and Multiple of Median (MOM) ....................................................................... 10
15. What does RDA measure? ................................................................................................................................... 10
16. What TSR time period will ISS use for the subject company and the peers in the relative pay for performance analysis? ...................................................................................................................................................................... 10
17. What compensation time period will ISS use for the subject company and the peers in the relative pay for performance analysis?................................................................................................................................................. 11
18. What is the range of values for RDA? .................................................................................................................. 11
19. What is Multiple of Median (MOM)? ................................................................................................................... 11
Constructing Comparison Groups .............................................................................................................................. 11
20. How are peer companies determined? ............................................................................................................... 11
21. What happens if ISS' peer group methodology does not generate at least 11 peer companies? ....................... 12
22. Why does ISS use 0 .25x – 4x revenue/asset range (rounded to nearest tenth)? ............................................... 13
23. Which industry groups will use assets for size comparisons? What happens when a company has potential peers in both asset-based and revenue-based industry groups? ................................................................................ 13
24. How does ISS define the "buckets" for the market capitalization constraint mentioned above? ....................... 14
FAQ: Canadian Executive Compensation
Enabling the financial community to manage governance risk for the benefit of shareholders.
25. Why does ISS select 11-24 companies? ............................................................................................................... 14
26. For a subject company with 11 peer companies, is the RDA test less significant? .............................................. 14
27. Do you include the subject company in the derivation of the peer group median? When you say 11 companies minimum for peers, does the 11 include the subject company? ................................................................................ 14
28. Will a company always be at the median of its peer group in terms of size? ...................................................... 14
29. When will the company's peer group have more than 11 companies? .............................................................. 15
30. Will ISS use companies from countries other than Canada to create the comparison group? ........................... 15
31. Why does ISS not use company selected peers? ................................................................................................. 15
32. Does ISS use the same list of peer companies for pay for performance as used for a company's allowable cap on an equity plan proposal? ........................................................................................................................................ 15
33. Who can I contact if I disagree with the GICS classification? ............................................................................... 15
34. When and how often will ISS reconstruct peer groups? ...................................................................................... 16
35. What does Pay-TSR Alignment (PTA) measure? .................................................................................................. 16
36. How is PTA calculated? ........................................................................................................................................ 16
37. Can you provide more details about the regressions? ........................................................................................ 16
ISS Thresholds – Quantitative Pay for Performance Evaluation ................................................................................. 16
38. What are the values for each pay for performance measure that may raise some degree of concern? ............ 17
ISS’ Qualitative Pay for Performance Evaluation ....................................................................................................... 17
39. What impact might an adverse score on the quantitative portion of the pay for performance methodology have? ........................................................................................................................................................................... 17
40. What qualitative factors are considered by ISS in the qualitative assessment of the company's pay and performance alignment? ............................................................................................................................................. 18
41. If a company has not been publicly traded for five fiscal years, does the quantitative Pay-for-Performance evaluation still apply? What if the company has not been publicly traded for three fiscal years? Would such a company be used as a peer company for other companies? ...................................................................................... 19
42. What impact might an adverse pay-for-performance recommendation have on an equity plan proposal? ...... 19
43. A company makes equity grants near the beginning of each year based on an evaluation of the company and/or the executive’s performance in the immediately preceding year. Such grant information will appear in the following year’s proxy statement. Will ISS take into account the timing of these early equity grants made in the current fiscal year and make adjustments to the top executives' total compensation when conducting its pay for performance analysis?................................................................................................................................................. 19
FAQ: Canadian Executive Compensation
Enabling the financial community to manage governance risk for the benefit of shareholders.
44. How is the cost of an equity plan calculated? ..................................................................................................... 20
45. How does ISS treat equity plans funded by shares purchased on the open market? ......................................... 21
46. How does ISS determine average award value? .................................................................................................. 21
47. How is the allowable cap determined? ................................................................................................................ 21
48. How is SVT affected by an omnibus equity plan which offers multiple forms of awards? .................................. 21
49. How does ISS calculate cost when a company has multiple equity plans on the meeting agenda? ................... 22
50. How is dilution calculated? .................................................................................................................................. 22
51. How is burn rate calculated? ............................................................................................................................... 22
Non-Employee Director (NED) Participation .............................................................................................................. 22
52. What is ISS' policy regarding discretionary non-employee director participation in equity plans? .................... 22
53. Why does ISS have a policy regarding discretionary non-employee director participation in equity plans? ...... 22
54. What are the acceptable limits for non-employee director participation in equity plans?................................. 23
55. What about equity or DSUs granted or taken by NEDs in lieu of cash fees? ....................................................... 23
56. If an Omnibus Plan substantially limits and discloses the number of stock options that can be granted out of the total reserve, so that full value awards will comprise a substantial percentage of the equity granted under the plan, will this impact the director participation limit? ................................................................................................ 24
57. Are DSU (Deferred Share Unit) plans considered equity plans for the purposes of the non-employee director participation limit? ...................................................................................................................................................... 24
58. Does a company need both a dollar limit and a percentage limit in order to acceptably limit an option plan for non-employee directors? ............................................................................................................................................ 24
59. Why does the ISS NED Limit policy distinguish between option-based and non-option-based equity plans? ... 24
60. What is ISS' policy toward option repricing? ....................................................................................................... 25
61. What constitutes repricing? ................................................................................................................................. 25
62. What is ISS' policy regarding options with declining exercise prices? ................................................................. 25
Equity Plan Amendment Provisions .......................................................................................................................... 25
63. According to ISS policy, which types of future amendments to an equity compensation plan should require shareholder approval? ................................................................................................................................................ 25
64. Does the above list of requirements differ depending on the type of award(s) issued under the equity plan? . 26
65. How does ISS’ policy concerning equity plan amendment provisions differ from that of the TSX? .................... 26
66. If a company has not placed any limit on director participation in an equity plan, must the equity plan still contain an amendment provision regarding non-executive director participation? .................................................. 26
FAQ: Canadian Executive Compensation
Enabling the financial community to manage governance risk for the benefit of shareholders.
A few years after the global financial crisis caused shareholders to lose roughly half the value of their investments, the Canadian market as indicated by the S&P/TSX Composite Index is still struggling to regain pre-crisis levels. Executive compensation levels, however, have bounced back much faster and have now surpassed pre-crisis levels at many Canadian companies. Executive compensation practices and their link to company performance and shareholder value continues to remain the number one concern of investors, generally some twenty-five years since these concerns were first raised by institutions in discussions with ISS.
By the time the annual meeting management information circulars of Canadian companies are released in 2015, shareholders will have seven years of comparable disclosure of compensation data with which to evaluate the longer term trends in executive compensation at these companies. ISS is refining and continuing to apply its enhanced quantitative methodology for assessing the relative and absolute rankings of pay versus company performance to provide investors in the Canadian market with an effective tool for this purpose. In keeping with ISS' commitment to transparency and in order to enable an understanding of ISS' methodology, which comprises the first step in the Canadian pay for performance policy, and how the methodology will be applied under that policy, the following frequently asked questions have been answered and presented herein. ISS is committed to also be responsive to our clients' needs and to continue to evolve and improve its analytical tools to reflect evolving practices and needs. It must be said, however, that while quantitative models and methodologies are important and necessary tools, the qualitative analysis that is completed in each case is the driver of any vote recommendation made by ISS when evaluating pay for performance.
ISS Pay for Performance Methodology
The Pay for Performance methodology is a tool to help evaluate the alignment of executive pay and company performance. The methodology is designed to focus on companies with a long term trend of over-compensation relative to performance. It comprises an initial quantitative screen and routine qualitative assessment, and, where a potential pay for performance misalignment is identified, a more in-depth and detailed qualitative assessment to determine if there is significant long-term pay for performance misalignment. The in-depth qualitative analysis is completed for all subject companies identified by the quantitative screen as having a potential pay for performance misalignment, and this qualitative assessment drives ISS' ultimate vote recommendation for this policy. The detailed components of the methodology are:
Quantitative
Relative:
› The Relative Degree of Alignment (RDA) is the difference between the company's Total Shareholder Return ("TSR") rank and the CEO's total pay rank within a peer group, measured over a 3-year period;
› Multiple of Median (MOM) is the total compensation in the last reported fiscal year relative to the median compensation of the peer group; and
Absolute:
› The CEO pay-to-TSR Alignment (PTA): the difference between absolute pay changes and absolute TSR changes over the most recent 5-year period (or as long a period as company disclosure permits)
FAQ: Canadian Executive Compensation
Enabling the financial community to manage governance risk for the benefit of shareholders.
Companies identified by the above quantitative screen as having potential pay for performance misalignment will receive a qualitative assessment to determine the ultimate recommendation, considering a range of case-by-case factors. These factors may include the ratio of performance to time based equity awards; the overall ratio of performance-based compensation; the completeness of disclosure and rigor of performance goals; actual results of other financial metrics, special circumstances related to a new CEO in the prior FY; and any other factors deemed relevant.
The methodology described above is further explained in the following sections of the FAQ.
Definition of Compensation
1. How does ISS define Total Compensation (Pay) for the pay for performance methodology?
In accordance with the National Instrument Form 51-102F6 - Statement of Executive Compensation, each annual meeting Management Information Circular ("proxy circular") must disclose an array of compensation data, with a three year look-back, for the five highest paid executives, including the CEO and CFO. The centerpiece of these disclosures is the Summary Compensation Table, which enumerates key elements found in a typical top executive's compensation package. These elements include:
i. Base Salary ii. Share-Based Awards
iii. Option-Based Awards iv. Non-Equity Incentive Plan Compensation – Annual Incentive Plans (Annual Bonus)1 v. Non-Equity Incentive Plan Compensation – Long Term Incentive Plans2
vi. Pension Value vii. All Other Compensation
viii. Total Compensation
The proxy circular also includes several other tables which provide more specific information such as grants of equity based awards, outstanding equity based awards, pension values etc. However, the Summary Compensation Table provides the most comprehensive picture of each named executive officer's total planned and earned compensation for the fiscal year - specifically, the pay and pay opportunities that the compensation committee and board determined the executives ought to receive. It is these decisions that investors generally wish to monitor and evaluate, since their aim is to ensure that executives are paid fairly, but not overpaid, for the performance executives ultimately deliver and sustain.
In evaluating pay for performance alignment at a company, ISS focuses on Total Compensation as reflected in the Summary Compensation Table of the proxy circular.
---------------------- 1 As per the NI 52-102F6, these columns include the cash awards received by the executive that are either discretionary or dependent upon pre-determined performance goals. Please note that compensation related to Annual Incentive Plan relates only to a single financial year, whereas Long Term Incentive Plans compensation relates to a period longer than a single year.
2. Why does ISS focus on the CEO's pay to determine pay for performance alignment?
ISS focuses on the CEO's pay because that package sets the "compensation pace" at most companies. In addition, the compensation committee and board are most directly involved in and accountable for the decisions that generate the CEO's pay.
3. Why does ISS use granted values for equity based long term incentive awards instead of using
realizable/realized values for such awards?
Some observers suggest that shareholders should evaluate "realized/realizable pay" rather than granted pay in determining whether pay and performance are aligned. This comprises compensation that results (or could result) from the exercise/vesting of an executive's previously granted equity awards at a given point in time. Since equity-based awards are by far the largest component of most top managers' pay, it is true that future shareholder returns will have substantial impact on those realized values – in other words, the pay realized from equity-based awards at underperforming companies is likely to be lower than that realized by executives at better performing companies, all else being equal. Nevertheless, those values are also significantly influenced by the award opportunities themselves, which reflect the compensation level the board has determined top executives deserve and that will appropriately incentivize future performance. Since all equity-based awards are sensitive, to some degree, to market trends beyond the control of individual executives, it is important that pay elements be considered if long-term company performance is misaligned with past pay and award opportunities. In that case, shareholders may expect the board to ensure that future incentive awards are clearly designed to promote performance improvements that will lead to shareholder value creation.
In the interest of protecting their assets, investors may have another reason to monitor granted pay: corporate pay benchmarking. Companies themselves measure their executives' compensation against competitors with respect to pay and pay opportunities, not "realized/realizable" pay.
A review of realizable/realized pay may be included in the qualitative assessment when a potential pay for performance misalignment has been identified.
4. How does ISS treat negative pension values in the Summary Compensation Table?
Negative pension values will be included as reported by the company and can serve to lower the Total Compensation. When an in-depth qualitative review of the company's compensation plans is conducted, ISS may consider both total compensation and total direct compensation. In some rare cases when the negative pension value causes a negative total compensation value in the summary compensation table, ISS may use total direct compensation in order evaluate the pay for performance alignment at a company.
Total compensation is the sum of all pay elements disclosed in the summary compensation table, that is, salary, share-based awards, option-based awards, non-equity incentive compensation-annual incentive plans, non-equity incentive compensation-long term incentive plans, pension value and all other compensation. Total Direct Compensation is Total Compensation less pension value.
FAQ: Canadian Executive Compensation
Enabling the financial community to manage governance risk for the benefit of shareholders.
5. How does ISS account for more than one CEO in a given fiscal year?
When a company transitions from one CEO to another, ISS will use only one CEO's pay. The CEO that was in the position at the end of the fiscal year will generally be the one whose pay will be used. The base salary for a CEO serving less than one year will be annualized.
If the company has co-CEOs, the higher total compensation figure will be used; note, however, that the impact of co-CEO compensation costs may be addressed separately as a part of ISS' qualitative executive compensation evaluation.
6. If the company has transitioned to a new CEO in a particular fiscal year, how does ISS compute total
compensation for the new CEO?
Total Compensation for the CEO is calculated as the sum of the following pay elements2:
i. Annualized Base Salary ii. Share-Based Awards
iii. Option-Based Awards iv. Non-Equity Incentive Plan Compensation – Annual Incentive Plans (Annual Bonus)3 v. Non-Equity Incentive Plan Compensation – Long Term Incentive Plans4
vi. Pension Value vii. All Other Compensation
In order to compare the total compensation of executives, the base salary of the new CEO is annualized. ISS does not, however, annualize any other pay component such as equity or non-equity related incentive plan compensation because these awards are likely related to achievement of performance goals.
If the company discloses contractual salary payments in the proxy circular, then such payments would be used as base salary. If this disclosure is not available, ISS will compute the annualized base salary based on the start date of the executive and fiscal year end of the company, using a 365 day year. Start date is the date the executive began employment as the CEO.
7. For pay for performance alignment, how will ISS treat CEOs who have not been in the position for
three years?
The quantitative methodology will analyze total CEO pay for each year in the analysis without regard to whether all years relate to the same or different CEOs. If that analysis indicates significant pay for performance misalignment, the ensuing in-depth qualitative analysis may take into account any relevant factors related to a change in CEO during the period. Given an apparent misalignment between performance and CEO pay, shareholders would expect the new CEO's pay package to be substantially performance based (with clearly disclosed metrics and goals).
8. How does ISS treat restated compensation amounts for prior years? This may include scenarios in
which the Board granted incentive awards to the executive, awards that the executive later declined.
---------------------- 2 Items ii. through vii. are as reported in the Summary Compensation Table. 3 As per the NI 52-102F6, these columns include the cash awards received by the executive that are either discretionary or dependent upon pre-determined performance goals. Please note that compensation related to Annual Incentive Plan relates only to a single financial year, whereas Long Term Incentive Plans compensation relates to a period longer than a single year.
FAQ: Canadian Executive Compensation
Enabling the financial community to manage governance risk for the benefit of shareholders.
ISS will not restate the total compensation amount for the purpose of the pay for performance methodology if the company restates total compensation values unless there are exceptional circumstances. Specifically, ISS will not restate prior year compensation amounts if previously granted performance based equity awards did not vest; these awards will continue to be recorded at their grant date fair value. The rationale behind this decision is that the total compensation prior to the restatement was what the compensation committee intended to award the executive, and therefore the compensation committee should be held accountable for its decisions regarding compensation amounts awarded. Subsequent events that lead to a restatement of grant date values or an executive declining compensation awards may be included in the qualitative assessment when a potential pay for performance misalignment has been identified.
9. What pay data does ISS use for companies with meetings early in the year whose peer CEO pay
information has not yet been released?
ISS uses the most recent compensation data available for the peer companies, which may be from the previous year in some cases. Pay data is updated very quickly as proxies are released, and the peer data is used only as a screening mechanism, so the impact of differing pay years within a pay group may be considered during ISS' qualitative review.
10. How are peer medians calculated for the Components of Pay Table?
The median is separately calculated for each component of pay and for the total annual compensation. For this reason, the median total compensation of the peer CEOs will not equal the sum of all the peer median pay components, because the values are calculated separately for each pay component. Rather, the median total compensation reflects the median of the total compensation of the peer group constituents.
Definition of Performance
11. How does ISS measure the performance of a company for the quantitative section of the pay for
performance methodology?
ISS believes that the key measure for investors in the context of a long-term pay for performance evaluation is TRS – i.e., change in stock price plus reinvested dividends over the specified measurement period.
12. Does ISS's pay for performance analysis only use TSR to gauge company performance?
The quantitative analysis, that is, the screening phase of the pay for performance methodology, only uses TSR to define a company's performance; however ISS understands that there are myriad ways to measure corporate performance, and key metrics may vary considerably from industry to industry and from company to company depending on the company's particular business strategy at any given time. Therefore, the qualitative assessment of the company's pay for performance alignment may consider other measures of company performance such as Return on Equity, Return on Invested Capital, and other relevant metrics.
FAQ: Canadian Executive Compensation
Enabling the financial community to manage governance risk for the benefit of shareholders.
Hence, ISS does not advocate that companies use TSR as the metric underlying their incentive programs; on the contrary, shareholders may prefer that incentive awards be tied to the company's short- and long-term business goals. If a company's business strategy is sound and well executed, the expectation is that it will create value for shareholders over time, as reflected in long-term total shareholder returns. For this reason, TSR, which is objective and transparent, is the primary metric ISS utilizes in evaluating pay and performance alignment in the quantitative analysis.
13. Where does ISS obtain 1-, 3- and 5-Year TSR data? And how often are these values updated?
ISS obtains all financial data in the compensation profile from Standard & Poor's Research Insight. The TSR values are updated every month to ensure TSR values accurately represent the fiscal year end of the company in question.
14. How does Research Insight calculate 1-, 3-, and 5-year TSR?
The one-, three- and five-year TSR is the annualized rate of return reflecting price appreciation plus dividends (based on reinvestment as of the end of the month of the dividend payment) and the compounding effect of dividends paid on reinvested dividends, over the relevant time period.
ISS Quantitative Pay for Performance Evaluation
Relative Degree of Alignment (RDA) and Multiple of Median (MOM)
15. What does RDA measure?
RDA addresses the question: Is the pay opportunity delivered to the CEO commensurate with the performance achieved by shareholders, relative to a comparable group of companies? This measure compares the percentile rank of a company's CEO pay and TSR performance, relative to a comparator or peer group, that is selected by ISS on the basis on size, industry, and market capitalization, over a three-year period. For more information on peer groups please see the Constructing Comparison Groups section below.
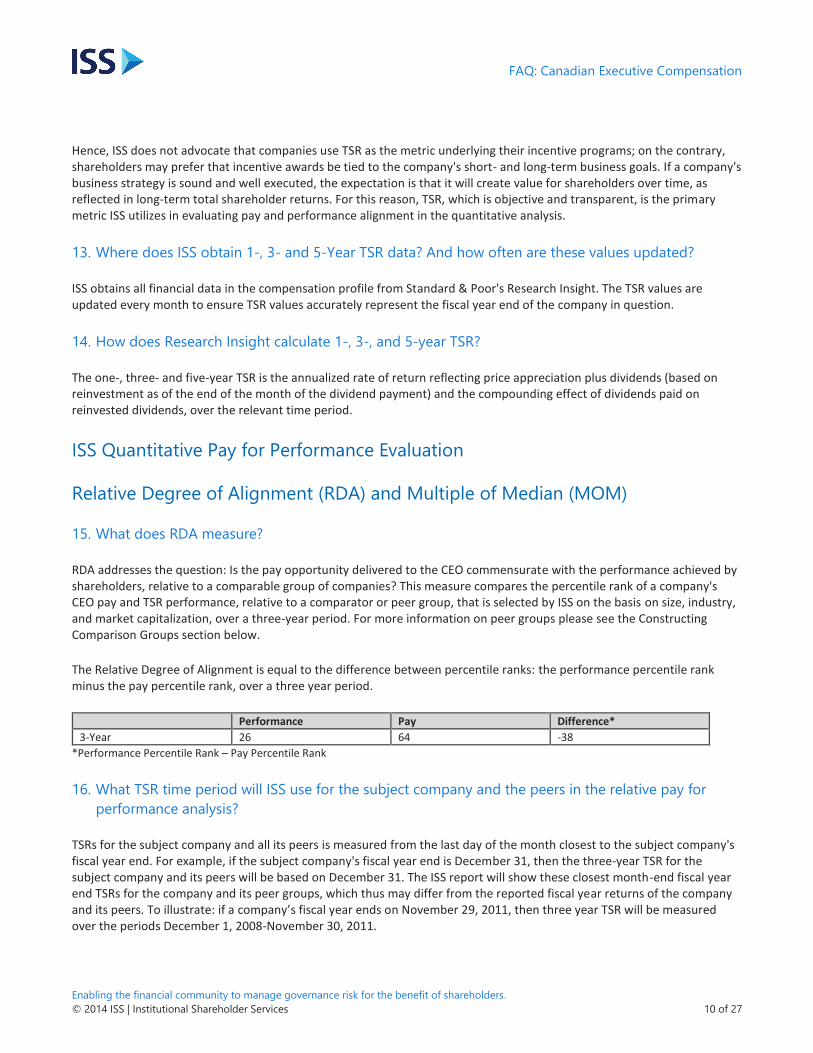
The Relative Degree of Alignment is equal to the difference between percentile ranks: the performance percentile rank minus the pay percentile rank, over a three year period.
16. What TSR time period will ISS use for the subject company and the peers in the relative pay for
performance analysis?
TSRs for the subject company and all its peers is measured from the last day of the month closest to the subject company's fiscal year end. For example, if the subject company's fiscal year end is December 31, then the three-year TSR for the subject company and its peers will be based on December 31. The ISS report will show these closest month-end fiscal year end TSRs for the company and its peer groups, which thus may differ from the reported fiscal year returns of the company and its peers. To illustrate: if a company’s fiscal year ends on November 29, 2011, then three year TSR will be measured over the periods December 1, 2008-November 30, 2011.
FAQ: Canadian Executive Compensation
Enabling the financial community to manage governance risk for the benefit of shareholders.
17. What compensation time period will ISS use for the subject company and the peers in the relative
pay for performance analysis?
Compensation figures for all companies are as of the latest available public disclosure filing.
18. What is the range of values for RDA?
Values for the Relative Degree of Alignment (RDA) measure range between -100 and +100, with -100 representing high pay for low performance (i.e., 100th percentile pay combined with 0th percentile performance), zero representing a high degree of alignment (the pay rank is equal to the performance rank), and positive values representing high performance for low pay.
19. What is Multiple of Median (MOM)?
Multiple of Median (MOM) is the company's one-year CEO pay divided by the median one-year CEO pay of the ISS selected comparator group. This measure aims to address the question: Is overall CEO pay significantly higher than amounts typical for the comparison group. This measure can range from zero (if the subject company paid its CEO nothing) to infinity and is designed to highlight cases where shareholders may be overpaying executives regardless of performance.
Constructing Comparison Groups
20. How are peer companies determined?
ISS constructs a comparison group of between 11 and 24 peer companies for each subject company covered by the Pay-For-Performance methodology. Peer groups are generally constructed with reference to the company's industry (based on GICS classification), revenue (or assets with respect to financial companies), and market value. Peer groups for all S&P/TSX Composite Index companies analyzed under this methodology are constructed twice a year, based on data provided by an independent source (Research Insight Quarterly Data Download [QDD]). The following criteria are used to determine peer companies:
› Revenue/Assets between 0.25X and 4X the subject company's size; › In the closest GICS industry group (8-digit, 6-digit, 4-digit, or 2-digit) to the subject company's GICS category; and › Market capitalization limits vary according to the company's market value, utilizing four market cap "buckets" (micro,
small, mid, and large).
The process for selecting comparison companies is as follows:
› Determine a potential comparison universe for the subject company. For each subject company, ISS begins by determining a potential comparison universe. The comparison universe of a company would include companies in ISS’ ExecComp Analytics database that meet the following criteria: i) companies that are in the same two-digit GICS universe as the subject, ii) companies with revenues between 0.25 times and 4 times the subject company’s annual revenues (assets for financial companies), and iii) companies with market capitalizations between 0.25 times the lower bound and 4 times the upper bound of the subject company's market cap bucket.
FAQ: Canadian Executive Compensation
Enabling the financial community to manage governance risk for the benefit of shareholders.
› Select industry-close comparators from the potential universe. ISS starts by selecting companies from the comparison universe that are in the subject company’s eight-digit category, first selecting the companies closest in size, while where possible alternating between companies larger and smaller than the subject company so as to position the subject at or near the median of the comparison group. Next we repeat the process mentioned above with the six-digit GICS group. Up to 24 comparison companies can be selected from the eight- and/or six-digit GICS categories if there is a sufficient number of peer companies available.
If 11 comparator group members are not selected from the companies in the universe that share the subject company’s eight- and/or six-digit GICS category, the process is repeated with companies in the comparison universe that share the company’s four-digit GICS category, maintaining the company at the median position where possible, until 11 or more comparison companies are selected; if 11 comparison companies cannot be selected using the four-digit, then the process is repeated using the two-digit GICS category, until 11 or more companies are selected.
21. What happens if ISS' peer group methodology does not generate at least 11 peer companies?
ISS' standard peer group construction methodology generally produces all or a majority of peer companies used for the relative comparisons in the quantitative component of the pay for performance analysis. There are, however, companies where the standard methodology does not generate a sufficient number of peers. Hence, additional customization is applied to ensure that each analysis is based on a robust comparison group:
For many large Canadian companies, there are a limited number of similar companies within the size and industry criteria mentioned above. These are handled in the following ways:
› Relax the revenue/ asset criteria: Peer groups with an insufficient number of peer companies will be augmented by relaxing the revenue (but not market cap) parameters in the peer group selection process while retaining peers selected under the standard methodology. Additional peer companies that are both larger and smaller will be added in order to maintain the subject company as close to the median size level as possible. The revenue criteria can be relaxed to include a few companies that are closest in terms of size to the subject company within reason. Since company size relates strongly with the top executive pay levels, however, we do not believe that expanding the size criteria significantly would benefit peer company selection.
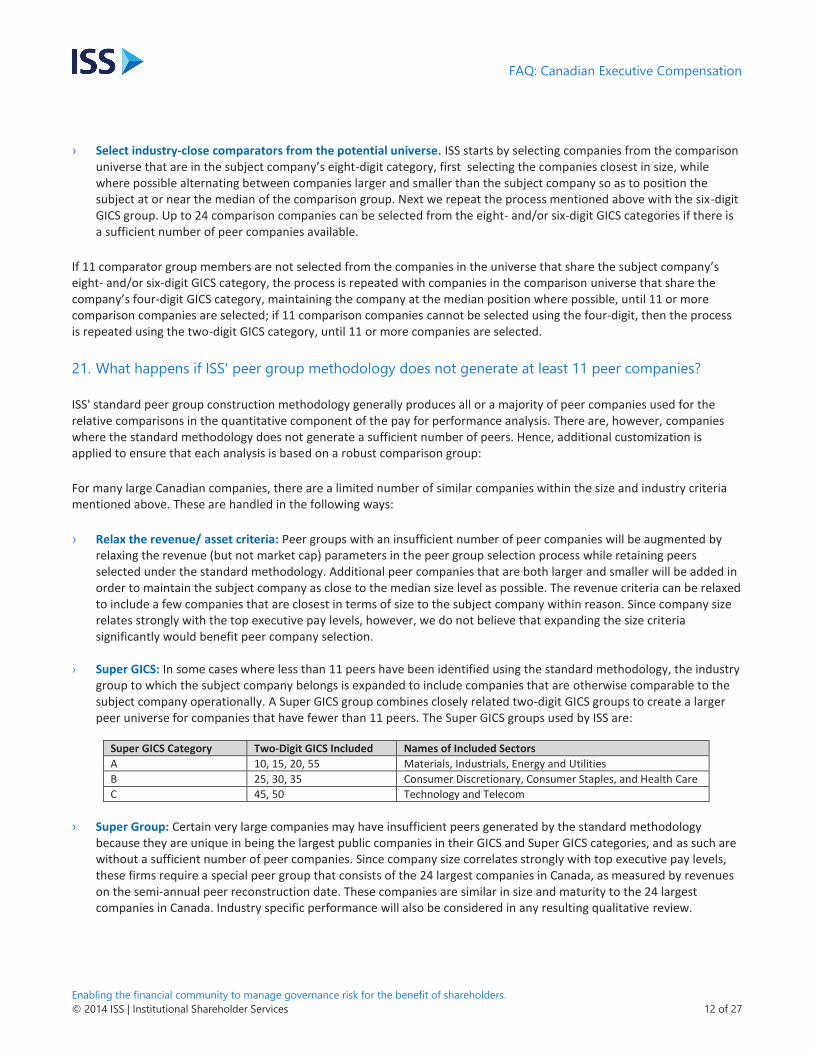
› Super GICS: In some cases where less than 11 peers have been identified using the standard methodology, the industry group to which the subject company belongs is expanded to include companies that are otherwise comparable to the subject company operationally. A Super GICS group combines closely related two-digit GICS groups to create a larger peer universe for companies that have fewer than 11 peers. The Super GICS groups used by ISS are:
Super GICS Category Two-Digit GICS Included Names of Included Sectors
A 10, 15, 20, 55 Materials, Industrials, Energy and Utilities
B 25, 30, 35 Consumer Discretionary, Consumer Staples, and Health Care
C 45, 50 Technology and Telecom
› Super Group: Certain very large companies may have insufficient peers generated by the standard methodology
because they are unique in being the largest public companies in their GICS and Super GICS categories, and as such are without a sufficient number of peer companies. Since company size correlates strongly with top executive pay levels, these firms require a special peer group that consists of the 24 largest companies in Canada, as measured by revenues on the semi-annual peer reconstruction date. These companies are similar in size and maturity to the 24 largest companies in Canada. Industry specific performance will also be considered in any resulting qualitative review.
FAQ: Canadian Executive Compensation
Enabling the financial community to manage governance risk for the benefit of shareholders.
› Company Disclosed Peers: In exceptional cases where the above methods do not result in the requisite 11 companies, ISS may consider supplementing the ISS selected peers with company selected peers. The company selected peers must fall within the size parameters as disclosed above; i.e., revenue between 0.25X and 4X the subject company's revenue and market cap within the 0.25X lower bound and 4X upper bound of the subject company's market capitalization bucket. If the inclusion of companies from the subject company's disclosed comparator group becomes necessary, ISS may select these companies by alternating between peers which are smaller and larger than the subject company so as to keep the subject company as close to the median as possible. Hence, in most cases any companies selected from the company disclosed comparator group would be selected in pairs. Please note that ISS will only use Canadian companies, even if the company disclosed comparator group includes non-Canadian companies.
› Peers of ISS-Selected Peers: In very few cases, the above steps will not lead to the generation of a minimum 11-company comparison group. In these cases, ISS will look at the peers of the ISS-selected peer companies. Beginning with the ISS-selected peer company closest in size to the target company, ISS will review the ISS-selected peers of that peer company and select companies from this group to serve as peers of the target company. Comparison companies will be selected from the peer company's peers with the intent of keeping the target company as close to the median of its peer group as possible.
Finally, ISS would like to note that this process is flexible and analysts regularly review company comparator groups to ensure that the comparison companies are appropriate. ISS has and will continue to adjust comparator groups where the comparator companies are deemed inappropriate.
22. Why does ISS use 0 .25x – 4x revenue/asset range (rounded to nearest tenth)?
There is an extensive literature that demonstrates a strong correlation between company size and CEO pay. Among executive compensation practitioners, a size range of 0.5 times to 2 times size (measured by revenue or assets, as appropriate for the company’s industry) has emerged as a standard of practice. Give, however, the size of the Canadian market, ISS has expanded this range to capture peers that may be similar in function but do not fall into a narrow size range.
23. Which industry groups will use assets for size comparisons? What happens when a company has
potential peers in both asset-based and revenue-based industry groups?
ISS will use balance sheet assets (rather than income statement revenue) to measure the size of companies in the following 8-digit GICS groups.
Both subject and potential peer must be in the asset-based GICS groups listed above in order to be compared on the basis of assets. In cases where a subject company is in one of the asset-based GICS groups and a potential peer is not, revenues will be used for size comparisons. This principle applies to the size comparisons made to qualify a company for potential inclusion as a peer; to the size rankings made to maintain the subject company near the median size of the peer group; and to the size prioritization of peers.
FAQ: Canadian Executive Compensation
Enabling the financial community to manage governance risk for the benefit of shareholders.
In addition, as deemed appropriate by ISS, additional 8-digit GICS categories may be determined to utilize assets and/or market cap to identify peers.
24. How does ISS define the "buckets" for the market capitalization constraint mentioned above?
ISS has indicated previously that market capitalization (defined as 200-day average price multiplied by shares issued and outstanding) is a secondary criteria used to evaluate the size of the subject company and its comparison companies. In order to apply this criterion the peer universe is separated based on market capitalization into the buckets below:
› Micro is under $200 million; › Small is $200-$1 billion; › Mid is $1-$10 billion; and › Large is $10 billion and above.
In the broadest possible sense, if necessary, ISS may consider peers for a subject company that may fall between 25% of the bucket lower bound and 4 times the bucket upper bound.
25. Why does ISS select 11-24 companies?
The Relative Degree of Alignment calculation measures percentile ranks of pay and performance for the subject company. The larger the comparison group, the finer the resolution of the percentile ranks (for instance: in a comparison group of 24, percentile ranks move in approximately 4-point increments, whereas they move in 10-point increments for a group of less than ten). We believe that using 11 or more companies in the comparison groups provides sufficient resolution for the percentile measure, while also allowing us to generate comparison groups for the vast majority of companies within the methodology’s size and industry constraints.
26. For a subject company with 11 peer companies, is the RDA test less significant?
No. While the smaller peer group does place constraints on the resolution of the percentile ranks, the results of such a test are most often consistent with those of a larger peer group. In addition, please note that 11 companies is the absolute minimum and ISS will almost always aim to have a comparator group that is larger than this figure.
27. Do you include the subject company in the derivation of the peer group median? When you say 11
companies minimum for peers, does the 11 include the subject company?
No, neither the CEO pay nor the TSR for the subject company is included in the median calculation. The subject company is also not included in the number of peer companies.
28. Will a company always be at the median of its peer group in terms of size?
The aim of the methodology is to produce a mix of peers larger and smaller than the subject company (ideally putting it at the median); however as long as a company's GICS group peers meet the market cap and revenue/asset range criteria they may be selected. The premise is that any company within the size range may be expected to provide compensation opportunities at around the same level as any other company within its size range.
FAQ: Canadian Executive Compensation
Enabling the financial community to manage governance risk for the benefit of shareholders.
29. When will the company's peer group have more than 11 companies?
If more than 11 companies within the subject company's eight- and six-digit GICS group meet the applicable size criteria (market cap and revenue/assets), up to 24 of those companies may be selected for the peer group. If less than 11 companies in the subject company's six-digit GICS group meet the size criteria, peers that do not meet the criteria will be selected from the broader GICS groups until 11 or more are identified.
30. Will ISS use companies from countries other than Canada to create the comparison group?
No. For the purpose of selecting peer companies, ISS shall only select Canadian companies with proxy materials filed on SEDAR. Please note that ISS will not consider Canadian incorporated companies that file DEF-14A in the US for the purpose of peer selection because these companies are deemed U.S. domestic reporting issuers under the SEC and are thus covered by ISS U.S. Research using U.S. policy.
31. Why does ISS not use company selected peers?
The comparison companies selected by ISS are not intended to serve the function that a “peer group” does for a board of directors when it benchmarks executive pay. Boards use peer groups to help determine an appropriate pay package for attracting and retaining executive talent. ISS’ pay-for-performance analysis, however, is not intended to benchmark pay directly, nor is it intended to help evaluate the effectiveness of a pay package in attracting and retaining executives, nor is it intended to serve as a list of “competitors” against which a company might compare itself, or even that an investor might compare in picking individual stocks.
The ISS comparison groups are intended, rather, to help evaluate the alignment of executive pay and company performance that results from a board of directors’ pay decisions over time. These comparison groups are constructed to help determine whether a company CEO’s pay and pay opportunities – relative to similarly situated investment opportunities -- has been commensurate with the performance that the company achieved -- again, relative to similarly situated investment opportunities.
32. Does ISS use the same list of peer companies for pay for performance as used for a company's
allowable cap on an equity plan proposal?
Although there may be an overlap of peers selected under each methodology, the peer companies used to determine allowable cap on an equity plan proposal are not necessarily the same peers used for assessing pay for performance. The peer group used for assessing pay for performance alignment is based on a combination of industry and size (revenue/assets and market cap); whereas the peer group used to create the allowable cap to assess a stock based compensation plan is based on industry, with adjustments for market capitalization.
33. Who can I contact if I disagree with the GICS classification?
ISS does not classify companies into the GICS codes. Please contact Standard and Poor's at 1-800-523-4534 if you believe that a company has been misclassified.
FAQ: Canadian Executive Compensation
Enabling the financial community to manage governance risk for the benefit of shareholders.
34. When and how often will ISS reconstruct peer groups?
Company peer groups will be reconstructed twice a year during July and December. The expectation is that revised peer groups, which are not anticipated to be significant, will be in place for meeting dates taking place on or after-September 1 and February 1, respectively.
Pay-TSR Alignment (PTA)
35. What does Pay-TSR Alignment (PTA) measure?
Pay-TSR Alignment (PTA) is a measure of long term absolute alignment and is designed to indicate whether shareholders of a subject company and its executives have experienced the same long term trend. It is important to note that PTA is not designed to measure the sensitivity of CEO pay to performance; i.e., whether pay and performance go up and down together on a year-over-year basis. Rather, PTA is a long-term measure of directional alignment.
36. How is PTA calculated?
At a high level, the measure is calculated as the difference between the slopes of weighted linear regressions for pay and for shareholder returns over a five-year period. This difference indicates the degree to which CEO pay has changed more or less rapidly than shareholder returns over that period.
By using regressions to estimate the long-term trends for pay and TSR, the method avoids the pitfalls of evaluating pay and performance over time:
› Performance over a fiscal year and pay granted over that period are measured in a consistent fashion, on the same scale, and are matched in time.
› Lumpiness of pay and volatility of performance are smoothed but not eliminated – addressing in a consistent fashion both the “lumpy pay” problem as well as the sensitivity of TSR to choice of endpoints.
The trend lines calculated by these regressions are analogous to a 5-year “trend rate” for pay and performance, weighted to reflect recent history. The final Pay-TSR Alignment measure is simply equal to the difference: performance slope minus the pay slope.
37. Can you provide more details about the regressions?
Full details are available in Appendix II of Evaluating Pay for Performance: ISS’ Quantitative and Qualitative Approach.
ISS Thresholds – Quantitative Pay for Performance Evaluation
The philosophy of the framework is simple: if pay-for-performance measures for a company lie within a range of typical values, then it has demonstrated some evidence of pay-for-performance alignment; if the company’s measure is an outlier beyond that range, however, it begins to raise some degree of concern that a potential misalignment may exist.
38. What are the values for each pay for performance measure that may raise some degree of concern?
The evaluative approach begins by identifying companies that are significant outliers in each measure. The approach is based on empirical observation of the distribution of the measures within the back-testing universe. Additionally, the methodology, where possible, avoids arbitrary threshold effects by using a continuous scoring approach. As a result, scores are additive; concerns raised for multiple measures can accumulate to provide evidence for a potential pay for performance misalignment and a deeper dive by the analyst covering the company. Thus the methodology identifies whether:
1. a company’s particular measure is a sufficient outlier to demonstrate a high concern by itself; or 2. a company’s particular measure is a sufficient outlier to demonstrate a high concern in conjunction with one or both of
the other measures.
The table below shows the levels for each measure that indicate, based on initial testing analysis, where a company would be considered an outlier (triggering Medium concern) or a significant outlier (which would trigger High concern). High concern for any individual factor will result in an overall High concern level for the quantitative component of the pay-for-performance evaluation, and multiple Medium concern levels may also result in an overall High concern.
Measure Level that may trigger high concern in conjunction with other measures
Level that triggers high concern by itself
Relative Degree of Alignment (RDA)
-45% ~18th percentile -60% ~9th percentile
Multiple of Median (MOM)
2.5x ~89th percentile 3.5x ~96th percentile
Pay-TSR Alignment (PTA)
-25% ~7th percentile -35% ~2nd percentile
ISS’ Qualitative Pay for Performance Evaluation
39. What impact might an adverse score on the quantitative portion of the pay for performance
methodology have?
The purpose of ISS' pay-for-performance evaluation is to identify companies where shareholders may wish to communicate concern about the pay-setting approach, given misalignment of compensation decisions relative to the company’s performance track record. ISS' new quantitative assessment is designed to detect such misalignment, based on both relative and absolute pay-performance evaluations, as well as to identify apparent good or satisfactory alignment that investors appreciate being aware of.
An important step when pay and performance appears misaligned is to assess how various pay elements may be working to encourage, or to undermine, long-term value creation and alignment with shareholder interests. All cases where the quantitative analysis indicates significant misalignment will continue to receive an in-depth qualitative assessment, to determine either the likely cause or mitigating factors. An adverse score on the quantitative portion of the pay for performance methodology will not lead to an adverse vote recommendation, rather to an in-depth qualitative analysis.
FAQ: Canadian Executive Compensation
Enabling the financial community to manage governance risk for the benefit of shareholders.
40. What qualitative factors are considered by ISS in the qualitative assessment of the company's pay
and performance alignment?
The factors considered by ISS during the qualitative assessment of the company's pay for performance alignment include but are not limited to the following:
Strength of performance based compensation: This key consideration includes a review of the ratio of performance- to time-based equity awards as well as the overall ratio of performance-based compensation to total compensation, focusing particularly on the compensation committee's most recent decision-making (which reflects its current direction).
A company that exhibits significant misalignment of pay and performance over time would be expected to strongly emphasize performance-based compensation (though not by simply increasing the size of the pay package in order to make it more performance-based). ISS will review both recent cash awards paid and the award opportunities (long-term incentive grants) intended to drive future performance to evaluate their performance conditions. Time-based awards (including time-based stock options) that are not granted due to the attainment of pre-set goals are not considered strongly performance-based in this context. Shareholders would also expect such a company to fully disclose performance metrics and goals, which should be reasonably challenging in the context of its past performance and goals, guidance the company has provided to analysts, etc. Use of a single metric, or similar metrics, in either or both of the short- and long-term incentive programs may suggest inappropriate focus on one aspect of business results at the expense of others. If the company uses non-GAAP metrics, adjustments should be clearly disclosed (along with compelling rationale if such adjustments are nonstandard).
The company's peer group benchmarking practices: Several studies have pointed to companies' peer group benchmarking practices as a source of pay escalation that is divorced from performance considerations. Companies undertake benchmarking in order to ensure that their top management pay packages will stay competitive in the interest of attracting and retaining key executives. While this is an important objective, there are no established standards or rules for the practice, one which has been described as "more of an art than a science" by many companies. Peer selection may be influenced by many considerations. While disclosure on this issue is not robust (according to a 2011 analysis, only 66 percent of S&P 1500 companies clearly specify benchmark targets, and even less beyond that group), among companies that do disclose target peer group percentiles, 40 percent target above the median level for a least one pay element. If a company exhibits long-term disconnect between pay and performance, ISS closely examines its disclosed benchmarking approach to determine whether that may be a contributing factor. For example, a preponderance of self-selected peers that are larger than the subject company may drive up compensation without regard to performance. Above-median targeting may have the same effect.
Results of financial/operational metrics: If a disconnect is driven by cash pay, ISS considers the rigor of performance goals (if any) that generated the payouts. Recent (GAAP) results on metrics such as return measures and growth in revenue, profit, cash flow, etc. -- both absolute and relative to peers – may also be examined to assess the rigor of goals and whether the quantitative analysis may be anomalous (if other metrics suggest sustained superior performance). As noted above, company disclosure about the metrics, goals, and adjustments to results, should be clear and fulsome.
Special circumstances: The qualitative analysis may also consider exceptional situations, such as recruitment of a new CEO in the prior fiscal year or unusual equity grant practices (e.g., bi- or triennial awards) that may distort a quantitative analysis. We note, however, that such circumstances do not automatically invalidate other aspects of the analysis, including the quantitative results, since that methodology's long-term orientation is designed to smooth the impact of timing anomalies. Further, while shareholders may welcome a new CEO in light of lagging performance, they may nevertheless be concerned about a board that has been forced to pay dearly for outside talent but fails to appropriately link the new CEO's pay to performance improvement.
41. If a company has not been publicly traded for five fiscal years, does the quantitative Pay-for-
Performance evaluation still apply? What if the company has not been publicly traded for three
fiscal years? Would such a company be used as a peer company for other companies?
If the company has not been publicly traded for five fiscal years, the relative assessment, specifically the relative one-year and three-year TSR pay and performance rank and the multiple of pay against the peer median, will still apply.
If the company has not been publicly traded for three fiscal years, the one-year pay for performance ranking and multiple of pay against the peer median will still apply.
In both cases, the company's limited life will be considered as part of any qualitative evaluation.
Generally, only companies with three full years of data will be used as peer companies. In limited circumstances, a company with less than three years of data may be used when the quantitative evaluation focuses on only one year.
42. What impact might an adverse pay-for-performance recommendation have on an equity plan
proposal?
If a significant portion of the CEO's misaligned pay is attributed to non-performance-based equity awards, and there is an equity plan on the ballot with the CEO as one of the participants, ISS may recommend a vote against the equity plan.
43. A company makes equity grants near the beginning of each year based on an evaluation of the
company and/or the executive’s performance in the immediately preceding year. Such grant
information will appear in the following year’s proxy statement. Will ISS take into account the timing
of these early equity grants made in the current fiscal year and make adjustments to the top
executives' total compensation when conducting its pay for performance analysis?
Such timing issues can be problematic for investors evaluating the relationship between performance and pay. The value of equity grants generally represents a significant proportion of top executives’ pay; if the grants are made subsequent to the “performance” year, disclosures in the Summary Compensation Table or the Awards Outstanding at Year End may distort the pay-for-performance link.
Some investors believe that equity awards can incentivize and retain executives for past and future performance; therefore, adjustments for such timing issues may not be relevant. In addition, ISS' pay-for-performance analysis has a long-term orientation, where these types of timing issues are less relevant than an evaluation of one year's pay. Nevertheless, ISS may consider the timing of equity awards made early in a fiscal year if complete disclosure and discussion is made in the proxy statement in a qualitative assessment. In order to ensure that pay-for-performance alignment is perceived, the company should discuss the specific pre-established performance measures and goals that resulted in equity awards made early in a fiscal year. A general reference to last year’s performance is not considered sufficient and meaningful to shareholders. If the company makes equity grants early in each year, based on the prior year’s specific performance achievement, shareholders should not be required to search for the information. Instead, companies should provide information about grants made in relation to the most recently completed fiscal year in the proxy statement for the shareholder meeting that follows that fiscal year (aligned with other compensation reported for that year).
FAQ: Canadian Executive Compensation
Enabling the financial community to manage governance risk for the benefit of shareholders.
Equity plans constitute a significant portion of compensation programs for many Canadian companies. They provide compensation committees with greater flexibility than cash remuneration tools with which to incentivize and reward, encourage employee retention and align employee interests with those of shareholders through the gradual acquisition of equity, and, which are increasingly contingent upon performance.
ISS' policy regarding equity compensation plans for TSX-listed companies is as follows:
"Vote case-by-case on equity-based compensation plans. Vote against the plan if any of the following factors apply:
› Cost of Equity Plans: The total cost of the company’s equity plans is unreasonable; › Dilution and Burn Rate: Dilution and burn rate are unreasonable, where the cost of the plan cannot be calculated
due to lack of relevant historical data. › Plan Amendment Provisions: The provisions do not meet ISS guidelines as set out in this section. › Non-Employee Director Participation: Participation of directors is discretionary or unreasonable. › Pay for performance: There is a disconnect between CEO pay and the company’s performance. › Repricing Stock Options: The plan expressly permits the repricing of stock options without shareholder approval
and the company has repriced options within the past three years. › Problematic Pay Practices: The plan is a vehicle for problematic pay practices."
These FAQs answer in greater detail how the above policy is applied to companies listed on the TSX.
Equity Compensation Plans
While ISS examines all of the areas outlined in the above policy, four key areas are given particular attention: the cost of equity plans; option repricing; non-employee director participation; and plan amendment provisions. In extraordinary situations, additional lenses such as burn rate or dilution may also be applied in order to produce a meaningful analysis of the plan.
Cost-Based Analysis
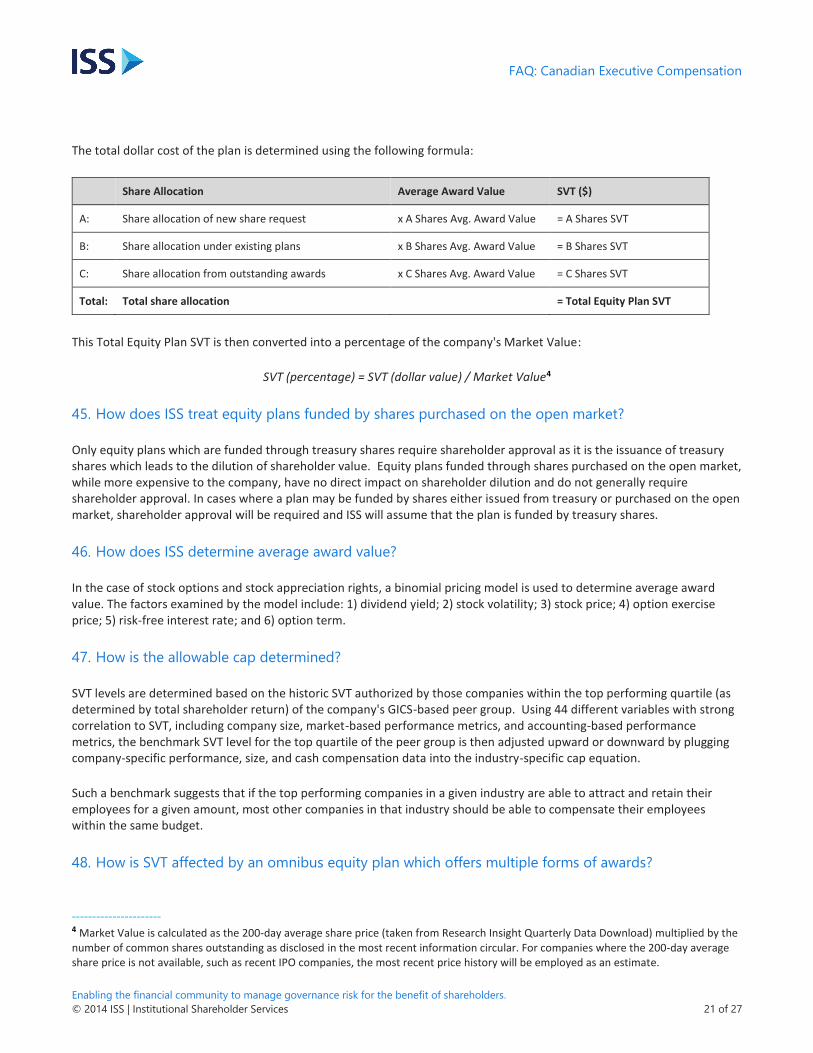
44. How is the cost of an equity plan calculated?
ISS determines the cost of an equity plan using Shareholder Value Transfer ("SVT"), a metric which assesses how much wealth flows from shareholders to award recipients. SVT can be expressed as both a dollar value and as a percentage of a company's market value. Overall, the reasonableness of the cost of an equity plan is determined by comparing its SVT to an industry-specific, market value based allowable cap. In general, equity based plans where the SVT is above the allowable cap would be considered costly for shareholders.
At a perfunctory level, SVT is the number of shares reserved under a plan multiplied by the average value of awards issued under that plan. It must be noted, however, that SVT is a snapshot of the company's equity compensation, and therefore shares available for grant or shares granted under continuing plans are included in the valuation of the equity plan on the ballot.
FAQ: Canadian Executive Compensation
Enabling the financial community to manage governance risk for the benefit of shareholders.
45. How does ISS treat equity plans funded by shares purchased on the open market?
Only equity plans which are funded through treasury shares require shareholder approval as it is the issuance of treasury shares which leads to the dilution of shareholder value. Equity plans funded through shares purchased on the open market, while more expensive to the company, have no direct impact on shareholder dilution and do not generally require shareholder approval. In cases where a plan may be funded by shares either issued from treasury or purchased on the open market, shareholder approval will be required and ISS will assume that the plan is funded by treasury shares.
46. How does ISS determine average award value?
In the case of stock options and stock appreciation rights, a binomial pricing model is used to determine average award value. The factors examined by the model include: 1) dividend yield; 2) stock volatility; 3) stock price; 4) option exercise price; 5) risk-free interest rate; and 6) option term.
47. How is the allowable cap determined?
SVT levels are determined based on the historic SVT authorized by those companies within the top performing quartile (as determined by total shareholder return) of the company's GICS-based peer group. Using 44 different variables with strong correlation to SVT, including company size, market-based performance metrics, and accounting-based performance metrics, the benchmark SVT level for the top quartile of the peer group is then adjusted upward or downward by plugging company-specific performance, size, and cash compensation data into the industry-specific cap equation.
Such a benchmark suggests that if the top performing companies in a given industry are able to attract and retain their employees for a given amount, most other companies in that industry should be able to compensate their employees within the same budget.
48. How is SVT affected by an omnibus equity plan which offers multiple forms of awards?
---------------------- 4 Market Value is calculated as the 200-day average share price (taken from Research Insight Quarterly Data Download) multiplied by the number of common shares outstanding as disclosed in the most recent information circular. For companies where the 200-day average share price is not available, such as recent IPO companies, the most recent price history will be employed as an estimate.
FAQ: Canadian Executive Compensation
Enabling the financial community to manage governance risk for the benefit of shareholders.
If the company discloses sub-limits or caps for the number of shares within the plan's share reserve which may be granted as specific award types, such information will be used to determine the shareholder value transfer as different award types would result in different SVT.
If the company does not disclose the number of shares within the reserve that may be granted under each specific award type or provides the company with a discretionary ability to determine award type, ISS will cost the share reserve for future grants as the most expensive type of award.
49. How does ISS calculate cost when a company has multiple equity plans on the meeting agenda?
If there are multiple plans on the ballot and if the cost of each plan is within allowable cap, the plans will be examined in conjunction with one another and on a qualitative basis. The cost of an individual plan is the incremental cost of the new plan in addition to the company's ongoing plans. This process ensures that the costs associated with shares that are available for issue and/or granted and outstanding are included, but are not double counted.
50. How is dilution calculated?
Dilution is calculated using both basic and fully diluted shares, with the latter including shares allocated from equity plans as well as warrants and convertibles.
51. How is burn rate calculated?
ISS uses three-year average burn rate when assessing equity plans. Annual burn rate is determined using weighted average common shares outstanding to smooth out the impact of share buybacks and share issuances. Within a given single year, burn rate is calculated as:
Number of options granted + (Number of full value shares awarded * FVA multiplier)5
Weighted average common shares outstanding
Non-Employee Director (NED) Participation
52. What is ISS' policy regarding discretionary non-employee director participation in equity plans?
ISS will recommend voting against an equity compensation plan which provides for discretionary participation by non-employee directors.
53. Why does ISS have a policy regarding discretionary non-employee director participation in equity
plans?
Canadian institutional investors do not generally support stock options as an appropriate form of equity compensation for non-employee directors, and at a minimum require that option grants to non-employee directors be substantially restricted. As well, discretion on the part of the plan administering committee to grant themselves other forms of equity
---------------------- 5 As full value awards (FVAs) are considered to be more expensive from a shareholder perspective, the dilutive value of FVAs will be
multiplied relative to the company's share price volatility.
FAQ: Canadian Executive Compensation
Enabling the financial community to manage governance risk for the benefit of shareholders.
raises concerns with respect to self-dealing and overcompensation of otherwise independent directors, from a corporate governance perspective.
54. What are the acceptable limits for non-employee director participation in equity plans?
Non-employee director participation in equity plans should be limited as follows:
› The number of shares reserved under the plan which may be granted to non-employee directors may not exceed 1 percent of shares outstanding;
AND › If the equity plan does not provide for the granting of stock options, the plan must explicitly state that the total annual
grant to any one non-employee director cannot exceed a grant value of $150,000; OR › If the equity plan is a stock option plan or an omnibus plan from which stock options may be issued up to the total
number of treasury shares reserved for the plan, the plan must explicitly state that the total annual grant to any one non-employee director cannot exceed a grant value of $100,000.
A one-time initial grant under an equity plan to a new director upon joining the board of directors is not subject to the ISS NED Limit policy as long as disclosure and rationale related to the exceptional one-time grant is clearly provided.
If the company has not disclosed any limits on the non-employee director participation in the equity plan document, ISS assumes that director participation is discretionary.
55. What about equity or DSUs granted or taken by NEDs in lieu of cash fees?
Equity or DSUs that are granted or taken by NEDs in place of cash fees are not counted toward the NED participation limit in the company's equity plans, provided that the equity granted has the same value as the cash fees given up in exchange. Please refer to the further discussion of DSU plans in Question 57.
FAQ: Canadian Executive Compensation
Enabling the financial community to manage governance risk for the benefit of shareholders.
56. If an Omnibus Plan substantially limits and discloses the number of stock options that can be
granted out of the total reserve, so that full value awards will comprise a substantial percentage of
the equity granted under the plan, will this impact the director participation limit?
Where a reasonable limit on shares reserved under the plan for stock options is disclosed, with full value awards making up a substantial percentage of the plan reserve, a plan may explicitly state that the total annual stock option grant value to any one non-employee director cannot exceed $100,000 (or a lesser grant value); and further indicate that the total annual full value award grant value to any one non-employee director cannot exceed an additional $50,000 (or greater limit if the annual option award limit has been established at less than $100,000), so that the maximum annual award limit to any one non-employee director may not exceed $150,000 in any event and further provided that stock option grants must not exceed $100,000 annual grant value.
57. Are DSU (Deferred Share Unit) plans considered equity plans for the purposes of the non-employee
director participation limit?
Non-employee director participation in a DSU plan will not be counted toward the non-employee director participation limit so long as the following criteria are met:
› All DSUs issued to non-employee directors are issued in lieu of cash fees; and › In the case of a Director DSU plan, the plan reserve is reasonably limited.
Any DSUs issued to non-employee directors from the treasury, on a discretionary basis, or in any way other than as a value-for-value alternative to cash compensation, will result in the plan being considered an equity plan for the purposes of the non-employee director equity participation limit.
The initial value of DSUs issued must be equal to the value of the fees deferred. Any policies which increase the initial dollar value of a director's compensation should the director elect to receive said compensation as equity rather than cash (for example, a policy where the company will match every DSU the director takes in lieu of cash with an additional DSU) will not be exempt from the participation limit.
58. Does a company need both a dollar limit and a percentage limit in order to acceptably limit an
option plan for non-employee directors?
ISS policy is concerned with the annual individual dollar value limit imposed on NED grants and explicitly set out in the terms of the equity plan being approved by shareholders. A company may, however, find it advantageous to also express the NED reserve within the plan reserve as a percentage so that this information may be considered by all of the company's shareholders in determining their vote.
59. Why does the ISS NED Limit policy distinguish between option-based and non-option-based equity
plans?
While shareholders continue to harbour concern regarding option grants to non-executive directors, shareholders also believe that director compensation should adequately reward directors for their experience, expertise, and time devoted to the company. Given regulatory updates and increased shareholder engagement activity, the role of non-employee directors has expanded substantially. Therefore, an increase in the level of non-employee director share based (non-option) compensation may be considered appropriate to attract and retain qualified and experienced directors.
FAQ: Canadian Executive Compensation
Enabling the financial community to manage governance risk for the benefit of shareholders.
Generally vote against proposals to reprice outstanding options. ISS has long opposed option repricing and believes that any proposal to reduce the price of outstanding options, including those held by non-insiders, should be approved by shareholders before being implemented. Stock options are intended to be at-risk incentive compensation which aligns the interests of option-holders and shareholders. This incentive value is diminished when the exercise price of out-of-the-money options can be adjusted downwards or the term of an option can be extended.
61. What constitutes repricing?
The following and any other adjustments that can be reasonably considered repricing will generally not be supported: reduction in exercise price or purchase price, extension of the term of outstanding options, cancellation and reissuance of options, substitution of options with other awards the terms of which are more favourable to the recipient.
62. What is ISS' policy regarding options with declining exercise prices?
A select few TSX companies issue or have issued options wherein the exercise prices of these options decrease relative to the value of regular ordinary dividends issued by the company. Institutional shareholders have indicated little tolerance for this practice, and ISS therefore considers this gradual decrease in the exercise price of an option to be repricing.
Equity Plan Amendment Provisions
63. According to ISS policy, which types of future amendments to an equity compensation plan should
require shareholder approval?
ISS will generally vote against an equity compensation plan that discloses plan amendment provisions (as required by the TSX) which do not require shareholder approval for the following types of amendments:
› Any increase in the number of shares reserved for issuance under a plan or plan maximum; › Any reduction in exercise price or cancellation and reissue of options or other entitlements; › Any amendment that extends the term of options beyond the original expiry; › Amendments to eligible participants that may permit the introduction or reintroduction of non-employee directors on
a discretionary basis or amendments that increase limits previously imposed on non-employee director participation; › Any amendment which would permit options granted under the Plan to be transferable or assignable other than for
normal estate settlement purposes; and › Amendments to the plan amendment provisions.
FAQ: Canadian Executive Compensation
Enabling the financial community to manage governance risk for the benefit of shareholders.
64. Does the above list of requirements differ depending on the type of award(s) issued under the
equity plan?
For equity plans under which only full-value awards may be issued, a plan’s amendment provisions need not address amendments which would only be relevant to an equity plan which grants options. The list of amendments which must require shareholder approval in order for a non-option granting equity plan to be found acceptable by ISS includes:
› Any increase in the number of shares reserved for issuance under a plan or plan maximum; › Amendments to eligible participants that may permit the introduction or reintroduction of non-employee directors on
a discretionary basis or amendments that increase limits previously imposed on non-employee director participation; › Amendments to the plan amendment provisions.
65. How does ISS’ policy concerning equity plan amendment provisions differ from that of the TSX?
Although the TSX requires shareholder approval for re-pricing only if the options being repriced are held by an insider, ISS does not support re-pricing of any outstanding options and at a minimum requires that the repricing of non-insider options should also require shareholder approval. The incentive value of stock options is diminished when the exercise price of out-of-the-money options can be adjusted downwards, and is not supportable when shareholders must suffer the consequences of a downturn in share price.
Discretionary participation by non-employee directors in equity compensation plans, while permitted by the TSX, is unacceptable from a corporate governance and accountability viewpoint because administrators of the plan should not have the unrestricted ability to issue awards to themselves. Directors who are able to grant themselves equity awards on a discretionary basis could find their independence compromised. Therefore, ISS supports amendment provisions which prohibit the board from altering equity-plan participation provisions to include non-employee directors without shareholder approval. As well, any amendment to a non-employee director limit established in the plan should require shareholder approval.
The TSX also does not require that any amendment to an equity plan which would allow options to be transferable or assignable require shareholder approval. The practice of transferring or assigning options other than for the purpose of estate settlement diminishes the purpose of granting options to retain employees and align their interests with shareholders in the long term. Therefore, ISS requires that any amendment to an equity plan which would permit options to be transferable or assignable should require shareholder approval.
66. If a company has not placed any limit on director participation in an equity plan, must the equity
plan still contain an amendment provision regarding non-executive director participation?
No, as doing so would serve no meaningful purpose. Rather, ISS expects that as more companies continue to restrict non-employee director participation in equity plans they will simultaneously choose to enshrine that choice through the addition of the relevant amendment provision.
FAQ: Canadian Executive Compensation
Enabling the financial community to manage governance risk for the benefit of shareholders.
This document and all of the information contained in it, including without limitation all text, data, graphs, and charts (collectively, the "Information") is the property of Institutional Shareholder Services Inc. (ISS), its subsidiaries, or, in some cases third party suppliers.
The Information has not been submitted to, nor received approval from, the United States Securities and Exchange Commission or any other regulatory body. None of the Information constitutes an offer to sell (or a solicitation of an offer to buy), or a promotion or recommendation of, any security, financial product or other investment vehicle or any trading strategy, and ISS does not endorse, approve, or otherwise express any opinion regarding any issuer, securities, financial products or instruments or trading strategies.
The user of the Information assumes the entire risk of any use it may make or permit to be made of the Information.
ISS MAKES NO EXPRESS OR IMPLIED WARRANTIES OR REPRESENTATIONS WITH RESPECT TO THE INFORMATION AND EXPRESSLY DISCLAIMS ALL IMPLIED WARRANTIES (INCLUDING, WITHOUT LIMITATION, ANY IMPLIED WARRANTIES OF ORIGINALITY, ACCURACY, TIMELINESS, NON-INFRINGEMENT, COMPLETENESS, MERCHANTABILITY, AND FITNESS for A PARTICULAR PURPOSE) WITH RESPECT TO ANY OF THE INFORMATION.
Without limiting any of the foregoing and to the maximum extent permitted by law, in no event shall ISS have any liability regarding any of the Information for any direct, indirect, special, punitive, consequential (including lost profits), or any other damages even if notified of the possibility of such damages. The foregoing shall not exclude or limit any liability that may not by applicable law be excluded or limited.