Friends at Work: Can Peer Support Stimulate Female Entrepreneurship? * Erica Field (Duke) Seema Jayachandran (Northwestern) Rohini Pande (Harvard) Natalia Rigol (MIT) June 6, 2014 Abstract Do lack of a support network and role models contribute to the observed gender gap in microen- terprises? And are these cultural constraints more strongly felt by women facing more restrictive social norms on their mobility? Working with 636 customers of India’s largest women’s bank, we offered a random sample two days of business counseling and assistance in identifying a medium- term financial goal. A random subsample were invited with a friend. The intervention had a significant immediate impact on participants’ business activity, but only if they were trained in the presence of a friend. These clients were more likely to take out new business loans; then, four months later, they reported increased business activity and higher household income, and were less likely to report their occupation as housewife. The positive impacts of training with a friend are stronger among women from religious or caste groups with social norms that restrict female mobility. * Contact information: [email protected]; [email protected]; rohini [email protected]; [email protected]. We are grateful to Manasee Desai, Katherine Durlacher, Mallika Thomas, and Divya Varma for excellent research assistance, to the staff of SEWA for their cooperation and support and to ICICI and Exxon Mobil (through WAPPP Harvard) for financial support. We thank the Centre for Microfinance for hosting the study.
Transcript
Friends at Work:
Can Peer Support Stimulate Female Entrepreneurship?∗
Erica Field (Duke) Seema Jayachandran (Northwestern)
Rohini Pande (Harvard) Natalia Rigol (MIT)
June 6, 2014
Abstract
Do lack of a support network and role models contribute to the observed gender gap in microen-
terprises? And are these cultural constraints more strongly felt by women facing more restrictive
social norms on their mobility? Working with 636 customers of India’s largest women’s bank, we
offered a random sample two days of business counseling and assistance in identifying a medium-
term financial goal. A random subsample were invited with a friend. The intervention had a
significant immediate impact on participants’ business activity, but only if they were trained in
the presence of a friend. These clients were more likely to take out new business loans; then,
four months later, they reported increased business activity and higher household income, and
were less likely to report their occupation as housewife. The positive impacts of training with a
friend are stronger among women from religious or caste groups with social norms that restrict
female mobility.
∗Contact information: [email protected]; [email protected]; rohini [email protected]; [email protected] are grateful to Manasee Desai, Katherine Durlacher, Mallika Thomas, and Divya Varma for excellent researchassistance, to the staff of SEWA for their cooperation and support and to ICICI and Exxon Mobil (through WAPPPHarvard) for financial support. We thank the Centre for Microfinance for hosting the study.
1 Introduction
Women in rich and poor countries alike are less likely than men to succeed as entrepreneurs (Global
Entrepreneurship Monitor, 2011; De Mel, McKenzie, and Woodruff, 2008). A common policy re-
sponse in low-income settings, where female educational attainment is relatively low, is to prescribe
business training and counseling programs. Yet a growing body of experimental evidence suggests
that simple deficits in business or accounting know-how are not at the heart of the gender gap in
performance (McKenzie and Woodruff, 2014).
Here we ask whether the low numbers of successful female micro-entrepreneurs may directly
contribute to their weaker performance by limiting positive peer effects on business behaviors. In
particular, if micro-entrepreneurs benefit from, or are positively influenced by, peer interactions in
the workplace, then women will be naturally disadvantaged in this sector.
To empirically test the proposition that the presence of peers influences the business behaviors
and outcomes of women, we conduct a short (two half-days, with two hours of in-class training per
day) business counseling program with clients of India’s largest women’s bank, SEWA Bank. From
a pool of 636 clients, 424 were randomly selected and invited to participate. Program take-up was
roughly 70%. During the program, women were taught basic financial literacy and business skills
and shown a film showcasing successful role models in their community. They also worked with
the trainer to set a medium-term financial goal and identify ways to break that goal down into
actionable steps. Participants were encouraged to use savings as the appropriate device to achieve
the target and were informed about the different savings products available from the bank. The
key experimental variation on which we focus is that a random half of the potential participants
were invited to attend the training and counseling sessions with a peer of their choice.
The brief sessions had substantial effects on business behaviors and outcomes, but only among
those who were trained alongside a friend. Bank administrative data show that four months later,
women in both groups were more likely to take out a loan relative to the control group of women
that were not invited to attend; however this may simply reflect greater familiarity with bank
products or confidence post-training that the bank would offer them a loan. More revealing are
the substantial differences in how that loan was used across those invited to attend alone and
those invited to attend with a friend. Women invited alone almost exclusively used the marginal
loans for home repair, whereas those invited with a friend almost exclusively used the marginal
loans for business purposes. Furthermore, survey data show that four months later, those invited
with a friend report differences in business behavior, including higher volume of business and more
stated business plans to increase revenues, while women invited alone experience no change in these
outcomes relative to the control group. Perhaps most strikingly, those invited with a friend also
2
report significantly higher household income and expenditures and are less likely to report their
occupation as housewife.
This set of findings indicates that the presence of a friend at the training enabled women to set
and successfully implement business-related goals. There are multiple channels through which peer
effects could operate. For instance, women may exhibit greater business confidence when they are
in a more supportive environment, or may feel more pressure when among peers to compete in the
workplace. Alternatively, peers may help women attain their goals by providing support after the
training is over. While our experiment is not designed to disentangle these potential mechanisms,
there is suggestive evidence from a subsample of participants that women in the treatment-with-
friend sessions set systematically different goals for themselves during the training, which indicates
that the presence of friends changed aspirations rather than ability to implement those goals. This
interpretation is further reflected in the fact that treatment-with-friend women feel no more or less
confident about business skills after the training and did not differ in their propensity to discuss
business matters with family and friends.
We also examine whether the impacts of treatment-with-friend vary with the social norms
regarding female mobility associated with the client’s caste and religion. The hypothesis is that
one reason why Indian female entrepreneurs lack a professional network is social norms that restrict
their mobility and interactions with others. Thus, the women most likely to benefit from professional
peer interactions are those most subject to social strictures. Consistent with this, the impacts of
peer training on business loans and labor supply are concentrated among women belonging to
groups with more restrictive social norms.1
Our results demonstrate that peer encouragement can exert a positive influence on female busi-
ness decisions, and suggest one potential reason for the gender gap in entrepreneurship: fewer peer
interactions in the workplace. They also highlight that one channel through which training pro-
grams for female entrepreneurs – specifically, programs that introduce role models and strengthen
business peer networks – can improve business outcomes is that they raise aspirations. This evi-
dence is related to work on how role models alter perceptions of what is achievable in the workplace
(Macours and Vakis, 2009; Ray, 2006; Genicot and Ray, 2010).
Our paper contributes to growing, but largely distinct, experimental literatures on peer effects
in learning and the impact of business training programs. In low-income settings, the literature
on peer effects in learning has largely focussed on schools. Duflo, Dupas, and Kremer (2011) finds
evidence of ability-based peer effects in learning and Rao (2014) finds limited evidence of income-
1The business counseling and training program was also analyzed in Field, Jayachandran, and Pande (2010),where we examined differences between the control and treatment groups irrespective of whether they were invitedwith a friend. In that paper, we showed that average treatment impacts also varied with client caste and religion,which were linked to social norms on mobility.
3
based peer effects for learning but significant effects for rich students’ willingness to interact with
poor students. On peer effects in entrepreneurship learning, two recent papers exploit random
variation in class section assignment at Harvard Business School to examine subsequent workplace
outcomes. Malmendier and Lerner (2013) find that having more peers with prior entrepreneurial
experiences reduces subsequent unsuccessful attempts at entrepreneurial activity which they at-
tribute to learning from peers. Shue (2013) finds that subsequent managerial and compensation
outcomes are more similar within sections than across sections. Our setting is very distinct in that
it focusses on low-income women in urban India.
Turning to business training programs for micro-entrepreneurs in low-income settings, exper-
imental studies point to modest positive program impacts with significant heterogeneity (for a
complete review, see McKenzie and Woodruff (2014)).2 LaFortune, Tessada, and Perticara (2013)
examine peer effects in a business training program in Chile where peer-treated participants are
assigned with participants with similar prior attachment to the workplace, defined using an index
of propensity to work. They find limited evidence that matching participants by workplace attach-
ment influences subsequent labor supply. However, they do find that (non-experimental) variation
in peers’ average propensity to work raises a participant’s labor supply.
Our paper extends these literatures in multiple ways. First, we focus on peer effects for the
population that is typically targeted by business training programs in low-income settings – female
micro-entrepreneurs. Second, we consider the role of friends as peers. In environments where
women face social norms that limit interactions with strangers, it is particularly important to know
whether training with self-identified friends (where the interaction restrictions are likely less strong)
can have an impact. Thus, in addition to shedding light on the role of peer networks and, thereby,
potential barriers to female microenterprise activity, our findings have implications in terms of how
to design business training and counseling programs to maximize their influence. Given that peer
effects are likely to operate through making participants more ambitious in the goals they set or
more accountable to those goals once set, we posit that the presence of friends as peers is likely
to be particularly influential in training programs that involve personalized business plans rather
than simple information provision.
The remainder of the paper is organized as follows. Section 2 first describes the business
counseling intervention and outlines our hypotheses regarding likely impacts. We follow this by
describing the study design, sample and data sources. Section 3 presents the empirical results and
Section 4 concludes.
2In terms of curriculum the most related paper is Karlan and Valdivia (2011) evaluate a program in Peru whichused training materials from the same group – Freedom from Hunger – as we do. Similar to them, we find thatbusiness training can increase loan demand from the microfinance institution.
4
2 Intervention and study design
2.1 Business Counseling: Context and Program Details
Our study was conducted in Ahmedabad – the capital city of Gujarat, India – in conjunction with
Self-Employed Women’s Association (SEWA) Bank.3 SEWA Bank’s 170,000 member-clients are
primarily women who work in the informal sector in home-based occupations such as piece rate
work (e.g., making incense sticks), vegetable vending, construction work, and rag picking. In 2006,
the median income of a SEWA client was one dollar a day.
SEWA Bank offers savings accounts, individual loan products (rather than the joint-liability
group lending often associated with microcredit), pension accounts, and other financial products
to its clients. All clients are required to have a savings account and roughly a quarter of them
eventually transition into borrowing.
In the early 2000s, SEWA Bank began offering a five-day financial literacy training program,
which used lessons, games, and videos to teach its clients basic accounting skills, interest rates,
the importance of avoiding excess debt, and long-term “life-cycle” planning, among other topics.
More recently, it started a second five-day course that teaches business skills such as marketing,
cost reduction, investment, and customer service. Anecdotally, individualized business counseling
occurred frequently during both programs, in line with the bank’s overall mission to serve and
empower its clients.
To investigate factors influencing female entrepreneurial outcomes, we collaborated with SEWA
Bank to design a streamlined two-day training module, which combined elements of the existing
financial literacy and business skills curricula, and added new material focused on aspirations.4
The training sessions we offered were taught by the regular SEWA Bank instructors who had been
teaching the five-day financial literacy and business skills classes. The rationale for combining the
course material was to address the fact that the two types of skills are complementary; many self-
employed women in this setting do not possess basic numeracy skills, which are clearly valuable in
making sound business decisions (e.g., assessing the returns on a potential investment relative to
the interest rate on a loan that could finance the investment), yet may not be enough on their own
to influence business outcomes. We chose to implement a very short, streamlined course in order
3SEWA Bank was created in 1974 by the Self-Employed Women’s Association, a trade union for poor self-employedwomen that is based in the city of Ahmedabad. While formally a trade union, SEWA functions as an all-aroundadvocacy and support group for self-employed women, and banking is one of the many services that SEWA providesits members.
4The original five-day course was based on a well-known Freedom from Hunger curriculum. Our modified curricu-lum was designed after focus group discussions with women who had attended SEWA trainings in 2006. We usedinformation on what training elements they found most useful, what they implemented in the short run and whatthey retained or abandoned in the long run to condense the two five-day trainings into a two-day training (a total offour hours).
5
to ascertain whether women’s aspirations and willingness to take up goals (complemented with a
review of skills needed to attain them) could be influenced with an intervention that could easily
be scaled up.
The training emphasized financial prudence – women were encouraged to save more and to
reduce “frivolous” spending (for example, on tea and snacks). The program featured content that
aimed directly to increase women’s aspirations . First, women were shown a short film showcasing
the lives of a few successful SEWA members who used good financial practices to bring themselves
out of poverty. Second, at the end of the first day women received a homework sheet in which they
had to identify (overnight) a financial goal they would like to achieve over the next six months.
During the second day of training, the participants worked in groups to identify steps they could
take to achieve their goal such as reducing wasteful expenditure and changing sub-optimal business
practices. They completed the worksheet which broke down their goal into smaller achievable steps
(the Appendix provides the worksheet). The aim was to motivate the women to set their sights
higher and to think about and decide on concrete ways to improve their financial and business
practices.
To isolate the influence of peer support, we designed the intervention so that a randomly selected
half of the participants were invited to come alone, while the other half were encouraged to bring
a close friend or relative of their own choosing, preferably someone who shared their occupation.
To acomplish this, we asked women in both treatment groups at the outset to name and provide
the contact information for a first and second choice friend who may be invited to attend with
them. For women randomly assigned to the treatment-with-friend group, we subsequently visited
the specified friend and invited her to attend the same training session.
2.2 Hypotheses
Most business training and counseling programs seek to provide information and advice that will
increase business income and economic well-being of the entrepreneur. The two-day module we used
emphasized savings, aimed to enhance aspirations and provided a structured way to identify and
work towards a financial goal. We examine impacts on financial and business behavior (including
labor supply decisions) alongside business income and household expenditures.
The invited-with-a-friend versus invited-alone treatment arms could differentially affect behavior
along several margins. First, if women’s mobility is constrained, particularly due to social norms
concerning women being unaccompanied while outside the home, we expect that women in the
invited-with-a-friend treatment arm may be more likely to attend our training sessions.5 Second,
5Also consistent with this theory is the possibility that the women incentivized to come to the training whentreated alone are different than those who take up the training with a friend.
6
while our trainings were meant to be easily comprehensible by the participants, it is possible that
women who attended with a friend were able to further discuss and internalize the material being
taught in the classes. If this is the case, we could see that treated-with-friend women follow the
advice given in the class more closely; therefore, we could expect these women to have a higher
levels of savings and aspirations. We could also observe a spillover to other business outcomes if
the training creates a space for friends to inspire confidence in one another, share other business
ideas, help one another implement innovations, or share risk. In addition, since participants set a
specific goal and discuss it with the group, having a friend witness this might act as a commitment
device to achieve the goal, or may influence their choice of goal.
2.3 Program Implementation
Our sample consisted of 636 women age 18 to 50 who had actively saved or borrowed from SEWA
Bank between December 2004 and January 2006. We followed a two-stage selection process: First,
we selected 435 eligible women from a pool of 1900 SEWA clients for whom a socioeconomic survey
had recently been conducted (which could give us baseline data). Second, in February 2007 we
selected an additional 201 women from the SEWA Bank customer database (using the criteria
listed above), and conducted a brief baseline survey for these clients.
Of the 636 participants, 212 clients were randomized into the control group, 217 were selected
for the first treatment arm – train alone – and 207 for the second treatment arm – train with
a friend. We followed a two-step stratified randomization procedure: the first stratification is
provided by the two-stage selection procedure described above (the randomization for the first 435
women and the additional 201 clients occurred at different times). Second, we stratified by the four
SEWA branches, with a woman being classified by the branch nearest to her home. Occupation,
religion, caste, and other socio-demographic characteristics are often correlated with the area in
which the woman lives, so branch stratification helped balance the sample on these characteristics.
In addition, trainings occurred at all four branches (with women recruited for the trainings at her
nearest branch). The overall treatment group, combining both arms, consists of 424 women.
To recruit the women for training, two members of the project team, accompanied by a local
SEWA bank officer (“saathi”), went to invite each woman in the treatment group. The woman was
told that many other women had attended business training in the past and had found some benefit
from it. In addition, she was informed that she would receive tea and snacks at each training, and
if she attended both days of the training, she would receive Rs. 40 to cover her travel expenses.
During recruitment, the woman was also shown a business-training certificate of participation and
a photograph of training participants, which she would additionally receive upon completion of the
training on the second day. All women were told that there was a possibility that their friends
7
could also be invited if enough spots were available. Each woman in the treatment group was,
therefore, asked to list the names, occupations, and addresses of three friends, two with the same
occupation as her and one with a different occupation.
For women in the treatment-with-friend group, a surveyor visited her friend and invited her to
attend the same training session. Follow-up phone calls were made to women who provided phone
numbers. Women were reimbursed for their transportation costs, but were not otherwise financially
compensated for attending. They were, however, provided snacks at the training and received the
promised certificate and a group photo. The estimated cost of providing the training is 157 rupees
(about four US dollars) per participant, including the instructor fee, classroom costs, recruitment,
and snacks and transportation reimbursement.
Women were recruited to attend a particular training session at their nearest SEWA branch.
There was only one instructor team so, rather than being held concurrently, training sessions rotated
among the four locations, with the order and schedule depending on classroom availability in the
SEWA branches. Typically eight women were trained at each session. These included four from
the treatment-alone group and four from the treatment-with-friend group. Actual attendance was,
therefore, up to twelve if all clients attended and those eligible brought friends.6 The morning of
the training, the recruiters would return to the women’s homes to remind them about the training
later that afternoon. Those who had telephones were also phoned as an additional reminder.
In total, we conducted 57 two-day training sessions over an eight-month period from September
2006 to April 2007, and 292 women from the sample attended training. In the estimation, each
woman’s randomly assigned treatment status rather than her attendance at training is used to
identify the program effects.7
The 212 women who were randomized into the control group were assigned to a particular
training session taking place at their nearest SEWA location; three or four control group members
were assigned to each training session. These women were not recruited for the actual training,
so the sole purpose of assigning them to a particular group was for data collection and analysis.
Specifically, for the follow-up survey, control group members were surveyed at the same time that
“their” group was resurveyed. In our regression analysis we cluster standard errors by training
session.
6Toward the end of the intervention, nine or ten women were often recruited, including women who were unableto attend during the beginning of the intervention.
7We observe the following deviations between intended training and actual training status: two women from thecontrol group were mistakenly recruited and attended the training, one with a friend. In addition, three women fromthe treatment arm with no friend invited a friend to attend. 12 women who were in the treatment-with-friend armcame without a friend.
8
2.4 Data
Our analysis makes use of three data sources: a baseline survey, a follow-up survey after the
intervention, and SEWA Bank administrative data. We have administrative data for the full sample
of 636 women.8
The baseline survey was administered to the original sample of 435 women in early 2006.9 The
supplementary sample of 201 clients was given a separate short baseline survey; for the treatment
group, the survey was conducted at the same visit when the woman was recruited for training, and
for the control group, it was conducted (without recruitment) at a similar time. Columns (1)–(3)
of Table 1 report descriptive statistics from the baseline survey, separately for the control and two
treatment arms. The average age of women in the sample is 35 years. A little under 90% are
married, and about 30% are Muslim (most of the others are Hindu). About 76% of the women
are literate and have an average of 6.4 years of education. Over 83% are employed in a household
enterprise, and 7% are housewives. Our study participants live in households with on average 5.28
occupants and Rs.5717 monthly income. In nearly 50% of the sample, a portion of that household
income is earned from a household enterprise.
The follow-up survey was conducted on a rolling basis on average four months after a given
participant was recruited to attend her training event. Control group members were administered
the survey at the same time as the members of their training session. This survey gathers data
on income, client business practices, labor supply outcomes, and also household expenditures. We
were able to complete the survey with 604 women. The attrition rate was similar across the three
groups.10
We also use SEWA Bank’s administrative data on clients’ financial activity, which track account
activity on a transaction level. This provides us data on whether the client took out a loan from
SEWA after the training and its purpose. We also have information on whether the client opened
a new savings account. In order to create a comparable measure with the survey data collected,
we consider the four-month span after each client’s training day.
8Since the publication of Field, Jayachandran, and Pande (2010), we have been able to obtain complete transactionsdata for the full sample of 636 clients.
9This survey was designed and administered for a different project, but has several pre-intervention measures thatwe use. It includes questions on the client’s savings and borrowing behavior and on educational, occupational, andother socio-demographic characteristics.
10The composition of treatment status in the follow-up survey consists of 205 from the treatment which had nofriend invited, 200 from the treatment group that had a friend invited, and 199 from the control group.
9
2.5 Estimation Strategy
Randomization of treatment arms allows us to estimate regressions of the form
Yi is an outcome measure for individual i, and Treati is an indicator variable that equals 1 if
she was assigned to receive the training and 0 otherwise. TreatWithFriendi equals 1 if the client
was additionally invited to training with a friend. The coefficient β2 is the differential effect of
being trained with a friend, relative to being trained without a friend. We include stratification
and training timing variables in the vector Xi. The stratification dummy variables are interactions
of the dummy for the SEWA training center and a dummy for whether the individual was part of
the original or supplementary sample. We also include training month dummies.11 Standard errors
are clustered by training session to allow for correlated errors caused either by a common training
experience or because of the similar timing when the follow-up data were collected.
In the regression tables, Panel A shows the β1 and β2 coefficients for the estimating equation
1. In Panel B we show β1 from the pooled regression
Yi = α+ β1 · Treati +Xi · λ+ ui (2)
Table 1 columns (4) and (5) report randomization balance checks. In column (4) we report β1
from estimating equation (2) and in column (5) β2 from estimating equation (1). The treatment
and control groups are roughly balanced along baseline characteristics. Three exceptions are that
our treatment group clients are significantly less likely to report being wage- or salary-employed
and more likely to be piece-rate workers. Additionally, some of the differences, while insignificant
are moderately large in magnitude, which is not surprising given the reasonably small sample size.
Our main tables provide the pure experimental estimates and in Appendix Table 2 we show that
adding controls for client occupation leave our estimates unchanged.
3 Results
In this section we examine program impacts four months after the training occurred. Our regressions
provide Intent to Treat (ITT) estimates throughout. In order to calibrate these effects, we start by
examining program take-up in Table 2. Column (1) Panel B shows that overall, being assigned to
treatment increased the likelihood of attending training by 67.7 percentage points. Panel A shows
11In unreported regressions we have checked that our impacts are robust to controlling for age, marital status,religion, literacy, years of education, employment status, occupation, household income, and household size.
10
an insignificant difference between invited-alone and invited-with-a-friend; the point estimate of
0.074 on TreatWithFriend in column (1) suggests that this feature increased take-up by 10% and
the effect is significant at the 11.5 percent level. In column (2) we examine the effect of treatment
status on attending with a friend. Panel A shows that nearly all of attendees who were recruited
with a friend attended with a friend.12 Our take-up results are consistent with other training
studies that offer free-of-charge counseling: McKenzie and Woodruff (2014) find that attendance
across 16 business training RCT studies is on average 65%.
Given evidence of substantial program take-up we now examine program impacts on financial
and economic outcomes.
3.1 Financial Behavior
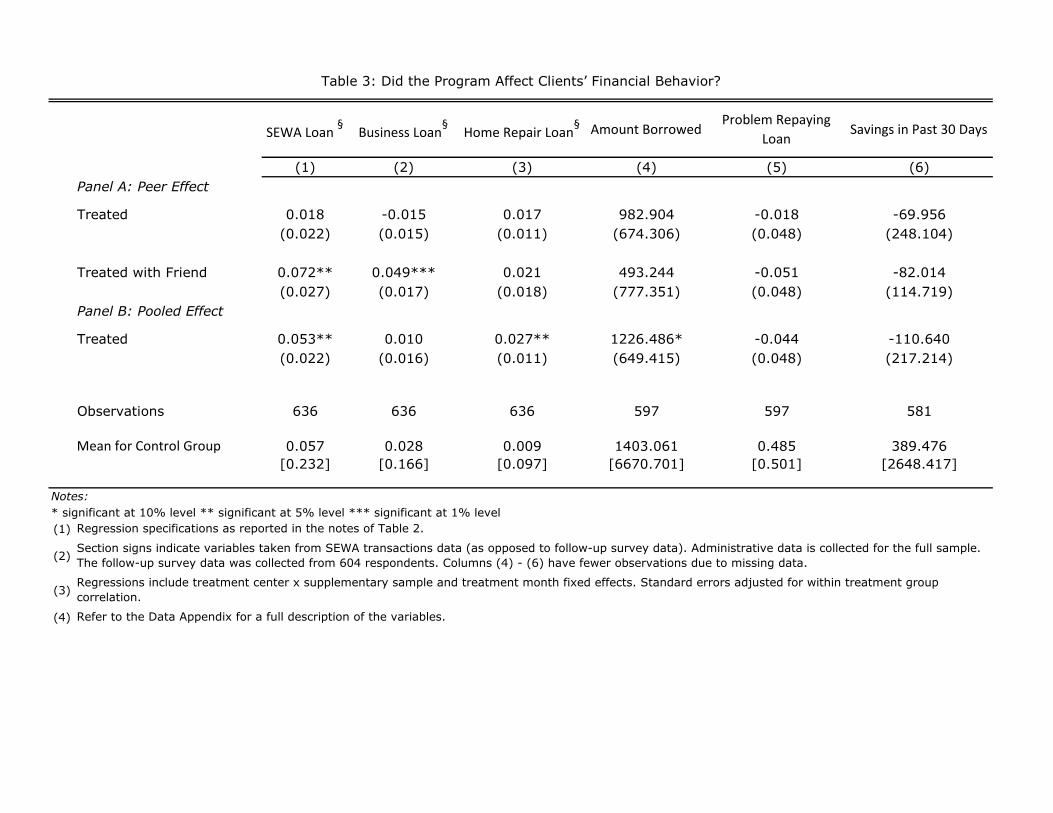
In Table 3 we use a combination of administrative and survey data to examine changes in client
financial behavior; in both cases outcomes are measured four months after training. We observe
a sharply differential effect between treatment-with-friend and treatment-alone groups in terms
of borrowing behavior. In column (1) we see that women in the treatment-with-friend group are
seven percentage points more likely to take out a loan (Panel A) and overall the training led to
a significant increase (5.3 percentage points) in the likelihood of taking out a loan from SEWA
(Panel B); the rate of loan take-up doubled as a result of the treatment. The fact that this effect
is concentrated among treatment-with-friend women suggests that this cannot be attributed to
general program features such as more information about SEWA loans or a belief among clients
that training makes one more eligible for a loan.
Two-thirds of the increased loan-taking was for business or house repair loans, with the remain-
ing one-third covering education, marriage, jewelry, and other expenses. In column (2) of Table 3
we see that the increase in business loans is concentrated among the treatment-with-friend group
while, in column (3), house repair loan increases occur for both treatment groups. We do not have
administrative data on the amount borrowed and therefore rely on self-reported loans amounts
(column 4). Consistent with the administrative data, total amount borrowed increases by about
Rs.1226, but the treatment-specific estimates in Panel A are noisy.
Many women operate their businesses from home, so the home versus business loans are not
mutually exclusive. The training, therefore, could have had the level effect of inducing both types
of treatment clients to take out home-repair loans for general improvement of the business. Yet
clients in the treatment-with-friend group were additionally more likely to incur other business-
12The only contamination in the attendance protocol, as seen in column (2), comes from three clients who wasassigned to be treated alone but attended a training meeting with a friend. Conditional on attending the first day,over 97% completed the training.
11
specific loans. Column (5) (from survey data) shows that clients in neither treatment group are
more likely to report having problems repaying their loans, which suggests that the training did
not encourage clients to enter into an excessive amount of business debt.
Lastly, column (6) uses survey data to examine the treatment effects on savings. Recall that the
curriculum explicitly encouraged savings (see Appendix). Thus, it is surprising that the training
had no effect on the total amount that households report saving in the previous 30 days. We do
not observe savings balances in the administrative data, but those data also confirm that treatment
clients are no more likely to open new types of savings account at SEWA (results not shown).
3.2 Business Behavior
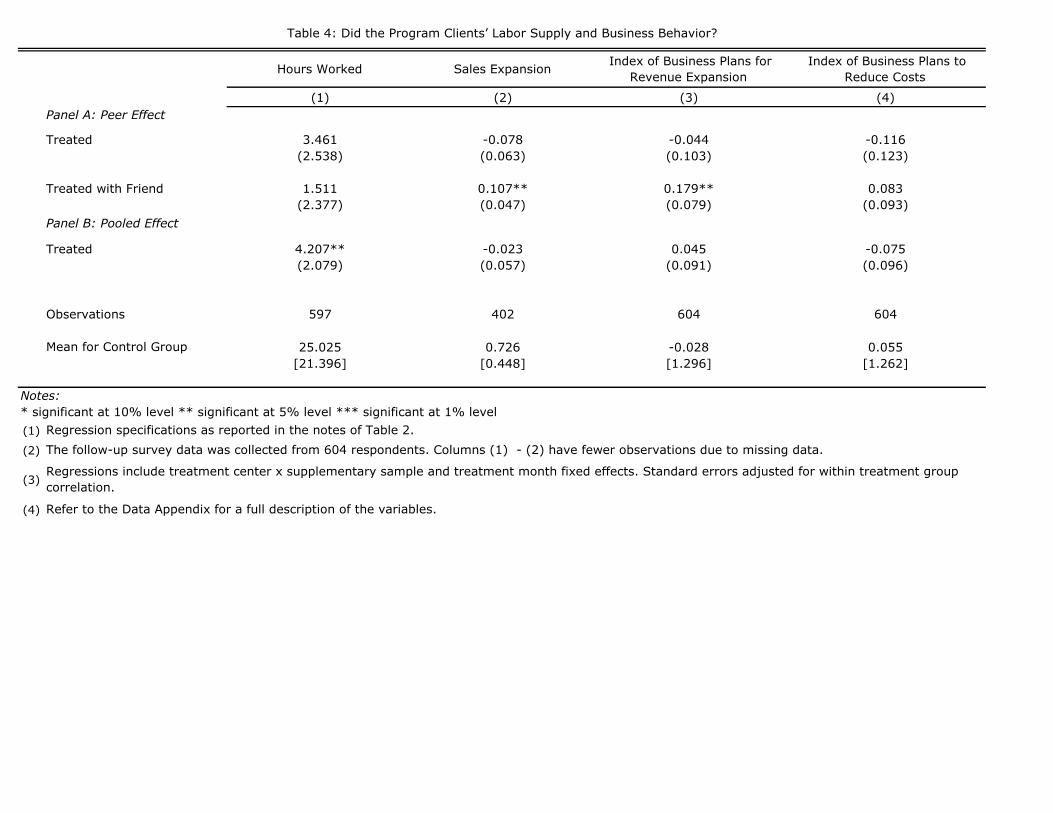
Given that treatment induced clients to incur more business loans, we examine in Table 4 the effects
of the training on labor supply and particular business behaviors. In column (1) Panel B we see
that treated clients increased their labor supply by four hours, which amounts to a 17% increase in
weekly work hours. Those treated with a friend show slightly higher but insignificant increases in
hours worked. Columns (2)–(4) examine whether, in tandem, business activities changed. Clients
were asked whether, in the previous week, they had sold more, the same number, or less items
(products or services) than in a typical week a year before. We report the regression with this
outcome variable in column (2). While on average the treatment had no effect on the probability
that a client reported having sold more or the same as the year before, we observe that clients
treated with a friend are 10.7 percentage points more likely to report having sold more or the same
as compared with the previous year.
As the training program focused on helping clients set goals and think strategically about their
businesses, we asked women whether they had concrete plans to undertake certain activities such
as increasing the number of clients or expanding the range of products sold. We break these plans
into activities that would help clients reduce costs of production – such as hiring new employees
or investing in new equipment – and plans that would help clients increase revenues, such as
increasing their customer base or the number of products and services they sell. We construct an
index for cost-reduction plans and one for revenue-increasing plans using the first component of
a principal component analysis, and report the two in columns (3) and (4), respectively. We find
that treatment-with-friend clients are significantly more likely to report concrete plans to increase
business revenues. In combination with the result in column (2), this outcome suggests that clients
treated with a friend borrowed more for business purposes (Table 3, column 2) and invested these
funds in expanding their sales. We observe no significant change in business activities to reduce
costs.
12
3.3 Client Well-Being
Increased borrowing may or may not be applied to productive business use. Thus, to more directly
measure the effect of training on business growth, we examine in Table 5 business income and
household expenditures. Respondents were asked about their income and expenditures in the last
week. Panel A of columns (1) and (2) show that relative to those treated alone, treatment-with-
friend clients show large and significant increases in both income and expenditures: 11.6% and
15.6% higher, respectively. In contrast, clients who were treated alone are indistinguishable from
the control in terms of income and expenditures: the coefficients on Treated in columns (1) and
(2) are close to zero.
As this intervention was only conducted with the female SEWA participants in the households,
we explore whether these specific women contributed to the significant increase in household income
and expenditures in the treatment-with-friend group. We look at the client-specific earnings and
occupational outcomes in columns (3) and (4). The extensive margin of whether the client earns an
income or not is not affected by either treatment – the coefficients on the treatment variables are
close to zero in both Panels A and B of column (3). However, in column (4) we observe that clients
who were treated with a friend are nearly 4 percentage points less likely to report their occupation
as housewife four months after the intervention.
These findings suggest that the intervention incentivized women trained with a friend to exit
unemployment and enter self-employment. These clients took out SEWA Bank business loans to
invest in an enterprise and used the loans to profitably expand the firm. The fact that the treatment-
with-friend clients are not more likely to report having earned an income would be consistent with
clients joining an already-existing household business, as family members often are not directly
compensated for their labor in household enterprises (Benjamin, 1992).
Our findings suggest that that the intervention – at least at the four-month mark after treatment
– appears to be welfare-improving for the clients trained with a peer as they have higher levels of
consumption and are no more likely to report problems repaying the loan or cite lower confidence
(Table 7). Our transactions data, however, do not span to the end of the loan cycles, so we do
not observe default. This means that we cannot comment on whether clients face problems later
in the loan cycle or whether, accounting for the costs of the training and the level of default, the
intervention is socially welfare-improving.
3.4 Heterogeneous Effects
A series of recent “cash-drop” studies study female entrepreneurship and find women enterprise
owners to be significantly less productive than their male counterparts De Mel, McKenzie, and
13
Woodruff (2008); Fafchamps, McKenzie, Quinn, and Woodruff (2011). One possible way of inter-
preting those results is that women are not good entrepreneurs. However, our findings challenge
such a conclusion. Specifically, women who attend a business training with a friend are able to ex-
pand their businesses and increase household earnings and expenditures. This suggests that rather
than being bad entrepreneurs, women may be constrained in ways that men are not.
In Field, Jayachandran, and Pande (2010), we examined heterogeneity in pooled treatment
effects by caste and religion. We found that upper-caste women benefited from the treatment
relative to both more restricted groups (Muslims) and less restricted ones (scheduled castes). Here,
we examine whether the impact of norms of restriction vary by treatment status, with or without
peer. Further, to provide a more granular analysis we interact treatment status directly with an
indicator of mobility restrictions faced by the caste or religion (Appendix Table 1 replicates this
analysis using the social group categorization used in Field, Jayachandran, and Pande (2010)). The
indicator is created through a point system of the following six criteria: whether the woman (1)
can go for employment, (2) can socialize alone, (3) has to wear a veil, (4) can speak to elder family
members, (5) has access to education/educational opportunities, and (6) can freely go outside the
home.13
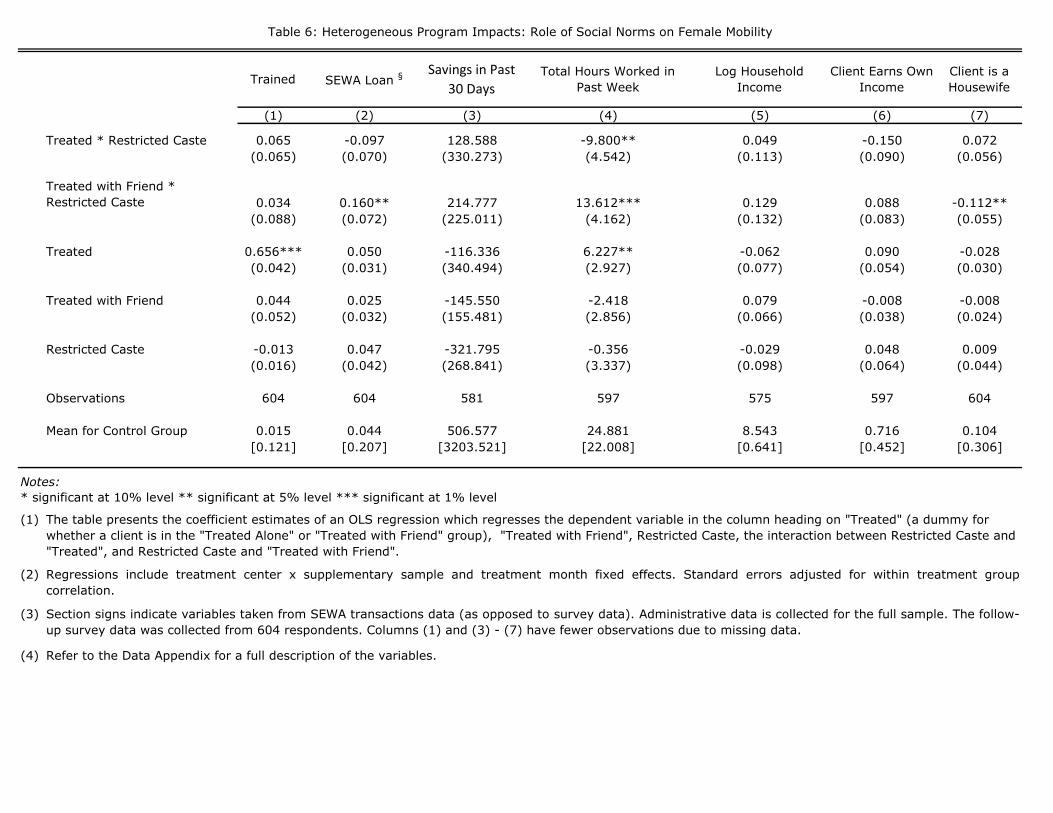
We hypothesize that women who are more restricted in their mobility are more prone to respond
to treatment-with-friend than those who are less restricted. We interact the treatment dummies
with an indicator for restricted (including the main effect) and present the results of this test in
Table 6. The treatment-with-friend findings in Tables 2–5 are concentrated among the treatment-
with-friend women who are more restricted in their mobility.
As can be seen in column (1), we do not find differential take-up when recruited with a friend
even among women from more conservative backgrounds. We do, however, observe in column (2)
that treatment-with-friend women are 16 percentage points or 400% more likely to take out a loan
than unrestricted women in the control, although they are no more likely to have higher savings
(column 3). We also find that restricted treatment-with-friend women work nearly 14 more hours
than women in the control group, and this is significant at the 1% level. Although noisy, the income
result in column (5) is qualitatively consistent with the finding in Table 5: restricted women trained
with a friend have 13% higher household income than women in the control group. They are also
less likely to be housewives four months after the interventions.
3.5 Peer Effects
While we do not have additional treatment arms that could help us disentangle why treatment-
with-friend matters, we theorize that there are at least three potential channels through which these
13For a detailed explanation of the creation of the indicator, see the variable creation description in the Appendix.
14
effects may operate. We use survey data to gather evidence on which channel is most important
and present these results in Table 7.
Social networks are a vital aspect of business start-up, survival, and growth: entrepreneurs draw
on their relationships for capital (Aldrich and Zimmer, 1986), labor (Freeman, 1999), skills (Greve
and Salaff, 2003), risk sharing (Grandori, 1997), information (Johannisson, 1988), advice (Smeltzer,
Van Hook, and Hutt, 1991) and opportunities (Singh, Hills, Lumpkin, and Hybels, 1999). In order
to turn a social network into a valuable resource for attaining business success, an entrepreneur
must be mindful of both the structure and composition of their network (Burt, 2000). Female
entrepreneurs in developed countries, for example, have more homogeneous networks in terms of
kin and skills composition: while they are more likely to report discussing business matters with
other family members, men are more likely to seek advice from coworkers or friends (Renzulli,
Aldrich, and Moody, 2000). This lack of diversity in women’s networks has been perceived as a
disadvantage in terms of business outcomes (Renzulli, Aldrich, and Moody, 2000).
Network homogeneity among female entrepreneurs may be even more prevalent in low-income
countries where women are subject to stricter social norms. Our intervention, which brought
together SEWA clients and their peers, could have served to widen or strengthen the non-familial
business network that our counseling participants had access to. Peers may have helped women
attain desired business outcomes by providing access to material (capital, labor) or immaterial
resources (advice, support) after the training was over. This is of special importance in India,
where female business networks are important determinants of entrepreneurial decisions (Ghani,
Kerr, and O’Connell, 2013).
During the follow-up survey, we collected information on how often our respondents engaged
in discussions about their businesses with friends or family four months after the end of the in-
tervention. In column (1) of Table 7, we report whether a woman discussed business matters
daily. We see that although there is a strong treatment effect, with women who were assigned to
treatment being 25% more likely to discuss their business on a daily basis, there is no differential
treatment-with-friend effect. While the counseling program may have expanded information- or
advice-sharing networks, it does not appear to have done so differentially by whether a participant
attended with a member of her already-existing network. We cannot rule out, however, that clients
invited to attend with friends did develop stronger risk-sharing networks and, for example, switched
the composition of with whom they discussed business, e.g., away from spouses and towards other
women outside their family. Alternatively, the training may simply have brought business matters
to the attention of participants which would prompt them to discuss their business more frequently
and which we don’t expect to have varied depending on whether they attended with friends or
alone.
15
Aside from developing a stronger business network, one of the main goals of the training pro-
gram was to take advantage of the role-model effect: increasing women’s ambitions by highlighting
successful females in their area (Beaman, Duflo, Pande, and Topalova, 2012). Participants in the
counseling program were shown a movie in which inspiring women from their communities spoke
about their own accomplishments. Evidence from organizational psychology suggests that psycho-
logically safe environments are essential for building confidence (Edmondson, 1999). Women who
were invited to attend with peers may have found themselves in a more comfortable and support-
ive environment which facilitated the effectiveness of the film at raising aspirations. At follow-up,
women were asked seven questions to ascertain their level of confidence.14 These seven measures
were combined into a confidence index using a the first component of a principal component anal-
ysis. As can be in seen in column (2) of Table 7, neither treatment has any effect on confidence
levels of counseling participants four months after intervention.
While the counseling program did not affect confidence in the long run, it may have served
to help clients set higher goals in the short run. Some suggestive evidence comes from the goal
worksheets filled out by women at the end of the first day of training. (The Appendix describes the
data collected). These worksheets, which were to be filled out at home, gave clients who attended
both days the opportunity to identify a financial goal they wished to achieve. On the second day,
methods for achieving that goal were reviewed with the group and the trainers. We were able to
retrieve the goal sheets for only a subset of the clients trained, and present these in columns (3)–(6)
of Table 7. The small sample limits our precision, but we find evidence consistent with outcomes
four months after the training. (Note that the sample only includes women in the treatment arms
because the control group did not fill out the worksheets; the omitted category in the regressions is
the treatment-alone arm.) The two most common goal categories were to start or expand a business
(column 3) and to buy/repair a house (column 4). The latter would often entail converting a room
in the house to a business or shop location.15 This matches the observed loan demand presented
in Table 3. Further, the plans in the treatment-with-friend arm are also projected to cost more
(column 6), which is consistent with these clients setting more ambitious goals .
14The seven questions were: (1) “Are you confident about countering problems that arise in your day-to-day life?”(2) “Are you confident about countering problems that arise in your work life?” (3) “Do you think that with hardwork you will be able to succeed?” (4) “Are you satisfied with your personal life?” (5) “Are you satisfied with yourwork?” (6) “Are you comfortable calculating your business costs?” (7) “How optimistic are you about the future?”For more information see the variable creation description in the Appendix.
15For instance, the goals might be “To open a shop; to take more catering orders to increase income,” or “ To openmy own agarbatti [incense] centre, for which I need my own small place.”
16
4 Conclusion
Despite the proliferation of financial inclusion efforts in developing countries over the past few
decades, financial institutions targeting the poor, such as microfinance institutions, still face prob-
lems reaching sufficient numbers of borrowers to stay afloat, and the successful ones are having
trouble scaling up operations (Armendariz and Morduch, 2010). Our results suggest that one
potentially important factor limiting financial inclusion efforts is inadequate peer support among
many of the women who have the potential to start or expand entrepreneurial activities. Involv-
ing a friend led participants in our two-day training program to double their demand for loans
and significantly expand their business activity, resulting in higher household income. Those who
belonged to more restrictive social groups were particularly sensitive to peer involvement. Thus,
programs designed to empower women through business training or by giving them loans or cash
grants (De Mel, McKenzie, and Woodruff, 2014) may be more successful if they harness peer sup-
port as part of the program design, particularly when working with clients from restrictive social
backgrounds.
What is also surprising is how quickly demand for bank services can be influenced simply by
encouraging female entrepreneurs to form concrete goals and aspirations. In our study, all women
were familiar with bank loans available through the partner institution well before the training
(as they were members of SEWA Bank with savings accounts), and during the training these
women were not taught about financing through loans nor encouraged to borrow. Rather, simply
encouraging them to focus on concrete goals changed their demand for bank loans. This suggests
that debt-aversion and lack of information about financial services are not the only roots of low
demand for credit among female entrepreneurs, as is often suggested. In addition, limited female
agency over household financial and business decisions may be an important factor limiting the
success of microfinance as a development tool.
References
Aldrich, H., and C. Zimmer (1986): “Entrepreneurship through social networks,” Universityof Illinois at Urbana-Champaign’s Academy for Entrepreneurial Leadership Historical ResearchReference in Entrepreneurship.
Armendariz, B., and J. Morduch (2010): The economics of microfinance. Cambridge, Mass:MIT press.
Beaman, L., E. Duflo, R. Pande, and P. Topalova (2012): “Female leadership raises aspi-rations and educational attainment for girls: A policy experiment in India,” Science, 335(6068),582–586.
17
Benjamin, D. (1992): “Household composition, labor markets, and labor demand: Testing forseparation in agricultural household models,” Econometrica: Journal of the Econometric Society,pp. 287–322.
Burt, R. S. (2000): “The network structure of social capital,” Research in Organizational Behav-ior, 22, 345–423.
De Mel, S., D. McKenzie, and C. Woodruff (2008): “Returns to capital in microenterprises:evidence from a field experiment,” The Quarterly Journal of Economics, 123(4), 1329–1372.
(2014): “Business training and female enterprise start-up, growth, and dynamics: Exper-imental evidence from Sri Lanka,” Journal of Development Economics, 106, 199–210.
Duflo, E., P. Dupas, and M. Kremer (2011): “Peer Effects, Teacher Incentives, and the Impactof Tracking: Evidence from a Randomized Evaluation in Kenya,” American Economic Review,101(5), 1739–74.
Edmondson, A. (1999): “Psychological safety and learning behavior in work teams,” Administra-tive Science Quarterly, 44(2), 350–383.
Fafchamps, M., D. McKenzie, S. Quinn, and C. Woodruff (2011): “Female Microenterprisesand the Fly-paper Effect: Evidence from a Randomized Experiment in Ghana,” Mimeo.
Field, E., S. Jayachandran, and R. Pande (2010): “Do Traditional Institutions Constrain Fe-male Entrepreneurship? A Field Experiment on Business Training in India,” American EconomicReview, 100(2), 125–129.
Freeman, J. (1999): “Venture capital as an economy of time,” in Corporate social capital andliability, pp. 460–479. Springer.
Genicot, G., and D. Ray (2010): “Aspirations and inequality,” Discussion paper, GeorgetownUniversity and New York University.
Ghani, E., W. R. Kerr, and S. D. O’Connell (2013): “Local industrial structures and femaleentrepreneurship in India,” Journal of Economic Geography, 13(6), 929–964.
Global Entrepreneurship Monitor (2011): “Global Entrepreneurship Monitor,” Discussionpaper.
Grandori, A. (1997): “An organizational assessment of interfirm coordination modes,” Organi-zation Studies, 18(6), 897–925.
Greve, A., and J. W. Salaff (2003): “Social networks and entrepreneurship,” EntrepreneurshipTheory and Practice, 28(1), 1–22.
Johannisson, B. (1988): “Business formation - A network approach,” Scandinavian Journal ofManagement, 4(3), 83–99.
Karlan, D., and M. Valdivia (2011): “Teaching entrepreneurship: Impact of business trainingon microfinance clients and institutions,” Review of Economics and Statistics, 93(2), 510–527.
18
LaFortune, J., J. Tessada, and M. Perticara (2013): “Are (Random) Friends Good forBusiness? Peer Effects in Training and Entrepreneurship Courses,” Mimeo.
Macours, K., and R. Vakis (2009): “Changing Households’ Investments and Aspirations throughSocial Interactions,” World Bank Research Working papers, pp. 1–45.
Malmendier, U., and J. Lerner (2013): “With a Little Help from My (Random) Friends:Success and Failure in Post-Business School Entrepreneurship,” Review of Financial Studies,26(10), 2411–52.
McKenzie, D., and C. Woodruff (2014): “What are we learning from business training andentrepreneurship evaluations around the developing world?,” The World Bank Research Observer,29(1), 48–82.
Rao, G. (2014): “Familiarity Does Not Breed Contempt: Diversity, Discrimination and Generosityin Delhi Schools,” Mimeo.
Ray, D. (2006): “Aspirations, poverty, and economic change,” in Understanding poverty, ed. byA. V. Banerjee, R. Benabou, and D. Mookherjee. Oxford University Press, Oxford.
Renzulli, L. A., H. Aldrich, and J. Moody (2000): “Family matters: Gender, networks, andentrepreneurial outcomes,” Social Forces, 79(2), 523–546.
Shue, K. (2013): “Executive Networks and Firm Policies: Evidence from the Random Assignmentof MBA Peers,” Review of Financial Studies, 26(6), 1401–1442.
Singh, R. P., G. E. Hills, G. Lumpkin, and R. C. Hybels (1999): “The entrepreneurial oppor-tunity recognition process: Examining the role of self-perceived alertness and social networks,”in Academy of Management Proceedings, vol. 1999, pp. G1–G6. Academy of Management.
Smeltzer, L. R., B. L. Van Hook, and R. W. Hutt (1991): “Analysis of the use of advisors asinformation sources in venture startups,” Journal of Small Business Management, 29(3), 10–20.
19
Not Treated TreatedTreated with
Friend
Difference
(2)-(1)
Difference
(3)-(2)
(1) (2) (3) (4) (5)
Age 35.463 34.584 34.532 -0.7583 -0.1439
[0.592] [0.4] [0.592] [0.7317] [0.7722]
Married 0.904 0.886 0.886 -0.0157 0.0014
[0.022] [0.017] [0.024] [0.0232] [0.0274]
Household Size 5.244 5.299 5.305 0.0668 0.0125
[0.134] [0.092] [0.127] [0.1645] [0.1801]
Literate 0.776 0.763 0.786 -0.015 0.0455
[0.031] [0.022] [0.03] [0.0319] [0.0422]
Years of Education 6.279 6.475 6.777 0.1339 0.5886
[0.293] [0.226] [0.299] [0.3052] [0.4312]
Muslim 0.332 0.284 0.3 -0.0355 0.0315
[0.034] [0.022] [0.033] [0.0443] [0.0428]
Hindu Scheduled Caste 0.087 0.132 0.116 0.0408* -0.0277
[0.02] [0.017] [0.023] [0.0232] [0.0302]
Restricted Caste 0.322 0.294 0.3 -0.0253 0.009
[0.033] [0.023] [0.033] [0.036] [0.0433]
Log Household Income 8.47 8.485 8.524 0.0023 0.0738
[0.059] [0.038] [0.057] [0.0553] [0.0652]
Household Business 0.437 0.503 0.489 0.0582 -0.0271
[0.036] [0.026] [0.037] [0.0379] [0.0399]
Client Receives a Wage or Salary 0.124 0.073 0.085 -0.0405* 0.0184
[0.024] [0.014] [0.02] [0.0213] [0.0235]
Client is Self-Employed 0.784 0.862 0.857 0.0561* -0.0024
* significant at 10% level ** significant at 5% level *** significant at 1% level
(1)
(2)
(3)
(4)
(5)
(6)
Notes:
Table 1: Baseline Characteristics for Treatment and Control Groups
Both regressions in columns (4) and (5) include treatment center x supplementary sample and treatment month fixed effects. Standard errors adjusted for
within treatment group correlation.
The number of observations corresponds to the respondents for whom we have both baseline and endline data.
Refer to the Data Appendix for a full description of the variables.
Means Balance Check
Columns (1)-(3) report variable means for different samples with standard deviation in parentheses.
In column (4) we report the coefficient from an OLS regression where the outcome is regressed on the treatment dummy. The treatment dummy=1 if the
client was in either the treated alone or the treated with friend group.
In the column (5) regression, we additionally include a dummy for treated with friend to the regression reported in column (4) and report this coefficient.
Trained Trained with Friend
(1) (2)
Panel A: Peer Effect
Treated 0.641*** 0.013
(0.038) (0.010)
Treated with Friend 0.074 0.650***
(0.046) (0.041)
Panel B: Pooled Effect
Treated 0.677*** 0.332***
(0.028) (0.022)
Observations 636 636
Mean for Control Group 0.009 0.005
[0.097] [0.069]
Notes:
(1)
(2)
(3)
Table 2: Business Counseling Program Take-up
Panel A presents the coefficient estimates of an OLS regression which
regresses the dependent variable in the column heading on "Treated"
(a dummy for whether a client is in the "Treated Alone" or "Treated
with Friend" group) and on "Treated with Friend." This is the
specification presented in equation (1) in the text. Panel B presents
the coefficient estimates of an OLS regression which regresses the
dependent variable in the column heading on "Treated". This is the
specification presented in equation (2) in the text.
* significant at 10% level ** significant at 5% level *** significant at
1% level
Regressions include treatment center x supplementary sample and
treatment month fixed effects. Standard errors adjusted for within
treatment group correlation.
Refer to the Data Appendix for a full description of the variables.
* significant at 10% level ** significant at 5% level *** significant at 1% level
(1)
(2)
(3)
(4)
Regression specifications as reported in the notes of Table 2.
Table 3: Did the Program Affect Clients’ Financial Behavior?
Section signs indicate variables taken from SEWA transactions data (as opposed to follow-up survey data). Administrative data is collected for the full sample.
The follow-up survey data was collected from 604 respondents. Columns (4) - (6) have fewer observations due to missing data.
Regressions include treatment center x supplementary sample and treatment month fixed effects. Standard errors adjusted for within treatment group
correlation.
Refer to the Data Appendix for a full description of the variables.
Hours Worked Sales Expansion Index of Business Plans for
Revenue Expansion
Index of Business Plans to
Reduce Costs
(1) (2) (3) (4)
Panel A: Peer Effect
Treated 3.461 -0.078 -0.044 -0.116
(2.538) (0.063) (0.103) (0.123)
Treated with Friend 1.511 0.107** 0.179** 0.083
(2.377) (0.047) (0.079) (0.093)
Panel B: Pooled Effect
Treated 4.207** -0.023 0.045 -0.075
(2.079) (0.057) (0.091) (0.096)
Observations 597 402 604 604
Mean for Control Group 25.025 0.726 -0.028 0.055
[21.396] [0.448] [1.296] [1.262]
Notes:
* significant at 10% level ** significant at 5% level *** significant at 1% level
(1)
(2)
(3)
(4)
Table 4: Did the Program Clients’ Labor Supply and Business Behavior?
Regression specifications as reported in the notes of Table 2.
The follow-up survey data was collected from 604 respondents. Columns (1) - (2) have fewer observations due to missing data.
Regressions include treatment center x supplementary sample and treatment month fixed effects. Standard errors adjusted for within treatment group
correlation.
Refer to the Data Appendix for a full description of the variables.
Log Household Income Log Expenditures Client Earns Own Income Client is a Housewife
(1) (2) (3) (4)
Panel A: Peer Effect
Treated -0.046 -0.044 0.045 -0.008
(0.064) (0.082) (0.048) (0.027)
Treated with Friend 0.116* 0.156* 0.017 -0.040*
(0.060) (0.081) (0.039) (0.021)
Panel B: Pooled Effect
Treated 0.011 0.033 0.054 -0.028
(0.052) (0.078) (0.040) (0.025)
Observations 575 603 597 604
Mean for Control Group 8.538 6.650 0.736 0.101
[0.615] [0.871] [0.442] [0.301]
Notes:
* significant at 10% level ** significant at 5% level *** significant at 1% level
(1)
(2)
(3)
(4)
The follow-up survey data was collected from 604 respondents. Columns (1) - (3) have fewer observations due to
missing data.
Table 5: Did the Program Affect Client Income and Occupation?
Regression specifications as reported in the notes of Table 2.
Regressions include treatment center x supplementary sample and treatment month fixed effects. Standard errors
adjusted for within treatment group correlation.
Refer to the Data Appendix for a full description of the variables.
* significant at 10% level ** significant at 5% level *** significant at 1% level
(1)
(2)
(3)
(4)
The table presents the coefficient estimates of an OLS regression which regresses the dependent variable in the column heading on "Treated" (a dummy for
whether a client is in the "Treated Alone" or "Treated with Friend" group), "Treated with Friend", Restricted Caste, the interaction between Restricted Caste and
"Treated", and Restricted Caste and "Treated with Friend".
Refer to the Data Appendix for a full description of the variables.
Table 6: Heterogeneous Program Impacts: Role of Social Norms on Female Mobility
Section signs indicate variables taken from SEWA transactions data (as opposed to survey data). Administrative data is collected for the full sample. The follow-
up survey data was collected from 604 respondents. Columns (1) and (3) - (7) have fewer observations due to missing data.
Regressions include treatment center x supplementary sample and treatment month fixed effects. Standard errors adjusted for within treatment group
correlation.
Discusses Business
DailyPCA-Confidence
Goal is to Expand
Business
Goal is to Expand
House
Goals is to Invest in
Education
Projected Cost of
Goal
(1) (2) (3) (4) (5) (6)
Panel A: Peer Effect
Treated 0.090* 0.097
(0.045) (0.256)
Treated with Friend -0.002 -0.048 0.038 0.049 -0.077 41193.983
* significant at 10% level ** significant at 5% level *** significant at 1% level
(1)
(2)
(3)
(4)
Appendix Table 1: Heterogeneous Impact of Business Training on Clients by Scheduled Caste and Muslim
The table presents the coefficient estimates of an OLS regression which regresses the dependent variable in the column heading on "Treated" (a dummy for whether
a client is in the "Treated Alone" or "Treated with Friend" group), "Treated with Friend", Hindu Scheduled Caste, Muslim, the interaction between Muslim and
"Treated", Muslim and "Treated with Friend", the interaction between Hindu Scheduled Caste and "Treated", Hindu Scheduled Caste and "Treated with Friend".
Regressions include treatment center x supplementary sample and treatment month fixed effects. Standard errors adjusted for within treatment group correlation.
Section signs indicate variables taken from SEWA transactions data (as opposed to survey data). Administrative data is collected for the full sample. The follow-up
survey data was collected from 604 respondents. Columns (1) - (7) have fewer observations due to missing data.
Refer to the Data Appendix for a full description of the variables.
* significant at 10% level ** significant at 5% level *** significant at 1% level
(1)
(2)
(3)
(4)
Appendix Table 2: Main Outcomes with Occupation Controls
Regression specification as reported in Table 2.
Regressions include treatment center x supplementary sample and treatment month fixed effects. Standard errors adjusted for within treatment group
correlation. Regressions also control for client occupation at baseline with variables presented in Table 1: Client is a housewife, client is business employed, client
has a wage or salaried job.Section signs indicate variables taken from SEWA transactions data (as opposed to survey data). Administrative data is collected for the full sample. The follow-
up survey data was collected from 604 respondents. Columns (3)-(6) have fewer observations due to missing data.
Refer to the Data Appendix for a full description of the variables.
Training Appendix
0.1 Outline of Training
Page references are to Freedom from Hunger training module
Day 1: How to think like a business person
• Introduction [5 min]
– Bicycle chain game: Get participants to introduce themselves: their name, business and
how long they have been doing it
• You run a business, pg 7 [10 min]
– Definition of a business is earning profits
– Types of business: manufacturing, services and trading
• Traits of a successful entrepreneur, pg 12 [30 min: 15 min story + 15 min discussion]
– Reshmaben and Rahimaben story and discussion
– Ask each woman to identify one trait of Reshmaben and one trait of Rahimaben that
they have
• How to keep track of costs including avoid wasteful expense, pg 45–49 [30 min]
– Many costs in a business; important to think about all of them
– Explain through example such as tailoring business, pg 48
– Direct costs: raw material such as cloth
– Indirect costs such as costs of electricity for sewing machine during home-based work,
repairing sewing machine, interest costs
• Avoid wasteful spending such as too many cups of tea, pan
• How to track income and calculate profit, pg 61 [15 min]
– Keep track of income and expenses
– Income minus expenses equals profits
– Profits go to household expenses + saving + investing to expand business
1
• Should be open to expanding your business [15 min]
– Products that are high-quality, trendy
– Investment in equipment/productive assets to expand
– Seasonal businesses
– Two businesses or more
• Inspirational video [10 minutes]
• Discussion of inspirational video [15 minutes]
• Announce to woman that their homework is to think of one medium-term (6 months or 1
year) financial or business goal
– Give examples of goals such as buying a sewing machine or increasing output by 10%
– Give them goal sheet to take home and think about
• Remind women about tomorrow’s class: This class will provide you with additional insights
and help consolidate the lessons from today. It is very important to attend the whole course
and the certificate is only given for attending the whole course.
Day 2: How to meet your business plan
• Review what was learned in Day 1 [20 min]
• Discuss inspirational video for group who saw video [15 min]
• Discuss goals[15 min]
– Each woman announces her medium-term goal
– Trainer explains that to reach a medium-term goal, you need to make a short-term plan
• Group discussion of goals [30 min]
– Divide women into 2-3 groups of 3
– Each woman in group talks about what her short-term plan will be
– Group members help each other and discuss
– Trainer walks around among groups to help and encourage them
2
• Each woman presents her plan to whole group [30 min]
– Trainer gives advice to help them refine short-term objectives
• Review of what learned and evaluation of training [20 min]
• Give out certificates and each woman states what she learned in particular [10 min]
0.2 Business Training worksheet
Training date:
Name:
Literate:
Business:
Age:
Approximate household income:
DAY 1: HOMEWORK
Answer questions 1 through 4 on this page only BEFORE class tomorrow.
1. List one specific goal or dream that you want to accomplish:
2. Approximately how much will it cost to accomplish this goal? Rs.
3. How far can you get towards this goal dream in one year: Rs.
4. Write down every personal and business expense yesterday:
DAY 2: Personal financial plan and business goals
1. How much you must save each week to accomplish your 1-year goal: Rs.
2. List one or two sources of wasteful expenditure in your household or business: a) Rs. b) Rs.
3. How much money do you waste each week on this? Rs.
3
4. List one other non-financial thing you can change to increase business profit: Rs.
5. Monthly financial plan:
A. Monthly business income:
B. Total household expenses:
C. Total business expenses:
D. Amount each month towards business goal:
E. Amount each month towards old age savings:
F. Amount each month towards emergency savings:
G. Amount each month towards other savings:
H. Purpose of other savings:
(a)
(b)
Signature:
4
Table Variable Description Data Source
1 Age Age of the client Baseline1 Married Whether the client is married Baseline1 Literate Whether the client can read and write Baseline1 Muslim Whether the client is muslim Baseline1 Hindu Scheduled Caste Whether the client's caste is scheduled caste (only applicable to hindus) Baseline
1 Restricted Caste
An index created from the following questions: (1) the client is allowed to go for employment (2) the
client is allowed to socialize alone (3) the client has to veil (4) the client is allowed to talk to elder
family members (5) the client has access to education/educational opportunities (6) the client is able
to go out of the homeBaseline
1 Years of Education The number of grades that the client completed Baseline
1 Log Household IncomeLog of the variable from the question:
"What was your total household income from all sources in the past 30 days?"Baseline
1 Household Size Total number of household members reported in the roster Baseline1 Client Works Piece Rate Whether the client works as a piece rate worker Baseline
1 Client Receives Salary or WageWhether the client works at a wage or salaried job
Baseline
1 Client is Business Employed Whether the client works in a household business Baseline1 Client is a Housewife Whether the client is a housewife Baseline1 Household Business Whether the household has a business Baseline
2 Trained Whether the client attended at least one day of the two-day training Training Session Logs2 Trained with friend Whether the client attended at least one day of the two-day training with a friend Training Session Logs
3 SEWA LoanClients are found to have taken a new SEWA loan in the four months after their training was
completedTransactions Data
3 Business LoanClients are found to have taken a new SEWA business loan in the four months after their training was
completedTransactions Data
3 Home Repair LoanClients are found to have taken a new SEWA home repair loan in the four months after their training
was completedTransactions Data
3 Amount Borrowed Created from the question: "How much is the total value of the loan?" Follow-up Survey
3 Problem Repaying LoanDummy made from the question: "Did you have any problems making a loan repayment in the past 30
days?"Follow-up Survey
3 Savings in Past 30 DaysThe following question added over all savings accounts of the household: "How much did you deposit
into this savings account?" Follow-up Survey
4 Total Hours Worked in Last Week
The multiplication of the following two question:
How many days out of the last 7 days did you work?
What was an average number of hours per day of work during last 7 days?Follow-up Survey
4Quantity Sold- Increased or
Remained the SameA dummy variable if the answer to the following question is more than or the same:
For your primary occupation was the amount of [UNIT] you had over that week more than, less than,
or the same as a typical week last year?
Follow-up Survey
4PCA - Plan for New Business
Activity to Increase Revenues
The first component of a principal component analysis of the following questions:
Do you PLAN to sell any new product as a part of your businesses during the next month?
Do you PLAN to provide any new service as part of your businesses in the next month?
Follow-up Survey
4PCA - Plan for New Business
Activity to Reduce Costs
The first component of a principal component analysis of the following questions:
Do you PLAN to buy new equipment for your businesses in the next month?
Do you PLAN to hire new employees to help run the businesses in the next month?
Do you PLAN to take a course to learn new skills for the businesses in the next one month?
Do you PLAN to make business-related purchases from a new supplier/agent during the next month?
Follow-up Survey
5 Log Household IncomeLog of the variable from the question:
"What was your total household income from all sources in the past 30 days?"Follow-up Survey
DATA APPENDIX
5 Log Expenditures
The sum of the following question:
"In total, over the last 7 days how much money did your household allocate towards the following
5 Client Earns Own Income Whether the client reported earning part of the household income Follow-up Survey5 Client is a Housewife Whether the client reported "housewife" as her occupation Follow-up Survey
7 Discusses Business DailyA variable from the following question:
"How often do you discuss your business?"Follow-up Survey
7 PCA-Confidence
The first component of a principal component analysis of the following questions:
Are you confident about countering problems that arise in your day to day life?
1) Yes, confident
2) No, not confident enough
3) No, not at all confident
M2 Are you confident about countering problems that arise in your work life?
1) Yes, confident
2) No, not confident enough
3) No, not at all confident
M3 Do you think that with hard work you will be able to succeed?
1) Yes
2) Somewhat
3) No
M4 Are you satisfied with your personal life?
1) Yes
2) Somewhat
3) No
M5 Are you satisfied with your work?
1) Yes
2 ) Somewhat
3) No
M6 Are you comfortable calculating your business costs?
1) Yes
2) Somewhat
3) No
M7 How optimistic are you about the future?
1) Yes, very optimistic
2) Somewhat optimistic
Follow-up Survey
7 Goals Coded from verbal answers by clients about what goals they had and how much they projected the