78
Foundations of Risk Management FRM 2012 Study Notes – Part 1.Topic 1 By David Harper, CFA FRM CIPM www.bionicturtle.com
| Date post: | 25-Oct-2015 |
| Category: |
Documents |
| Upload: | sadiakhn03 |
| View: | 202 times |
| Download: | 47 times |
Foundations of Risk Management FRM 2012 Study Notes – Part 1.Topic 1
By David Harper, CFA FRM CIPM
www.bionicturtle.com

FRM 2012 FOUNDATIONS OF RISK MANAGEMENT 1 www.bionicturtle.com
Table of Contents
Jorion, Chapter 1: The Need for Risk Management ............................................. 2
Stulz Chapter 3: Creating Value with Risk Management ...................................... 17
Elton, Chapter 5: Delineating Efficient Portfolios .............................................. 24
Elton, Chapter 13: The Standard Capital Asset Pricing Model ............................... 31
Elton, Chapter 14: Nonstandard Forms of Capital Asset Pricing Models ................... 37
Elton, Chapter 16: Arbitrage Pricing Model (APT) .............................................. 42
Amenc, Chapter 4 (4.2 only): Applying CAPM to Performance Measurement ............. 46
CAS, Overview of Enterprise Risk Management ................................................. 53
Allen, Chapter 4: Financial Disasters ............................................................ 61
René Stulz,” Risk Management Failures What and When .................................... 69
GARP Code of Conduct ............................................................................... 74
FRM 2012 FOUNDATIONS OF RISK MANAGEMENT 2 www.bionicturtle.com
Jorion, Chapter 1:
The Need for Risk
Management
In this chapter…
Define risk and describe some of the major sources of risk. Differentiate between business and financial risks and give examples of each. Relate significant market events of the past several decades to the growth of
the risk management industry. Describe the functions and purposes of financial institutions as they relate to
financial risk management. Define what a derivative contract is and how it differs from a security. Define financial risk management. Define value-at-risk (VaR) and describe how it is used in risk management. Describe the advantages and disadvantages of VaR relative to other risk
management tools such as stop-loss, limits, notional limits, and exposure limits. Compare and contrast valuation and risk management, using VaR as an example. Define and describe the four major types of financial risks: market, liquidity,
credit, and operational; and their forms.
Define risk and describe some of the major sources of risk.
Risk is volatility of unexpected outcomes (value of assets, equity, or earnings). Some authors
distinguish between risk and uncertainty:
Risk: when the outcome is random but the probability distribution is known or can be estimated or approximated. e.g., a six-sided die (we know the distribution is uniform). Much of our FRM study concerns the traditional attempt to parameterize (or otherwise estimate, even if empirically) the approximately distribution of possible losses.
Uncertainty: the probability distribution is itself unknown. Example: a terrorist attack. This is when the distribution itself eludes us.
The major sources of risk include:
Human (Accident) including regulatory policy (and unintended consequence
Human (Deliberate) including terrorism and war
Natural disaster including earthquakes and hurricanes
Economic growth including the creative “disruption” caused by technological innovation

FRM 2012 FOUNDATIONS OF RISK MANAGEMENT 3 www.bionicturtle.com
Differentiate between business & financial risks & give examples of each.
Business risks are risks that the corporation assumes willingly. They may do this to create a competitive edge or to add shareholder value.
Financial risks are losses due to financial market activities. Examples of financial risk include losses due to interest-rate movements or defaults on financial obligations.
Deliberate, necessary
Competitive advantage
To create Shareholder value
For example
Business decisions (investments, products) & environment (competition & economy)
Shareholders pay for and expect firms to assume business risk!
Losses due to financial market activities
For example
Interest rate exposure
Defaults on financial obligations
Accounts receivables
To a non-financial firm, not core & firm should (probably) hedge
Banks & financial services are in the business of managing financial risk; managing
financial risk is (should be) a core strategic activity. However, industrial (non-financial)
companies typically want to hedge financial risks; i.e., the assumption of financial risk is
often non-strategic to non-financial companies.
Human (Accident)
• Regulatory policy: unintended consequence
Human (Deliberate)
• Terrorism
• War
Natural disaster
• Earthquake
• Hurricane
Economic Growth
• Technological innovation
Business Risks Financial Risks

FRM 2012 FOUNDATIONS OF RISK MANAGEMENT 4 www.bionicturtle.com
Relate significant market events of past several decades to growth of the
risk management industry.
Fixed exchange rate system broke down 1971 1
Oil price shocks High inflation 1973 2
Black Monday. US stocks drop 23%
10/19/87 3
Bond debacle (Fed hikes rates 6 times) 1994 4
Deflation of Japanese stock price bubble 1989 5
Asian turmoil 1997 6
Russian default Global crisis (LTCM) Aug 1998 7
Terrorist attack on New York 9/11/01 8
Visible subprime crisis Aug 2007 9
Fed takeover Fannie Mae & Freddie Mac; Merrill Lynch sold; Lehman bankruptcy; AIG Sep 2008 10
Bretton
Woods
Black
Monday
FRM 2012 FOUNDATIONS OF RISK MANAGEMENT 5 www.bionicturtle.com
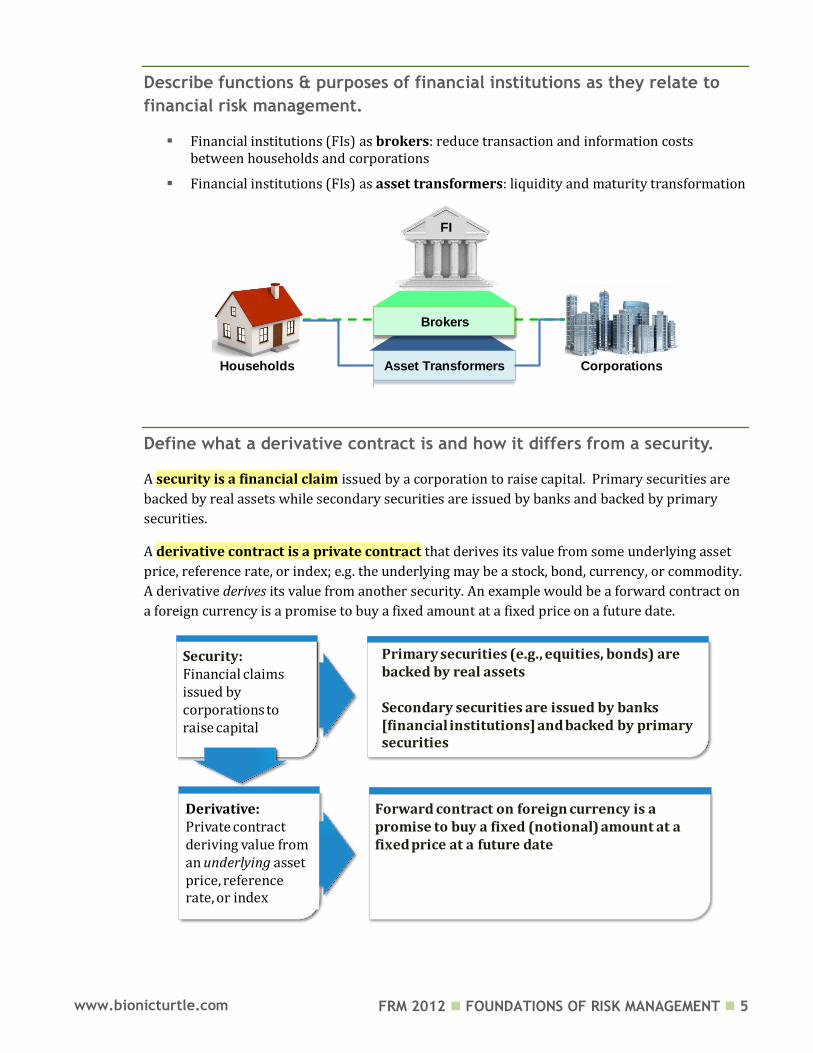
Describe functions & purposes of financial institutions as they relate to
financial risk management.
Financial institutions (FIs) as brokers: reduce transaction and information costs between households and corporations
Financial institutions (FIs) as asset transformers: liquidity and maturity transformation
Define what a derivative contract is and how it differs from a security.
A security is a financial claim issued by a corporation to raise capital. Primary securities are
backed by real assets while secondary securities are issued by banks and backed by primary
securities.
A derivative contract is a private contract that derives its value from some underlying asset
price, reference rate, or index; e.g. the underlying may be a stock, bond, currency, or commodity.
A derivative derives its value from another security. An example would be a forward contract on
a foreign currency is a promise to buy a fixed amount at a fixed price on a future date.
Asset Transformers
Brokers
Corporations
FI
Households
Security:Financial claims issued by corporations to raise capital
Primary securities (e.g., equities, bonds) are backed by real assets
Secondary securities are issued by banks [financial institutions] and backed by primary securities
Derivative:Private contract deriving value from an underlying asset price, reference rate, or index
Forward contract on foreign currency is a promise to buy a fixed (notional) amount at a fixed price at a future date
FRM 2012 FOUNDATIONS OF RISK MANAGEMENT 6 www.bionicturtle.com
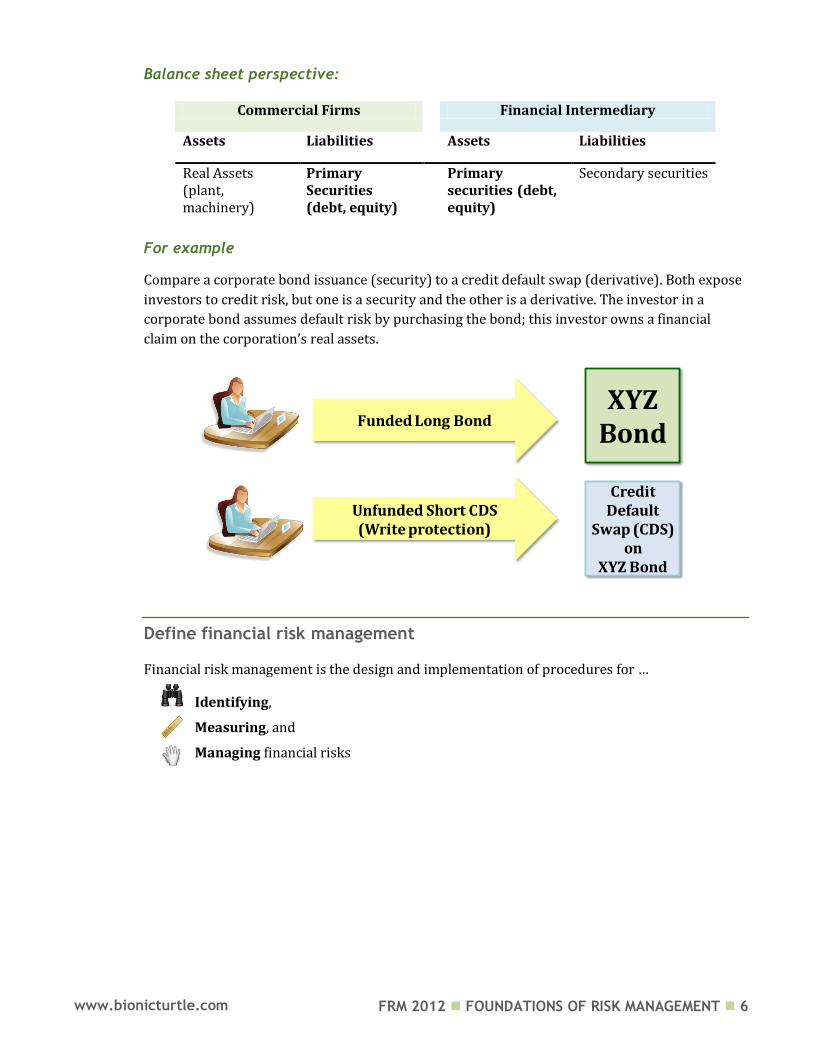
Balance sheet perspective:
Commercial Firms
Financial Intermediary
Assets Liabilities
Assets Liabilities
Real Assets
(plant, machinery)
Primary Securities (debt, equity)
Primary securities (debt, equity)
Secondary securities
For example
Compare a corporate bond issuance (security) to a credit default swap (derivative). Both expose
investors to credit risk, but one is a security and the other is a derivative. The investor in a
corporate bond assumes default risk by purchasing the bond; this investor owns a financial
claim on the corporation’s real assets.
Define financial risk management
Financial risk management is the design and implementation of procedures for …
Identifying,
Measuring, and
Managing financial risks
XYZBond
Credit Default
Swap (CDS) on
XYZ Bond
Unfunded Short CDS (Write protection)
Funded Long Bond
FRM 2012 FOUNDATIONS OF RISK MANAGEMENT 7 www.bionicturtle.com
0
20
40
60
80
100
-4 -3 -2 -1 0 1 2 3 4
Specify confidence = 1 – significance (α)
Specify horizon
VaR is always one-tail!
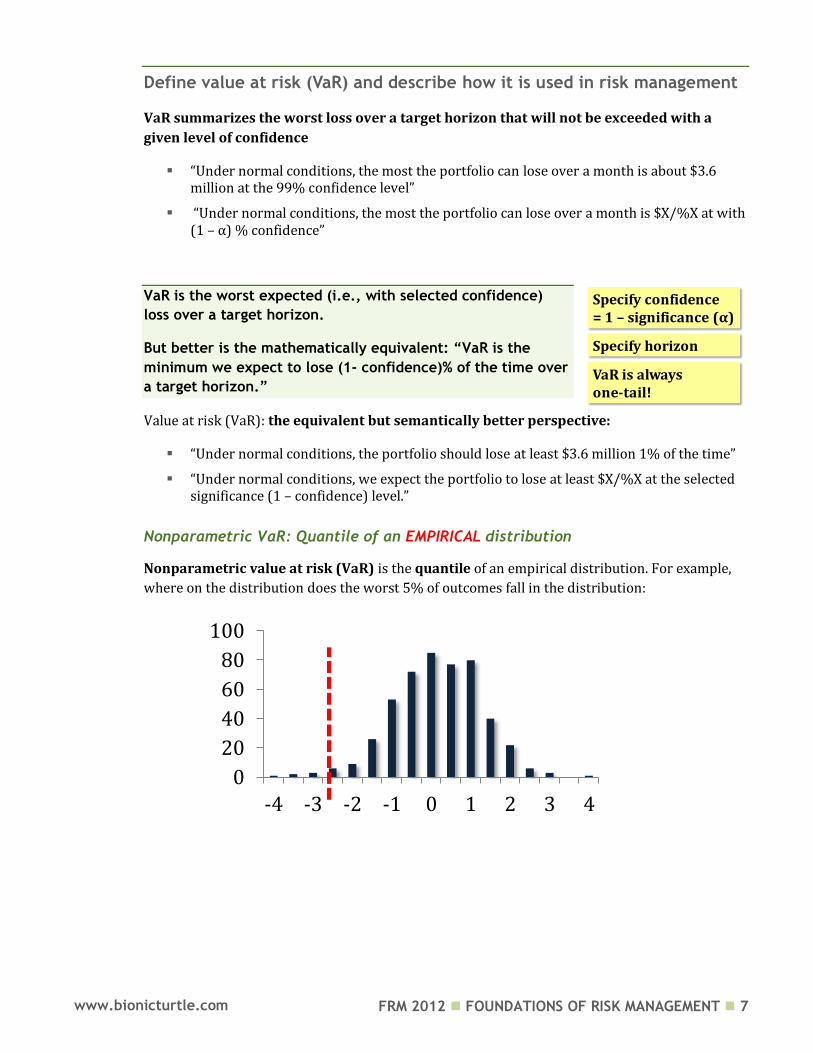
Define value at risk (VaR) and describe how it is used in risk management
VaR summarizes the worst loss over a target horizon that will not be exceeded with a
given level of confidence
“Under normal conditions, the most the portfolio can lose over a month is about $3.6 million at the 99% confidence level”
“Under normal conditions, the most the portfolio can lose over a month is $X/%X at with (1 – α) % confidence”
VaR is the worst expected (i.e., with selected confidence)
loss over a target horizon.
But better is the mathematically equivalent: “VaR is the
minimum we expect to lose (1- confidence)% of the time over
a target horizon.”
Value at risk (VaR): the equivalent but semantically better perspective:
“Under normal conditions, the portfolio should lose at least $3.6 million 1% of the time”
“Under normal conditions, we expect the portfolio to lose at least $X/%X at the selected significance (1 – confidence) level.”
Nonparametric VaR: Quantile of an EMPIRICAL distribution
Nonparametric value at risk (VaR) is the quantile of an empirical distribution. For example,
where on the distribution does the worst 5% of outcomes fall in the distribution:
FRM 2012 FOUNDATIONS OF RISK MANAGEMENT 8 www.bionicturtle.com
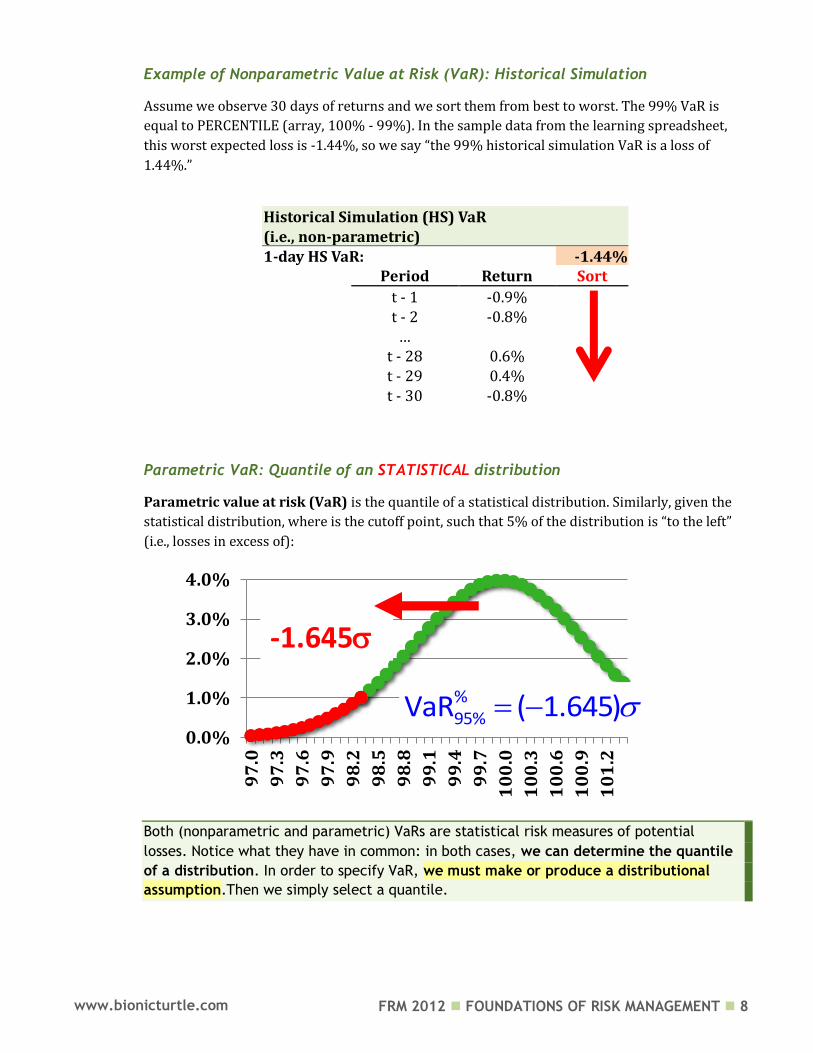
Example of Nonparametric Value at Risk (VaR): Historical Simulation
Assume we observe 30 days of returns and we sort them from best to worst. The 99% VaR is
equal to PERCENTILE (array, 100% - 99%). In the sample data from the learning spreadsheet,
this worst expected loss is -1.44%, so we say “the 99% historical simulation VaR is a loss of
1.44%.”
Historical Simulation (HS) VaR (i.e., non-parametric) 1-day HS VaR:
-1.44%
Period Return Sort
t - 1 -0.9%
t - 2 -0.8%
…
t - 28 0.6%
t - 29 0.4%
t - 30 -0.8%
Parametric VaR: Quantile of an STATISTICAL distribution
Parametric value at risk (VaR) is the quantile of a statistical distribution. Similarly, given the
statistical distribution, where is the cutoff point, such that 5% of the distribution is “to the left”
(i.e., losses in excess of):
Both (nonparametric and parametric) VaRs are statistical risk measures of potential
losses. Notice what they have in common: in both cases, we can determine the quantile
of a distribution. In order to specify VaR, we must make or produce a distributional
assumption.Then we simply select a quantile.
0.0%
1.0%
2.0%
3.0%
4.0%
97
.0
97
.3
97
.6
97
.9
98
.2
98
.5
98
.8
99
.1
99
.4
99
.7
10
0.0
10
0.3
10
0.6
10
0.9
10
1.2
%95%VaR ( 1.645)
-1.645
FRM 2012 FOUNDATIONS OF RISK MANAGEMENT 9 www.bionicturtle.com
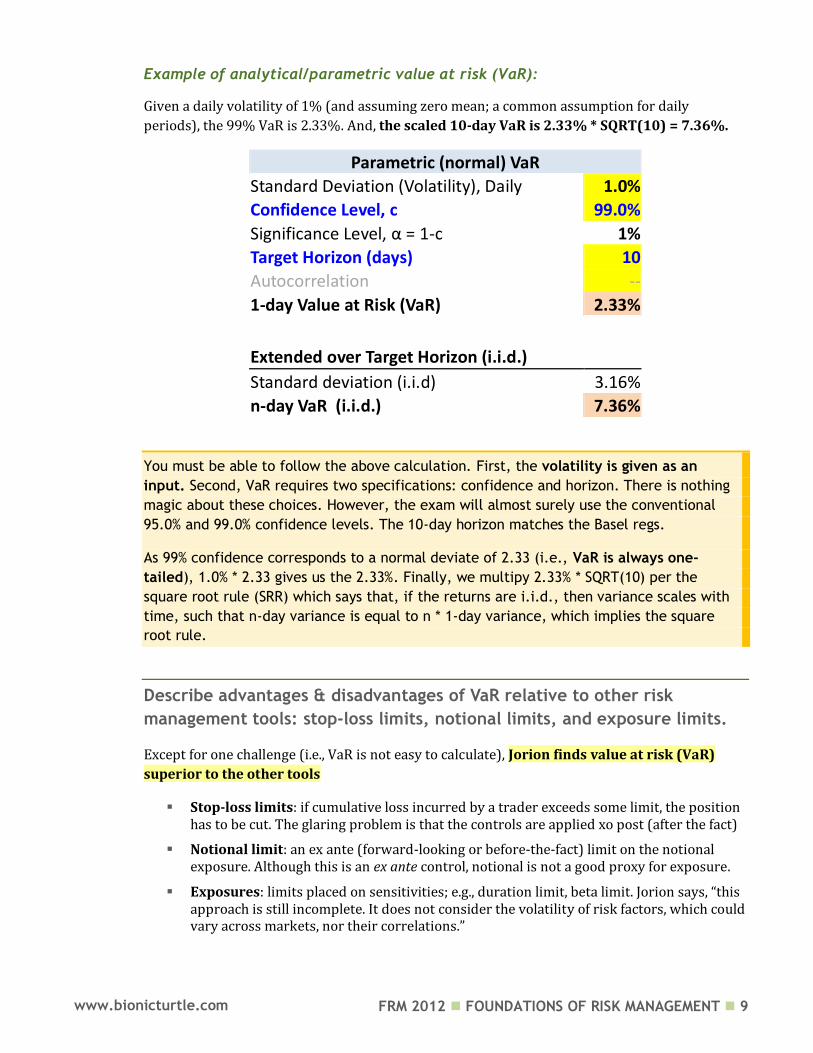
Example of analytical/parametric value at risk (VaR):
Given a daily volatility of 1% (and assuming zero mean; a common assumption for daily
periods), the 99% VaR is 2.33%. And, the scaled 10-day VaR is 2.33% * SQRT(10) = 7.36%.
Parametric (normal) VaR
Standard Deviation (Volatility), Daily 1.0%
Confidence Level, c 99.0%
Significance Level, α = 1-c 1%
Target Horizon (days) 10
Autocorrelation --
1-day Value at Risk (VaR) 2.33%
Extended over Target Horizon (i.i.d.) Standard deviation (i.i.d) 3.16%
n-day VaR (i.i.d.) 7.36%
You must be able to follow the above calculation. First, the volatility is given as an
input. Second, VaR requires two specifications: confidence and horizon. There is nothing
magic about these choices. However, the exam will almost surely use the conventional
95.0% and 99.0% confidence levels. The 10-day horizon matches the Basel regs.
As 99% confidence corresponds to a normal deviate of 2.33 (i.e., VaR is always one-
tailed), 1.0% * 2.33 gives us the 2.33%. Finally, we multipy 2.33% * SQRT(10) per the
square root rule (SRR) which says that, if the returns are i.i.d., then variance scales with
time, such that n-day variance is equal to n * 1-day variance, which implies the square
root rule.
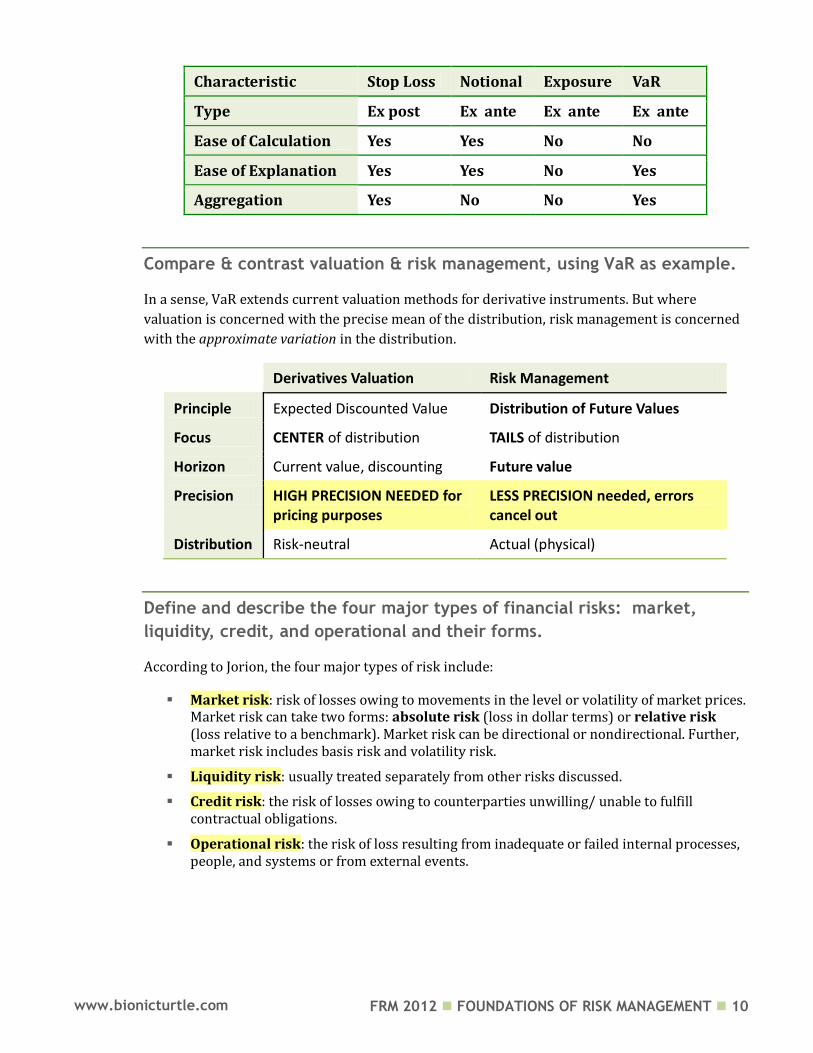
Describe advantages & disadvantages of VaR relative to other risk
management tools: stop-loss limits, notional limits, and exposure limits.
Except for one challenge (i.e., VaR is not easy to calculate), Jorion finds value at risk (VaR)
superior to the other tools
Stop-loss limits: if cumulative loss incurred by a trader exceeds some limit, the position has to be cut. The glaring problem is that the controls are applied xo post (after the fact)
Notional limit: an ex ante (forward-looking or before-the-fact) limit on the notional exposure. Although this is an ex ante control, notional is not a good proxy for exposure.
Exposures: limits placed on sensitivities; e.g., duration limit, beta limit. Jorion says, “this approach is still incomplete. It does not consider the volatility of risk factors, which could vary across markets, nor their correlations.”
FRM 2012 FOUNDATIONS OF RISK MANAGEMENT 10 www.bionicturtle.com
Characteristic Stop Loss Notional Exposure VaR
Type Ex post Ex ante Ex ante Ex ante
Ease of Calculation Yes Yes No No
Ease of Explanation Yes Yes No Yes
Aggregation Yes No No Yes
Compare & contrast valuation & risk management, using VaR as example.
In a sense, VaR extends current valuation methods for derivative instruments. But where
valuation is concerned with the precise mean of the distribution, risk management is concerned
with the approximate variation in the distribution.
Derivatives Valuation Risk Management
Principle Expected Discounted Value Distribution of Future Values
Focus CENTER of distribution TAILS of distribution
Horizon Current value, discounting Future value
Precision HIGH PRECISION NEEDED for pricing purposes
LESS PRECISION needed, errors cancel out
Distribution Risk-neutral Actual (physical)
Define and describe the four major types of financial risks: market,
liquidity, credit, and operational and their forms.
According to Jorion, the four major types of risk include:
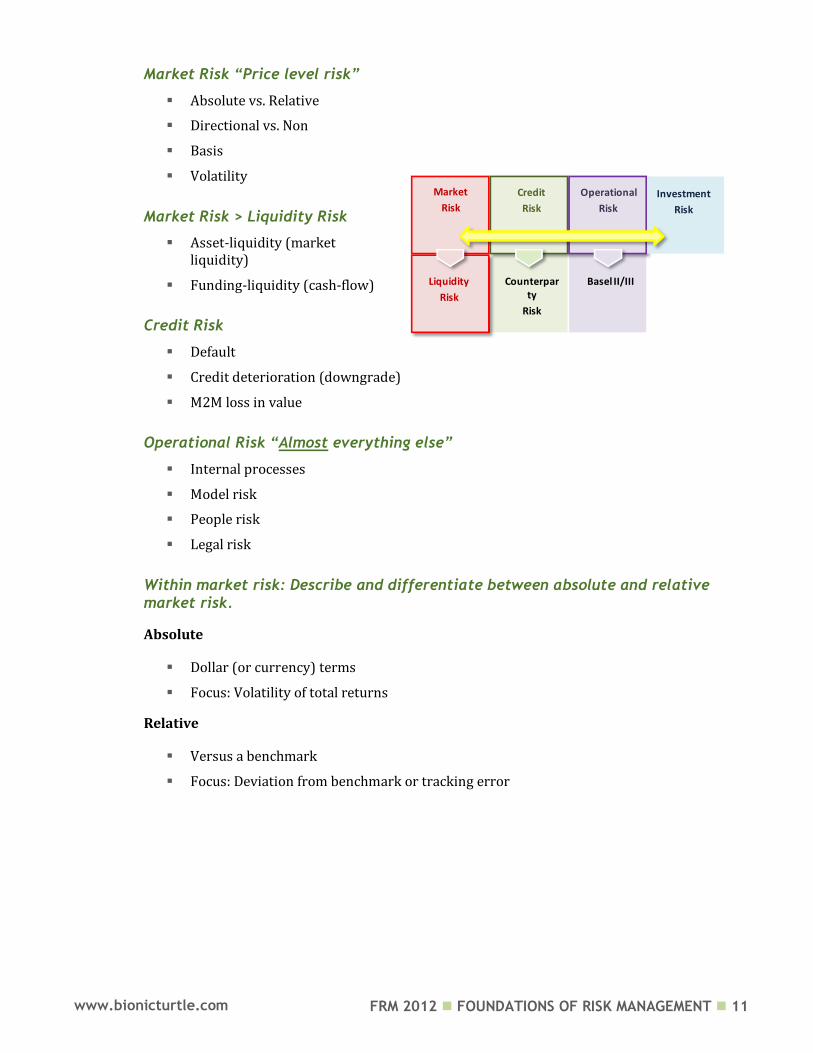
Market risk: risk of losses owing to movements in the level or volatility of market prices. Market risk can take two forms: absolute risk (loss in dollar terms) or relative risk (loss relative to a benchmark). Market risk can be directional or nondirectional. Further, market risk includes basis risk and volatility risk.
Liquidity risk: usually treated separately from other risks discussed.
Credit risk: the risk of losses owing to counterparties unwilling/ unable to fulfill contractual obligations.
Operational risk: the risk of loss resulting from inadequate or failed internal processes, people, and systems or from external events.
FRM 2012 FOUNDATIONS OF RISK MANAGEMENT 11 www.bionicturtle.com
Operational
Risk
Credit
Risk
Basel II/IIICounterparty
Risk
Liquidity
Risk
Market
Risk
Investment
Risk
Market Risk “Price level risk”
Absolute vs. Relative
Directional vs. Non
Basis
Volatility
Market Risk > Liquidity Risk
Asset-liquidity (market liquidity)
Funding-liquidity (cash-flow)
Credit Risk
Default
Credit deterioration (downgrade)
M2M loss in value
Operational Risk “Almost everything else”
Internal processes
Model risk
People risk
Legal risk
Within market risk: Describe and differentiate between absolute and relative market risk.
Absolute
Dollar (or currency) terms
Focus: Volatility of total returns
Relative
Versus a benchmark
Focus: Deviation from benchmark or tracking error

FRM 2012 FOUNDATIONS OF RISK MANAGEMENT 12 www.bionicturtle.com
Within market risk: Describe and differentiate between directional and non-directional market risk.
Directional
Movements in financial variables. For example:
Stock price moves down,
Interest rates drop,
Commodity prices change
Non-directional
The risks that remain, including hedged positions
Nonlinear exposures,
Basis risk
Volatilities
Within market risk: Describe basis risk and its sources.
Basis risk refers to unanticipated movements in relative prices of assets in a hedged
position, such as cash and futures or interest-rate spreads are considered basis risk. In the case
of a forward contract, the basis is the difference between the forward price (F) and the spot
price (S). In theory, the forward and spot prices should converge, such that the basis should
approach zero as the contract approaches maturity. But this is only theoretical and depends on
an exact match in the commodity, perfect timing, other key assumptions (e.g., perfect liquidity)
and the absence of other frictions. A hedge is constructed based on an anticipation of the basis
(e.g., that the basis will converge to zero). Basis risk, then, is the risk that the hedge will not
perform as expected; i.e., that the hedge will not offset the loss in the primary position.
Time (T)S0
F0
ST-1
FT-1 F0ST
ST=FT
All hedges imply (at least some) basis risk: the risk the hedge will not exactly offset
FRM 2012 FOUNDATIONS OF RISK MANAGEMENT 13 www.bionicturtle.com
Basis risk is often underestimated but it is arguably one of the most important risks. All
hedges imply (at least some) basis risk: the risk the hedge will not exactly offset.
Recently in “Lessons from the Financial Crisis,” Goldman’s CEO said, “a lot of risk models
incorrectly assumed that positions could be fully hedged. After LTCM and the crisis in
emerging markets in 1998, new products like basket indices and credit default swaps
were created to help offset a number of risks. However, we didn’t, as an industry,
consider carefully enough the possibility that liquidity would dry up, making it difficult to
apply effective hedges.”
Within market risk: Describe volatility risk & sources.
Unanticipated movements in relative prices of assets in a hedged position, such as cash and
futures or interest-rate spreads
The classic instrument that represents a trade on volatility risk is a stock option. In fact,
options are motivated as instruments of volatility. Salih Neftci writes (in Principles of
Financial Engineering, 2nd Ed), “an option exposure, when fully put in place, is an impure
position on the way volatility is expected to change. A market maker with a net long
position in options is someone who is “expecting” the volatility to increase. A market
maker who is short the option is someone who thinks that the volatility of the underlying
is going to decrease.”
Within liquidity risk: Asset vs. funding liquidity risk.
Liquidity risk is typically divided into two different, but related, types: asset-liquidity risk (a.k.a.,
market/product-liquidity risk) and funding-liquidity risk (a.k.a., cash-flow risk). Both concern
the dilemma of not having enough time: liquidity risk implies that time can eventually solve the
problem. Funding liquidity risk refers to the inability to meet payment obligations or to fund
ongoing operations. “This is especially a problem for portfolios that are leveraged and subject to
margin calls from the lender.” Asset-liquidity risk refers to a transaction that cannot be
conducted at prevailing market prices “owing to the size of the position relative to normal
trading lots.” This is also simply when the position cannot be exited without steep discounting
(or, in the extreme case, a “fire sale”)
Asset-liquidity risk (market/product liquidity risk)
Cannot exit position at prevailing market prices due to size of the position
Varies by…
Asset class
Prevailing market conditions
Funding-liquidity risk (cash-flow risk)
Cannot meet payment obligations
Balance sheet issue, typically concern of CFO

FRM 2012 FOUNDATIONS OF RISK MANAGEMENT 14 www.bionicturtle.com
In the context of the credit crisis, much attention has been focused on the interrelationship
between asset and funding liquidity risk. Specifically, for example, the lack of asset liquidity can
trigger margin calls that create funding liquidity risk.
Within credit risk: Describe and differentiate between exposure and recovery rate.
Exposure (a.k.a., amount at risk) is the potential amount that can be lost. For example, if a bond
buyer invests $10 million dollars, then the investor’s exposure is $10 million. However, upon
default, the investor expects at least some partial recovery. The recovery rate (1 – loss given
default) is the proportion recovered. Recovery is also referred to as “cents on the dollar;” e.g.,
40% recovery is “40 cents on the dollar.”
Exposure (EAD)
Amount at risk
Recovery Rate
Proportion paid back to lender (cents on the dollar)
Asset-liquidity risk (market/product liquidity risk)
• Transaction cannot be conducted at prevailing market prices owing to size of the position
• Varies by…
• Asset class
• Prevailing market conditions
Funding-liquidity risk (cash-flow risk)
• Inability to meet payment obligations, which may force liquidation, transforming paper losses into realized losses
Crisis Lesson: Inter-
related
FRM 2012 FOUNDATIONS OF RISK MANAGEMENT 15 www.bionicturtle.com
C
M
Within credit risk: Describe credit event and how it may relate to market risk.
A credit event occurs when there is a change in the counterparty’s ability to perform its
obligations. According to Jorion, credit risk should be defined as the potential loss in mark-to-
market value incurred owing to a credit event.
Please pay careful attention: credit risk is not limited to default. Consistent with the
broad here definition in Jorion, De Servigny includes three sub-classes of credit risk in his
overview of credit risk models: default; rating migration; and change in spread.
Therefore, credit risk include both default risk and risk of credit deterioration.
Within credit risk: Describe sovereign risk and its sources.
Sovereign risk
Country-specific (unlike default risk which is generally company-specific)
Sources
Countries impose foreign-exchange controls that make it impossible for counterparties to honor their obligations
Within credit risk: Describe settlement risk and its sources
Settlement risk: when two payments are exchanged the same day. Risk that counterparty may
default after the institution already made its payment
Pre-settlement exposure: only netted value
On settlement day: full value of payments due
Jorion: Settlement risk is acute for foreign-exchange transactions
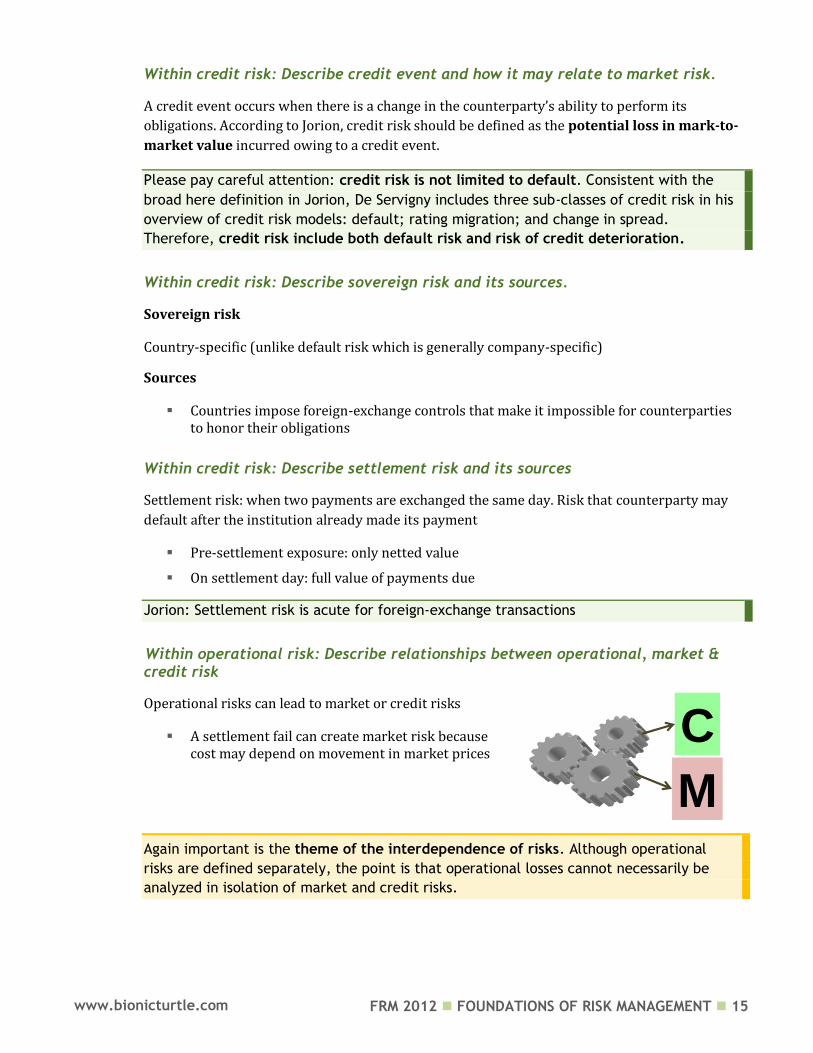
Within operational risk: Describe relationships between operational, market & credit risk
Operational risks can lead to market or credit risks
A settlement fail can create market risk because cost may depend on movement in market prices
Again important is the theme of the interdependence of risks. Although operational
risks are defined separately, the point is that operational losses cannot necessarily be
analyzed in isolation of market and credit risks.

FRM 2012 FOUNDATIONS OF RISK MANAGEMENT 16 www.bionicturtle.com
Within operational risk: Describe model risk and its sources
Operational risk > Model risk
Model risk is risk of losses owing to the fact that valuation models may be flawed
“Very insidious” and requires intimate knowledge of modeling process
Model risk is “the risk of error in our estimated risk measures due to inadequacies (or
deficiencies) in our models. (Kevin Dowd)” Models are by definition quantitative but
this chapter largely concerns the qualitative conundrums posed by reliance on models.
Within operational risk: Describe people risk
Operational risk > People risk
People risk includes internal or external fraud
For example:
Rogue traders
Within operational risk: Describe legal risk and its sources
Operational risk > Legal risk
Legal risk arises from exposure to fines, penalties or punitive damages resulting from supervisory actions, as well as private settlements
Examples:
Counterparties sue to invalidate credit losses [related to credit risk]
Shareholders lawsuits against corporations
What is excluded from operational risk?
Strategic risk
Business risk
Reputational risk (controversial)
FRM 2012 FOUNDATIONS OF RISK MANAGEMENT 17 www.bionicturtle.com
Stulz Chapter 3:
Creating Value with
Risk Management
In this chapter…
Explain how risk management can create value by handling bankruptcy costs. Explain how risk management can create value moving income across time and
reducing taxes. Describe how risk reduction benefiting a large shareholder may increase or
decrease firm value. Explain the relationship between risk management, managerial incentives, and
the structure of management compensation, and its effect on firm value. Describe debt overhang, and explain how risk management can increase firm
value by reducing the probability of debt overhang. Explain how risk management can reduce the problem of information
asymmetry and increase firm value.

FRM 2012 FOUNDATIONS OF RISK MANAGEMENT 18 www.bionicturtle.com
Stulz Chapter 3 realizes imperfect markets and concludes risk management can add value
Perfect financial markets risk management cannot create value
Markets are not perfect! Imperfections (and frictions) imply risk management can create value
Capital structure (financial distress)
Taxes
Agency and information asymmetries
Explain how risk management can create value by handling bankruptcy
costs.
Debt is cheaper than equity. In theory, then, firm value increases as the firm increases its financial
leverage (ratio of debt/equity or debt/total assets). However, higher leverage also increases the
probability of bankruptcy (and default) and incurs a “cost of financial distress.”
In summary:
Equity is more expensive than debt due to (i) subordinate claim and (ii) tax shield on debt
Ceteris paribus, the firm would prefer to increase leverage to lower its weighted average cost of capital (WACC)
However, the “friction” is the cost of financial distress: as leverage increases, beyond some point, the cost of equity and debt both increase due to the threat of default and bankruptcy
NoFriction
PerfectCompetition
PerfectInformation
Cost ofFinancialDistress
InformationAsymmetry
Taxest(friction!)

FRM 2012 FOUNDATIONS OF RISK MANAGEMENT 19 www.bionicturtle.com
Generally, interest paid by a company is tax-deductible. The tax savings achieved by the use of
debt is called the tax shield. All other things being equal, a firm that uses debt saves cash taxes
and decreases its weighted average cost of capital.
However, at a certain point, using more debt becomes counterproductive because debt carries a
fixed obligation and increases the risk of default. This is the essential trade-off: as they increase
their leverage (i.e., ratio of debt-to-equity), firms increase their tax shield but also increase the
present value of costs of financial distress. The optimal capital structure of a firm balances the
tax benefits of debt against the costs of financial distress.
A firm can reduce the present value of the costs of financial distress through risk management
by making financial distress less likely. As a result, it can take on more debt. Risk management
enables the firm to have a higher debt level, and hence a greater tax shield from debt, for any
likelihood of financial distress.
If a firm carries a risk of bankruptcy, then it incurs bankruptcy costs (e.g., as reflected in higher
interest expense). In this case, the irrelevance theorem does not hold. The present value of this
firm can be reduced by the present value of the bankruptcy costs, as follows:
Value of firm = PV(Cash flow) – PV (bankruptcy costs)
If the cost to hedge bankruptcy risk is zero (or even if it is merely less than the bankruptcy
costs), risk management creates value because the market will bear the diversifiable risk. In fact,
if the risk is diversifiable (i.e., non-systematic), the capital markets should be able to bear the
risk with zero cost. In this case, gains from risk management equal present value of the
bankruptcy costs:
Gain from risk mgmt = Value of hedged firm − Value of un-hedged firm = Present Value (bankruptcy costs)
- 2,000 4,000 6,000 8,000
10,000 12,000 14,000
0.13 0.36 0.55 0.70 0.84 0.95
Firm value(FCF/WACC)
Firm value - PV(cost of financialdistress)
FRM 2012 FOUNDATIONS OF RISK MANAGEMENT 20 www.bionicturtle.com
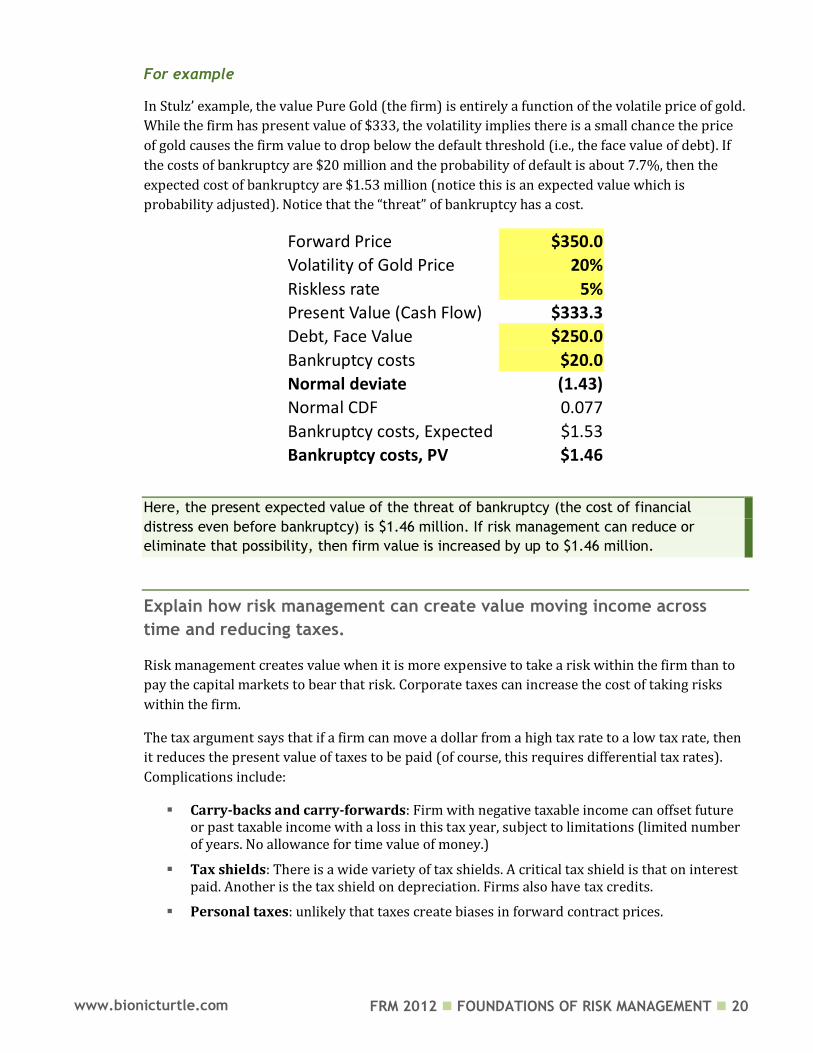
For example
In Stulz’ example, the value Pure Gold (the firm) is entirely a function of the volatile price of gold.
While the firm has present value of $333, the volatility implies there is a small chance the price
of gold causes the firm value to drop below the default threshold (i.e., the face value of debt). If
the costs of bankruptcy are $20 million and the probability of default is about 7.7%, then the
expected cost of bankruptcy are $1.53 million (notice this is an expected value which is
probability adjusted). Notice that the “threat” of bankruptcy has a cost.
Forward Price $350.0
Volatility of Gold Price 20%
Riskless rate 5%
Present Value (Cash Flow) $333.3
Debt, Face Value $250.0
Bankruptcy costs $20.0
Normal deviate (1.43) Normal CDF 0.077
Bankruptcy costs, Expected $1.53
Bankruptcy costs, PV $1.46
Here, the present expected value of the threat of bankruptcy (the cost of financial
distress even before bankruptcy) is $1.46 million. If risk management can reduce or
eliminate that possibility, then firm value is increased by up to $1.46 million.
Explain how risk management can create value moving income across
time and reducing taxes.
Risk management creates value when it is more expensive to take a risk within the firm than to
pay the capital markets to bear that risk. Corporate taxes can increase the cost of taking risks
within the firm.
The tax argument says that if a firm can move a dollar from a high tax rate to a low tax rate, then
it reduces the present value of taxes to be paid (of course, this requires differential tax rates).
Complications include:
Carry-backs and carry-forwards: Firm with negative taxable income can offset future or past taxable income with a loss in this tax year, subject to limitations (limited number of years. No allowance for time value of money.)
Tax shields: There is a wide variety of tax shields. A critical tax shield is that on interest paid. Another is the tax shield on depreciation. Firms also have tax credits.
Personal taxes: unlikely that taxes create biases in forward contract prices.

FRM 2012 FOUNDATIONS OF RISK MANAGEMENT 21 www.bionicturtle.com
For example
Pure Gold (the firm) will achieve pre-tax profit of either $250 million (50% probability) or $450
million (50% probability). The simplified tax schedule is such that 50% taxes are paid only if the
pre-tax cash flow exceeds $300 million; no taxes otherwise. Alternatively, Pure Gold can sell its
gold forward at $350; note this is the same as the expected (average) value of the future spot
price. After-tax cash flow is higher for the hedged firm:
Tax Schedule
RF Rate 5%
Cash Flow < $299.0 0%
Cash Flow > $300.0 50%
Future
After-tax
Spot (S1) Tax FV PV
Probability 50% $250.0 $0.0 $250.0 Probability 50% $450.0 $75.0 $375.0 Expected
$350.0 $37.5 $312.5 $297.6
Forward
After-tax
(F0)
FV PV
$350.0 $25.0 $325.0 $309.5
If a firm can move a dollar from a high tax rate to a low tax rate, then it reduces the
present value of taxes to be paid
Describe how risk reduction benefiting a large shareholder or stakeholder
may increase or decrease firm value.
A large shareholder can engage in monitoring.
Evaluate management actions
Influence incentives (e.g., bonus plans, stock options)
Explain the relationship between risk management, managerial
incentives, and management compensation, and its effect on firm value.
Agency problem
Management acts in their own interest instead of shareholders’ interests (e.g., “empire building”)
How to solve? Incentives (e.g., stock options) try to provide alignment between management actions (and decisions) with shareholder welfare.
But practice is more difficult

FRM 2012 FOUNDATIONS OF RISK MANAGEMENT 22 www.bionicturtle.com
Authors argue for:
Tying compensation to some measure of value
creation
Share ownership
Describe debt overhang and explain how risk management can increase
firm value by reducing the probability of debt overhang.
Debt overhang is too much debt: To increase shareholder value may not increase firm value!
Induces shareholders seek negative NPV projects, and/or
Avoid investing in valuable projects because they dilute
Consequently, risk management that reduces this probability increases firm value today.
Rate 5% Gold $5 Invest,
HLG Debt $400.0 Price Payoff of:
$10
Probability 50% $250.0 $260.0
Probability 50% $450.0 $460.0
Value of Debt:
50% $250.0 $260.0
50% $400.0 $400.0
FV $325.0 $330.0
PV $309.5 $314.3
Value of Equity:
50% $0.0 $0.0
50% $50.0 $60.0
FV $25.0 $30.0
PV $23.81 $28.6
Value of Firm (D+E) $333.3 $342.9
Increase in Equity Value $4.8
Existing Equity DILUTED to: $23.571
Principal-Agent (Agency) is a key friction in Subprime Crisis

FRM 2012 FOUNDATIONS OF RISK MANAGEMENT 23 www.bionicturtle.com
Explain how risk management can reduce the problem of information
asymmetry and increase firm value.
Information asymmetry: one party (management) knows more than the other (outside investor)
Problem for management raising funds managers know more about firms’ projects than outsiders
Ways to reduce the costs of managerial discretion (and therefore reduce the costs of the funds)
Sit large shareholder on board; e.g., private equity fund
Borrow against assets rather than against future project.

FRM 2012 FOUNDATIONS OF RISK MANAGEMENT 24 www.bionicturtle.com
Elton, Chapter 5:
Delineating
Efficient Portfolios
In this chapter…
Calculate the expected return and volatility of a portfolio of risky assets. Explain how covariance and correlation affect the expected return and volatility
of a portfolio of risky assets. Describe the shape of the portfolio possibilities curve. Define the minimum variance portfolio. Define the efficient frontier and describe the impact on it of various
assumptions concerning short sales and borrowing.
Calculate the expected return and volatility of a portfolio of risky assets.
Expected return
The expected return on a portfolio of two assets is given by
P A A B BR X R X R , fraction of portfolio held in asset A, asset B
, , expected return on asset A, asset B, portfolio
A B
A B P
X X
R R R
Volatility of a portfolio of risky assets The expected return on a portfolio of two assets is given by
1 22 2 2 2(1 ) 2 (1 )P A A A B A A ABX X X X
Please note we can replace the covariance with the product of the correlations and the standard
deviations:
1 22 2 2 2(1 ) 2 (1 )P A A A B A A AB A BX X X X
FRM 2012 FOUNDATIONS OF RISK MANAGEMENT 25 www.bionicturtle.com
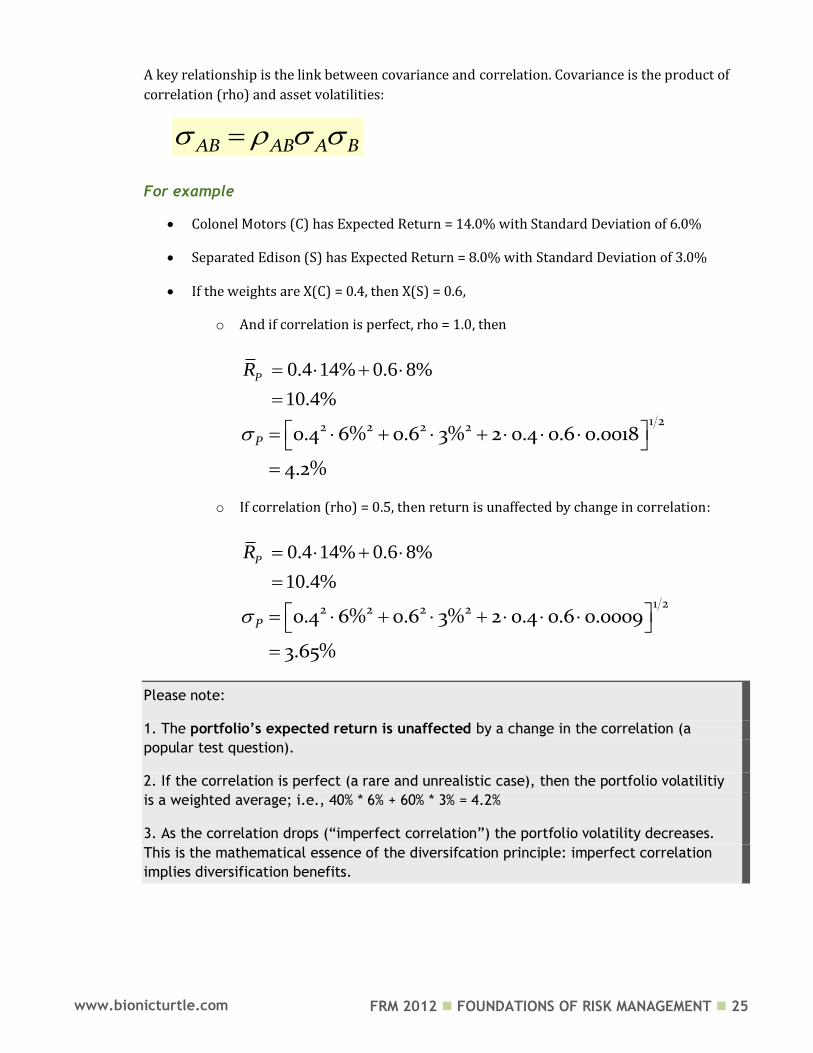
A key relationship is the link between covariance and correlation. Covariance is the product of
correlation (rho) and asset volatilities:
AB AB A B
For example
Colonel Motors (C) has Expected Return = 14.0% with Standard Deviation of 6.0%
Separated Edison (S) has Expected Return = 8.0% with Standard Deviation of 3.0%
If the weights are X(C) = 0.4, then X(S) = 0.6,
o And if correlation is perfect, rho = 1.0, then
0.4 14% 0.6 8%
10.4%
PR
1 22 2 2 20.4 6% 0.6 3% 2 0.4 0.6 0.0018
4.2%
P
o If correlation (rho) = 0.5, then return is unaffected by change in correlation:
0.4 14% 0.6 8%
10.4%
PR
1 22 2 2 20.4 6% 0.6 3% 2 0.4 0.6 0.0009
3.65%
P
Please note:
1. The portfolio’s expected return is unaffected by a change in the correlation (a
popular test question).
2. If the correlation is perfect (a rare and unrealistic case), then the portfolio volatilitiy
is a weighted average; i.e., 40% * 6% + 60% * 3% = 4.2%
3. As the correlation drops (“imperfect correlation”) the portfolio volatility decreases.
This is the mathematical essence of the diversifcation principle: imperfect correlation
implies diversification benefits.

FRM 2012 FOUNDATIONS OF RISK MANAGEMENT 26 www.bionicturtle.com
Explain how covariance & correlation affect the expected return and
volatility of a portfolio of risky assets.
Assume two assets with expected returns and standard deviations. The riskless rate is 4.0%.
Riskless rate 4.00%
Asset A
Expected Return 14.00%
Standard Deviation 20.00%
Variance 0.0400
Asset B
Expected Return 4.00%
Standard Deviation 10.00%
Variance 0.0100
The portfolio that includes these two assets has a risk/return profile that varies according to the
correlation (different weights between the assets will “move you along a line.”)
According to Stock & Watson
The lower (closer to -1.0) the correlation coefficient between assets, all other attributes
held constant, the higher the payoff from diversification.
The combinations of two assets can never have more risk than that found on a straight
line connecting the two assets in expected return standard deviation space.
0.0%
5.0%
10.0%
15.0%
0.0% 5.0% 10.0% 15.0% 20.0% 25.0%
Exp
ect
ed
Re
turn
Standard Deviation
Portfolio Possibilities Curve Given Various Correlation Assuptions
From -1.0 to +1.0
-1.00
-0.50
0.00
0.50
1.00
FRM 2012 FOUNDATIONS OF RISK MANAGEMENT 27 www.bionicturtle.com
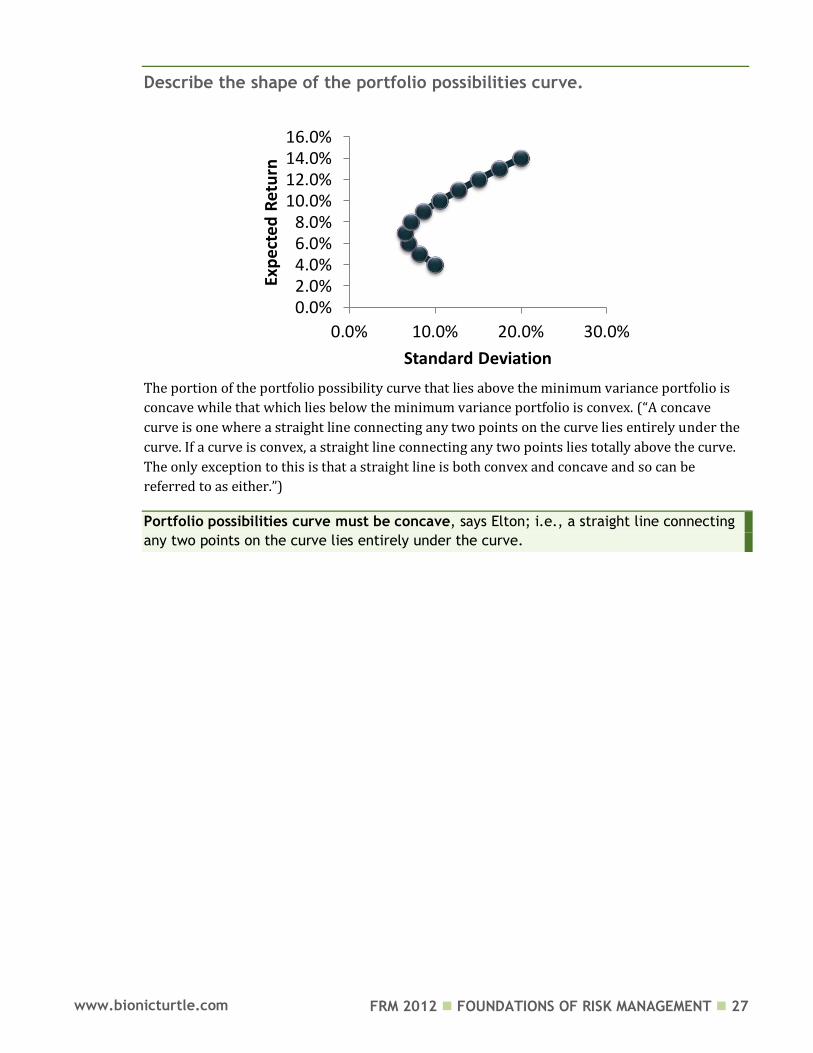
Describe the shape of the portfolio possibilities curve.
The portion of the portfolio possibility curve that lies above the minimum variance portfolio is
concave while that which lies below the minimum variance portfolio is convex. (“A concave
curve is one where a straight line connecting any two points on the curve lies entirely under the
curve. If a curve is convex, a straight line connecting any two points lies totally above the curve.
The only exception to this is that a straight line is both convex and concave and so can be
referred to as either.”)
Portfolio possibilities curve must be concave, says Elton; i.e., a straight line connecting
any two points on the curve lies entirely under the curve.
0.0%2.0%4.0%6.0%8.0%
10.0%12.0%14.0%16.0%
0.0% 10.0% 20.0% 30.0%
Exp
ecte
d R
etu
rn
Standard Deviation

FRM 2012 FOUNDATIONS OF RISK MANAGEMENT 28 www.bionicturtle.com
Define the (global) minimum variance portfolio.
The (global) minimum variance portfolio is not the “best” portfolio; i.e., it is not the
portfolio with the highest Sharpe ratio.
Although not assigned, we can solve for the minimum variance portfolio. We can solve by setting
first partial derivative equal to zero (i.e., where slope of tangent is flat):
mvp
2
mvp 2 2
0
2
PA
A
B AB A BA
A B AB A B
XX
X
0.0%
2.0%
4.0%
6.0%
8.0%
10.0%
12.0%
14.0%
16.0%
0.0% 10.0% 20.0% 30.0%
Exp
ecte
d R
etu
rn
Standard Deviation
Minimum variance
Most efficient
(highest excess
return/volatility)
FRM 2012 FOUNDATIONS OF RISK MANAGEMENT 29 www.bionicturtle.com
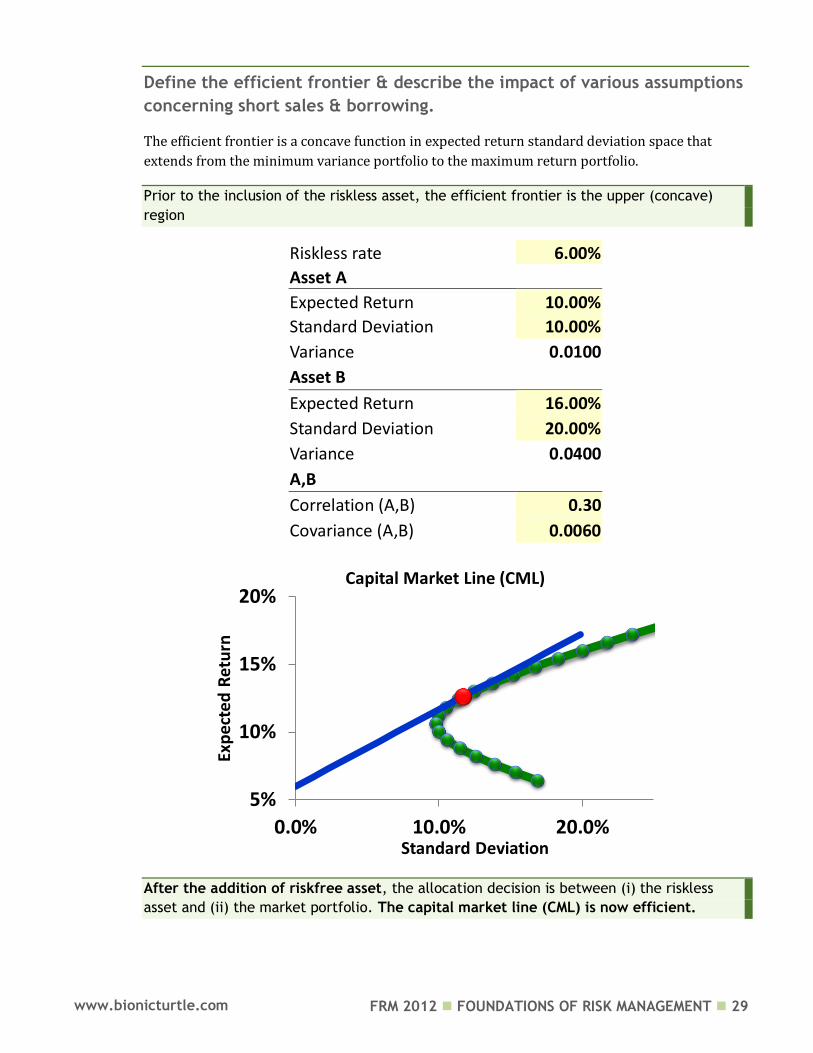
Define the efficient frontier & describe the impact of various assumptions
concerning short sales & borrowing.
The efficient frontier is a concave function in expected return standard deviation space that
extends from the minimum variance portfolio to the maximum return portfolio.
Prior to the inclusion of the riskless asset, the efficient frontier is the upper (concave)
region
Riskless rate 6.00%
Asset A
Expected Return 10.00%
Standard Deviation 10.00%
Variance 0.0100
Asset B
Expected Return 16.00%
Standard Deviation 20.00%
Variance 0.0400
A,B
Correlation (A,B) 0.30
Covariance (A,B) 0.0060
After the addition of riskfree asset, the allocation decision is between (i) the riskless
asset and (ii) the market portfolio. The capital market line (CML) is now efficient.
5%
10%
15%
20%
0.0% 10.0% 20.0%
Exp
ecte
d R
etu
rn
Standard Deviation
Capital Market Line (CML)

FRM 2012 FOUNDATIONS OF RISK MANAGEMENT 30 www.bionicturtle.com
With short sales
With short sales, portfolios exist that give infinite expected rates of return.
With the introduction of the riskfree borrowing and lending
Before the introduction of riskfree borrowing and lending, the efficient frontier is the non-
linear segment starting at the global minimum variance portfolio and extending up (superior
portfolios dominate) throughout the market portfolio. But these portfolios, which lie on the non-
linear curve, are risky portfolios with—as we progress up and to the right—higher risk and
higher return. (Elton: “Up to this point we have been dealing with portfolios of risky assets.”)
Then the riskless asset is introduced: “We can consider lending at a riskless rate as investing in
an asset with a certain outcome (e. g., a short- term government bill or savings account).
Borrowing can be considered as selling such a security short; thus borrowing can take place at
the riskless rate.”
Combinations of any security or portfolio and riskless lending and borrowing lie along a
straight line in expected return standard deviation of return space.
A FC F C
A
R RR R

FRM 2012 FOUNDATIONS OF RISK MANAGEMENT 31 www.bionicturtle.com
Elton, Chapter 13:
The Standard Capital
Asset Pricing Model
In this chapter …
Understand the derivation and components of the CAPM. Describe the assumptions underlying the CAPM. Describe the capital market line. Use the CAPM to calculate the expected return on an asset.

FRM 2012 FOUNDATIONS OF RISK MANAGEMENT 32 www.bionicturtle.com
Understand the derivation and components of the CAPM.
CAPM says that expected return is a linear function of systemic risk (beta)
Expected excess return = (price of risk) * (quantity of risk)
i F i M FR R R R
Equivalent formulation for CAPM:
Since beta is equal to covariance [security return, market return] / market return variance, an
equivalent expression is given by:
2
2
iMi
M
M F iMi F
M M
M FF iM
M
R RR R
R RR
Price of risk (MRP, ERP)
Quantity of risk
0%
5%
10%
15%
20%
25%
0.00 1.00 2.00 3.00
Exp
ecte
d R
etu
rn
Beta (quantity of systemic risk]
Security Market Line (SML)

FRM 2012 FOUNDATIONS OF RISK MANAGEMENT 33 www.bionicturtle.com
Describe the assumptions underlying the CAPM.
No transaction costs.
There is no cost (no friction) to buy or sell any asset. To include transaction costs in the model
adds much complexity. Whether it is worthwhile introducing this complexity depends on the
importance of transaction costs to investors’ decisions. Given the size of transaction costs, they
are probably of minor importance.
Assets are infinitely divisible.
Investors could take any position in an investment, regardless of the size of their wealth. For
example, they can buy one dollar’s worth of IBM stock.
Absence of personal income tax.
Implies investor (individual) is indifferent to dividends versus capital gains.
Perfect competition (individuals are “price-takers”)
An individual cannot affect the price of a stock by his/her buying or selling action. This is
analogous to the assumption of perfect competition. While no single investor can affect prices by
an individual action, investors in total determine prices by their actions.
Mean-variance framework.
Investors are make decisions solely in terms of expected values and standard deviations. of the
returns on their portfolios.
First (mean) and second (variance or standard deviation) moments only

FRM 2012 FOUNDATIONS OF RISK MANAGEMENT 34 www.bionicturtle.com
Unlimited short sales allowed.
Individual investor can sell short any amount of any shares.
Unlimited lending and borrowing at the riskless rate.
Investor can lend or borrow any amount of funds desired at a rate of interest equal to the rate
for riskless securities.
Homogeneity of expectations: single period
All investors are assumed to define the relevant period in exactly the same manner.
Investors are concerned with the mean and variance of returns (or prices over a single period)
and all investors are assumed to define the relevant period in exactly the same manner.
Homogeneity of expectations: identical expectations.
All investors are assumed to have identical expectations with respect to the necessary inputs to
the portfolio decision: expected returns, variance of returns, and the (pairwise) correlation
matrix.
All assets are marketable.
All assets, including human capital, can be sold and bought on the market.
Describe the capital market line.
The capital market line (CML) is the set of optimal portfolios: a linear combination of (i) the
market portfolio and (ii) the risk-free asset
From Elton’s Conclusion: “We have discussed the Sharpe– Lintner– Mossin form of a
general equilibrium relationship in the capital markets. This model, usually referred to as
the capital asset pricing model or standard CAPM … we have shown that, under the
assumptions of the CAPM, the only portfolio of risky assets that any investor will own is
the market portfolio. Recall that the market portfolio is a portfolio in which the fraction
invested in any asset is equal to the market value of that asset divided by the market
value of all risky assets. Each investor will adjust the risk of the market portfolio to his or
her preferred risk- return combination by combining the market portfolio with lending or
borrowing at the riskless rate. This leads directly to the two mutual fund theorem. The
two mutual fund theorem states that all investors can construct an optimum portfolio by
combining a market fund with the riskless asset. Thus, all investors will hold a portfolio
along the [straight] line connecting [the riskfree rate] with the [market portfolio] in
expected return, standard deviation of return space.”
FRM 2012 FOUNDATIONS OF RISK MANAGEMENT 35 www.bionicturtle.com
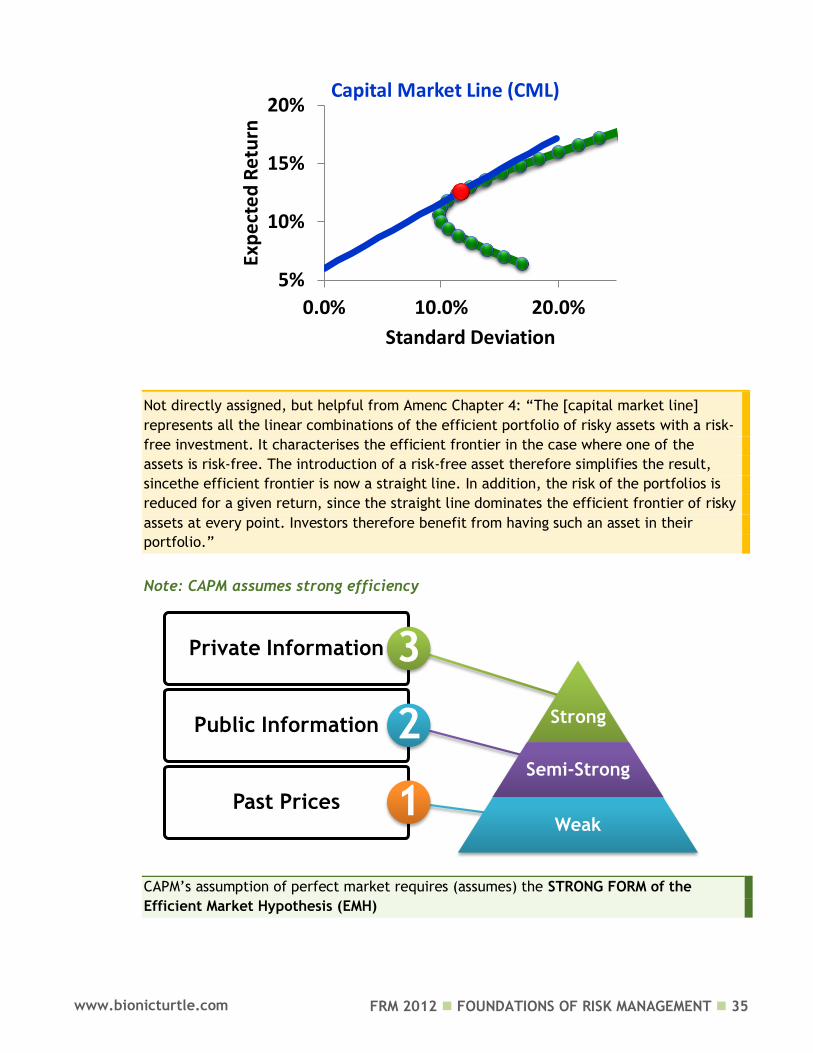
Not directly assigned, but helpful from Amenc Chapter 4: “The [capital market line]
represents all the linear combinations of the efficient portfolio of risky assets with a risk-
free investment. It characterises the efficient frontier in the case where one of the
assets is risk-free. The introduction of a risk-free asset therefore simplifies the result,
sincethe efficient frontier is now a straight line. In addition, the risk of the portfolios is
reduced for a given return, since the straight line dominates the efficient frontier of risky
assets at every point. Investors therefore benefit from having such an asset in their
portfolio.”
Note: CAPM assumes strong efficiency
CAPM’s assumption of perfect market requires (assumes) the STRONG FORM of the
Efficient Market Hypothesis (EMH)
Private Information
Strong Public Information
3
Semi-Strong
Past Prices
2
Weak 1
5%
10%
15%
20%
0.0% 10.0% 20.0%
Exp
ect
ed
Re
turn
Standard Deviation
Capital Market Line (CML)

FRM 2012 FOUNDATIONS OF RISK MANAGEMENT 36 www.bionicturtle.com
Use the CAPM to calculate the expected return on an asset.
Assume that the following assets are correctly priced according to the security market line.
Derive the security market line.
What is the expected return on an asset with a Beta of 2.0 (Elton Question 13.1)?
1 1
2 2
6% 0.5
12% 1.5
R
R
Answer:
12% 1.5
6% 0.5
6% 3%
F
F
F
R MRP
R MRP
MRP R
2.0
3% 6%
3% 6% 2 15%
R
R
FRM 2012 FOUNDATIONS OF RISK MANAGEMENT 37 www.bionicturtle.com
Elton, Chapter 14:
Nonstandard Forms of Capital
Asset Pricing Models
In this chapter…
Describe the impact on the CAPM of the following: Short sales disallowed Riskless lending and borrowing Personal taxes Nonmarketable assets Heterogeneous expectations Non-price-taking behavior
Describe the following multi-period versions of CAPM: Consumption-oriented CAPM CAPM including inflation Multi-beta CAPM
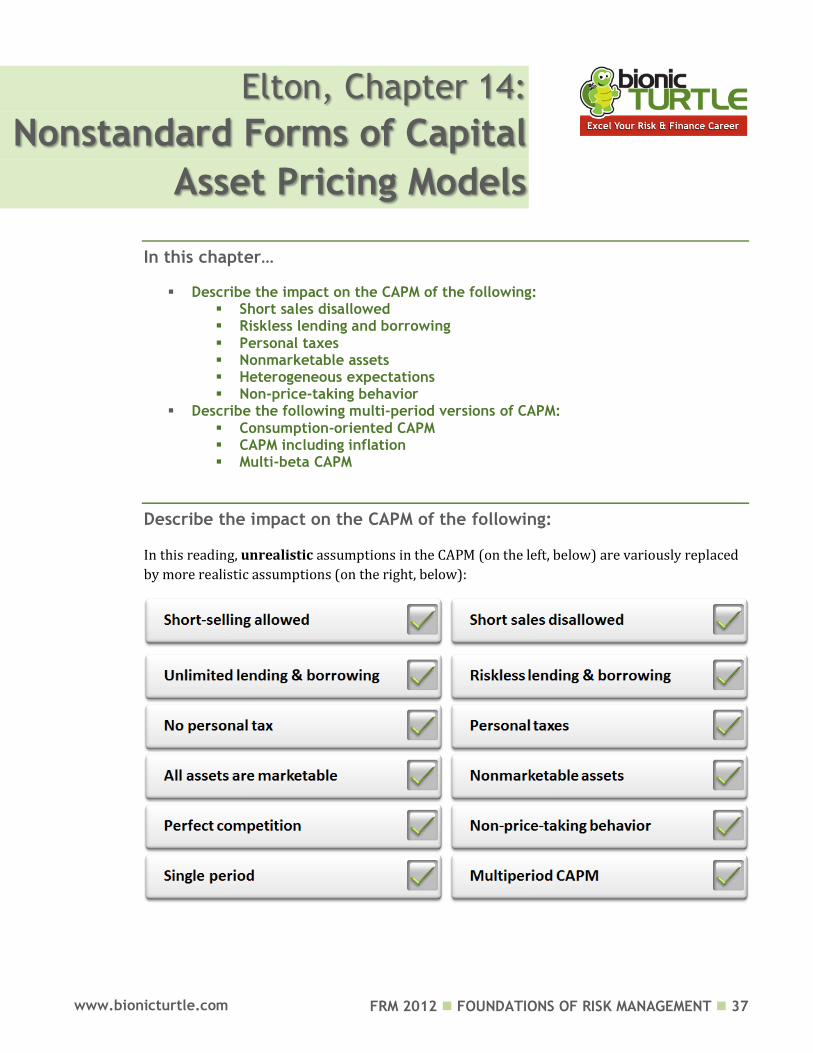
Describe the impact on the CAPM of the following:
In this reading, unrealistic assumptions in the CAPM (on the left, below) are variously replaced
by more realistic assumptions (on the right, below):

FRM 2012 FOUNDATIONS OF RISK MANAGEMENT 38 www.bionicturtle.com
Describe the impact on the CAPM of the following: Short sales disallowed The allowance of short-sales is a convenient assumption that simplifies the derivation math, but
it is not a necessary assumption: if short sales are disallowed, exactly the same CAPM result
is obtained.
Elton: “Short sales were defined in the broadest sense of the term in that the investor
was allowed to sell any security (whether owned or not) and to use the proceeds to buy
any other security. This was a convenient assumption and it simplified the mathematics
of the derivation, but it was not a necessary assumption. Exactly the same result would
have been obtained had short sales been disallowed. The economic intuition behind this
is quite simple. In the CAPM framework all investors hold the market portfolio in
equilibrium. Since in equilibrium no investor sells any security short, prohibiting short
selling cannot change the equilibrium. Thus, the same CAPM relationship would be
derived irrespective of whether short sales are allowed or prohibited.”
Describe the impact on the CAPM of the following: No Riskless lending and
borrowing
If we assume there is neither riskless lending nor borrowing, CAPM still applies except
borrowing (lending) at the riskfree asset is replaced by shorting (going long) the zero-
beta portfolio. This is the zero-beta CAPM; also referred to as the two-factor model:
( )
expected return on zero-beta portfolio
i Z M Z i
Z
R R R R
R
No riskless lending/borrowing leads to Zero-beta CAPM
Elton: “Under the zero-beta CAPM (i.e., no riskless lending and borrowing), all investors
no longer hold the same portfolio in equilibrium. This is comforting for it is more
consistent with observed behavior. Of less comfort is that investors still hold most
securities (either long or short) and hold many securities short. In the case where neither
lending nor borrowing is allowed, we have a two mutual fund theorem. In the case where
riskless lending is allowed, we have a three mutual fund theorem. As in the case of the
simple CAPM, we still get a security market line. In addition, many of the implications
of this relationship are the same. For risky assets or portfolios, expected return is still a
linearly increasing function of risk as measured by Beta. It is only market risk that affects
the return on individual risky securities and portfolios of risky securities. On these
securities the investor gains no extra return from bearing diversifiable risk. In fact, the
only difference lies in the intercept and slope of the security market line.”
FRM 2012 FOUNDATIONS OF RISK MANAGEMENT 39 www.bionicturtle.com
Describe the impact on the CAPM of the following: Personal taxes
The simple form of the CAPM ignores taxes, which therefore assumes that investors are
indifferent between capital gain and dividend income; and that all investors hold the same
portfolio of risky assets.
If we introduce taxes, including the assumption that capital gains are taxed, in general, at a
lower rate than dividends, the equilibrium prices should change. Investors will evaluate after-
tax risk and return. This implies that, even with homogeneous expectations about the before-tax
return on a portfolio, the relevant (after-tax) efficient frontier faced by each investor will be
different. However, a general equilibrium relationship should still exist since, in the
aggregate, markets must clear.
( )
dividend yield of market portfolio
dividend yield for stock i
tax factor
i F i M F M F i F
M
i
E R R E R R R R
After the more realistic introduction of personal taxes: although each investor new looks
at a different efficient frontier, markets still clear to (more complex) general
equilibrium
Describe the impact on the CAPM of the following: Nonmarketable assets
Human capital is an example of a nonmarketable asset
Adding nonmarketable assets leads to a general equilibrium relationship of the same
form as the simple model that excluded nonmarketable assets. However, the market trade-
off between return and risk is different, as is the measure of risk for any asset.
The equilibrium return for an asset can be either higher or lower than it is under the standard form of the CAPM
FRM 2012 FOUNDATIONS OF RISK MANAGEMENT 40 www.bionicturtle.com
Describe the impact on the CAPM of the following: Heterogeneous
expectations
CAPM assumes homogenous expectations: all investors have the same inputs (expected
returns, variances [of returns], and covariance/correlation matrix)
If we relax this assumption to allow for the (certainly!) more realistic assumption that investors
have heterogeneous expectations, equilibrium can still be expressed in terms of expected
returns, covariances, and variance, but now these returns, covariances, and variances are
complex weighted averages of the estimates held by different individuals
Describe the impact on the CAPM of the following: Non-price-taking
behavior
Elton: “Lindenberg finds the price affector will hold less of the riskless asset (will be less of a risk
avoider) than [otherwise]. By doing so the price affector increases utility. “
Because the price affector still holds a combination of the riskless asset and the market portfolio,
we still get the simple form of the CAPM, but the market price of risk is lower than it
would be if all investors were price takers.
One of the CAPM assumptions is that markets are perfectly compeitive; that is, the
individuals are price-takers. Relaxing this assumption implies the idea that some investors
(e.g., large mutual or pension funds) believe their trades impact price.
Describe the following multi-period versions of CAPM: Consumption-
oriented CAPM
A number of authors have taken a different approach to defining equilibrium in the capital
markets. They start with a set of assumptions:
Investors maximize a multiperiod utility function for lifetime consumption;
Investors have homogeneous beliefs concerning return characteristics of assets;
There is an infinitely lived fixed population;
There is a single consumption good; and
There exists a capital market that allows investors to reach a consumption pattern such that they cannot jointly fare better by additional trades.
The authors are able to show, under these assumptions, that return on assets should be
linearly related to the growth rate in aggregate consumption if the parameters of the linear
relationship can be assumed constant over time.

FRM 2012 FOUNDATIONS OF RISK MANAGEMENT 41 www.bionicturtle.com
This model is directly analogous to the simple form of the CAPM, except the growth rate of per
capita consumption replaces the rate of return on the market portfolio.
1
1 market price of the consumption beta
expected return on portfolio with
zero consumption beta
i Z i
i
R R
Describe the following multi-period versions of CAPM: CAPM including
[uncertain] inflation
Equilibrium is similar to the simple form of the CAPM, but both the definition of the market price
of risk and the risk on an asset are modified.
As long as the correlation between the rate of return on the market and the rate of inflation is positive, the market price of risk is higher than that depicted in the standard CAPM.
Risk of any asset is not just a function of its covariance with the market; it is also a function of its
covariance with the rate of inflation.
If an asset’s rate of return is positively correlated with the rate of inflation, the standard CAPM formulation overstates the risk of the asset.
Describe the following multi-period versions of CAPM: Multi-beta CAPM
Multi-beta CAPM says expected return is a function of (related to) several sensitivities.
1 1 2 2 ...
i F
iM M F il l F il l F
R R
R R R R R R
For example:
i F
iM M F il ll F
R R
R R R R
Price of inflation risk
Sensitivity to inflation risk
FRM 2012 FOUNDATIONS OF RISK MANAGEMENT 42 www.bionicturtle.com
Elton, Chapter 16:
Arbitrage Pricing
Model (APT)
In this chapter…
Describe the APT and the assumptions underlying it. Use the APT to calculate the expected returns on an asset. Explain the relationship between the CAPM and the APT. Describe how APT can be used in both active and passive portfolio management.
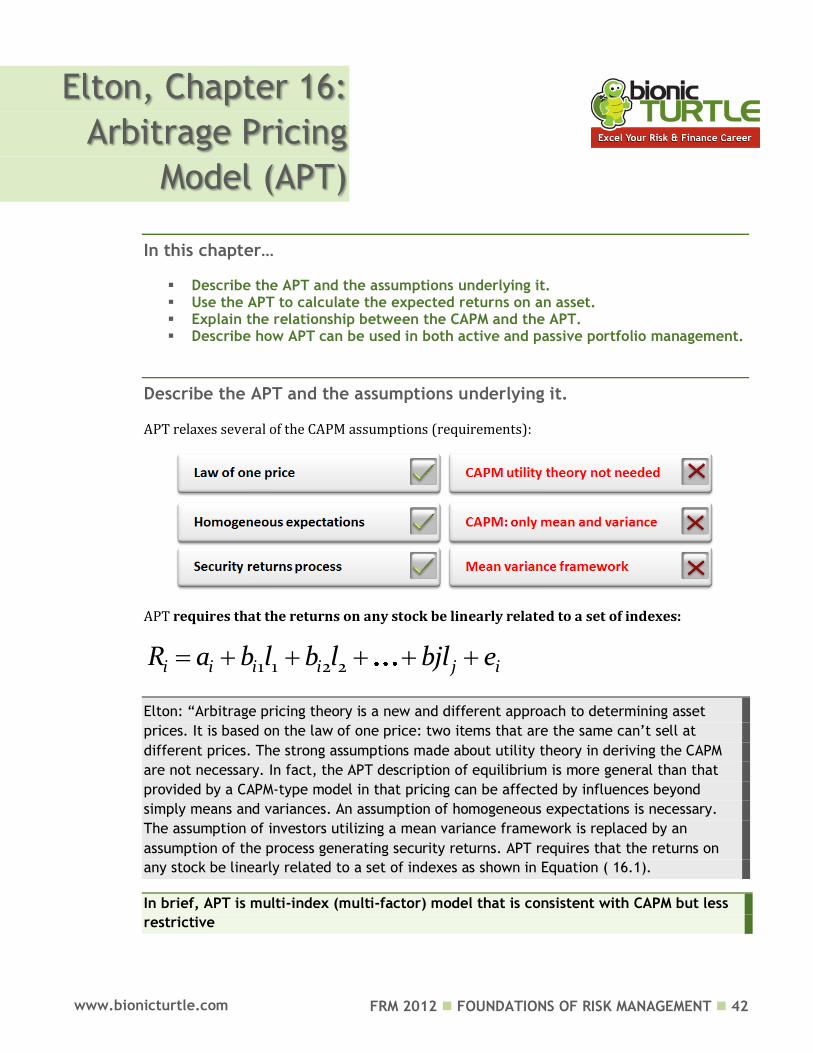
Describe the APT and the assumptions underlying it.
APT relaxes several of the CAPM assumptions (requirements):
APT requires that the returns on any stock be linearly related to a set of indexes:
1 1 2 2i i i i j iR a b l b l bjl e
Elton: “Arbitrage pricing theory is a new and different approach to determining asset
prices. It is based on the law of one price: two items that are the same can’t sell at
different prices. The strong assumptions made about utility theory in deriving the CAPM
are not necessary. In fact, the APT description of equilibrium is more general than that
provided by a CAPM-type model in that pricing can be affected by influences beyond
simply means and variances. An assumption of homogeneous expectations is necessary.
The assumption of investors utilizing a mean variance framework is replaced by an
assumption of the process generating security returns. APT requires that the returns on
any stock be linearly related to a set of indexes as shown in Equation ( 16.1).
In brief, APT is multi-index (multi-factor) model that is consistent with CAPM but less
restrictive
FRM 2012 FOUNDATIONS OF RISK MANAGEMENT 43 www.bionicturtle.com
Use the APT to calculate the expected returns on an asset.
Elton example (S&P Index)
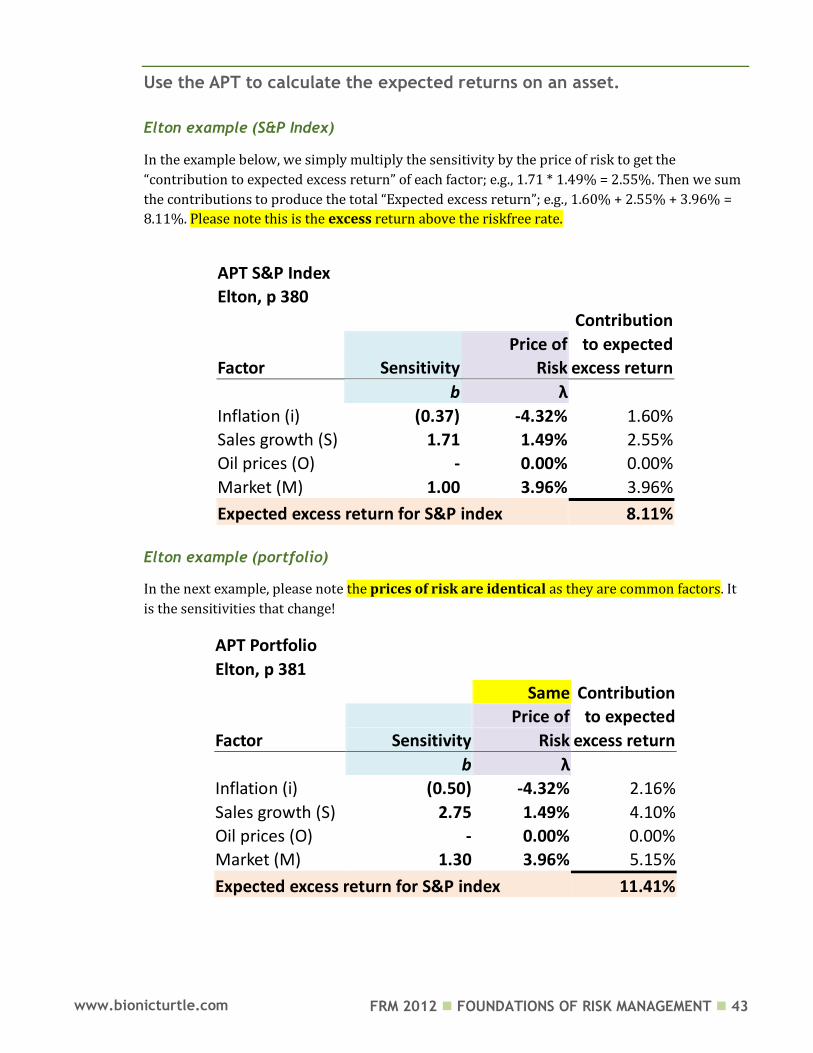
In the example below, we simply multiply the sensitivity by the price of risk to get the
“contribution to expected excess return” of each factor; e.g., 1.71 * 1.49% = 2.55%. Then we sum
the contributions to produce the total “Expected excess return”; e.g., 1.60% + 2.55% + 3.96% =
8.11%. Please note this is the excess return above the riskfree rate.
APT S&P Index Elton, p 380
Contribution
Price of to expected
Factor Sensitivity Risk excess return
b λ
Inflation (i) (0.37) -4.32% 1.60%
Sales growth (S) 1.71 1.49% 2.55%
Oil prices (O) - 0.00% 0.00%
Market (M) 1.00 3.96% 3.96%
Expected excess return for S&P index 8.11%
Elton example (portfolio)
In the next example, please note the prices of risk are identical as they are common factors. It
is the sensitivities that change!
APT Portfolio Elton, p 381
Same Contribution
Price of to expected
Factor Sensitivity Risk excess return
b λ
Inflation (i) (0.50) -4.32% 2.16%
Sales growth (S) 2.75 1.49% 4.10%
Oil prices (O) - 0.00% 0.00%
Market (M) 1.30 3.96% 5.15%
Expected excess return for S&P index 11.41%
FRM 2012 FOUNDATIONS OF RISK MANAGEMENT 44 www.bionicturtle.com
Explain the relationship between the CAPM and the APT.
The APT solution with multiple factors appropriately priced is fully consistent with the Sharpe–
Lintner–Mossin form of the CAPM.
Elton: “Employing the Roll and Ross procedure and finding that more than one risk factor
(price of risk) is significantly different from zero is not sufficient proof to reject any
CAPM. If the lambdas are not significantly different from [beta*excess market return],
the empirical results could be fully consistent with the Sharpe–Lintner–Mossin form of the
CAPM. It is perfectly possible that more than one index explains the covariance between
security returns but that the CAPM holds.”
Describe how the APT can be used in both active and passive portfolio
management.
APT in passive portfolio management:
APT can be used to do a better job of tracking an index or to design a passive portfolio that is
appropriate for a particular client.
To create a portfolio of stocks that closely tracks an index (the simplest use).
To match (track) an index with a portfolio that excludes certain stocks: “Another problem frequently encountered in passive management is the desire to match an index with a portfolio that excludes certain types of stocks. Social goals or management preferences frequently restrict the set of stocks that can be used to match an index. In the last 10 years, for example, it was not uncommon for a pension fund to declare that it would not own tobacco stocks or gambling stocks. It is likely that a sector of the market such as tobacco stocks has a sensitivity to inflation or interest rates that is different from that of the average stock. If an index fund is formed from a set of stocks that precludes tobacco stocks using the single- index model, then the sensitivity to the single- index will be matched but the sensitivity to other important influences will probably be different. Use of a multi- index model improves tracking an index.”
To match (track) an index with a portfolio that must include certain stocks: “This is very common in Japan, where stocks are often held for reasons that have their foundations in the business relationship between firms. In the United States, an investor may want to maintain ( or add) certain holdings in a portfolio for business reasons or because the investor does not want to recognize certain accumulated but unrealized capital losses or gains for either tax purposes or reporting purposes. The problem then is to find an overall portfolio matching as closely as possible an index but including a defined set of stocks. Because these stocks may have sensitivities to important influences that are different from the index being matched, it is important to explicitly match on each of the key risk factors.”
To closely track an index while tailoring the risk exposure in some specific way: “One type of passive management that can be performed with a multi- index model, is fundamentally different from what can be done with a single- index model. The multi-index model allows one to closely match an index while purposely taking positions with

FRM 2012 FOUNDATIONS OF RISK MANAGEMENT 45 www.bionicturtle.com
respect to certain types of risk different from the positions contained in the index. For example, consider a pension fund that has cash outflows affected by inflation (COLA or cost-of-living adjustments). The payments for such a pension fund increase with inflation. Thus the overseers want a portfolio that will perform especially well when the rate of inflation increases.”
APT in active portfolio management:
An obvious advantage of a multi-index model is that it allows the user to increase or decrease,
with intention, exposures to selected common factors.
To make common factor bets: “What a multi-index model does that cannot be done with a single- index model is allow the user to make factor bets. If you believe that unexpected inflation will accelerate at a rate above that anticipated by the market, then you may want to place a bet by increasing your exposure with inflation. This can be done holding a portfolio with sensitivity to inflation larger than the S& P index. Obviously the more indexes included in the model, the more active bets you can make. For example, in the Salomon model described earlier in this chapter, you can take active bets on economic growth, the stage of the business cycle, long- term interest rates, short- term interest rates, inflation rates, the value of the U. S. dollar, or the state of the stock market.”
To build optimal portfolios: “Multi- index models and APT models can be used just as the single-index model and CAPM models are used to form optimal portfolios building upon estimates of the performance of individual securities. The simplest approach is … where a multi-index model is used to generate the covariance between securities while expected returns and variances are supplied by some combination of analysts’ forecasts and historical data.”
To judge the valuation of securities: “Another application of APT is to use APT to determine stocks that are under- or overvalued. In this procedure an analyst produces a forecast of the return on a stock. The APT is then used together with estimates of the sensitivity of the stock to the factors to calculate a required return for the stock. If the estimated return is above what’s required given the stock’s sensitivity and the s, the stock is purchased.
Related, to track an index or benchmark but enhance with active tilt: “One of the most common uses of the APT model is to form a portfolio of stocks that while closely tracking a target will also produce a return in excess of that index. One way to implement this type of procedure is simply to employ the index- matching procedure described earlier in this chapter but only allow selection from among a set of stocks that analysts have earmarked as superior performers. Other techniques use either numeric discrete ranking of stocks or expected return on stocks in an attempt to produce an excess return above an index while using the multi-index model to track an index as closely as possible. Portfolios designed this way have become known as research-tilted index funds. Although some additional risk is involved (the index can’t be matched as closely when selecting from a restricted set of stocks), investors who use this technique feel that an excess return can be earned with only a slight loss in the ability to track the index. The advantage of the multi- index model over the simple- index model is that the target index can be tracked more closely because the different sources of risk are explicitly taken into consideration.”
FRM 2012 FOUNDATIONS OF RISK MANAGEMENT 46 www.bionicturtle.com
Amenc, Chapter 4 (4.2 only):
Applying CAPM to
Performance Measurement
In this chapter…
Calculate, compare, and evaluate the Treynor measure, the Sharpe measure, and Jensen's alpha.
Compute and interpret tracking error, the information ratio, and the Sortino ratio.
Explain the Morningstar Rating System, VaR based, and management related risk-adjusted return measures.
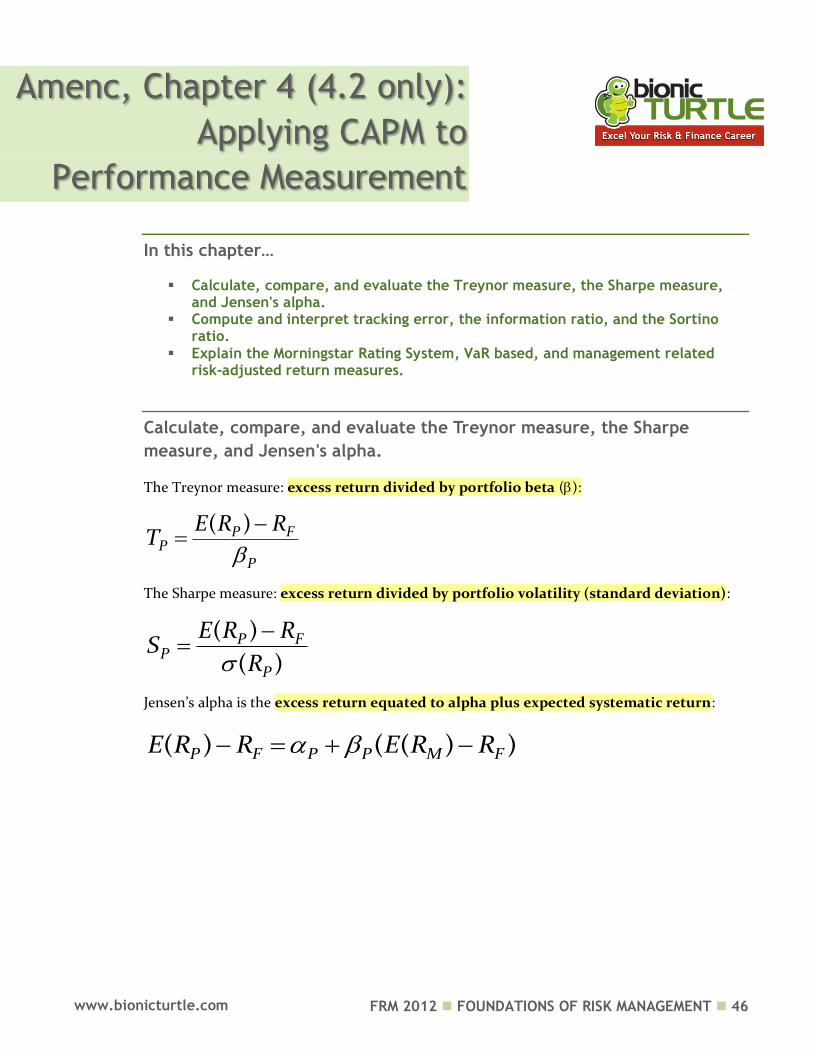
Calculate, compare, and evaluate the Treynor measure, the Sharpe
measure, and Jensen's alpha.
The Treynor measure: excess return divided by portfolio beta ():
( )P FP
P
E R RT
The Sharpe measure: excess return divided by portfolio volatility (standard deviation):
( )
( )P F
PP
E R RS
R
Jensen’s alpha is the excess return equated to alpha plus expected systematic return:
( ) ( ( ) )P F P P M FE R R E R R
FRM 2012 FOUNDATIONS OF RISK MANAGEMENT 47 www.bionicturtle.com
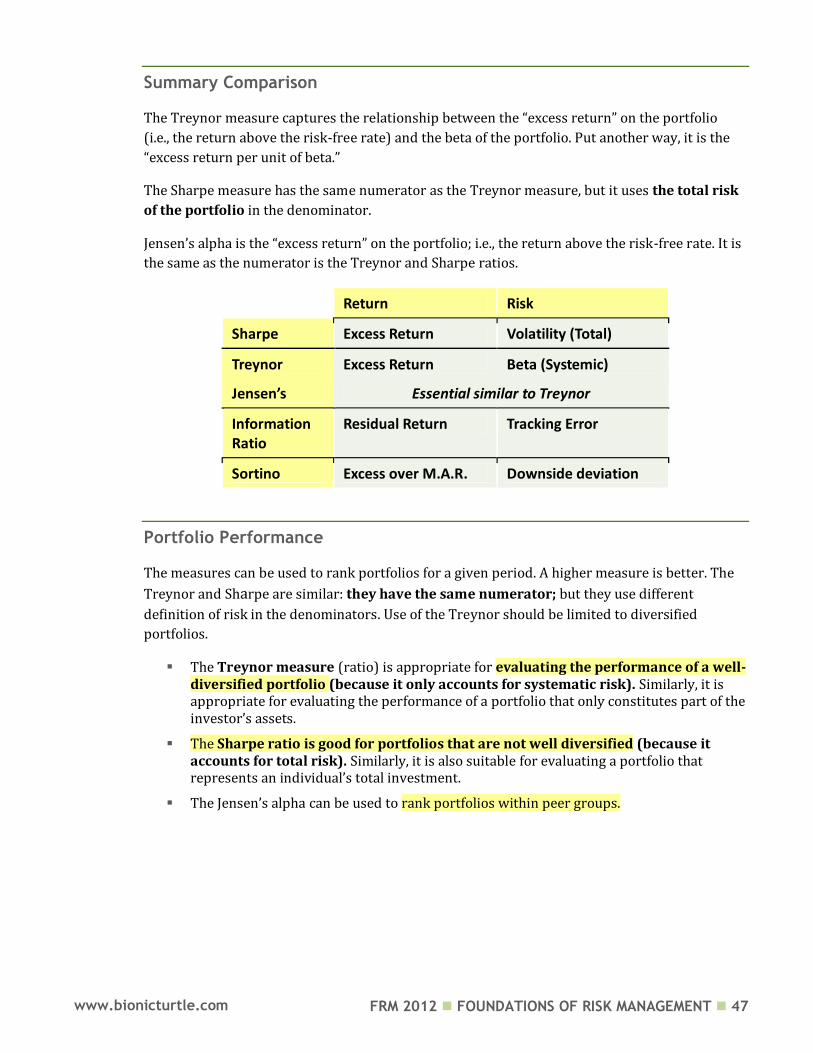
Summary Comparison
The Treynor measure captures the relationship between the “excess return” on the portfolio
(i.e., the return above the risk-free rate) and the beta of the portfolio. Put another way, it is the
“excess return per unit of beta.”
The Sharpe measure has the same numerator as the Treynor measure, but it uses the total risk
of the portfolio in the denominator.
Jensen’s alpha is the “excess return” on the portfolio; i.e., the return above the risk-free rate. It is
the same as the numerator is the Treynor and Sharpe ratios.
Return Risk
Sharpe Excess Return Volatility (Total)
Treynor Excess Return Beta (Systemic)
Jensen’s Essential similar to Treynor
Information Ratio
Residual Return Tracking Error
Sortino Excess over M.A.R. Downside deviation
Portfolio Performance
The measures can be used to rank portfolios for a given period. A higher measure is better. The
Treynor and Sharpe are similar: they have the same numerator; but they use different
definition of risk in the denominators. Use of the Treynor should be limited to diversified
portfolios.
The Treynor measure (ratio) is appropriate for evaluating the performance of a well-diversified portfolio (because it only accounts for systematic risk). Similarly, it is appropriate for evaluating the performance of a portfolio that only constitutes part of the investor’s assets.
The Sharpe ratio is good for portfolios that are not well diversified (because it accounts for total risk). Similarly, it is also suitable for evaluating a portfolio that represents an individual’s total investment.
The Jensen’s alpha can be used to rank portfolios within peer groups.

FRM 2012 FOUNDATIONS OF RISK MANAGEMENT 48 www.bionicturtle.com
Compute and interpret tracking error, the information ratio, and the
Sortino ratio.
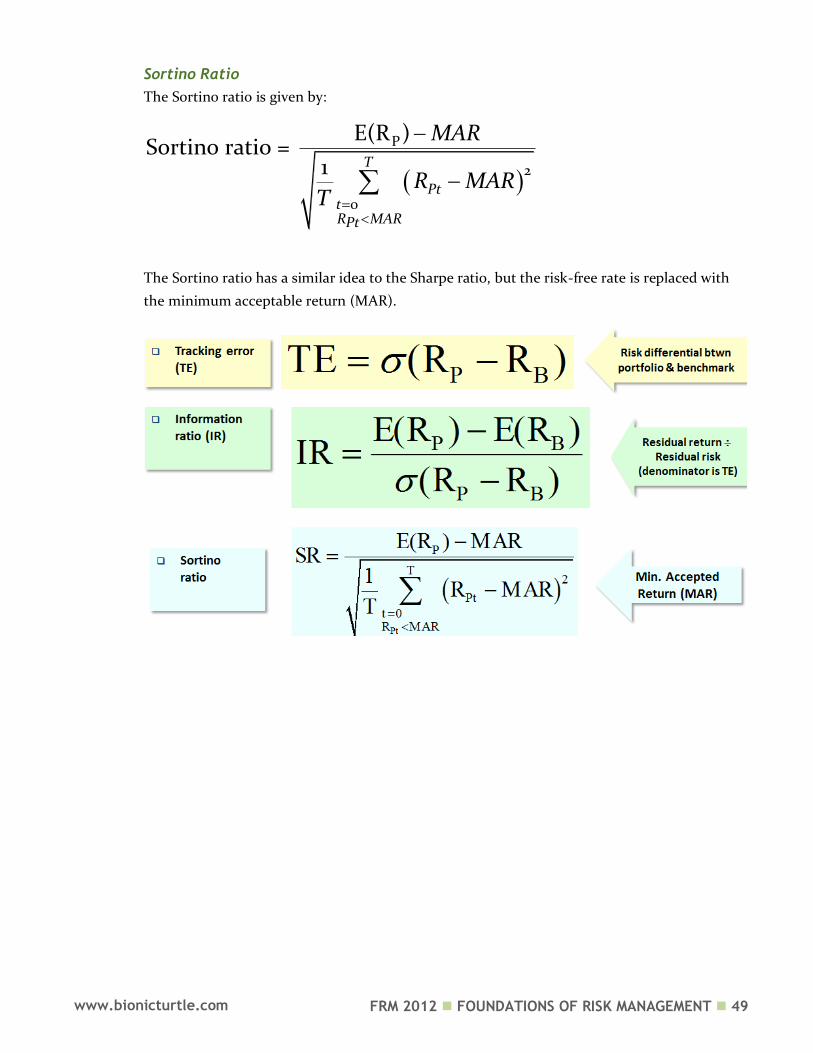
Tracking Error (TE)
Tracking error (TE) is the standard deviation of the difference between the portfolio return
and the benchmark return:
( )P BTE R R
Tracking error is used to analyze benchmark funds; i.e., funds that assume a risk profile (and
construction, generally) similar to a particular profile but then deviates from the benchmark in
an attempt to add value. The ideal, of course, is to add value without assuming additional risk.
Information ratio (IR)
The information ratio (IR, aka, the appraisal ratio) is given by:
( ) ( )
( )P B
P B
E R E RIR
R R
The information ratio (IR) is also used to evaluate the manager of a benchmark fund. It helps
to answer the question, “was the manager sufficiently rewarded for the risk incurred by
deviating from the benchmark?”
FRM 2012 FOUNDATIONS OF RISK MANAGEMENT 49 www.bionicturtle.com
Sortino Ratio
The Sortino ratio is given by:
P
2
0
E(R )Sortino ratio =
1 T
PttR MARPt
MAR
R MART
The Sortino ratio has a similar idea to the Sharpe ratio, but the risk-free rate is replaced with
the minimum acceptable return (MAR).
FRM 2012 FOUNDATIONS OF RISK MANAGEMENT 50 www.bionicturtle.com
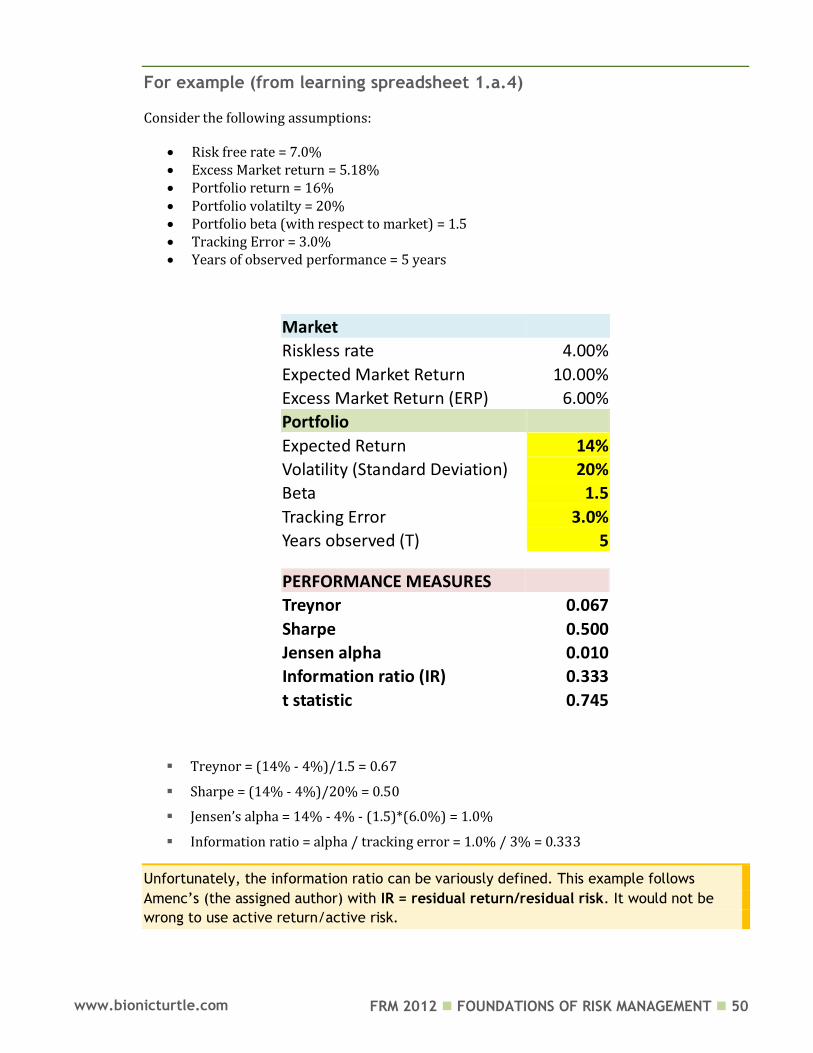
For example (from learning spreadsheet 1.a.4)
Consider the following assumptions:
Risk free rate = 7.0% Excess Market return = 5.18% Portfolio return = 16% Portfolio volatilty = 20% Portfolio beta (with respect to market) = 1.5 Tracking Error = 3.0% Years of observed performance = 5 years
Market
Riskless rate 4.00%
Expected Market Return 10.00%
Excess Market Return (ERP) 6.00%
Portfolio
Expected Return 14%
Volatility (Standard Deviation) 20%
Beta 1.5
Tracking Error 3.0%
Years observed (T) 5
PERFORMANCE MEASURES
Treynor 0.067
Sharpe 0.500
Jensen alpha 0.010
Information ratio (IR) 0.333
t statistic 0.745
Treynor = (14% - 4%)/1.5 = 0.67
Sharpe = (14% - 4%)/20% = 0.50
Jensen’s alpha = 14% - 4% - (1.5)*(6.0%) = 1.0%
Information ratio = alpha / tracking error = 1.0% / 3% = 0.333
Unfortunately, the information ratio can be variously defined. This example follows
Amenc’s (the assigned author) with IR = residual return/residual risk. It would not be
wrong to use active return/active risk.

FRM 2012 FOUNDATIONS OF RISK MANAGEMENT 51 www.bionicturtle.com
Explain the Morningstar Rating System, VaR based, and management
related risk-adjusted return measures.
Morningstar Rating System (4.2.9.1.)
The Morningstar measure is called a risk-adjusted rating (RAR).The principle of the measure is
to rand different funds that belong to the same peer group. The RAR for a fund is calculated as
the difference between its relative returns and its relative risk. The relative return and the
relative risk for the fund are obtained by dividing, respectively, the return and the risk of the
fund by a quantity, called the base, which is common to all the funds in the peer group, or
P P Pi i iRAR RR RRisk
(relative return) =
(relative risk) =
PiPi
g
PiPi
g
RRR
BR
RiskRRisk
BRisk
Where (g) denotes the peer group containing the fund Pi;
RPi denotes the return on fund Pi, in excess of the risk-free rate;
RiskPi denotes the risk of fund Pi;
BRg denotes the base used to calculate the relative returns of all the funds in the group;
BRiskg denotes the base used to calculate the relative risks of all the funds in the group.
“The Morningstar measure is based on an investment period of one month, although funds
are in fact held for longer periods, and a decrease in one month can be compensated for
by an increase in the following month. This measure is not therefore very appropriate for
measuring the risk of funds that are held over a long period.” -- Amenc
Analysis based on the Value at Risk (VaR; 4.2.9.3)
The numerator is the same as with Sharpe and Treynor: excess return. But risk is replaced with
a risk indicator based on value at risk (VaR):
0
P F
P
P
R R
VaR
V
RP denotes the return on the portfolio; RF denotes the return on the risk-free asset; VaRP denotes the VaR of the portfolio; V(0)P denotes the initial value of the portfolio.
FRM 2012 FOUNDATIONS OF RISK MANAGEMENT 52 www.bionicturtle.com
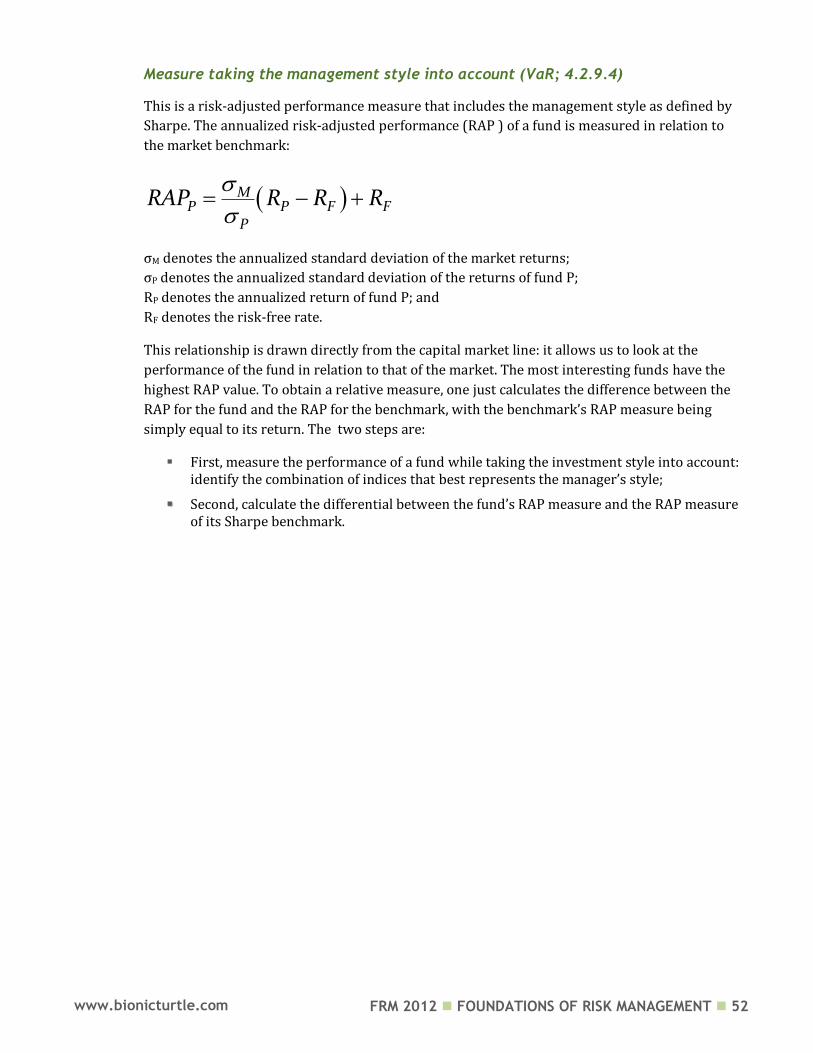
Measure taking the management style into account (VaR; 4.2.9.4)
This is a risk-adjusted performance measure that includes the management style as defined by
Sharpe. The annualized risk-adjusted performance (RAP ) of a fund is measured in relation to
the market benchmark:
M
P P F FP
RAP R R R
σM denotes the annualized standard deviation of the market returns;
σP denotes the annualized standard deviation of the returns of fund P;
RP denotes the annualized return of fund P; and
RF denotes the risk-free rate.
This relationship is drawn directly from the capital market line: it allows us to look at the
performance of the fund in relation to that of the market. The most interesting funds have the
highest RAP value. To obtain a relative measure, one just calculates the difference between the
RAP for the fund and the RAP for the benchmark, with the benchmark’s RAP measure being
simply equal to its return. The two steps are:
First, measure the performance of a fund while taking the investment style into account: identify the combination of indices that best represents the manager’s style;
Second, calculate the differential between the fund’s RAP measure and the RAP measure
of its Sharpe benchmark.

FRM 2012 FOUNDATIONS OF RISK MANAGEMENT 53 www.bionicturtle.com
CAS,
Overview of Enterprise
Risk Management
In this chapter…
Describe what is meant by ERM. Identify and describe risks addressed by ERM. Describe the measures, models, and tools typically used within an ERM
framework. Discuss practical considerations related to ERM implementation.
Describe what is meant by ERM.
ERM is the discipline by which an organization in any industry assesses, controls, exploits,
finances, and monitors risks from all sources for the purpose of increasing the organization’s
short- and long-term value to its stakeholders.
1. ERM is a discipline: ERM is an orderly or prescribed conduct or pattern of behavior for
an enterprise, that it has the full support and commitment of the management of the
enterprise, that it influences corporate decision-making, and that it ultimately becomes
part of the culture of that enterprise.
2. ERM applies to all industries: ERM, even as it is defined for CAS purposes, applies to all
industries, not just the property/casualty insurance industry with which casualty
actuaries are intimately familiar.
3. ERM is not just defensive, it adds value: The specific mention of exploiting risk as a
part of the risk management process (along with the stated objective of increasing short-
and long-term value) demonstrates that the intention of ERM is to be value creating as
well as risk mitigating.
4. ERM encompasses all risks: All sources of risk are considered, not only the hazard risk
with which casualty actuaries are particularly familiar, or those traditionally managed
within an enterprise (such as financial risk).
5. ERM addresses all stakeholders: ERM considers all stakeholders of the enterprise,
which include shareholders and debtholders, management and officers, employees,
customers, and the community within which the enterprise resides.
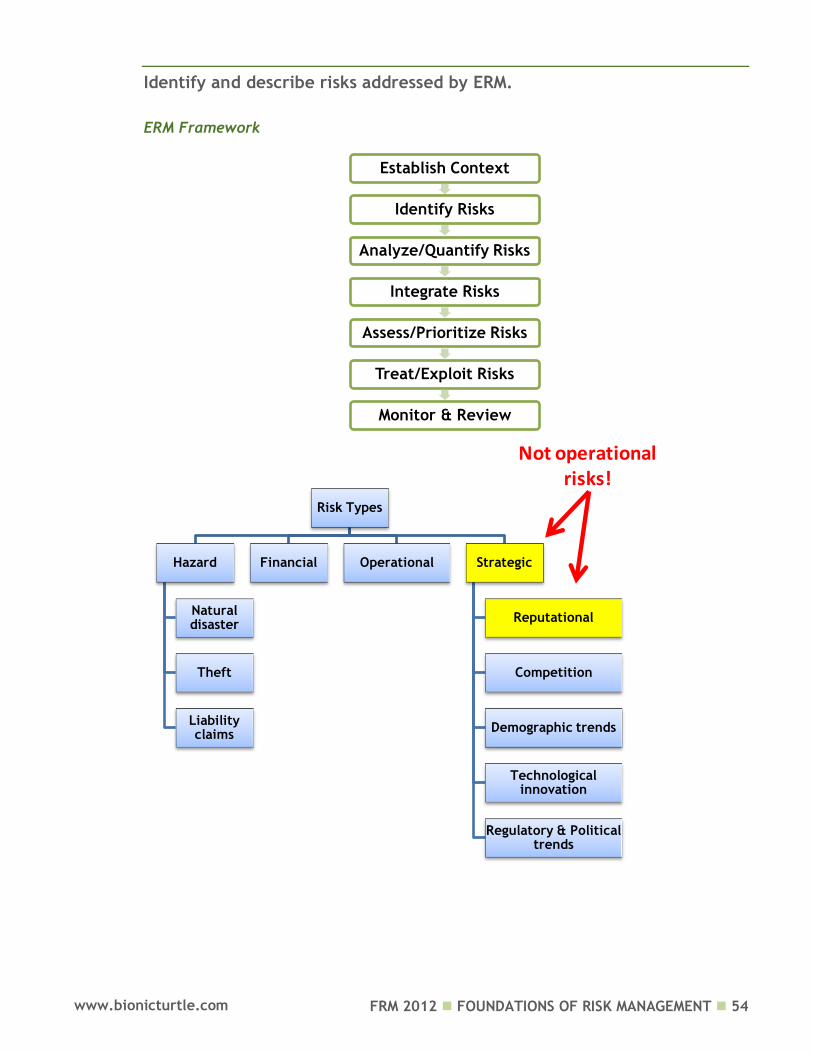
FRM 2012 FOUNDATIONS OF RISK MANAGEMENT 54 www.bionicturtle.com
Identify and describe risks addressed by ERM.
ERM Framework
Risk Types
Hazard
Natural disaster
Theft
Liability claims
Financial Operational Strategic
Reputational
Competition
Demographic trends
Technological innovation
Regulatory & Political trends
Not operational risks!
Establish Context
Identify Risks
Analyze/Quantify Risks
Integrate Risks
Assess/Prioritize Risks
Treat/Exploit Risks
Monitor & Review

FRM 2012 FOUNDATIONS OF RISK MANAGEMENT 55 www.bionicturtle.com
Hazard Risks include risks from:
Fire and other property damage,
Windstorm and other natural perils,
Theft and other crime, personal injury,
Business interruption,
Disease and disability (including work-related injuries and diseases), and
Liability claims.
Financial Risks include risks from:
price (e.g. asset value, interest rate, foreign exchange, commodity),
Liquidity (e.g. cash flow, call risk, opportunity cost),
Credit (e.g. default, downgrade)
Inflation/purchasing power, and
Hedging/basis risk
Operational Risks include risks from:
Business operations (e.g., human resources, product development, capacity, efficiency, product/service failure, channel management, supply chain management, business cyclicality),
Empowerment (e.g., leadership, change readiness),
Information technology (e.g., relevance, availability), and
Information/business reporting (e.g., budgeting and planning, accounting information, pension fund, investment evaluation, taxation).
Strategic Risks include risks from:
Reputational damage (e.g., trademark/brand erosion, fraud, unfavorable publicity)
Competition,
Customer wants,
Demographic and social/cultural trends,
Technological innovation,
Capital availability, and
Regulatory and political trends.
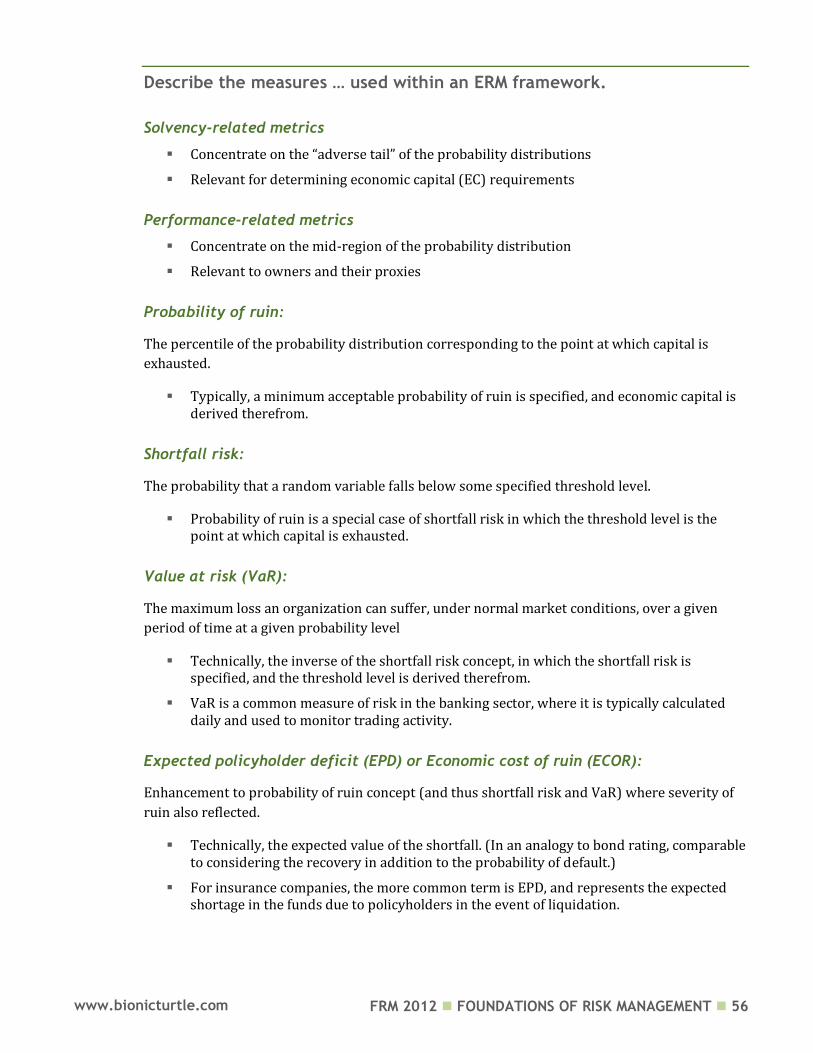
FRM 2012 FOUNDATIONS OF RISK MANAGEMENT 56 www.bionicturtle.com
Describe the measures … used within an ERM framework.
Solvency-related metrics
Concentrate on the “adverse tail” of the probability distributions
Relevant for determining economic capital (EC) requirements
Performance-related metrics
Concentrate on the mid-region of the probability distribution
Relevant to owners and their proxies
Probability of ruin:
The percentile of the probability distribution corresponding to the point at which capital is
exhausted.
Typically, a minimum acceptable probability of ruin is specified, and economic capital is derived therefrom.
Shortfall risk:
The probability that a random variable falls below some specified threshold level.
Probability of ruin is a special case of shortfall risk in which the threshold level is the point at which capital is exhausted.
Value at risk (VaR):
The maximum loss an organization can suffer, under normal market conditions, over a given
period of time at a given probability level
Technically, the inverse of the shortfall risk concept, in which the shortfall risk is specified, and the threshold level is derived therefrom.
VaR is a common measure of risk in the banking sector, where it is typically calculated daily and used to monitor trading activity.
Expected policyholder deficit (EPD) or Economic cost of ruin (ECOR):
Enhancement to probability of ruin concept (and thus shortfall risk and VaR) where severity of
ruin also reflected.
Technically, the expected value of the shortfall. (In an analogy to bond rating, comparable to considering the recovery in addition to the probability of default.)
For insurance companies, the more common term is EPD, and represents the expected shortage in the funds due to policyholders in the event of liquidation.

FRM 2012 FOUNDATIONS OF RISK MANAGEMENT 57 www.bionicturtle.com
Analytical
Simulation
Statistical Structural
Tail Value at Risk (Tail VaR) or Tail Conditional Expectation (TCE):
an ECOR-like measure in the sense that both the probability and the cost of “tail events” are
considered. It differs from ECOR in that it is the expected value, from first dollar, of all events
beyond the tail threshold event, not just the shortfall amount.
Performance-related metrics:
Variance: average squared difference between a random variable and its mean.
Standard deviation: square root of the variance.
Semi-variance and downside standard deviation: only unfavorable deviations from a specified target level are considered in the calculation.
Below-target-risk (BTR): expected value of unfavorable deviations of a random variable from a specified target level (such as not meeting an earnings target).
Describe the models … typically used within an ERM framework.
“As a practical matter, the choice of modeling approach is typically between statistical analytic
models and structural simulation models”
Continuum of model methods: from “objective” data to experts
Rating agency models
RBC
Some option pricing models
DFA

FRM 2012 FOUNDATIONS OF RISK MANAGEMENT 58 www.bionicturtle.com
Describe the … tools typically used within an ERM framework.
Generic applications
Optimization: formal process by which decisions are made under conditions of uncertainty
Candidate analysis: a restricted form of optimization analysis in which only a finite number of prespecified decision options are considered
Capital management
Capital adequacy: minimum needed to satisfy economic capital (EC) constraint
Capital structure: optimal mix
Capital attribution: assignment by risk (denominator of RAROC)
Capital allocation: actual deployment to business segments
Tools typically used within an ERM framework.
Performance measurement
Investment strategy/asset allocation
Insurance/reinsurance/hedging strategy optimization
Crisis management
Contingency planning
Business expansion/contraction strategy
Distribution channel strategy
Strategic planning
Historical Data Analysis
Empirical distributions
Extreme value theory (EVT)
Regressions
Combination
System dynamics simulation
Fuzzy logic
Expert Input
Preference among bets
Judgments of Relative Likelihood
Influence diagram
Delphi Method
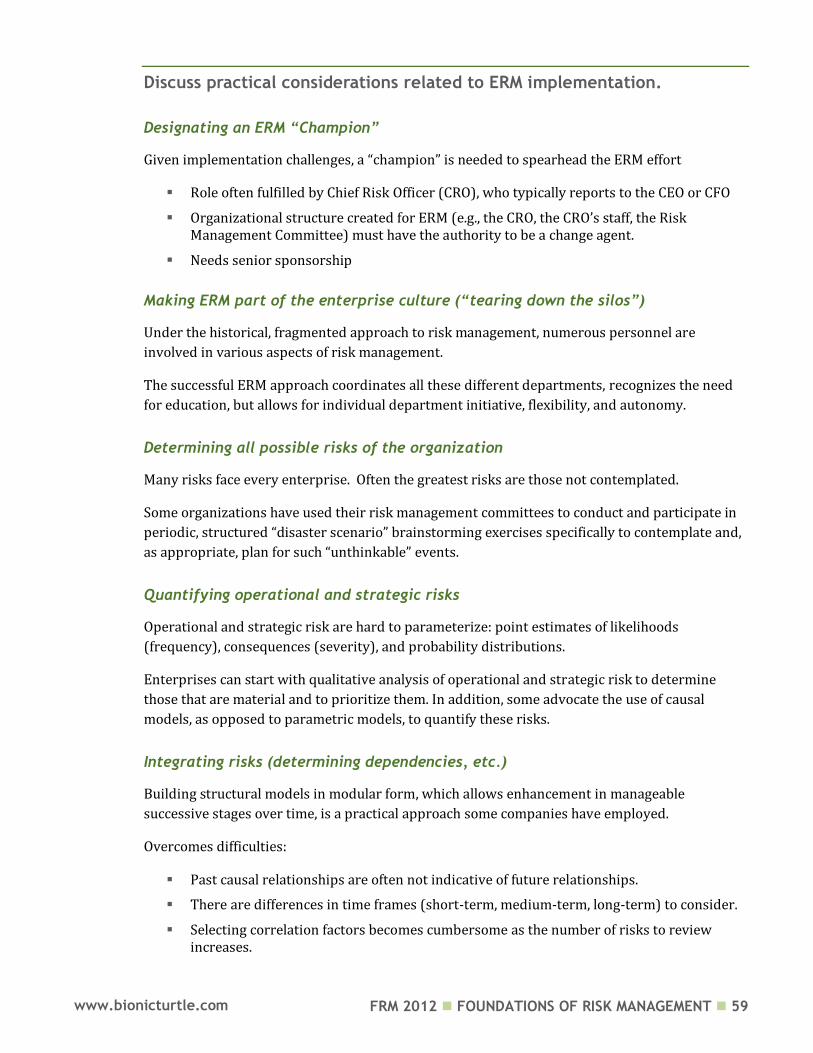
FRM 2012 FOUNDATIONS OF RISK MANAGEMENT 59 www.bionicturtle.com
Discuss practical considerations related to ERM implementation.
Designating an ERM “Champion”
Given implementation challenges, a “champion” is needed to spearhead the ERM effort
Role often fulfilled by Chief Risk Officer (CRO), who typically reports to the CEO or CFO
Organizational structure created for ERM (e.g., the CRO, the CRO’s staff, the Risk Management Committee) must have the authority to be a change agent.
Needs senior sponsorship
Making ERM part of the enterprise culture (“tearing down the silos”)
Under the historical, fragmented approach to risk management, numerous personnel are
involved in various aspects of risk management.
The successful ERM approach coordinates all these different departments, recognizes the need
for education, but allows for individual department initiative, flexibility, and autonomy.
Determining all possible risks of the organization
Many risks face every enterprise. Often the greatest risks are those not contemplated.
Some organizations have used their risk management committees to conduct and participate in
periodic, structured “disaster scenario” brainstorming exercises specifically to contemplate and,
as appropriate, plan for such “unthinkable” events.
Quantifying operational and strategic risks
Operational and strategic risk are hard to parameterize: point estimates of likelihoods
(frequency), consequences (severity), and probability distributions.
Enterprises can start with qualitative analysis of operational and strategic risk to determine
those that are material and to prioritize them. In addition, some advocate the use of causal
models, as opposed to parametric models, to quantify these risks.
Integrating risks (determining dependencies, etc.)
Building structural models in modular form, which allows enhancement in manageable
successive stages over time, is a practical approach some companies have employed.
Overcomes difficulties:
Past causal relationships are often not indicative of future relationships.
There are differences in time frames (short-term, medium-term, long-term) to consider.
Selecting correlation factors becomes cumbersome as the number of risks to review increases.

FRM 2012 FOUNDATIONS OF RISK MANAGEMENT 60 www.bionicturtle.com
Lack of appropriate risk transfer mechanisms
Insurance, reinsurance and capital markets markets are not complete in the sense of being able
to provide all products and services that enterprises may need.
These markets need to continue to evolve over time (such as the development of the alternative
risk market for hazard risks) in order to provide products that will meet the risk transfer needs
of enterprises. Risk transfer mechanisms for operational and strategic risks are even less
mature.
Monitoring the Process
Ideally, ERM is not a one-time “project”, but a discipline that evolves over time as risks and
opportunities within an enterprise change.
The successful ERM process will include regular progress reports and comparisons to previous
risk assessments so changes and refinements can be made as appropriate. Regularly monitoring
results can, and should, be tied to the time scales identified for the risks actively managed.
Start Slowly - Build Upon Successes
Because of the traditional, fragmented approach to risk management described earlier and the
complexity of many businesses, enterprises often find it useful to start their ERM initiative
slowly, tackling smaller projects first, so tangible results can be achieved early.
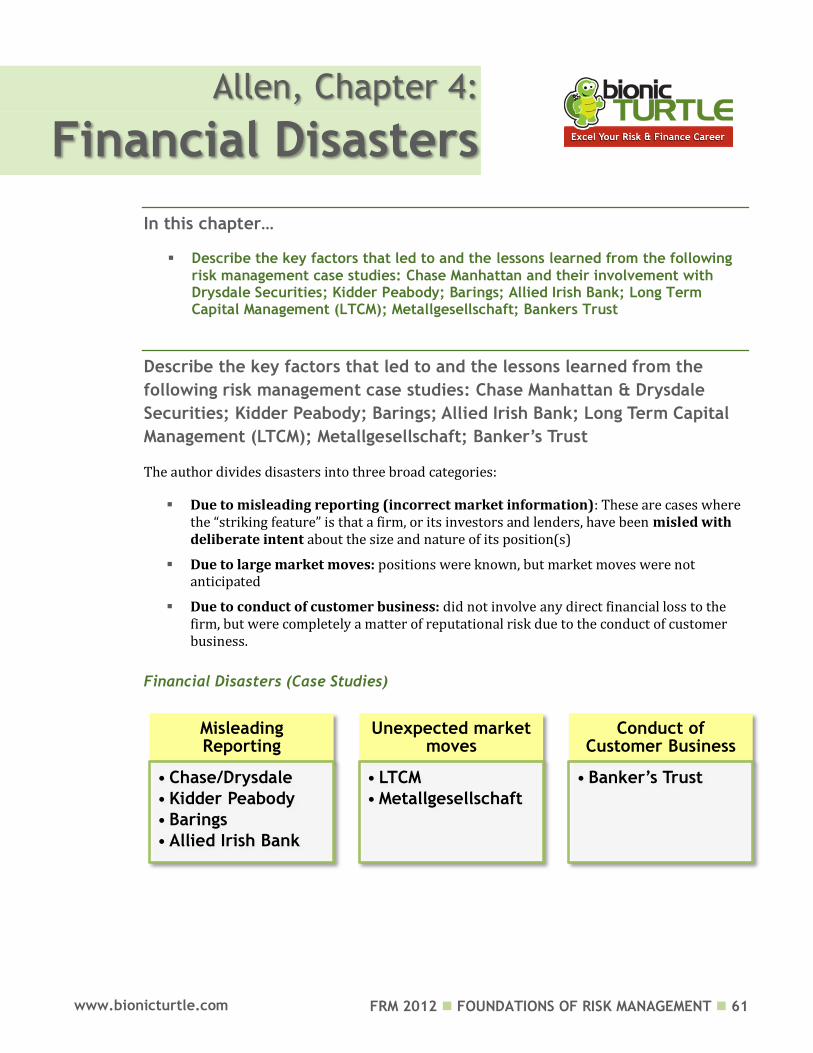
FRM 2012 FOUNDATIONS OF RISK MANAGEMENT 61 www.bionicturtle.com
Allen, Chapter 4:
Financial Disasters
In this chapter…
Describe the key factors that led to and the lessons learned from the following risk management case studies: Chase Manhattan and their involvement with Drysdale Securities; Kidder Peabody; Barings; Allied Irish Bank; Long Term Capital Management (LTCM); Metallgesellschaft; Bankers Trust
Describe the key factors that led to and the lessons learned from the
following risk management case studies: Chase Manhattan & Drysdale
Securities; Kidder Peabody; Barings; Allied Irish Bank; Long Term Capital
Management (LTCM); Metallgesellschaft; Banker’s Trust
The author divides disasters into three broad categories:
Due to misleading reporting (incorrect market information): These are cases where the “striking feature” is that a firm, or its investors and lenders, have been misled with deliberate intent about the size and nature of its position(s)
Due to large market moves: positions were known, but market moves were not anticipated
Due to conduct of customer business: did not involve any direct financial loss to the firm, but were completely a matter of reputational risk due to the conduct of customer business.
Financial Disasters (Case Studies)
Misleading Reporting
• Chase/Drysdale
• Kidder Peabody
• Barings
• Allied Irish Bank
Unexpected market moves
• LTCM
• Metallgesellschaft
Conduct of Customer Business
• Banker’s Trust

FRM 2012 FOUNDATIONS OF RISK MANAGEMENT 62 www.bionicturtle.com
Drysdale Securities (Chase Manhattan)
During three months in 1976, Drysdale, a subsidiary of Chase (an established firm), obtained unsecured borrowing of ~$300 million by exploiting a flaw in the market practices for computing the value of U.S. government bond collateral.
But Drysdale only had $20 million in capital. This unsecured borrowing exceeded any amount for which they would have been approved.
Drysdale used the borrowed money to take outright positions in bond markets.
When they lost money on the positions they put on, they lacked cash with which to pay back their borrowings.
Drysdale went bankrupt, losing virtually all of the $300 million in unsecured borrowings.
Chase Manhattan absorbed almost all of these losses because they had brokered most of Drysdale's securities borrowings.
Although Chase employees believed they were only acting as agents on these transactions and were not taking any direct risk on behalf of Chase, the legal documentation of the securities borrowings did not support their claim.
Chase experienced reputational damage and an impact on to their stock price
Drysdale: Key Factors
Chase failed to detect the unauthorized positions: Chase did not believe the firm’s capital was a risk.
Inexperienced managers
Did not correctly interpret borrowing agreements that made Chase responsible for payments due.
Drysdale: Lessons Learned
More precise methods for computing the value of collateral. “The securities industry as a whole learned that it needed to make its methods for computing collateral value on bond borrowings more precise.”
Better process control. New products should receive prior approval from the Risk Function. “Chase, and other firms who may have had similar control deficiencies, learned the need for a process that forced areas contemplating new product offerings to receive prior approval from representatives of the principal risk control functions within the firm.”
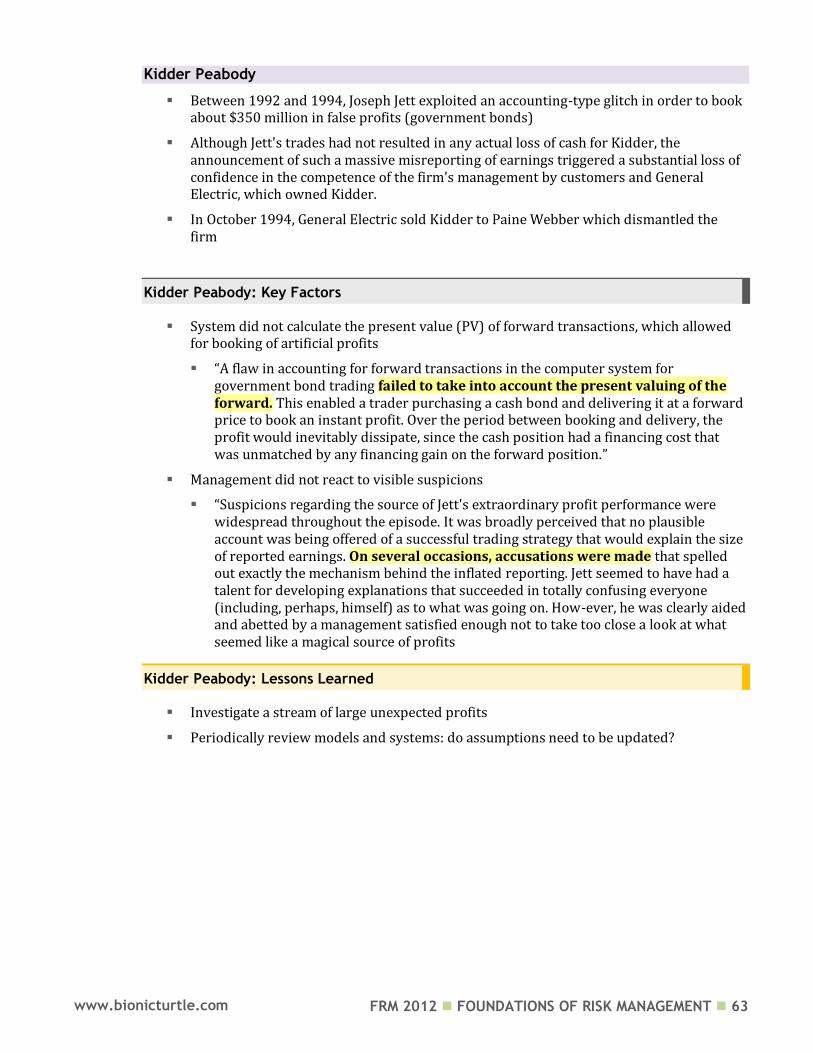
FRM 2012 FOUNDATIONS OF RISK MANAGEMENT 63 www.bionicturtle.com
Kidder Peabody
Between 1992 and 1994, Joseph Jett exploited an accounting-type glitch in order to book about $350 million in false profits (government bonds)
Although Jett's trades had not resulted in any actual loss of cash for Kidder, the announcement of such a massive misreporting of earnings triggered a substantial loss of confidence in the competence of the firm's management by customers and General Electric, which owned Kidder.
In October 1994, General Electric sold Kidder to Paine Webber which dismantled the firm
Kidder Peabody: Key Factors
System did not calculate the present value (PV) of forward transactions, which allowed for booking of artificial profits
“A flaw in accounting for forward transactions in the computer system for government bond trading failed to take into account the present valuing of the forward. This enabled a trader purchasing a cash bond and delivering it at a forward price to book an instant profit. Over the period between booking and delivery, the profit would inevitably dissipate, since the cash position had a financing cost that was unmatched by any financing gain on the forward position.”
Management did not react to visible suspicions
“Suspicions regarding the source of Jett's extraordinary profit performance were widespread throughout the episode. It was broadly perceived that no plausible account was being offered of a successful trading strategy that would explain the size of reported earnings. On several occasions, accusations were made that spelled out exactly the mechanism behind the inflated reporting. Jett seemed to have had a talent for developing explanations that succeeded in totally confusing everyone (including, perhaps, himself) as to what was going on. How-ever, he was clearly aided and abetted by a management satisfied enough not to take too close a look at what seemed like a magical source of profits
Kidder Peabody: Lessons Learned
Investigate a stream of large unexpected profits
Periodically review models and systems: do assumptions need to be updated?
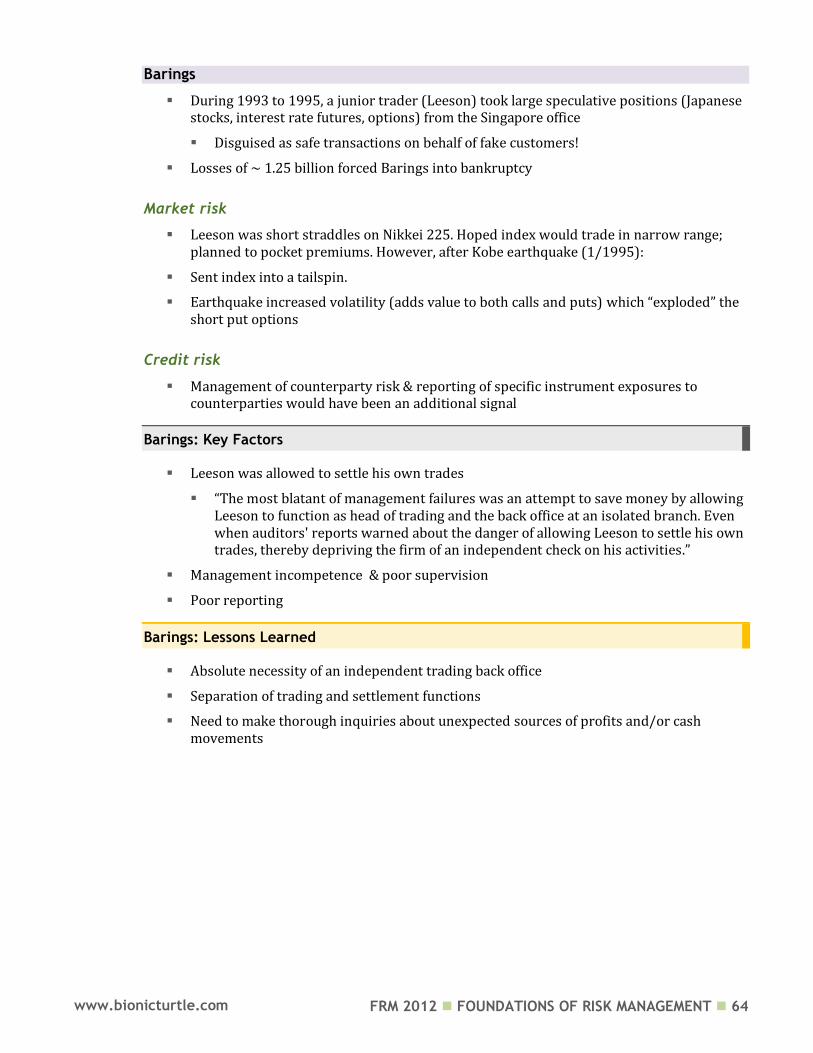
FRM 2012 FOUNDATIONS OF RISK MANAGEMENT 64 www.bionicturtle.com
Barings
During 1993 to 1995, a junior trader (Leeson) took large speculative positions (Japanese stocks, interest rate futures, options) from the Singapore office
Disguised as safe transactions on behalf of fake customers!
Losses of ~ 1.25 billion forced Barings into bankruptcy
Market risk
Leeson was short straddles on Nikkei 225. Hoped index would trade in narrow range; planned to pocket premiums. However, after Kobe earthquake (1/1995):
Sent index into a tailspin.
Earthquake increased volatility (adds value to both calls and puts) which “exploded” the short put options
Credit risk
Management of counterparty risk & reporting of specific instrument exposures to counterparties would have been an additional signal
Barings: Key Factors
Leeson was allowed to settle his own trades
“The most blatant of management failures was an attempt to save money by allowing Leeson to function as head of trading and the back office at an isolated branch. Even when auditors' reports warned about the danger of allowing Leeson to settle his own trades, thereby depriving the firm of an independent check on his activities.”
Management incompetence & poor supervision
Poor reporting
Barings: Lessons Learned
Absolute necessity of an independent trading back office
Separation of trading and settlement functions
Need to make thorough inquiries about unexpected sources of profits and/or cash movements
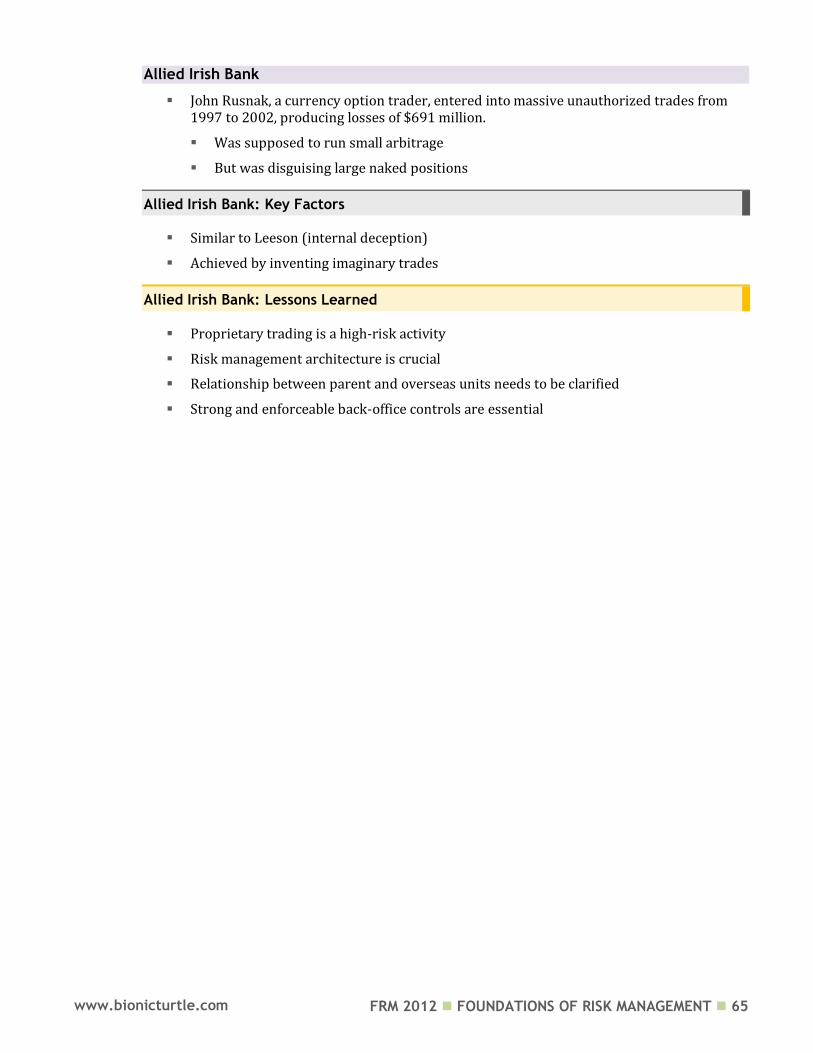
FRM 2012 FOUNDATIONS OF RISK MANAGEMENT 65 www.bionicturtle.com
Allied Irish Bank
John Rusnak, a currency option trader, entered into massive unauthorized trades from 1997 to 2002, producing losses of $691 million.
Was supposed to run small arbitrage
But was disguising large naked positions
Allied Irish Bank: Key Factors
Similar to Leeson (internal deception)
Achieved by inventing imaginary trades
Allied Irish Bank: Lessons Learned
Proprietary trading is a high-risk activity
Risk management architecture is crucial
Relationship between parent and overseas units needs to be clarified
Strong and enforceable back-office controls are essential
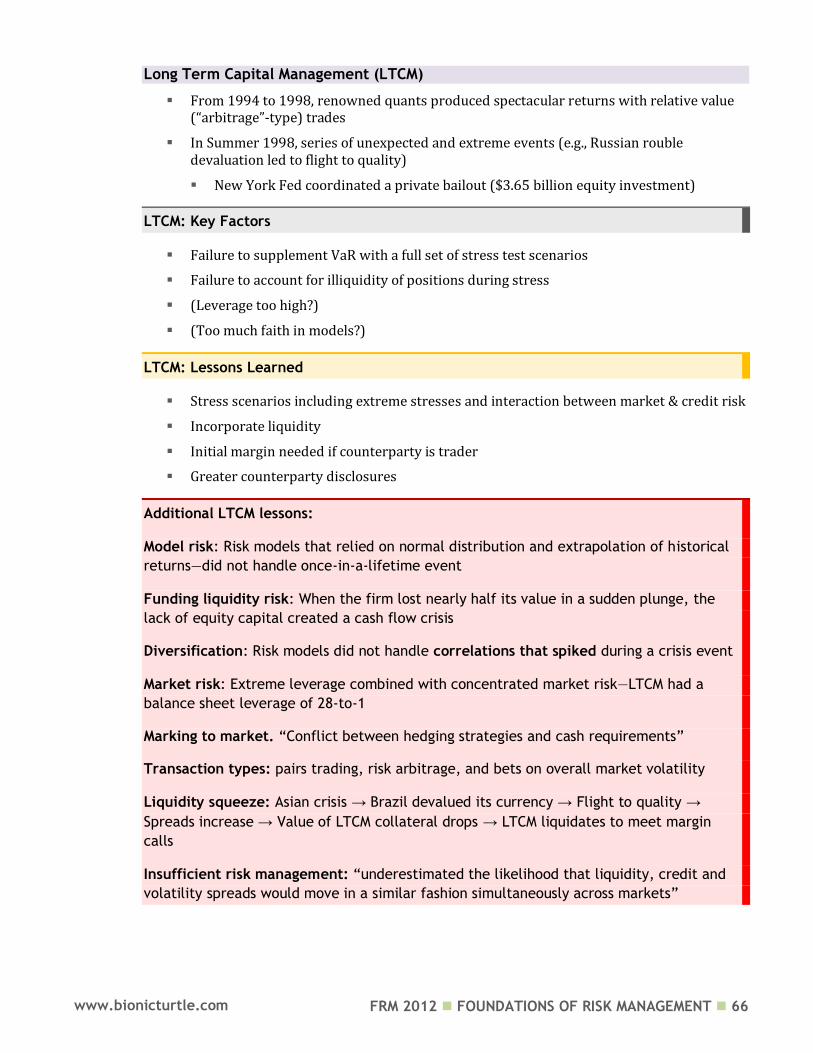
FRM 2012 FOUNDATIONS OF RISK MANAGEMENT 66 www.bionicturtle.com
Long Term Capital Management (LTCM)
From 1994 to 1998, renowned quants produced spectacular returns with relative value (“arbitrage”-type) trades
In Summer 1998, series of unexpected and extreme events (e.g., Russian rouble devaluation led to flight to quality)
New York Fed coordinated a private bailout ($3.65 billion equity investment)
LTCM: Key Factors
Failure to supplement VaR with a full set of stress test scenarios
Failure to account for illiquidity of positions during stress
(Leverage too high?)
(Too much faith in models?)
LTCM: Lessons Learned
Stress scenarios including extreme stresses and interaction between market & credit risk
Incorporate liquidity
Initial margin needed if counterparty is trader
Greater counterparty disclosures
Additional LTCM lessons:
Model risk: Risk models that relied on normal distribution and extrapolation of historical
returns—did not handle once-in-a-lifetime event
Funding liquidity risk: When the firm lost nearly half its value in a sudden plunge, the
lack of equity capital created a cash flow crisis
Diversification: Risk models did not handle correlations that spiked during a crisis event
Market risk: Extreme leverage combined with concentrated market risk—LTCM had a
balance sheet leverage of 28-to-1
Marking to market. “Conflict between hedging strategies and cash requirements”
Transaction types: pairs trading, risk arbitrage, and bets on overall market volatility
Liquidity squeeze: Asian crisis → Brazil devalued its currency → Flight to quality →
Spreads increase → Value of LTCM collateral drops → LTCM liquidates to meet margin
calls
Insufficient risk management: “underestimated the likelihood that liquidity, credit and
volatility spreads would move in a similar fashion simultaneously across markets”

FRM 2012 FOUNDATIONS OF RISK MANAGEMENT 67 www.bionicturtle.com
Metallgesellschaft
MGRM wrote (sold) long-term forward contracts to sell gas/oil
Hedged with long positions in short-term futures (stack-and-roll hedge)
As spot oil prices dropped, oil futures curve shifted to contango
In 1993, creditors rescued with a $1.9 billion package
Metallgesellschaft: Key Factors
1) First factor was that the market shifted to contango (i.e., futures price is greater than
the spot price) that exploited the basis risk.
Stack-and-roll hedge exposes to basis risk
Shift to contango created losses on roll return
Greatly increased the cost of the stack-and-roll hedge.
Led to cash flow (liquidity) problems
2) Second factor was German accounting methods required Metallgesellschaft to show
futures losses (i.e., from hedge) but could not recognize unrealized gains from the
forward.
Accounting standards required recognition of futures losses but not forward gains!
These reported losses triggered margin calls and a panic, which led to credit rating downgrades.
Metallgesellschaft: Lessons Learned
Short-term hedge against long-term contracts requires liquidity
Uncertainty of roll returns
Liquidity consideration may favor other than minimum variance hedge
Metallgesellschaft
Basis risk
Liquidity risk
Operational risk
Shift!
FRM 2012 FOUNDATIONS OF RISK MANAGEMENT 68 www.bionicturtle.com
Banker’s Trust (BT)
To reducing their funding expenses, Proctor & Gamble (P&G) and Gibson Greetings bought complex derivative products offered by BT
Due to losses (e.g., P&G lost >$100 million in 1994), customers sued BT
Claimed they were exploited because they were not sophisticated enough to understand their risks
Banker’s Trust: Key Factors
Complex derivatives
Evidence of some intent to deceive (Discovery evidence)
Banker’s Trust: Lessons Learned
Better controls for matching complexity of trade with client sophistication
Need to provision price quotes independent of the front office
Implications of internal communications that can later be made public
FRM 2012 FOUNDATIONS OF RISK MANAGEMENT 69 www.bionicturtle.com
René Stulz,”
Risk Management Failures
What and When
In this chapter…
Define the role of risk management and explain why a large financial loss is not necessarily a failure of risk management.
Describe how risk management can fail. Describe how risk can be mismeasured. Explain how a firm can fail to take known and unknown risks into account in
making strategic decisions. Explain the importance of communication in effective risk management. Describe how firms can fail to correctly monitor and manage risk on an ongoing
basis. Explain the role of risk metrics and discuss the shortcomings of existing risk
metrics.
Define the role of risk management and explain why a large financial loss
is not necessarily a failure of risk
To assess risks faced by firm,
Communicate risks to risk-taking decision-makers
Manage and monitor risks to ensure firm only bears risks desired by management and board of directors
But Board and Management decide to take the risks!
The articulation of risk appetite is a Board-level decision.
Why a large loss is not necessarily a failure of risk management
Stulz images a simplified example of an investor in Long-term Capital Management (LTCM)
before its collapse in September 1998. “Suppose that you stood in the shoes of the managers of
LTCM in January 1998 and had the opportunity to invest in trades that, overall, had a 99%
chance of producing a return for the fund before fees of 25% and a 1% chance of making a loss of
70% over the coming year.”
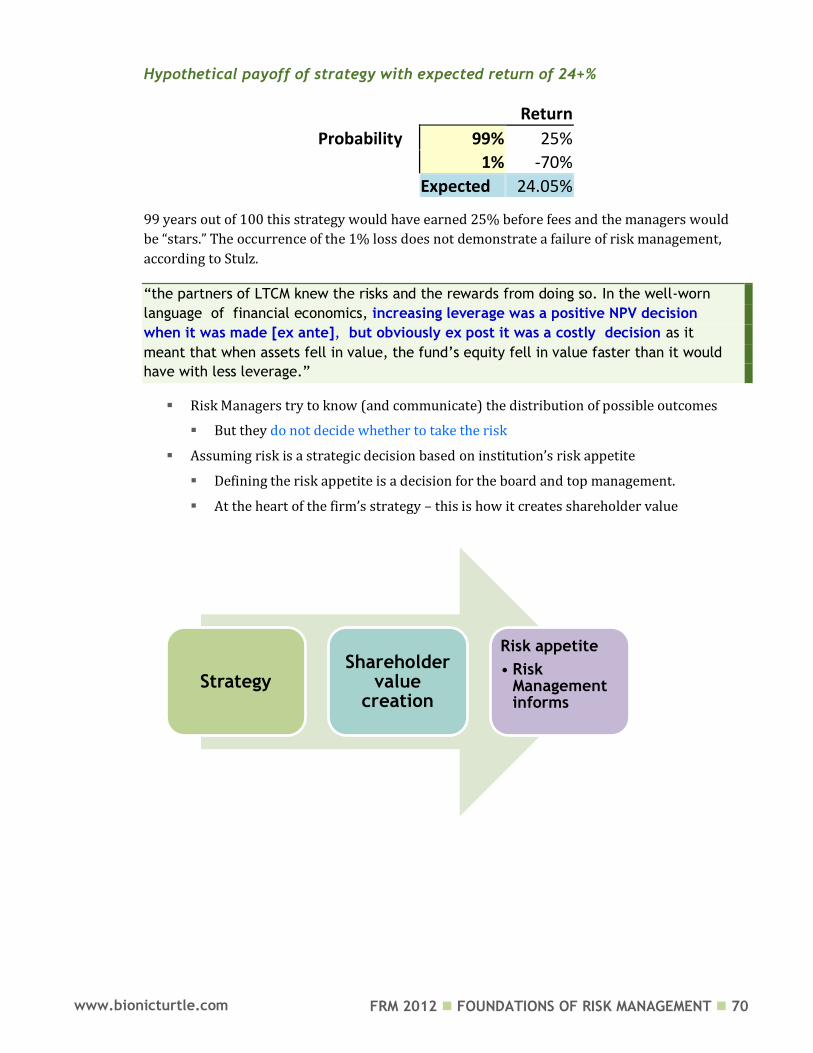
FRM 2012 FOUNDATIONS OF RISK MANAGEMENT 70 www.bionicturtle.com
Hypothetical payoff of strategy with expected return of 24+%
Return
Probability 99% 25%
1% -70%
Expected 24.05%
99 years out of 100 this strategy would have earned 25% before fees and the managers would
be “stars.” The occurrence of the 1% loss does not demonstrate a failure of risk management,
according to Stulz.
“the partners of LTCM knew the risks and the rewards from doing so. In the well-worn
language of financial economics, increasing leverage was a positive NPV decision
when it was made [ex ante], but obviously ex post it was a costly decision as it
meant that when assets fell in value, the fund’s equity fell in value faster than it would
have with less leverage.”
Risk Managers try to know (and communicate) the distribution of possible outcomes
But they do not decide whether to take the risk
Assuming risk is a strategic decision based on institution’s risk appetite
Defining the risk appetite is a decision for the board and top management.
At the heart of the firm’s strategy – this is how it creates shareholder value
Strategy Shareholder
value creation
Risk appetite
• Risk Management informs
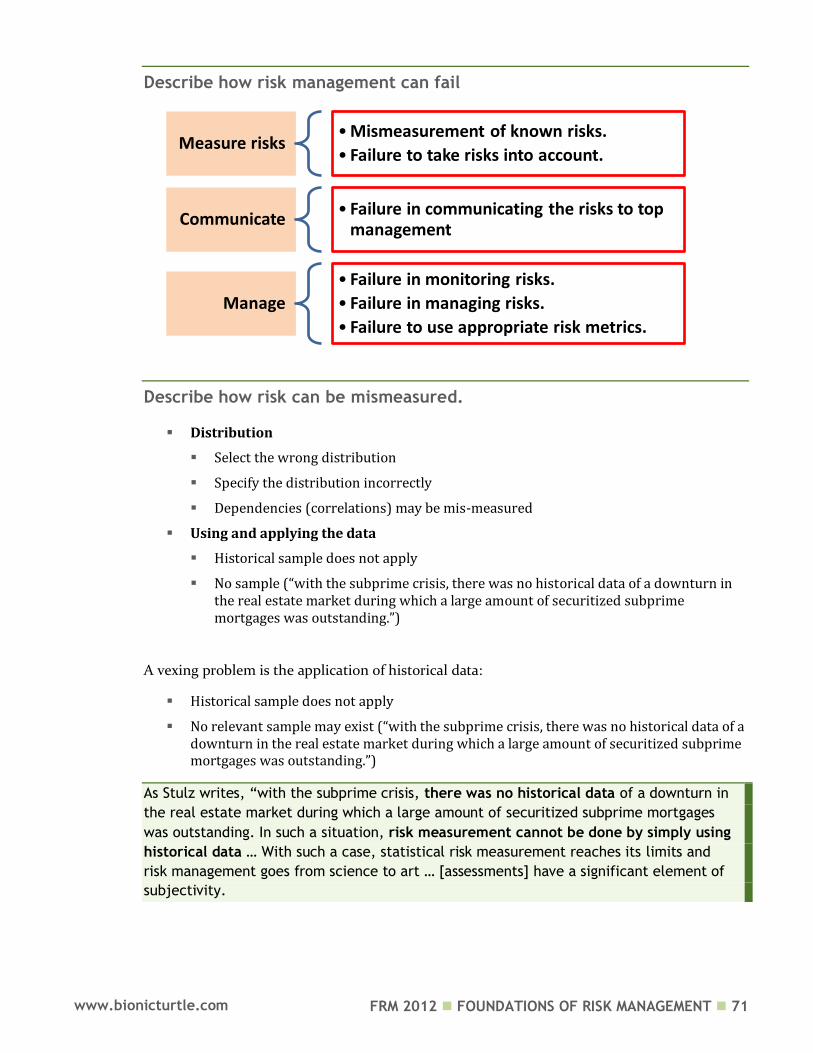
FRM 2012 FOUNDATIONS OF RISK MANAGEMENT 71 www.bionicturtle.com
Describe how risk management can fail
Describe how risk can be mismeasured.
Distribution
Select the wrong distribution
Specify the distribution incorrectly
Dependencies (correlations) may be mis-measured
Using and applying the data
Historical sample does not apply
No sample (“with the subprime crisis, there was no historical data of a downturn in the real estate market during which a large amount of securitized subprime mortgages was outstanding.”)
A vexing problem is the application of historical data:
Historical sample does not apply
No relevant sample may exist (“with the subprime crisis, there was no historical data of a downturn in the real estate market during which a large amount of securitized subprime mortgages was outstanding.”)
As Stulz writes, “with the subprime crisis, there was no historical data of a downturn in
the real estate market during which a large amount of securitized subprime mortgages
was outstanding. In such a situation, risk measurement cannot be done by simply using
historical data … With such a case, statistical risk measurement reaches its limits and
risk management goes from science to art … [assessments] have a significant element of
subjectivity.
Measure risks • Mismeasurement of known risks.
• Failure to take risks into account.
Communicate • Failure in communicating the risks to top
management
Manage
• Failure in monitoring risks.
• Failure in managing risks.
• Failure to use appropriate risk metrics.
FRM 2012 FOUNDATIONS OF RISK MANAGEMENT 72 www.bionicturtle.com
Explain how a firm can fail to take known and unknown risks into account
in making strategic decisions.
1. A firm may ignore a risk even though that risk is known.
2. Somebody in the firm knows about a risk, but that risk is not captured by the risk
models.
3. Realization of a truly unknown risk
Risk divisions (typology) can contribute to ignored risks:
Credit vs. market vs. operational risk are “partly artificial and partly motivated by regulations.”
Trading books (market to market) versus credit book (accrual).
Explain the importance of communication in effective risk management.
Stulz key point here is that risk managers have a different job than the board and other top
management. Risk managers [risk management] need to provide timely information to the
board and top management, enabling them to make decisions (maximize shareholder value by
assuming risk). Communication, and the lack of effective communication, played a role in the
most recent crisis.
In short, because risk managers and senior management (including the board) have different
roles—risk managers analyze, quantify and assess risk while the Board determines what
orientation to assume vis-à-vis risk (how much? What type?)—the communication between the
two roles must be critical.
Risk management has to provide timely information to the board and top management
Top managers are supposed to maximize shareholder value by assuming risk
Lack of communication has played a role in the most recent crisis
Describe how firms can fail to correctly monitor and manage risk on an
ongoing basis
For a financial firm, risks can change sharply even if the firm does not take new positions.
Complex positions with derivatives
Challenging to capture these changes and adjust
Important for risk manager to identify possible solutions that can be implemented quickly
Contingency hedging plans are critical.
FRM 2012 FOUNDATIONS OF RISK MANAGEMENT 73 www.bionicturtle.com
Explain the role of risk metrics and discuss the shortcomings of existing
risk metrics.
Shortcomings of existing risk metrics include:
May not scale over long time horizons
Historical data samples may not predictive (history may not repeat itself)
Often, they are not designed to capture risks associated with crises (catastrophes)
In the case of Value at Risk (VaR), VaR says nothing about the magnitude of losses in excess of VaR. (“It could be that the exceedances were really small and that there were many large gains as well because volatility increased rapidly. Alternatively, there could have been very large losses and few large gains.”)
In the case of the Summer of 2007 and the abrupt withdrawal of liquidity: the risk model may not handle sudden illiquidity.
Most metrics cannot handle complicated interactions across risks and across institutions: “Statistical risk models typically take returns to be exogenous to the firm and ignore risk concentrations across institutions”
FRM 2012 FOUNDATIONS OF RISK MANAGEMENT 74 www.bionicturtle.com
GARP Code of Conduct
Describe the responsibility of each GARP member with respect to
professional integrity, ethical conduct, conflicts of interest,
confidentiality of information and adherence to generally accepted
practices in risk management.
1. Principles
1.1 Professional Integrity and Ethical Conduct. GARP Members shall act with honesty,
integrity, and competence to fulfill the risk professional's responsibilities and to uphold
the reputation of the risk management profession. GARP Members must avoid disguised
contrivances in assessments, measurements and processes that are intended to provide
business advantage at the expense of honesty and truthfulness.
1.2 Conflicts of Interest. GARP Members have a responsibility to promote the interests of all
relevant constituencies and will not knowingly perform risk management services
directly or indirectly involving an actual or potential conflict of interest unless full
disclosure has been provided to all affected parties of any actual or apparent conflict of
interest. Where conflicts are unavoidable GARP Members commit to their full disclosure
and management
1.3 Confidentiality. GARP Members will take all reasonable precautionary measures to
prevent intentional and unintentional disclosure of confidential information.
2. Professional standards
2.1 Fundamental Responsibilities
GARP Members must endeavor, and encourage others, to operate at the highest level of professional skill.
GARP Members should always continue to perfect their expertise.
GARP Members have a personal ethical responsibility and cannot out-source or delegate that responsibility to others.
FRM 2012 FOUNDATIONS OF RISK MANAGEMENT 75 www.bionicturtle.com
2.2 Best Practices
GARP Members will promote and adhere to applicable 'best practice standards', and will ensure that risk management activities performed under his/her direct supervision or management satisfies these applicable standards.
GARP Members recognize that risk management does not exist in a vacuum.
GARP Members commit to considering the wider impact of their assessments and actions on their colleagues and the wider community and environment in which they work.
2.3 Communication and Disclosure. GARP Members issuing any communications on behalf of
their firm will ensure that the communications are clear, appropriate to the circumstances and
their intended audience, and satisfy applicable standards of conduct.
Rules of Conduct
1. Professional Integrity and Ethical Conduct
GARP Members:
1.1 Shall act professionally, ethically & with integrity in all dealings with employers, existing
or potential clients, the public, and other practitioners in the financial services industry.
1.2 Shall exercise reasonable judgment in the provision of risk services while maintaining
independence of thought and direction. GARP Members must not offer, solicit, or accept
any gift, benefit, compensation, or consideration that could be reasonably expected to
compromise their own or another's independence and objectivity.
1.3 Must take reasonable precautions to ensure that the Member's services are not used for
improper, fraudulent or illegal purposes.
1.4 Shall not knowingly misrepresent details relating to analysis, recommendations, actions,
or other professional activities.
1.5 Shall not engage in any professional conduct involving dishonesty or deception or
engage in any act that reflects negatively on their integrity, character, trustworthiness, or
professional ability or on the risk management profession.
1.6 Shall not engage in any conduct or commit any act that compromises the integrity of the
GARP, the (Financial Risk Manager) FRM® designation or the integrity or validity of the
examinations leading to the award of the right to use the FRM designation or any other
credentials that may beoffered by GARP.
1.7 Shall endeavor to be mindful of cultural differences regarding ethical behavior and
customs, and to avoid any actions that are, or may have the appearance of being
unethical according to local customs. If there appears to be a conflict or overlap of
standards, the GARP member should always seek to apply the higher standard.
FRM 2012 FOUNDATIONS OF RISK MANAGEMENT 76 www.bionicturtle.com
2. Conflict of Interest
GARP Members shall:
2.1 Act fairly in all situations and must fully disclose any actual or potential conflict to all
affected parties.
2.2 Make full and fair disclosure of all matters that could reasonably be expected to impair
their independence and objectivity or interfere with their respective duties to their
employer, clients, and prospective clients.
3. Confidentiality
GARP Members:
3.1 Shall not make use of confidential information for inappropriate purposes and unless
having received prior consent shall maintain the confidentiality of their work, their
employer or client.
3.2 Must not use confidential information to benefit personally.
4. Fundamental Responsibilities
GARP Members shall:
4.1 Comply with all applicable laws, rules, and regulations (including this Code) governing
the GARP Members' professional activities and shall not knowingly participate or assist
in any violation of such laws, rules, or regulations.
4.2 Have ethical responsibilities and cannot out-source or delegate those responsibilities to
others.
4.3 Understand the needs and complexity of their employer or client, and should provide
appropriate and suitable risk management services and advice.
4.4 Be diligent about not overstating the accuracy or certainty of results or conclusions.
4.5 Clearly disclose the relevant limits of their specific knowledge and expertise concerning
risk assessment, industry practices and applicable laws and regulations.
5. General Accepted Practices
GARP Members shall:
5.1 Execute all services with diligence and perform all work in a manner that is independent
from interested parties. GARP Members should collect, analyze and distribute risk
information with the highest level of professional objectivity.
5.2 Shall be familiar with current generally accepted risk management practices and shall
clearly indicate any departure from their use.

FRM 2012 FOUNDATIONS OF RISK MANAGEMENT 77 www.bionicturtle.com
5.3 Shall ensure that communications include factual data and do not contain false
information.
5.4 Shall make a distinction between fact and opinion in the presentation of analysis and
recommendations.
Describe the potential consequences of violating the GARP Code of
Conduct.
Applicability and Enforcement
Every GARP Member should know and abide by this Code. Local laws and regulations may also
impose obligations on GARP Members. Where local requirements conflict with the Code, such
requirements will have precedence.
Violation(s) of this Code by may result in, among other things, the temporary suspension or
permanent removal of the GARP Member from GARP's Membership roles, and may also include
temporarily or permanently removing from the violator the right to use or refer to having
earned the FRM designation or any other GARP granted designation following a formal
determination that such a violation has occurred.


![Financial Risk Manager - FRM- PPT[1]](https://static.documents.pub/doc/80x56/55141cc54a7959c4028b4e96/financial-risk-manager-frm-ppt1.jpg)


