From Bits to Buildings: Energy Efficiency and the Path to Exaflops Horst D. Simon Lawrence Berkeley National Laboratory and EECS Dept., UC Berkeley [email protected]26e Forum ORAP, Paris, France March 31, 2010
Transcript
From Bits to Buildings:Energy Efficiency and the Path to Exaflops
Horst D. SimonLawrence Berkeley National Laboratory
AcknowledgementsA large number of individuals have contributed to energy efficiency in computing at Berkeley Lab, UC Berkeley, and to this presentation: David Bailey (CRD), Michael Banda (CRD), Michael Bennett (ITD), ShoaibKamil (CRD), Jonathan Koomey (Stanford), Randy Katz (EECS), TsuJae King (EECS), Chuck McParland (CRD), Juan Meza (CRD), Bruce Nordman (EETD), Lenny Oliker (CRD), EkowOtoo (CRD), Vern Paxson (UCB/ICSI/CRD), DoronRotem (CRD), Dale Sartor (EETD), John Shalf (NERSC), Erich Strohmaier (CRD), Bill Tschudi (EETD), Howard Walter (NERSC), Michael Wehner (CRD), Kathy Yelick (NERSC/CRD) … and many others
Trends in Power Consumption and Energy Efficiency for HPC
Building and infrastructure problem -- continued increase in demand for computing (“buildings”)
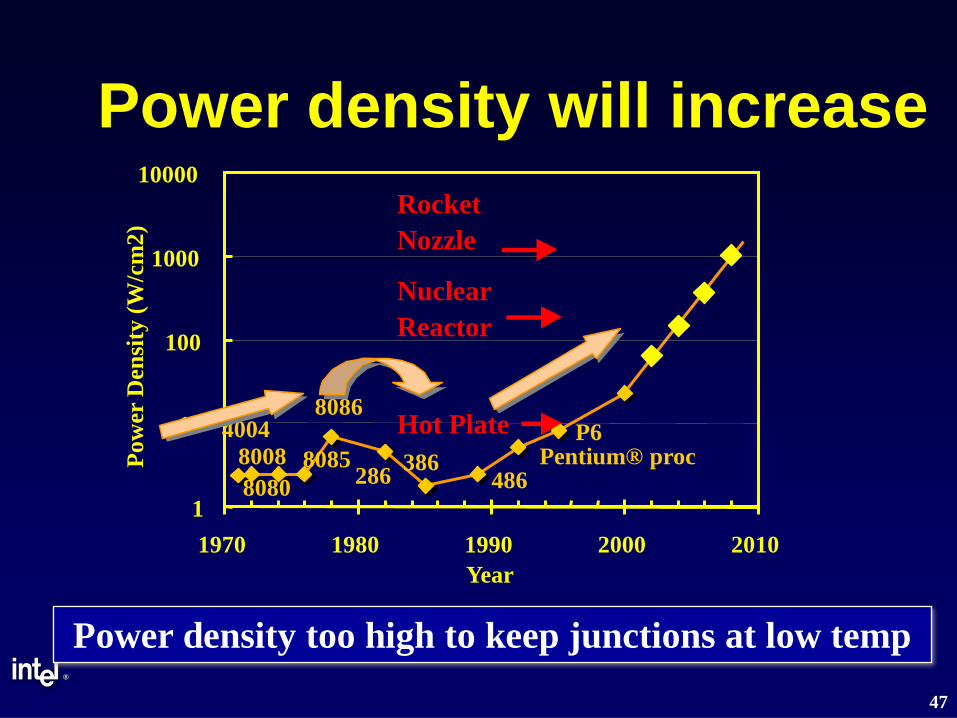
Computer technology problem --no more power density scaling (“bits”)
Summary of the Talk
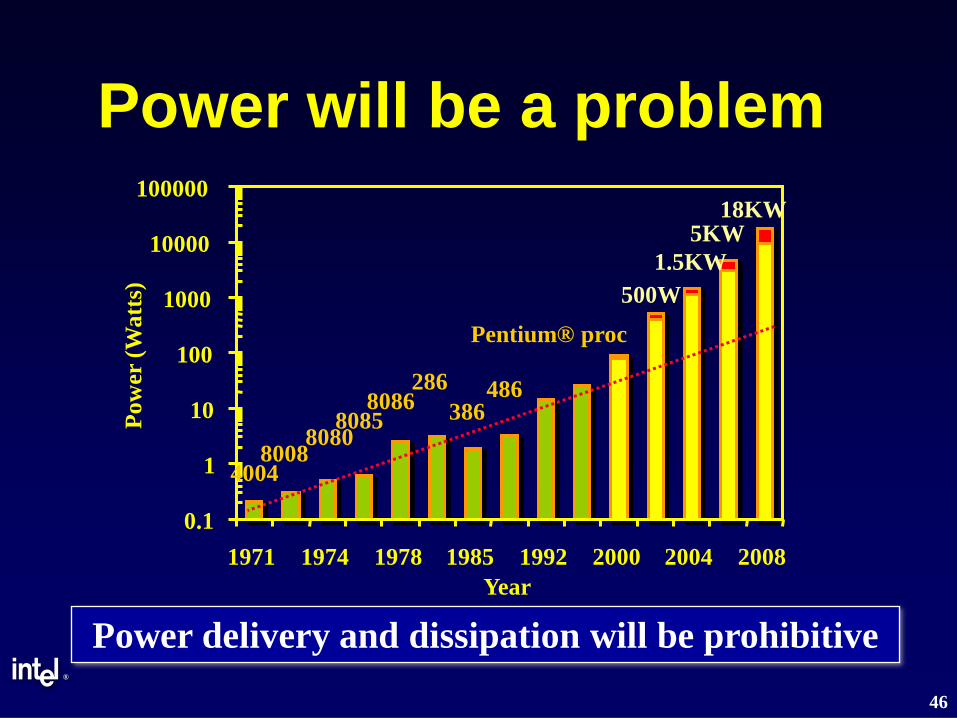
Power has become THE dominant problem in computing
EnergyProduction and Use in the U.S.
10-8-2008 5
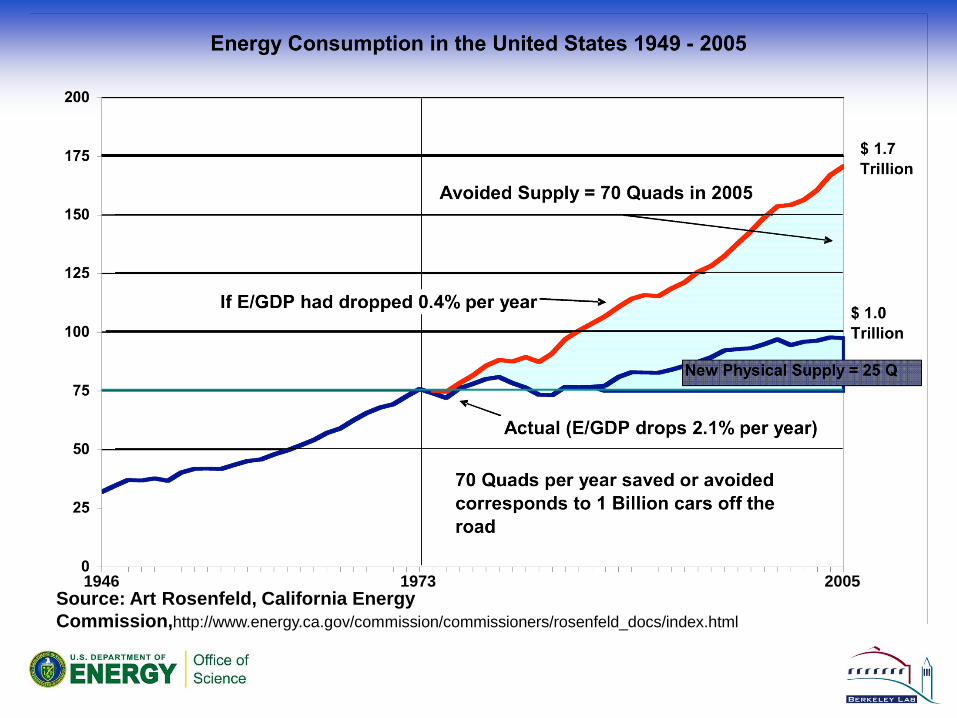
Why does saving energy matter?
Source: Art Rosenfeld, California Energy Commission,http://www.energy.ca.gov/commission/commissioners/rosenfeld_docs/index.html
1946 1973 2005
An Honest Question?
Does the HPC community really care about reducing the carbon footprint?
NO!
HPC Interests
• Energy efficiency in computer rooms– Spend more resources on computing
than on infrastructure• Energy efficient technology
– Maintain performance growth and get things done that could not be done before
Khazzoom-Brookes Postulate
• Energy efficiency at the micro-level leads to higher energy consumption at the macro-level– cheaper energy increases use– increased energy efficiency leads to
economic growth– increased efficiency in one bottleneck
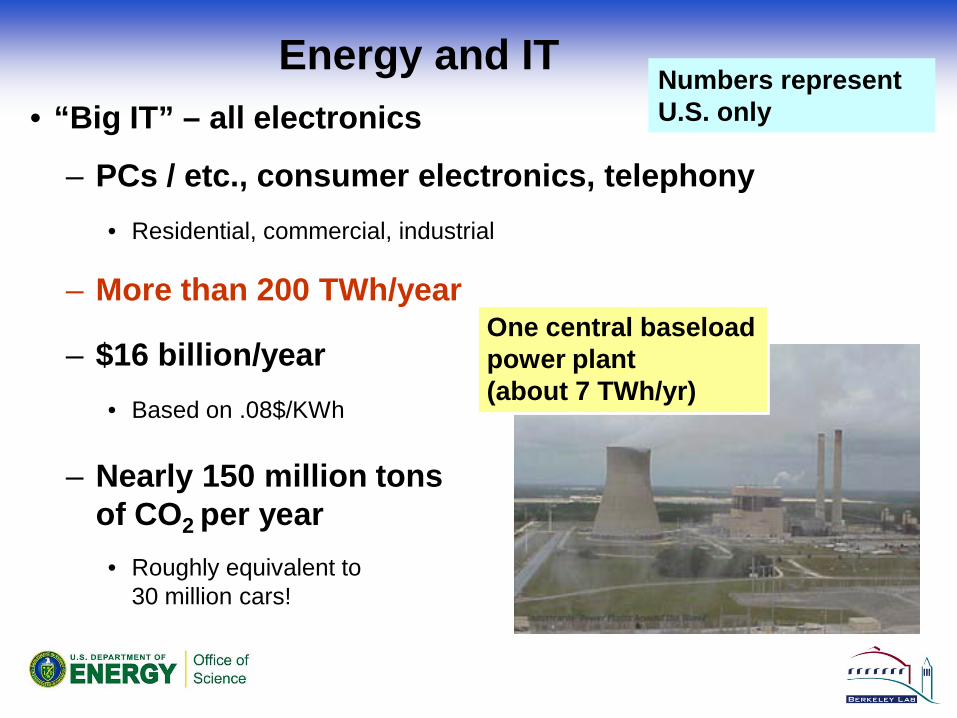
– Nearly 150 million tonsof CO2 per year• Roughly equivalent to
30 million cars!
One central baseload power plant (about 7 TWh/yr)
Numbers represent U.S. only
… and IT electricity use is increasingdata taken from: Jonathan Koomey, “Estimating Total Power Consumption by Servers in the U.S. and the World”
Available at: http://www.koomey.com/publications.html
2020 IT Carbon Footprint
14
“SMART 2020: Enabling the Low Carbon Economy in the Information Age”, The Climate Group
USAChinaTelecoms DC PCs
Datacenters: Owned by single entity interested in reducing opex
billion tons CO2
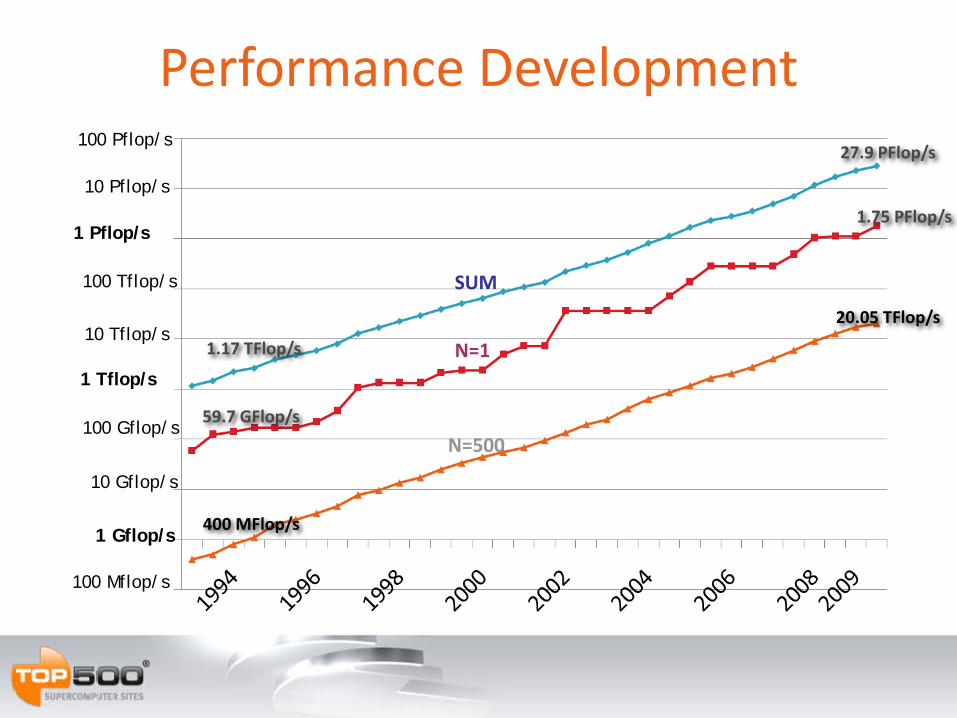
Performance Development
1 Gflop/s
1 Tflop/s
100 Mflop/s
100 Gflop/s
100 Tflop/s
10 Gflop/s
10 Tflop/s
1 Pflop/s
100 Pflop/s
10 Pflop/s
59.7 GFlop/s
400 MFlop/s
1.17 TFlop/s
1.75 PFlop/s
20.05 TFlop/s
27.9 PFlop/s
SUM
N=1
N=500
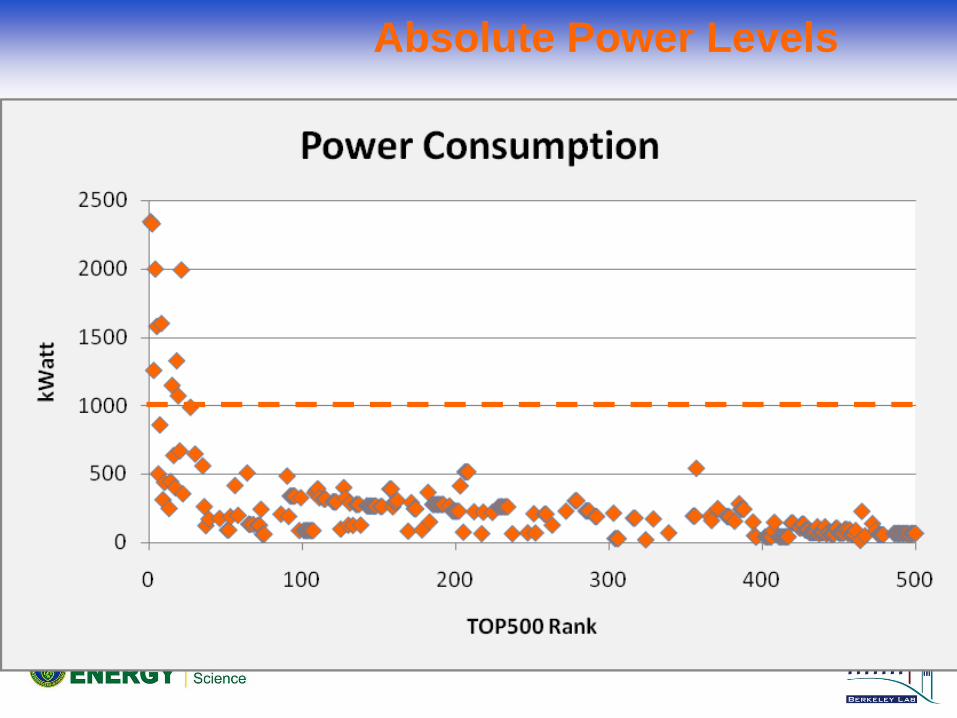
Absolute Power Levels
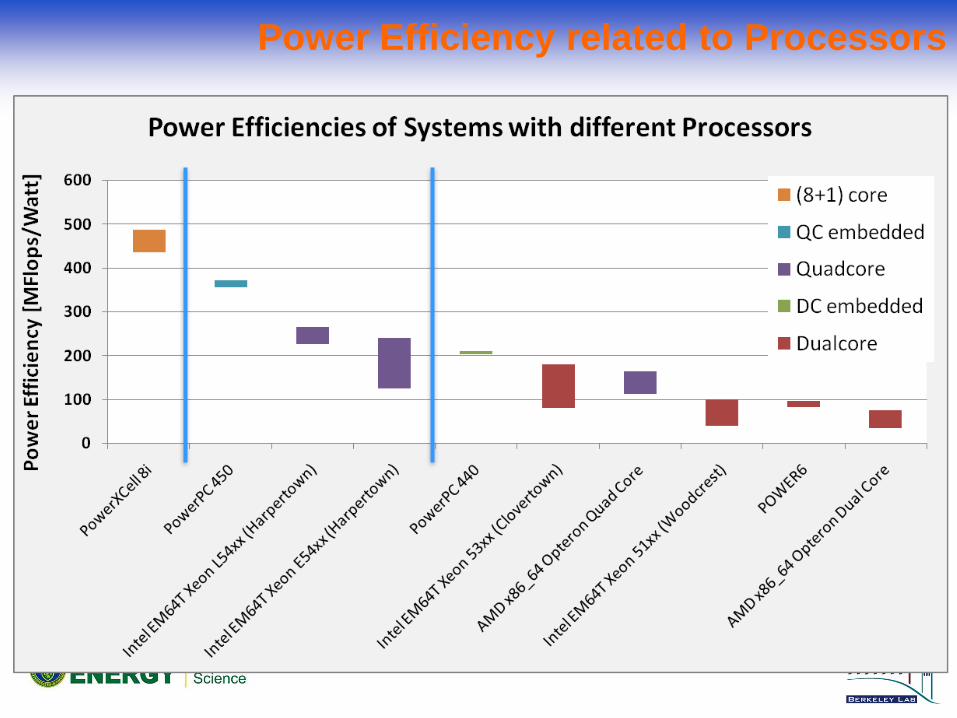
Power Efficiency related to Processors
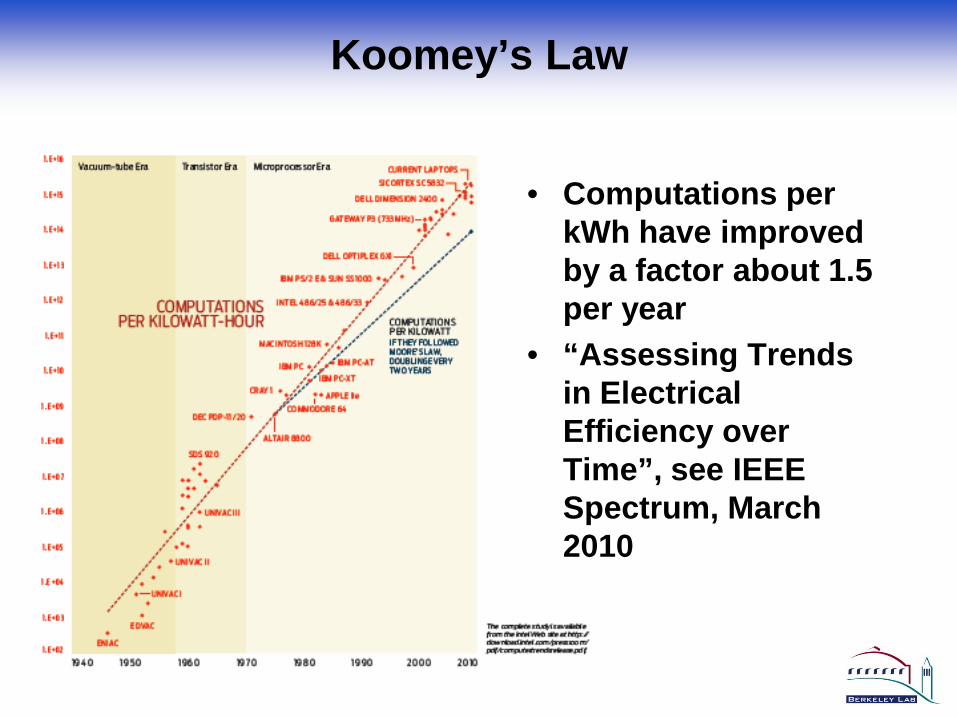
Koomey’s Law
• Computations per kWh have improved by a factor about 1.5 per year
• “Assessing Trends in Electrical Efficiency over Time”, see IEEE Spectrum, March 2010
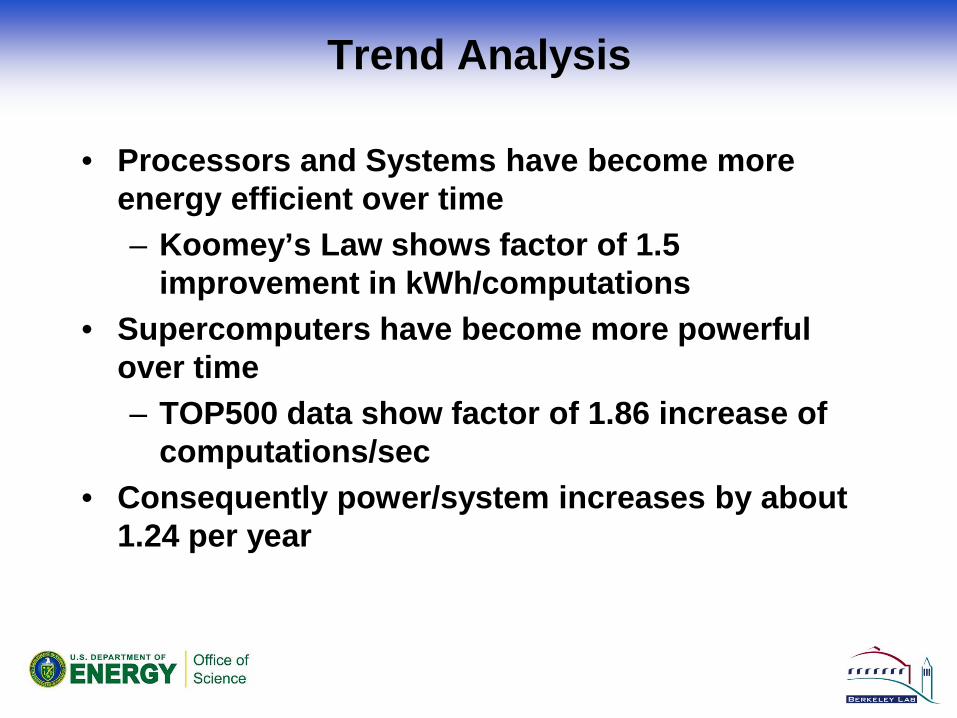
Trend Analysis
• Processors and Systems have become more energy efficient over time– Koomey’s Law shows factor of 1.5
improvement in kWh/computations• Supercomputers have become more powerful
over time– TOP500 data show factor of 1.86 increase of
computations/sec• Consequently power/system increases by about
1.24 per year
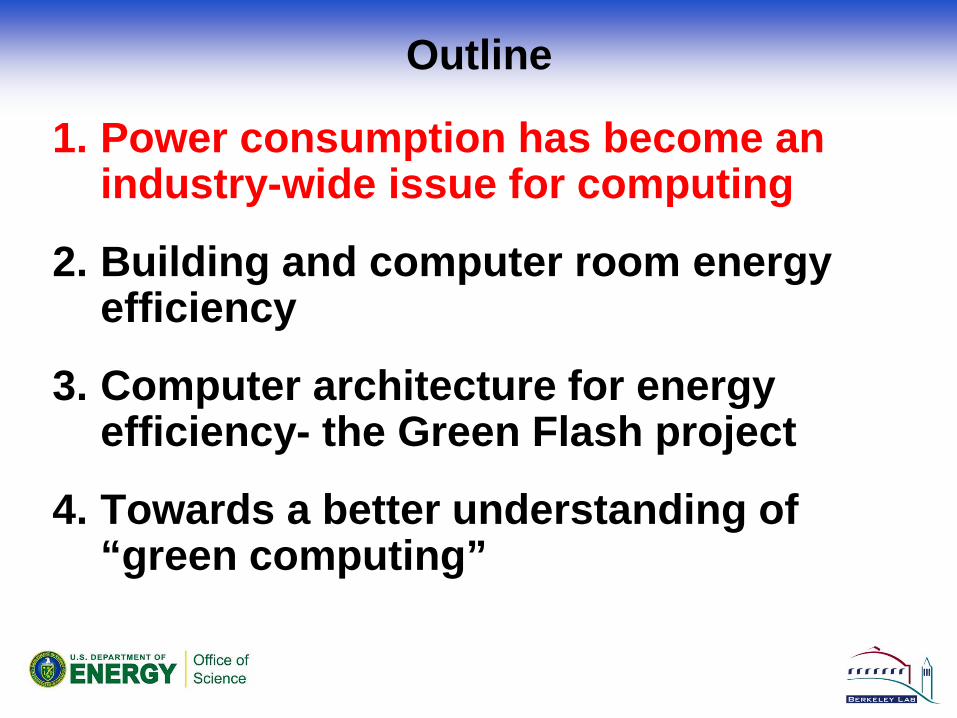
Outline
Trends in Power Consumption and Energy Efficiency for HPC
Building and infrastructure problem -- continued increase in demand for computing (“buildings”)
Computer technology problem --no more power density scaling (“bits”)
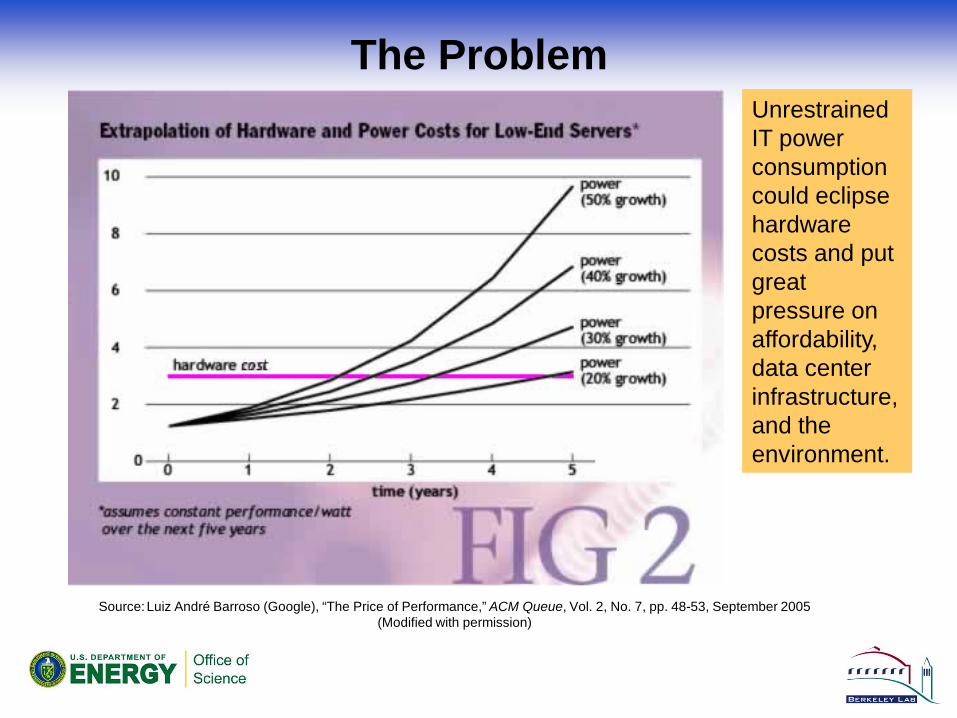
The Problem
Source:Luiz André Barroso (Google), “The Price of Performance,” ACM Queue, Vol. 2, No. 7, pp. 48-53, September 2005 (Modified with permission)
Unrestrained IT power consumption could eclipse hardware costs and put great pressure on affordability, data center infrastructure, and the environment.
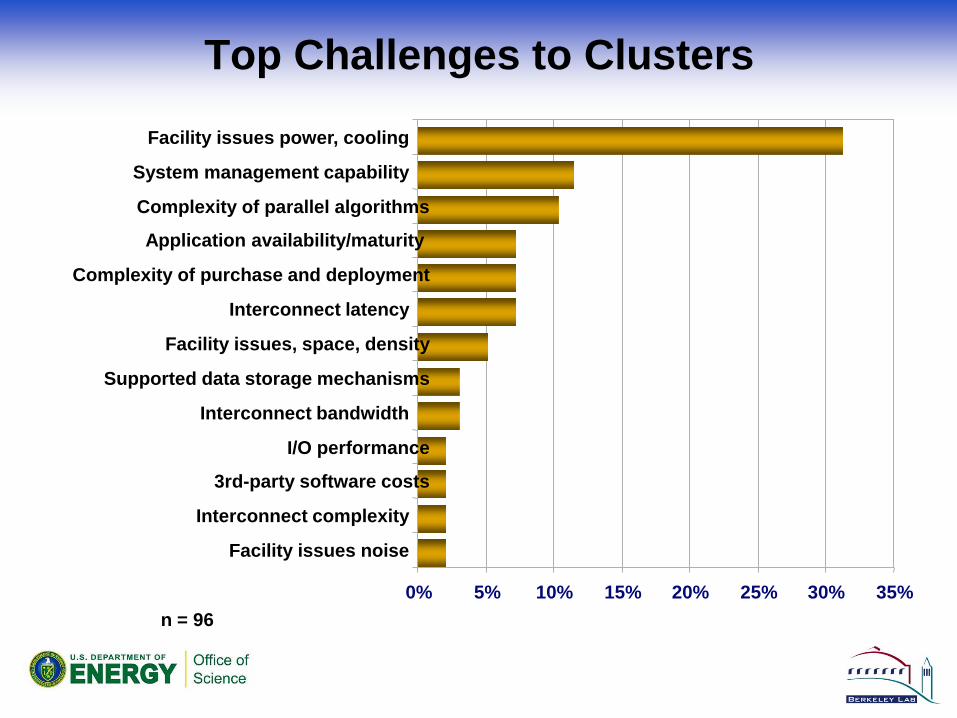
Top Challenges to Clusters
n = 960% 5% 10% 15% 20% 25% 30% 35%
Facility issues noise
Interconnect complexity
3rd-party software costs
I/O performance
Interconnect bandwidth
Supported data storage mechanisms
Facility issues, space, density
Interconnect latency
Complexity of purchase and deployment
Application availability/maturity
Complexity of parallel algorithms
System management capability
Facility issues power, cooling
Responses
• Cloud• Containerized data centers• Large scale data “factories”• Increased emphasis on computer
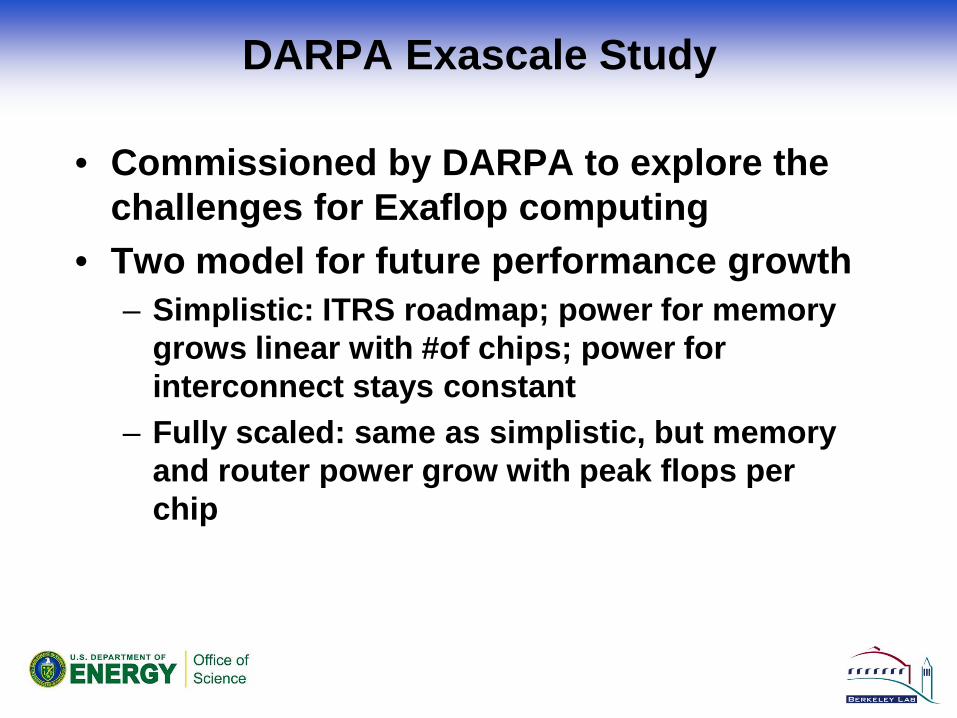
What are critical exascale technology investments?
• System power is a first class constraint on exascale system performance and effectiveness.
• Memory is an important component of meeting exascale power and applications goals.
• Programming model. Early investment in several efforts to decide in 2013 on exascale programming model, allowing exemplar applications effective access to 2015 system for both mission and science.
• Investment in exascale processor design to achieve an exascale-like system in 2015.
• Operating System strategy for exascale is critical for node performance at scale and for efficient support of new programming models and run time systems.
• Reliability and resiliency are critical at this scale and require applications neutral movement of the file system (for check pointing, in particular) closer to the running apps.
• HPC co-design strategy and implementation requires a set of a hierarchical performance models and simulators as well as commitment from apps, software and architecture communities.
56
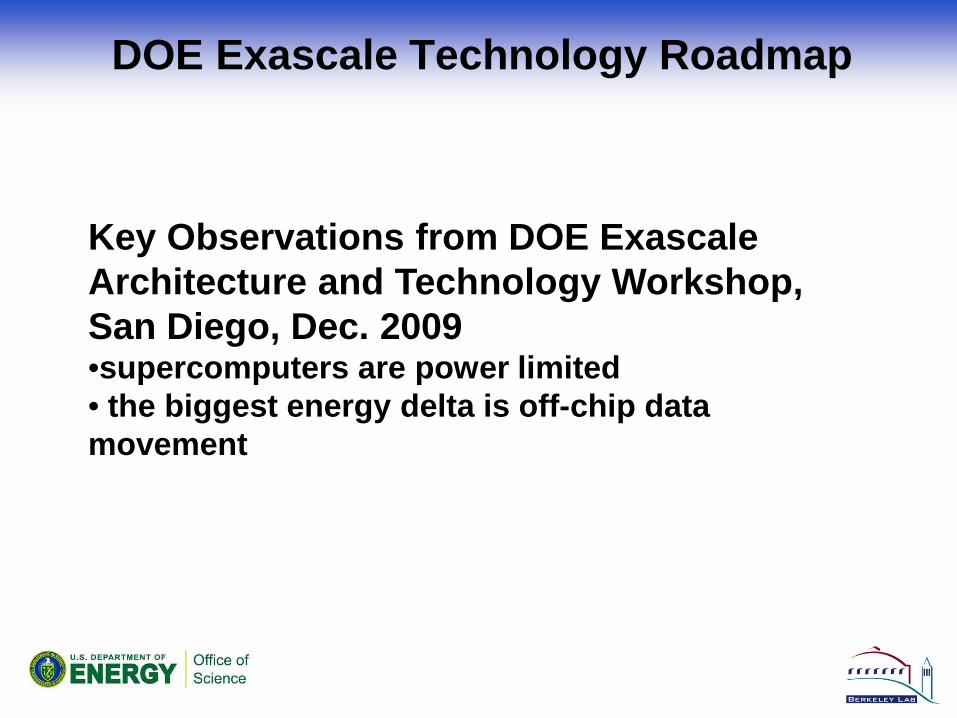
DOE Exascale Technology Roadmap
Key Observations from DOE ExascaleArchitecture and Technology Workshop, San Diego, Dec. 2009•supercomputers are power limited• the biggest energy delta is off-chip data movement
Memory Power Consumption
• Power Consumption with standard Technology Roadmap
• Power Consumption with Investment in Advanced Memory Technology
10,6
48
12
FPU
Memory
Interconnect
10,6
6,4
12
FPU
Memory
Interconnect
20 Megawatts total70 Megawatts total
Memory TechnologyBandwidth costs power
0
10
20
30
40
50
60
70
80
90
100
0,01 0,1 0,2 0,5 1 2
Mem
ory
Pow
er C
onsu
mpt
ion
in M
egaw
atts
(MW
)
Bytes/FLOP ratio (# bytes per peak FLOP)
Stacked JEDEC 30pj/bit 2018 ($20M)
Advanced 7pj/bit Memory ($100M)
Enhanced 4pj/bit Advanced Memory ($150M cumulative)Feasible Power Envelope (20MW)
• Project by Shalf, Oliker, Wehner and others at LBNL
• A route to exascale computing– Target specific machine designs to answer a
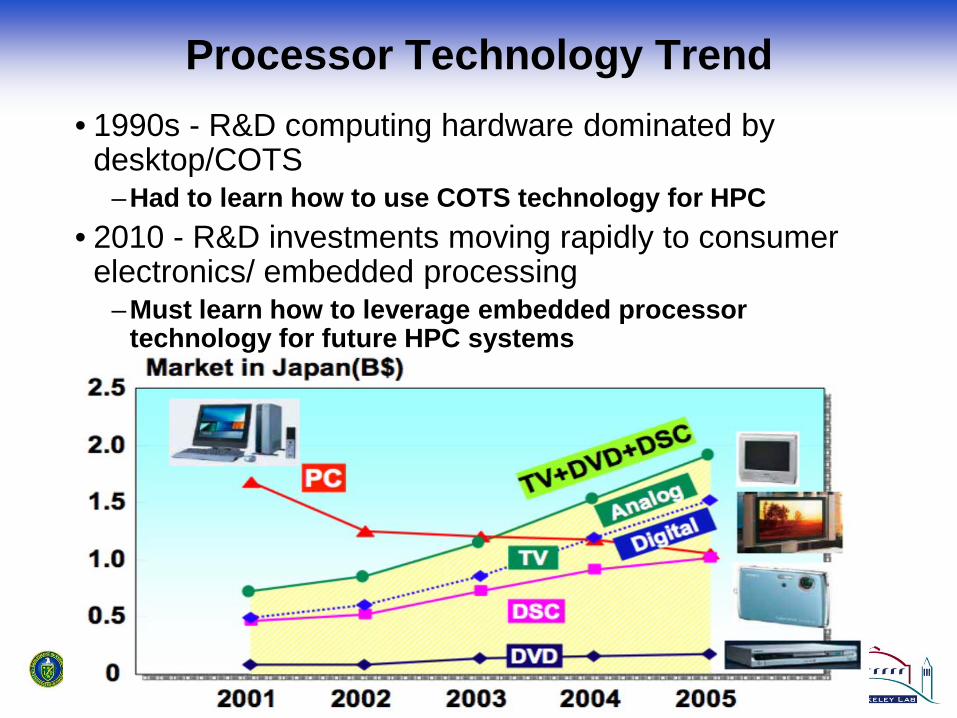
scientific question– Use of new technologies driven by the consumer
market.
Green Flash:Ultra-Efficient Climate Modeling
Ultra-Efficient “Green Flash” Computing at NERSC: 100x over Business as Usual
Radically change HPC system development via application-driven hardware/software co-design– Achieve 100x power efficiency and 100x
capability of mainstream HPC approach for targeted high-impact applications
– Accelerate development cycle for exascale HPC systems
– Approach is applicable to numerous scientific applications
– Proposed pilot application: Ultra-high resolution climate change simulation
Path to Power EfficiencyReducing Waste in Computing
• Examine methodology of low-power embedded computing market– optimized for low power, low cost and high computational
efficiency
“Years of research in low-power embedded computing have shown only one design technique to reduce power:reducewaste.”
Mark Horowitz, Stanford University &Rambus Inc.
• Sources of waste– Wasted transistors (surface area)– Wasted computation (useless work/speculation/stalls)– Wasted bandwidth (data movement)– Designing for serial performance
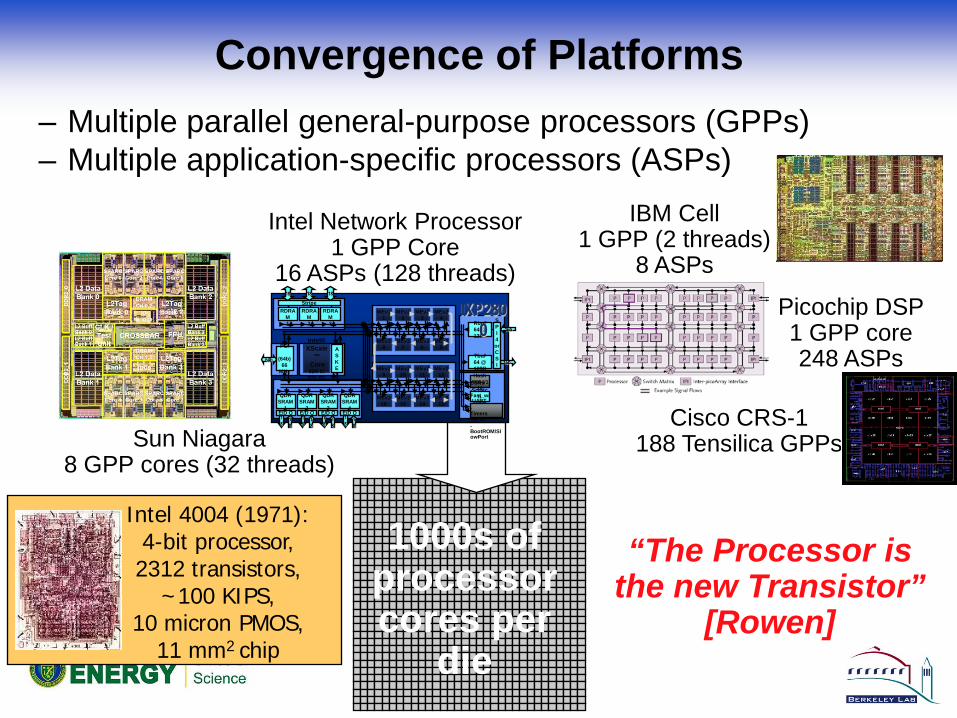
Design for Low Power: More Concurrency
Intel Core215W
Power 5120W
This is how iPhones and MP3 players are designed to maximize battery life and minimize cost
PPC4503W
Tensilica DP0.09W
• Cubic power improvement with lower clock rate due to V2F
• Slower clock rates enable use of simpler cores
• Simpler cores use less area (lower leakage) and reduce cost
• Tailor design to application to reduce waste
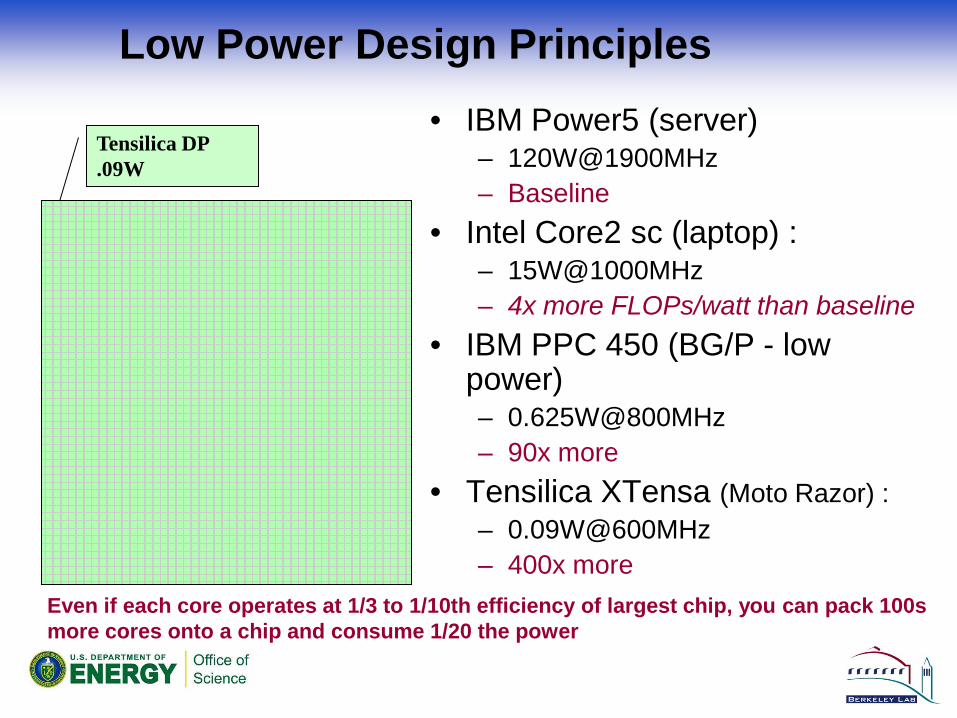
Low Power Design Principles• IBM Power5 (server)
– 120W@1900MHz– Baseline
• Intel Core2 sc (laptop) :– 15W@1000MHz– 4x more FLOPs/watt than baseline
• IBM PPC 450 (BG/P - low power)– 0.625W@800MHz– 90x more
• Tensilica XTensa (Moto Razor) : – 0.09W@600MHz– 400x more
Intel Core2
Tensilica DP.09W
Power 5
Even if each core operates at 1/3 to 1/10th efficiency of largest chip, you can pack 100s more cores onto a chip and consume 1/20 the power
Green Flash Strawman System DesignWe examined three different approaches (in 2008 technology)