
From Bits to Buildings:Energy Efficiency and the Path to Exaflops
Horst D. SimonLawrence Berkeley National Laboratory
and EECS Dept., UC [email protected]
26e Forum ORAP, Paris, FranceMarch 31, 2010
AcknowledgementsA large number of individuals have contributed to energy efficiency in computing at Berkeley Lab, UC Berkeley, and to this presentation: David Bailey (CRD), Michael Banda (CRD), Michael Bennett (ITD), ShoaibKamil (CRD), Jonathan Koomey (Stanford), Randy Katz (EECS), TsuJae King (EECS), Chuck McParland (CRD), Juan Meza (CRD), Bruce Nordman (EETD), Lenny Oliker (CRD), EkowOtoo (CRD), Vern Paxson (UCB/ICSI/CRD), DoronRotem (CRD), Dale Sartor (EETD), John Shalf (NERSC), Erich Strohmaier (CRD), Bill Tschudi (EETD), Howard Walter (NERSC), Michael Wehner (CRD), Kathy Yelick (NERSC/CRD) … and many others
Check the LBNL website for more details:
http://www.lbl.gov/cs/html/energy_efficient_computing.html
Outline
Trends in Power Consumption and Energy Efficiency for HPC
Building and infrastructure problem -- continued increase in demand for computing (“buildings”)
Computer technology problem --no more power density scaling (“bits”)

Summary of the Talk
Power has become THE dominant problem in computing

EnergyProduction and Use in the U.S.
10-8-2008 5
Why does saving energy matter?
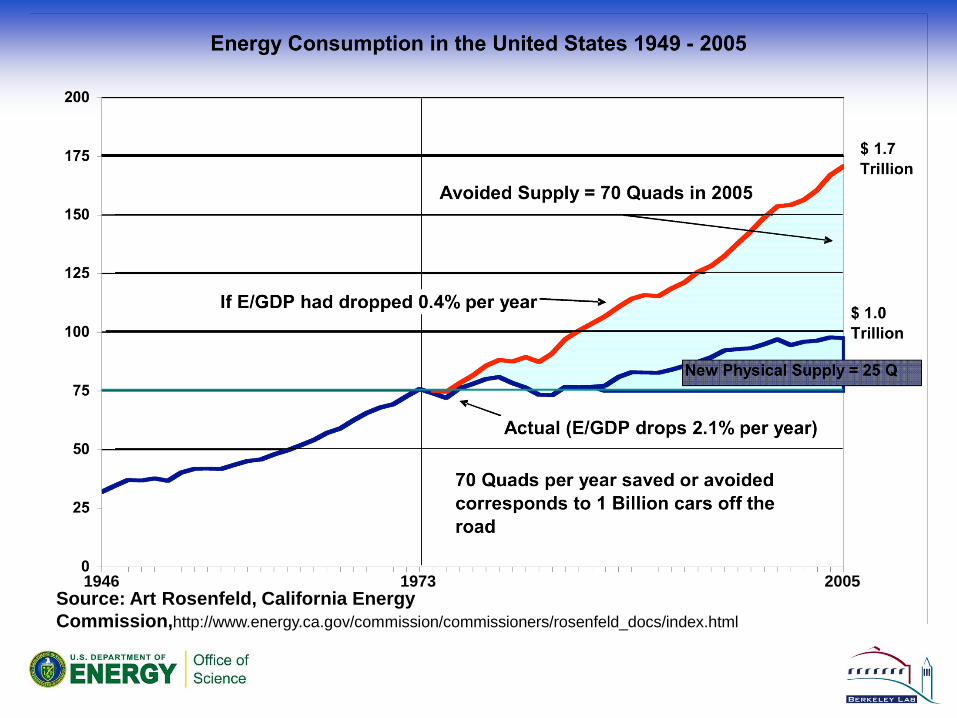
Source: Art Rosenfeld, California Energy Commission,http://www.energy.ca.gov/commission/commissioners/rosenfeld_docs/index.html
1946 1973 2005

An Honest Question?
Does the HPC community really care about reducing the carbon footprint?
NO!
HPC Interests
• Energy efficiency in computer rooms– Spend more resources on computing
than on infrastructure• Energy efficient technology
– Maintain performance growth and get things done that could not be done before
Khazzoom-Brookes Postulate
• Energy efficiency at the micro-level leads to higher energy consumption at the macro-level– cheaper energy increases use– increased energy efficiency leads to
economic growth– increased efficiency in one bottleneck
resource increases use of companion technologies
• HPC follows Khazzoom-Brookes
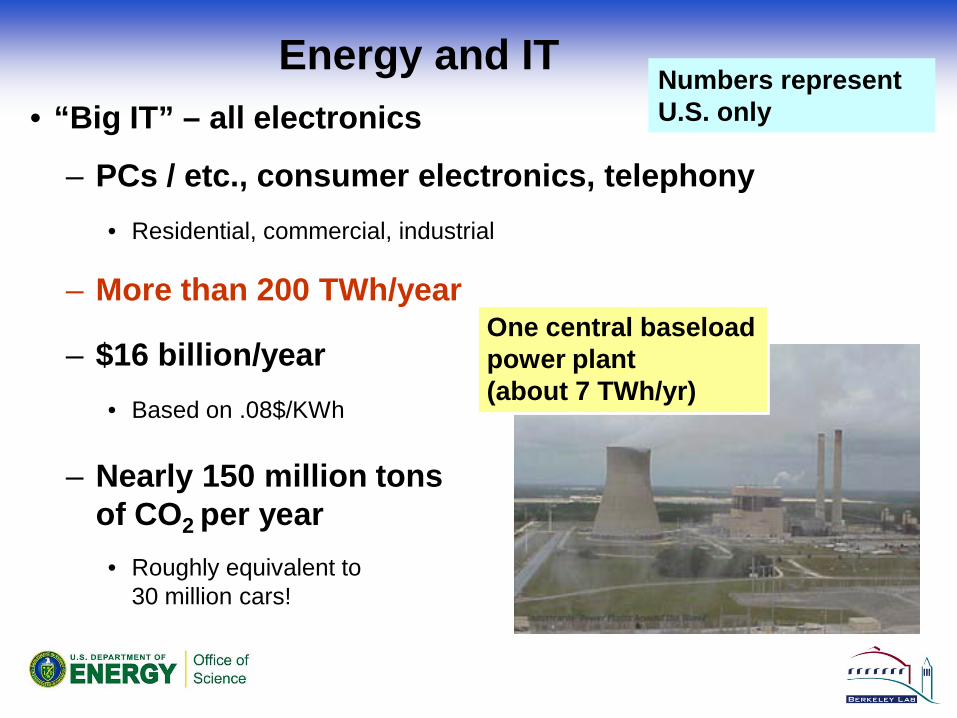
Energy and IT• “Big IT” – all electronics
– PCs / etc., consumer electronics, telephony• Residential, commercial, industrial
– More than 200 TWh/year
– $16 billion/year• Based on .08$/KWh
– Nearly 150 million tonsof CO2 per year• Roughly equivalent to
30 million cars!
One central baseload power plant (about 7 TWh/yr)
Numbers represent U.S. only

… and IT electricity use is increasingdata taken from: Jonathan Koomey, “Estimating Total Power Consumption by Servers in the U.S. and the World”
Available at: http://www.koomey.com/publications.html

2020 IT Carbon Footprint
14
“SMART 2020: Enabling the Low Carbon Economy in the Information Age”, The Climate Group
USAChinaTelecoms DC PCs
Datacenters: Owned by single entity interested in reducing opex
billion tons CO2
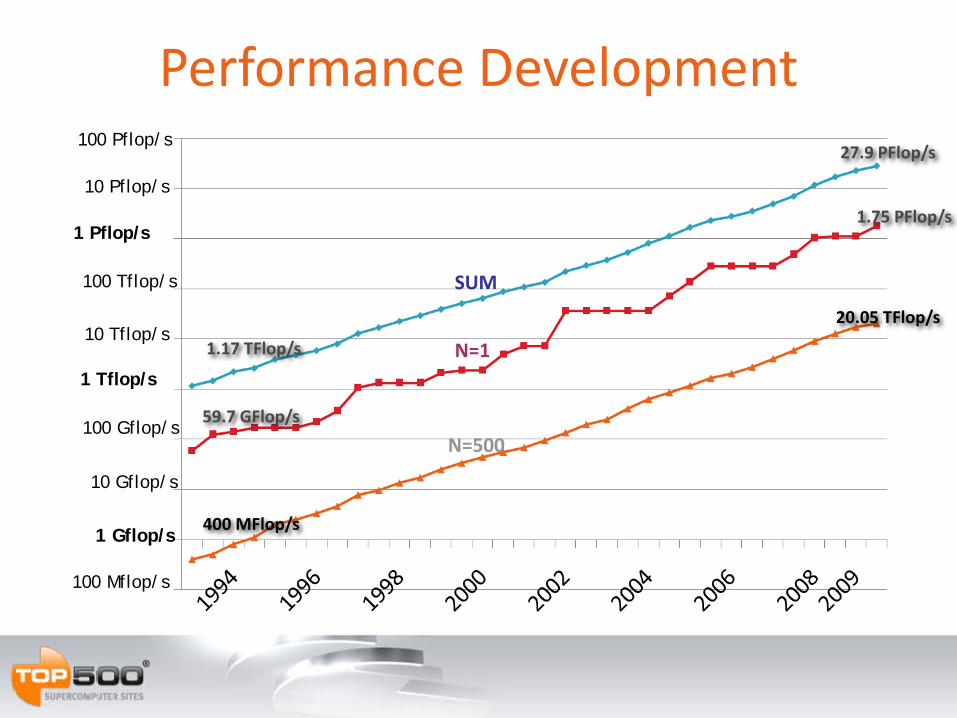
Performance Development
1 Gflop/s
1 Tflop/s
100 Mflop/s
100 Gflop/s
100 Tflop/s
10 Gflop/s
10 Tflop/s
1 Pflop/s
100 Pflop/s
10 Pflop/s
59.7 GFlop/s
400 MFlop/s
1.17 TFlop/s
1.75 PFlop/s
20.05 TFlop/s
27.9 PFlop/s
SUM
N=1
N=500

Absolute Power Levels

Power Efficiency related to Processors
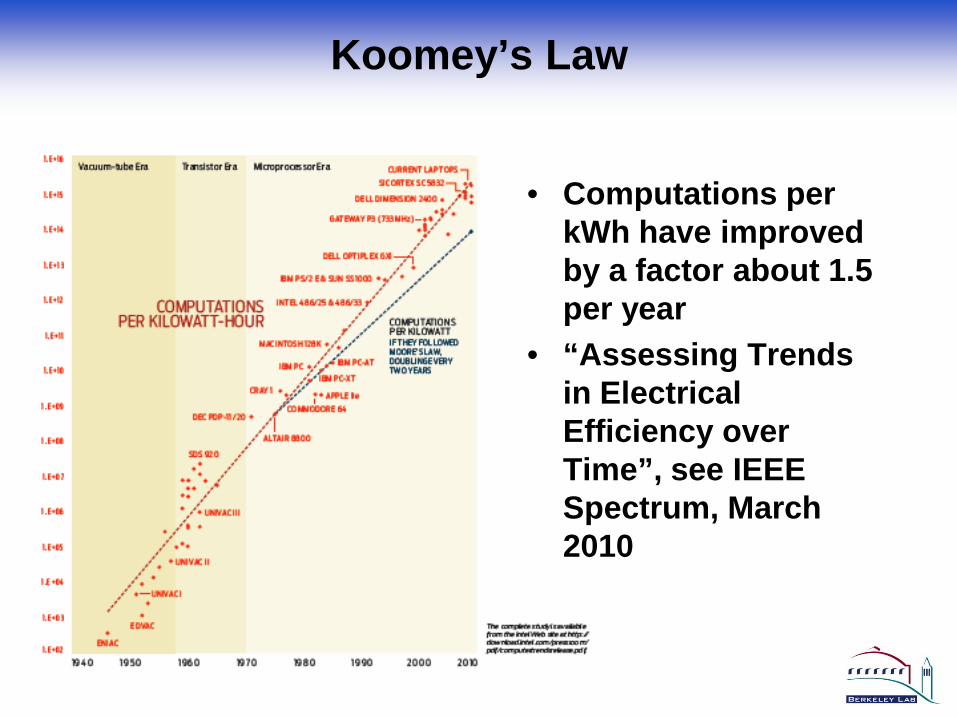
Koomey’s Law
• Computations per kWh have improved by a factor about 1.5 per year
• “Assessing Trends in Electrical Efficiency over Time”, see IEEE Spectrum, March 2010
Trend Analysis
• Processors and Systems have become more energy efficient over time– Koomey’s Law shows factor of 1.5
improvement in kWh/computations• Supercomputers have become more powerful
over time– TOP500 data show factor of 1.86 increase of
computations/sec• Consequently power/system increases by about
1.24 per year
Outline
Trends in Power Consumption and Energy Efficiency for HPC
Building and infrastructure problem -- continued increase in demand for computing (“buildings”)
Computer technology problem --no more power density scaling (“bits”)
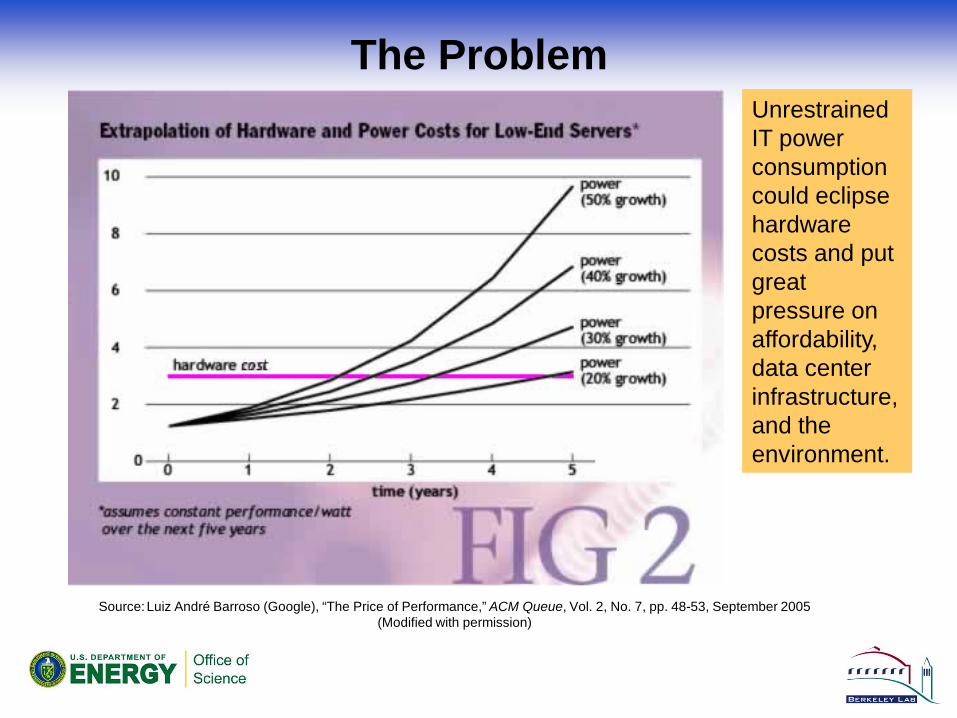
The Problem
Source:Luiz André Barroso (Google), “The Price of Performance,” ACM Queue, Vol. 2, No. 7, pp. 48-53, September 2005 (Modified with permission)
Unrestrained IT power consumption could eclipse hardware costs and put great pressure on affordability, data center infrastructure, and the environment.
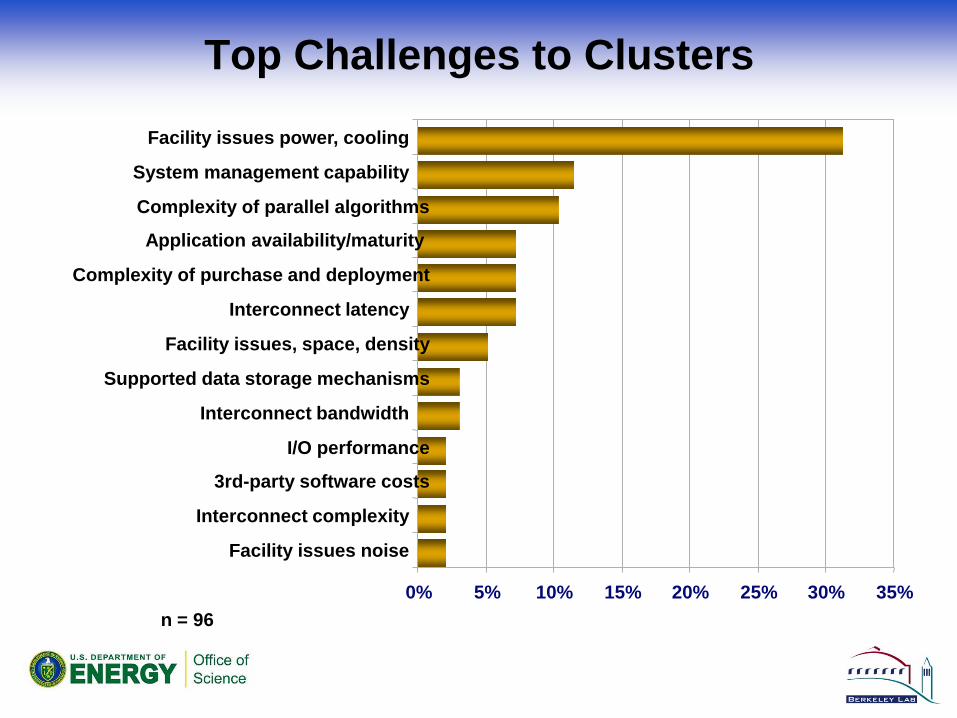
Top Challenges to Clusters
n = 960% 5% 10% 15% 20% 25% 30% 35%
Facility issues noise
Interconnect complexity
3rd-party software costs
I/O performance
Interconnect bandwidth
Supported data storage mechanisms
Facility issues, space, density
Interconnect latency
Complexity of purchase and deployment
Application availability/maturity
Complexity of parallel algorithms
System management capability
Facility issues power, cooling
Responses
• Cloud• Containerized data centers• Large scale data “factories”• Increased emphasis on computer
room and building efficiency
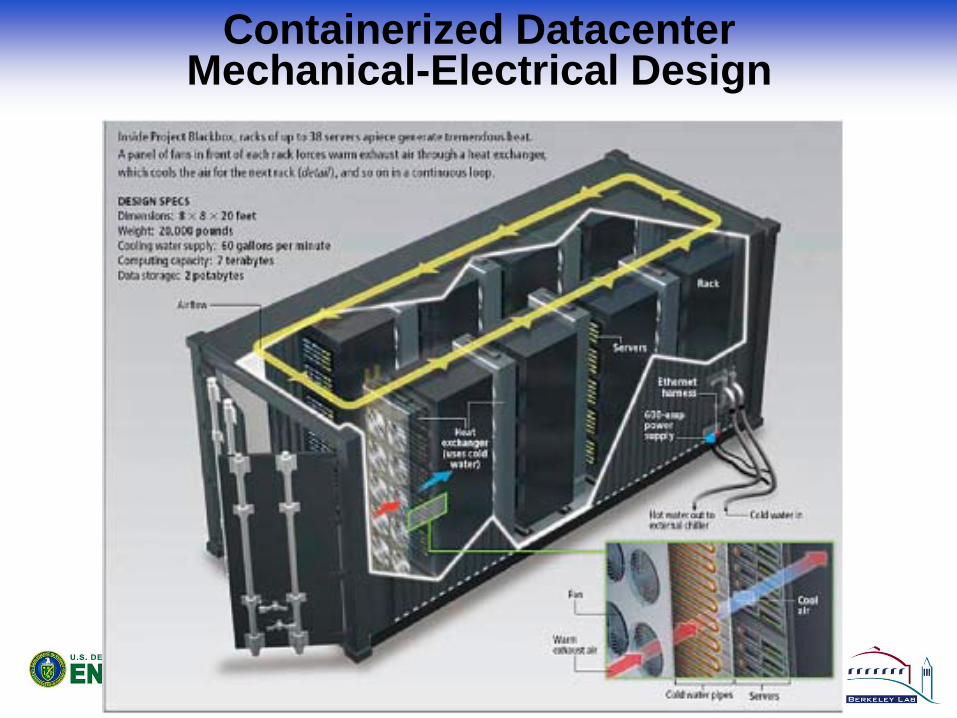
Containerized DatacenterMechanical-Electrical Design
25
Data Center Economic Reality (2006)
Source: New York Times, June 14, 2006
• June 2006 - Google begins building a new data center near the Columbia River on the border between Washington and Oregon
– Because the location is “at the intersection of cheap electricity and readily accessible data networking”
• Microsoft and Yahoo are building big data centers upstream in Wenatchee and Quincy, Wash.
– To keep up with Google, which means they need cheap electricity and readily accessible data networking
“Hiding in Plain Sight, Google Seeks More Power” by John Markoff, NYT, June 14, 2006

Google Dalles Oregon Facility68,680 Sq Ft Per Pod
Source: Levy and Snowhorn, Data Center Power Trends, February 18, 2008
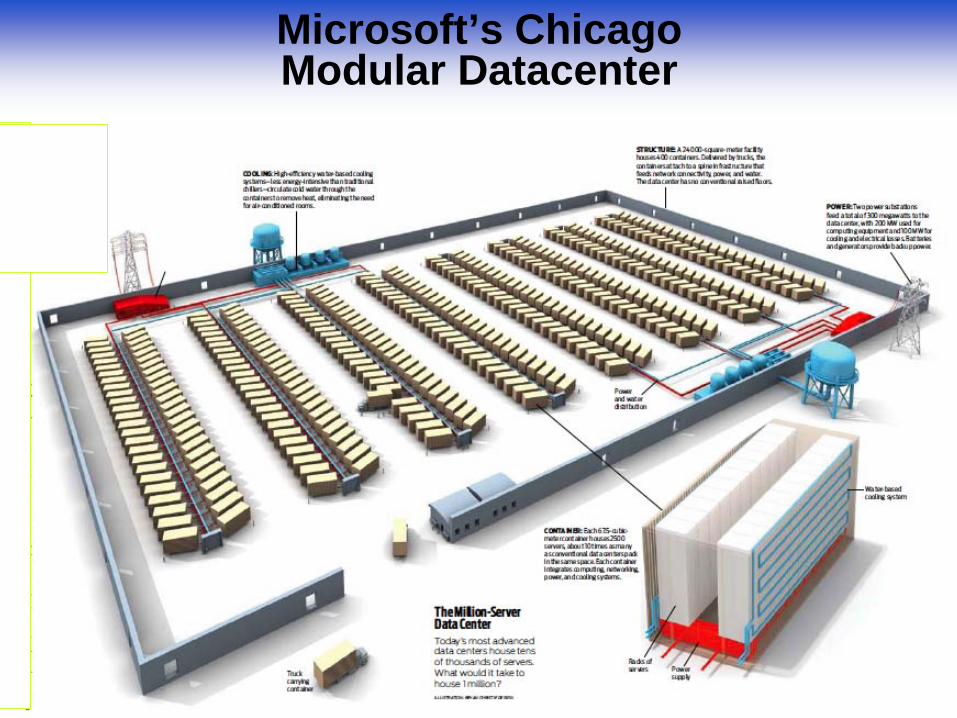
Microsoft’s ChicagoModular Datacenter
29
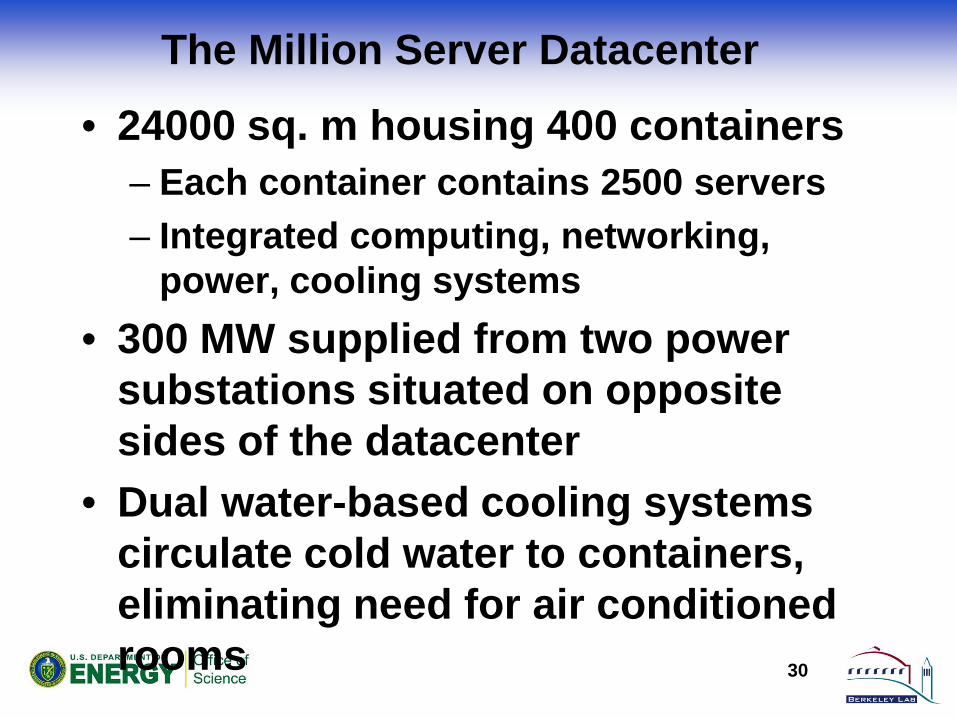
The Million Server Datacenter
• 24000 sq. m housing 400 containers– Each container contains 2500 servers– Integrated computing, networking,
power, cooling systems• 300 MW supplied from two power
substations situated on opposite sides of the datacenter
• Dual water-based cooling systems circulate cold water to containers, eliminating need for air conditioned rooms 30
• 20-40% savings typically possible• Aggressive strategies can yield
better than 50% savings • Extend life and capacity of
existing data center infrastructures
• But is my center good or bad?
Potential Benefits of Improved Data Center Energy Efficiency:

Benchmarking for Energy Performance Improvement:
Energy benchmarking can allow comparison to peers and help identify best practices
LBNL conducted studies of over 30 data centers:
– Found wide variation in performance
– Identified best practices
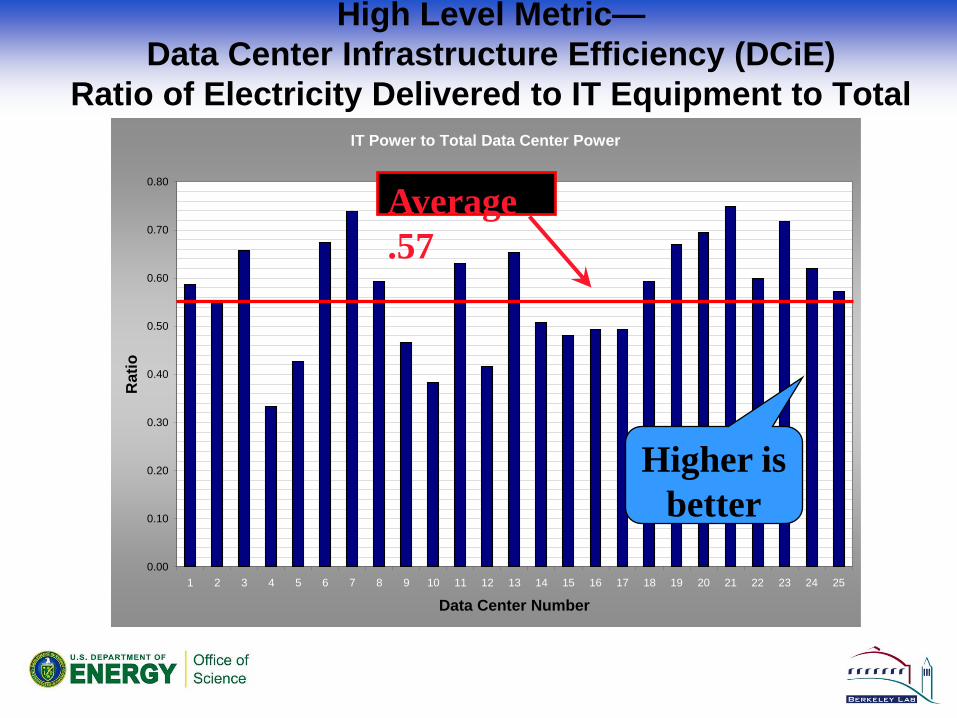
High Level Metric—Data Center Infrastructure Efficiency (DCiE)
Ratio of Electricity Delivered to IT Equipment to TotalIT Power to Total Data Center Power
0.00
0.10
0.20
0.30
0.40
0.50
0.60
0.70
0.80
1 2 3 4 5 6 7 8 9 10 11 12 13 14 15 16 17 18 19 20 21 22 23 24 25
Data Center Number
Rat
io
Average .57
Higher is better
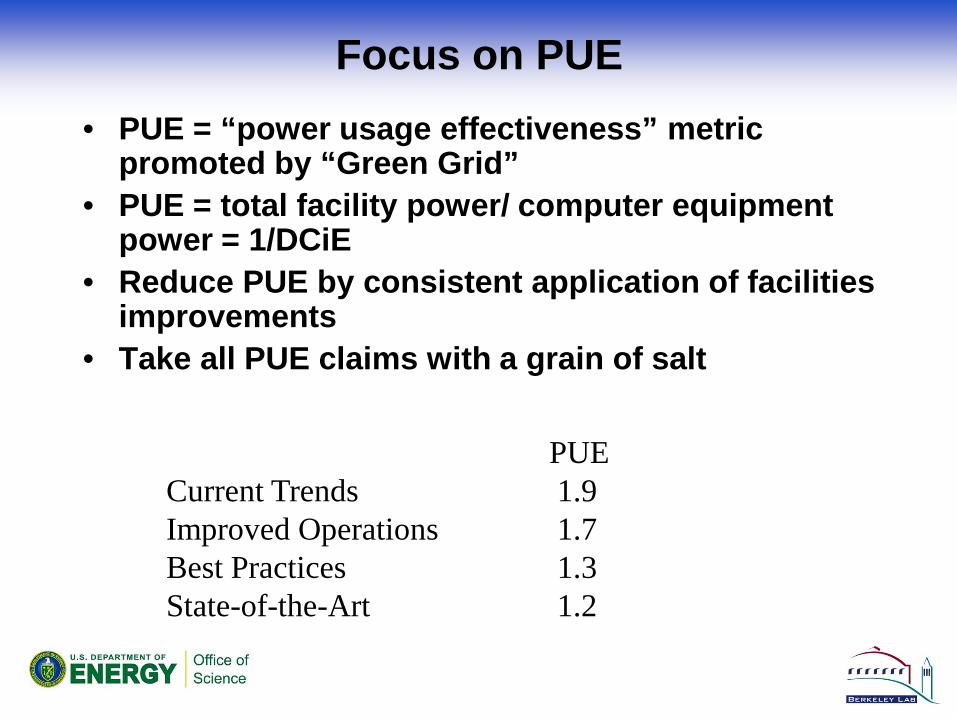
Focus on PUE• PUE = “power usage effectiveness” metric
promoted by “Green Grid”• PUE = total facility power/ computer equipment
power = 1/DCiE• Reduce PUE by consistent application of facilities
improvements• Take all PUE claims with a grain of salt
PUECurrent Trends 1.9Improved Operations 1.7Best Practices 1.3State-of-the-Art 1.2
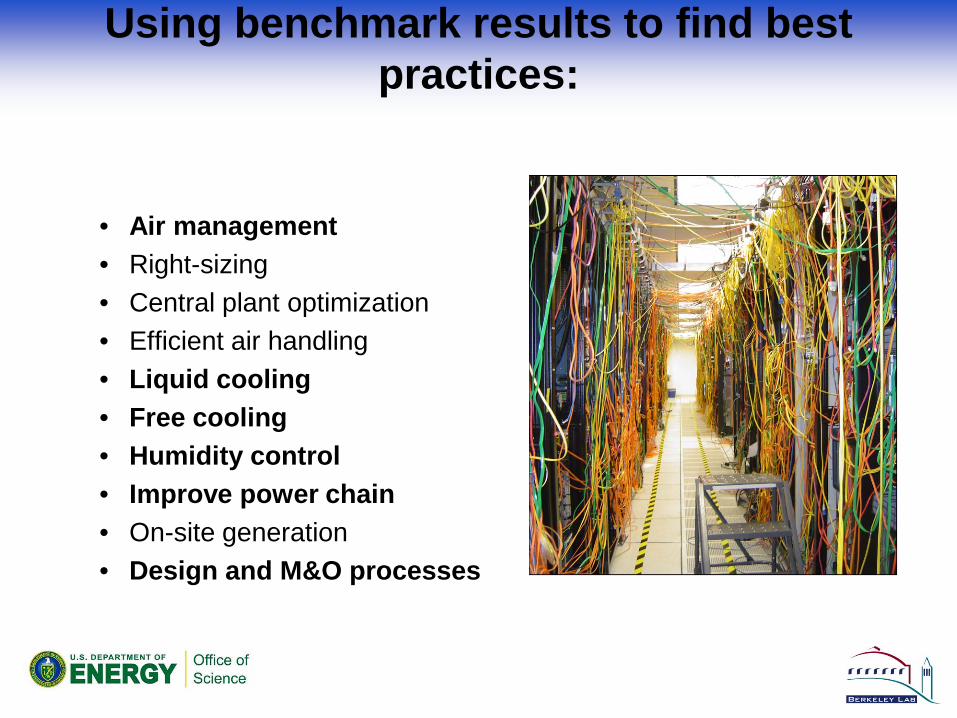
• Air management• Right-sizing• Central plant optimization• Efficient air handling• Liquid cooling • Free cooling• Humidity control• Improve power chain• On-site generation• Design and M&O processes
Using benchmark results to find best practices:
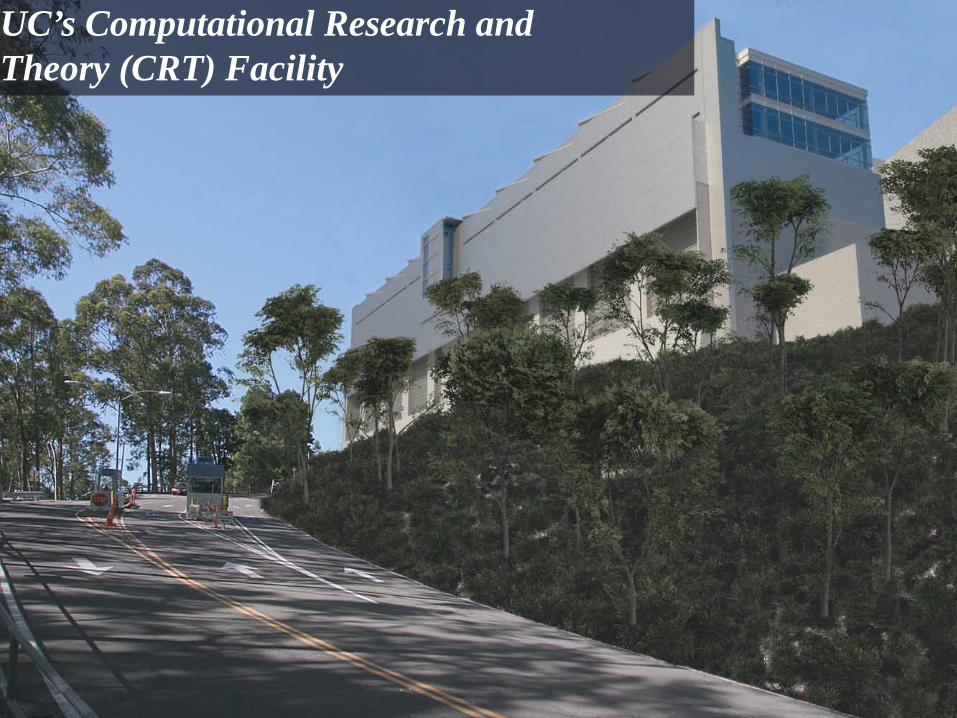
UC’s Computational Research and Theory (CRT) Facility

• Water-side Economizers– No contamination question– Can be in series with chiller
• Outside-Air Economizers – Can be very effective (24/7 load) – Must consider humidity
Use Free Cooling:

• Allows multiple temperature feeds at server locations through mixing of CHW & TRW
• Closed-loop treated cooling water from cooling towers (via heat exchanger)
• Chilled water from chillers• Headers, valves and caps for modularity and future
flexibility
Water Cooling: Four-pipe System
Predicted CRT Performance• DCIE of 0.95 based on annual
energy• DCIE of 0.88 based on peak
power

• Design Guides were developed based upon the observed best practices
• Guides are available through PG&E and LBNL websites
• Self benchmarking protocol also available
Design Guidelines Are Available
http://hightech.lbl.gov/datacenters.html
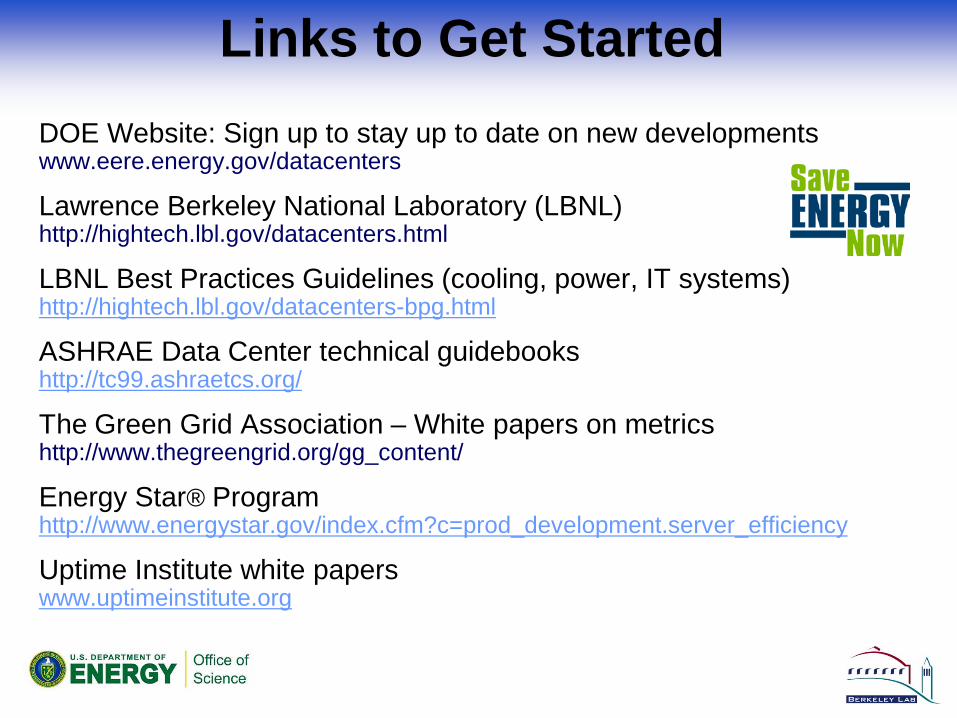
Links to Get StartedDOE Website: Sign up to stay up to date on new developmentswww.eere.energy.gov/datacenters
Lawrence Berkeley National Laboratory (LBNL)http://hightech.lbl.gov/datacenters.html
LBNL Best Practices Guidelines (cooling, power, IT systems)http://hightech.lbl.gov/datacenters-bpg.html
ASHRAE Data Center technical guidebooks http://tc99.ashraetcs.org/
The Green Grid Association – White papers on metrics http://www.thegreengrid.org/gg_content/
Energy Star® Programhttp://www.energystar.gov/index.cfm?c=prod_development.server_efficiency
Uptime Institute white papers www.uptimeinstitute.org

Outline
Trends in Power Consumption and Energy Efficiency for HPC
Building and infrastructure problem -- continued increase in demand for computing (“buildings”)
Computer technology problem --no more power density scaling (“bits”)

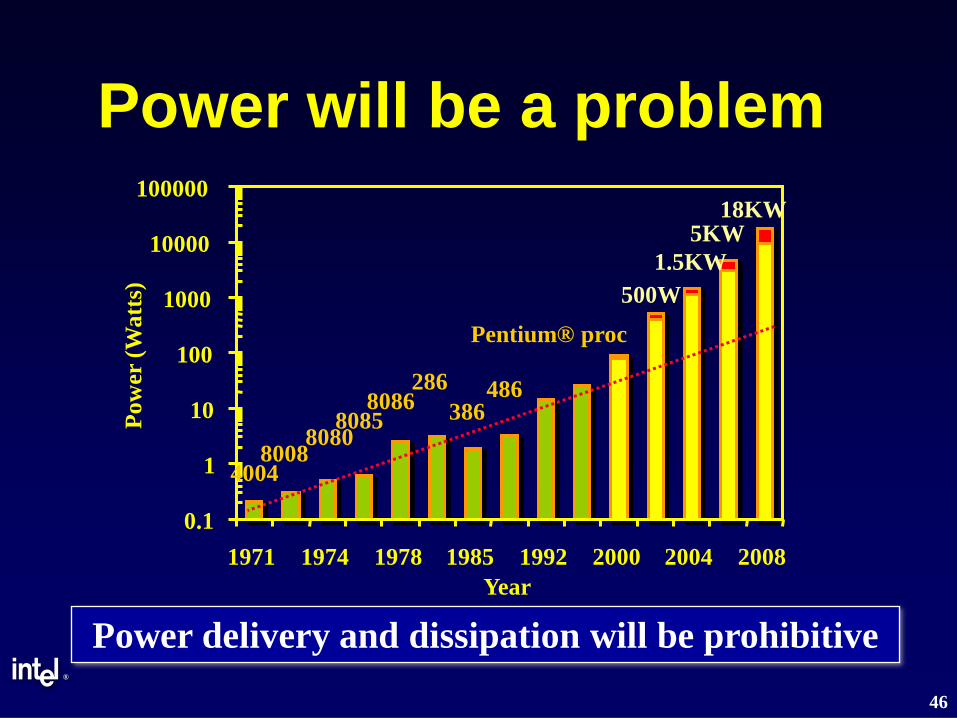
An Early Warning
• Presented by ShekharBorkar in Berkeley in November 2000
®
46
Power will be a problem
5KW 18KW
1.5KW 500W
40048008
80808085
8086286
386486
Pentium® proc
0.1
1
10
100
1000
10000
100000
1971 1974 1978 1985 1992 2000 2004 2008Year
Pow
er (W
atts
)
Power delivery and dissipation will be prohibitive
®
47
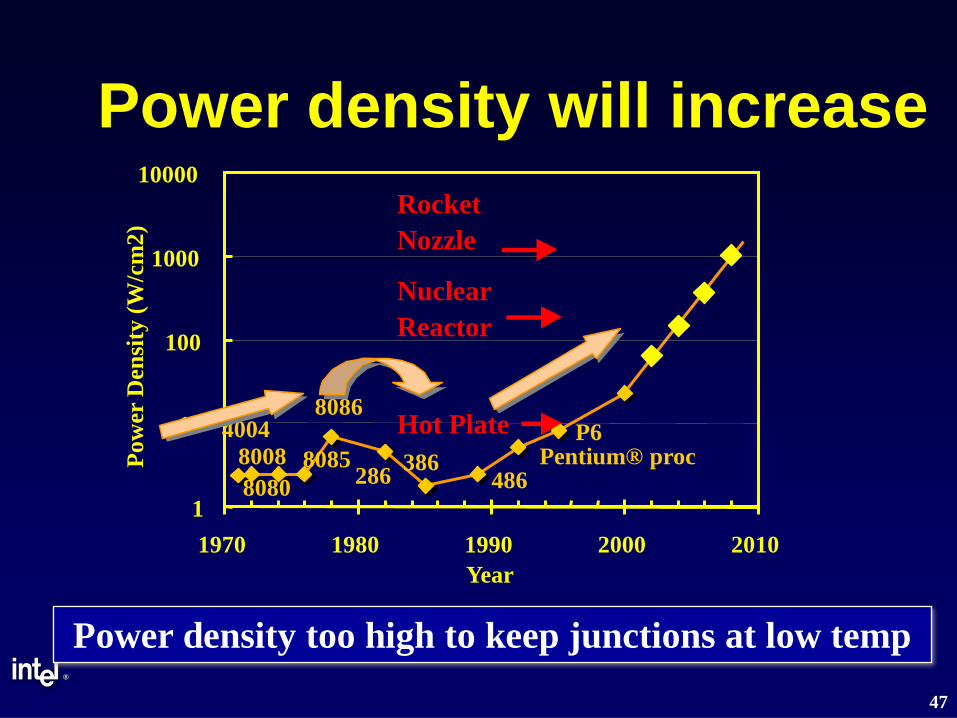
Power density will increase
400480088080
8085
8086
286 386486
Pentium® procP6
1
10
100
1000
10000
1970 1980 1990 2000 2010Year
Pow
er D
ensi
ty (W
/cm
2)
Hot Plate
NuclearReactor
RocketNozzle
Power density too high to keep junctions at low temp
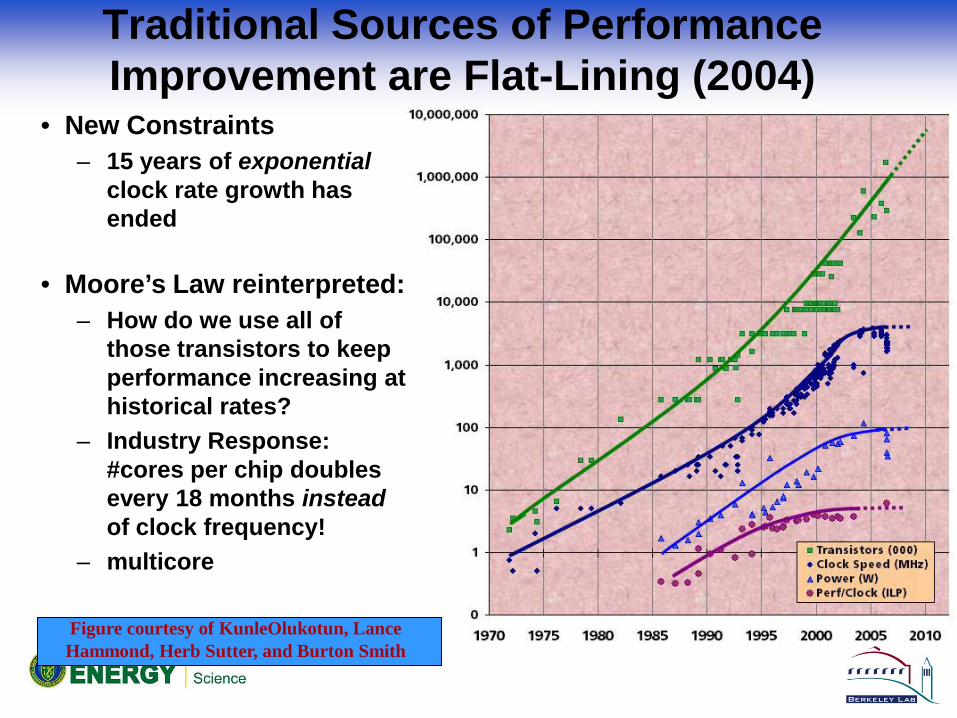
Traditional Sources of Performance Improvement are Flat-Lining (2004)
• New Constraints– 15 years of exponential
clock rate growth has ended
• Moore’s Law reinterpreted:– How do we use all of
those transistors to keep performance increasing at historical rates?
– Industry Response: #cores per chip doubles every 18 months insteadof clock frequency!
– multicore
Figure courtesy of KunleOlukotun, Lance Hammond, Herb Sutter, and Burton Smith
DARPA Exascale Study
• Commissioned by DARPA to explore the challenges for Exaflop computing
• Two model for future performance growth– Simplistic: ITRS roadmap; power for memory
grows linear with #of chips; power for interconnect stays constant
– Fully scaled: same as simplistic, but memory and router power grow with peak flops per chip
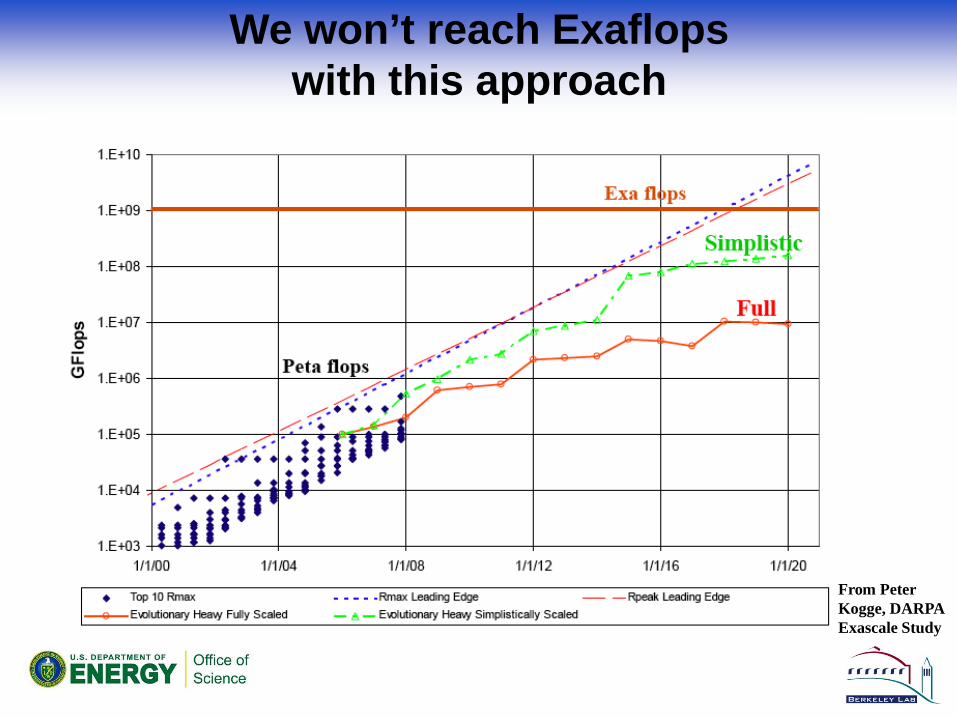
From Peter Kogge, DARPA Exascale Study
We won’t reach Exaflops with this approach

… and the power costs will still be staggering
From Peter Kogge, DARPA Exascale Study

A decadal DOE plan for providing exascale applications and technologies for DOE mission
needs
Rick Stevens and Andy White, co-chairsPete Beckman, Ray Bair-ANL; Jim Hack, Jeff Nichols, Al Geist-
ORNL; Horst Simon, Kathy Yelick, John Shalf-LBNL; Steve Ashby, Moe Khaleel-PNNL; Michel McCoy, Mark Seager, Brent
Gorda-LLNL; John Morrison, Cheryl Wampler-LANL; James Peery, Sudip Dosanjh, Jim Ang-SNL; Jim Davenport, Tom
Schlagel, BNL; Fred Johnson, Paul Messina, ex officio
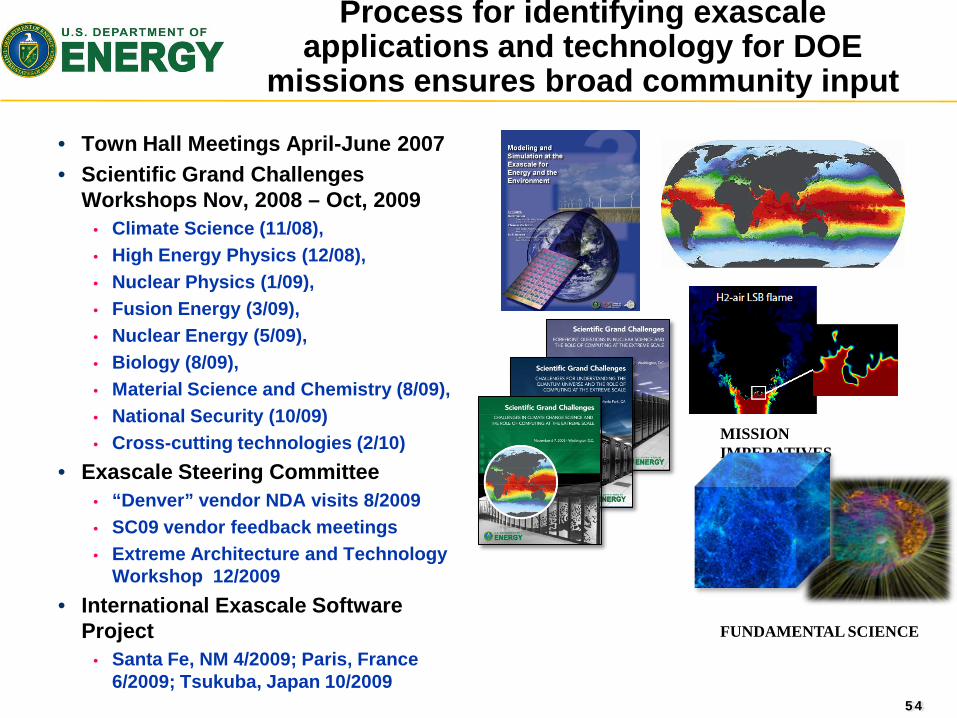
Process for identifying exascale applications and technology for DOE
missions ensures broad community input
• Town Hall Meetings April-June 2007• Scientific Grand Challenges
Workshops Nov, 2008 – Oct, 2009• Climate Science (11/08), • High Energy Physics (12/08), • Nuclear Physics (1/09), • Fusion Energy (3/09), • Nuclear Energy (5/09), • Biology (8/09), • Material Science and Chemistry (8/09), • National Security (10/09)• Cross-cutting technologies (2/10)
• Exascale Steering Committee• “Denver” vendor NDA visits 8/2009• SC09 vendor feedback meetings• Extreme Architecture and Technology
Workshop 12/2009• International Exascale Software
Project• Santa Fe, NM 4/2009; Paris, France
6/2009; Tsukuba, Japan 10/200954
MISSION IMPERATIVES
FUNDAMENTAL SCIENCE

Potential System Architecture Targets
System attributes
2010 “2015” “2018”
System peak 2 Peta 200 Petaflop/sec 1 Exaflop/sec
Power 6 MW 15 MW 20 MW
System memory 0.3 PB 5 PB 32-64 PB
Node performance 125 GF 0.5 TF 7 TF 1 TF 10 TF
Node memory BW 25 GB/s 0.1TB/sec 1 TB/sec 0.4TB/sec 4 TB/sec
Node concurrency 12 O(100) O(1,000) O(1,000) O(10,000)
System size (nodes)
18,700 50,000 5,000 1,000,000 100,000
Total Node Interconnect BW
1.5 GB/s 20 GB/sec 200GB/sec
MTTI days O(1day) O(1 day)

What are critical exascale technology investments?
• System power is a first class constraint on exascale system performance and effectiveness.
• Memory is an important component of meeting exascale power and applications goals.
• Programming model. Early investment in several efforts to decide in 2013 on exascale programming model, allowing exemplar applications effective access to 2015 system for both mission and science.
• Investment in exascale processor design to achieve an exascale-like system in 2015.
• Operating System strategy for exascale is critical for node performance at scale and for efficient support of new programming models and run time systems.
• Reliability and resiliency are critical at this scale and require applications neutral movement of the file system (for check pointing, in particular) closer to the running apps.
• HPC co-design strategy and implementation requires a set of a hierarchical performance models and simulators as well as commitment from apps, software and architecture communities.
56
DOE Exascale Technology Roadmap
Key Observations from DOE ExascaleArchitecture and Technology Workshop, San Diego, Dec. 2009•supercomputers are power limited• the biggest energy delta is off-chip data movement

Memory Power Consumption
• Power Consumption with standard Technology Roadmap
• Power Consumption with Investment in Advanced Memory Technology
10,6
48
12
FPU
Memory
Interconnect
10,6
6,4
12
FPU
Memory
Interconnect
20 Megawatts total70 Megawatts total

Memory TechnologyBandwidth costs power
0
10
20
30
40
50
60
70
80
90
100
0,01 0,1 0,2 0,5 1 2
Mem
ory
Pow
er C
onsu
mpt
ion
in M
egaw
atts
(MW
)
Bytes/FLOP ratio (# bytes per peak FLOP)
Stacked JEDEC 30pj/bit 2018 ($20M)
Advanced 7pj/bit Memory ($100M)
Enhanced 4pj/bit Advanced Memory ($150M cumulative)Feasible Power Envelope (20MW)

• Project by Shalf, Oliker, Wehner and others at LBNL
• A route to exascale computing– Target specific machine designs to answer a
scientific question– Use of new technologies driven by the consumer
market.
Green Flash:Ultra-Efficient Climate Modeling
Ultra-Efficient “Green Flash” Computing at NERSC: 100x over Business as Usual
Radically change HPC system development via application-driven hardware/software co-design– Achieve 100x power efficiency and 100x
capability of mainstream HPC approach for targeted high-impact applications
– Accelerate development cycle for exascale HPC systems
– Approach is applicable to numerous scientific applications
– Proposed pilot application: Ultra-high resolution climate change simulation
Path to Power EfficiencyReducing Waste in Computing
• Examine methodology of low-power embedded computing market– optimized for low power, low cost and high computational
efficiency
“Years of research in low-power embedded computing have shown only one design technique to reduce power:reducewaste.”
Mark Horowitz, Stanford University &Rambus Inc.
• Sources of waste– Wasted transistors (surface area)– Wasted computation (useless work/speculation/stalls)– Wasted bandwidth (data movement)– Designing for serial performance

Design for Low Power: More Concurrency
Intel Core215W
Power 5120W
This is how iPhones and MP3 players are designed to maximize battery life and minimize cost
PPC4503W
Tensilica DP0.09W
• Cubic power improvement with lower clock rate due to V2F
• Slower clock rates enable use of simpler cores
• Simpler cores use less area (lower leakage) and reduce cost
• Tailor design to application to reduce waste
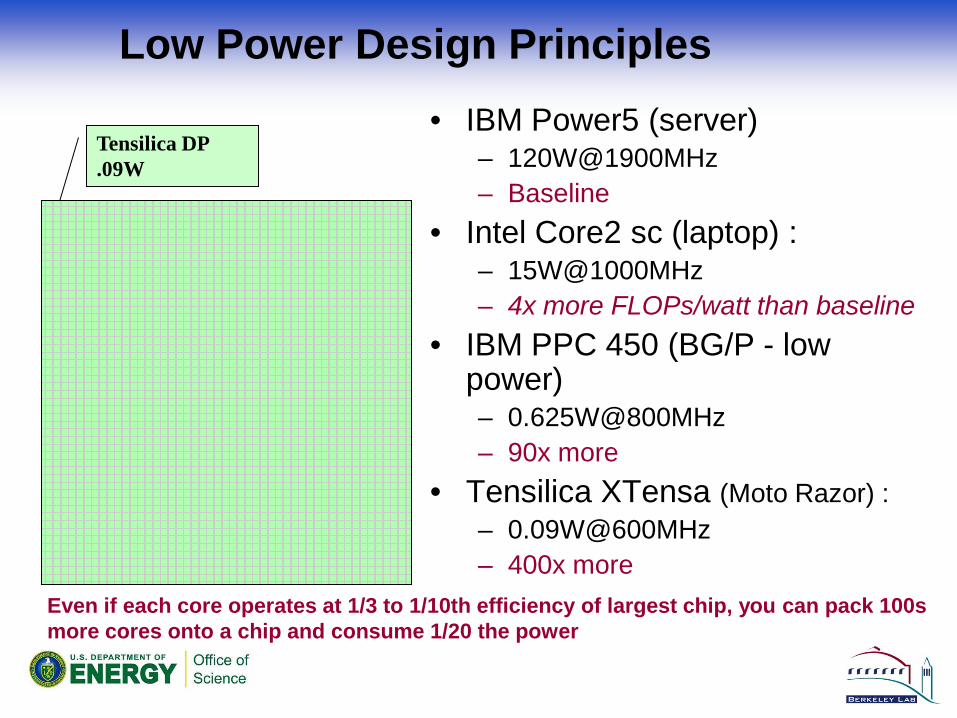
Low Power Design Principles• IBM Power5 (server)
– 120W@1900MHz– Baseline
• Intel Core2 sc (laptop) :– 15W@1000MHz– 4x more FLOPs/watt than baseline
• IBM PPC 450 (BG/P - low power)– 0.625W@800MHz– 90x more
• Tensilica XTensa (Moto Razor) : – 0.09W@600MHz– 400x more
Intel Core2
Tensilica DP.09W
Power 5
Even if each core operates at 1/3 to 1/10th efficiency of largest chip, you can pack 100s more cores onto a chip and consume 1/20 the power

Green Flash Strawman System DesignWe examined three different approaches (in 2008 technology)
Computation .015oX.02oX100L: 10 PFlops sustained, ~200 PFlops peak• AMD Opteron: Commodity approach, lower efficiency for scientific
applications offset by cost efficiencies of mass market• BlueGene: Generic embedded processor core and customize system-on-
chip (SoC) to improve power efficiency for scientific applications• Tensilica XTensa: Customized embedded CPU w/SoC provides further
power efficiency benefits but maintains programmability
Processor Clock Peak/Core(Gflops)
Cores/Socket
Sockets Cores Power Cost2008
AMD Opteron 2.8GHz 5.6 2 890K 1.7M 179 MW $1B+IBM BG/P 850MHz 3.4 4 740K 3.0M 20 MW $1B+Green Flash / Tensilica XTensa
650MHz 2.7 32 120K 4.0M 3 MW $75M

Climate System Design ConceptStrawman Design Study
32 boards per rack
100 racks @ ~25KW
power + comms
32 chip + memory clusters per board (2.7
TFLOPS @ 700W
VLIW CPU: • 128b load-store + 2 DP MUL/ADD + integer op/ DMA
per cycle:• Synthesizable at 650MHz in commodity 65nm • 1mm2 core, 1.8-2.8mm2 with inst cache, data cache
data RAM, DMA interface, 0.25mW/MHz• Double precision SIMD FP : 4 ops/cycle (2.7GFLOPs)• Vectorizing compiler, cycle-accurate simulator,
debugger GUI (Existing part of Tensilica Tool Set)• 8 channel DMA for streaming from on/off chip DRAM• Nearest neighbor 2D communications grid
ProcArray
RAM RAM
RAM RAM
8 DRAM perprocessor chip:
~50 GB/s
CPU64-128K D
2x128b
32K I
8 chanDMA
CPU
D
IDM A
CPU
D
IDM A
CPU
D
IDM A
CPU
D
IDM A
CPU
D
IDM A
CPU
D
IDM A
CPU
D
IDM A
CPU
D
IDM A
CPU
D
IDM A
CPU
D
IDM A
CPU
D
IDM A
CPU
D
IDM A
CPU
D
IDM A
CPU
D
IDM A
CPU
D
IDM A
CPU
D
IDM A
CPU
D
IDM A
CPU
D
IDM A
CPU
D
IDM A
CPU
D
IDM A
CPU
D
IDM A
CPU
D
IDM A
CPU
D
IDM A
CPU
D
IDM A
CPU
D
IDM A
CPU
D
IDM A
CPU
D
IDM A
CPU
D
IDM A
CPU
D
IDM A
CPU
D
IDM A
CPU
D
IDM A
CPU
D
IDM A
Opt. 8M
B em
bedded DR
AM
External DRAM interface
External DRAM interface
External D
RA
M interfaceE
xter
nal D
RA
M in
terfa
ce
MasterProcessor
Comm LinkControl
32 processors per 65nm chip83 GFLOPS @ 7W

Green Flash Hardware Demo at SC08 and SC09
• Demonstrated during SC ’08 and ‘09
• Proof of concept – CSU atmospheric model ported
to Tensilica Architecture– Single Tensilica processor
running atmospheric model at 50MHz
• Emulation performance advantage– Processor running at 50MHz
vs. Functional model at 100 kHz
– 500x Speedup• Actual code running - not
representative benchmark

Silicon Photonics for Energy-Efficient Communication
• Silicon photonics enables optics to be integrated with conventional CMOS
• Enables up to 27x improvement in communication energy efficiency!
Silicon PhotonicRing Resonator
Summary• Power consumption is a huge problem in HPC
– “Bits”: we may not be able to scale to Exaflops without new technologies
• In particular need technology investment in memory
• Be prepared for low byte/Flop ratios– “Buildings”: we may have to spend
more $$ on infrastructure and less on computing
• Get ready for cloud computing as power consumption is going to change economics of computing
Extra Slides

Outline
1. Power consumption has become an industry-wide issue for computing
2. Building and computer room energy efficiency
3. Computer architecture for energy efficiency- the Green Flash project
4. Future
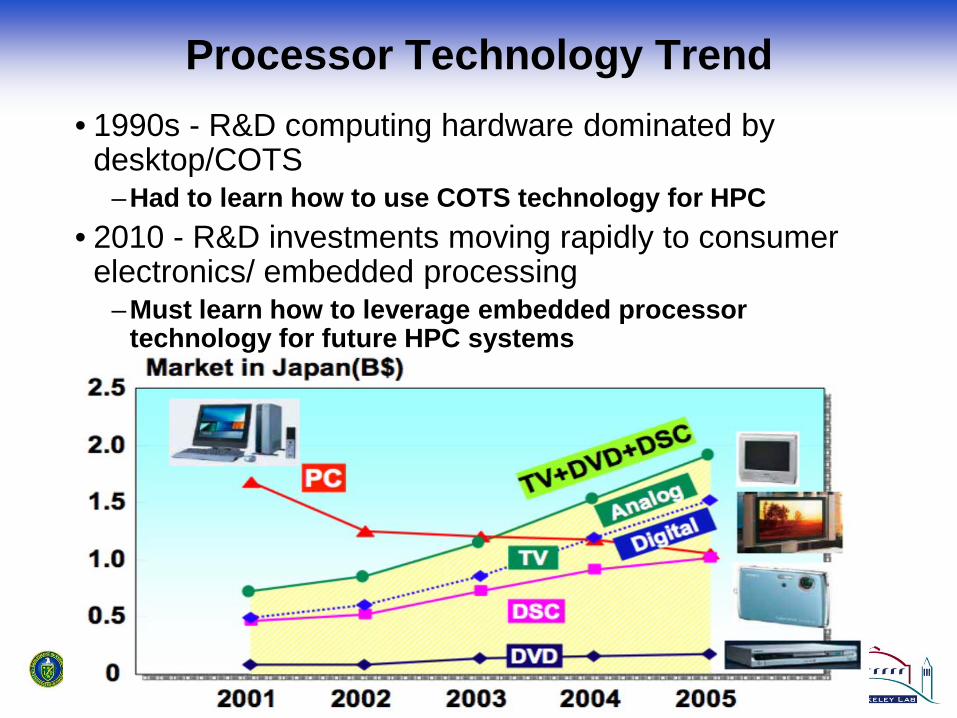
Processor Technology Trend • 1990s - R&D computing hardware dominated by
desktop/COTS–Had to learn how to use COTS technology for HPC
• 2010 - R&D investments moving rapidly to consumer electronics/ embedded processing
–Must learn how to leverage embedded processor technology for future HPC systems

Consumer Electronics has Replaced PCs as the Dominant Market Force in CPU Design!!
Apple Introduces
IPod
IPod+ITunes exceeds 50% of
Apple’s Net Profit
Apple Introduces Cell Phone (iPhone)

Presented at STF Workshop, Sept. 2008 by Bill Camp, Intel

The Transition to Low-Power Technology is Inevitable
• Information “factories” are only affordable for a few government labs and large commercial companies (Google, MSN, Yahoo …)
– Midrange installations will soon hit the 1 - 2 MW wall, requiring costly new installations
– Economics will change if operating expenses of a server exceed acquisition cost
• The industry will switch to low-power technology within 2 - 3 years
• Embedded processors or game processors will be the next step (BG, Cell, Nvidia, SiCortex, Tensilica)
– Example RR, first Petaflops system
Does it make sense to build systems that require the electric power equivalent of an aluminum smelter?
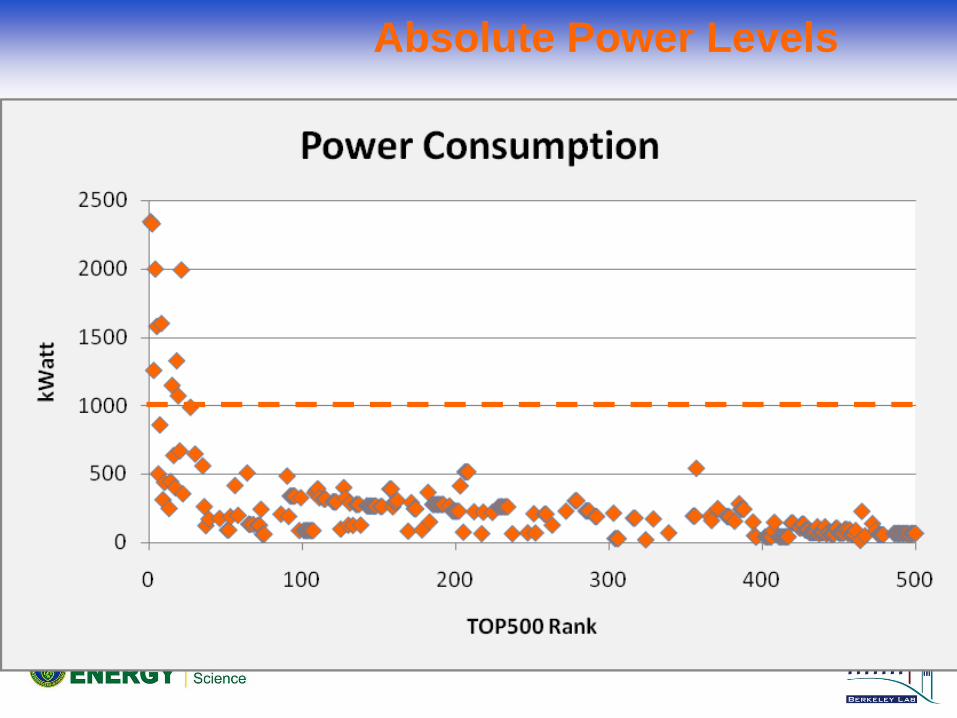
Absolute Power Levels
31st List / June 2008
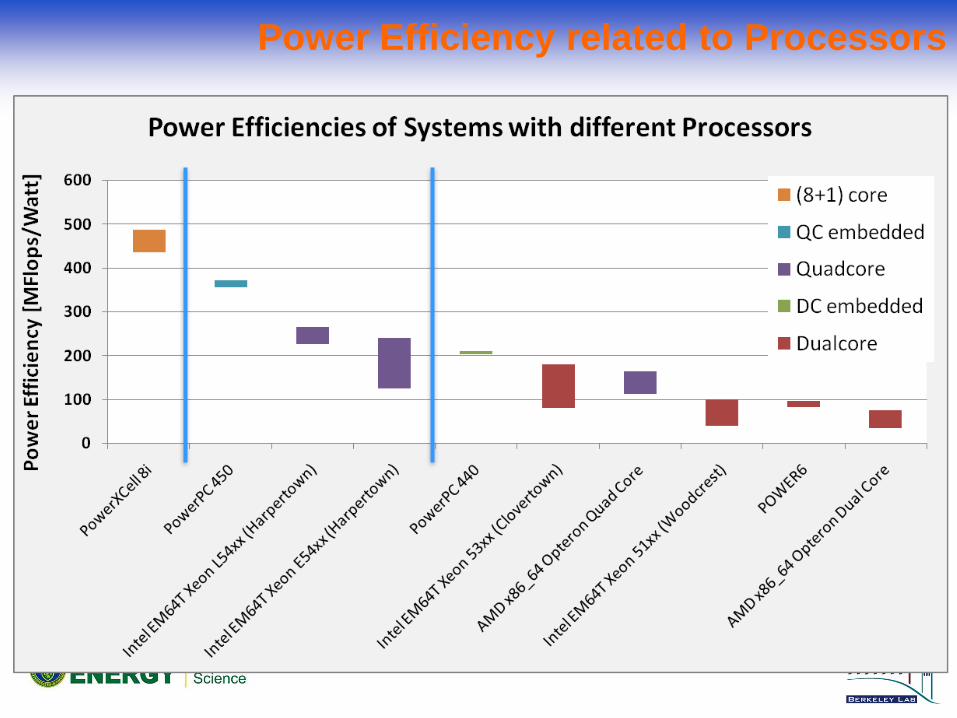
Power Efficiency related to Processors
31st List / June 2008
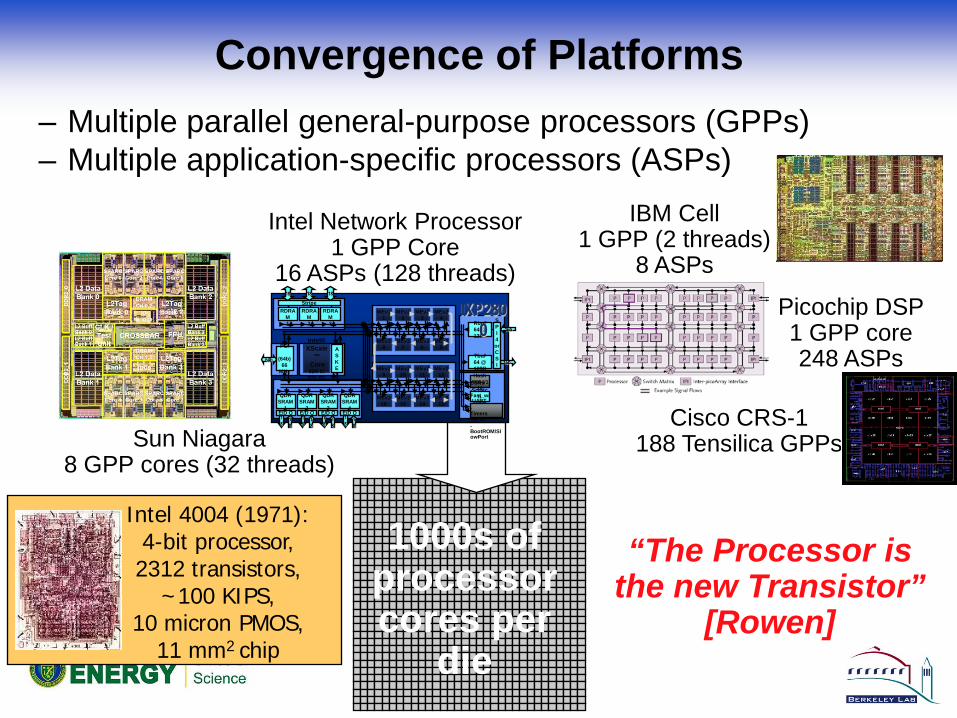
Convergence of Platforms– Multiple parallel general-purpose processors (GPPs)– Multiple application-specific processors (ASPs)
“The Processor is the new Transistor”
[Rowen]
Intel 4004 (1971): 4-bit processor,2312 transistors,
~100 KIPS, 10 micron PMOS,
11 mm2 chip
1000s of processor cores per
die
Sun Niagara8 GPP cores (32 threads)
Intel®XScale
™Core32K IC32K DC
MEv210
MEv211
MEv212
MEv215
MEv214
MEv213
Rbuf64 @ 128B
Tbuf64 @ 128BHash
48/64/128Scratch
16KBQDR
SRAM2
QDRSRAM
1
RDRAM1
RDRAM3
RDRAM2
GASKET
PCI
(64b)66
MHz
IXP2800 16b
16b
18
18
18
18
18 18 18
64b
SPI4orCSIX
Stripe
E/D Q E/D Q
QDRSRAM
3E/D Q18
18
MEv29
MEv216
MEv22
MEv23
MEv24
MEv27
MEv26
MEv25
MEv21
MEv28
CSRs -Fast_wr-UART-Timers-GPIO-BootROM/SlowPort
QDRSRAM
4E/D Q18
18
Intel Network Processor1 GPP Core
16 ASPs (128 threads)
IBM Cell1 GPP (2 threads)
8 ASPs
Picochip DSP1 GPP core248 ASPs
Cisco CRS-1188 Tensilica GPPs
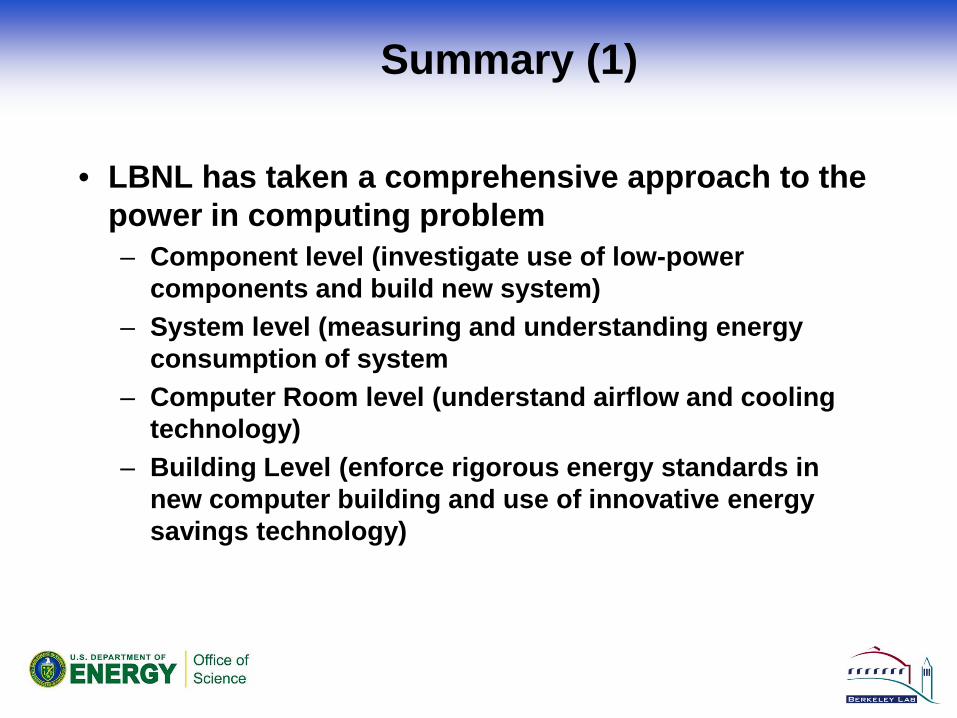
Summary (1)
• LBNL has taken a comprehensive approach to the power in computing problem– Component level (investigate use of low-power
components and build new system)– System level (measuring and understanding energy
consumption of system– Computer Room level (understand airflow and cooling
technology)– Building Level (enforce rigorous energy standards in
new computer building and use of innovative energy savings technology)
Summary (2)
• Economic factors are driving us already to more energy efficient solutions in computing
• Incremental improvements are well on track, but we may ultimately need revolutionary new technology to reach the Exaflop/s level and beyond
Outline
1. Power consumption has become an industry-wide issue for computing
2. Building and computer room energy efficiency
3. Computer architecture for energy efficiency- the Green Flash project
4. Towards a better understanding of “green computing”


