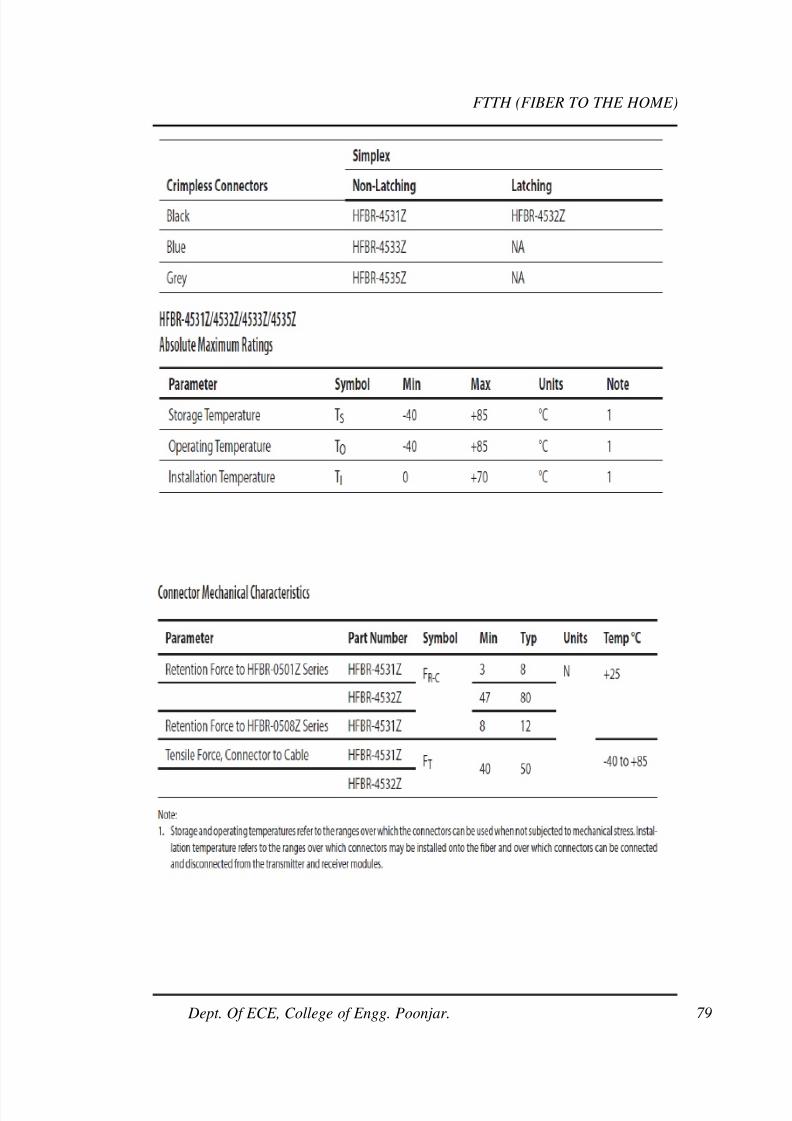
FTTH (FIBER TO THE HOME) Dept. Of ECE, College of Engg. Poonjar. 1 CHAPTER 1 INTRODUCTION Growing demand for high speed internet is the primary driver for the new access technologies which enable experiencing true broadband. Traditionally telecom companies have been offering T1 lines and DSL to small businesses, houses for applications such as voice services, high speed data, internet and video services. T1 lines are often expensive and DSL‟s performance issues limit availability of these services. DSL Copper networks do not allow sufficient data rates due to signal distortion and cross talk. Cable modem is another competing technology for broadband services. In cable modems only few RF channels are assigned for data and most of the bandwidth is dedicated to video channels. FTTH offers triple play services with data speeds ranging from 155 Mbps to 2.5Gbps Downstream (Network to User) and 155 Mbps to 1Gbps Up stream (User to Network) range of services due to high bandwidth and Though the field trials and technology development for fiber in the access loop started in late 1980s, real deployments did not happen as the deployment costs were very hi gh at that time. In the last 20 years enormous progress is made in optical networking equipment and production of high quality optical fibers associated with falling prices are driving forces for fiber to the home(FTTH). The recent telecom bubble burst also had hard hit on the big telecom players and the revenue generation from the long haul core networks are falling. This lead to shift in the business strategy for maximizing the revenue generation from access loop and wireless. While there is no standard definition for broadband, definition of broadband has become country specific. In Japan more than 1 Mbps is defined as broadband and in India bandwidth more than 256kbps is specified as broadband.
Transcript
8/2/2019 Ftth Report
http://slidepdf.com/reader/full/ftth-report 1/83
FTTH (FIBER TO THE HOME)
Dept. Of ECE, College of Engg. Poonjar. 1
CHAPTER 1
INTRODUCTION
Growing demand for high speed internet is the primary driver for the new
access technologies which enable experiencing true broadband. Traditionally
telecom companies have been offering T1 lines and DSL to small businesses,
houses for applications such as voice services, high speed data, internet and video
services. T1 lines are often expensive and DSL‟s performance issues limit
availability of these services. DSL Copper networks do not allow sufficient data
rates due to signal distortion and cross talk. Cable modem is another competing
technology for broadband services. In cable modems only few RF channels are
assigned for data and most of the bandwidth is dedicated to video channels.
FTTH offers triple play services with data speeds ranging from 155 Mbps
to 2.5Gbps Downstream (Network to User) and 155 Mbps to 1Gbps Up stream
(User to Network) range of services due to high bandwidth and Though the field
trials and technology development for fiber in the access loop started in late
1980s, real deployments did not happen as the deployment costs were very high at
that time. In the last 20 years enormous progress is made in optical networking
equipment and production of high quality optical fibers associated with falling
prices are driving forces for fiber to the home(FTTH). The recent telecom bubble
burst also had hard hit on the big telecom players and the revenue generation from
the long haul core networks are falling. This lead to shift in the business strategy
for maximizing the revenue generation from access loop and wireless. While there
is no standard definition for broadband, definition of broadband has become
country specific. In Japan more than 1 Mbps is defined as broadband and in India
bandwidth more than 256kbps is specified as broadband.
8/2/2019 Ftth Report
http://slidepdf.com/reader/full/ftth-report 2/83
FTTH (FIBER TO THE HOME)
Dept. Of ECE, College of Engg. Poonjar. 2
1.1 WHY FTTH
FTTH is a true multi service communications access which simultaneously
handles several phone calls, TV/Video streams and Internet users in the
home/office. There are several advantages of deploying FTTH over other
traditional access technologies as given below:
· FTTH provides end-users with a broad range of communications and
entertainment services, and faster activation of new services.
· Competition is beginning to offer a “multi-play” (i.e. voice, video, data etc.)
bundle.
· FTTH provides service provider‟s with the ability to provide “cutting edge”
technology and “best-in-class” services.
· Deploying a fiber optic cable to each premise will provide an extraordinary
amount of bandwidth for future services.
· FTTH provides the community in which it‟s located with superior
communications which enhance the efficiency of local business and thus deliver
economic advantage for the community.
· Around the world FTTH is viewed as strategic national infrastructure similar to
roads, railways, and telephone networks.
· FTTH provides carriers with an opportunity to increase the Average Revenues
Per User (ARPU), to reduce the capital
1.2 FIBER IN THE LOOP
Fiber In The Loop (FITL) is a system implementing or upgrading portions of the
POTS local loop with fiber optic technology from the central office of a telephone
carrier to a remote Serving area interface (SAI) located in a neighborhood or to an
Optical Network Unit (ONU) located at the customer premises (residential and/or
business). Generally, fiber is used in either all or part of the local loop distribution
8/2/2019 Ftth Report
http://slidepdf.com/reader/full/ftth-report 3/83
FTTH (FIBER TO THE HOME)
Dept. Of ECE, College of Engg. Poonjar. 3
network. FITL includes various architectures, such as fiber to the curb (FTTC),
fiber to the home (FTTH) and fiber to the premises (FTTP).
Residential areas already served by balanced pair distribution plant call for a trade-off
between cost and capacity. The closer the fiber head, the higher the cost of
construction and the higher the channel capacity. In places not served by metallic
facilities, little cost is saved by not running fiber to the home.
Fiber to the x (FTTX) is a generic term for any network architecture that uses
optical fiber to replace all or part of the usual copper local loop used for
telecommunications.
The four technologies, in order of an decreasingly fiber loop length are:
Fiber to the node / neighborhood (FTTN) / Fiber to the cabinet (FTTCab)
Fiber to the curb (FTTC) / Fiber to the kerb (FTTK)
Fiber to the building (FTTB)
Fiber to the home (FTTH)
8/2/2019 Ftth Report
http://slidepdf.com/reader/full/ftth-report 4/83
FTTH (FIBER TO THE HOME)
Dept. Of ECE, College of Engg. Poonjar. 4
CHAPTER 2
BASICS OF OFC
2.1 OPTICAL FIBER COMMUNICATION
Optical fiber has a number of advantages over the copper wire used to make
connections electrically. For example, optical fiber, being made of glass or plastic,
is immune to electromagnetic interference which is caused by thunderstorms.
Also, because light has a much higher frequency than any radio signal we can
generate, fiber has a wider bandwidth and can therefore carry more information at
one time.
Most telephone company long-distance lines are now of optical fiber.
Transmission on optical fiber wire requires repeaters at distance intervals. The
glass fiber requires more protection within an outer cable than copper. For these
reasons and because the installation of any new wiring is labor-intensive, few
communities yet have optical fiber wires or cables from the phone company's
Fiber optic transmitters are devices that include an LED or laser source,
and signal conditioning electronics, to inject a signal into fiber. The modulated
light may be turned on or off, or may be linearly varied in intensity between two
predetermined levels. Light Emitting Diodes (LEDs) have relatively large
emitting areas and as a result are not as good light sources as laser diodes.
However, they are widely used for short to moderate transmission distances
because they are much more economical. Laser diodes can couple many times
more power to optical fiber than LEDs. They are primarily used for applications
that require the transmission of signals over long distances.
Important performance specifications to consider when searching for fiber
optic transmitters include data rate, transmitter rise time, wavelength, spectral
width, and maximum optical output power. Data rate is the number of data bits
transmitted in bits per second. Data rate is a way of expressing the speed of the
transceiver. In the approximation of a step function, the transmitter rise time is
the time required for a signal to change from a specified 10% to 90% of full
power. Rise time is a way of expressing the speed of the transmitter. Wavelength
refers to the output wavelength of the transceiver. The spectral width refers to the
spectral width of the output signal.
2.1.2 RECEIVERS
Fiber optic receivers are instruments that convert light into electrical
signals. They contain a photodiode semiconductor, signal conditioning circuitry,
and an amplifier. Fiber optic receivers use three types of photodiodes: positive-
negative (PN) junctions, positive-intrinsic-negative (PIN) photodiodes, and
avalanche photodiodes (APD). PIN photodiodes have a large, neutrally-doped
region between the p-doped and n-doped regions. APDs are PIN photodiodes that
operate with high reverse-bias voltages. In short wavelength fiber optic receivers
(400 nm to 1100 nm), the photodiode is made of silicon (Si).
8/2/2019 Ftth Report
http://slidepdf.com/reader/full/ftth-report 6/83
FTTH (FIBER TO THE HOME)
Dept. Of ECE, College of Engg. Poonjar. 6
In long wavelength systems (900 nm to 1700 nm), the photodiode is made
of indium gallium arsenide (InGaAs). With low-impedance amplifiers, bandwidth
and receiver noise decrease with resistance. With trans-impedance amplifiers, the
bandwidth of the receiver is affected by the gain of the amplifier. Typically, fiber
optic receivers include a removable adaptor for connections to other devices. Data
outputs include transistor-transistor logic (TTL), emitter-coupled logic (ECL),
video, radio frequency (RF), and complementary metal oxide semiconductor (CMOS)
signals. Also, it uses many types of connectors.
2.2 LITERATURE REVIEW.
Today‟s standard optical fiber is the product of precision manufacturing
techniques and exacting standards. Even though it is found in almost any data or
communications link, optical fiber is a finely tuned instrument requiring care in its
production, handling, and installation. As shown in Figure, a typical optical fiber
comprises three main components: the core, which carries the light; the cladding,
which surrounds the core with a lower refractive index and contains the light; and
the coating, which protects the fragile fiber within.
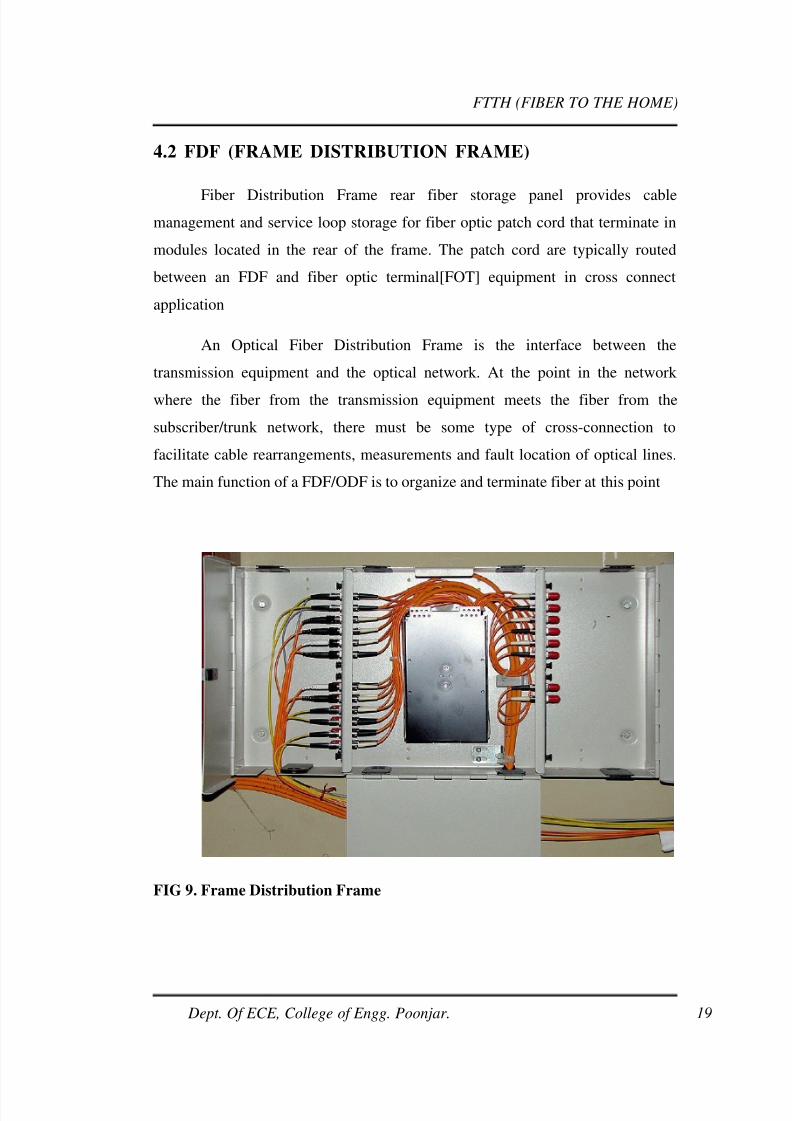
FIG 2.Crosssection Of OFC
8/2/2019 Ftth Report
http://slidepdf.com/reader/full/ftth-report 7/83
FTTH (FIBER TO THE HOME)
Dept. Of ECE, College of Engg. Poonjar. 7
2.2.1 CORE
The core, which carries the light, is the smallest and most fragile part of
the optical fiber. The optical fiber core is usually made of glass, although some
are made of plastic. The glass used in the core is extremely pure silicon dioxide
(SiO2). In the manufacturing process, the glass used in the core has impurities
such as germanium or phosphorous added to raise the refractive index under
controlled conditions. Optical fiber cores are manufactured in different diameters
for different applications. Typical glass cores range from as small as 3.7 µm up to
200µm. Core sizes commonly used in telecommunications are 9µm, 50µm and
62.5µm. Plastic optical fiber cores can be much larger than glass. A popular
plastic core size is about 1000µm.
2.2.2 CLADDING
Surrounding and protecting the core, and providing the lower refractive
index to make the optical fiber work, is the cladding. When glass cladding is used,
the cladding and the core are manufactured together from the same silicon
dioxide – based material in a permanently fused state. The manufacturing process
adds different amounts of impurities to the core and the cladding to maintain a
difference in refractive indices between them of about 1 percent. Typically, the
core will have a refractive index of 1.48, while the cladding will have a refractive
index of 1.46. Like the core, cladding is manufactured in standard diameters. The
two most commonly used diameters are 125 µm and 140 µm. The 125µm
cladding typically supports core sizes of 9µ, 50µ, 62.5µ, and 85µ. The
140cladding typically has a 100 µcore.
8/2/2019 Ftth Report
http://slidepdf.com/reader/full/ftth-report 8/83
FTTH (FIBER TO THE HOME)
Dept. Of ECE, College of Engg. Poonjar. 8
2.2.3 COATING
The coating is the true protective layer of the optical fiber. Generally made
of plastic or acrylate, the coating absorbs the shocks, nicks, scrapes, and even
moisture that could damage the cladding. Without the coating, the optical fiber is
very fragile. A single microscopic nick in the cladding could cause the optical
fiber to break when it‟s bent. Coating is essential for all-glass fibers, and they are
not sold without it. The coating is solely protective. It does not contribute to the
light-carrying ability of the optical fiber in any way. The outside diameter of thecoating is typically either 250µm or 500 µm. The coating is typically colorless. In
some communication applications, however, the coating is colored so that
individual optical fibers in a group of optical fibers can be identified.
2.3 FIBER
Fiber is the medium to guide the light form the transmitter to the receiver.
It is classified into two types depending on the way the light is transmitted:
multimode fiber and single-mode fiber.
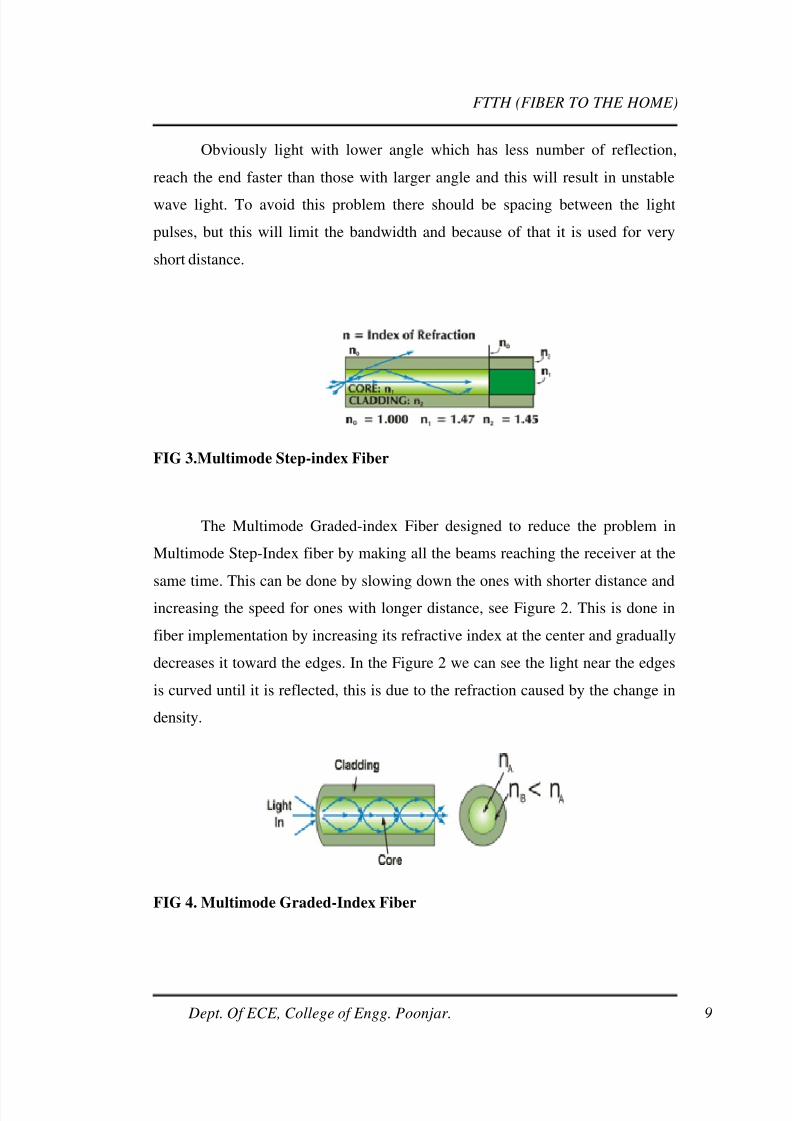
2.3.1 MULTIMODE FIBER
Multimode fiber designed to transmit more than one light at a time. Fiber
diameter ranges from 50-to-100 micron. Multimode fibers can be divided in to
two categories Multimode Step-index Fiber and Multimode Graded-index FiberIn
Multimode Step-index Fiber the lights are sent at angles lower than the critical
angle or straight (or simply the angle is zero). Any light angle exceed the critical
angle will cause it to penetrate through cladding (refracted) and being lost as
shown in Figure 1.
8/2/2019 Ftth Report
http://slidepdf.com/reader/full/ftth-report 9/83
FTTH (FIBER TO THE HOME)
Dept. Of ECE, College of Engg. Poonjar. 9
Obviously light with lower angle which has less number of reflection,
reach the end faster than those with larger angle and this will result in unstable
wave light. To avoid this problem there should be spacing between the light
pulses, but this will limit the bandwidth and because of that it is used for very
short distance.
FIG 3.Multimode Step-index Fiber
The Multimode Graded-index Fiber designed to reduce the problem in
Multimode Step-Index fiber by making all the beams reaching the receiver at the
same time. This can be done by slowing down the ones with shorter distance and
increasing the speed for ones with longer distance, see Figure 2. This is done in
fiber implementation by increasing its refractive index at the center and gradually
decreases it toward the edges. In the Figure 2 we can see the light near the edges
is curved until it is reflected, this is due to the refraction caused by the change in
density.
FIG 4. Multimode Graded-Index Fiber
8/2/2019 Ftth Report
http://slidepdf.com/reader/full/ftth-report 10/83
FTTH (FIBER TO THE HOME)
Dept. Of ECE, College of Engg. Poonjar. 10
2.3.2 SINGLE-MODE FIBER
In single-mode, only one light is transmitted in the fiber which diameter
ranges from 8.3 to 10 microns, see Figure 3. Since there is only one light the
problem associated with the multimode fiber does not exist and by this we can
have a higher transmission rate and also it can be used for longer distance. To
utilize the fiber a Wave-Division-Multiplexing (WDM) is used as it will be
described later.
This type of fiber has been improved over years and that result in three
types of single-mode fiber. The first is Non Dispersion-Shifted Fiber (NDSF)
which was used to transmit light with wave length 1310 nm, but some systems use
it with a wave length of 1550 nm and this wave length causes dispersion (losing
pulse mode) with this type of fibers. The second type is Dispersion-Shifted Fiber
(DSF), in this type the dispersion is shifted so that the dispersion at the wave
length 1550 nm is zero and in this way we could solve the problem of the first.
But system with DWDM (Dense Wavelength Division Multiplexing) found to be
nonlinear with this type of fiber. The term Dense Wavelength Division
Multiplexing (DWDM) came from the tremendously increase in use of WDM.
The third type is Non Zero-Dispersion-Shifted Fibers (NZ-DSF) which is
designed to solve the problems with the previous two.
FIG 5. Single-Mode Fiber
8/2/2019 Ftth Report
http://slidepdf.com/reader/full/ftth-report 11/83
FTTH (FIBER TO THE HOME)
Dept. Of ECE, College of Engg. Poonjar. 11
CHAPTER 3
FTTH SYSTEM OVERVIEW
3.1 FTTH ARCHITECTURE
Active and passive are two commonly used FTTH architectures for FTTH
deployment. Active Architecture is also called as Point 2 Point(P2P) and Passive
Optical Network (PON) architecture is called Point to Multi Point(P2M). Choiceof active or passive architectures for deployment depends on the type of services
to be delivered, cost of the infrastructure, current infrastructure and future plans
for migrating to new technology. ACTIVE Technology Active Ethernet also
called Ethernet Switched Optical Network (ESON) or Point to Point(P2P)
Network architecture provides a dedicated fiber to the side from the central office
exchange shown in the figure 2.1. A P2P architecture is a very simple network
design. Since the fiber is dedicated, Operation, administration and maintenance of
the content and trouble shooting become easy. Active FTTH solutions are
implemented in many different ways, through both standard and proprietary
methods. Since the distances of the central node and remote sites are known,
estimation of power budget, trouble shooting the faults in the network would be
easier. Transmission in P2P configuration, is more secure, since all transmissions
are physically separated by fiber. Only the end points will transmit and receive
information, which is not mixed with that of any other customer.
3.1.1 ACTIVE NETWORK ARCHITECTURE
Core switch, Aggregation switch and Optical Network Terminal (ONT)
are main building blocks of an P2P network. The Core Switch is a high capacity
Ethernet switch that communicates to Aggregator Switches using standard GbE
optical signals. The Aggregator Switch interfaces this data stream to multiple
Premises Gateways called Optical Network Terminals(ONT).
8/2/2019 Ftth Report
http://slidepdf.com/reader/full/ftth-report 12/83
FTTH (FIBER TO THE HOME)
Dept. Of ECE, College of Engg. Poonjar. 12
FIG 6. Point to Point Network
The Core Switch interfaces multiple content and service providers over an
MPLS-based Metro or Regional network to deliver data, video, and voice services
to the users on the access network. Aggregator Switch resides in both standard CO
and in building entrance and in outside plant cabinets to meet the environmental
needs of the network provider. The Aggregator Switch delivers traffic to the
subscriber in accordance with the specific bandwidth requirements from 1 Mb/s to
100 Mb/s (symmetrical) per subscriber.
3.1.2 PASSIVE OPTICAL NETWORK (PON) TECHNOLOGY
PON is a point to multipoint (P2M) network . Each customer is connected
into the optical network via a passive optical splitter, therefore, no active
electronics in the distribution network and bandwidth is shared from the feeder to
the drop.
8/2/2019 Ftth Report
http://slidepdf.com/reader/full/ftth-report 13/83
FTTH (FIBER TO THE HOME)
Dept. Of ECE, College of Engg. Poonjar. 13
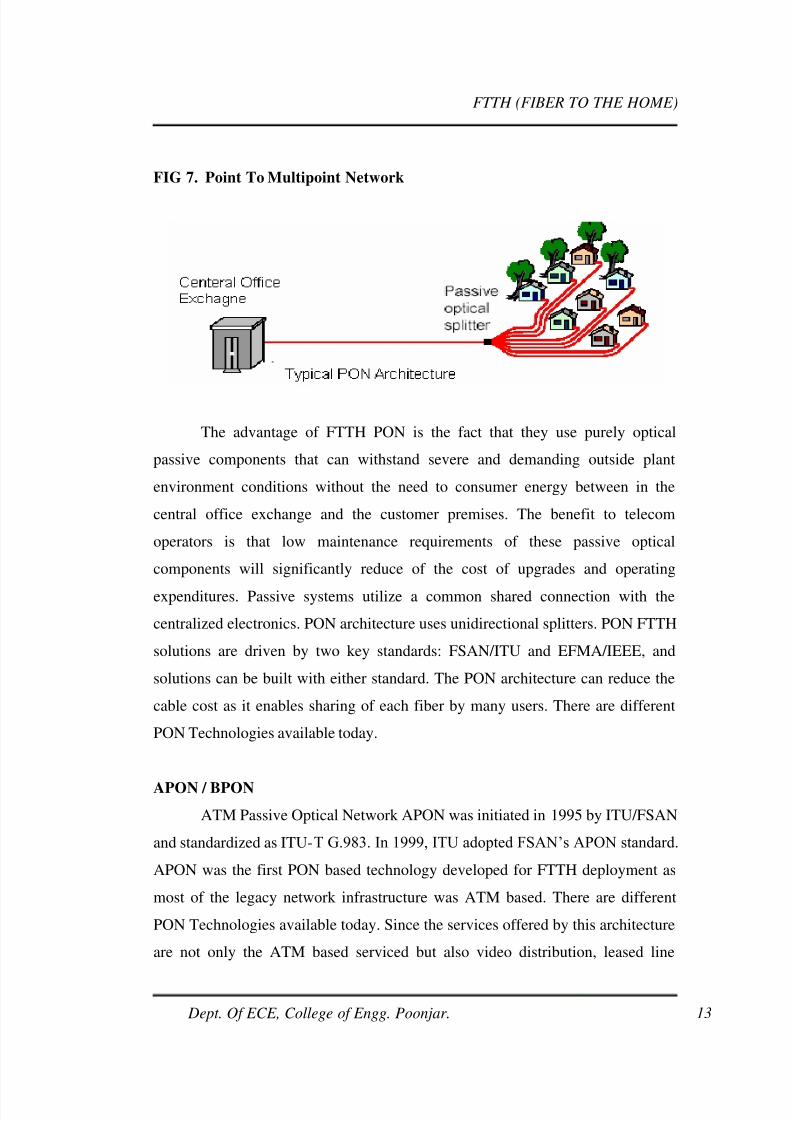
FIG 7. Point To Multipoint Network
The advantage of FTTH PON is the fact that they use purely optical
passive components that can withstand severe and demanding outside plant
environment conditions without the need to consumer energy between in the
central office exchange and the customer premises. The benefit to telecom
operators is that low maintenance requirements of these passive optical
components will significantly reduce of the cost of upgrades and operating
expenditures. Passive systems utilize a common shared connection with the
A single splitter is shown in the GPON network diagram below. Note that
the splitter can be deployed in the Central Office (CO) alongside the OLT, or it
may be deployed in an OutSidePlant (OSP) cabinet closer to the subscribers. A
splitter can also be deployed in the basement of a building for a Multiple Dwelling
Unit (MDU) installation.
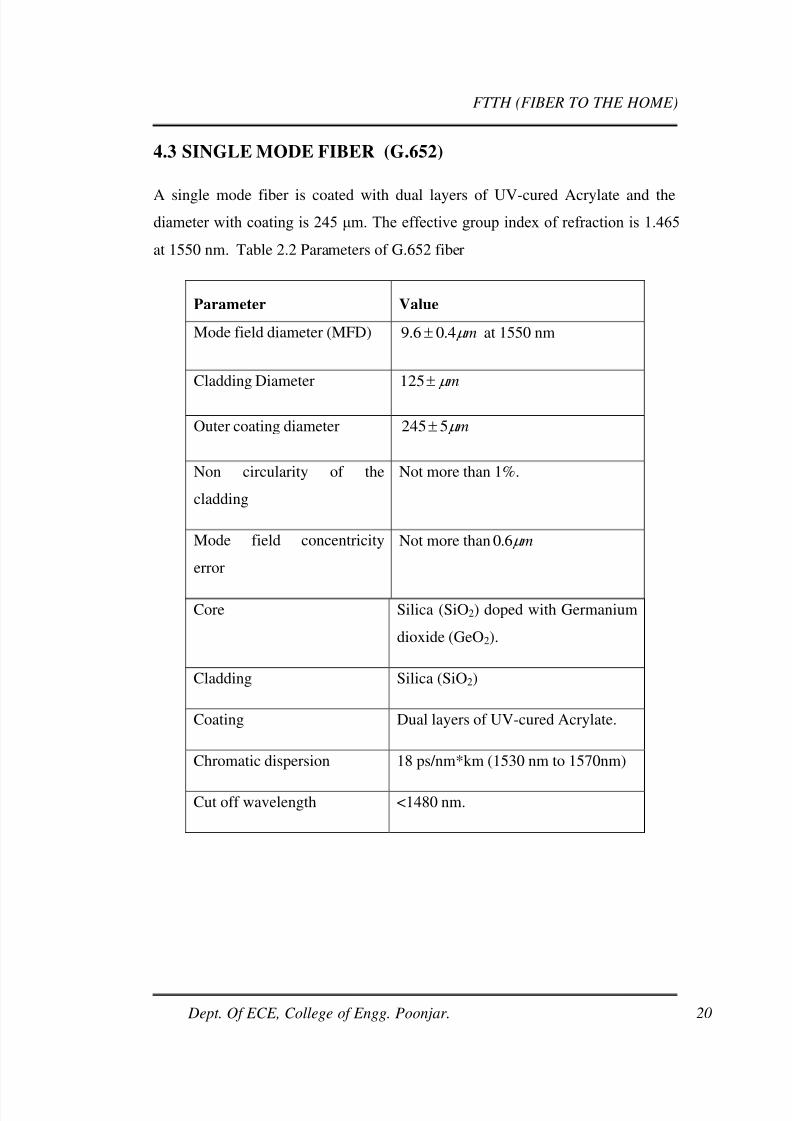
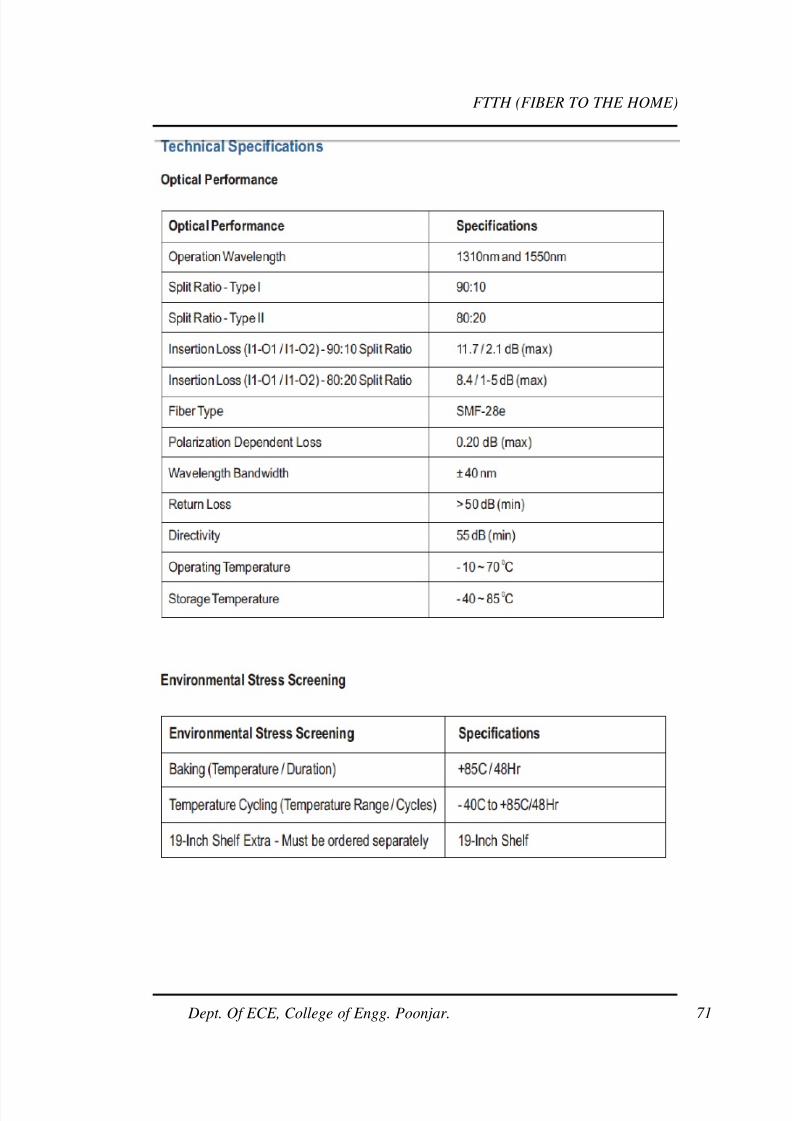
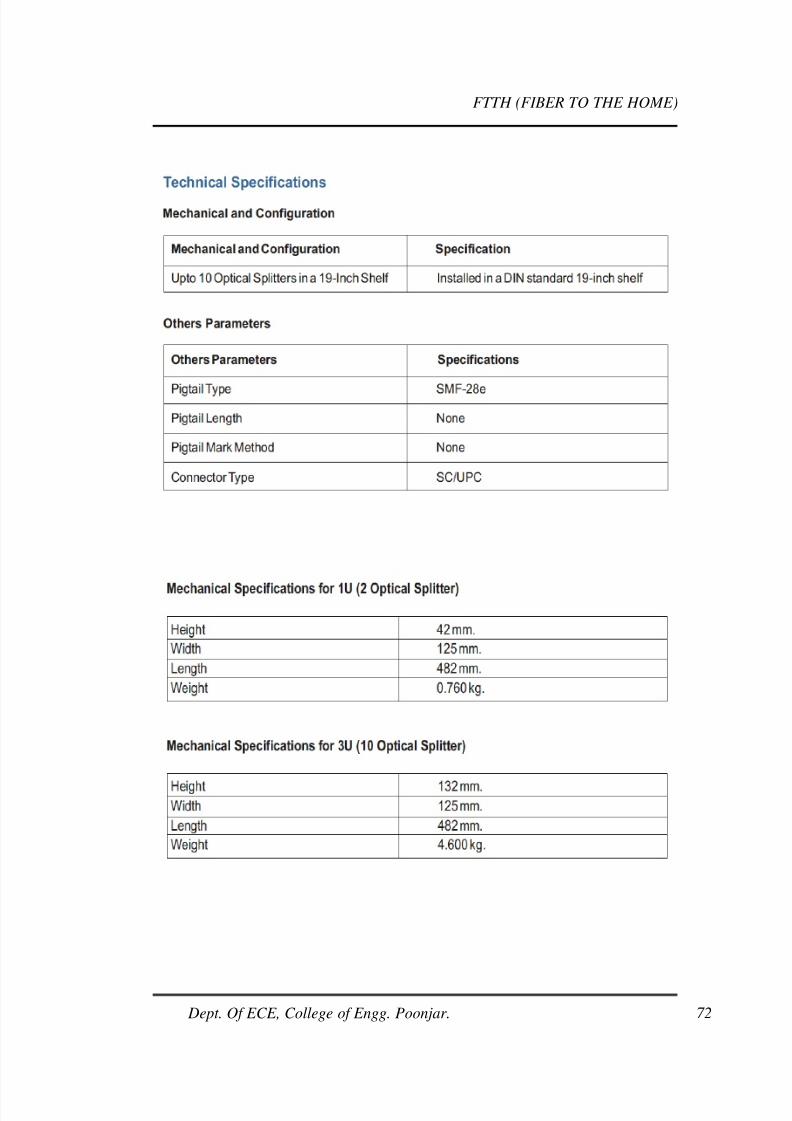
Table 2.3 Splitter attenuation
FIG 10. PON Splitter
1*2splitter 3.5 db
1*4splitter 7.4 db
1*8splitter 11 db
1*16splitter 14.3 db
1*32splitter 17.8 db
8/2/2019 Ftth Report
http://slidepdf.com/reader/full/ftth-report 23/83
FTTH (FIBER TO THE HOME)
Dept. Of ECE, College of Engg. Poonjar. 23
4.5 ONT (OPTICAL NETWORK TERMINAL)
An ONT is a media converter that is installed by Verizon either outside or
inside your premises. An ONT is a media converter that is installed by Verizon
either outside or inside your premises
The ONT converts fiber-optic light signals to copper/electric signals.
Three wavelengths of light are used between the ONT and the OLT:
• 1310 nm voice/data transmit
• 1490 nm voice/data r eceive
• 1550 nm video receive
Each ONT is capable of delivering:
Multiple POTS (plain old telephone service) lines
Internet data
Video
8/2/2019 Ftth Report
http://slidepdf.com/reader/full/ftth-report 24/83
FTTH (FIBER TO THE HOME)
Dept. Of ECE, College of Engg. Poonjar. 24
CHAPTER 5
EXPERIMENTS
5.1 VERIFICATION OF INSERTION LOSS CHECK OF
DIFFERENT TYPES OF SPLITTERS
TYPES OF SPLITTERS :
1. 1x4 Splitter
2. 2x4 Splitter
3. 1x32 Splitter
5.1.1 1X4SPLITTER
Downstream: Path loss
Sending level at +1.40 dBm for wavelength at 1490nm at Com Port 1
COM PORT 1
Measured at Port Rx Level (dBm) Insertion Loss(dB) Limit
(dB)
Theorectical
Value
(10 log 1/ N)
1 -5.25 6.65 7.4 6.02
2 -5.06 6.46 7.4 6.02
3 -5.65 7.05 7.4 6.02
4 -5.27 6.67 7.4 6.02
8/2/2019 Ftth Report
http://slidepdf.com/reader/full/ftth-report 25/83
FTTH (FIBER TO THE HOME)
Dept. Of ECE, College of Engg. Poonjar. 25
Upstream: Path loss
Sending level at -3.20 dBm for wavelength at 1310nm at individual ports
COM PORT 1
Feeding at Port Rx Level (dBm) Insertion Loss(dB) Limit
(dB)
Theorectical
Value
(10 log 1/ N)
1 -10.00 6.80 7.4 6.02
2 -10.10 6.90 7.4 6.02
3 -10.25 7.05 7.4 6.02
4 -10.05 6.85 7.4 6.02
8/2/2019 Ftth Report
http://slidepdf.com/reader/full/ftth-report 26/83
FTTH (FIBER TO THE HOME)
Dept. Of ECE, College of Engg. Poonjar. 26
5.1.2. 2X4SPLITTER
Downstream: Path loss (1490 nm)
Sending level at +1.40 dBm for wavelength at 1490 nm at Individual ports
COM PORT 1
Sending level: +1.40 dBm
COM PORT 2
Sending level: +1.40 dBm
Limit
(dB)
Measured at
Port
Rx Level
(dBm)
Insertion
Loss(dB)
Rx
Level(dBm)
Insertion
Loss(dB)
1 -5.40 6.80 -5.32 6.72 7.4
2 -5.41 6.81 -5.30 6.70 7.4
3 -5.72 7.12 -5.85 7.25 7.4
4 -5.52 6.92 -5.35 6.75 7.4
8/2/2019 Ftth Report
http://slidepdf.com/reader/full/ftth-report 27/83
FTTH (FIBER TO THE HOME)
Dept. Of ECE, College of Engg. Poonjar. 27
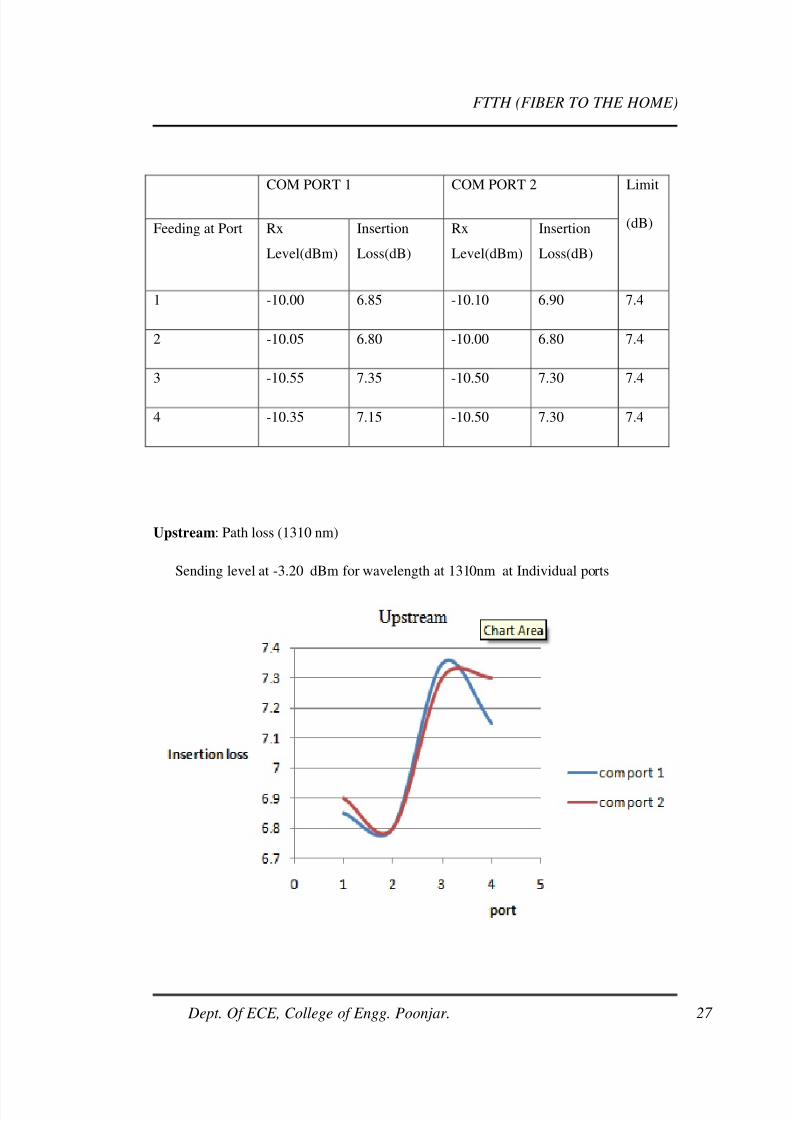
Upstream: Path loss (1310 nm)
Sending level at -3.20 dBm for wavelength at 1310nm at Individual ports
COM PORT 1 COM PORT 2 Limit
(dB)Feeding at Port Rx
Level(dBm)
Insertion
Loss(dB)
Rx
Level(dBm)
Insertion
Loss(dB)
1 -10.00 6.85 -10.10 6.90 7.4
2 -10.05 6.80 -10.00 6.80 7.4
3 -10.55 7.35 -10.50 7.30 7.4
4 -10.35 7.15 -10.50 7.30 7.4
8/2/2019 Ftth Report
http://slidepdf.com/reader/full/ftth-report 28/83
FTTH (FIBER TO THE HOME)
Dept. Of ECE, College of Engg. Poonjar. 28
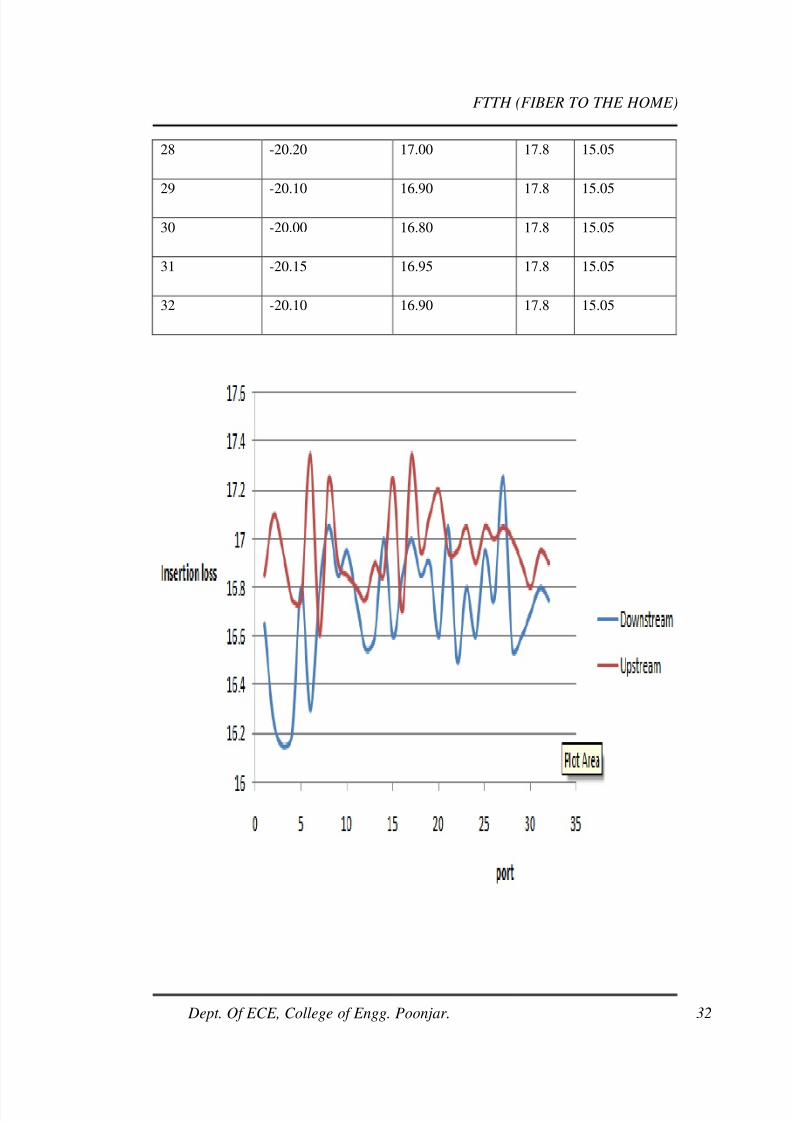
5.1.3 1X32SPLITTER
Downstream: Path loss
Sending level at +3.70 dBm for wavelength at 1490nm at Com Port 1
COM PORT 1
Measured at Port Rx Level (dBm) Insertion
Loss(dB)
Limit
(dB)
Theorectical
Value
(10 log 1/ N)
1 -12.95 16.65 17.8 15.05
2 -12.55 16.25 17.8 15.05
3 -12.45 16.15 17.8 15.05
8/2/2019 Ftth Report
http://slidepdf.com/reader/full/ftth-report 29/83
FTTH (FIBER TO THE HOME)
Dept. Of ECE, College of Engg. Poonjar. 29
4 -12.50 16.20 17.8 15.05
5 -12.90 16.80 17.8 15.05
6 -12.60 16.30 17.8 15.05
7 -13.10 16.80 17.8 15.05
8 -13.35 17.05 17.8 15.05
9 -13.15 16.85 17.8 15.05
10 -13.25 16.95 17.8 15.05
11 -13.05 16.75 17.8 15.05
12 -12.85 16.55 17.8 15.05
13 -12.90 16.60 17.8 15.05
14 -13.30 17.00 17.8 15.05
15 -12.90 16.60 17.8 15.05
16 -13.15 16.85 17.8 15.05
17 -13.30 17.00 17.8 15.05
18 -13.15 16.85 17.8 15.05
19 -13.20 16.90 17.8 15.05
20 -12.90 16.60 17.8 15.05
21 -13.35 17.05 17.8 15.05
22 -12.80 16.50 17.8 15.05
23 -13.10 16.80 17.8 15.05
24 -12.90 16.60 17.8 15.05
8/2/2019 Ftth Report
http://slidepdf.com/reader/full/ftth-report 30/83
FTTH (FIBER TO THE HOME)
Dept. Of ECE, College of Engg. Poonjar. 30
25 -13.25 16.95 17.8 15.05
26 -13.05 16.75 17.8 15.05
27 -13.55 17.25 17.8 15.05
28 -12.85 16.55 17.8 15.05
29 -12.90 16.60 17.8 15.05
30 -13.00 16.70 17.8 15.05
31 -13.10 16.80 17.8 15.05
32 -13.05 16.75 17.8 15.05
Upstream: Path loss
Sending level at -3.20 dBm for wavelength at 1310nm at individual ports
COM PORT 1
Feeding at Port Rx Level(dBm) Insertion
Loss(dB)
Limit
(dB)
Theorectical
Value
(10 log 1/ N)
1 -20.05 16.85 17.8 15.05
2 -20.30 17.10 17.8 15.05
3 -20.15 16.95 17.8 15.05
4 -19.95 16.75 17.8 15.05
5 -19.95 16.75 17.8 15.05
6 -20.55 17.35 17.8 15.05
8/2/2019 Ftth Report
http://slidepdf.com/reader/full/ftth-report 31/83
FTTH (FIBER TO THE HOME)
Dept. Of ECE, College of Engg. Poonjar. 31
7 -19.80 16.60 17.8 15.05
8 -20.45 17.25 17.8 15.05
9 -20.10 16.90 17.8 15.05
10 -20.05 16.85 17.8 15.05
11 -20.00 16.80 17.8 15.05
12 -19.95 16.75 17.8 15.05
13 -20.10 16.90 17.8 15.05
14 -20.05 16.85 17.8 15.05
15 -20.45 17.25 17.8 15.05
16 -19.90 16.70 17.8 15.05
17 -20.55 17.35 17.8 15.05
18 -20.15 16.95 17.8 15.05
19 -20.30 17.10 17.8 15.05
20 -20.40 17.20 17.8 15.05
21 -20.15 16.95 17.8 15.05
22 -20.15 16.95 17.8 15.05
23 -20.25 17.05 17.8 15.05
24 -20.10 16.90 17.8 15.05
25 -20.25 17.05 17.8 15.05
26 -20.20 17.00 17.8 15.05
27 -20.25 17.05 17.8 15.05
8/2/2019 Ftth Report
http://slidepdf.com/reader/full/ftth-report 32/83
FTTH (FIBER TO THE HOME)
Dept. Of ECE, College of Engg. Poonjar. 32
28 -20.20 17.00 17.8 15.05
29 -20.10 16.90 17.8 15.05
30 -20.00 16.80 17.8 15.05
31 -20.15 16.95 17.8 15.05
32 -20.10 16.90 17.8 15.05
8/2/2019 Ftth Report
http://slidepdf.com/reader/full/ftth-report 33/83
FTTH (FIBER TO THE HOME)
Dept. Of ECE, College of Engg. Poonjar. 33
5.2 SPLITTER ANALYSIS
Splitter Analysis is carried out by varying the Variable Optical
Attenuator, which is placed before and after the splitter. By varying the
attenuation, link length can be varied.
5.2.1 1 X 4 SPLITTER
Case 1: Attenuator placed before Splitter
CONNECTION DIAGRAM:
2.5Gbps Tx Tx 2.5Gbps
Rx
PROCEDURE:
1. Power meter is set to 1550nm wavelength.
2. Attenuator is set to low value.
3. 2.5 Gbps input data stream is given to attenuator from STM-16 equipment.
4. The attenuator is connected to 1x4 splitter.
5. The output port of the splitter is connected back to the Rx of the STM-16
equipment.
6. Vary the attenuator value, until UAS (Unavailable Seconds) ≠ 0.
Attenuation (dB) Distance (Km) UAS BBER
1 4 0 0
5 20 0 0
10 40 0 0
11 44 0 0
11.4 45.6 0 7.13x10⁻⁷
STM-16+99
EQUIPMENT
VOA1X 4
SPLITTER
8/2/2019 Ftth Report
http://slidepdf.com/reader/full/ftth-report 34/83
FTTH (FIBER TO THE HOME)
Dept. Of ECE, College of Engg. Poonjar. 34
12.1 48.4 0 6.34x10⁻⁷
13.4 53.6 0 1.92x10⁻⁵
14 56 0 0.0002
14.1 56.4 11 0
Case 2: Attenuator placed after Splitter
CONNECTION DIAGRAM:
2.5Gbps Tx 2.5Gbps
Rx
PROCEDURE:
1. Power meter is set to 1550nm wavelength.
2. Attenuator is set to low value.
3. 2.5 Gbps input data stream is given to1x4 splitter from STM-16
equipment.
4. The splitter is connected to attenuator.
Attenuation (dB) Distance (Km) UAS BBER
1 4 0 0
5 20 0 0
10 40 0 0
11.5 46 0 0
12 48 0 0
STM-16
EQUIPMENT
1X 4
SPLITTER
VOA
8/2/2019 Ftth Report
http://slidepdf.com/reader/full/ftth-report 35/83
FTTH (FIBER TO THE HOME)
Dept. Of ECE, College of Engg. Poonjar. 35
5. The output of the attenuator is connected back to the Rx of the STM-16
equipment.
6. Vary the attenuator value, until UAS (Unavailable Seconds) ≠ 0.
CONCLUSION:
In case1, when attenuator is placed before splitter, error free transmission
distance limit is 44km and Maximum reachable distance is 56 km.
In case2, when attenuator is placed after splitter, error free transmission
distance limit is 48km and Maximum reachable distance is 66.8km.
From this, it is found that sending data to the fiber after splitting is better.
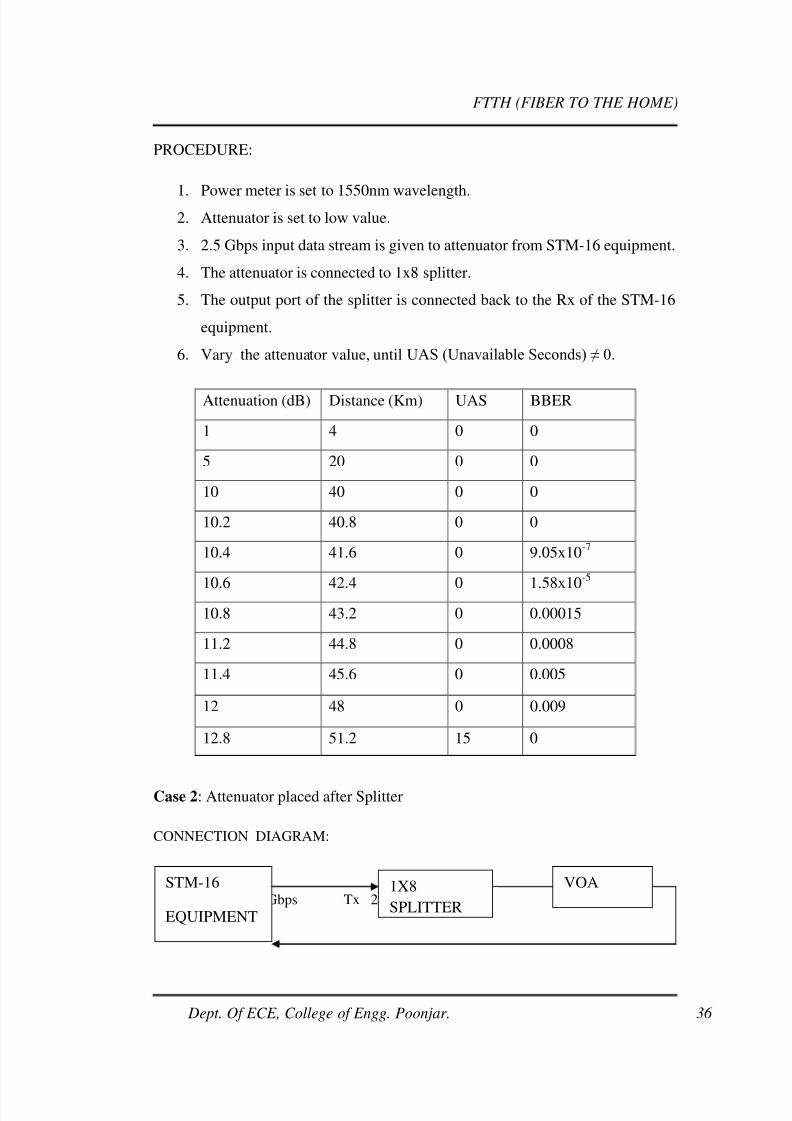
5.2.2 1X 8 SPLITTER
Case 1: Attenuator placed before Splitter
CONNECTION DIAGRAM:
2.5Gbps Tx 2.5Gbps
Rx
14.2 56.8 0 4.42X10⁻⁷
14.8 59.2 0 8.74X10⁻⁶
15.4 61.6 0 2.68X10⁻⁵
16.2 64.8 0 0.008
16.7 66.8 23 0
STM-16
EQUIPMENT
VOA 1X 8
SPLITTER
8/2/2019 Ftth Report
http://slidepdf.com/reader/full/ftth-report 36/83
FTTH (FIBER TO THE HOME)
Dept. Of ECE, College of Engg. Poonjar. 36
PROCEDURE:
1.
Power meter is set to 1550nm wavelength.2. Attenuator is set to low value.
3. 2.5 Gbps input data stream is given to attenuator from STM-16 equipment.
4. The attenuator is connected to 1x8 splitter.
5. The output port of the splitter is connected back to the Rx of the STM-16
equipment.
6. Vary the attenuator value, until UAS (Unavailable Seconds) ≠ 0.
Case 2: Attenuator placed after Splitter
CONNECTION DIAGRAM:
2.5Gbps Tx 2.5Gbps
Attenuation (dB) Distance (Km) UAS BBER
1 4 0 0
5 20 0 0
10 40 0 0
10.2 40.8 0 0
10.4 41.6 0 9.05x10⁻⁷
10.6 42.4 0 1.58x10
-5
10.8 43.2 0 0.00015
11.2 44.8 0 0.0008
11.4 45.6 0 0.005
12 48 0 0.009
12.8 51.2 15 0
STM-16
EQUIPMENT
1X8
SPLITTER
VOA
8/2/2019 Ftth Report
http://slidepdf.com/reader/full/ftth-report 37/83
FTTH (FIBER TO THE HOME)
Dept. Of ECE, College of Engg. Poonjar. 37
PROCEDURE:
1. Power meter is set to 1550nm wavelength.
2. Attenuator is set to low value.
3. 2.5Gbps input data stream is given to1x8 splitter from STM-16 equipment.
4. The splitter is connected to attenuator.
5. The output of the attenuator is connected back to the Rx of the STM-16 equipment.
6. Vary the attenuator value, until UAS (Unavailable Seconds) ≠ 0.
CONCLUSION:
In case1, when attenuator is placed before splitter, error free transmission distance
limit is 40.8km and Maximum reachable distance is 51.2km.
In case2, when attenuator is placed after splitter, error free transmission distance limit
is 44km and Maximum reachable distance is 56.8km.
From this, it is found that sending data to the fiber after splitting is better.
Attenuation (dB) Distance (Km) UAS BBER
1 4 0 0
5 20 0 0
10 40 0 0
11 44 0 0
11.5 46 0 8.74X10
-6
12 48 0 2.68X10⁻⁵
12.5 50 0 0.0001
13 52 0 0.0003
14 56 0 0.013
14.2 56.8 10 0
8/2/2019 Ftth Report
http://slidepdf.com/reader/full/ftth-report 38/83
FTTH (FIBER TO THE HOME)
Dept. Of ECE, College of Engg. Poonjar. 38
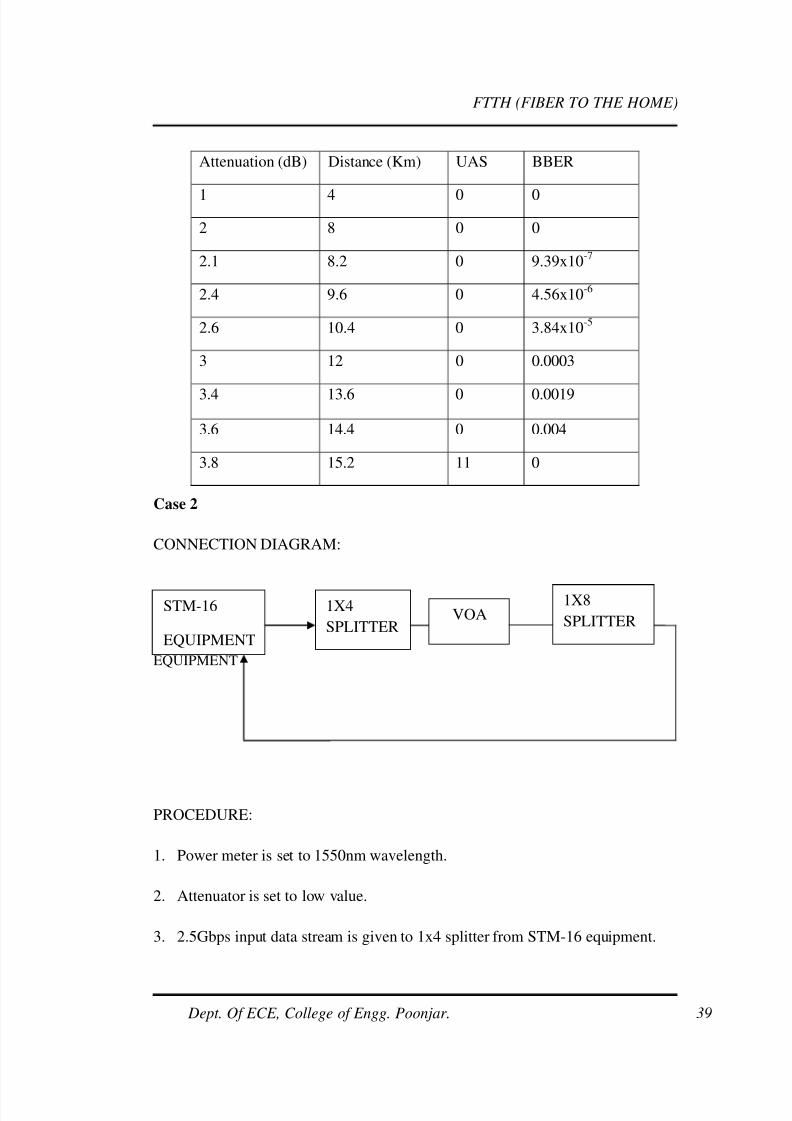
5. 3 EFFECT OF DOUBLE SPLITTING
Case1:
CONNECTION DIAGRAM:
STM-16
EQUIPMENT
PROCEDURE:
1. Power meter is set to 1550nm wavelength.
2. Attenuator is set to low value.
3. 2.5Gbps input data stream is given to an attenuator from STM-16 equipment.
4. The attenuator is connected to 1x4 splitter.
5. The output of the 1x4 splitter is connected to 1x8 splitter.
6. The output from 1x8 splitter is connected to the Rx of the STM-16 equipment.
7. Vary the attenuator value, until UAS (Unavailable Seconds) ≠ 0.
STM-16
EQUIPMENT
VOA 1X4
SPLITTER
1X8
SPLITTER
8/2/2019 Ftth Report
http://slidepdf.com/reader/full/ftth-report 39/83
FTTH (FIBER TO THE HOME)
Dept. Of ECE, College of Engg. Poonjar. 39
Case 2
CONNECTION DIAGRAM:
STM-16
EQUIPMENT
PROCEDURE:
1. Power meter is set to 1550nm wavelength.
2. Attenuator is set to low value.
3. 2.5Gbps input data stream is given to 1x4 splitter from STM-16 equipment.
Attenuation (dB) Distance (Km) UAS BBER
1 4 0 0
2 8 0 0
2.1 8.2 0 9.39x10⁻⁷
2.4 9.6 0 4.56x10⁻⁶
2.6 10.4 0 3.84x10⁻⁵
3 12 0 0.0003
3.4 13.6 0 0.0019
3.6 14.4 0 0.004
3.8 15.2 11 0
STM-16
EQUIPMENT
1X4
SPLITTERVOA
1X8
SPLITTER
8/2/2019 Ftth Report
http://slidepdf.com/reader/full/ftth-report 40/83
FTTH (FIBER TO THE HOME)
Dept. Of ECE, College of Engg. Poonjar. 40
4. The 1x4 splitter is connected to attenuator .
5. The output of the attenuator is connected to 1x8 splitter.
6. The output from 1x8 splitter is connected to the Rx of the STM-16
equipment.
7. Vary the attenuator value, until UAS (Unavailable Seconds) ≠ 0.
Case 3:
CONNECTION DIAGRAM:
STM-16
EQUIPMENT
Attenuation (dB) Distance (Km) UAS BBER
1 4 0 0
2 8 0 0
5 10 0 0
6.5 26 0 0
6.8 27.2 0 7.86x10⁻⁷
7.1 28.4 0 1.05x10⁻⁵
7.5 30 0 0.00012
7.8 31.2 0 0.0007
8.2 32.8 0 0.002
8.4 33.6 11 0
STM-16
EQUIPMENT
1X4
SPLITTER
1X8
SPLITTER
VOA
8/2/2019 Ftth Report
http://slidepdf.com/reader/full/ftth-report 41/83
FTTH (FIBER TO THE HOME)
Dept. Of ECE, College of Engg. Poonjar. 41
PROCEDURE:
1. Power meter is set to 1550nm wavelength.
2. Attenuator is set to low value.
3. 2.5Gbps input data stream is given to 1x4 splitter from STM-16 equipment.
4. The 1x4 splitter is connected to 1x8 splitter.
5. The output of the 1x8 splitter is connected to an attenuator.
6. The output from the attenuator is connected to the Rx of the STM-16
equipment.
7. Vary the attenuator value, until UAS (Unavailable Seconds) ≠ 0.
Attenuation (dB) Distance (Km) UAS BBER
1 4 0 0
5 20 0 0
6 24 0 0
6.3 25.2 0 1.53x10⁻⁶
6.8 27.2 0 8.5x10⁻⁶
7.4 29.6 0 0.0002
7.6 30.4 0 0.001
7.8 31.2 0 0.002
8 32 0 0.004
8.1 32.4 15 0
8/2/2019 Ftth Report
http://slidepdf.com/reader/full/ftth-report 42/83
FTTH (FIBER TO THE HOME)
Dept. Of ECE, College of Engg. Poonjar. 42
CONCLUSION:
Case 1: When attenuator is placed before two splitters, the distance limit for error
free transmission is 8km and maximum reachable distance is 15.2km.
Case 2: When attenuator is placed between two splitters, the distance limit for
error free transmission is 26km and maximum reachable distance is 33.6km.
Case 3: When attenuator is placed after two splitters, the distance limit for error
free transmission is 24km and maximum reachable distance is 32.4km.
In the above three cases, second case is better. Here first 1x4 splitting is done
and after a long distance, again each of them splitted into 8.
8/2/2019 Ftth Report
http://slidepdf.com/reader/full/ftth-report 43/83
FTTH (FIBER TO THE HOME)
Dept. Of ECE, College of Engg. Poonjar. 43
CHAPTER 6
LINK DESIGN AND OPTIMIZATION
6.1 FIBER OPTICAL LINK DESIGN
Basically a telecommunication system contains a transmitter, a receiver,
and an information channel (media). A laser source (infrared), which is modulated
by information signals acts as the transmitter. The modulated pulses from the
transmitter are launched into an optical fiber. The optical pulses will undergo total
internal reflection within the fiber and is detected at the receiving end. The
receiver (APD or PIN) converts back the optical pulses into electrical information
signal. The block diagram of a fiber optic link is shown in Figure.
Network-Medium
Fiber Links Fiber Links
FIG 11.Link Design Model
The satisfactoriness of the transmission in a fiber optic link can be defined
in terms of some characteristic parameters. The user generally specifies the
distance over which the information is to be sent and the data rate to betransmitted. The Designer has to find the specification of the system components.
The designer generally has to define some additional criteria either as per the
standards or as per the user specifications.The Design criteria are given in the
following:
TransmitterAmplifier Amplifier Receiver
8/2/2019 Ftth Report
http://slidepdf.com/reader/full/ftth-report 44/83
FTTH (FIBER TO THE HOME)
Dept. Of ECE, College of Engg. Poonjar. 44
1. Primary Design Criteria
Data Rate
Link Length
2. Additional Design Parameters
Modulation format
System fidelity
Cost involved in components, installation and maintenance
Upgradeability
Commercial availability
A SIMPLE POINT – TO – POINT OPTICAL LINK DESIGN
The link has primarily three components to design:
Optical Transmitter
Optical Fiber
Optical Receiver
Considering the cost, speed etc, first choose the laser and the detector.
Also the type of fiber is chosen. The design of an optical link involves many
interrelated variables among the fiber, source, and photodetector operating
characteristics, so that the actual link design and analysis may require several
iterations before they are completed satisfactorily. Since performance and cost
constraints are very important factors in fiber optic communication links, the
designer must carefully choose the components to ensure that the desired
performance level can be maintained over the expected system lifetime without
overspecifying the component characteristics.
8/2/2019 Ftth Report
http://slidepdf.com/reader/full/ftth-report 45/83
FTTH (FIBER TO THE HOME)
Dept. Of ECE, College of Engg. Poonjar. 45
The key system requirements needed in analyzing a link are:
1. The desired ( or possible ) transmission distance
2. The data rate or channel bandwidth
3. The bit error rate
To fulfill these requirements the designer has a choice of the following
components and their associated characteristics:
1. Multimode or single- mode optical fiber.
Core size
Core refractive-index profile
Bandwidth or dispersion
Attenuation
Numerical aperture or mode-field diameter
2. LED or laser diode optical source
Emission wavelength
Spectral line width
Output power
Effective radiating area
Emission pattern
Number of emitting modes
3. PIN or avalanche photodiode
Responsivity
Operating wavelength
Speed
Sensitivity
8/2/2019 Ftth Report
http://slidepdf.com/reader/full/ftth-report 46/83
FTTH (FIBER TO THE HOME)
Dept. Of ECE, College of Engg. Poonjar. 46
Two analysis are usually carried out to ensure that the desired system
performance can be met; these are the link power budget and the system rise-time
budget analysis. In the link power budget analysis, one first determines the power
margin between the optical transmitter output and the minimum receiver
sensitivity needed to establish a specified BER. This margin can then be allocated
to connector , splice, and fiber losses, plus any additional margins required for
expected component degradation or temperature effects. If the choice of
components did not allow the desired transmission distance to be achieved, the
components might have to be changed or repeaters might have to be incorporated
into the link.
Once the link power budget has been established, the designer can perform
a system rise-time analysis to ensure that the desired overall system performance
has been met.In carrying out a link power budget, we first decide at which
wavelength to transmit and then choose components operating in this region. If
the distance over which the data are to be transmitted is not too far, we may
decide to operate in the 800nm to 900nm region. On the other hand, if the
transmission distance is relatively long, we may want to take advantage of the
lower attenuation and dispersion that occurs at around 1310 or 1550nm.
Having decided on a wavelength, we next interrelate the system
performances of the three major optical link building blocks, that is , the receiver,
transmitter, and optical fiber. Normally the designer chooses the characteristics of
two of these elements and then computes those of the third to see if the system
performance requirements are met. We first select the photodetector and then an
optical source and see how far data can be transmitted over a particular fiber
before a repeater is needed in the line to boost up the power level of the optical
signal.
In choosing a particular photodetector, we mainly need to determine the
minimum optical power that must fall on the photodetector to satisfy the BER
requirement at the specified data rate. In making this choice, the designer also
8/2/2019 Ftth Report
http://slidepdf.com/reader/full/ftth-report 47/83
FTTH (FIBER TO THE HOME)
Dept. Of ECE, College of Engg. Poonjar. 47
needs to take into account any design cost and complexity constraints. A pin
photodiode receiver is simpler, more stable with changes in temperature, and less
expensive than an avalanche photodiode receiver. In addition, pin photodiode bias
voltages are normally less than 50V, whereas those of avalanche photodiode are
several hundred volts. However, the advantages of pin photodiodes may be
overruled by the increased sensitivity of the avalanche photodiode if very low
optical power levels are to be detected.
The system parameters involved in deciding between the use of an LED
and a laser diode are signal dispersion, data rate, transmission distance, and cost.The spectral width of the laser output is much narrower than that of an LED. This
is of importance in the 800nm to 900nm region, where the spectral width of an
LED and dispersion characteristics of silica fibers limit the data rate-distance
product to around 150(Mbps)km. For higher values(upto 2500(Mbps)km) a laser
must be used at these wavelengths. At wavelengths around 1.3um, where signal
dispersion is very low, bit-rate-distance products of atleast 1500(Mbps)km are
achievable with LEDs. Since laser diodes typically couple from 10 to 15dB more
optical power into a fiber than an LED, greater repeaterless transmission distances
are possible with laser. This advantage and the lower dispersion capability of laser
diodes may be offset by cost constraints. Not only is a laser diode itself more
expensive than an LED, but also the laser transmitter circuitry is much more
complex, since the lasing threshold has to be dynamically controlled as a function
of temperature and device aging.
For the optical fiber we have a choice between single-mode and multi-
mode fiber, either of which could have a step- or a graded – index core. This
choice depends on the type of light source used and on the amount of dispersion
that can be tolerated. LEDs tend to be used with multimode fibers, although edge-
emittihg LEDs can launch sufficient optical power into a single mode fiber for
transmission at data rates upto 560Mbps over several kilometers. Either a single
mode or multimode fiber can be used with a laser diode. A single mode fiber can
8/2/2019 Ftth Report
http://slidepdf.com/reader/full/ftth-report 48/83
FTTH (FIBER TO THE HOME)
Dept. Of ECE, College of Engg. Poonjar. 48
provide the ultimate bit-rate-distance product, with values of 30(Gbps)km being
achievable. A disadvantage of single mode fibers is that the small core size makes
fiber splicing more difficult and critical than for multimode fibers.
When choosing the attenuation characteristics of a cabled fiber, the excess
loss that results from the cabling process must also be considered in addition to
the attenuation of the fiber itself. This must also include connector and splice
losses as well as environmental-induced losses that could arise from temperature
variations, radiation effects, dust and moisture on the connectors.An optical power
loss model for a point-to-point link is shown in the Figure
FIG 12. Link Network
The optical power received at the photodetector depends on the amount of
light coupled into the fiber and the losses occurring in the fiber and at the
connectors and splices. The link loss budget is derived from the sequential loss
contributions of each element in the link. Each of these loss elements is expressedin decibels as
Where Pin and Pout are the optical powers emanating into and out of the
loss element, respectively.
8/2/2019 Ftth Report
http://slidepdf.com/reader/full/ftth-report 49/83
FTTH (FIBER TO THE HOME)
Dept. Of ECE, College of Engg. Poonjar. 49
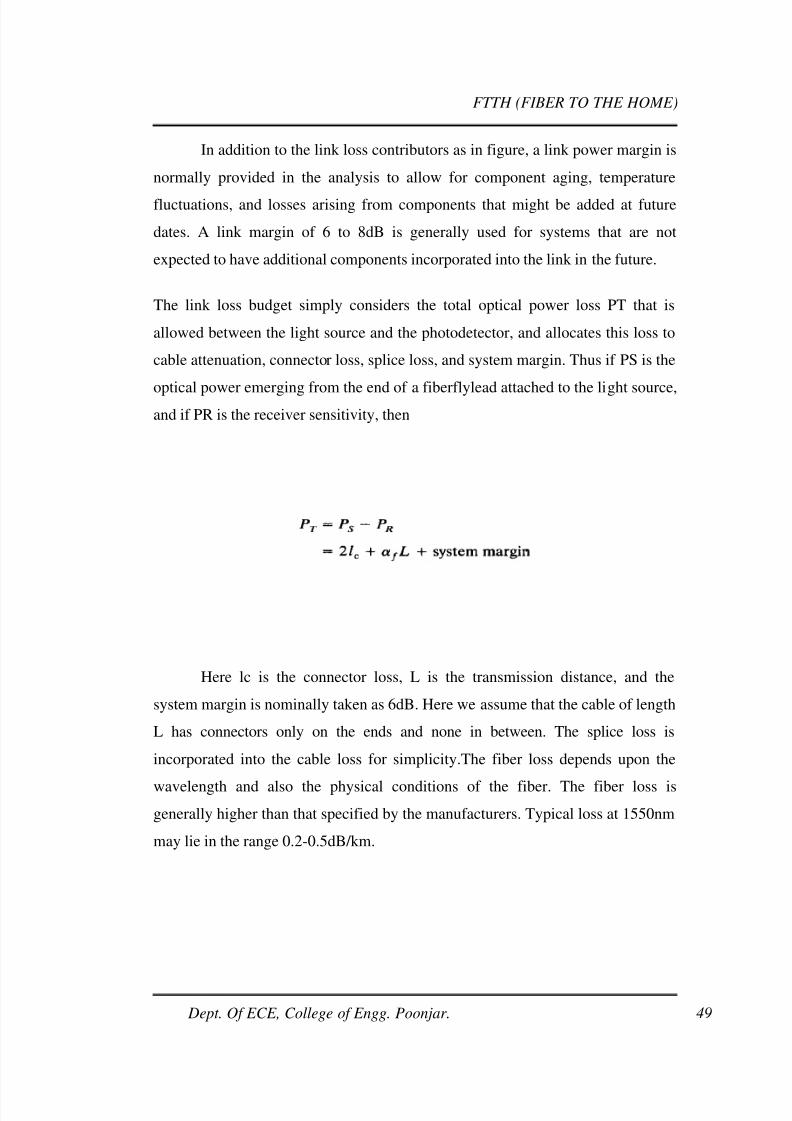
In addition to the link loss contributors as in figure, a link power margin is
normally provided in the analysis to allow for component aging, temperature
fluctuations, and losses arising from components that might be added at future
dates. A link margin of 6 to 8dB is generally used for systems that are not
expected to have additional components incorporated into the link in the future.
The link loss budget simply considers the total optical power loss PT that is
allowed between the light source and the photodetector, and allocates this loss to
cable attenuation, connector loss, splice loss, and system margin. Thus if PS is the
optical power emerging from the end of a fiberflylead attached to the light source,and if PR is the receiver sensitivity, then
Here lc is the connector loss, L is the transmission distance, and the
system margin is nominally taken as 6dB. Here we assume that the cable of length
L has connectors only on the ends and none in between. The splice loss is
incorporated into the cable loss for simplicity.The fiber loss depends upon the
wavelength and also the physical conditions of the fiber. The fiber loss is
generally higher than that specified by the manufacturers. Typical loss at 1550nm
may lie in the range 0.2-0.5dB/km.
8/2/2019 Ftth Report
http://slidepdf.com/reader/full/ftth-report 50/83
FTTH (FIBER TO THE HOME)
Dept. Of ECE, College of Engg. Poonjar. 50
6.2 FTTH PON LINK ENGINEERING
Case1: Considering the below FTTH link with one 1x8 splitter and the design
Where spectral width =1 nm at 1330 nm, B is Bandwidth
dt = 1* 10 * 18
8/2/2019 Ftth Report
http://slidepdf.com/reader/full/ftth-report 56/83
FTTH (FIBER TO THE HOME)
Dept. Of ECE, College of Engg. Poonjar. 56
dt = 180 ps
Pd = -10 log (1-.5(1.540*10^9) (3.24*10^-20))
=-10 log (1-.24948)
= -10 log .7505
Dispersion penalty, Pd= 1.246 dB
Tx= -29+ 17.7+ 2 +1.246
= -8.054
0>=- 8.054
Transmitter power is greater than the power at the receiver.The transmitting
power is enough for the system to work.
Case2:Considering the below FTTH link with one 1x8 splitter and the output portfrom that is again fed to a 1x4 splitter and the design procedure is as follows.
Figure 14. 1x8 And 1x4 Splitters Using Double Splitting
8/2/2019 Ftth Report
http://slidepdf.com/reader/full/ftth-report 57/83
FTTH (FIBER TO THE HOME)
Dept. Of ECE, College of Engg. Poonjar. 57
Downstream Power Budget = +2.5dbm-(-25dbm) = 27.5dB
Upstream Power Budget = 0 dbm-(-29dbm) = 29 dB
Downstream Design (10 Km)
Downstream is done in 1490nm wavelength.
The main equation is
Tx =Rx +CL +Ms +Pd
Tx= transmitted power
Rx=Receiver sensitivity
CL=Channel loss
Ms=System margin
Pd=Dispersion penalty
Tx =2.5dBm , Rx =-25dBm
CL=Spice loss+ fiber loss+ connector loss+ splitter loss
Splice loss
Splice loss= (L/2 +1)*0.1
Where 0.1dB is splice loss per splice ,L=Length of the fiber
Splice loss= (10/2 + 1) *0.1
=6*0.1=0.6 dBm
Fiber loss
Fiber loss= 0.21dB*L
8/2/2019 Ftth Report
http://slidepdf.com/reader/full/ftth-report 58/83
FTTH (FIBER TO THE HOME)
Dept. Of ECE, College of Engg. Poonjar. 58
(0.21 dB is fiber loss per kilometer)
=0.21*10
=2.1 dBm
Connector loss
Connector loss = 0.4 dB * no of connectors
(0.4 dB is the connector loss in a SC connector)
=0.4 * 8
=3.2 dB
Splitter loss
Splitter loss =11 dB
= 11 +7.4
= 18.4 dB
(11dB for 1x8 splitter, 7.4dB for 1x4 splitter)
CL = splice loss + fiber loss + connector loss + splitter loss
= .6 + 2.1 + 2.8 + 11
Channel Loss =12.41 dB
System margin
Extra allowance given to the system for compensating channel loss.
System margin = 2 dB
Which is given in the system parameters
8/2/2019 Ftth Report
http://slidepdf.com/reader/full/ftth-report 59/83
FTTH (FIBER TO THE HOME)
Dept. Of ECE, College of Engg. Poonjar. 59
Dispersion penalty
Extra power required by the system to compensate the dispersion.