Fuel conservation and emission reduction through novel waste heat recovery for internal combustion engines Frank Will ⇑ Deakin University, School of Engineering, Faculty of Science and Technology, Waurn Ponds Campus, Geelong, VIC 3217, Australia highlights " Variable oil pumps reduce the heat transfer between engine and oil by 50%. " Exhaust gas/oil heat exchangers can reduce fuel usage by over 7%. " NOx and CO emissions are also reduced by such systems. " Water condensation contributes up to 50% of usable exhaust heating power. " A simple external engine oil bypass can achieve similar benefits. article info Article history: Received 15 February 2011 Received in revised form 15 April 2012 Accepted 7 June 2012 Available online 23 June 2012 Keywords: Fuel conservation Emission Combustion engines Waste heat recovery Oil viscosity abstract Lubrication systems of combustion engines offer a large potential for energy conservation and reduction of emissions. Different approaches include variable oil pumps to adjust oil pressure and flow rates to the engines requirements or thermal management to reduce the viscosity of the engine oil. For both of these systems the fuel conservation during physical tests is typically much smaller than the predictions through computations. The root cause of these differences between simulations and test results are ana- lysed in this paper with specific focus on the heat transfer from the engine to the lubrication oil and the effects of water condensation in the exhaust. The analysis resulted in different waste heat recovery sys- tem configurations that are presented. Vehicle test results for one system with a gasoline engine demon- strate a fuel conservation potential of over 7% together with two digit reductions of several emission components. For another more effective but also more simple system configuration a similar improve- ment potential is shown. Risks and benefits of such novel waste heat recovery systems are discussed. Further benefits are the positive effects on performance, reduction of wear and the potential of extended oil change intervals. Ó 2012 Elsevier Ltd. 1. Introduction Historically the major focus during the development of engine lubrication systems was to reduce the wear and to increase the durability of an engine. With the introduction of emission regula- tions the reduction of oil emissions like unburned hydro-carbons (HC) became another priority. With increases in fuel prices the focus has been shifted to the reduction of friction to reduce fuel consumption. Loss through friction is the second largest factor – after wasted heat – that reduces the efficiency of internal combustion engines. For fully warmed up operating temperatures above 90 °C, the fric- tional losses within the engine have been reported to be in the range of between 10% and 40%, depending on the load of the engine [1–5]. However, during most normal driving conditions of a car the oil temperatures are much lower. The legal drive cycles to deter- mine fuel consumption and exhaust emissions, for example the New European Drive Cycle (NEDC), start at a much lower test tem- perature between 20 °C and 30 °C [6] and at such a temperature of 20 °C the engine friction can be 2.5 times as high compared to a warm engine operation [4,8]. Another study performed in Germany revealed that the yearly average ambient temperature is even lower with only 9.8 °C [7] which means even higher friction contribution. For the average oil temperature of 55 °C during the NEDC test the friction is still 50% higher compared to a hot engine with 100 °C oil temperature [4]. That means that under normal driving conditions the frictional losses of a passenger car’s combus- tion engine can account to up to 60% of the total fuel energy! Historically the main driver to reduce fuel consumption by reducing friction was to reduce the operating cost of a vehicle together with the positive effects on engine performance. With 0016-2361 Ó 2012 Elsevier Ltd. http://dx.doi.org/10.1016/j.fuel.2012.06.044 ⇑ Tel.: +61 3 5227 2828; fax: +61 3 5227 2167. E-mail address: [email protected]Fuel 102 (2012) 247–255 Contents lists available at SciVerse ScienceDirect Fuel journal homepage: www.elsevier.com/locate/fuel Open access under CC BY-NC-ND license. Open access under CC BY-NC-ND license.
Transcript
Fuel 102 (2012) 247–255
Contents lists available at SciVerse ScienceDirect
Fuel
journal homepage: www.elsevier .com/locate / fuel
Fuel conservation and emission reduction through novel waste heat recoveryfor internal combustion engines
Frank Will ⇑Deakin University, School of Engineering, Faculty of Science and Technology, Waurn Ponds Campus, Geelong, VIC 3217, Australia
h i g h l i g h t s
" Variable oil pumps reduce the heat transfer between engine and oil by 50%." Exhaust gas/oil heat exchangers can reduce fuel usage by over 7%." NOx and CO emissions are also reduced by such systems." Water condensation contributes up to 50% of usable exhaust heating power." A simple external engine oil bypass can achieve similar benefits.
a r t i c l e i n f o
Article history:Received 15 February 2011Received in revised form 15 April 2012Accepted 7 June 2012Available online 23 June 2012
Lubrication systems of combustion engines offer a large potential for energy conservation and reductionof emissions. Different approaches include variable oil pumps to adjust oil pressure and flow rates to theengines requirements or thermal management to reduce the viscosity of the engine oil. For both of thesesystems the fuel conservation during physical tests is typically much smaller than the predictionsthrough computations. The root cause of these differences between simulations and test results are ana-lysed in this paper with specific focus on the heat transfer from the engine to the lubrication oil and theeffects of water condensation in the exhaust. The analysis resulted in different waste heat recovery sys-tem configurations that are presented. Vehicle test results for one system with a gasoline engine demon-strate a fuel conservation potential of over 7% together with two digit reductions of several emissioncomponents. For another more effective but also more simple system configuration a similar improve-ment potential is shown. Risks and benefits of such novel waste heat recovery systems are discussed.Further benefits are the positive effects on performance, reduction of wear and the potential of extendedoil change intervals.
� 2012 Elsevier Ltd. Open access under CC BY-NC-ND license.
1. Introduction
Historically the major focus during the development of enginelubrication systems was to reduce the wear and to increase thedurability of an engine. With the introduction of emission regula-tions the reduction of oil emissions like unburned hydro-carbons(HC) became another priority. With increases in fuel prices thefocus has been shifted to the reduction of friction to reduce fuelconsumption.
Loss through friction is the second largest factor – after wastedheat – that reduces the efficiency of internal combustion engines.For fully warmed up operating temperatures above 90 �C, the fric-tional losses within the engine have been reported to be in therange of between 10% and 40%, depending on the load of the engine
C-ND license.
[1–5]. However, during most normal driving conditions of a car theoil temperatures are much lower. The legal drive cycles to deter-mine fuel consumption and exhaust emissions, for example theNew European Drive Cycle (NEDC), start at a much lower test tem-perature between 20 �C and 30 �C [6] and at such a temperature of20 �C the engine friction can be 2.5 times as high compared to awarm engine operation [4,8]. Another study performed inGermany revealed that the yearly average ambient temperatureis even lower with only 9.8 �C [7] which means even higher frictioncontribution. For the average oil temperature of 55 �C during theNEDC test the friction is still 50% higher compared to a hot enginewith 100 �C oil temperature [4]. That means that under normaldriving conditions the frictional losses of a passenger car’s combus-tion engine can account to up to 60% of the total fuel energy!
Historically the main driver to reduce fuel consumption byreducing friction was to reduce the operating cost of a vehicletogether with the positive effects on engine performance. With
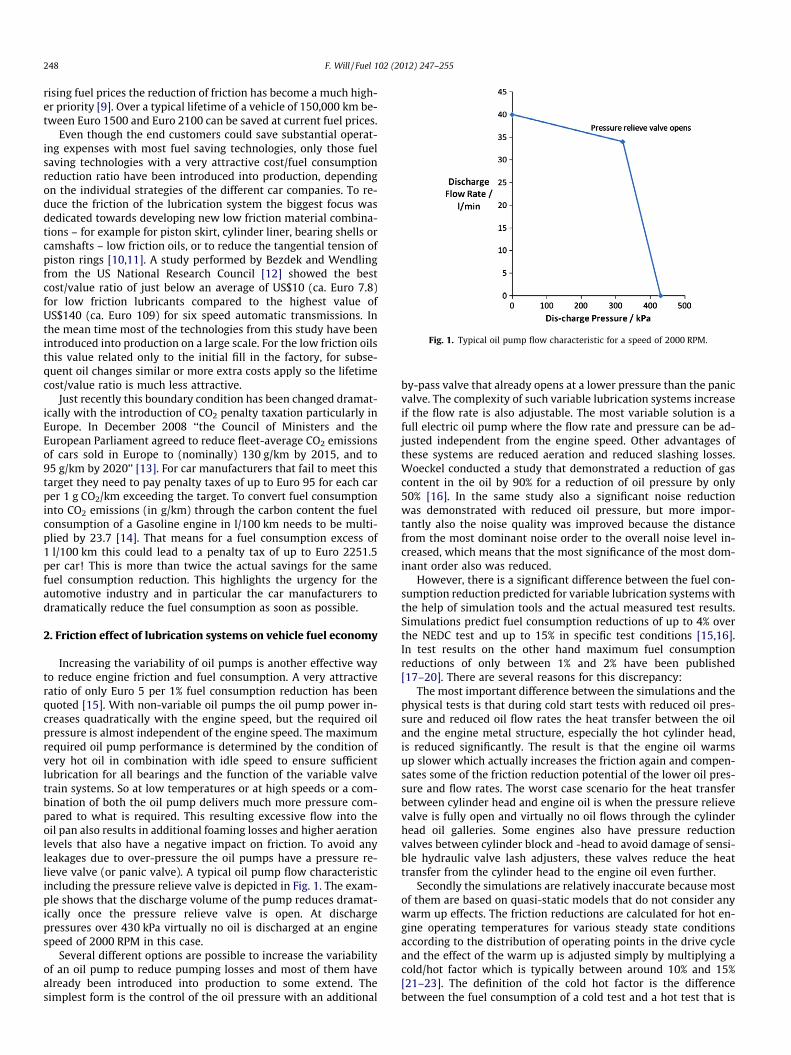
Fig. 1. Typical oil pump flow characteristic for a speed of 2000 RPM.
248 F. Will / Fuel 102 (2012) 247–255
rising fuel prices the reduction of friction has become a much high-er priority [9]. Over a typical lifetime of a vehicle of 150,000 km be-tween Euro 1500 and Euro 2100 can be saved at current fuel prices.
Even though the end customers could save substantial operat-ing expenses with most fuel saving technologies, only those fuelsaving technologies with a very attractive cost/fuel consumptionreduction ratio have been introduced into production, dependingon the individual strategies of the different car companies. To re-duce the friction of the lubrication system the biggest focus wasdedicated towards developing new low friction material combina-tions – for example for piston skirt, cylinder liner, bearing shells orcamshafts – low friction oils, or to reduce the tangential tension ofpiston rings [10,11]. A study performed by Bezdek and Wendlingfrom the US National Research Council [12] showed the bestcost/value ratio of just below an average of US$10 (ca. Euro 7.8)for low friction lubricants compared to the highest value ofUS$140 (ca. Euro 109) for six speed automatic transmissions. Inthe mean time most of the technologies from this study have beenintroduced into production on a large scale. For the low friction oilsthis value related only to the initial fill in the factory, for subse-quent oil changes similar or more extra costs apply so the lifetimecost/value ratio is much less attractive.
Just recently this boundary condition has been changed dramat-ically with the introduction of CO2 penalty taxation particularly inEurope. In December 2008 ‘‘the Council of Ministers and theEuropean Parliament agreed to reduce fleet-average CO2 emissionsof cars sold in Europe to (nominally) 130 g/km by 2015, and to95 g/km by 2020’’ [13]. For car manufacturers that fail to meet thistarget they need to pay penalty taxes of up to Euro 95 for each carper 1 g CO2/km exceeding the target. To convert fuel consumptioninto CO2 emissions (in g/km) through the carbon content the fuelconsumption of a Gasoline engine in l/100 km needs to be multi-plied by 23.7 [14]. That means for a fuel consumption excess of1 l/100 km this could lead to a penalty tax of up to Euro 2251.5per car! This is more than twice the actual savings for the samefuel consumption reduction. This highlights the urgency for theautomotive industry and in particular the car manufacturers todramatically reduce the fuel consumption as soon as possible.
2. Friction effect of lubrication systems on vehicle fuel economy
Increasing the variability of oil pumps is another effective wayto reduce engine friction and fuel consumption. A very attractiveratio of only Euro 5 per 1% fuel consumption reduction has beenquoted [15]. With non-variable oil pumps the oil pump power in-creases quadratically with the engine speed, but the required oilpressure is almost independent of the engine speed. The maximumrequired oil pump performance is determined by the condition ofvery hot oil in combination with idle speed to ensure sufficientlubrication for all bearings and the function of the variable valvetrain systems. So at low temperatures or at high speeds or a com-bination of both the oil pump delivers much more pressure com-pared to what is required. This resulting excessive flow into theoil pan also results in additional foaming losses and higher aerationlevels that also have a negative impact on friction. To avoid anyleakages due to over-pressure the oil pumps have a pressure re-lieve valve (or panic valve). A typical oil pump flow characteristicincluding the pressure relieve valve is depicted in Fig. 1. The exam-ple shows that the discharge volume of the pump reduces dramat-ically once the pressure relieve valve is open. At dischargepressures over 430 kPa virtually no oil is discharged at an enginespeed of 2000 RPM in this case.
Several different options are possible to increase the variabilityof an oil pump to reduce pumping losses and most of them havealready been introduced into production to some extend. Thesimplest form is the control of the oil pressure with an additional
by-pass valve that already opens at a lower pressure than the panicvalve. The complexity of such variable lubrication systems increaseif the flow rate is also adjustable. The most variable solution is afull electric oil pump where the flow rate and pressure can be ad-justed independent from the engine speed. Other advantages ofthese systems are reduced aeration and reduced slashing losses.Woeckel conducted a study that demonstrated a reduction of gascontent in the oil by 90% for a reduction of oil pressure by only50% [16]. In the same study also a significant noise reductionwas demonstrated with reduced oil pressure, but more impor-tantly also the noise quality was improved because the distancefrom the most dominant noise order to the overall noise level in-creased, which means that the most significance of the most dom-inant order also was reduced.
However, there is a significant difference between the fuel con-sumption reduction predicted for variable lubrication systems withthe help of simulation tools and the actual measured test results.Simulations predict fuel consumption reductions of up to 4% overthe NEDC test and up to 15% in specific test conditions [15,16].In test results on the other hand maximum fuel consumptionreductions of only between 1% and 2% have been published[17–20]. There are several reasons for this discrepancy:
The most important difference between the simulations and thephysical tests is that during cold start tests with reduced oil pres-sure and reduced oil flow rates the heat transfer between the oiland the engine metal structure, especially the hot cylinder head,is reduced significantly. The result is that the engine oil warmsup slower which actually increases the friction again and compen-sates some of the friction reduction potential of the lower oil pres-sure and flow rates. The worst case scenario for the heat transferbetween cylinder head and engine oil is when the pressure relievevalve is fully open and virtually no oil flows through the cylinderhead oil galleries. Some engines also have pressure reductionvalves between cylinder block and -head to avoid damage of sensi-ble hydraulic valve lash adjusters, these valves reduce the heattransfer from the cylinder head to the engine oil even further.
Secondly the simulations are relatively inaccurate because mostof them are based on quasi-static models that do not consider anywarm up effects. The friction reductions are calculated for hot en-gine operating temperatures for various steady state conditionsaccording to the distribution of operating points in the drive cycleand the effect of the warm up is adjusted simply by multiplying acold/hot factor which is typically between around 10% and 15%[21–23]. The definition of the cold hot factor is the differencebetween the fuel consumption of a cold test and a hot test that is
F. Will / Fuel 102 (2012) 247–255 249
followed directly after the cold test divided through the hot testfuel consumption.
Thirdly the simulations are also based on friction analyses thatuse the strip down method: the engine is motored by a dynamom-eter and the required motoring torque is measured. Oil tempera-tures are typically maintained at a constant level by an externalheat management. At the beginning the motoring torque is mea-sured for the complete engine, than one component after the otheris removed and the torque measurements repeated, starting withthe removal of the generator, water pump, oil pump, fuel pump(only for Diesel and direct injection gasoline), cam shafts, valves(to evaluate the pumping losses), and the piston group includingconnecting rods. There are several issues with this approach: theresults vary quite significantly between tests without load andwith load. The friction at higher loads is typically much higher thanat lower loads due to the higher combustion forces, especially atlow engine speeds where the compensating mass forces are small[24]. This increase of friction with increase of load is most relevantto the crankshaft main bearings and the con-rod bearings. But forthe piston friction this is not as relevant due to the piston pin offsetfrom the centre-line. The friction of the piston group is oftenquoted to be in the range of 40%, However this includes thecon-rod big end bearings and the piston pin bearings. For a four-cylinder engine with five main bearings and four con-rod big endbearings the friction of the connection rod big end bearings arealmost in the range as the main bearing friction which amountsto around 20% of the total engine friction [24]. The additional fric-tion due to the bending of the crankshaft under load is also not in-cluded in strip down friction measurements.
3. Heat transfer in engine oil galleries
The accurate modelling of the heat transfer between the gas inthe combustion chamber and the lubrication oil for a dynamicvehicle test such as the NEDC is very difficult. Many parametersare changing rapidly, particularly the pressure, temperature andmaterial properties of the gases in the combustion chamber butalso to a less extreme extent the vehicle speed and the enginespeed. Alone the modelling of the heat transfer between combus-tion gas and the walls of the combustion chamber requires thesolution of various complex differential equations. Although asolution to these differential equations was published some timeago [25,26] this solution has not been introduced in any commer-cially available combustion simulation tool, maybe due to the com-plexity of this new equation and the resulting programmingdifficulties. Instead, these combustion simulation tools utilise rela-tively basic empirical formulas in the form of ‘‘heat transfer coeffi-cient’’ times ‘‘temperature difference between chamber wall andgas’’ [27], for instance the equations from Woschni [28], Bargende[29], Hohenberg [30], or Annand [31]. Therefore a similar simplifi-cation is justified for this analysis, so it is based on the assumptionof drive cycle average values for engine speed and material proper-ties. A very simple equation was used to calculate the heat transfercoefficient between engine galleries and oil [32]:
Nu ¼ 0:036 Re0:8Pr1=3ðd=LÞ0:055 ð1Þ
hO ¼Nuk
Dð2Þ
The engine dimensions were taken from a 4.0 l Ford FalconTurbo In-line 6 cylinder engine. This vehicle was also used forexperimental tests that will be described later. The material prop-erties were taken from [33]. A resulting heat transfer coefficient hO
= 36.2 W/(m2 �C) was calculated. If the oil flow rate is reduced by50% to 15 l/min this results in a reduction of the heat transfer
coefficient by 43%. This explains the difference between experi-mental tests and simulations for variable oil pump systems. Anideal method to minimise fuel consumption would be to increasethe heat transfer without increasing the oil pump power require-ments by raising the oil flow rate.
4. Oil warm up system – test results and benefits
The experiments were conducted with an Australian FordFalcon vehicle. The engine is a Barra 245 T, a turbo charged In-linesix cylinder engine with intercooler, the displacement is 3984 ccm.The engine has four valves per cylinder and two overhead camshafts, each of them with an independent variable cam phaserand knock control, similar to most modern down sized enginesbut with port fuel injection. The vehicle is a rear wheel drive withautomatic transmission.
4.1. Fuel consumption
Experimental tests that were completed to evaluate the maxi-mum fuel saving potential of warming up the engine oil oftenstarted with the assumption that the 10–15% fuel consumption dif-ference between a cold- and a hot NEDC test is the maximum fuelsaving potential through any warm up measures and even thoughthe warm up potential of the engine is a major contributor towardsthe cold/hot-factor there are also some other factors that contrib-ute towards the cold–hot factor. The most important of these fac-tors are the warm up of the transmission (particularly automatictransmissions that have lower efficiencies than manual transmis-sions), calibration effects required to warm up the catalyst to meetemission legislations (e.g. increased idle speed or cold start sparkretard), tyre temperature, the friction of the remaining drive shaftsand wheel bearings as well as differences in the battery chargemainly caused by electric consumers during the 6–32 h soak peri-od. That often leads to the general assumption that warming up theoil can be specifically relevant for short drive cycles that include acold start but that it would not be very relevant for warmer andlonger drive cycles like the EUDC. Farrant [34] predicted a maxi-mum fuel economy improvement potential of only 2% for the EUDCif the complete test would be conducted with 94 �C engine oiltemperature. So most approaches focus on increasing the enginetemperature during the first part of the drive cycle but not so muchon the second part, also because the coolant – different to theoil – reaches the operating temperature early in the EUDC.
To investigate the general potential of increasing the lubricationtemperature by utilising wasted exhaust heat vehicle tests with anexhaust gas heat exchanger have been performed. Initial resultshave been presented in [35,36]. Five NEDC vehicle tests were con-ducted in two different configurations, with and without an activeexhaust gas heat exchanger. The vehicle was tested on a chassisdynamometer in an emission lab that was accredited accordingto ISO9000 and ISO17025, details of the testing equipment weredescribed in detail in various publications [21,42]. The results offive NEDC tests were averaged for each system configuration andcompared for the two different configurations.
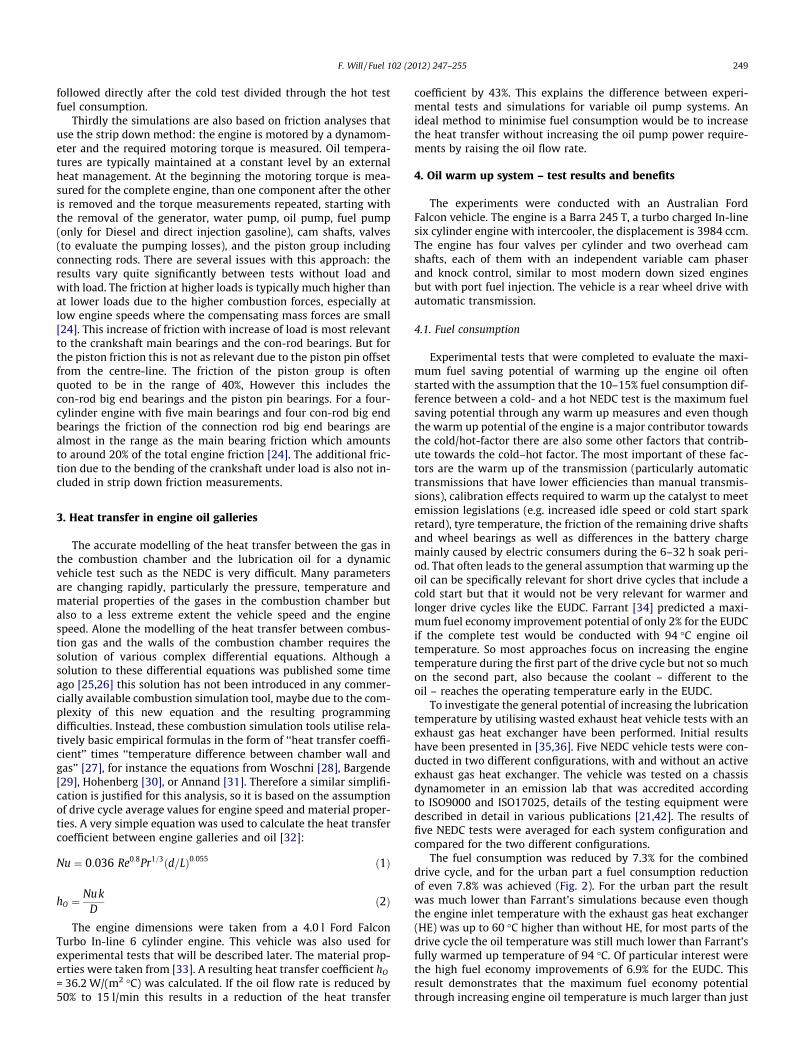
The fuel consumption was reduced by 7.3% for the combineddrive cycle, and for the urban part a fuel consumption reductionof even 7.8% was achieved (Fig. 2). For the urban part the resultwas much lower than Farrant’s simulations because even thoughthe engine inlet temperature with the exhaust gas heat exchanger(HE) was up to 60 �C higher than without HE, for most parts of thedrive cycle the oil temperature was still much lower than Farrant’sfully warmed up temperature of 94 �C. Of particular interest werethe high fuel economy improvements of 6.9% for the EUDC. Thisresult demonstrates that the maximum fuel economy potentialthrough increasing engine oil temperature is much larger than just
7.8%6.9% 7.3%
0.0%
2.0%
4.0%
6.0%
8.0%
10.0%
Urban Extra Urban NEDC Overall
Fig. 2. Fuel economy improvements with oil/exhaust gas heat exchanger (vehiclemeasurements averaged over five tests in each configuration) [36].
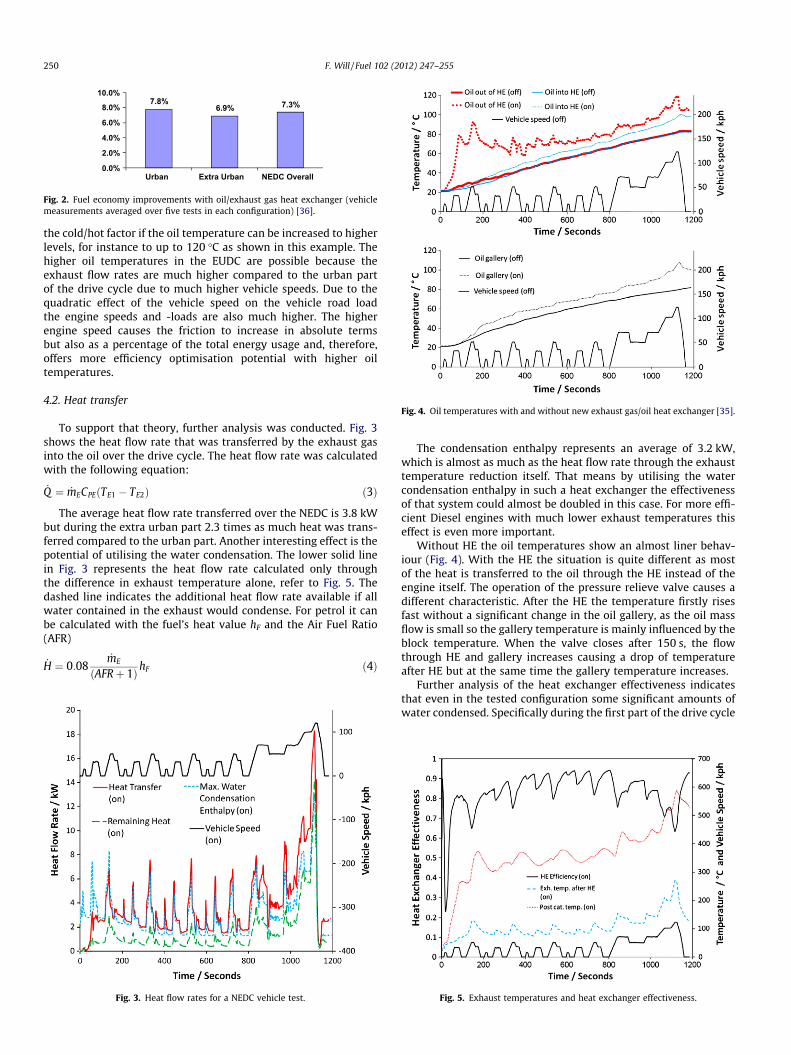
Fig. 4. Oil temperatures with and without new exhaust gas/oil heat exchanger [35].
250 F. Will / Fuel 102 (2012) 247–255
the cold/hot factor if the oil temperature can be increased to higherlevels, for instance to up to 120 �C as shown in this example. Thehigher oil temperatures in the EUDC are possible because theexhaust flow rates are much higher compared to the urban partof the drive cycle due to much higher vehicle speeds. Due to thequadratic effect of the vehicle speed on the vehicle road loadthe engine speeds and -loads are also much higher. The higherengine speed causes the friction to increase in absolute termsbut also as a percentage of the total energy usage and, therefore,offers more efficiency optimisation potential with higher oiltemperatures.
4.2. Heat transfer
To support that theory, further analysis was conducted. Fig. 3shows the heat flow rate that was transferred by the exhaust gasinto the oil over the drive cycle. The heat flow rate was calculatedwith the following equation:
_Q ¼ _mECPEðTE1 � TE2Þ ð3Þ
The average heat flow rate transferred over the NEDC is 3.8 kWbut during the extra urban part 2.3 times as much heat was trans-ferred compared to the urban part. Another interesting effect is thepotential of utilising the water condensation. The lower solid linein Fig. 3 represents the heat flow rate calculated only throughthe difference in exhaust temperature alone, refer to Fig. 5. Thedashed line indicates the additional heat flow rate available if allwater contained in the exhaust would condense. For petrol it canbe calculated with the fuel’s heat value hF and the Air Fuel Ratio(AFR)
_H ¼ 0:08_mE
ðAFRþ 1ÞhF ð4Þ
Fig. 3. Heat flow rates for a NEDC vehicle test.
The condensation enthalpy represents an average of 3.2 kW,which is almost as much as the heat flow rate through the exhausttemperature reduction itself. That means by utilising the watercondensation enthalpy in such a heat exchanger the effectivenessof that system could almost be doubled in this case. For more effi-cient Diesel engines with much lower exhaust temperatures thiseffect is even more important.
Without HE the oil temperatures show an almost liner behav-iour (Fig. 4). With the HE the situation is quite different as mostof the heat is transferred to the oil through the HE instead of theengine itself. The operation of the pressure relieve valve causes adifferent characteristic. After the HE the temperature firstly risesfast without a significant change in the oil gallery, as the oil massflow is small so the gallery temperature is mainly influenced by theblock temperature. When the valve closes after 150 s, the flowthrough HE and gallery increases causing a drop of temperatureafter HE but at the same time the gallery temperature increases.
Further analysis of the heat exchanger effectiveness indicatesthat even in the tested configuration some significant amounts ofwater condensed. Specifically during the first part of the drive cycle
Fig. 5. Exhaust temperatures and heat exchanger effectiveness.
Engi
ne o
il in
oil
pan
Engi
ne o
il in
exh
aust Hyd
ro
Car
bons
Parti
cula
tes
and
by-
prod
ucts
Vaporisation
Coking
Scraping & Dashing
Reverse Blow by
Blow By (into intake)
Valve stem leakage
Turbo bearing leakage
Deposits
Leaky gaskets and seals
Combustion Gases
Coolant
Fuel
Water
Manufacturing Deposits
Abrasive wear
Con
sum
ptio
nD
ilutio
n
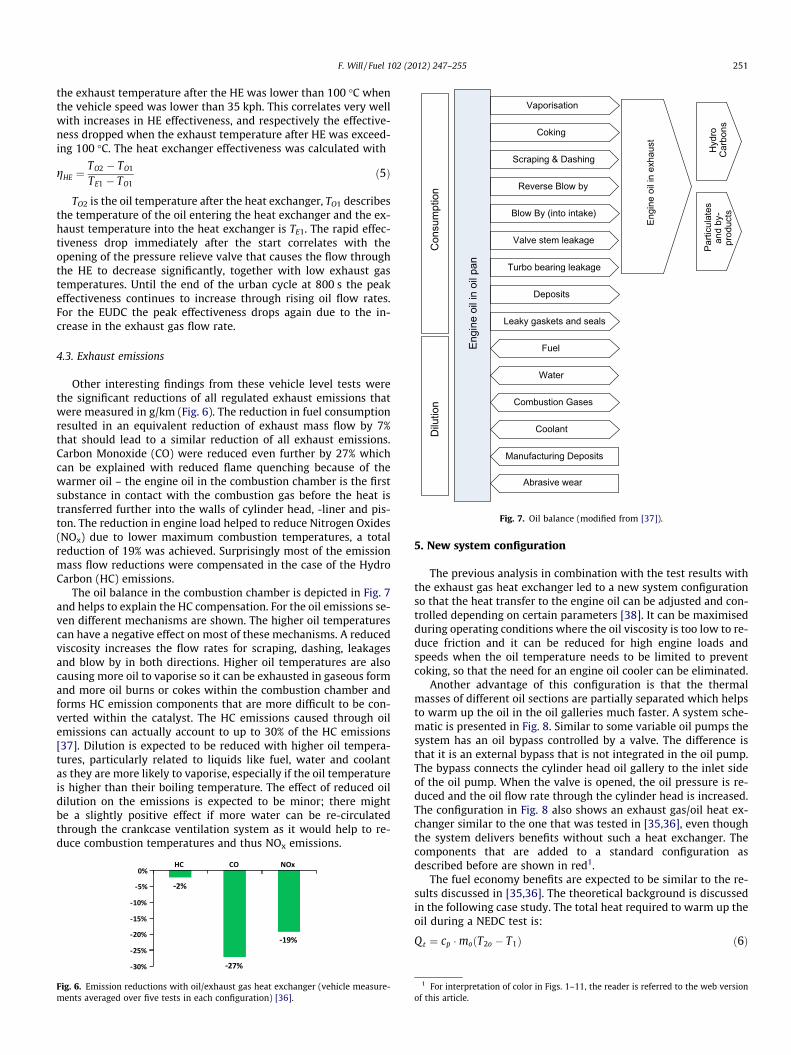
Fig. 7. Oil balance (modified from [37]).
F. Will / Fuel 102 (2012) 247–255 251
the exhaust temperature after the HE was lower than 100 �C whenthe vehicle speed was lower than 35 kph. This correlates very wellwith increases in HE effectiveness, and respectively the effective-ness dropped when the exhaust temperature after HE was exceed-ing 100 �C. The heat exchanger effectiveness was calculated with
gHE ¼TO2 � TO1
TE1 � TO1ð5Þ
TO2 is the oil temperature after the heat exchanger, TO1 describesthe temperature of the oil entering the heat exchanger and the ex-haust temperature into the heat exchanger is TE1. The rapid effec-tiveness drop immediately after the start correlates with theopening of the pressure relieve valve that causes the flow throughthe HE to decrease significantly, together with low exhaust gastemperatures. Until the end of the urban cycle at 800 s the peakeffectiveness continues to increase through rising oil flow rates.For the EUDC the peak effectiveness drops again due to the in-crease in the exhaust gas flow rate.
4.3. Exhaust emissions
Other interesting findings from these vehicle level tests werethe significant reductions of all regulated exhaust emissions thatwere measured in g/km (Fig. 6). The reduction in fuel consumptionresulted in an equivalent reduction of exhaust mass flow by 7%that should lead to a similar reduction of all exhaust emissions.Carbon Monoxide (CO) were reduced even further by 27% whichcan be explained with reduced flame quenching because of thewarmer oil – the engine oil in the combustion chamber is the firstsubstance in contact with the combustion gas before the heat istransferred further into the walls of cylinder head, -liner and pis-ton. The reduction in engine load helped to reduce Nitrogen Oxides(NOx) due to lower maximum combustion temperatures, a totalreduction of 19% was achieved. Surprisingly most of the emissionmass flow reductions were compensated in the case of the HydroCarbon (HC) emissions.
The oil balance in the combustion chamber is depicted in Fig. 7and helps to explain the HC compensation. For the oil emissions se-ven different mechanisms are shown. The higher oil temperaturescan have a negative effect on most of these mechanisms. A reducedviscosity increases the flow rates for scraping, dashing, leakagesand blow by in both directions. Higher oil temperatures are alsocausing more oil to vaporise so it can be exhausted in gaseous formand more oil burns or cokes within the combustion chamber andforms HC emission components that are more difficult to be con-verted within the catalyst. The HC emissions caused through oilemissions can actually account to up to 30% of the HC emissions[37]. Dilution is expected to be reduced with higher oil tempera-tures, particularly related to liquids like fuel, water and coolantas they are more likely to vaporise, especially if the oil temperatureis higher than their boiling temperature. The effect of reduced oildilution on the emissions is expected to be minor; there mightbe a slightly positive effect if more water can be re-circulatedthrough the crankcase ventilation system as it would help to re-duce combustion temperatures and thus NOx emissions.
Fig. 6. Emission reductions with oil/exhaust gas heat exchanger (vehicle measure-ments averaged over five tests in each configuration) [36].
5. New system configuration
The previous analysis in combination with the test results withthe exhaust gas heat exchanger led to a new system configurationso that the heat transfer to the engine oil can be adjusted and con-trolled depending on certain parameters [38]. It can be maximisedduring operating conditions where the oil viscosity is too low to re-duce friction and it can be reduced for high engine loads andspeeds when the oil temperature needs to be limited to preventcoking, so that the need for an engine oil cooler can be eliminated.
Another advantage of this configuration is that the thermalmasses of different oil sections are partially separated which helpsto warm up the oil in the oil galleries much faster. A system sche-matic is presented in Fig. 8. Similar to some variable oil pumps thesystem has an oil bypass controlled by a valve. The difference isthat it is an external bypass that is not integrated in the oil pump.The bypass connects the cylinder head oil gallery to the inlet sideof the oil pump. When the valve is opened, the oil pressure is re-duced and the oil flow rate through the cylinder head is increased.The configuration in Fig. 8 also shows an exhaust gas/oil heat ex-changer similar to the one that was tested in [35,36], even thoughthe system delivers benefits without such a heat exchanger. Thecomponents that are added to a standard configuration asdescribed before are shown in red1.
The fuel economy benefits are expected to be similar to the re-sults discussed in [35,36]. The theoretical background is discussedin the following case study. The total heat required to warm up theoil during a NEDC test is:
Qt ¼ cp �moðT2o � T1Þ ð6Þ
1 For interpretation of color in Figs. 1–11, the reader is referred to the web versionof this article.
Fig. 8. New lubrication system configuration – cylinder head oil bypass with exhaust gas/oil heat exchanger.
252 F. Will / Fuel 102 (2012) 247–255
with cp the specific heat of oil (2.09 kJ/kg K), mo the total oil mass inthe engine, T1 the oil temperature at test start (22 �C) and T2o theoriginal oil temperature at the end of drive cycle (82 �C). The heatrate transferred into the oil _Q ¼ Qt=Dt is considered to be constantbased on the oil temperature graph from Fig. 7. The ratio of the by-pass mass flow divided by the total mass flow is defined as x so withthe oil mass of the bypass mB the bypass oil temperature at the endof the drive cycle can be calculated as
T2B ¼ T1 þx � Q � Dtcp �mB
ð7Þ
For the oil sump mass mS the temperature at the end of thedrive cycle is
T2S ¼ T1 þð1� xÞ � QDt
cp �msð8Þ
So for the mixed oil that enters the oil pump the temperature atthe end of the test is
T2m ¼ x � T2B þ ð1� xÞ � T2S ð9Þand with y = mB/mS being the ratio of oil mass in engine circuit(including bypass) divided through the oil mass in sump, in thiscase y = 0.1 was determined, so
T2m ¼ T1 þQ � dtcp �m
� 1� 2xþ x2
1� y
� �þ x2
y
� �ð10Þ
Fig. 9. Engine oil pressure map for different temperatures and engine speeds.
5.1. Oil pressure map
The oil pressure for different temperatures was measured toevaluate how much excessive pressure – and therefore also flow– is available during a cold start (Fig. 9). Therefore such an oilpressure map was an essential requirement for the following
simulations. The oil pressures were recorded with a Setra 206250PSIG pressure transducer. Compared to the results that werepresented in Section 4, these measurements were recorded in dy-namic acceleration tests with the transmission in neutral, but withthe same test vehicle. In this way the required oil pressure mapcould be established in a very quick way without the need forexpensive engine dynamometer installations and testing. The testswere started with the lowest oil temperature. Three accelerationsfrom idle across the speed range were performed at each oil tem-perature. After each of these three tests the engine was left idlinguntil the next oil temperature level was recorded and subsequentaccelerations were performed.
The difference between the minimum pressure that is requiredfor a reliable engine function, in this case 100 kPa, and the
Δ
Fig. 11. Mixed oil temperature with new bypass.
F. Will / Fuel 102 (2012) 247–255 253
theoretical maximum pressure (without opening of pressure re-lieve valve) could be used to increase the flow rate through the cyl-inder head.
It can be seen that at the lowest engine speed the difference be-tween the minimum functional pressure of 100 kPa and the maxi-mum pressure at 40 �C is 300 kPa. This represents excessive flowavailability of 75% through the cylinder head by-pass. At themaximum engine speed of 5300 RPM the pressure is 740 kPa, rep-resenting an excessive flow availability of 86%. The actual excessiveflow availability at low temperatures and low engine revolutionswill be even larger because at temperatures below 80 �C the oilpressure is already higher than the opening pressure of the pres-sure relieve valve so that the relieve valve releases a significantamount of oil flow (Fig. 1). The pressure curves at 100 �C and120 �C initially show a steep increase of pressure but after1500 RPM the curve flattens out and the slope of the pressure in-crease over engine speed is reduced by over 50% due to the openingof the pressure relieve valve. At temperatures below 60 �C thissignificant reduction of the slope is missing because the pressurerelieve valve is already open at 1000 RPM.
5.2. Warm up simulation results
A very simple simulation was conducted for a new system con-figuration that only includes the bypass through the cylinder headbut without the heat exchanger. For different by-pass flow ratios xthe mixed oil temperature after 300 s was calculated and com-pared with the calculated temperature for the original configura-tion (Fig. 10). At a bypass flow ratio of 70% the oil temperatureincreased by 64 �C and for a ratio of 0.5 the temperature gain is still29 �C. At a lower ratio of 0.2 however, the temperature improve-ment is less than 2 �C. That means to achieve a good warm up ben-efit, the bypass flow ratio needs to be as large as possible. If theratio is too small, no measureable fuel economy benefits can berealised.
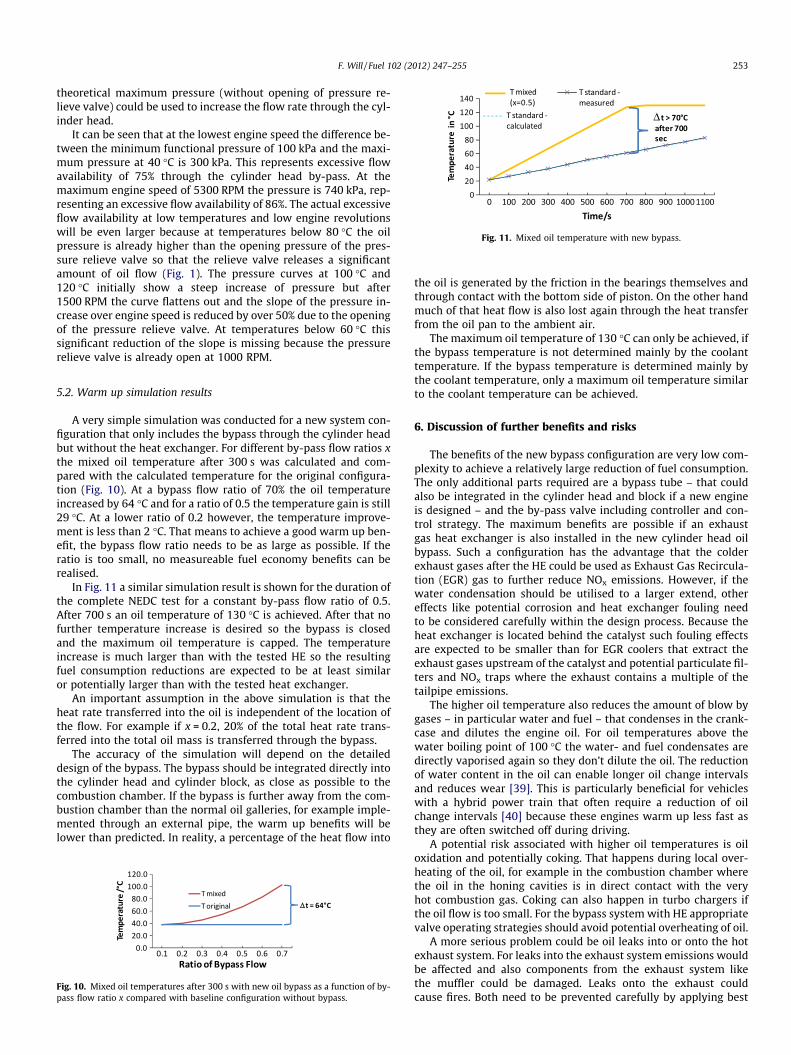
In Fig. 11 a similar simulation result is shown for the duration ofthe complete NEDC test for a constant by-pass flow ratio of 0.5.After 700 s an oil temperature of 130 �C is achieved. After that nofurther temperature increase is desired so the bypass is closedand the maximum oil temperature is capped. The temperatureincrease is much larger than with the tested HE so the resultingfuel consumption reductions are expected to be at least similaror potentially larger than with the tested heat exchanger.
An important assumption in the above simulation is that theheat rate transferred into the oil is independent of the location ofthe flow. For example if x = 0.2, 20% of the total heat rate trans-ferred into the total oil mass is transferred through the bypass.
The accuracy of the simulation will depend on the detaileddesign of the bypass. The bypass should be integrated directly intothe cylinder head and cylinder block, as close as possible to thecombustion chamber. If the bypass is further away from the com-bustion chamber than the normal oil galleries, for example imple-mented through an external pipe, the warm up benefits will belower than predicted. In reality, a percentage of the heat flow into
ΔΔ
Fig. 10. Mixed oil temperatures after 300 s with new oil bypass as a function of by-pass flow ratio x compared with baseline configuration without bypass.
the oil is generated by the friction in the bearings themselves andthrough contact with the bottom side of piston. On the other handmuch of that heat flow is also lost again through the heat transferfrom the oil pan to the ambient air.
The maximum oil temperature of 130 �C can only be achieved, ifthe bypass temperature is not determined mainly by the coolanttemperature. If the bypass temperature is determined mainly bythe coolant temperature, only a maximum oil temperature similarto the coolant temperature can be achieved.
6. Discussion of further benefits and risks
The benefits of the new bypass configuration are very low com-plexity to achieve a relatively large reduction of fuel consumption.The only additional parts required are a bypass tube – that couldalso be integrated in the cylinder head and block if a new engineis designed – and the by-pass valve including controller and con-trol strategy. The maximum benefits are possible if an exhaustgas heat exchanger is also installed in the new cylinder head oilbypass. Such a configuration has the advantage that the colderexhaust gases after the HE could be used as Exhaust Gas Recircula-tion (EGR) gas to further reduce NOx emissions. However, if thewater condensation should be utilised to a larger extend, othereffects like potential corrosion and heat exchanger fouling needto be considered carefully within the design process. Because theheat exchanger is located behind the catalyst such fouling effectsare expected to be smaller than for EGR coolers that extract theexhaust gases upstream of the catalyst and potential particulate fil-ters and NOx traps where the exhaust contains a multiple of thetailpipe emissions.
The higher oil temperature also reduces the amount of blow bygases – in particular water and fuel – that condenses in the crank-case and dilutes the engine oil. For oil temperatures above thewater boiling point of 100 �C the water- and fuel condensates aredirectly vaporised again so they don’t dilute the oil. The reductionof water content in the oil can enable longer oil change intervalsand reduces wear [39]. This is particularly beneficial for vehicleswith a hybrid power train that often require a reduction of oilchange intervals [40] because these engines warm up less fast asthey are often switched off during driving.
A potential risk associated with higher oil temperatures is oiloxidation and potentially coking. That happens during local over-heating of the oil, for example in the combustion chamber wherethe oil in the honing cavities is in direct contact with the veryhot combustion gas. Coking can also happen in turbo chargers ifthe oil flow is too small. For the bypass system with HE appropriatevalve operating strategies should avoid potential overheating of oil.
A more serious problem could be oil leaks into or onto the hotexhaust system. For leaks into the exhaust system emissions wouldbe affected and also components from the exhaust system likethe muffler could be damaged. Leaks onto the exhaust couldcause fires. Both need to be prevented carefully by applying best
254 F. Will / Fuel 102 (2012) 247–255
practice design principles like Failure Mode and Effect Analysissimilar as for other oil pipes that are close to the exhaust like forthe turbo charger lubrication.
On the positive side the engine performance at cold tempera-tures and cold start drive away will be improved a lot, sluggish colddrive is a problematic area of modern down-sized engines. Theeffect on the cabin warm up will depend on the system configura-tion. Without exhaust/oil HE there could be a negative effect as lesswasted heat is available due to reduced engine load. With HE theheater performance is expected to improve.
Engine noise can also be affected depending on the detaileddesign solution. Some articles suggest a reduction of engine noiseand particularly a reduction of the dominating orders comparedto the overall noise level with the reduction of oil pressures [41],the same is expected with an external by-pass that also reducesoil pressures to a similar extend.
7. Conclusions
(1) Tests with variable oil pumps confirm only 50% of the fueleconomy improvements that were predicted with computersimulations. The discrepancy can be explained because var-iable oil pumps reduce the heat transfer to the oil and thusreduce the oil temperature during warm up. Increasing theheat transfer to the oil therefore offers further potential toimprove fuel economy.
(2) Vehicle tests showed fuel consumption reductions of over7% if the engine oil is heated directly with an exhaust gasheat exchanger. The percentage improvements for the coldextra urban drive cycle and urban drive cycle were of similarmagnitude indicating a similar real world benefit.
(3) The cold/hot factor does not describe the maximum fueleconomy improvement due to warm up because the oil tem-perature can be elevated well above the oil temperaturesthat are relevant for the determination of the cold/hot factor.
(4) A maximum heat exchanger heating power of 18 kW wasmeasured during a NEDC test. Water condensation furtherincreases the heat exchanger effectiveness. The condensa-tion of exhaust water offers a benefit that is in the samerange as reducing the exhaust gas temperature. A maximumavailable condensation enthalpy of 14 kW has been deter-mined for the vehicle tested.
(5) Emission reduction is another important benefit of warmingup the oil faster, particularly for CO and NOx. For HC emis-sions the benefits are partially offset by increased oil vapori-sation in the combustion chamber.
(6) A new system with an external engine oil bypass has beenpresented that is less complex compared to an exhaust gasheat exchanger. Simulations have demonstrated that sucha system is capable of large increases in oil temperatureand therefore similar fuel consumption reductions as forthe heat exchanger system that was tested. For a standardengine the percentage of oil mass flow that can be directedinto such a new bypass can account to up to 80% of the totaloil flow at NEDC test start temperature.
(7) Potential risks of such a system are oil degradation or leaks.These risks are already mastered in engine applications withturbo chargers.
(8) Warming up the engine oil offers further advantages likebetter oil quality leading to extended oil change intervalsor reduced wear, improved engine performance, faster cabinwarm up and reduced noise. The extend of these benefitswill depend on specific configurations of the new systemand the engine to be modified which offers a broad rangeof opportunities for further research.
Acknowledgements
The author likes to thank Dong Yang, Associate Prof. LingxueKong, Prof. Peter Hodgson, Ford Motor Company of Australia andIno8 Pty Ltd. for their support related to this exciting project.
References
[1] Enomoto Y, Yamamoto T. New materials in automotive tribology. Tribol Lett1998;5:13–24.
[2] Qu J, Blau PJ, Dai S, Luo H, Meyer III HM. Ionic liquids as novel lubricants andadditives for diesel engine applications. Tribol Lett 2009;35:181–9.
[3] van Basshuysen R, Schaefer F. Internal combustion enginehandbook. Warrendale: SAE; 2004.
[4] Maassen F J, Dohmen J, Pischinger S, Schwaderlapp M. Reibleistungsreduktion– Konstruktive Maßnahmen zur Verbrauchseinsparung. MTZ 2005;66:592–7[in German].
[5] Kirkpatrick A, Ferguson C. Internal combustion engines, appliedthermoscience. 2nd ed. New York: Wiley; 2001.
[6] n.n.: Motor vehicle emissions. Council directive 70/220/EEC, Interregs; 1999.[7] Deussen N. In: Waermemanagement des Kraftfahrzeugs V, Steinberg P, editors.
Einfluss der Starttemperatur auf den Kraftstoffverbrauch. Renningen: ExpertVerlag; 2006. p. 143–62 [in German].
[8] Pischinger S, Kochanowski H-A, Steffens C, Sonnen S, Atzler M. AkustischeAuslegung von Wälzlagern im Kurbeltrieb. MTZ 2009;70:244–51 [in German].
[9] Everson MP, Ohtani H. New opportunities in automotive tribology. Tribol Lett1998;5:1–12.
[10] Yajun M, Wancheng Z, Shenghua L, Yuangsheng J, Yucong W, Simon C.Tribological performance of three advanced piston rings in the presence ofMoDTC-modified GF-3 oils. Tribol Lett 2005;18:75–83.
[11] Martinez DL, Valverde M, Rabute R, Ferrarese A. Ring packs for frictionoptimised engines. MTZ 2010;71:27–9.
[12] Bezdek RH, Wendling RM. Energy Policy. US National Research Council; 2002.[13] Dings J. Reducing CO2 emissions from new cars: a study of major car
manufacturers progress in 2008. European Federation for Transport andEnvironment; 2009.
[14] Lund C, Maister W, Lange C, Beyer B. In: Wärmemanagement desKraftfahrzeugs VI, Steinberg P, editors. Innovation durch Co-Simulation. Renningen: Expert Verlag; 2008. p. 163–87 [in German].
[15] Voigt D. In: Oelkreislauf von Verbrennungsmotoren III, Berg M, editors.Potentiale zur Weiterentwickung von Regeloelpumpen. Renningen: ExpertVerlag; 2009. p. 106–17 [in German].
[16] Woeckel N, Leimboeck M. In: Oelkreislauf von Verbrennungsmotoren II, BergM, editors. Optimierter Oelkreislauf der neuen Porsche V8 Motoren mitvariabler Oelpumpe. Renningen: Expert Verlag; 2007. p. 2–22 [in German].
[17] Mendl G, Heiduk T, Mendle J, Verhees V, Renner D. In: Oelkreislauf vonVerbrennungsmotoren II, editor. Der Oelhaushalt der neuen V6 Ottomotoren:Entwicklung einer Regeloelpumpe mit zweistufigerDrucksteuerung. Renningen: Expert Verlag; 2007. p. 23–39 [in German].
[18] Ernst J, Holl J, Froehlich G, Jung M. In: Oelkreislauf von VerbrennungsmotorenIII, Berg M, editors. Die Audi Regeloelpumpe: Eine Herausvorderung an dasGesamtfahrzeug. Renningen: Expert Verlag; 2009. p. 2–24 [in German].
[19] Mehring J, Borrmann D, Pingen B, Buck T, Treutler J. In: Oelkreislauf vonVerbrennungsmotoren III, Berg M, editors. Simulation desKraftstoffverbrauchsvorteils durch Einsatz innovativerOelpumpenkonzepte. Renningen: Expert Verlag; 2009. p. 49–70 [in German].
[20] Schwaderlapp M, Dohmen J, Haubner F, Barthel R, Biwer C.Reibungsreduzierung als Verbrauchsmaßnahme. MTZ 2003;64:222–9 [inGerman].
[21] Will F. The importance of advanced test processes to reduce emissions and fuelconsumption, key note speech. In: ICSAT conference, Melbourne; 2008.
[22] Holzer H. Waermemanagement im Antriebsstrang von Verbrennungsmotoren.PhD thesis. Technical University of Vienna. MTZ 2002;63:386 [in German].
[23] Kunze K, Wolff S, Lade I, Tonhauser J. A systematic analysis of CO2 reduction byan optimised heat supply during vehicle warm-up. SAE 2006-01-1450.
[24] Maassen JF, Dohmen J, Pischinger S, Schwaderlapp M. Reibleistungsreduktion -Konstruktive Maßnahmen zur Verbrauchseinsparung. MTZ 2005;66:592–7 [inGerman].
[25] Kleinschmidt W, Hebel D. Instationaere Waermeuebertragung inVerbrennungsmotoren – theory, simulation and comparison with test results.Final report of research project Kl600/1-2. German Research Association; 1995 [inGerman].
[26] Kleinschmidt W, Hebel D. Instationaere Waermeuebertragung inVerbrennungsmotoren – theory, simulation and comparison with test results.VDI progress reports, No. 383. Society of German Engineers (VDI); 1999.
[27] Merker GP, Schwarz C, Stiesch G, Otto F. Simulating combustion – simulation ofcombustion and pollutant formation or engine-development. Berlin: Springer;2006.
[28] Woschni G. Die Berechnung der Wandwärmeverluste und der thermischenBelastung der Bauteile von Dieselmotoren. MTZ 1970;31:491–9 [in German].
[29] Bargende M. Ein Gleichungsansatz zur Berechnung der instationärenWandwärmeverluste im Hochdruckteil von Ottomotoren. Dissertation, THDarmstadt; 1990 [in German].
F. Will / Fuel 102 (2012) 247–255 255
[30] Hohenberg G. Experimentelle Erfassung der Wandwärme von Kolbenmotoren.Habilitation, TU Graz; 1980.
[31] Annand W. Instantanious heat transfer rates to the cylinder head surface of asmall compression-ignition engine. Proc Instn Mech Engrs 1971;185(72):976–87.
[32] n.n. Bosch automotive handbook. 7th ed. Chichester: Wiley; 2007.[33] Holman JP. Heat transfer. 10th ed. New York: McGraw Hill; 2010.[34] Farrant PE, Robertson A, Hartland J, Joyce S. The application of thermal
modelling to an engine and transmission to improve fuel consumptionfollowing a cold start. SAE2005-01-2038.
[35] Will F. A novel exhaust heat recovery system to reduce fuel consumption. In:F2010A073, FISITA conference, Budapest, Hungary; 2010.
[36] Will F, Boretti A. A new Method to warm up lubricating oil to improve fueleconomy, SAE 2011-01-0318, SAE world congress, Detroit, USA; 2011.
[37] Gohl M. Schnelle Ölemissionsmessung bei Otto- und Dieselmotoren, FVVVorhaben Nr. 758, Massenspektrometrische Bestimmung der Ölemission imAbgas von Otto- und Dieselmotoren, FVV; 2002 [in German].
[38] Will F. Process and device for lubrication of rotating and oscillatingcomponents. Patent application no. DE 102009013943.5 filed 19/03/2009;2009.
[39] Schwarze H, Brouwer L, Knoll G, Schlerege F, Müller-Frank U, Kopnarski M,et al. Ölalterung und Verschleiß im Ottomotor. MTZ 2008;69:878–86 [inGerman].
[40] n.n., Owners manual Toyota Camry hybrid, Toyota Motor Corporation; 2006.[41] Woeckel N, Leimboeck M. In: Oelkreislauf von Verbrennungsmotoren II, editor.
Optimierter Oelkreislauf der neuen Porsche V8 Motoren mit variablerOelpumpe. Renningen: Expert Verlag; 2007 [in German].
[42] Boretti AA, Will F, Watson HC, Brear MJ, Dingli R, Voice G. Comparison of staticand dynamic engine models on the transient performance of a passengervehicle powertrain. In: FISITA congress, Munich, F2008-12-287.