55
FULL YEAR RESULTS APRIL 29 TH 2015
| Date post: | 09-Jun-2018 |
| Category: |
Documents |
| Upload: | nguyenkhue |
| View: | 215 times |
| Download: | 0 times |

FULL YEAR RESULTS
APRIL 29TH 2015
A PIVOTAL YEAR
• Significant change and challenge
• Profit performance below initial expectations
• Strategic vision unchanged
• Improvements in systems, processes and structures
• Becoming a better retailer will deliver future growth
• Financial services represents further opportunity
1

AGENDA
FINANCIALS & GUIDANCE
STRATEGY UPDATE
IMPROVING OUR RETAIL BASICS
FINANCIAL SERVICES
FIT 4 THE FUTURE
INTERNATIONAL & STORES UPDATE
SUMMARY
Q&A
2

JOHN GUEST, FINANCIAL CONTROLLER
FINANCIALS & GUIDANCE
3
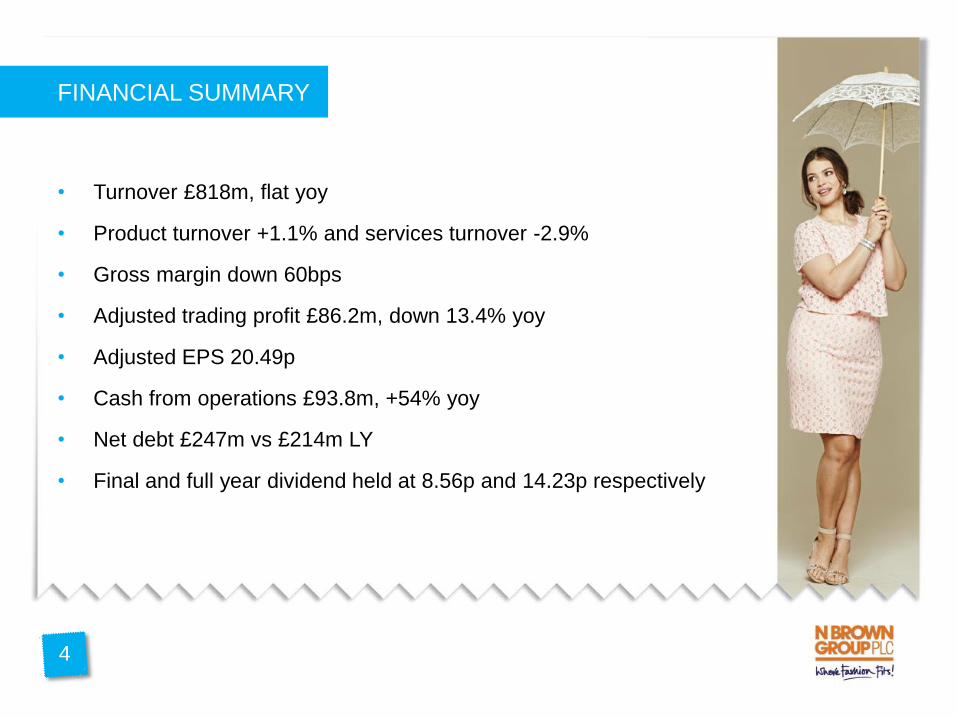
FINANCIAL SUMMARY
• Turnover £818m, flat yoy
• Product turnover +1.1% and services turnover -2.9%
• Gross margin down 60bps
• Adjusted trading profit £86.2m, down 13.4% yoy
• Adjusted EPS 20.49p
• Cash from operations £93.8m, +54% yoy
• Net debt £247m vs £214m LY
• Final and full year dividend held at 8.56p and 14.23p respectively
4
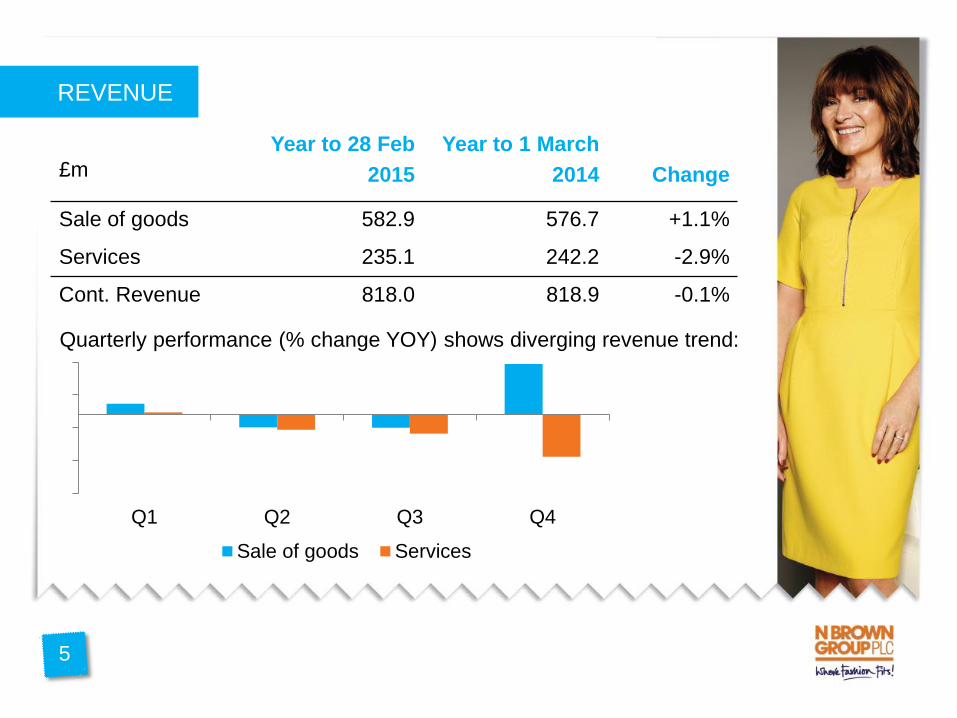
REVENUE
Quarterly performance (% change YOY) shows diverging revenue trend:
£m
Year to 28 Feb
2015
Year to 1 March
2014
Change
Sale of goods 582.9 576.7 +1.1%
Services 235.1 242.2 -2.9%
Cont. Revenue 818.0 818.9 -0.1%
5
Q1 Q2 Q3 Q4
Sale of goods Services
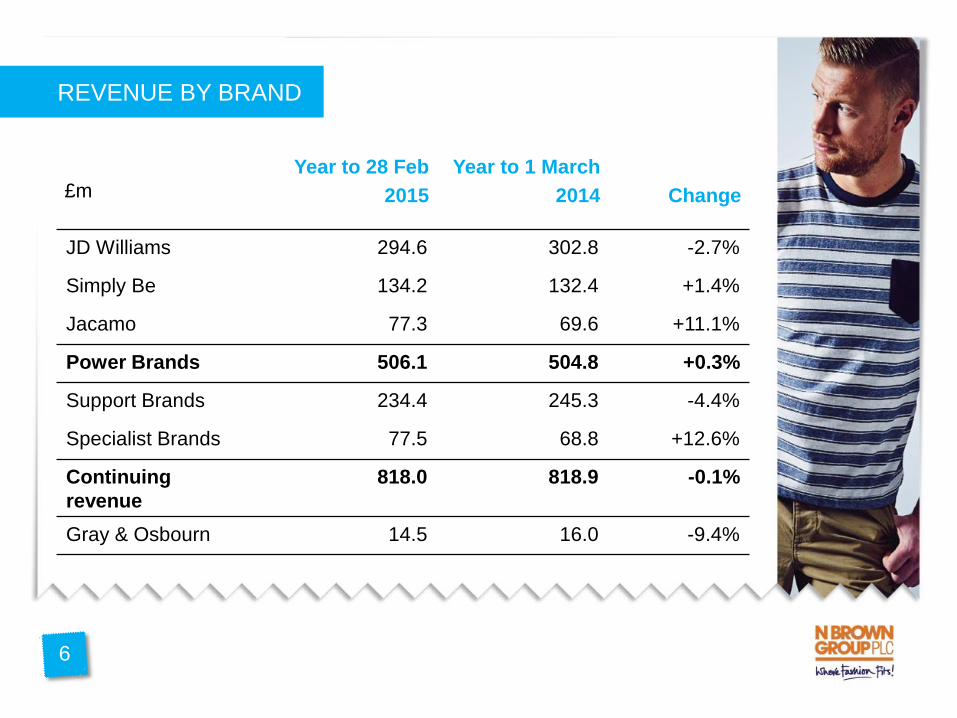
REVENUE BY BRAND
£m
Year to 28 Feb
2015
Year to 1 March
2014
Change
JD Williams 294.6 302.8 -2.7%
Simply Be 134.2 132.4 +1.4%
Jacamo 77.3 69.6 +11.1%
Power Brands 506.1 504.8 +0.3%
Support Brands 234.4 245.3 -4.4%
Specialist Brands 77.5 68.8 +12.6%
Continuing
revenue
818.0 818.9 -0.1%
Gray & Osbourn 14.5 16.0 -9.4%
6
GROSS MARGIN
7
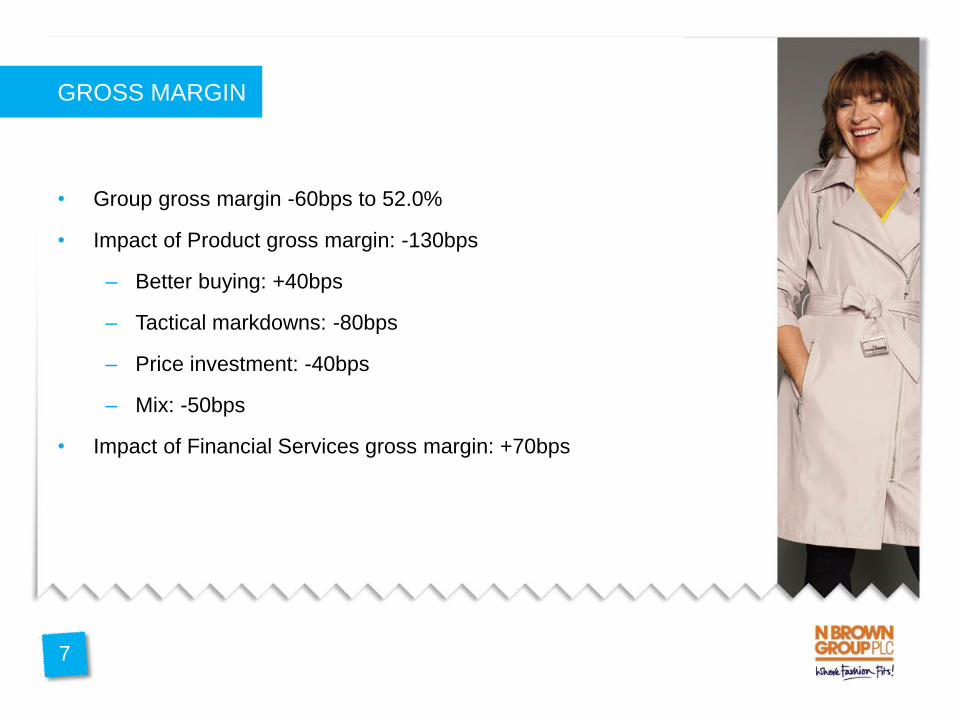
• Group gross margin -60bps to 52.0%
• Impact of Product gross margin: -130bps
– Better buying: +40bps
– Tactical markdowns: -80bps
– Price investment: -40bps
– Mix: -50bps
• Impact of Financial Services gross margin: +70bps

OPERATING PROFIT
£m
Year to 28 Feb
2015
Year to 1 March
2014
Change
Group Revenue 818.0 818.9 -0.1%
Gross Profit 425.6 431.1 -1.3%
Gross Margin % 52.0% 52.6% -60bps
Distribution Costs (73.9) (69.4) +6.5%
Sales and
Administration (257.9) (255.2) +1.1%
Operating Profit 93.8 106.5 -11.9%
Operating Margin 11.5% 13.0% -150bps
8
Continuing operations, pre-exceptional items

PROFIT BRIDGE
9
99.6
50
60
70
80
90
100
110
4.5 (5.1)
(10.0)
(8.4)
4.3 2.2 0.9 (1.8) 86.2
GROUP PROFIT & LOSS
10
£m
Year to 28 Feb
2015
Year to 1 March
2014
Change
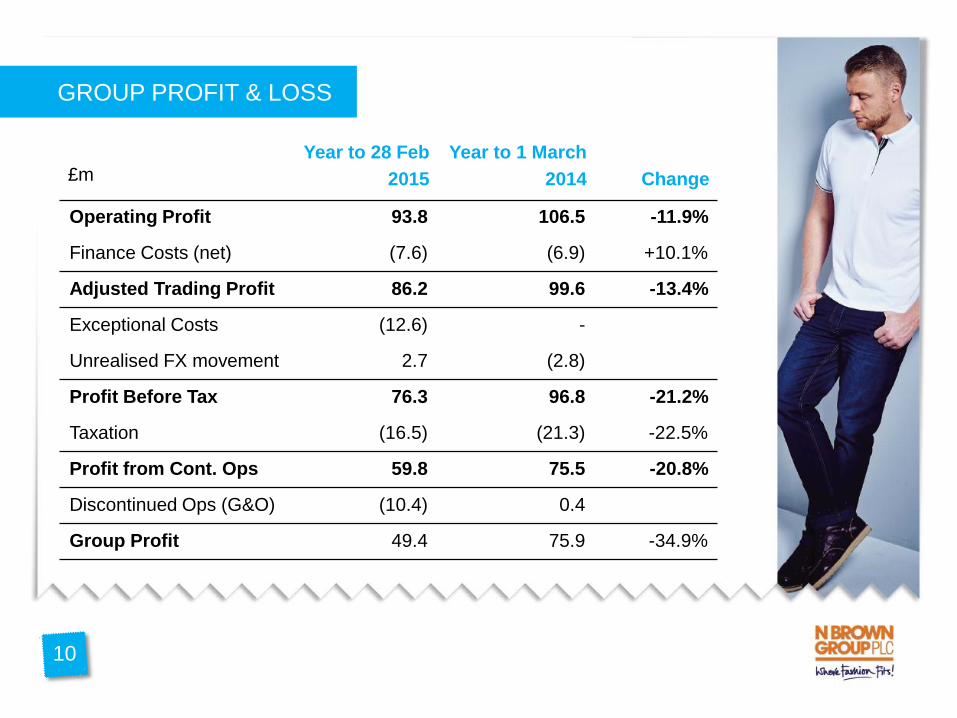
Operating Profit 93.8 106.5 -11.9%
Finance Costs (net) (7.6) (6.9) +10.1%
Adjusted Trading Profit 86.2 99.6 -13.4%
Exceptional Costs (12.6) -
Unrealised FX movement 2.7 (2.8)
Profit Before Tax 76.3 96.8 -21.2%
Taxation (16.5) (21.3) -22.5%
Profit from Cont. Ops 59.8 75.5 -20.8%
Discontinued Ops (G&O) (10.4) 0.4
Group Profit 49.4 75.9 -34.9%
NET ASSETS
11
£m
28 Feb
2015
1 March
2014
Change
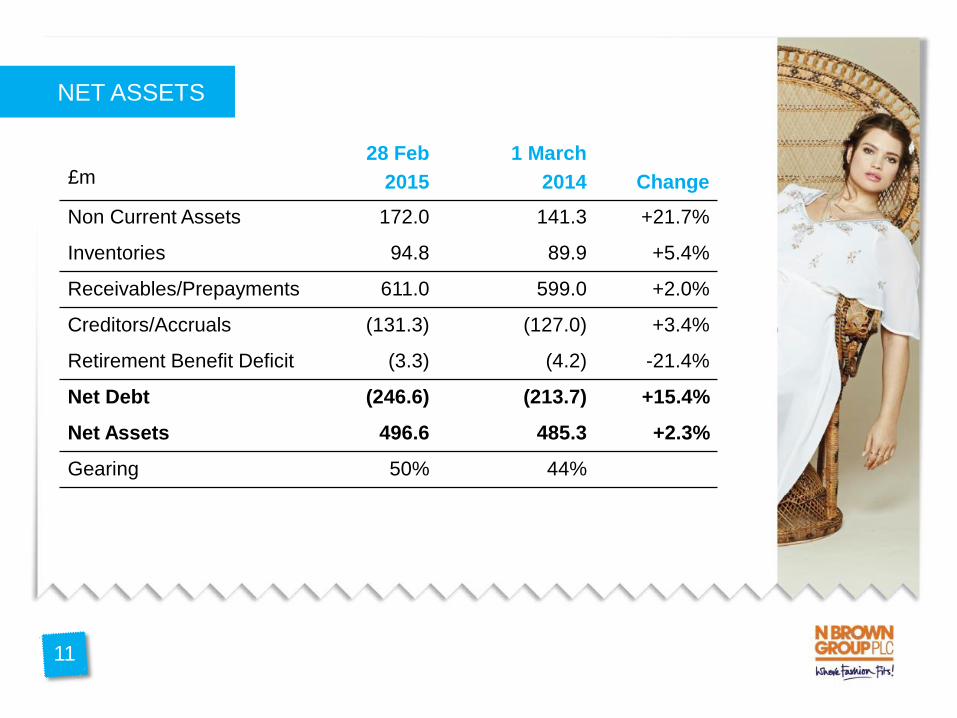
Non Current Assets 172.0 141.3 +21.7%
Inventories 94.8 89.9 +5.4%
Receivables/Prepayments 611.0 599.0 +2.0%
Creditors/Accruals (131.3) (127.0) +3.4%
Retirement Benefit Deficit (3.3) (4.2) -21.4%
Net Debt (246.6) (213.7) +15.4%
Net Assets 496.6 485.3 +2.3%
Gearing 50% 44%
RECEIVABLES & PROVISIONING
12
£m
28 Feb
2015
1 March
2014
Change
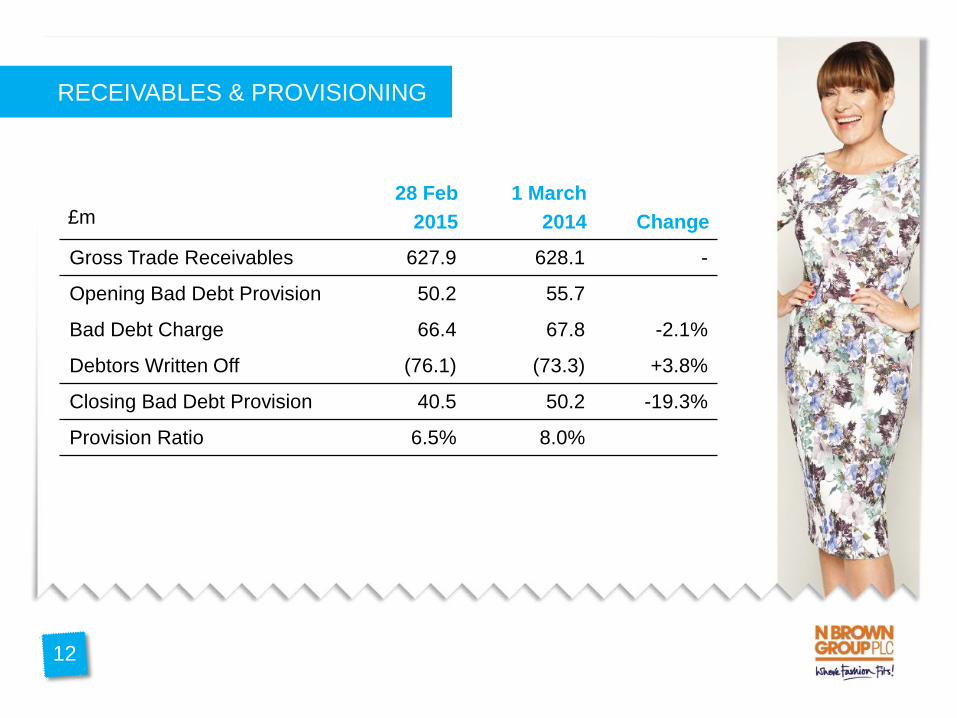
Gross Trade Receivables 627.9 628.1 -
Opening Bad Debt Provision 50.2 55.7
Bad Debt Charge 66.4 67.8 -2.1%
Debtors Written Off (76.1) (73.3) +3.8%
Closing Bad Debt Provision 40.5 50.2 -19.3%
Provision Ratio 6.5% 8.0%
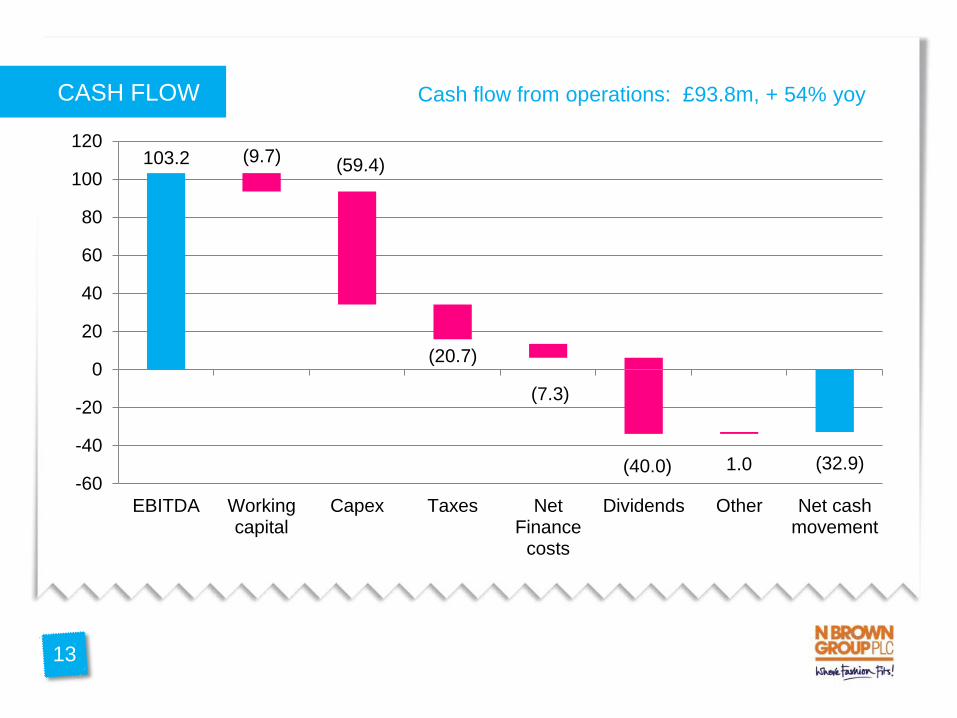
CASH FLOW
13
103.2 (9.7)
Cash flow from operations: £93.8m, + 54% yoy
-60
-40
-20
0
20
40
60
80
100
120
EBITDA Workingcapital
Capex Taxes NetFinance
costs
Dividends Other Net cashmovement
(59.4)
(20.7)
(7.3)
(40.0) 1.0 (32.9)
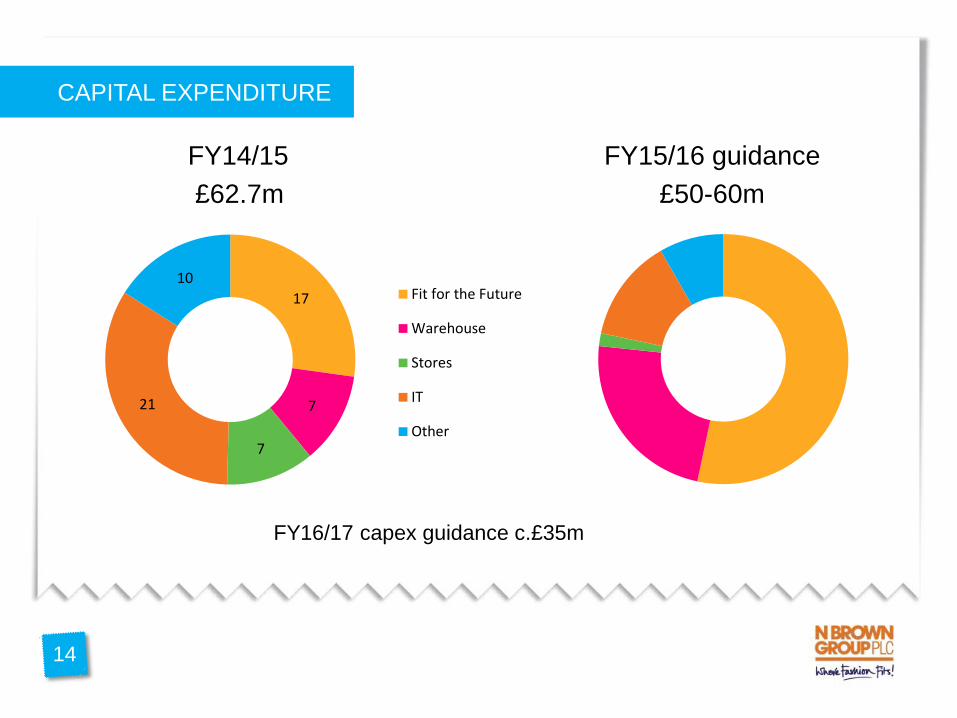
CAPITAL EXPENDITURE
FY14/15 FY15/16 guidance
£62.7m £50-60m
FY16/17 capex guidance c.£35m
14
17
7
7
21
10 Fit for the Future
Warehouse
Stores
IT
Other
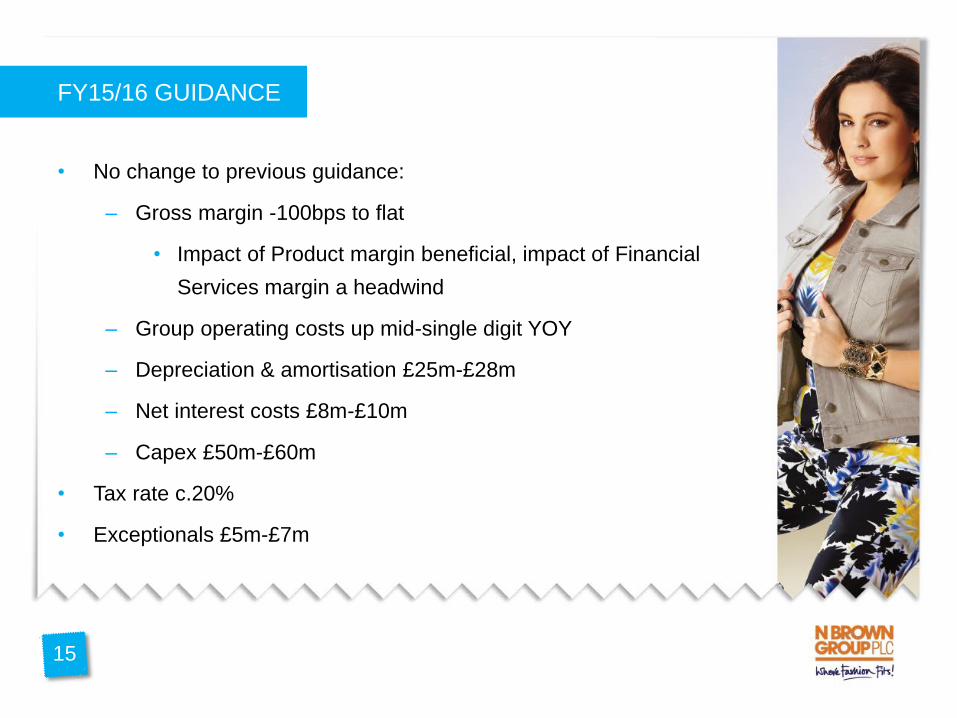
FY15/16 GUIDANCE
15
• No change to previous guidance:
– Gross margin -100bps to flat
• Impact of Product margin beneficial, impact of Financial
Services margin a headwind
– Group operating costs up mid-single digit YOY
– Depreciation & amortisation £25m-£28m
– Net interest costs £8m-£10m
– Capex £50m-£60m
• Tax rate c.20%
• Exceptionals £5m-£7m

STRATEGY UPDATE
AGENDA
FINANCIALS & GUIDANCE
IMPROVING OUR RETAIL BASICS
FINANCIAL SERVICES
FIT 4 THE FUTURE
INTERNATIONAL & STORES UPDATE
SUMMARY
Q&A
16
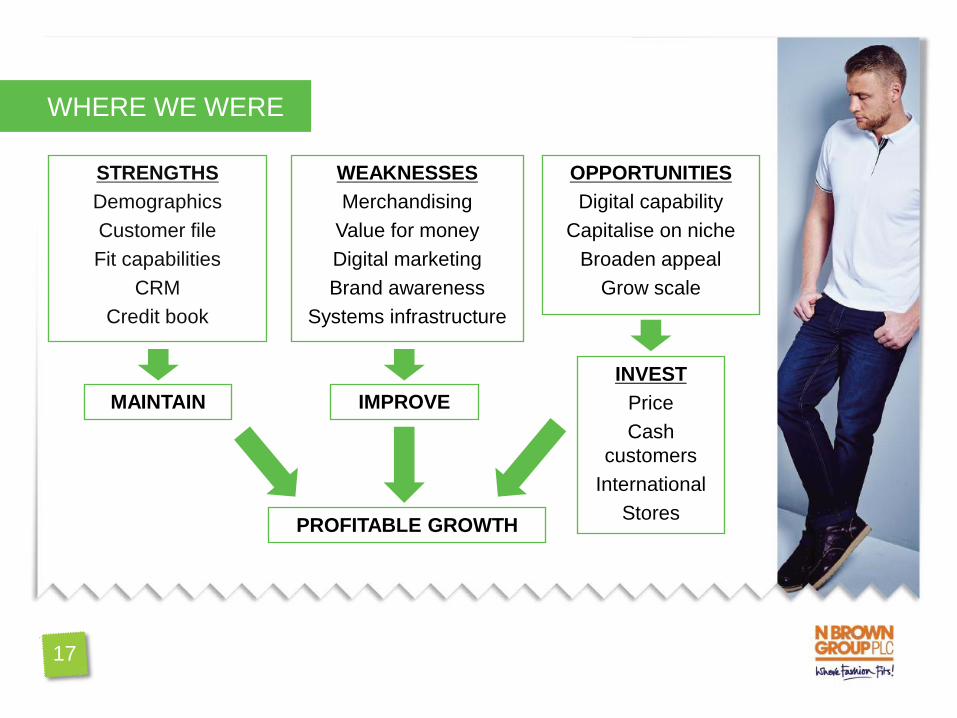
WHERE WE WERE
STRENGTHS
Demographics
Customer file
Fit capabilities
CRM
Credit book
WEAKNESSES
Merchandising
Value for money
Digital marketing
Brand awareness
Systems infrastructure
OPPORTUNITIES
Digital capability
Capitalise on niche
Broaden appeal
Grow scale
MAINTAIN IMPROVE
INVEST
Price
Cash
customers
International
Stores
PROFITABLE GROWTH
17
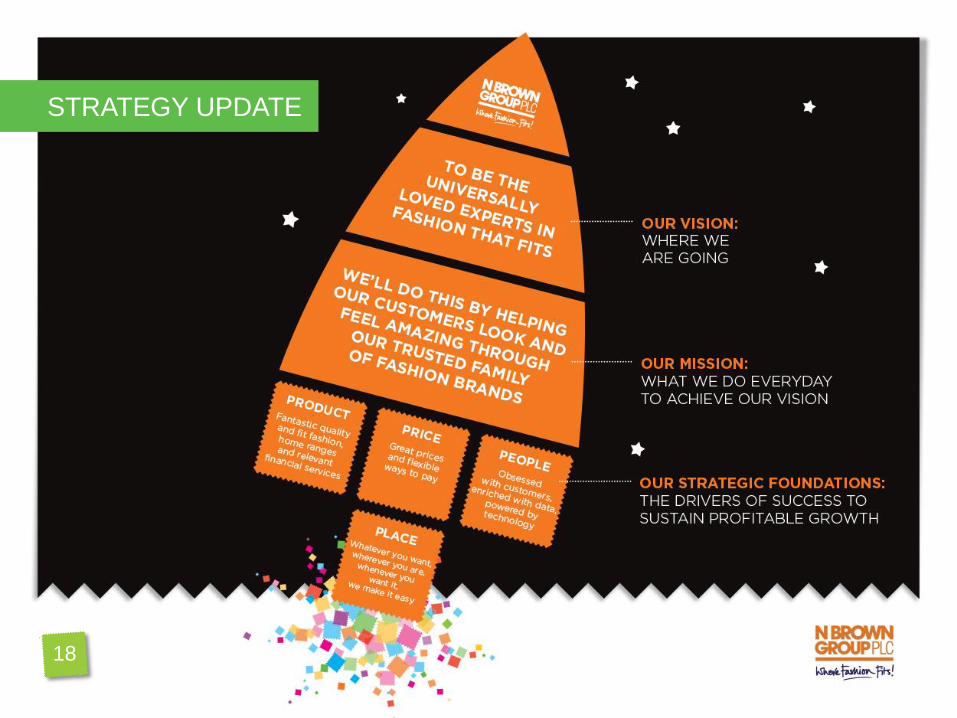
STRATEGY UPDATE
18
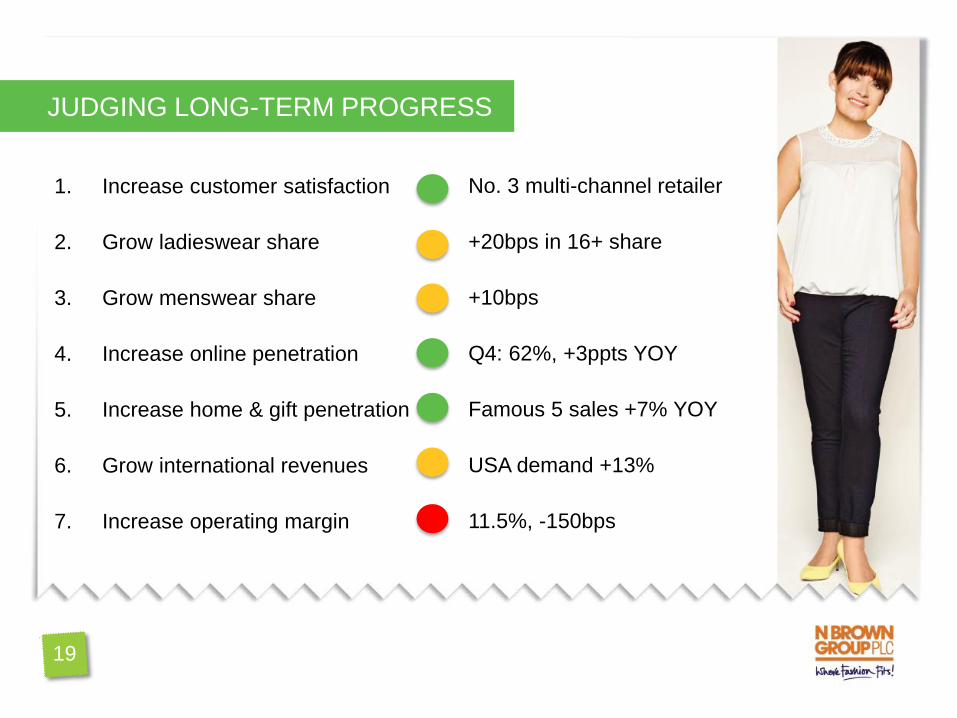
JUDGING LONG-TERM PROGRESS
1. Increase customer satisfaction
2. Grow ladieswear share
3. Grow menswear share
4. Increase online penetration
5. Increase home & gift penetration
6. Grow international revenues
7. Increase operating margin
No. 3 multi-channel retailer
+20bps in 16+ share
+10bps
Q4: 62%, +3ppts YOY
Famous 5 sales +7% YOY
USA demand +13%
11.5%, -150bps
19
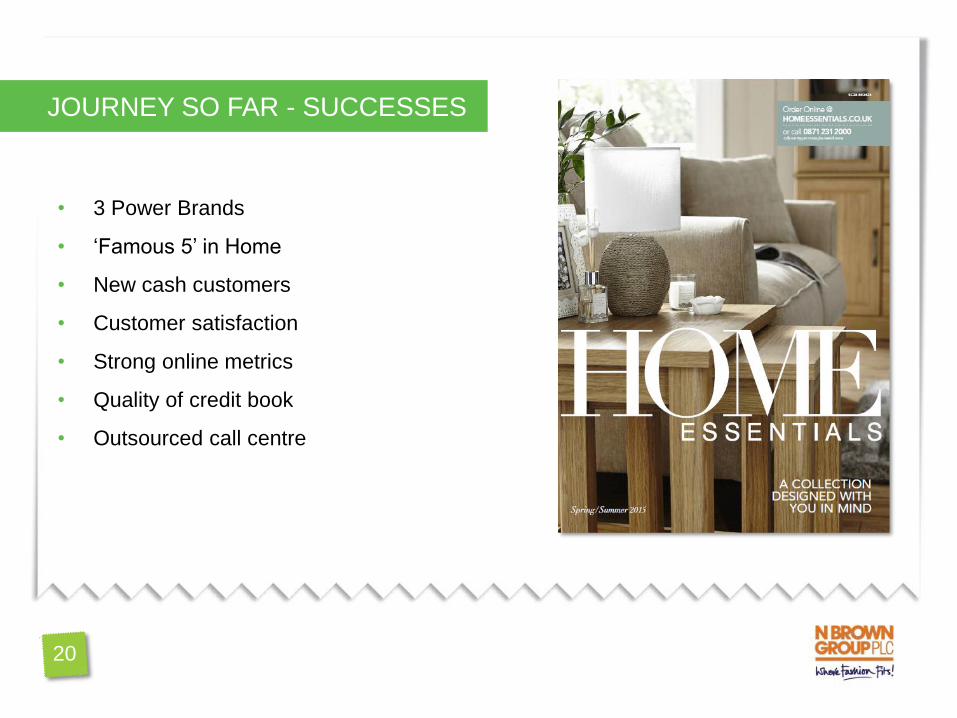
JOURNEY SO FAR - SUCCESSES
• 3 Power Brands
• ‘Famous 5’ in Home
• New cash customers
• Customer satisfaction
• Strong online metrics
• Quality of credit book
• Outsourced call centre
20
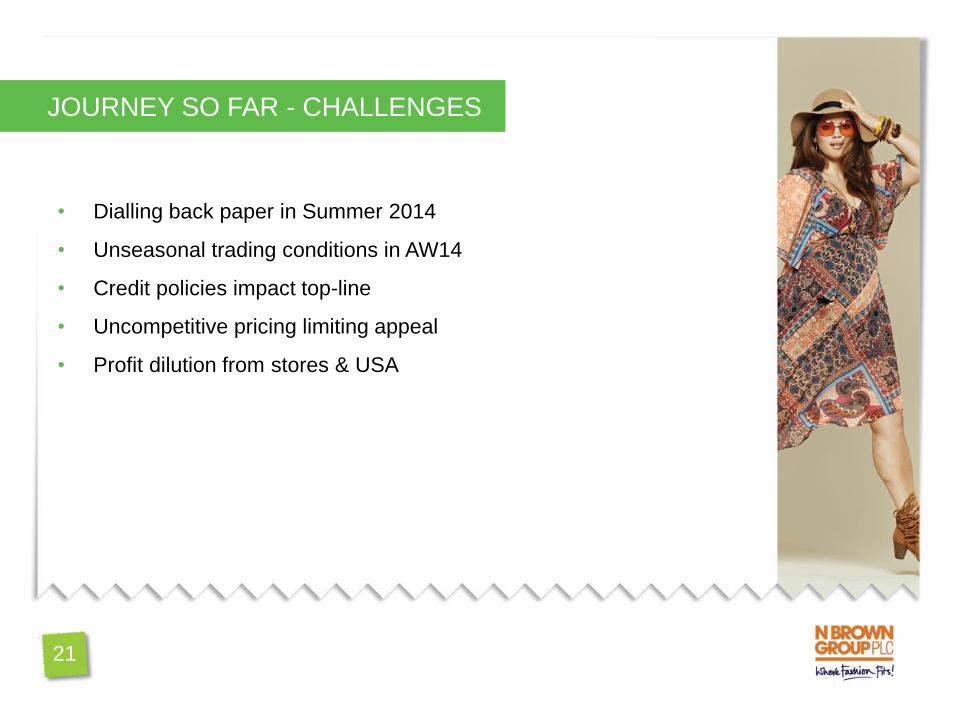
JOURNEY SO FAR - CHALLENGES
• Dialling back paper in Summer 2014
• Unseasonal trading conditions in AW14
• Credit policies impact top-line
• Uncompetitive pricing limiting appeal
• Profit dilution from stores & USA
21
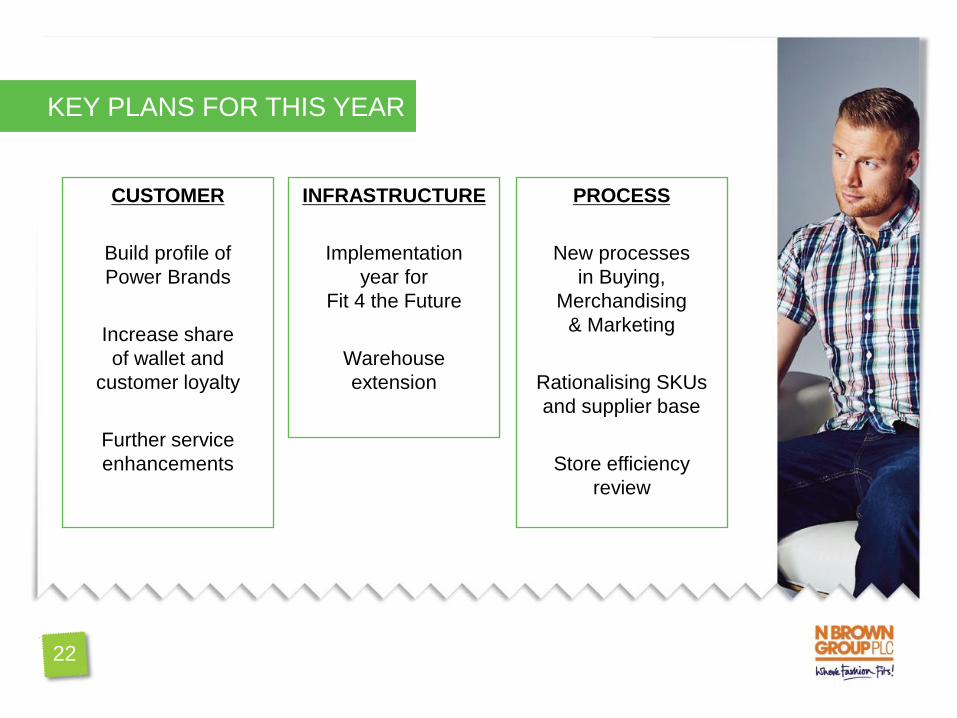
KEY PLANS FOR THIS YEAR
INFRASTRUCTURE
Implementation
year for
Fit 4 the Future
Warehouse
extension
CUSTOMER
Build profile of
Power Brands
Increase share
of wallet and
customer loyalty
Further service
enhancements
PROCESS
New processes
in Buying,
Merchandising
& Marketing
Rationalising SKUs
and supplier base
Store efficiency
review
22
IMPROVING OUR RETAIL BASICS
AGENDA
FINANCIALS & GUIDANCE
STRATEGY UPDATE
FINANCIAL SERVICES
FIT 4 THE FUTURE
INTERNATIONAL & STORES UPDATE
SUMMARY
Q&A
23

PRODUCT QUALITY
• Strengthened fit specialism
• Better size consistency
• Improving fabric qualities
• Developing unique and
innovative products
24
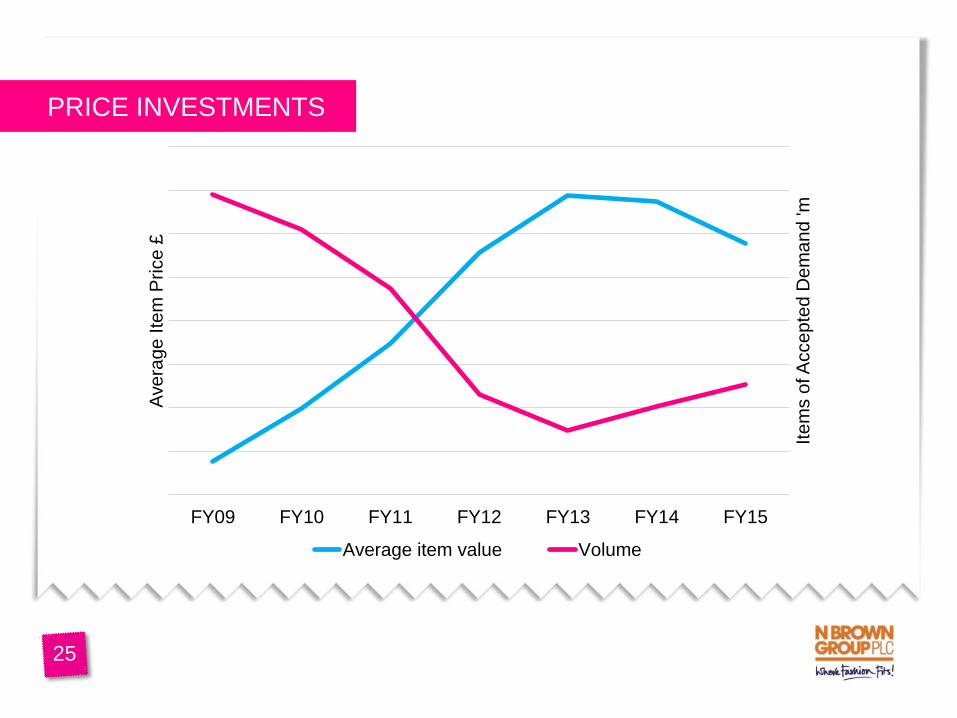
25
FY09 FY10 FY11 FY12 FY13 FY14 FY15
Ite
ms o
f A
cce
pte
d D
em
an
d 'm
Ave
rag
e I
tem
Price
£
Average item value Volume
PRICE INVESTMENTS
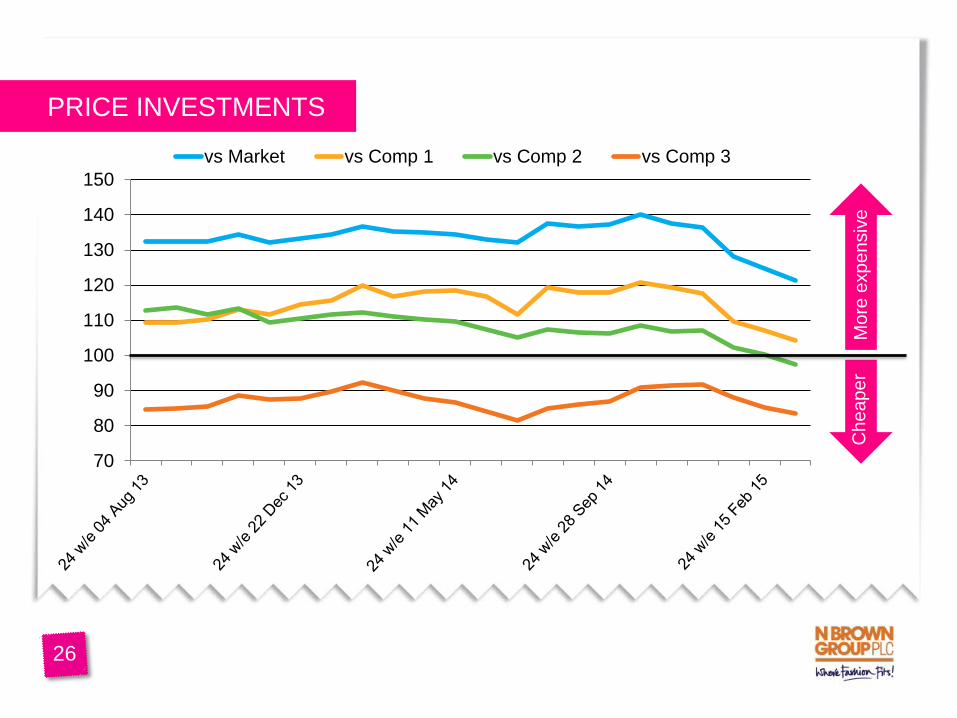
PRICE INVESTMENTS
70
80
90
100
110
120
130
140
150
vs Market vs Comp 1 vs Comp 2 vs Comp 3
26
Cheaper
Mo
re e
xp
en
siv
e
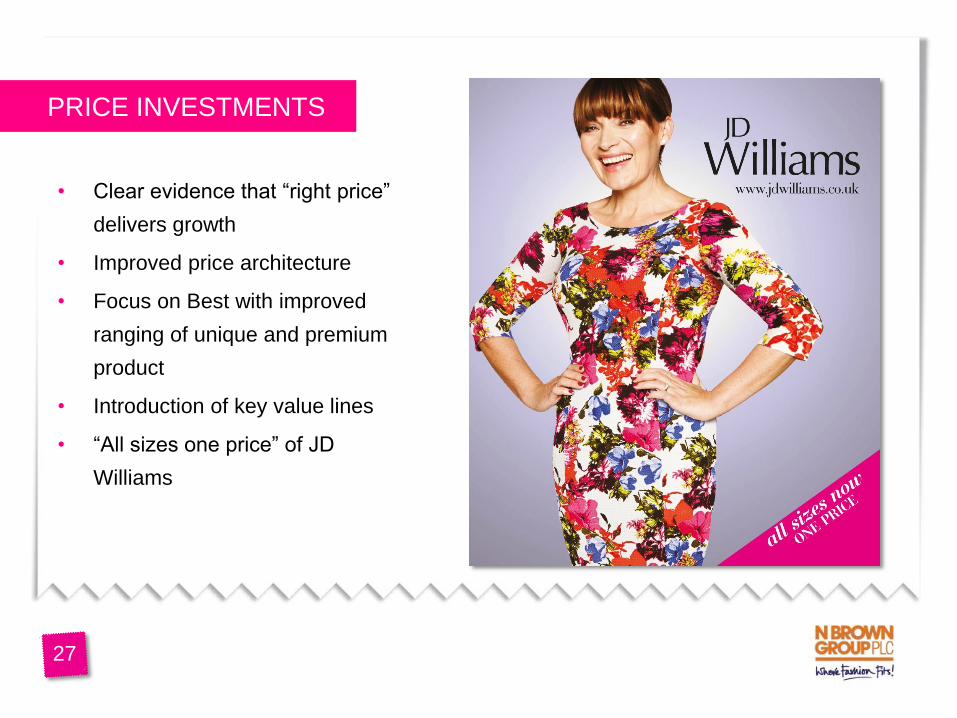
PRICE INVESTMENTS
• Clear evidence that “right price”
delivers growth
• Improved price architecture
• Focus on Best with improved
ranging of unique and premium
product
• Introduction of key value lines
• “All sizes one price” of JD
Williams
27
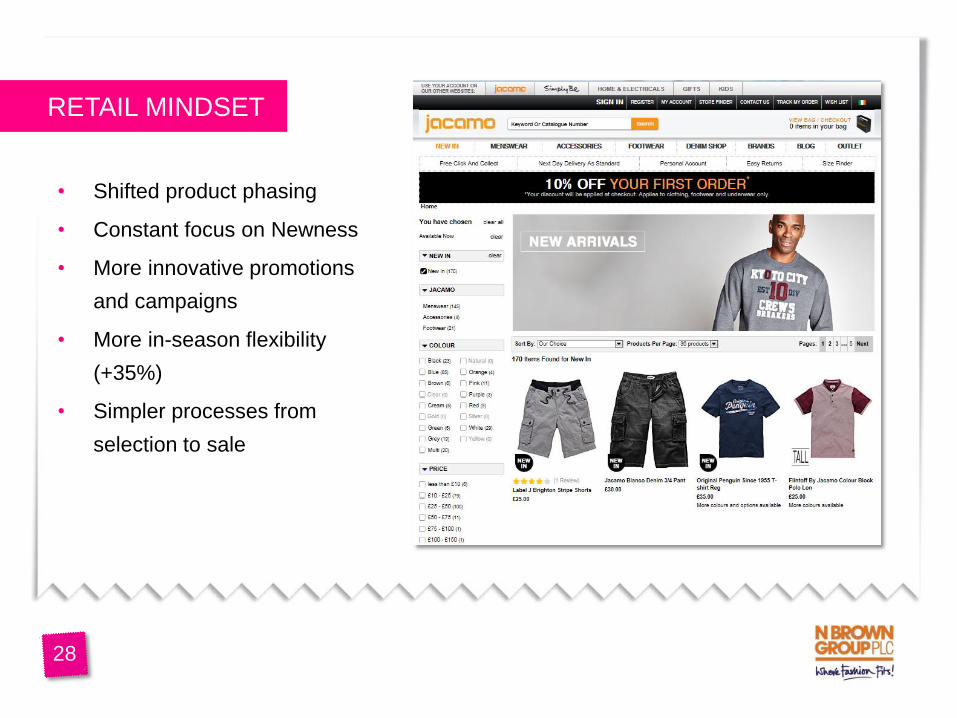
RETAIL MINDSET
• Shifted product phasing
• Constant focus on Newness
• More innovative promotions
and campaigns
• More in-season flexibility
(+35%)
• Simpler processes from
selection to sale
28
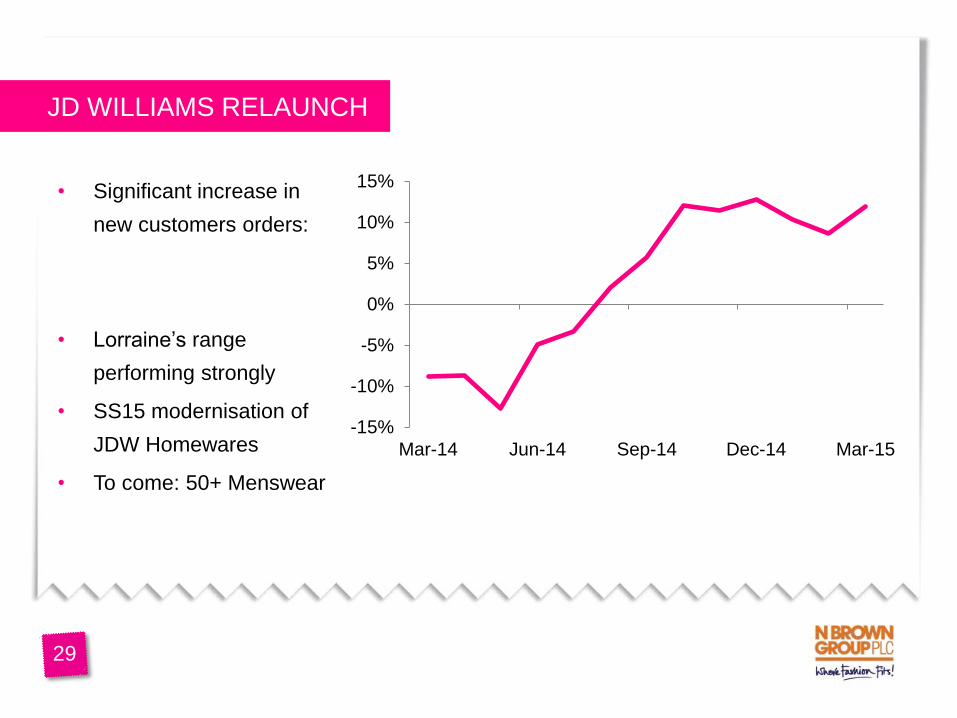
JD WILLIAMS RELAUNCH
• Significant increase in
new customers orders:
• Lorraine’s range
performing strongly
• SS15 modernisation of
JDW Homewares
• To come: 50+ Menswear
-15%
-10%
-5%
0%
5%
10%
15%
Mar-14 Jun-14 Sep-14 Dec-14 Mar-15
29

FROM DIRECT MAIL
TO DIGITAL FIRST
• Simplified checkout
• Launched Amplience
and Monetate
• Introduced predictive
recommendations
• Currently testing
personalisation tool
• New digital talent brought
into Marketing team
30
31
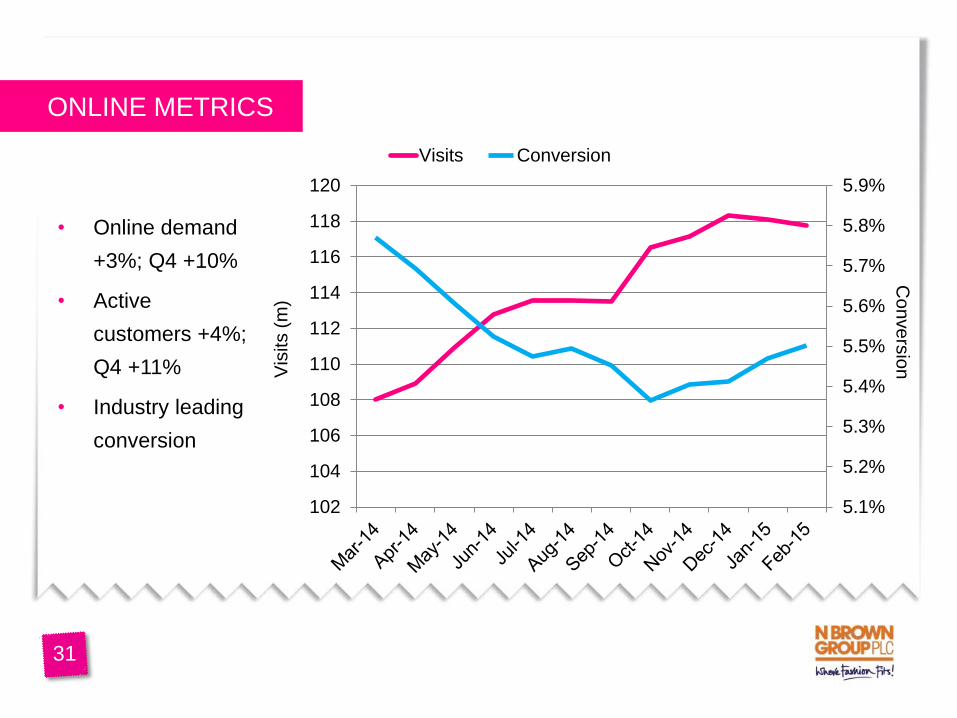
ONLINE METRICS
• Online demand
+3%; Q4 +10%
• Active
customers +4%;
Q4 +11%
• Industry leading
conversion
5.1%
5.2%
5.3%
5.4%
5.5%
5.6%
5.7%
5.8%
5.9%
102
104
106
108
110
112
114
116
118
120
Visits Conversion
Vis
its (
m)
Co
nve
rsio
n

AGENDA
FINANCIALS & GUIDANCE
STRATEGY UPDATE
IMPROVING OUR RETAIL BASICS
FIT 4 THE FUTURE
INTERNATIONAL & STORES UPDATE
SUMMARY
Q&A
FINANCIAL SERVICES
32
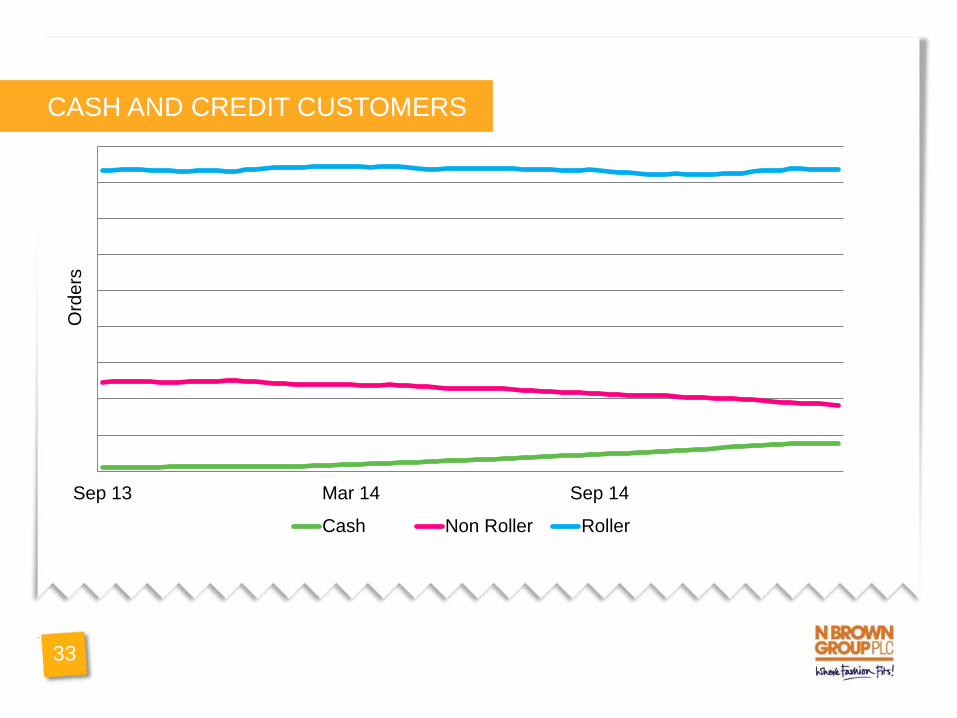
CASH AND CREDIT CUSTOMERS
33
Sep 13 Mar 14 Sep 14
Ord
ers
Cash Non Roller Roller
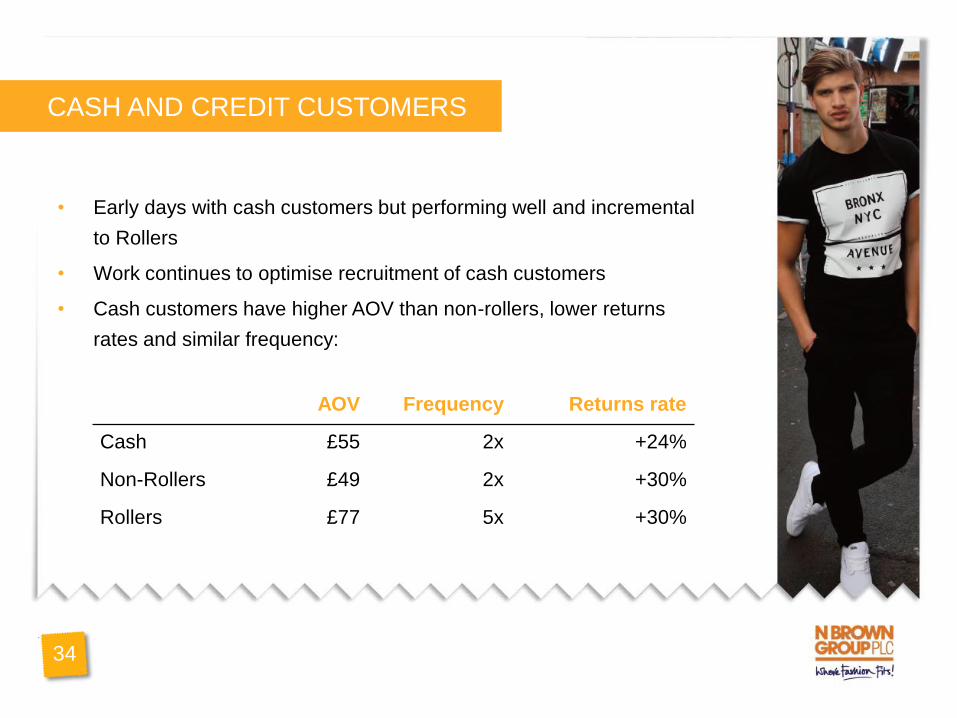
CASH AND CREDIT CUSTOMERS
• Early days with cash customers but performing well and incremental
to Rollers
• Work continues to optimise recruitment of cash customers
• Cash customers have higher AOV than non-rollers, lower returns
rates and similar frequency:
AOV Frequency Returns rate
Cash £55 2x +24%
Non-Rollers £49 2x +30%
Rollers £77 5x +30%
34
FUTURE PLANS
• Quality of debtor book
• Customer loyalty schemes
• Modernisation – Fit 4 the Future a key enabler
• Preparing for full FCA authorisation
35
AGENDA
FINANCIALS & GUIDANCE
STRATEGY UPDATE
IMPROVING OUR RETAIL BASICS
FINANCIAL SERVICES
INTERNATIONAL & STORES UPDATE
SUMMARY
Q&A
FIT 4 THE FUTURE
36
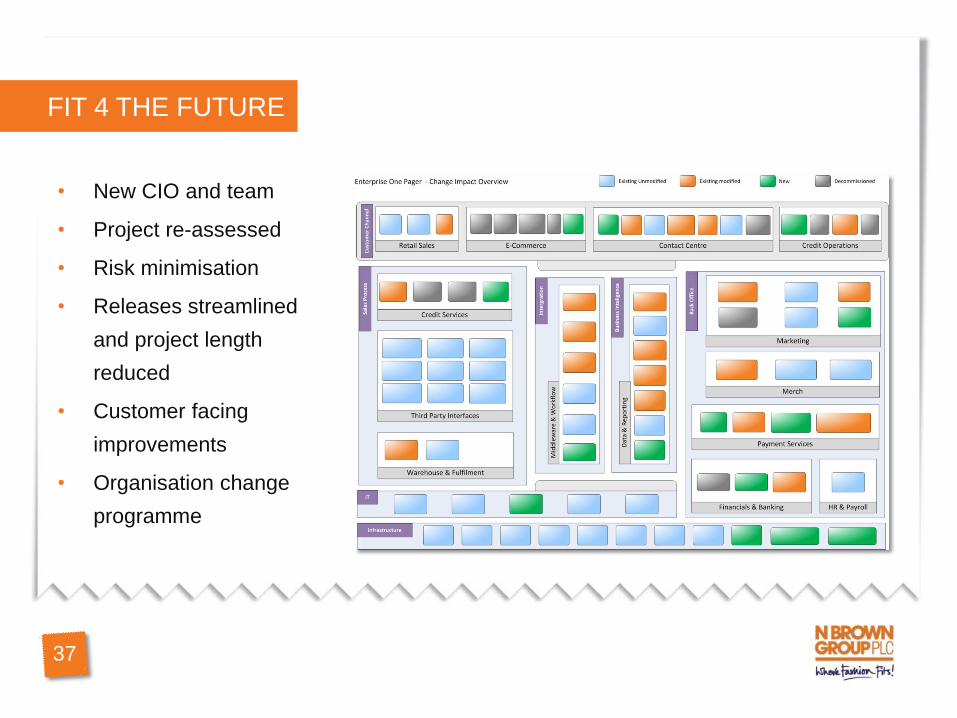
FIT 4 THE FUTURE
• New CIO and team
• Project re-assessed
• Risk minimisation
• Releases streamlined
and project length
reduced
• Customer facing
improvements
• Organisation change
programme
37
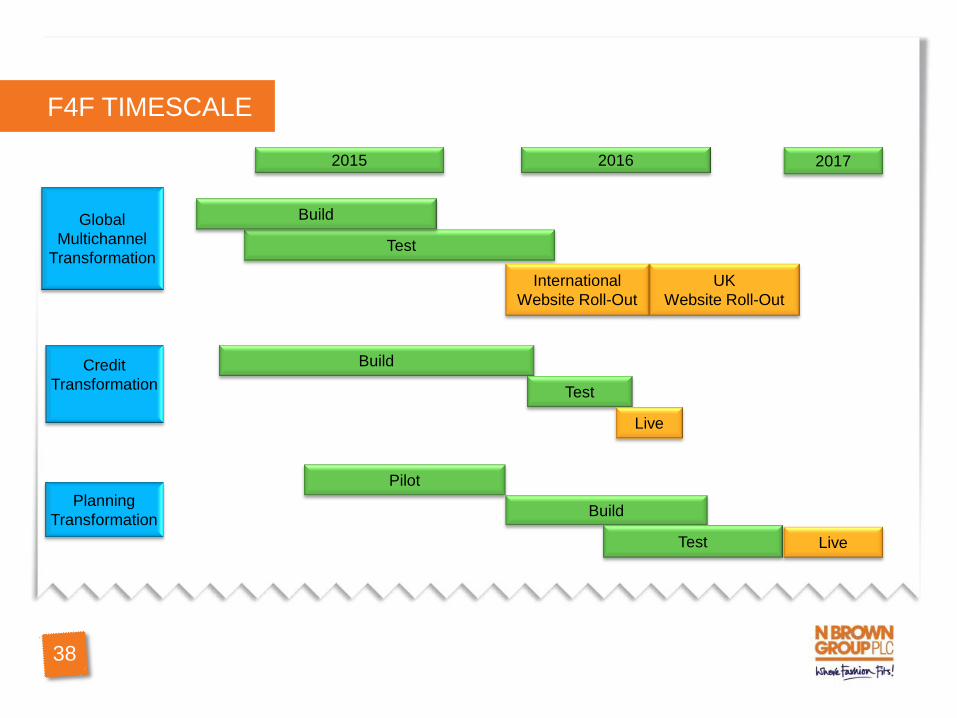
F4F TIMESCALE
38
Test
International
Website Roll-Out
Planning
Transformation Build
Test
UK
Website Roll-Out
Global
Multichannel
Transformation
Credit
Transformation
Build
Test
Live
Build
2016 2015 2017
Pilot
Live
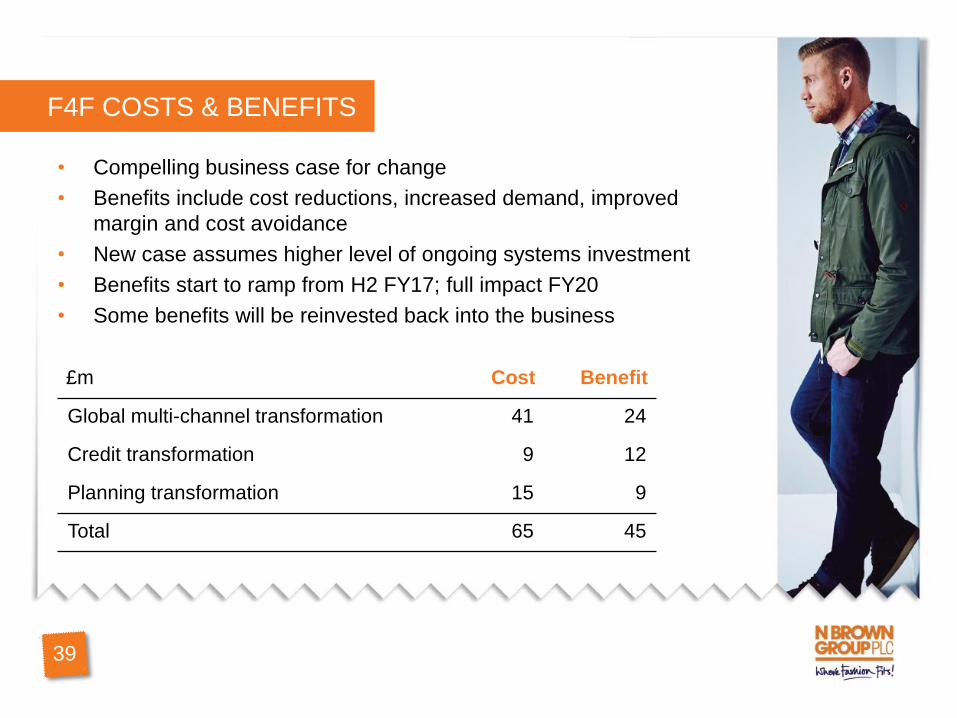
F4F COSTS & BENEFITS
• Compelling business case for change
• Benefits include cost reductions, increased demand, improved
margin and cost avoidance
• New case assumes higher level of ongoing systems investment
• Benefits start to ramp from H2 FY17; full impact FY20
• Some benefits will be reinvested back into the business
39
£m Cost Benefit
Global multi-channel transformation 41 24
Credit transformation 9 12
Planning transformation 15 9
Total 65 45
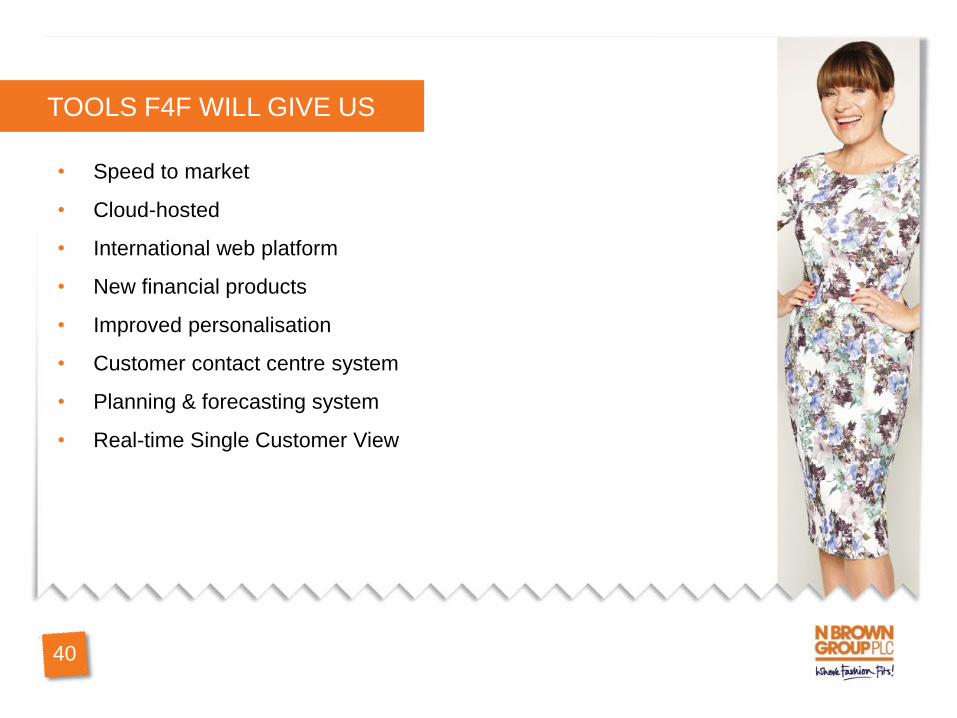
TOOLS F4F WILL GIVE US
• Speed to market
• Cloud-hosted
• International web platform
• New financial products
• Improved personalisation
• Customer contact centre system
• Planning & forecasting system
• Real-time Single Customer View
40
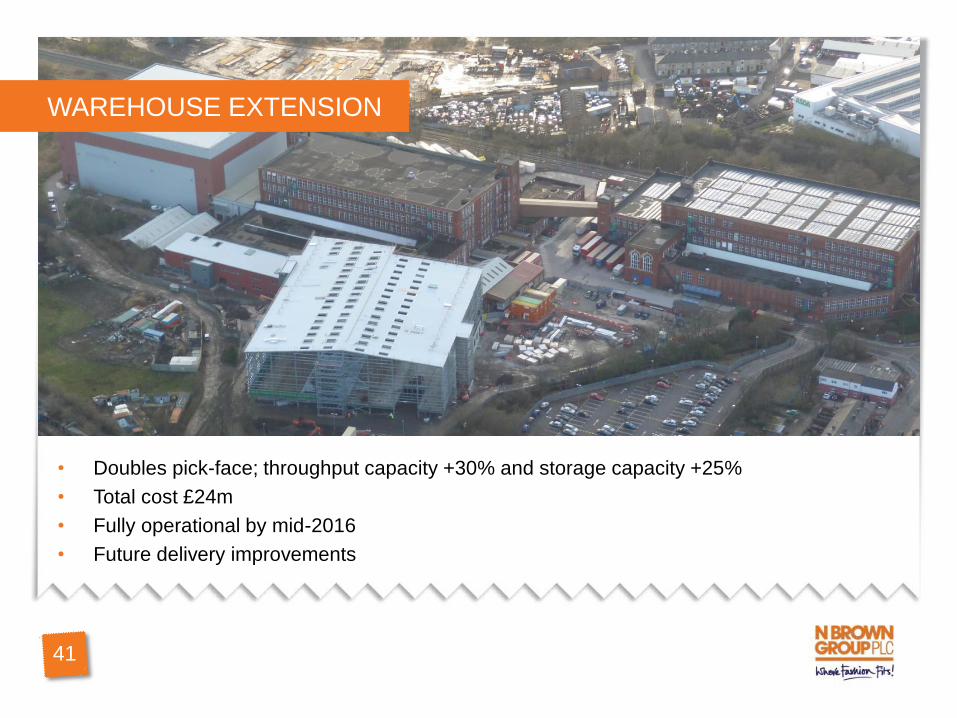
• Doubles pick-face; throughput capacity +30% and storage capacity +25%
• Total cost £24m
• Fully operational by mid-2016
• Future delivery improvements
WAREHOUSE EXTENSION
41
AGENDA
FINANCIALS & GUIDANCE
STRATEGY UPDATE
IMPROVING OUR RETAIL BASICS
FINANCIAL SERVICES
FIT 4 THE FUTURE
SUMMARY
Q&A
INTERNATIONAL & STORES UPDATE
42
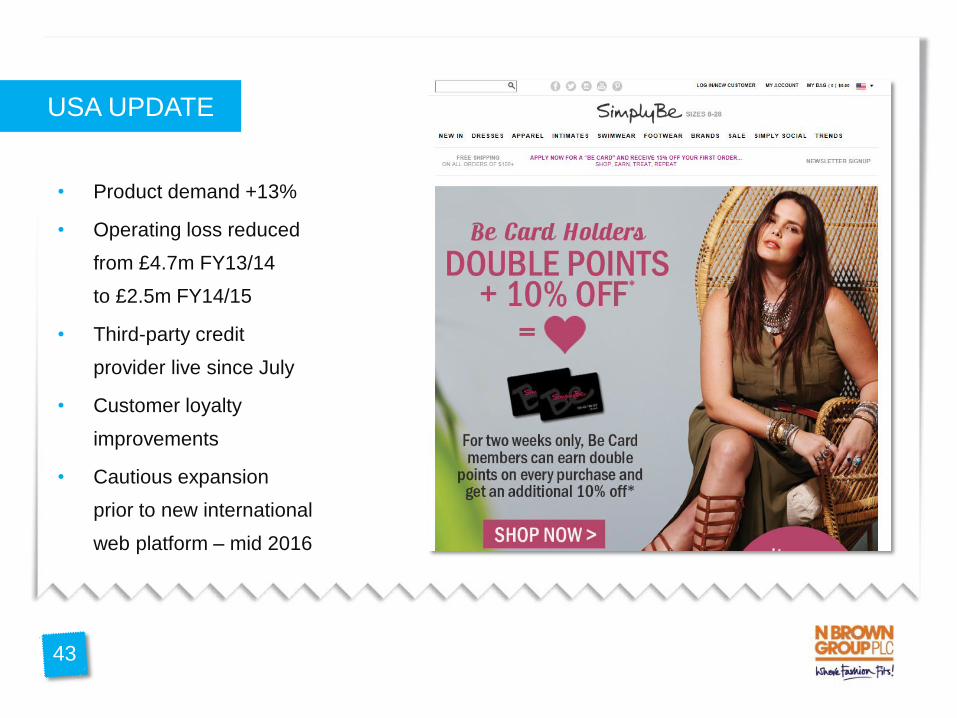
USA UPDATE
• Product demand +13%
• Operating loss reduced
from £4.7m FY13/14
to £2.5m FY14/15
• Third-party credit
provider live since July
• Customer loyalty
improvements
• Cautious expansion
prior to new international
web platform – mid 2016
43
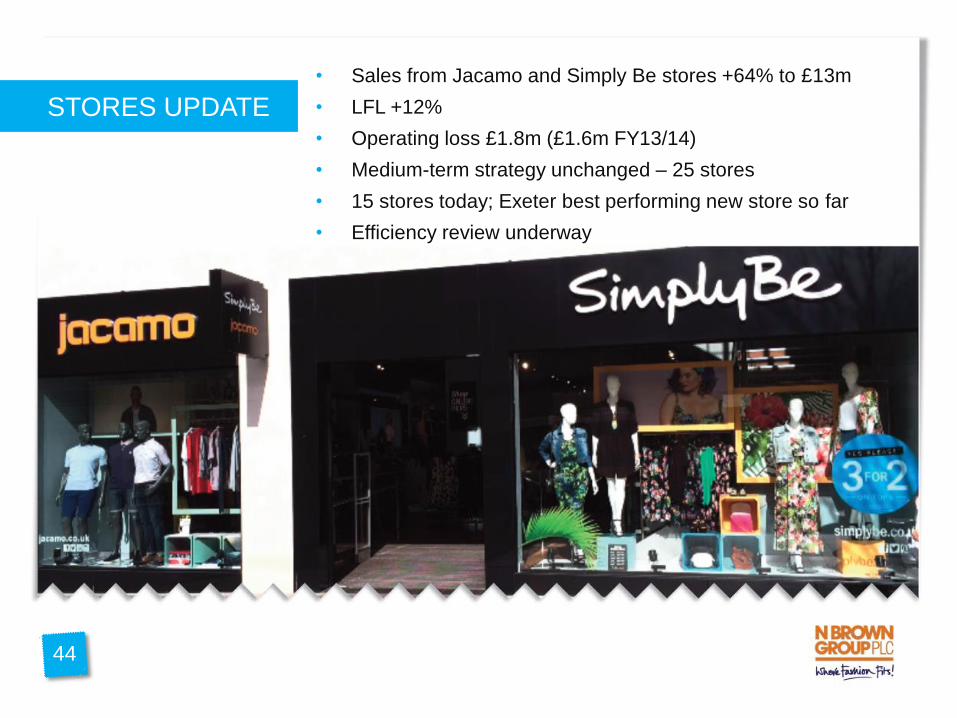
• Sales from Jacamo and Simply Be stores +64% to £13m
• LFL +12%
• Operating loss £1.8m (£1.6m FY13/14)
• Medium-term strategy unchanged – 25 stores
• 15 stores today; Exeter best performing new store so far
• Efficiency review underway
STORES UPDATE
44

AGENDA
FINANCIALS & GUIDANCE
STRATEGY UPDATE
IMPROVING OUR RETAIL BASICS
FINANCIAL SERVICES
FIT 4 THE FUTURE
INTERNATIONAL & STORES UPDATE
Q&A
SUMMARY
45
CONFIDENT IN THE FUTURE
• Driving strategy forward
• Encouraged by KPIs
• Disappointed by profit performance this year
• Improving the sustainability of future profit growth
• FY14/15 year of heavy lifting
• FY15/16 year of execution
• FY16/17 and onwards – realising our full potential
46

AGENDA
FINANCIALS & GUIDANCE
STRATEGY UPDATE
IMPROVING OUR RETAIL BASICS
FINANCIAL SERVICES
FIT 4 THE FUTURE
INTERNATIONAL & STORES UPDATE
Q&A
SUMMARY
47
APPENDIX
• Revenue by category
• Operating cash flow
• Group cash flow
• Exceptional items
• New reporting schedule
• Investor relations contacts
48
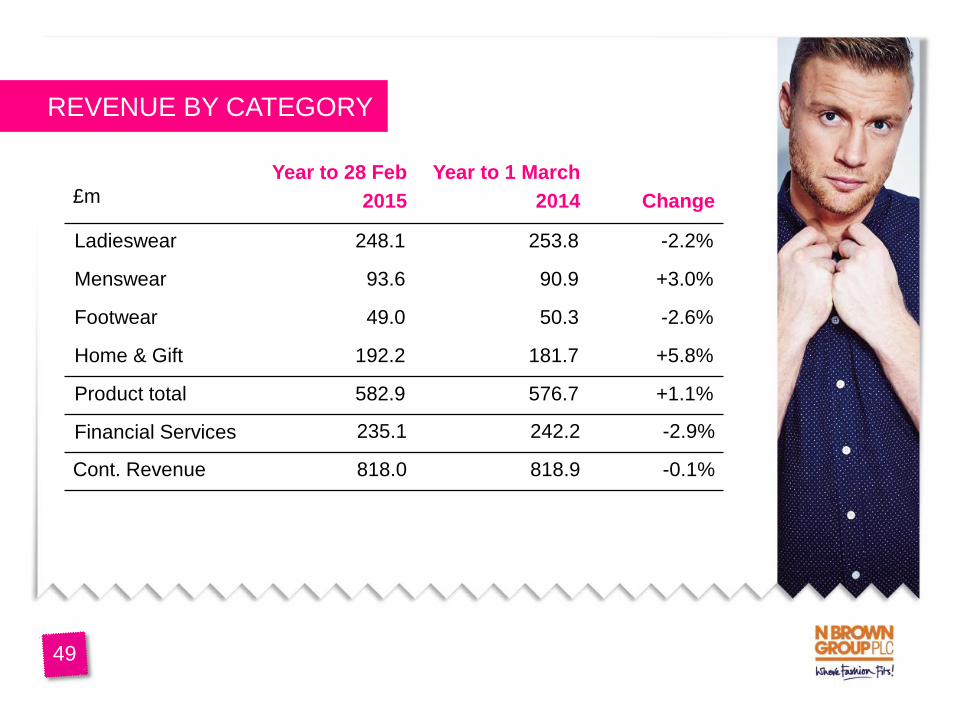
REVENUE BY CATEGORY
49
£m
Year to 28 Feb
2015
Year to 1 March
2014
Change
Ladieswear 248.1 253.8 -2.2%
Menswear 93.6 90.9 +3.0%
Footwear 49.0 50.3 -2.6%
Home & Gift 192.2 181.7 +5.8%
Product total 582.9 576.7 +1.1%
Financial Services 235.1 242.2 -2.9%
Cont. Revenue 818.0 818.9 -0.1%
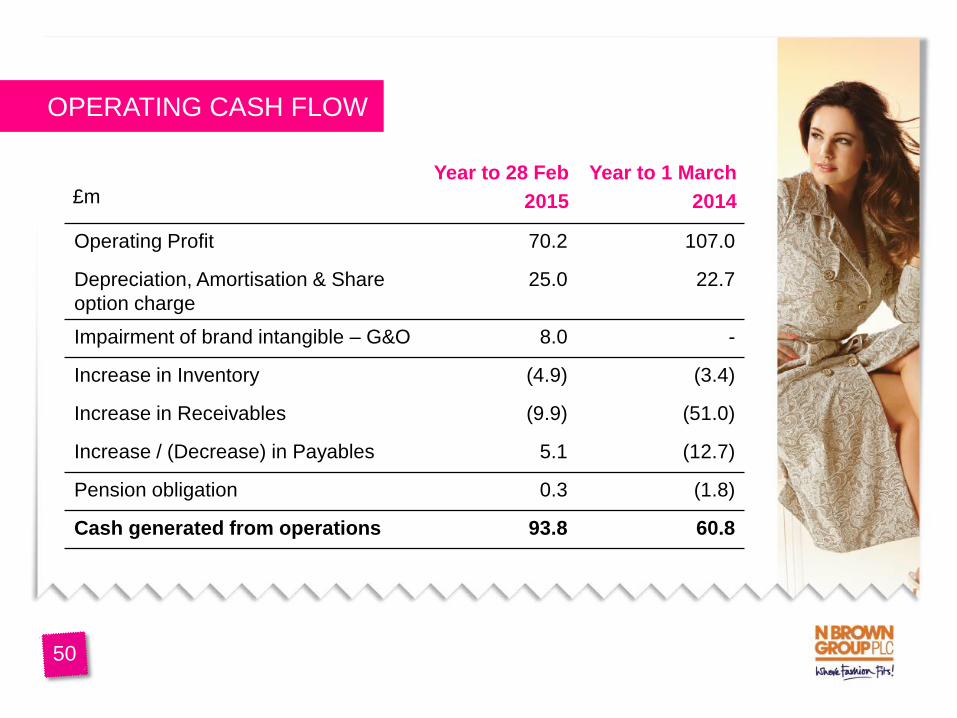
OPERATING CASH FLOW
50
£m
Year to 28 Feb
2015
Year to 1 March
2014
Operating Profit 70.2 107.0
Depreciation, Amortisation & Share
option charge
25.0 22.7
Impairment of brand intangible – G&O 8.0 -
Increase in Inventory (4.9) (3.4)
Increase in Receivables (9.9) (51.0)
Increase / (Decrease) in Payables 5.1 (12.7)
Pension obligation 0.3 (1.8)
Cash generated from operations 93.8 60.8
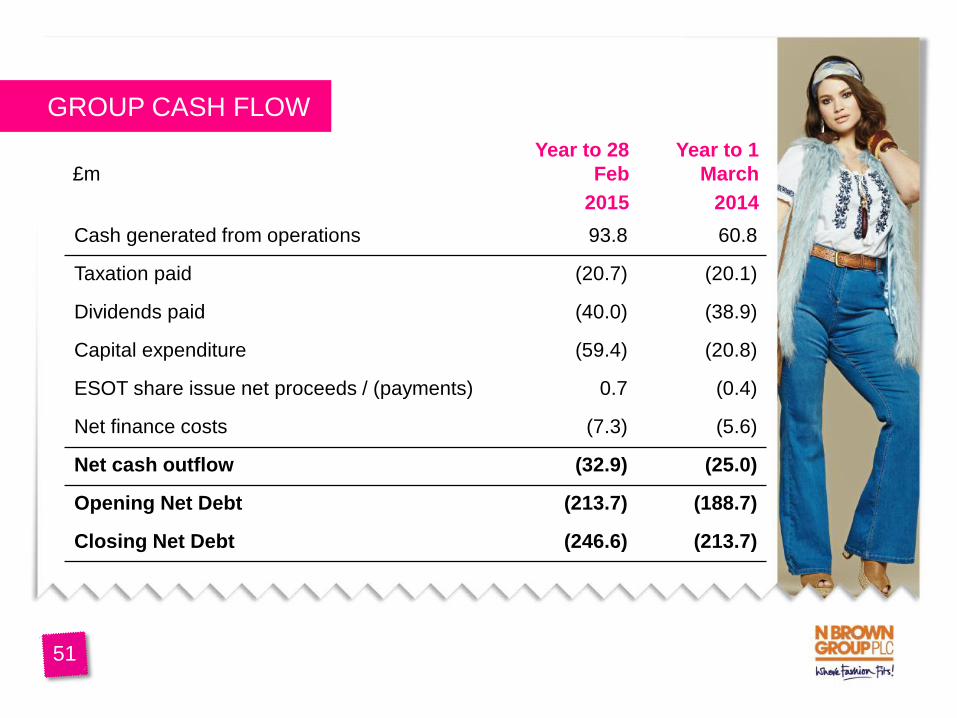
GROUP CASH FLOW
51
£m
Year to 28
Feb
2015
Year to 1
March
2014
Cash generated from operations 93.8 60.8
Taxation paid (20.7) (20.1)
Dividends paid (40.0) (38.9)
Capital expenditure (59.4) (20.8)
ESOT share issue net proceeds / (payments) 0.7 (0.4)
Net finance costs (7.3) (5.6)
Net cash outflow (32.9) (25.0)
Opening Net Debt (213.7) (188.7)
Closing Net Debt (246.6) (213.7)
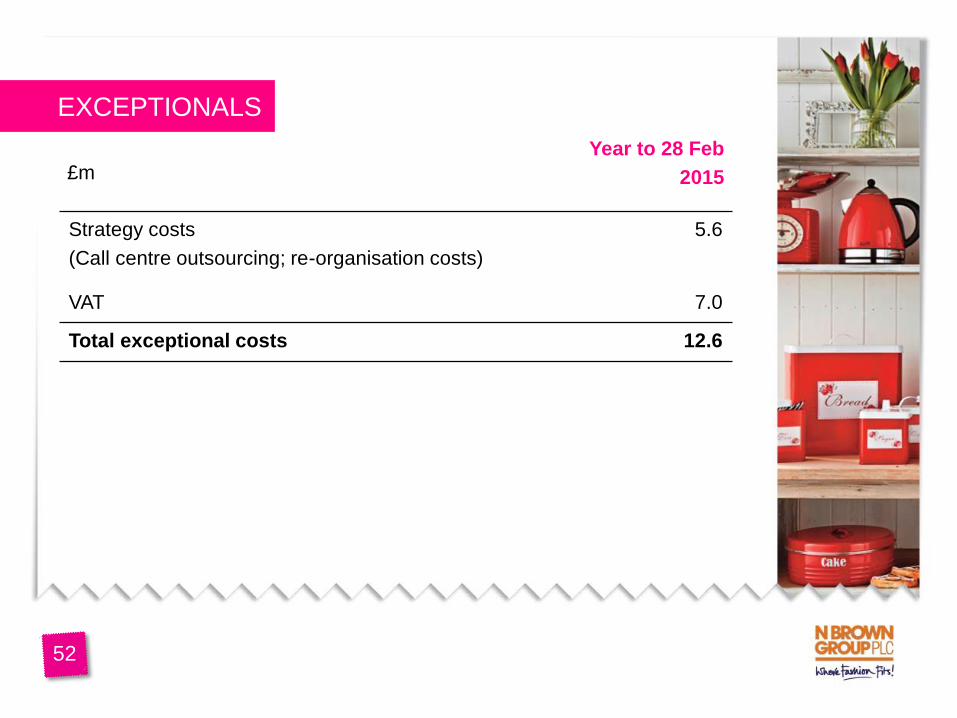
EXCEPTIONALS
£m
Year to 28 Feb
2015
Strategy costs
(Call centre outsourcing; re-organisation costs)
5.6
VAT 7.0
Total exceptional costs 12.6
52
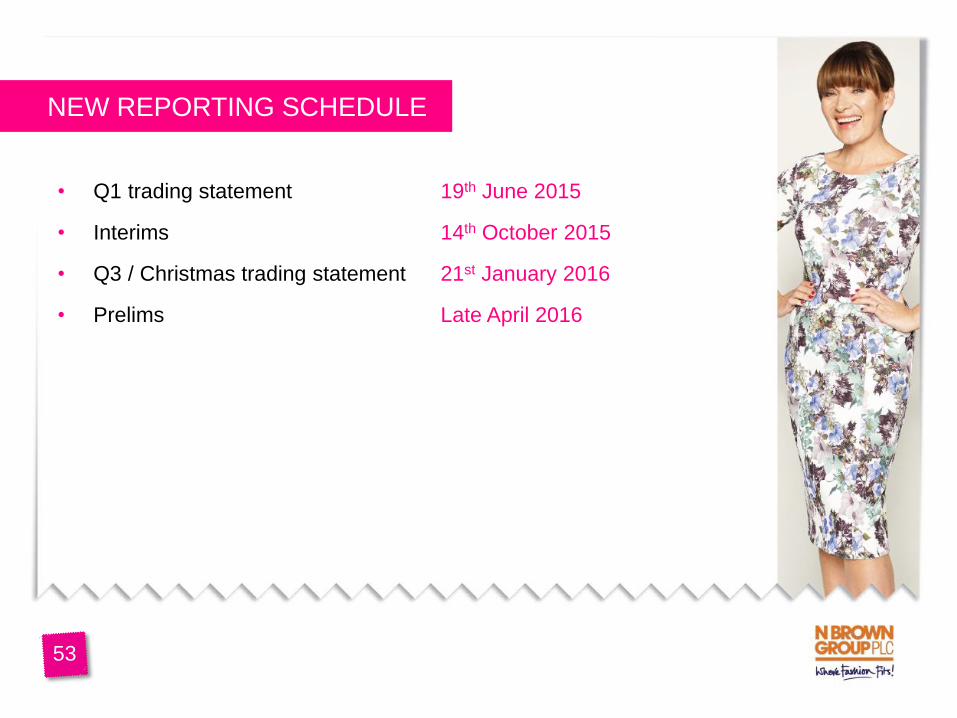
NEW REPORTING SCHEDULE
53
• Q1 trading statement 19th June 2015
• Interims 14th October 2015
• Q3 / Christmas trading statement 21st January 2016
• Prelims Late April 2016

IR CONTACT DETAILS
Bethany Hocking
Director of Investor Relations
Email: [email protected]
Tel: 0161 238 1845
Mobile: 07887 536 153
54


