arXiv:0707.1004v1 [physics.chem-ph] 6 Jul 2007 Full Dimensional (15D) Quantum-Dynamical Simulation of the Protonated Water-Dimer II: Infrared Spectrum and Vibrational Dynamics Oriol Vendrell, 1, ∗ Fabien Gatti, 2, † and Hans-Dieter Meyer 1, ‡ 1 Theoretische Chemie, Physikalisch-Chemisches Institut, Universit¨ at Heidelberg, INF 229, D-69120 Heidelberg, Germany 2 LDSMS (UMR 536-CNRS), CC 014, Universit´ e de Montpellier II, F-34095 Montpellier, Cedex 05, France (Dated: November 15, 2018) Abstract The infrared absorption spectrum of the protonated water dimer (H 5 O + 2 ) is simulated in full dimensionality (15D) in the spectral range 0–4000 cm −1 . The calculations are performed using the Multiconfiguration Time-Dependent Hartree (MCTDH) method for propagation of wavepackets. All the fundamentals and several overtones of the vibrational motion are computed. The spectrum of H 5 O + 2 is shaped to a large extent by couplings of the proton-transfer motion to large amplitude fluxional motions of the water molecules, water bending and water-water stretch motions. These couplings are identified and discussed, and the corresponding spectral lines assigned. The large couplings featured by H 5 O + 2 do not hinder, however, to describe the coupled vibra- tional motion by well defined simple types of vibration (stretching, bending, etc.) based on well defined modes of vibration, in terms of which the spectral lines are assigned. Comparison of our results to recent experiments and calculations on the system is given. The reported MCTDH IR-spectrum is in very good agreement to the recently measured spectrum by Hammer et al. [JCP, 122, 244301, (2005)]. * e-mail: [email protected]† e-mail: [email protected]‡ e-mail: [email protected]1
Transcript
arX
iv:0
707.
1004
v1 [
phys
ics.
chem
-ph]
6 J
ul 2
007
Full Dimensional (15D) Quantum-Dynamical Simulation of the
Protonated Water-Dimer II: Infrared Spectrum and Vibrational
Dynamics
Oriol Vendrell,1, ∗ Fabien Gatti,2, † and Hans-Dieter Meyer1, ‡
where |Ψµ,0〉 is the dipole-operated initial state, i.e., |Ψµ,0〉 ≡ µ |Ψ0〉, and E0 is the ground-
state energy. The IR spectrum may be equivalently computed in the time-dependent picture.
4
From Eq. (1) follows
I(E) =E
6 c ǫ0 ~2
∫ ∞
−∞
ei(E+E0−En)t/~〈Ψµ,0|Ψn〉 〈Ψn|Ψµ,0〉 dt (2a)
=E
6 c ǫ0 ~2
∫ ∞
−∞
ei(E+E0)t/~〈Ψµ,0|e−i H t/~|Ψµ,0〉 dt (2b)
=E
3 c ǫ0 ~2Re
∫ ∞
0
ei(E+E0)t/~aµ(t) dt, (2c)
where the autocorrelation function of the dipole-operated initial state, aµ(t), has been de-
fined in Eq. (2c) implicitly. The real part, Re, appears because aµ(−t) = a∗µ(t) holds.
Eq. (2c) tells that the IR spectrum is obtained in the time-dependent picture by Fourier
transformation (FT) of the autocorrelation of the dipole-operated initial state. Whether a
time-dependent or a time-independent approach is more efficient depends on the problem
at hand. A time-independent approach relies on the accurate computation of the eigen-
states of the Hamiltonian, |Ψn〉, which may be accomplished by iterative-diagonalization
methods of the Hamiltonian matrix expressed in some basis, obtaining all the eigenstates
up to some desired energy, and then using Eq. (1) to compute the IR spectrum. The
method to obtain eigenstates of the Hamiltonian within the MCTDH approach is called
improved relaxation [21] and consists essentially on a time-independent multiconfiguration
self consistent field (MCSCF) computation of an eigenstate, in which both the expansion
coefficients of the wavefunction and the basis of SPFs (see Eq. (1) in Paper I) are optimized
to self-consistency. The optimal basis of SPFs varies from state to state, which difficults the
application of iterative diagonalization procedures to the computation of the whole spec-
trum. To obtain each excited state with improved relaxation, a new computation is needed
in which the basis is optimized for that specific state. A comprehensive calculation of an
IR spectrum by improved relaxation has been recently achieved for 6D problems, namely
H2CS [21], and HONO [22]. The lowest 184 states of A′ symmetry of the latter molecule
were calculated. The improved relaxation approach, however, is not practicable with the
current computational capabilities to obtain the whole spectrum for a molecule of the size
of H5O+2 . The iterative process of improved relaxation converges only if the space spanned
by the configurations allows to separate the desired state from neighboring ones. When the
density of states increases, the number of SPFs necessary to ensure convergence increases as
well. This makes it impossible to compute states higher in energy. For the present problem
we could compute states up to about 600 cm−1. However, not only the excitation energy
5
but also state coupling determines the feasibility of improved relaxation. For example, we
could compute the second excited state of the water-water stretch by improved relaxation,
despite its excitation energy is 1069 cm−1.
Propagation of a wavepacket by MCTDH, on the other hand, is always feasible. A small
set of SPFs makes a propagation less accurate, but not impossible. Therefore, the full IR
spectrum is efficiently calculated in the time-dependent representation. The resolution at
which different peaks of the spectrum are resolved is given by the Fourier Transform (FT)
of the damping function g(t) [17] with which the autocorrelation aµ(t) is to be multiplied
when performing the integral (2c) to minimize artifacts due to the Gibbs phenomenon. We
choose g(t) = cos(πt/2T ) and set g(t) = 0 for t > T , where T denotes the length of the
autocorrelation function. Since we make use of the T/2 trick, aµ(t) = 〈Ψ∗µ0(t/2)|Ψµ0(t/2)〉,
which holds when the initial wavepacket is real and the Hamiltonian symmetric, T is twice
the propagation time. The FT of g(t) is known [17] and its full width at half maximum
(FWHM) is
∆E = 27, 300 cm−1 fs /T. (3)
To clearly identify two peaks 100 cm−1 apart, i.e., the doublet structure in the H5O+2 spec-
trum, one needs a resolution of ∆E = 67 cm−1 and hence a propagation time of T/2 = 200
fs. Time propagations have been carried out over 500 fs providing a resolution of 30 cm−1.
Often we make use of the filter diagonalization (FD) technique [23, 24, 25, 26] to analyze
the autocorrelation function of the propagated wavepackets, which yields eigenenergies and
spectral intensities. FD is able to provide accurate eigenenergies from shorter time propaga-
tions than the ones needed to resolve the IR spectrum. However, FD calculations are more
sensitive to errors in the autocorrelation function compared to the FT method. Therefore
these calculations are targeted to obtain accurate energies of a single state or a small group
of related states from a propagation of an appropriately prepared initial wavepacket.
The dipole operator is a vector and the operator µ appearing in Eqs. (1,2) is to be
interpreted as the scalar product ~e· ~µ where ~e denotes the polarization vector of the absorbed
light. As the molecule is assumed to be randomly oriented we average over all orientations
and obtain
I(E) =1
3(Iz(E) + 2Ix(E)), (4)
where Iz and Ix denote the intensities obtained with the x− and z−component of the dipole
6
operator, respectively. The factor 2 appears because aµx = aµy holds. The intensity Iy is
hence not explicitly computed.
B. Eigenstates of the system and spectrum assignment
Even if the computation of the IR spectrum in the time-dependent representation is
feasible, a means of assigning the different lines to specific motions of the system is still
required.
Wavefunctions of excited states converged by improved relaxation [21] contain all the
possible information of that specific state. The intensity of a given excited state |Ψn〉 is
readily obtained by computing the dipole moment |〈Ψn|µ|Ψ0〉|2. But even if an excited
state of interest |Ψn〉 has been obtained it is difficult to directly inspect these mathematical
objects due to their high dimensionality. Moreover, for the higher excited states we do not
have |Ψn〉 at our disposal but only an autocorrelation function providing spectral lines. In
both cases we characterize the eigenstates by their overlaps with carefully chosen test states,
i.e., by the numbers |〈Φtest|Ψn〉|2. The following procedures are used:
1. Test states |Φtest〉 are generated
a) by applying some operator O to a previously converged eigenfunction,
|Φtest〉 = NO|Ψn〉, (5)
where N is a normalization constant, e.g., Nz|Ψ0〉 generates a test state which
in essence differs from the ground state |Ψ0〉 by a one quantum excitation in the
proton-transfer coordinate z.
b) by forming Hartree products, where the SPFs are obtained through diagonal-
ization of mode-Hamiltonians hj. The hj are low-dimensional Hamiltonians and
each hj operates on the space of a group of coordinates (see Paper I for details
on coordinates grouping into modes). Rather than using single Hartree prod-
ucts one may use linear combinations of products in order to satisfy a symmetry
constraint.
2. The overlaps |〈Φtest|Ψn〉|2 are then computed by
7
a) by direct evaluation of the scalar product if |Ψn〉 is available.
b) by Fourier transform of the autocorrelation function
a(t) = 〈Φtest| exp(−i H t)|Φtest〉. The overlap is obtained via the formula
[21]:
|〈Φtest|Ψn〉|2 =π
2TRe
∫ T
0
eiEnta(t) cos(πt
2T)dt (6)
c) by Fourier transformation of the cross-correlation function
c(t) = 〈Φtest| exp(−i H t)|Ψµ,0〉. The absolute square of the FT of c(t) at
energy En must then be divided by the spectral intensities of |Ψµ,0〉 to obtain
|〈Φtest|Ψn〉|2. This is the fastest method because it does not require additional
propagations. However, it is also the least accurate procedure. We used this
method several times to obtain a quick overview, but it was not used to generate
data reported in this article.
Excitations related to test states will be denoted (n1 q1, n2 q2 . . .), where n1 represents the
quanta of excitation on coordinate q1 (in a separable limit). A test state will be denoted
by |Φn1 q1,n2 q2...〉 where the terms with nj = 0 are omitted. In case a test state has been
generated such that it cannot be represented by this simple notation, it will be defined more
explicitly.
III. RESULTS AND DISCUSSION
FIGURE 1 AROUND HERE
FIGURE 2 AROUND HERE
The MCTDH spectrum in the full range 0–4000 cm−1 is depicted in Fig. 1 and compared
to experiment in Fig. 2. The dipole-moment operated ground state µ|Ψ0〉 was propagated
for 500 fs, yielding an autocorrelation of 1000 fs. The spectrum was calculated according to
Eq. (2) and the FWHM resolution of the spectrum is, according to Eq. (3), about 30 cm−1.
In the following sections the different parts of the spectrum and the peak assignments are
discussed. Table I collects the energies of several states of H5O+2 obtained with MCTDH,
MULTIMODE [5] and experimental values on the H5O+2 ·Ne system [5].
TABLE I AROUND HERE
8
The symmetry labels of the discussed vibrational states are given within the G16 symmetry
group, which arises due to the feasibility (in the sense of Longet-Higgins [27]) of the wagging
and internal rotation motions (see Paper I). A character table for the G16 symmetry group
is found in Table A-25 in Ref. [28]. If the internal rotation motion around α is assumed
to be unfeasible, the symmetry analysis can be performed using the D2d point group. The
permutation-inversion group G16 contains the D2d point group as a subgroup, but allows
additionally to permute the two hydrogens of one of the water monomers [28, 29]. The G16
labels reduce to the D2d ones by ignoring (−/+) signs in the labeling provided by G16. The
use of G16 becomes important when labeling the states related to the internal rotational
motion. The z component of the dipole moment excites vibrational states of B+2 symmetry,
while the perpendicular components those of E+ symmetry.
A. Low-energy region
The low energy region of the spectrum, below 900 cm−1, has not yet been accessed
experimentally. The reported spectrum in Fig. 1 shows a strong absorption around 100
cm−1 followed by two lines of fewer intensity at about 250 and 500 cm−1, respectively.
The three absorptions arise from excitation of the perpendicular component of the field.
Modes oscillating at these low frequencies are strongly anharmonic: already in the ground
vibrational state, the system interconverts between equivalent minima through low barriers
along the wagging (γA, γB) and torsional (α) coordinates [15].
FIGURE 3 AROUND HERE
The first three excited states associated to the internal rotation (1α, 2α, 3α) have been
computed with improved relaxation and their probability-density along the internal rotation
α is depicted in Fig. 3. The energy of the (4α) state has been computed by FD. They
have excitation energies of 1, 103, 126 and 210 cm−1, and symmetries A−1 , B
+1 , B
−1 and A+
1 ,
respectively. Here (1α) is the splitting state related to the torsional barrier along α. The
excitation energy of 1 cm−1 is hence the tunneling split. In fact, the symmetry label of the
rotationally-split state of a (+) state is obtained by multiplication with A−1 .
FIGURE 4 AROUND HERE
9
FIGURE 5 AROUND HERE
Fig. 4 depicts the probability-density projection on the wagging coordinates for the ground
vibrational state, which is of A+1 symmetry, as well as for one of the two fundamental states
(w1a,w1b) of the wagging modes. The fundamental wagging modes are centered at 106 cm−1
and belong to the E− irreducible representation of the G16 group. Therefore, they are
doubly degenerate, dark states. The band at about 100 cm−1 (see Fig. 1 center) due to
the perpendicular component of the dipole corresponds to the states centered at 108 cm−1,
which belong to the E+ irreducible representation. Such states are combined states of the
fundamental wagging motion and the (1α) state of the internal rotation, of A−1 symmetry.
Thus, both pairs of degenerate wagging states, centered at 106 and 108 cm−1 are split
states with respect to the internal rotational barrier around α. In a similar way the band
at about 250 cm−1 corresponds to the combination of the fundamental wagging motion
and the (3α) internal-rotation state, which belongs to the B−1 irreducible representation.
This combination results in two degenerate states of E+ symmetry. The energies of the
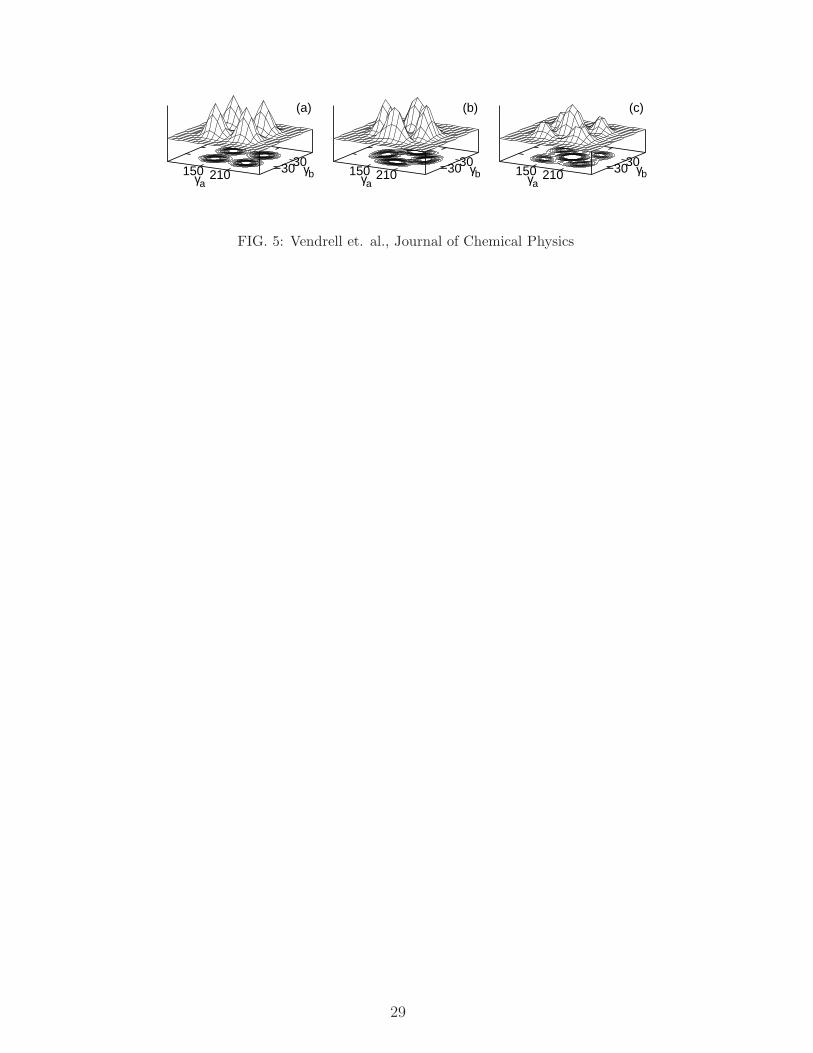
next three wagging-mode states (w2,w3,w4) are, respectively, 232, 374 and 422 cm−1 and
they are shown in Figs. 5a, 5b and 5c, respectively. These three states correspond to
two quanta of excitation in the wagging motions and they can be represented by kets |11〉,(|20〉 − |02〉)/
√2 and (|20〉+ |02〉)/
√2, respectively, where the |ab〉 notation signifies the
quanta of excitation in the wagging motions of monomer A and B. These states have
symmetries B+1 , B
+2 and A+
1 , respectively. In the harmonic limit these three states would be
degenerate. The next 2 states, w4a,w4b, which are not computed, are degenerate again and
correspond to kets |31〉 and |13〉. State w2 has an energy that nearly doubles the energy of
the w1x states, since it roughly corresponds to one quantum in state w1a and one quantum
in state w1b. The strong anharmonicity of the wagging motions as well as the coupling
between right and left wagging can be further appreciated in the progression of w2, w3 and
w4 vibrational-state energies. We emphasize again that these three states are degenerate in
the harmonic limit. In addition, the harmonic-analysis energies of the two lowest wagging-
fundamentals w1a and w1b are around 300 cm−1 larger than the MCTDH result and do
not account for their degeneracy, since harmonic normal-modes are constructed taking as
a reference the C2 absolute minimum. However, as discussed above and in Paper I, H5O+2
interconverts through low potential barriers between several equivalent minima and has G16
10
symmetry. The state w3 has four probability-density maxima along the 2D space spanned
by γA and γB. They correspond to geometries in which one of the water molecules adopts
a trigonal-planar geometry (H3O+ character) and the other adopts a pyramidal geometry
(H2O character). This state transforms according to the B+2 symmetry representation, which
is also the symmetry of the proton-transfer fundamental. State w3 will play a major role
due to its strong coupling to the proton-transfer mode.
The first two fundamentals of the symmetric stretch ([O-O‖], R coordinate) have energies
of 550 and 1069 cm−1 respectively, and have A+1 symmetry, while the rocking fundamentals,
which are degenerate E+ states, have an energy of 481 cm−1 and are responsible of the band
appearing slightly below 500 cm−1 in the MCTDH spectrum. In contrast to the wagging
motion, the rocking motion is fairly harmonic and exhibits only a weak coupling between
left and right rocking. The energies of the two-quanta rocking states r2, r3 and r4 – defined
in a similar way to w2, w3 and w4 but with a reverse ordering of the zero-order ket-states –
are therefore almost degenerate. These energies read 915, 930 and 943 cm−1.
B. Doublet at 1000 cm−1
The doublet centered at 1000 cm−1 is the most characteristic feature of the IR spectrum
of H5O+2 . It is depicted in Fig. 2 (top). The highest energy line has been measured to be at
1047 cm−1 while the low energy component appears at 928 cm−1 [5]. There is accumulated
evidence in the literature that the absorption of the proton-transfer fundamental occurs in
the region of 1000 cm−1 [5, 10, 11, 12, 13]. Specifically, the band at 1047 cm−1 in Ref. [5] was
assigned to the first excitation of the central proton motion [5] based on MULTIMODE [30]
calculations. This band is the most intense band of the spectrum since the central proton
motion along the z axis induces a large change in the dipole-moment of the cation. The low-
energy component has been recently assigned by us [14]. The doublet is seen to arise from
coupling between the proton-transfer motion [O-H-O‖], the low frequency water-wagging
modes and the water-water stretching [O-O‖] motion. In order to obtain a fundamental
understanding of the low-energy (|Ψld〉) and high energy (|Ψh
d〉) components of the doublet,
test states were constructed by operating with z on the ground state: |Φ1z〉 = z|Ψ0〉N ,
where N is a normalization constant, and by operating with (R− R0) on the third excited
wagging state w3: |Φ1R,w3〉 = (R − R0)|Ψw3〉N . Note that |Φ1z〉 is characterized by one
11
quantum of excitation in the proton-transfer coordinate whereas |ΦR1,w3〉 by one quantum
in [O-O‖] and two quanta in the wagging motion. These two test states were propagated
and their auto- and crosscorrelation functions were used for FD analysis, which yielded an
energy of 918 cm−1 for |Ψld〉 and an energy of 1033 cm−1 for |Ψh
d〉. These energies are in good
accordance to the peaks in Fig. 2 which arise from the propagation of |Ψµ,0〉. The spectral
intensities were also obtained by FD analysis. The overlaps of the test states to the states
making the doublet read: |〈Φ1z|Ψld〉|2 = 0.09, |〈Φ1R,w3 |Ψl
d〉|2 = 0.83 and |〈Φ1z|Ψhd〉|2 = 0.46,
|〈Φ1R,w3 |Ψhd〉|2 = 0.10. One should take into account that these numbers depend on the
exact definition of the test states, which is not unique. However, they provide a clear
picture of the nature of the doublet: the low-energy band has the largest contribution from
the combination of the symmetric stretch and the third excited wagging (see Figs. 5b and
3c), whereas the second largest is the proton-transfer motion. For the high-energy band
the importance of these two contributions is reversed. Thus, the doublet may be regarded
as a Fermi-resonance between two zero-order states which are characterized by (1R, w3)
and (1z) excitations, respectively. The reason why the third wagging excitation plays an
important role in the proton-transfer doublet is understood by inspecting Fig. 5b and 6.
The probability density of state w3 has four maxima, each of which corresponds to a planar
conformation of H2O-H+ (H3O+ character) for one of the waters, and a bent conformation
(H2O character) where a lone-pair H2O orbital forms a hydrogen bond with the central
proton. When the proton oscillates between the two waters, the two conformations exchange
their characters accordingly. Thus, the asymmetric wagging mode (w3, 374 cm−1) combines
with the water-water stretch motion (R, 550 cm−1) to reach an energy close to the natural
absorption-frequency of the proton transfer, making these motions coupled. The two states
of the doublet transform according to the B+2 irreducible representation of G16.
One last remark regarding the spectral region of the doublet is the small but noticeable
absorption, which is appreciated both in the experimental and MCTDH spectra between
both peaks (see Fig. 2). This low-intensity absorption is due to the r3 rocking centered at
930 cm−1 and which belongs to the B+2 irreducible representation. In an analogous way to
the w3 wagging state, the r3 rocking state presents four probability-density maxima along
the rocking coordinates, each of which consists of one water aligned with the central axis
while the other is in a bent conformation, and therefore will present some degree of coupling
to the proton-transfer motion. The low absorption of this band, despite its proximity to
12
the natural absorption-frequency of the proton-transfer motion, is qualitatively explained
by the fact that the rocking motions do not change the hybridization properties of the water
monomers and are of a lower amplitude in comparison to the wagging motions. The rocking
motion hence couples more weakly to the proton-transfer motion and induces a smaller
change of the dipole-moment as compared to the wagging motions.
FIGURE 6 AROUND HERE
C. 1000-2000 cm−1 region
The region between the proton-transfer doublet and the doublet centered at 1800 cm−1
features couplings related to the [O-H-O‖] and [O-O‖] motions. The MCTDH spectrum
reported in Fig. 1 presents three main absorptions in this range, located at 1411, 1741
and 1898 cm−1. We call the eigenstates producing these peaks |Ψm1〉, |Ψm2〉 and |Ψm3〉,respectively, where the m stands for middle spectral-range. The experimental H5O
+2 ·Ne
spectrum shows two clearly distinguishable bands at similar positions to the 1741 and 1898
cm−1 absorptions in the MCTDH spectrum, as depicted in Fig. 2. The spectrum of H5O+2 ·Ne
also shows weak but non-negligible absorption in the region immediately above 1400 cm−1
(see Fig. 5 in Ref. 5).
Propagation of test states followed by Fourier analysis of their autocorrelation functions
as described in Sec. II B were used to assign these peaks. The following test states were
generated using eigenfunctions of low dimensional Hamiltonians: |Φ1z,1R〉, |Φ1z,2R〉, |Φbu〉.The test state |Φbu〉 consists on the water-bending with ungerade symmetry, i.e. it is char-
acterized by (|01〉 − |10〉)/√2 where the two entries indicate the quanta of bending motion
of monomer A and B, respectively.
TABLE II AROUND HERE
The overlaps |〈Φ|Ψ〉|2, where |Φ〉 is a test state and |Ψ〉 is an eigenstate, are given in Tab.
II. The analysis contemplates also the states of the doublet at 1000 cm−1, since these states
are coupled to some extent to the ones in the middle spectral-region, e.g., the eigenstate
|Ψhd〉 has a squared overlap of 0.10 with the test state |Φbu〉. All states in Tab. II are of B+
2
symmetry.
13
State |Ψm1〉, absorbing at 1411 cm−1 in the MCTDH spectrum, has a largest contribution
from the |Φ1z,1R〉 test state. The experimental H5O+2 ·Ne spectrum shows a weak absorption
in this region with a lower intensity than the peaks at 1763 and 1878 cm−1, the same trend as
in the MCTDH spectrum. Based on the general good agreement between the experimental
and MCTDH spectra we propose that this weak absorption is mainly a combined excitation
(1z, 1R). A band appearing at 1600 cm−1 in the MM/VCI spectrum [5] was assigned to the
(1z, 1R) transition. However, the experimental spectrum of H5O+2 ·Ne shows no absorption
at 1600 cm−1 [5].
State |Ψm2〉, which is responsible for the absorption at 1741 cm−1 in the MCTDH spec-
trum, has the largest contribution from the |Φbu〉 test state. This peak is then mainly related
to the ungerade water-bending, and has been already assigned in Ref. 5 and a number of
works. This peak can be assigned already from a standard normal-modes analysis, since
its main contribution is from an internal motion of the water monomers, and less from the
relative motions between them. However, it must not come as a surprise that the eigen-
state |Ψm2〉 has a total squared overlap of 0.26 with the test states containing one quanta
of excitation in the proton transfer coordinate, namely |Φ1z〉, |Φ1z,1R〉 and |Φ1z,2R〉. In a
fashion similar to the coupling to the w3 wagging motion, as the proton approaches one
water molecule the equilibrium value of the H-O-H angle shifts to a larger value because this
water molecule acquires more H3O+ character. Conversely, the water molecule at a larger
distance of the central proton acquires H2O character and the angle H-O-H shifts to lower
values.
State |Ψm3〉 is responsible for the absorption at 1898 cm−1 in the MCTDH spectrum,
the lowest intensity feature of the doublet centered at about 1800 cm−1. This state has the
largest overlap with the |Φ1z,2R〉 test-state. Comparison in position and intensity of this
peak to the corresponding one in the experimental H5O+2 ·Ne spectrum suggests that the
latest is mainly related to the (1z, 2R) excitation.
Analysis of the values in Tab. II shows that the eigenstates in the region 1400-1900 cm−1
are characterized by the asymmetric bending and combinations of the proton-transfer fun-
damental and water-water-stretch fundamental and first overtone, with important couplings
between them. Such a coupling was already noted by Bowman and collaborators by analyz-
ing the CI coefficients of their MM/VCI expansion [5]. However, the exact nature of each
band could not be disentangled, and it was concluded that this “is indicative of large cou-
14
plings among various zero-order states in this region”. We show that, despite such couplings
exist and play an important role in shaping the spectrum, the different eigenstates involved
retain each its particular character (note that the largest numbers in Tab. II appear at the
diagonal) and can be assigned to well defined transitions.
D. 2000-4000 cm−1 region
Symmetry analysis of the OH stretchings of the water molecules within the G16 group
predicts four vibrational states with labels A+1 , B
+2 and E+, and the corresponding torsional
splitting A−1 , B
−2 and E− states. The states-labeling simplifies to A1, B2 and E, respectively,
when adopting the D2d point group, in which the internal rotation around α is treated as
unfeasible. The use of the smaller group D2d is reasonable here because all the minus-
states are dark in the linear IR-spectrum. The A1 state corresponds to the symmetrical,
gerade stretch, the B2 state is the symmetrical, ungerade stretch and the E states are
the two asymmetrical stretches of gerade and ungerade type. We recall that the notation
gerade/ungerade is used to indicate +/− linear combinations of the motions of the two
monomers, while symmetric/antisymmetric refers to the OH motions within each monomer.
A symmetry analysis based on the C2 point group, the symmetry group of the absolute
minimum, labels the symmetric stretches as A and B states and the asymmetric stretches
again as A and B states. The harmonic analysis results (see Tab I) yield the symmetric
stretches separated by less than 10 cm−1 and appear at a lower energy than the asymmetric
stretches. The asymmetric stretches, despite not being degenerate, are very close in energy,
separated by less than 1 cm−1. Exact degeneracy of the asymmetric stretches is regained as
a consequence of the feasibility of the wagging-motions, leading to D2d symmetry.
The MCTDH spectrum in the water-stretching region reveals two absorptions. The lowest
energy one is related exclusively to the z component of the dipole, while the largest energy,
most intense band arises exclusively from the perpendicular component (seen Fig. 1). The
lowest energy absorption is related to the symmetric, ungerade stretching, while the highest
energy absorption is related to the degenerate asymmetric stretchings. The energy separa-
tion between symmetric and asymmetric stretchings is known to be of about 80 cm−1 as seen
from different experiments and computations [5, 31], so these peaks can be resolved by a
propagation of about 260 fs. The splitting between symmetric gerade and ungerade stretch-
15
ings is expected to be less than 10 cm−1 according to harmonic results. Thus, a propagation
of about 2100 fs would be needed to resolve these peaks, which is unfeasible in a reasonable
amount of computer time for this system. In order to resolve the symmetric stretchings
two initial test-states were prepared by diagonalization of mode-operators, the symmetric
gerade (|Φsg〉) and symmetric ungerade (|Φsu〉) stretchings. Both test states were propa-
gated and their auto- and crosscorrelation functions analyzed by means of the FD method.
FD analysis yields the symmetric, in-phase stretching at 3607 cm−1, and the symmetric,
out-of-phase counterpart at 3614 cm−1. Propagation of a test state |Φsa〉 of the asymmetric,
doubly degenerate stretchings yields the peak centered at 3689 cm−1. These results are in
excellent agreement to the bands observed in the experimental H5O+2 ·Ne spectrum [5]. Note
that the propagation of |Φsa〉 yields a result in better agreement to experiment than the
peak in Fig. 2 obtained by propagation of the perpendicular component of the dipole. This
is due to the fact that the wavefunction obtained from application of the dipole operator
to the ground state is a coherent superposition of several eigenstates that are propagated
together. The more eigenstates are to be coherently propagated, the more complex is the
dynamics of the wavepacket and the less accurate becomes the propagation for each individ-
ual state. For this reason, the most accurate energies (e.g. values in Table I) are obtained
from either improved relaxation to the desired eigenstate, if possible, or propagation of care-
fully prepared wavepackets (referred to as test states in this work) which have as much
overlap as possible with the eigenstate of interest or a group of them. As a final remark,
the spectrum arising from direct excitation of the z coordinate (propagation of the |Φ1z〉test state) yields all the peaks in the range 800-2000 cm−1 with almost the same relative
intensities than compared to the propagation of µz|Ψ0〉. However, the propagation of |Φ1z〉gives a completely flat spectrum in the region above 3000 cm−1. This indicates that the
excitation of the stretching motions must occur locally on each water molecule and does not
depend on the excitation of the central proton. Moreover, the coupling of the stretching
motions to the central proton is very weak, as indicated by the splitting of only 7 cm−1
between gerade and ungerade symmetric stretchings and indicates that the OH stretchings
of H5O+2 are robust to the displacement of the central proton, contrary to the situation seen
for wagging and bending modes. Despite the excitation of the stretchings is local in each
water monomer, the calculated band at 3614 cm−1 corresponds to the symmetric, ungerade
mode of B2 symmetry, since both water molecules are oriented in opposite directions with
16
respect to the z-direction incident field. The symmetric, gerade mode is a dark state of A1
symmetry.
IV. SUMMARY AND CONCLUSION
The infrared absorption spectrum of the Zundel cation (H5O+2 ) is calculated by the
quantum-dynamical multiconfiguration time-dependent Hartree (MCTDH) method in the
linear-absorption spectral-range 0 – 4000 cm−1. The energies of all fundamentals and several
overtones related to different motions of the system are reported. The cation is considered in
its full dimensionality (15D). A curvilinear set of coordinates is used to describe the configu-
ration of the system. Details on the derivation of the kinetic energy operator used, which is
exact for total angular momentum J = 0, and on the representation of the potential energy
surface are given in the companion paper [15].
The lowest frequency part of the spectrum, shows a strong absorption at about 100 cm−1
due to the combination of the fundamental wagging-modes w1, which are E− degenerate
states, and the internal-rotation state (1α) of A−1 symmetry. The resulting pair of degen-
erate states is of E+ symmetry and therefore bright. The two absorptions at 250 and 500
cm−1 are related to the combination state of the fundamental waggings and the (3α) state,
which results in a pair of E+ degenerate states and to the rocking fundamentals, also of
E+ symmetry, respectively. These absorptions are related to the component of the field
perpendicular to the water-water axis. The spectral region at about 1000 cm−1 presents a
double-peak absorption which is the most characteristic feature of the spectrum. This dou-
ble peak is seen to arise from the coupling of the proton-transfer motion with a combination
state involving the w3 wagging mode. The reduced probability density of the w3 wagging
mode projected onto the wagging coordinates is shown in Fig. 5b. This state presents four
probability maxima, each of which corresponds to a water in pyramidal conformation (H2O
character) while the other is in planar conformation (H+3 O character), and has an energy
of 374 cm−1. This state alone absorbs light only very weakly (see Fig. 1), but the state
arising from the combination of w3 and the water-water stretching (550 cm−1) reaches an
energy close to the natural absorption of the proton-transfer at about 1000 cm−1. The
coupling between these both states explains the doublet absorption at about 1000 cm−1,
which is interpreted as a Fermi resonance between the combination state (1R,w3) and the
17
proton-transfer fundamental (1z).
The region between 1000 and 2000 cm−1 presents three main absorptions at 1411, 1741
and 1898 cm−1. The peak with the highest intensity in this region is the peak at 1741 cm−1
which corresponds to the ungerade bending motion of the water moieties. The eigenstate at
1741 cm−1 has in addition important contributions from the proton-transfer mode and proton
transfer combined with the water-water stretching mode (see Tab. II). The eigenstates
absorbing at 1411 and 1898 cm−1 are both described by one quantum on the proton-transfer
mode plus one and two quanta excitations, respectively, on the water-water stretching mode.
The nature of the two eigenstates of the doublet at 1000 cm−1 and the three eigenstates
between 1000 and 2000 cm−1 is described by clearly defined motions (diagonal elements in
Tab. II), e.g. the asymmetric bending. However, they constitute a set of coupled states
(non-diagonal elements in Tab. II) featuring the wagging, bending, water-water stretch and
proton-transfer motions.
The region above 3000 cm−1 presents the direct absorptions of the OH-stretching motions
starting at about 3600 cm−1. Symmetry analysis of the OH-stretching motions in the D2d or
G16 groups reveals that the symmetric gerade and ungerade stretching transform according
to the A1 and B2 representations, respectively. The ungerade, B2 state absorbs at 3614 cm−1
due to the z-component of the field. The gerade, A1 state, which is dark, has an energy of
3607 cm−1. The small energy splitting between gerade and ungerade states shows that the
coupling of these motions to the central proton motion must be very weak. Furthermore,
our analysis also points out that the excitation of the ungerade, B2 state is completely
independent of the central proton excitation, and is caused by interaction of the field with
the local dipole of each monomer. Symmetry analysis reveals also that the asymmetric gerade
and ungerade states are E degenerate. They absorb at 3689 cm−1 due to the component of
the field perpendicular to the water-water axis.
The fact that the H5O+2 cation may interconvert between several low energy barriers
connecting equivalent minima had already been pointed out by Wales [29], who showed that
the correct symmetry group, because wagging and internal rotation motions are allowed, is
the permutation-inversion group G16 [33]. Our study shows that the symmetry analysis in
G16 is necessary to understand some important features of the IR linear absorption spectrum.
In addition, it has been shown in Paper I that already in the ground vibrational state there is
non-neglible probability of crossing the internal-rotation barrier. However, the consideration
18
of the cation in the more familiar D2d point group may provide an adequate labelling of the
vibrational motions of the system as long as the internal-rotation mode is not involved in
the considered states.
The reported calculations are in excellent agreement to the experimental measurements
of Ref. [5] on the predissociation spectrum of H5O+2 ·Ne. The discrepancy of the MCTDH
energies reported in Tab. I with respect to the position of the measured bright bands lies
always below 22 cm−1, the average discrepance is 14 cm−1 (see Tab. I). Such a remarkable
consistency between experiment and theory along the whole spectral range represents, on
the one hand, a validation of the underlying potential energy surface of Huang et al. [11] and
of the mode-based cluster expansion of the potential [15] used in the quantum-dynamical
simulations, but is also a clear indication that a suitable set of coordinates was selected to
tackle the problem [15]. On the other hand, it provides a validation of the measurements on
the H5O+2 ·Ne cation by the predissociation technique, since this method gives access to the
infrared linear-absorption regime without noticeable disturbances caused by the messenger
atom. The only essential disagreement between experiment and theory is in the intensities.
The intensities are not measured absolutely but, in comparison to the bright double-peak
at 1000 cm−1, the structures which appear between 1400 and 2000 cm−1 are too low by
a factor of 3 when compared to the MCTDH simulation. Such a discrepancy does not
occur in the spectrum of H5O+2 ·Ar [5], which displays a relative intensity in that region
similar to the MCTDH one despite an incorrect shape. Therefore we conclude that more
investigations are necessary to determine the origin of the discrepancy in relative intensities
between experiment and theory in some regions of the spectrum.
The fact that the reported simulations are successful in obtaining accurate results for
a system of the dimensionality of the protonated water-dimer is to be attributed in great
part to the MCTDH algorithm, in which not only the expansion coefficients, but also the
orbitals (here SPFs), are variationally optimal. For a 15-dimensional system the use of only
4 basis functions per degree of freedom represents of the order of 109 configurations. The
largest calculations reported here consist of about 107 configurations, while already good
results are obtained by using as few as 105 configurations (see Tab. 3 in Paper I). Such an
early convergence of the MCTDH method becomes crucial as high-dimensional problems are
attempted.
The reported simulations constitute a new example of the ability of the MCTDH method
19
to tackle high dimensional, complex molecular systems in a rigorous manner, and they open
exciting perspectives for the simulation and understanding of even more complicated systems
by means of accurate, non-trivial quantum-dynamical methods. Last but not least, they
provide important information on the spectroscopy and dynamics of the hydrated proton.
V. ACKNOWLEDGMENTS
The authors thank Prof. J. Bowman for providing the potential-energy routine, M. Brill
for the help with the parallelized code, and the Scientific Supercomputing Center Karlsruhe
for generously providing computer time. O. V. is grateful to the Alexander von Humboldt
Foundation for financial support. Travel support by the Deutsche Forschungsgemeinschaft
(DFG) is also gratefully acknowledged.
[1] D. Marx, M. Tuckerman, J. Hutter, and M. Parrinello, Nature 397, 601 (1999).
[2] N. Agmon, Isr. J. Chem. 39, 493 (1999).
[3] J.-C. Jiang, Y.-S. Wang, H.-C. Chang, S. H. Lin, Y. T. Lee, G. Niedner-Schatteburg, and
H.-C. Chang, J. Am. Chem. Soc. 122, 1398 (2000).
[4] J. M. Headrick, E. G. Diken, R. S. Walters, N. I. Hammer, R. A. Christie, J. Cui, E. M.
Myshakin, M. A. Duncan, M. A. Johnson, and K. D. Jordan, Science 308, 1765 (2005).
[5] N. I. Hammer, E. G. Diken, J. R. Roscioli, M. A. Johnson, E. M. Myshakin, K. D. Jordan,
A. B. McCoy, X. Huang, J. M. Bowman, and S. Carter, J. Chem. Phys. 122, 244301 (2005).
[6] K. R. Asmis, N. L. Pivonka, G. Santambrogio, M. Brummer, C. Kaposta, D. M. Neumark,
and L. Woste, Science 299, 1375 (2003).
[7] T. D. Fridgen, T. B. McMahon, L. MacAleese, J. Lemaire, and P. Maitre, J. Phys. Chem. A
108, 9008 (2004).
[8] J. M. Headrick, J. C. Bopp, and M. A. Johnson, J. Chem. Phys 121, 11523 (2004).
[9] M. V. Vener, O. Kuhn, and J. Sauer, J. Chem. Phys. 114, 240 (2001).
[10] J. Dai, Z. Bacic, X. C. Huang, S. Carter, and J. M. Bowman, J. Chem. Phys. 119, 6571
(2003).
[11] X. Huang, B. J. Braams, and J. M. Bowman, J. Chem. Phys. 122, 044308 (2005).
20
[12] J. Sauer and J. Dobler, Chem. Phys. Chem. 6, 1706 (2005).
[13] M. Kaledin, A. L. Kaledin, and J. M. Bowman, J. Phys. Chem. A 110, 2933 (2006).
[14] O. Vendrell, F. Gatti, and H.-D. Meyer, Angewandte Chemie in press (2007).
[15] O. Vendrell, F. Gatti, D. Lauvergnat, and H.-D. Meyer, J. Chem. Phys. (2007).
[16] U. Manthe, H.-D. Meyer, and L. S. Cederbaum, J. Chem. Phys. 97, 3199 (1992).
[17] M. H. Beck, A. Jackle, G. A. Worth, and H.-D. Meyer, Phys. Rep. 324, 1 (2000).
[18] H.-D. Meyer and G. A. Worth, Theor. Chem. Acc. 109, 251 (2003).
[19] G. A. Worth, M. H. Beck, A. Jackle, and H.-D. Meyer, The MCTDH Pack-
age, Version 8.2, (2000). H.-D. Meyer, Version 8.3 (2002), Version 8.4 (2007). See
http://www.pci.uni-heidelberg.de/tc/usr/mctdh/.
[20] G. G. Balint-Kurti, R. N. Dixon, and C. C. Marston, J. Chem. Soc., Faraday Trans. 86, 1741
(1990).
[21] H.-D. Meyer, F. Le Quere, C. Leonard, and F. Gatti, Chem. Phys. 329, 179 (2006).
[22] F. Richter, F. Gatti, C. Leonard, F. Le Quere, and H.-D. Meyer, J. Chem. Phys. in press
(2007).
[23] M. R. Wall and D. Neuhauser, J. Chem. Phys. 102, 8011 (1995).
[24] M. H. Beck and H.-D. Meyer, J. Chem. Phys. 109, 3730 (1998).
[25] M. H. Beck and H.-D. Meyer, J. Chem. Phys. 114, 2036 (2001).
[26] F. Gatti, M. H. Beck, G. A. Worth, and H.-D. Meyer, PCCP 3, 1576 (2001).
[27] H. C. Longuet-Higgins, Mol. Phys. 6, 445 (1963).
[28] P. R. Bunker and P. Jensen, Molecular Symmetry and Spectroscopy (NRC Research Press,
1998), 2nd ed.
[29] D. J. Wales, J. Chem. Phys. 110, 10403 (1999).
[30] J. M. Bowman, S. Carter, and X. Huang, Int. Rev. Phys. Chem. 22, 533 (2003).
[31] L. I. Yeh, M. Okumura, J. D. Myers, J. M. Price, and Y. T. Lee, The Journal of Chemical
Physics 91, 7319 (1989),
[32] A. B. McCoy, X. Huang, S. Carter, M. Y. Landeweer, and J. M. Bowman, J. Chem. Phys.
122, 061101 (2005).
[33] Note that Wales [29] uses a convention to assign irreducible representations which differs
from the one we use [28]. The latter convention has the advantage to be consistent with the
aNormal mode harmonic analysis. Results are taken from Ref. [11].bEnergies computed by the MULTIMODE program and (in parenthesis) by diffusion Monte-Carlo. Results
taken grom Ref. [32].cExperimental results taken from Ref. [32].dThis work.
22
TABLE II: Overlaps |〈Φ|Ψ〉|2, where |Φ〉 are test states and |Ψ〉 are eigenstates.
|Ψld〉 |Ψh
d〉 |Ψm1〉 |Ψm2〉 |Ψm3〉
Energy [cm−1] 918 1033 1411 1741 1898
〈Φ1R,w3 | 0.83 0.09 0.00 0.00 0.00
〈Φ1z| 0.10 0.46 0.04 0.10 0.04
〈Φ1z,1R| 0.00 0.00 0.44 0.06 0.01
〈Φbu| 0.07 0.12 0.10 0.38 0.02
〈Φ1z,2R| 0.00 0.00 0.00 0.10 0.38
23
Figure Captions
Figure 1: Simulated MCTDH spectrum in the range 0–4000 cm−1. Excitation in the z
direction (top), perpendicular to the O-H-O axis (middle) and total spectrum, i.e. (1/3)z +
(2/3)∗perpendicular (bottom). Note the different scale of intensities in the perpendicular-
component plot. Autocorrelation time T = 1000 fs. Absorption is given in absolute scale in
mega-barns (Mb). (1 Mb = 10−18 cm2).
Figure 2: Comparison between the MCTDH spectrum (top) and the H5O+2 ·Ne spectrum of
Ref. [5] (bottom). The intensity of the experimental spectrum is adjusted in each spectral
region (800-2000 and 3500-3800 cm−1) using the most intense peak of the MCTDH spectrum
as a reference. Absorption for the MCTDH spectrum is given in absolute scale in mega-barns
(Mb). (1 Mb = 10−18 cm2).
Figure 3: Reduced probability density on the internal rotation α for (a) the ground state
and the first three excited states: (b) 1α, (c) 2α and (d) 3α. The dotted lines correspond to
an enlarged scale (×10). The +/− symbols are intended to clarify the symmetry properties of
each state. They indicate the sign of the underlying wavefunction based on a 1D computation
for coordinate α and do not refer directly to the multidimensional wavefunctions from which
densities are given.
Figure 4: Reduced probability density on the wagging coordinates γA and γB of (a) the
ground vibrational state and (b) the first-excited (w1a) wagging-mode states.
Figure 5: Reduced probability density on the wagging coordinates γA and γB of the excited
states w2, w3 and w4, characterized by two quanta of excitation. Compare with Table I.
Figure 6: Schematic representation of the two most important coupled motions responsible
for the doublet peak at 1000 cm−1
24
0.0
2.0
4.0
6.0
8.0
I [M
b]
z field
0.0
0.5
1.0
1.5I [
Mb]
Perp. field
0.0
1.0
2.0
3.0
0 500 1000 1500 2000 2500 3000 3500
I [M
b]
E [cm−1]
Tot.
FIG. 1: Vendrell et. al., Journal of Chemical Physics
25
0
1
2
3
800 1000 1200 1400 1600 1800 2000I [
Mb]
MCTDH
0
0.5
3700 3500
800 1000 1200 1400 1600 1800 2000
E [cm-1]
x4
Exp.
3700 3500
E [cm-1]
FIG. 2: Vendrell et. al., Journal of Chemical Physics
26
2ππ0
(a)
+ +
2ππ0
(b)
+ -
2ππ0
α
(c)
+ - - +
2ππ0
α
(d)
+ - + -
FIG. 3: Vendrell et. al., Journal of Chemical Physics
27
(a)
150 210γa−30
30γb
(b)
150 210γa−3030γb
FIG. 4: Vendrell et. al., Journal of Chemical Physics
28
(a)
150 210γa−3030γb
(b)
150 210γa−3030γb
(c)
150 210γa−3030γb
FIG. 5: Vendrell et. al., Journal of Chemical Physics
29
FIG. 6: Vendrell et. al., Journal of Chemical Physics


![ELLIPTIC DYNAMICAL QUANTUM GROUPS AND …rimanyi.web.unc.edu/files/2018/07/elliptic.pdfELLIPTIC QUANTUM GROUPS AND EQUIVARIANT COHOMOLOGY 3 The recent preprint [1] of Aganagic and](https://static.documents.pub/doc/80x56/5f1d549023b13d661333897f/elliptic-dynamical-quantum-groups-and-elliptic-quantum-groups-and-equivariant-cohomology.jpg)


