Page 1
Functional diversity measures revealed impacts of non-native species and habitat degradation on species-poor freshwater fish assemblages Nicole Colin, Sébastien Villéger, Martin Wilkes, Adolfo de Sostoa, Alberto Maceda-Veiga Accepted peer reviewed version deposited in Coventry University Repository Original citation: Colin, N; Villeger, S; Wilkes, M; de Sostoa, A; Maceda-Veiga, A. (2018) Functional diversity measures revealed impacts of non-native species and habitat degradation on species-poor freshwater fish assemblages Science of The Total Environment (625), 861-871. DOI: 10.1016/j.scitotenv.2017.12.316 http://dx.doi.org/10.1016/j.scitotenv.2017.12.316 Elsevier CC BY-NC-ND Copyright © and Moral Rights are retained by the author(s) and/ or other copyright owners. A copy can be downloaded for personal non-commercial research or study, without prior permission or charge. This item cannot be reproduced or quoted extensively from without first obtaining permission in writing from the copyright holder(s). The content must not be changed in any way or sold commercially in any format or medium without the formal permission of the copyright holders.
Page 2
Functional diversity measures revealed impacts of non-native species and habitat
degradation on species-poor freshwater fish assemblages
Nicole Colin1,2*, Sébastien Villéger3, Martin Wilkes4, Adolfo de Sostoa1, Alberto Maceda-
Veiga1,5
1Department of Evolutionary Biology, Ecology & Environmental Sciences-Institute of
Research in Biodiversity (IRBio-UB), University of Barcelona, 08028 Barcelona, Spain
2Center for Research on Biodiversity and Sustainable Environments (CIBAS), Universidad
Católica de la Santísima Concepción, Concepción, Chile
3Biodiversité marine et ses usages (UMR 9190 MARBEC), CNRS, Université de Montpellier,
Place Eugène Bataillon, CP 34095, Montpellier Cedex 5, France
4Centre for Agroecology, Water and Resilience, Coventry University, Ryton Organic Gardens,
Wolston Lane, Ryton-On-Dunsmore, CV8 3LG, UK
5Department of Integrative Ecology, Estación Biológica de Doñana (EBD-CSIC), 41092
Sevilla, Spain
*corresponding author:
Nicole Colin
Email: [email protected]
Department of Evolutionary Biology, Environmental Sciences and Ecology
Avda Diagonal, 643 University of Barcelona
08028 Barcelona, Spain
Page 3
Abstract
Trait-based ecology has been developed for decades to infer ecosystem responses to stressors
based on the functional structure of communities, yet its value in species-poor systems is
largely unknown. Here, we used an extensive dataset in a Spanish region highly prone to non-
native fish invasions (15 catchments, N = 389 sites) to assess for the first time how species-
poor communities respond to large-scale environmental gradients using a taxonomic and
functional trait-based approach in riverine fish. We examined total species richness and three
functional trait-based indices available when many sites have ≤ 3 species (specialization, FSpe;
originality, FOri and entropy, FEnt). We assessed the responses of these taxonomic and
functional indices along gradients of altitude, water pollution, physical habitat degradation and
non-native fish biomass. Whilst species richness was relatively sensitive to spatial effects,
functional diversity indices were responsive across natural and anthropogenic gradients. All
four diversity measures declined with altitude but this decline was modulated by physical
habitat degradation (richness, FSpe and FEnt) and the non-native:total fish biomass ratio (FSpe
and FOri) in ways that varied between indices. Furthermore, FSpe and FOri were significantly
correlated with Total Nitrogen. Non-native fish were a major component of the taxonomic and
functional structure of fish communities, raising concerns about potential misdiagnosis
between invaded and environmentally-degraded river reaches. Such misdiagnosis was evident
in a regional fish index widely used in official monitoring programs. We recommend the
application of FSpe and FOri to extensive datasets from monitoring programs in order to
generate valuable cross-system information about the impacts of non-native species and habitat
degradation, even in species-poor systems. Scoring non-native species apart from habitat
degradation in the indices used to determine ecosystem health is essential to develop better
management strategies.
Keyword: fish assemblages; human disturbance; functional diversity; Mediterranean rivers;
non-native species; biomonitoring.
Page 4
1. Introduction
Biodiversity loss is occurring at unprecedented rates on Earth, and freshwater ecosystems are
a prime example (Strayer and Dudgeon, 2010; Tittensor et al., 2014). The EU’s Water
Framework directive has been highly influential in Europe to take conservation actions on
major threats to freshwater ecosystems, mainly water pollution and hydromorphological
alterations (EU Commission, 2003). However, effective management strategies can only be
developed with a good knowledge of how multiple impacts affect aquatic biota, including
biological invasions (Thomsen et al., 2014).
The loss of sensitive species is a well-known response of aquatic communities to stress
(Kolkwitz and Marsoon, 1909; Friberg et al., 2011), and the basis of the myriad of taxonomic-
based procedures developed, hereafter referred to as indices of biotic quality (IBQs), to assess
the health status of rivers (Birk et al., 2012; Karr, 1981). Despite being widely adopted by
resource managers, many criticisms have arisen from their use (Friberg et al., 2011; Jackson et
al., 2016). Among the most important is that the extensive use of IBQs may have limited our
ability to develop theory on how aquatic assemblages respond to stress. Ecological niche theory
states that habitat acts as ‘filter’ selecting those species with the best set of traits for a given
condition (Chase and Leibold, 2003). That is, communities geographically distant can differ in
species composition but have similar trait combinations (e.g. Bonada et al., 2007).
Towards predicting the response of communities, functional ecology has been
developing in recent decades (Petchey and Gaston 2006; Statzner et al., 2001) including
functional diversity (FD) measurements based on species’ functional traits, i.e. attributes of
organisms linked to their response to environment or their role in ecosystem processes (Maire
et al., 2015; Mouillot et al., 2013; Petchey and Gaston, 2002). It is widely recognised that FD
measures are a superior alternative to taxonomic-based approaches to detect the consequences
of human impacts on animal assemblages (e.g. Gagic et al., 2015; Hooper et al., 2005; Villéger
Page 5
et al., 2010). However, their advantages over IBQs have not been specifically investigated.
IBQs often use community traits in making diagnoses, but resultant scores do not explicitly
account for functional diversity.
Here, we assess how taxonomic richness and the functional structure of freshwater fish
assemblages respond to fish invasions and environmental degradation in an extensive area of
north-eastern Spain. This region has a long-history of anthropogenic disturbances (e.g. water
pollution, physical habitat degradation, and non-native invasions; Figuerola et al., 2012;
Maceda-Veiga et al., 2017a; Mas-Marti et al., 2010) and allow us to assess the relative
contribution of these three factors to variation in the structure of fish assemblages in a wide
range of orographic conditions (Sabater et al., 2009). If suitable for river biomonitoring
programs, fish diversity measures should respond to three major threats to riverine ecosystems,
namely water pollution, physical habitat degradation and non-native fish invasions and, to a
minor degree, to natural factors, including altitude. However, the low fish species richness in
Mediterranean rivers (often <4 species, e.g. Maceda-Veiga et al., 2017a) contrasts with the
higher richness in other European rivers and may limit the performance of FD indices to detect
effect of stressors (see Maire et al., 2015). Nonetheless, this region is highly prone to non-
native fish invasions, with tributaries containing mostly native species and lowland mainstems
mostly non-native species (up to six invasive species in Maceda-Veiga et al., 2017a).
The life-histories of native fish populations, including endemic (Barbus haasi Mertens
1925, Luciobarbus graellsii Steindachner, 1866) and widely distributed species (Salmo trutta
Linnaeus, 1758, Anguilla anguilla Linnaeus, 1758), are adapted to the hydrological dynamism
of Mediterranean rivers (e.g. Vinyoles et al., 2010; Doadrio, 2011). However, fish species
introduced in this area, including globally distributed invaders (e.g. Alburnus alburnus
Linnaeus, 1758, Cyprinus carpio Linnaeus, 1758), appear to perform better in hydrological
regimes generated by damming and water abstractions than in natural rivers (Maceda-Veiga et
al., 2017a).
The objectives of our study are: i) to test whether three FD indices (functional
Page 6
specialization, originality and entropy) identify the impacts of human activities better than does
taxonomic richness in species-poor fish assemblages, and ii) to compare the diagnostic value
of traditional IBQs and FD indices in detecting two major threats to rivers, namely habitat
degradation and the release of non-native species, which may not necessarily co-occur (see
Benejam et al., 2009). We expected that FD indices would provide better inferences of how
fish invasions, water pollution and physical habitat degradation affect fish assemblages than
would do species richness alone, because community-habitat relationships should be mediated
via functional traits (e.g. Suding et al., 2008). If FD indices have potential to become new
monitoring tools in species-poor systems, we expected them to perform better than a regional
fish index and other IBQs widely used by water agencies in compliance with the EU’s Water
Framework Directive.
2. Materials and methods
2.1. Study area
The study area is located in north-eastern Spain and comprises 15 catchments, including the
complete Ebro River and part of the Garonne basin (Fig 1). Except the Garonne, all rivers flow
east from the Cantabrian, Pyrenean or low mountains to the sea. Overall, the selected river
basins drain an extensive area of up to 99,700 km2 and the variety of human impacts over large-
scale natural gradients provide an excellent study system (see also Sabater et al., 2009).
Approximately 40% of all sampling sites (N = 389) have non-native species. The range of
values for widely used indicators of pollution (e.g. conductivity and nutrients) is wide in
invaded (conductivity = 79-4108 µS cm-1; nitrate = 0-25 mg l-1) and non-invaded sites
(conductivity = 20-4108 µS cm-1; nitrate = 0-30 mg l-1). Similarly, the altitudinal range of
sites with non-native (3-984 m.a.s.l.) and native species was wide (3-1814 m.a.s.l.) (see
Maceda-Veiga et al., 2017b for further details).
Most of these rivers are small and follow a typical Mediterranean hydrological regime,
Page 7
with severe droughts in summer and torrential floods in autumn. In large rivers, however,
streamflow peaks in spring because of snowmelt. We surveyed in low flow conditions because
this is when fish populations can be most efficiently sampled using electrofishing (see below).
These conditions are also likely to intensify the effects of anthropogenic stressors on aquatic
organisms (Petrovic et al., 2011).
2.2. Fish surveys
We assembled fish data from 430 surveys performed in north-eastern Spain from 2002 to 2008
(e.g. Sostoa et al., 2003; Maceda-Veiga and de Sostoa, 2011). Our surveys followed an
international standardized fish sampling method (CEN standards EN 14962 and EN 14011), in
compliance with the EU’s Water Framework Directive.
We used a single-pass electrofishing approach using a portable unit which generated up
to 200 V and 3 A pulsed D.C. in an upstream direction. We covered the whole wetted width of
the 100-m long reaches surveyed in each site, which included a variety of habitat types (pools,
rifles and runs) (see Maceda-Veiga et al., 2017a for further details). Fish were kept in buckets
provided with air pumps until the end of the survey when they were released into the river.
There was no mortality. Fish were anaesthetized with a buffered MS222® solution (0.02%
Tricaine methane-sulfonate, Sigma) to reduce stress. Fish were identified to species level,
counted and a representative set of individuals of each species (40 individuals when possible)
weighed to the nearest g. Fish biomass was expressed as total fish weight divided by the area
surveyed and sampling time in minutes (kg/ha x min).
2.2. Functional characterization of fish
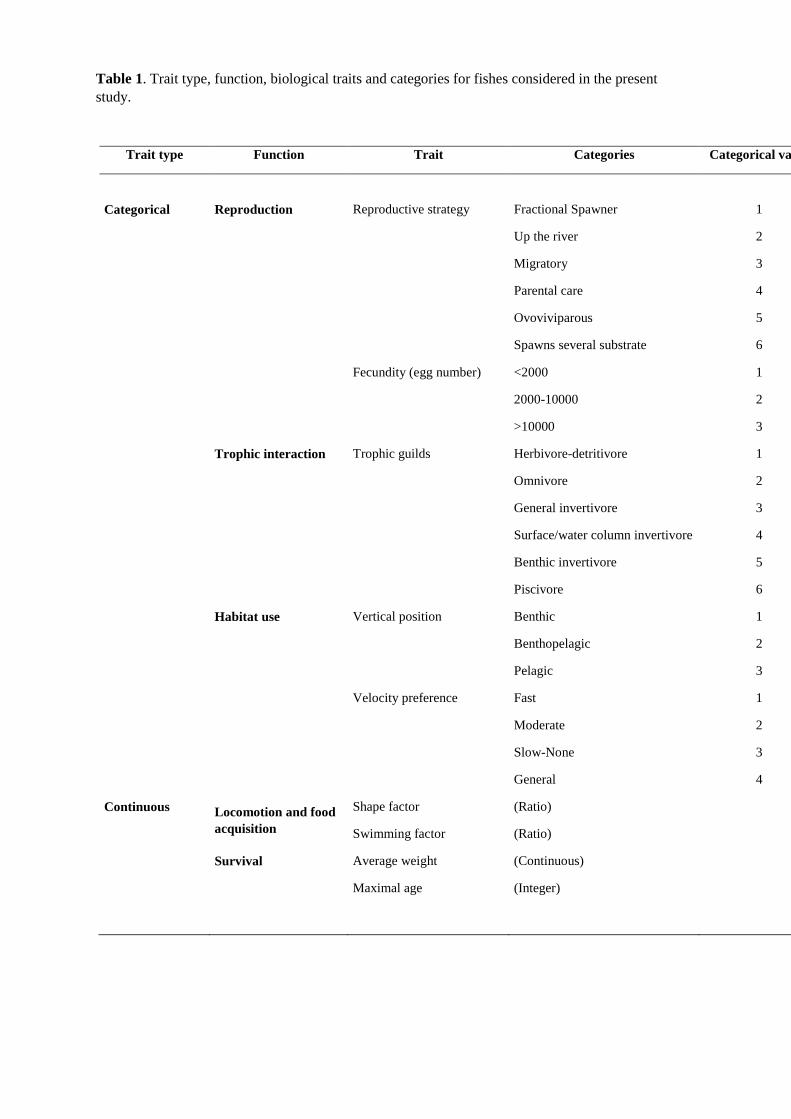
To describe the functional identity of each fish species, we used 9 traits that are related to key
biological functions such as food acquisition, locomotion and reproduction weighted by the
biomass of each species in each sampling site (Table 1) (Buisson et al., 2013; Olden et al.,
2006, Villéger et al., 2013). These traits have major implications for ecosystem functions. For
Page 8
example, migratory species, including the European eel (A. anguilla) are important for the
transfer of energy along rivers (Flecker et al. 2010), and prey consumption is related to
predator’s body size (e.g. Jardine et al., 2017).
Traits were coded as continuous or ordinal variables. We used regional fish descriptions
(Doadrio, 2011; Kottelat and Freyhof, 2007; Sostoa et al., 1990), electronic databases
(http://www.fishbase.org), the scientific literature, and our own expertise to provide a
functional description of all fish species (Table 2). Ordinal traits were assigned a single state
based on a majority rules approach according to adult preferences following Olden et al.
(2006). The lack of an in-depth ecological knowledge of some fish species precluded the use
of more traits. We acknowledge that species traits can differ among populations (see Ackerly
and Cornwell, 2007), but we lack this specific information for the present study. Species mostly
found in river mouths such as mullets (Liza spp., Chelon labrosus Risso, 1827 and Mugil
cephalus Linnaeus, 1758) were excluded from the analysis, as they play a minor ecological
role at the basin scale.
2.3. Measuring functional diversity
Functional diversity (FD) indices of fish assemblages were computed using different measures
of dissimilarity among the traits of a given species in relation to the trait composition of the
overall data-set (N = 430 sites) (Maire et al., 2015; Mouillot et al., 2013; Villéger et al., 2008).
We calculated overall differences in traits among species using the Gower distance (Gower,
1966). We then used a principal coordinates analysis to identify the number of axes that best
represent the differences in trait composition (i.e. the multidimensional Euclidean space in
Villéger et al., 2008). The first four axes (mSD: 0.012) provided the best result based on the
criterion of Maire et al. (2015) for species-poor systems, where the species more separated had
the most extreme traits. However, the relative importance of the traits of a given species in
relation to the complete data-set can be weighted using different algorithms. This is why we
used the three indices of FD that can be calculated even with one species in each sampling site,
Page 9
namely functional entropy (FEnt), functional specialization (FSpe), and functional originality
(FOri; Maire et al., 2015).
FEnt was calculated as 1/(1-Q), where Q is Rao’s quadratic entropy computed as the
biomass-weighted sum of pairwise functional distance among species within the community
(Ricotta and Szeidl, 2009). FEnt increases when species with the greatest biomass are
functionally distinct (Mouillot et al., 2013). FSpe was calculated as the biomass-weighted mean
distance in the functional space to the average value of all the species present at the regional
scale (Bellwood et al., 2006). It reaches high values when the species with the greatest biomass
has the most extreme traits from the regional pool. Finally, we calculated FOri as the biomass-
weighted mean distance to the nearest species within functional space (Mouillot et al., 2013).
It increases when species with unique trait combinations have the greatest biomass in the
community.
2.4. Environmental variables and indices of biotic quality
In each sampling site, we quantified seven water quality variables (pH, conductivity,
ammonium, nitrite, nitrate and phosphate-P concentrations) prior to fish sampling (e.g.
Maceda-Veiga et al., 2017a). These variables provide an overview of major stressors to aquatic
ecosystems, including nutrient pollution and changes in overall ionic composition (e.g. Nielsen
et al., 2003; Smallbone et al., 2016; Maceda-Veiga et al., 2017a). To describe physical habitat,
we used 17 variables from two widely used habitat quality indices in this region, namely the
QBR (Munné et al., 2003) and RBA indices (a modified version of the U.S. Rapid
Bioassessment by Barbour et al., 1999). As geographical features, we recorded the basin name
and altitude (m.a.s.l.) in each site using Google Earth®. Altitude was used as a surrogate for the
position of the sampling site in the river, and summarises the role of natural spatial gradients
in fish indicators, as previously validated in this region (Murphy et al., 2013).
As indices of biotic quality, we downloaded scores of three indices based on diatoms,
fish and invertebrates from the Catalan Water Agency (http://aca-
Page 10
web.gencat.cat/aca/appmanager/aca/aca/) for 50 sites that match with our fish surveys. We
used the Specific Polluosensitivity Index for diatoms (IPS, Coste, 1982), the Index of Biotic
Integrity for Catalan rivers for fish (IBICAT, Sostoa et al., 2003), and the Index of the Iberian
Biomonitoring Working Party for invertebrates (IBMWP, Alba-Tercedor et al., 2002). Last,
we calculated the median tolerance of all fish species to water and habitat degradation in each
sampling site using the tolerance indicator values (TIV) developed by Maceda-Veiga and de
Sostoa (2011).
2.5. Statistical analyses
All analyses were computed in R (R Development Core Team, 2013) using the packages stats,
MASS, lme4 (Bates et al., 2016), ade4 (Dray & Dufour, 2007), psych (Revelle and Revelle,
2016), and hier.part (Walsh et al. 2013) and the functions outlined below. Continuous variables
were log-transformed and % were arc-sine square-root transformed to aid in model fitting. The
original set of 24 environmental variables was reduced by excluding highly correlated variables
(Spearman’s rho > 0.7), as reported in Maceda-Veiga and de Sostoa (2011). A principal
component analysis (the function principal) was then applied to summarize variation in the
remnant 11 water and habitat variables in form of principal component axes, which we re-
named as ‘gradients of anthropogenic impact’. The ‘varimax’ rotation facilitated the
interpretation of axes, and the number of axes was selected based on explanatory power.
2.5.1. Modelling taxonomic and functional fish diversity as function of natural factors,
environmental degradation and non-native fish biomass
Generalized linear mixed models (GLMM, the function glmer) were used to examine
relationships among fish diversity measures (taxonomic richness, FEnt, FSpe, and FOri),
altitude, and the gradients of anthropogenic impact. As other anthropogenic stressor, we
included in the models the proportion of non-native fish species in relation to the total fish
Page 11
biomass to explore their contribution to the variation in taxonomic richness and FD indices.
Basin was included as random effect to control for potential systematic differences among
basins. Sampling year was also included as random factor but was excluded from final models
because the explained variance was close to 0. Proportional data (FSpe, FOri, and FEnt) was
analysed using binomial errors/logit link, and patterns in species richness were examined using
Poisson errors/log link. Models were validated by visually inspecting diagnostic plots of
residuals. The statistical threshold was established at P < 0.05.
To further test the robustness of our results, we used a hierarchical partitioning (HP)
analysis (the function hier.part) using the error distributions validated in the GLMM approach.
HP models deal with collinearity among predictors (e.g. between altitude and habitat
degradation, see Murphy et al., 2013), which even in small amounts can bias regression
parameters (Freckleton, 2011). Whilst causality cannot be determined in observational studies,
HP decomposes the variation of dependent variables in unique and joined fractions of a set of
predictors (Mac Nally and Walsh, 2004). We assessed the significance of HP models using a
randomization test for hierarchical partitioning analysis (the function rand.hp). As many
regressors can generate rounding errors in HP models, we validated their outputs by changing
the order of predictors, as recommended by Mac Nally and Walsh (2004).
2.5.2. Effects of environmental degradation and non-native fish biomass on fish traits
To determine the relative contribution of each functional trait in the fish community-
environment relationships, we used fourth-corner and RLQ analyses following the guidelines
of Dray et al. (2014). Both methods are based on the analysis of the fourth-corner matrix, which
crosses traits and environmental variables weighted by species biomass. RLQ is a multivariate
technique that provides ordination scores to summarize the joint structure among species
distributions across sampling sites, environmental variables and species traits. In contrast, the
fourth-corner method mainly tests for individual trait-environment relationships (one trait and
one environmental variable at a time). We included the non-native status of fish as additional
Page 12
trait in this analysis to avoid circularity in our reasoning (as non-native species contributed to
the trait matrix). We used model type 6 to avoid inflated rates of type I error (Dray and
Legendre, 2008). The significance of trait-environment relationships was assessed through
Monte Carlo permutation (999 iterations using the approach of ter Braak et al., 2012).
2.5.3. Comparing the diagnostic value of fish diversity measures and traditional indices of
biotic quality in environmentally degraded or invaded river reaches
We used Spearman rank correlation coefficients (at P < 0.05) to test to which extent the fish
diversity measures used (taxonomic richness, FEnt, FSpe and FOri) were associated with other
measurements of river health status, namely indicators of nutrient pollution, conductivity and
the number of non-native species) using an independent data-set from the same study area (N
= 50 sampling sites). Moreover, we compared these correlation coefficients with those obtained
from correlations with indices of biotic quality to assess the potential superiority of FD indices
in determining river health status.
3. Results
3.1. Description of the taxonomic and functional diversity of fish assemblages
We captured 26 fish taxa from 11 families, of which 12 species were Cyprinidae (Table 2).
Fourteen taxa were native and 12 non-native, and the maximum total species richness in each
site was 11. The most frequently captured native species (>100 sampling sites) were brown
trout (S. trutta), Iberian redfin barbel (B. haasi) and common barbel (L. graellsii). The most
common non-native species (captured in > 40 sampling sites) were carp (C. carpio) and bleak
(A. alburnus). Functional specialization (FSpe) and functional originality (FOri) reached their
maximum value (1), whereas the functional entropy index (FEnt) ranged from 1 to 1.8. Species
richness was significantly correlated to the three functional diversity (FD) indices, with
Page 13
correlation coefficients slightly higher for FEnt (r = 0.54; P < 0.01) than for FSpe (r = 0.24; P
< 0.01) and FOri (r = 0.26; P < 0.01).
3.2. Defining gradients of water and physical habitat degradation
Only the first two axes of PCA were considered gradients of anthropogenic impact and
explained altogether 42.88 % of variance (Table 3). PC1 accounted for 29.6% of the variance
and was mainly driven by water pollution (e.g. nitrite, nitrate, and phosphates-P). PC2
explained 13.8% of variance and was mainly related to physical habitat degradation (riparian
cover, habitat structure, and channel morphology).
3.3. Relative contribution of natural factors, environmental degradation and non-native fish
biomass to variation in taxonomic and functional diversity of fish assemblages
Since human activities often concentrate in the lowlands, it was necessary to disentangle
the relative effects of natural factors, water pollution, physical habitat degradation, and the
proportion of non-native fish species expressed as biomass on the three FD measures.
Hierarchical partitioning (HP) models revealed that altitude made the largest individual
contribution to the variation in all four fish diversity measures (Fig 2). Patterns in taxon
richness were mainly attributed to natural factors, namely altitude and basin (Fig 3). All three
functional diversity (FD) indices followed the altitudinal trend observed for species richness
(Figs 3 and 4). Physical habitat degradation also explained a significant unique fraction of
variation in FD indices (Fig 2).
HP results were mostly concordant with those from generalized linear mixed models
(Table 4). However, the two modelling techniques ranked the contribution of altitude, physical
habitat degradation and non-native fish biomass to variation in FD measures in a different order
(Fig 2, Table 4). While FSpe and FOri indices were influenced by altitude and the biomass of
non-native fish species in the same way, only FSpe was significantly related to physical habitat
Page 14
degradation (Table 4). Water pollution was not retained as having a significant effect in any of
the four fish diversity measures (Table 4). The random effect of basin was of major importance
to explain variation in species richness but not in FD (Table 5).
3.4 Associations of fish traits with environmental degradation and non-native biomass
The first of three axes in the RLQ analysis explained the vast majority (68%) of variation in
the trait-environment relationship, which was largely driven by responses of non-native
species, velocity preference, shape factor and vertical position (Figure 5). Overall, there was a
significant link between traits and the environment (RLQ: p = 0.04). However, only one
individual environment-trait link was significant, namely a positive relationship between water
pollution (PC1) and non-native fish status (fourth-corner: r = 5.06, padj = 0.04; Table S1).
There was a further notable, yet non-significant, negative relationship between altitude and
velocity preference (fourth-corner: r = -2.66, padj = 0.11; Table S1).
3.5. Comparing the diagnostic value of fish diversity measures and traditional indices of
biotic quality in environmentally degraded or invaded river reaches
The strongest correlations were found among all three FD indices (FSpe, FOri, and FEnt) and
the proportion of non-native fish in the fish assemblage expressed as richness or biomass (Table
6). A weak but negative relationship was observed for the regional fish index IBICAT and the
two non-native fish metrics (Table 6). In contrast, a strong negative relationship was found
among non-native fish the diatom (IPS) and benthic macroinvertebrate (IBMWP) indices, and
the tolerance indicator values of fish to water pollution (TIV_WATER) and physical habitat
degradation (TIV_RBA) following the methods outlined of Maceda-Veiga and de Sostoa
(2011) (Table 6).
At least one indicator of environmental degradation was significantly correlated, either
with a fish diversity measure or an index of biotic quality (Table 6). IPS and IBMWP showed
Page 15
a highly negative correlation with conductivity and total nutrient concentrations. Conversely,
nutrients were positively related to FSpe, FOri and the TIV for water quality (Table 6). A
positive association was also found for the habitat index RBA and the index IPS and the TIV
for physical habitat quality (Table 6). In contrast, the physical habitat index RBA was
negatively associated with FSpe and FOri (Table 6). All water and habitat indicators were
poorly related to total fish richness, the fish index IBICAT, and the FD index FEnt (Table 6).
4. Discussion
Our study is a first in showing the potential of FD measures to identify the mechanisms
behind changes in the structure of species-poor fish assemblages. We showed the superior
performance of three functional diversity (FD) indices (specialization, FSpe; originality, FOri;
and entropy; FEnt) over taxonomic richness and a regional fish index in response to habitat
degradation and non-native fish invasions, two major drivers of the freshwater biodiversity
crisis around the world (Marr et al., 2010; Strayer and Dudgeon, 2010; Vörösmarty et al.,
2010).
4.1. Relative contribution of natural factors, environmental degradation and non-native fish
biomass to variation in taxonomic and functional diversity of fish assemblages
Our results support the notion that geographical features, including altitude, are major
shaping forces of the composition of fish assemblages (Maceda-Veiga et al., 2017a; Richards
et al., 1996; Williams et al., 2003). In upstream sites above 1000 m, FD indices and richness
values were very low. As altitude declined below 500 m FD indices increased rapidly, whereas
species richness exhibited a more gradual change (Fig 3). The most plausible explanation for
these results is that rivers increase in size downstream as do resources available (Angermeier
and Schlosser, 1989; Lomolino, 2000). Such a trend in the three indices of FD indicates that
Page 16
more species with extreme, unique trait values were found downstream, as reported by
Karadimou et al. (2016).
The relative effect of non-native fish biomass and physical habitat quality on FD was
index- and model-specific. Incongruence between generalized linear mixed models (GLMMs)
and hierarchical partitioning analyses of variance (HP) can be due to collinearity. Even when
highly correlated variables are excluded before running any model, predictors are always
correlated (see details in Mac Nally, 2002). Non-native fish often occur in hydrologically-
impacted rivers (e.g. dams, Maceda-Veiga et al., 2017a; Marchetti et al., 2004). This may have
obscured our relationships between non-native fish species and physical habitat degradation
and FD indices, but HP models can shed light into these associations (see also Buisson et al.,
2008; Murphy et al., 2013). GLMMs and HPs ranked biotic and abiotic predictors in a different
order, which has management implications because different actions are required to extirpate
species and to restore habitat. Nonetheless, hydromorphological restoration might solve both
issues, as rivers with natural flow regimes are often the least invaded (Maceda-Veiga et al.,
2017a, Bernardo et al., 2003; Marchetti and Moyle, 2001; Poff et al., 1997).
In our study, the indices FSpe and FOri were strongly associated with non-native fish
biomass and physical habitat degradation as opposed to species richness and FEnt, both mostly
affected by natural factors (Fig 3, Fig 4). These results proved the utility of FD indices to detect
human impacts, as has been demonstrated in many taxa including birds (Huijbers et al., 2016),
plants (Laliberté et al., 2013), aquatic invertebrates (Gutiérrez-Cánovas et al., 2015) and fish
(Villéger et al., 2010), but it had not yet been tested in species-poor fish assemblages. A high
number of endemic species but low richness is a common trait in freshwater fish assemblages
in Mediterranean basins, which are home to among the most threatened faunas in the world
(Smith and Darwall, 2006). Studies examining species composition provide useful insights into
how human perturbations affect these assemblages (e.g. Maceda-Veiga et al., 2017a).
However, functional trait-based ecology transforms taxonomic information into a matrix of
Page 17
ecological traits and allows researchers to make cross-taxa and cross-system comparisons more
easily (Mouillot et al., 2013; Villéger et al., 2010).
4.2. Identifying the traits that best represent differences in the functional composition of fish
assemblages
FSpe and FOri indices differed in their response to human impacts, supporting the idea
that multiple indices are required to fully describe functional diversity (Mouillot et al., 2013;
Villeger et al., 2008). FOri reduced if non-native fish dominated in biomass because successful
invaders shared traits (e.g. high fecundity, Marr et al., 2010). These traits are very different
from those of native species, and non-native fish traits have a strong biomass weighting because
of the large size of the fish (e.g. the predator Silurus glanis Linnaeus, 1758, >100 Kg; Doadrio,
2011). The native fish fauna in our study-system naturally lacks many predators, with most
species being medium-size omnivorous-invertivorous cyprinids (Doadrio, 2011), which may
also explain an increase in FSpe with the proportion of non-native fish species. A remarkable
exception is the native fish A. anguilla which has unique trait sets among native fish (e.g.
predator, catadromous) (de Sostoa et al., 1990). However, the traits of A. anguilla probably had
a minor weight in computing the FD indices because this species is currently rare in our study
area (Maceda-Veiga et al., 2010). Interestingly, traits such as fecundity seemed to be related to
water quality even when this factor did not have an overall effect on FD indices. These results
can be explained because nutrient pollution was one of our water quality variables and
energetic reserves increase body condition and hence fecundity (Peig and Green, 2009), but
may have not affected other functional traits. This result indicates that it may be important to
use a trait which has the strongest link with a function of interest, instead of combining many
traits in scores of multi-trait indices (see also Colin et al., 2016b).
Although the indices FSpe and FOri better identified anthropogenic impact than did
species richness, this does not mean that modern ecology can be disconnected from taxonomy.
A good taxonomical and ecological knowledge of species is crucial to assign traits properly
Page 18
(e.g. Rodríguez-Lozano et al., 2016; Sánchez-Hernández et al., 2011). Even though the marine
fish Sarpa salpa Linneo, 1758 and Siganus luridus Rüppell 1829 are both herbivores, the
former feeds exclusively on vascular plants whereas the latter feeds on macroalgae, affecting
the ecosystem in a different manner (Vergés et al., 2014). Similarly, detailed studies of two
omnivorous species in our study (e.g. B. meridionalis, Squalius laietanus) have shown
differences in prey consumed in clean and polluted sites among seasons (Colin, In preparation).
These changes provide evidence further that a good knowledge of natural history is essential
to avoid a coarse assignment of traits, but pragmatism is also needed as function of time
invested in data acquisition and model outcomes. In our study, there were also issues with
species identity (genera Phoxinus, Gobio, Carassius, Barbatula) which requires identification
using genetic data (Maceda-Veiga et al., 2017a).
4.3. Congruence among fish diversity measures and other indicators of river health
Riverine taxa integrate the effects of multiple stressors over variable spatio-temporal scales
based on their different life-histories (Barbour et al., 1999). Thus, biotic indices may not
correlate strongly with fluctuating variables such as water variables but inform about diagnostic
ability. However, strong correlations can indicate that aquatic taxa are exposed to chronic
pollution (e.g. Colin et al., 2016a), which is suggested in our study by a strong relationship
between diatom (IPS) and invertebrate-based indices (IBMWP) and nutrient concentrations.
These results support the idea that biotic indices were originally developed to detect organic
pollution, even though they are now used to determine the ecological impact of many pollution
sources (e.g. Colin et al., 2016a; Juttner et al., 2012; Munné and Prat, 2009). A strong negative
relationship was found in our study between non-native fish and the indices IPS and IBMWP.
As stated above, this association can be attributed to the fact that non-native fish species tend
to occur in degraded sites, although these species are often ecosystem engineers which directly
cause habitat degradation (Shin-Ichiro et al., 2009). Nonetheless, there is still limited insight
Page 19
into how non-native fish invasions affect native fish responses to water pollution and physical
habitat degradation (but see Maceda-Veiga et al., 2017b).
The confounding effect of non-native fish in ecosystem health diagnostic was
particularly problematic for fish-based measures. For example, the regional fish index IBICAT
did not significantly respond to water quality and physical habitat, and was markedly affected
by non-native fish occurrence, as has been highlighted by Benejam et al., (2009). Fish richness
was also poorly related to environmental degradation and mostly driven by the presence of
non-native fish. Conversely, functional indices (FSpe and FOri) responded to both, even though
the direction of the effects often differed from our large-scale data-set, which indicates that the
outputs of functional analyses depend on the pool of traits of the assemblage under study
(Mouillot et al., 2013; Villeger et al., 2008).
Last, our study showed that invaded sites were dominated by fish species relatively
tolerant to poor water and habitat quality according to tolerance indicator values developed by
Maceda-Veiga and de Sostoa (2011). These results support the prevailing assumption in the
literature that non-native fish species are highly tolerant (Hermoso et al., 2011; Ribeiro et al.,
2008; but see Kennard et al., 2005; Maceda-Veiga and de Sostoa, 2011). However, it may also
indicate that native species living there have wider tolerance ranges, if say, non-native fish
species that typically occur in upstream reaches (e.g. Oncorhynchus mykiss, Phoxinus spp.) are
likely to be more tolerant than native fish species from downstream reaches (e.g. Luciobarbus
graellsii) (Maceda-Veiga and de Sostoa, 2011). However, these inferences need testing with
specific experiments because the response of a species to stress is affected by many factors at
play, including acclimation, adaptation, and phenotypic plasticity (Biagianti-Risbourg et al.,
2013).
Page 20
5. Conclusions
Official biomonitoring schemes are firmly rooted in more than 200 indices of biotic quality
which appraise the ecological status of water-bodies in Europe alone (Birk et al., 2012). The
principal disadvantages are that they are not generalisable beyond the region they were
designed for and they do not reflect ecological processes. Without underestimating their value,
our study provides evidence of the potential of the indices FSpe and FOri based on fish traits
as new diagnostic tools in species-poor systems. The FD indices were sensitive to both abiotic
and biotic degradation, and showed more sensitivity to anthropogenic impacts than did species
richness and a regional fish index. By identifying which traits make species more vulnerable
to human actions in extensive data-sets collected through official monitoring schemes, it is
possible to identify the taxa at most-risk in the highly threatened Mediterranean rivers (Smith
and Darwall, 2006). Therefore, FD indices are a promising tool to better understand the causes
of decline in freshwater fish and develop more effective conservation strategies.
Acknowledgments
We thank all people who assisted in the field and Dr Lluís Cardona for useful insights
into the use of functional guilds in ecological studies. NC was funded by the National
Commission of Scientific and Technological Research (CONICYT PhD fellowship, Ref:
72100771) and AMV by the Severo Ochoa Program for Centres of Excellence in R+D+I (Ref:
SEV-2012-0262).
References
Alba-Tercedor, J., Jáimez-Cuéllar, P., Álvarez, M., Avilés, J., Bonada i Caparrós, N., Casas, J.,
Mellado, A., Ortega, M., Pardo, I., Prat, N., Rieradevall, M., Robles, S., Sáinz-Cantero, C.E., Sánchez-
Ortega, A., Suárez, M. L., Toro, M., Vidal-Abarca, M. R., Vivas, S., Zamora-Muñoz, C., 2002.
Page 21
Caracterización del estado ecológico de ríos mediterráneos ibéricos mediante el índice IBMWP (antes
BMWP’). Limnetica 21(3-4): 175-185.
Ackerly, D.D., Cornwell, W.K. 2007. A trait-based approach to community assembly: partitioning of
species trait values into within- and among-community components. Ecology Letters 10: 135–145.
Angermeier, P.L., Schlosser, I.J. 1989. Species-area relationships for stream fishes. Ecology 70: 1450–
1462.
Bates, D., Maechler, M., Bolker, B., Walker, S., Christensen, R. H. B., Singmann, H., Dai, B.,
Grothendieck G., Green, P. 2016. Package ‘lme4’. In R Package Version 1.1–10.
Barbour, M. T., Gerritsen, J., Snyder, B. D., Stribling, J. B. 1999. Rapid bioassessment protocols for
use in streams and wadeable rivers. USEPA, Washington.
Bellwood, D.R., Wainwright, P.C., Fulton, C.J., Hoey, A.S. 2006. Functional versatility supports coral
reef biodiversity. Proceedings of the Royal Society of London B 273: 101–107.
Benejam, L., Alcaraz, C., Sasal, P., Simon-Levert, G., García-Berthou, E. 2009. Life history and
parasites of the invasive mosquitofish (Gambusia holbrooki) along a latitudinal gradient. Biological
Invasions 11(10): 2265-2277.
Bernardo, J.M., Ilhe´u, M., Matono, P., Costa, A.M. 2003. Interannual variation of the fish assemblage
structure in a mediterranean river: implications of streamflow on the dominance of native or exotic
species. River Research and Applications 19: 521–532.
Biagianti-Risbourg S, Paris-Palacios S, Mouneyrac C, Amiard-Triquet C (2013) Pollution Acclimation,
Adaptation, Resistance, and Tolerance in Ecotoxicology. In Encyclopedia of Aquatic
Ecotoxicology (pp. 883-892). Springer Netherlands.
Birk, S., Bonne, W., Borja, A., Brucet, S., Courrat, A., Poikane, S., Solimini, A., Van de Bund, W.,
Zampoukas, N., Hering, D., 2012. Three hundred ways to assess Europe’s surface waters: an almost
complete overview of biological methods to implement the Water Framework Directive. Ecol. Indic.
18: 31–41.
Page 22
Bonada, N., Doledec, S., & Statzner, B. 2007. Taxonomic and biological trait differences of stream
macroinvertebrate communities between mediterranean and temperate regions: implications for future
climatic scenarios. Global Change Biology, 13(8): 1658-1671.
Buisson, L., Blanc, L., Grenouillet, G. 2008. Modelling stream fish species distribution in a river
network: the relative effects of temperature versus physical factors. Ecology of Freshwater Fish 17(2):
244-257.
Buisson, L., Grenouillet, G., Villéger, S., Canal, J., Laffaille, P. 2013. Toward a loss of functional
diversity in stream fish assemblages under climate change. Global Change Biology 19(2): 387-400.
Chase, J. M., Leibold, M. A. 2003. Ecological niches: linking classical and contemporary approaches.
University of Chicago Press, Chicago, Illinois, USA.
Colin, N., Maceda-Veiga, A., Flor-Arnau, N., Mora, J., Fortuño, P., Vieira, C., Prat, N., Cambra, J., de
Sostoa, A. 2016a. Ecological impact and recovery of a Mediterranean river after receiving the effluent
from a textile dyeing industry. Ecotoxicology and Environmental Safety, 132, 295-303.
Colin, N., Porte, C., Fernandes, D., Barata, C., Padrós, F., Carrassón, M., Monroy, M., Cano-
Rocabayera, O., De Sostoa, A., Piña, B., Maceda-Veiga, A. 2016b. Ecological relevance of biomarkers
in monitoring studies of macro-invertebrates and fish in Mediterranean rivers. Science of The Total
Environment, 540, 307-323.
Coste, M., 1982. Etude des méthodes biologiques d’appréciation quantitative de la qualité des eaux.
Rapport Cemagref QE Lyon-AF Bassin Rhône Méditerranée Corse, Lyon, France.
Doadrio, I. 2011. Ictiofauna continental española: Bases para su seguimiento. Ministerio de Medio
Ambiente y Medio Rural y Marino, Centro de Publicaciones.
Dray, S. and Dufour, A.B. 2007. The ade4 package: implementing the duality diagram for ecologists.
Journal of Statistical Software, 22, 1-20.
Dray, S. and Legendre, P. 2008. Testing the species traits–environment relationships: the fourth‐corner
problem revisited. Ecology, 89, 3400-3412.
Page 23
Dray, S., Choler, P., Doledec, S., Peres-Neto, P.R., Thuiller, W., Pavoine, S. and ter Braak, C.J. 2014.
Combining the fourth‐corner and the RLQ methods for assessing trait responses to environmental
variation. Ecology, 95, 14-21.
European Commission, 2003. Common Implementation Strategy for the Water Framework Directive
(2000/60/EC). Overall Approach to the Classification of Ecological Status and Ecological Potential.
Office for Official publications of the European Communities, Luxembourg, 52 pp
Figuerola, B., Maceda-Veiga, A. De Sostoa, A., 2012. Assessing the effects of sewage effluents in a
Mediterranean creek: fish population features and biotic indices. Hydrobiologia 694(1): 75-86.
Flecker, A. S., McIntyre, P. B., Moore, J. W., Anderson, J. T., Taylor, B. W., Hall Jr, R. O., 2010.
Migratory fishes as material and process subsidies in riverine ecosystems. American Fisheries Society
Symposium 73 (2): 559-592.
Freckleton, R.P., 2011. Dealing with collinearity in behavioural and ecological data: model averaging
and the problems of measurement error. Behavioral Ecology and Sociobiology 65(1): 91-101.
Friberg, N., Bonada, N., Bradley, D.C., Dunbar, M.J., Edwards, F.K., Grey, J., Hayes, R., Hildrew, A.,
Lamouroux, N., Trimmer., M., 2011. Biomonitoring of human impacts in freshwater ecosystems: the
good, the bad and the ugly. Adv. Ecol. Res. 44, 1–68.
Gagic, V., Bartomeus, I., Jonsson, T., Taylor, A., Winqvist, C., Fischer, C., Slade, E M. Steffan-
Dewenter, I., Emmerson, M., Potts, S. G., Tscharntke, T., Weisser, W., Bommarco R. 2015. Functional
identity and diversity of animals predict ecosystem functioning better than species-based indices.
Proceedings of the Royal Society of London B: Biological Sciences 282(1801): 20142620.
Gower, J. C. 1966. Some distance properties of latent root and vector methods used in multivariate
analysis. Biometrika 53(3-4): 325-338.
Gutiérrez-Cánovas, C., Sánchez-Fernández, D., Velasco, J., Millán, A., & Bonada, N. (2015). Similarity
in the difference: changes in community functional features along natural and anthropogenic stress
gradients. Ecology, 96(9), 2458-2466.
Page 24
Hermoso, V., Clavero, M., Blanco-Garrido, F., Prenda, J. 2011. Invasive species and habitat
degradation in Iberian streams: an analysis of their role in freshwater fish diversity loss. Ecological
Applications 21(1): 175-188.
Huijbers, C. M., Schlacher, T. A., McVeigh, R. R., Schoeman, D. S., Olds, A. D., Brown, M. B., ... &
Connolly, R. M. (2016). Functional replacement across species pools of vertebrate scavengers
separated at a continental scale maintains an ecosystem function. Functional ecology, 30(6), 998-1005.
Hooper, D. U., Chapin, F. S., Ewel, J. J., Hector, A., Inchausti, P., Lavorel, S., J. H. Lawton, J. H.,
Lodge, D. M., Loreau, M., Naeem, S., Schmid, B., Setälä, H.,. Symstad, A. J., Vandermeer. J. 2005.
Effects of biodiversity on ecosystem functioning: a consensus of current knowledge. Ecological
monographs 75(1): 3-35.
Jackson, M. C., Weyl, O. L. F., Altermatt, F., Durance, I., Friberg, N., Dumbrell, A. J., Piggott, J. J.,
Tiegs, S.D., Tockner, K., Krug, C.B., Leadley, P.W., Woodward, G. 2016. Chapter Twelve-
Recommendations for the Next Generation of Global Freshwater Biological Monitoring Tools.
Advances in Ecological Research 55: 615-636.
Jardine, T. D., Rayner, T. S., Pettit, N. E., Valdez, D., Ward, D. P., Lindner, G., et al. (2017). Body size
drives allochthony in food webs of tropical rivers. Oecologia, 183(2), 505-517.
Jüttner, I., Chimonides, P. J., Ormerod, S. J. 2012. Developing a diatom monitoring network in an urban
river-basin: initial assessment and site selection. Hydrobiologia, 695(1): 137-151.
Karadimou, E. K., Kallimanis, A. S., Tsiripidis, I., Dimopoulos, P. 2016. Functional diversity exhibits
a diverse relationship with area, even a decreasing one. Scientific reports, 6.
Karr, J.R., 1981. Assessment of biotic integrity using fish communities. Fisheries 6 (6), 21–27
Kennard, M. J., Arthington, A. H., Pusey, B. J., Harch, B. D. 2005. Are alien fish a reliable indicator of
river health? Freshwater Biology 50(1): 174-193.
Kottelat M, Freyhof J. 2007. Handbook of European freshwater fishes. Berlin: Publications Kottelat,
Cornol and Freyhof.
Kolkwitz and Marsoon. 1909. Oekologie der tierischen Saprobien. Int. Rev. hrd. Hydrobiol 2: 126-152.
Page 25
Laliberté, E., Norton, D. A., & Scott, D. (2013). Contrasting effects of productivity and disturbance on
plant functional diversity at local and metacommunity scales. Journal of Vegetation Science, 24(5),
834-842.
Lomolino, M. V. 2000. Ecology’s most general, yet protean pattern: The species‐area relationship.
Journal of Biogeography 27(1): 17-26.
Maire, E., Grenouillet, G., Brosse, S., & Villéger, S. 2015. How many dimensions are needed to
accurately assess functional diversity? A pragmatic approach for assessing the quality of functional
spaces. Global Ecology and Biogeography 24(6): 728-740.
Maceda-Veiga, A., Monleon-Getino, A., Caiola, N., Casals, F., de Sostoa, A., 2010. Changes in fish
assemblages in catchments in north‐eastern Spain: biodiversity, conservation status and introduced
species. Freshwater Biology 55(8): 1734-1746.
Maceda-Veiga, A., De Sostoa, A. 2011. Observational evidence of the sensitivity of some fish species
to environmental stressors in Mediterranean rivers. Ecological Indicators 11(2): 311-317.
Maceda-Veiga, A., Baselga, A., Sousa, R., Vilà, M., Doadrio, I., de Sostoa, A. 2017ª. Fine-scale
determinants of conservation value of river reaches in a hotspot of native and non-native species
diversity. Science of the Total Environment 574: 455-466.
Maceda-Veiga, A., Mac Nally, R., de Sostoa, A. 2017b. The presence of non-native species is not
associated with native fish sensitivity to water pollution in greatly hydrologically altered rivers. Science
of The Total Environment, 607, 549-557.
Mac Nally, R., Walsh, C. J. 2004. Hierarchical partitioning public-domain software. Biodiversity and
Conservation 13(3): 659-660.
Mac Nally, R. 2002. Multiple regression and inference in ecology and conservation biology: further
comments on identifying important predictor variables. Biodiversity and Conservation 11(8): 1397-
1401.
Marchetti, M. P., P. B. Moyle. 2001. Effects of flow regime on fish assemblages in a regulated
California stream. Ecological Applications 11: 530–539.
Page 26
Marchetti, M. P., Light, T., Moyle, P. B., Viers, J. H. 2004. Fish invasions in California watersheds:
testing hypotheses using landscape patterns. Ecological Applications 14(5): 1507-1525.
Marr, S. M., Marchetti, M. P., Olden, J. D., García‐Berthou, E., Morgan, D. L., Arismendi, I., Day, J.
A., Griffiths, C. L., Skelton, P. H. 2010. Freshwater fish introductions in mediterranean‐climate regions:
are there commonalities in the conservation problem? Diversity and Distributions 16(4): 606-619.
Mas-Martí, E., García-Berthou, E., Sabater, S., Tomanova, S., Muñoz, I. 2010. Comparing fish
assemblages and trophic ecology of permanent and intermittent reaches in a Mediterranean stream.
Hydrobiologia 657(1): 167-180.
Mouillot, D., Graham, N. A., Villéger, S., Mason, N. W., Bellwood, D. R. 2013. A functional approach
reveals community responses to disturbances. Trends in Ecology and Evolution 28(3): 167-177.
Munné, A., Prat, N., Sola, C., Bonada, N., Rieradevall, M. 2003. A simple field method for assessing
the ecological quality of riparian habitat in rivers and streams: QBR index. Aquat. Conserv. Mar.
Freshw. Ecosyst. 13(2): 147–163.
Munné, A., Prat, N., 2009. Use of macroinvertebrate-based multimetric indices for water quality
evaluation in Spanish Mediterranean Rivers: an intercalibration approach with the IBMWP index.
Hydrobiologia 628 (1): 203–225.
Murphy, C. A., Casals, F., Solà, C., Caiola, N., de Sostoa, A., García-Berthou, E. 2013. Efficacy of
population size structure as a bioassessment tool in freshwaters. Ecological indicators 34: 571-579.
Nielsen, D. L., Brock, M. A., Rees, G. N., & Baldwin, D. S. 2003. Effects of increasing salinity on
freshwater ecosystems in Australia. Australian Journal of Botany 51(6): 655-665.
Olden, J. D., Poff, N. L., & Bestgen, K. R. 2006. Life‐history strategies predict fish invasions and
extirpations in the Colorado River Basin. Ecological Monographs 76(1): 25-40.
Olden, J. D., Rooney, T. P. 2006. On defining and quantifying biotic homogenization. Global Ecology
and Biogeography 15(2): 113-120.
Peig, J., & Green, A. J. (2009). New perspectives for estimating body condition from mass/length data:
the scaled mass index as an alternative method. Oikos, 118(12), 1883-1891.
Page 27
Petchey, O. L., Gaston, K. J. 2002. Functional diversity (FD), species richness and community
composition. Ecology Letters 5(3): 402-411.
Petchey, O. L., Gaston, K. J. 2006. Functional diversity: back to basics and looking forward. Ecology
letters 9(6) : 741-758.
Petrovic, M., Ginebreda, A., Acuña, V., Batalla, R. J., Elosegi, A., Guasch, H., López de Alda, M.,
Marcé, R., Muñoz, I., Navarro-Ortega, A., Navarro, E., Vericat, D., Sabater, S., Barceló, D. 2011.
Combined scenarios of chemical and ecological quality under water scarcity in Mediterranean rivers.
TrAC 30(8): 1269-1278.
Poff, N. L., J. D. Allan, M. B. Bain, J. R. Karr, K. L. Prestegaard, B. D. Richter, R. E. Sparks, J. C.
Stromberg. 1997. The natural flow regime: a paradigm for river conservation and restoration.
BioScience 47: 769–784.
Revelle, W., Revelle, M. W. 2016. Package ‘psych’. Cran R.
Ribeiro, F., Elvira, B., Collares-Pereira, M. J., Moyle, P. B. 2008. Life-history traits of non-native fishes
in Iberian watersheds across several invasion stages: a first approach. Biological Invasions 10(1): 89-
102.
Richards, A. J., Kirschner, J., Stepanek, J., Marhold, K. 1996. Apomixis and taxonomy: an introduction.
Folia Geobotanica 31(3): 281-282.
Ricotta, C., Szeidl, L., 2009. Diversity partitioning of Rao’s quadratic entropy. Theoretical population
biology 76(4): 299-302.
Rodríguez‐Lozano, P., Verkaik, I., Maceda‐Veiga, A., Monroy, M., Sostoa, A., Rieradevall, M., Prat,
N. 2016. A trait‐based approach reveals the feeding selectivity of a small endangered Mediterranean
fish. Ecology and evolution 6(10): 3299-3310.
Sánchez-Hernández, J., Vieira-Lanero, R., Servia, M. J., Cobo, F. 2011. Feeding habits of four
sympatric fish species in the Iberian Peninsula: keys to understanding coexistence using prey traits.
Hydrobiologia, 667(1): 119-132.
Sabater S, Feio MJ, Graça MAS, Muñoz I, Romaní AM. 2009. The Iberian Rivers. In: Rivers of Europe
(Eds K. Tockner, U. Uehlinger & C.T. Robinson), Academic Press, London, pp. 113– 149.
Page 28
Shin-ichiro, S. M., Usio, N., Takamura, N., & Washitani, I. 2009. Contrasting impacts of invasive
engineers on freshwater ecosystems: an experiment and meta-analysis. Oecologia 158(4): 673-686.
Smallbone, W., Cable, J., & Maceda-Veiga, A. 2016. Chronic nitrate enrichment decreases severity and
induces protection against an infectious disease. Environment international 91: 265-270.
Smith, K. G., Darwall, W. R. (Eds.). 2006. The status and distribution of freshwater fish endemic to the
Mediterranean Basin (Vol. 1). IUCN, pp. 34
Sostoa, A. D., Casals, F., Fernández, J. V., Lobón-Cervià, J., de Sostoa, F. J., Vinyoles, D. 1990. Peixos.
Història Natural dels Països Catalans, 11.
Sostoa, A., Caiola, N., Vinyoles, D., Sánchez, S., Franch, C. 2003. Development of a biotic integrity
index (IBICAT) based on the use of fish as indicators of the environmental quality of the rivers of
Catalonia. Report to the Catalan Water Agency, Barcelona. [available on-line at: http://www. gencat.
net/aca/en//planificacio/directiva/treballs. jsp# C].
Statzner, B., Hildrew, A.G., Resh, V.H. 2001. Species traits and environmental constraints:
Entomological research and the history of ecological theory. Annu. Rev. Entomol. 46: 291–316.
Strayer, D. L., Dudgeon, D. 2010. Freshwater biodiversity conservation: recent progress and future
challenges. Journal of the North American Benthological Society 29(1): 344-358.
Suding, K. N., Lavorel, S., Chapin, F. S., Cornelissen, J. H., Diaz, S., Garnier, E., Goldberg, D., Hooper,
D., Jackson, S., Navas, M. L. 2008. Scaling environmental change through the community‐level: a trait‐
based response‐and‐effect framework for plants. Global Change Biology 14(5): 1125-1140.
Team, R. 2013. R development core team. RA Lang Environ Stat Comput 55: 275-286.
Thomsen, M., Wernberg, T., Olden, J., Byers, J. E., Bruno, J., Silliman, B., & Schiel, D. (2014). Forty
years of experiments on aquatic invasive species: are study biases limiting our understanding of
impacts?. NeoBiota, 22, 1.
ter Braak, C.J.F., Cormont, A. and Dray, S. 2012. Improved testing of species traits-environment
relationships in the fourth-corner problem. Ecology, 93, 1525-1526.
Page 29
Tittensor, D.P., Walpole, M., Hill, S.L.L., Boyce, D. G., Britten, G. L. et al., 2014. A mid-term analysis
of progress towards international biodiversity targets. Science 346: 241–244.
Vergés A, Steinberg PD, Hay ME, Poore AG, Campbell AH, Ballesteros E, Heck KL, Booth DJ,
Coleman MA, Feary DA, Figueira W. The tropicalization of temperate marine ecosystems: climate-
mediated changes in herbivory and community phase shifts. InProc. R. Soc. B. 2014 (Vol. 281, No.
1789, p. 20140846). The Royal Society.
Villéger, S., Mason, N. W., Mouillot, D. 2008. New multidimensional functional diversity indices for
a multifaceted framework in functional ecology. Ecology 89(8): 2290-2301.
Villéger, S., Ramos-Miranda, J., Flores-Hernándes, D., Mouillot, D. 2010. Contrasting changes in
taxonomic vs. functional diversity of tropical fish communities after habitat degradation. Ecological
Applications 20: 1512–1522.
Villéger, S., Grenouillet, G., Brosse, S. 2013. Decomposing functional β‐diversity reveals that low
functional β‐diversity is driven by low functional turnover in European fish assemblages. Global
Ecology and Biogeography 22(6): 671-681.
Vinyoles, D., De Sostoa, A., Franch, C., Maceda‐Veiga, A., Casals, F., Caiola, N. 2010. Life‐history
traits of the stone loach Barbatula barbatula. Journal of Fish Biology 77(1): 20-32.
Vörösmarty, C. J., McIntyre, P. B., Gessner, M. O., Dudgeon, D., Prusevich, A., Green, P. Glidden, S.,
Bunn, E., Sullivan, C.A., Reidy-Liermann C., Davies, P. M. 2010. Global threats to human water
security and river biodiversity. Nature 467(7315): 555-561.
Walsh, C., Mac Nally, R., & Walsh, M. C. (2013). Package ‘hier. part’. R package Version, 1-0.
Williams, L.R., Taylor, C.M., Warren, M.L., Clingenpeel, J.A., 2003. Environmental variability,
historical contingency, and the structure of regional fish and macroinvertebrate faunas in Ouachita
Mountain stream systems. Environmental Biology of Fishes 67(2): 203-216.
Page 30
Table 1. Trait type, function, biological traits and categories for fishes considered in the present
study.
Trait type Function Trait Categories Categorical value
Categorical Reproduction Reproductive strategy Fractional Spawner 1
Up the river 2
Migratory 3
Parental care 4
Ovoviviparous 5
Spawns several substrate 6
Fecundity (egg number) <2000 1
2000-10000 2
>10000 3
Trophic interaction Trophic guilds Herbivore-detritivore 1
Omnivore 2
General invertivore 3
Surface/water column invertivore 4
Benthic invertivore 5
Piscivore 6
Habitat use Vertical position Benthic 1
Benthopelagic 2
Pelagic 3
Velocity preference Fast 1
Moderate 2
Slow-None 3
General 4
Continuous Locomotion and food
acquisition
Shape factor (Ratio)
Swimming factor (Ratio)
Survival Average weight (Continuous)
Maximal age (Integer)
Page 31
30
1
Table 2. Fish species list registered in study area. 2
Family Species Code Common name Origin
Anguillidae Anguilla anguilla An European eel N
Blenniidae Salaria fluviatilis Sf Freshwater blenny N
Centrarchidae Lepomis gibbosus Lg Pumpkinseed E
Micropterus salmoides Ms Largemouth bass E
Cobitidae Barbatula quignardi Bq Pyreneann stone loach N
Cobitis calderoni Cc Northern iberian spined-loach N
Cobitis paludica Cp Southern iberian spined-loach N
Cyprinidae Achondrostoma arcasii Aa Bermejuela N
Alburnus alburnus Al Bleak E
Barbus haasi Bh Iberian redfin barbel N
Barbus meridionalis Bm Western Mediterranean barbel N
Carassius auratus Ca Goldfish E
Cyprinus carpio Cy Carp E
Gobio lozanoi Gl Pyrennean gudgeon N
Luciobarbus graellsii Bg Ebro barbel N
Parachondrostoma miegii Pm European nase N
Phoxinus sp Pb Pyrennean minnow N
Squalius laeitanus Sl Ebro chub N
Scardinius
erythrophthalmus
Se
Rudd E
Ictaluridae Ameiurus melas Am Bullhead E
Esocidae Esox lucius El Pickerel E
Percidae Sander luciperca Sa Pike-perch E
Poeciliidae Gambusia holbrooki Gh Mosquitofish E
Salmonidae Oncorhynchus mykiss Om Rainbow trout E
Salmo trutta St Brown trout N
Siluridae Silurus glanis Sg Welscatfish E
3
Page 32
31
Note: Native species (N), Non-native species (E) 4
5
Page 33
32
6
Table 3. Loadings for axes 1 and 2 according to PCA built with water physico-chemical variables 7 and habitat quality features measured in rivers from north-eastern Spain. Bold values are 8 considered high ≥ 0.4 (Maceda-Veiga et al. 2014). 9
10
Environmental Variables PC1 PC2
Habitat structure -0.24 0.67
Riparian coverage -0.09 0.79
Channel conservation -0.05 0.80
pH 0.03 0.02
Temperature 0.27 -0.28
Ammonium 0.80 -0.08
Nitrite 0.79 -0.13
Nitrate 0.76 -0.09
Phosphates 0.49 -0.23
Conductivity 0.43 -0.31
Macrophytes -0.06 0.04
11
12
13
Page 34
33
Table 4. Generalized linear mixed model results for fixed effects. P values <0.05 in bold. 14
15
Estimate SE z p
Taxon richness
(Intercept) 2.540 0.234 10.876 1.50E-27
log(altitude + 1) -0.294 0.038 -7.829 4.94E-15
Physical habitat 0.733 0.218 3.361 0.0008
Water quality -0.184 0.131 -1.407 0.1594
Non-native biomass ratio 0.148 0.102 1.446 0.1481
log(altitude + 1)*Physical habitat -0.128 0.036 -3.565 0.0004
log(altitude + 1)*Physico-chemical 0.022 0.027 0.817 0.4141
FSpe
(Intercept) 6.640 1.432 4.636 3.55E-06
log(altitude + 1) -1.742 0.282 -6.177 6.52E-10
Physical habitat 3.691 1.443 2.559 0.0105
Water quality -0.692 0.719 -0.962 0.3362
Non-native biomass ratio 3.072 0.546 5.625 1.86E-08
log(altitude + 1)*Physical habitat -0.700 0.278 -2.518 0.0118
log(altitude + 1)*Physico-chemical 0.164 0.160 1.026 0.3048
FOri
(Intercept) 9.147 1.840 4.971 6.65E-07
log(altitude + 1) -2.189 0.364 -6.017 1.78E-09
Physical habitat 1.970 1.681 1.172 0.2413
Water quality -0.720 0.723 -0.996 0.3190
Non-native biomass ratio -3.423 1.279 -2.677 0.0074
log(altitude + 1)*Physical habitat -0.400 0.341 -1.175 0.2399
log(altitude + 1)*Physico-chemical 0.145 0.176 0.826 0.4088
FEnt
(Intercept) 4.529 1.472 3.077 0.002
log(altitude + 1) -1.478 0.298 -4.958 7.11E-07
Physical habitat 5.808 2.111 2.752 0.006
Water quality -0.991 0.987 -1.005 0.315
Non-native biomass ratio 0.343 0.973 0.353 0.724
log(altitude + 1)*Physical habitat -0.981 0.406 -2.416 0.016
log(altitude + 1)*Physico-chemical 0.186 0.227 0.820 0.412
16
17
18
Table 5. Generalized linear mixed model results for random effect of basin. 19
20
(Basin) Variance SD
Taxon richness 0.0736 0.2712
FSpe 2.51E-10 1.58E-05
FOri 3.74E-08 1.93E-04
FEnt 2.54E-10 1.59E-05
21
Page 35
34
Table 6. Spearman rank correlation coefficients between functional diversity measures (FSpe and FOri), habitat quality indices (RBA), proportion of 22
exotic species in biomass and richness, the indices of biotic integrity using fish (IBICAT), diatoms (IPS) and macroinvertebrates (IBMPW) as bioindicators 23
and tolerance indicator values of fish communities to water (TIV_WATER) and habitat deterioration (TIV_RBA) used in this region (see methods). 24
25
Environmental stressors
Functional diversity measures and IBIs
FSpe FOri FEnt Richness IBICAT IBMWP IPS TIV_RBA TIV_WATER
Conductivity 0.197 0.124 -0.060 -0.059 -0.104 -0.481*** -0.396** -0.498** 0.306
Total Nitrogen 0.436** 0.427** 0.160 -0.001 0.112 -0.576*** -0.684*** -0.398* 0.439*
RBA -0.469*** -0.454** -0.060 -0.072 -0.017 0.357 0.466*** 0.401* -0.531**
Non-native biomass 0.609*** 0.666*** 0.445** 0.332* -0.282* -0.440** -0.592*** -0.804*** 0.900**
Non-native ratio 0.525*** 0.575*** 0.325* 0.305* -0.297* -0.584*** -0.688*** -0.762*** 0.793***
26
Note: Significance codes: 0 ‘***’ 0.001 ‘**’ 0.01 ‘*’ 0.05 ‘.’ 0 27
28
29
30
31
Page 36
35
32 Figure 1. Location of study area in northeastern Spain. The 389 sampling sites are 33
shown with black points. 34 35
36
Page 37
36
37
Figure 2. Independent contribution (%) of the five predictors to explain variation of 3 38 functional diversity measures (FSpe, FOri, FEnt) and taxonomic richness. All predictors 39 were significant at the 95% confidence interval based on a randomized permutation test. 40
41 42
Page 38
37
43 44
Figure 3. Relationship (mean fitted values from GLMM) between taxon richness and altitude 45 (with basin as random effect) at three levels of physical habitat quality (PC2): PC2 = maximum 46
(a); PC2 = median (b); and PC2 = minimum (c). 47
48
49
Page 39
38
50 51
Figure 4. Relationships between FD indices (FSpe, FOri and FEnt) and significant drivers 52 according to GLMMs accounting for altitude, physical habitat (PC2) and ratio of non-native to 53 native biomass (‘ratio’); a-c) FSpe vs altitude for 3 levels of non-native fish biomass (100%, 54
50% and 0%, colors) and three types of physical habitat (maximum, median , minimum value of 55 PC2, respectively); d) FOri vs altitude for 3 levels of non-native fish biomass ; e) FEnt vs 56 altitude for 3 levels physical habitat habitat (maximum, median , minimum value of PC2, 57
respectively). 58
59
60
Page 40
39
61 62
Figure 5. Results of the first two axes of the RLQ analysis: (a) species scores (see Table 1 for 63 species codes); (b) coefficients for environmental variables (PC1=water quality, PC2=physical 64 habitat); (c) coefficients for traits (see Table 1 for descriptions); and (d) eigenvalues with the 65
first two axes in grey. Note: water quality is negatively correlated with PC1. 66
67