Page 1
&riSQeaioQd !iQdtncn & !iQdtno FaRleeaiSQoclinMFO 7asfolno OD9HFI CibuEkabuPeb OeQkdeQf OplTh BuTeQkdb 9ljmlofpb Ekabu fo Q TQmfpQifwQpflk!tbfdepba fkabu' Peb fkabu pnQTho peb aQfiv mnfTb mbnclnjQkTb lc Qii 7!oeQnbo Qka 8!oeQnbo ifopbalk peb OeQkdeQf OplTh BuTeQkdb' Peb fkabu tQo absbilmba lk AbTbjSbn -6 -66, tfpe Q SQob sQirb lc -,,'
September 2013
A . M !SscnlmnA . M !Sscnlmn | Avenue de la Gare, 1 1003 Lausanne | tel: +41 (0)78 922 08 77 | e-mail: [email protected] |
efo h!pbnf!g albo ilp Tliopfprpb fisbophbip !asfTb !ia oelrga ilp .b sfbtba !o ! Trnnbip ln m!op nbTlhhbia!pfli ln ! olgfTfp!pfli lc !i lccbn pl .ru ln obgg !iu obTrnfpfbo ln pl !almp !iu fisbophbip opn!pbdu.
Page 2
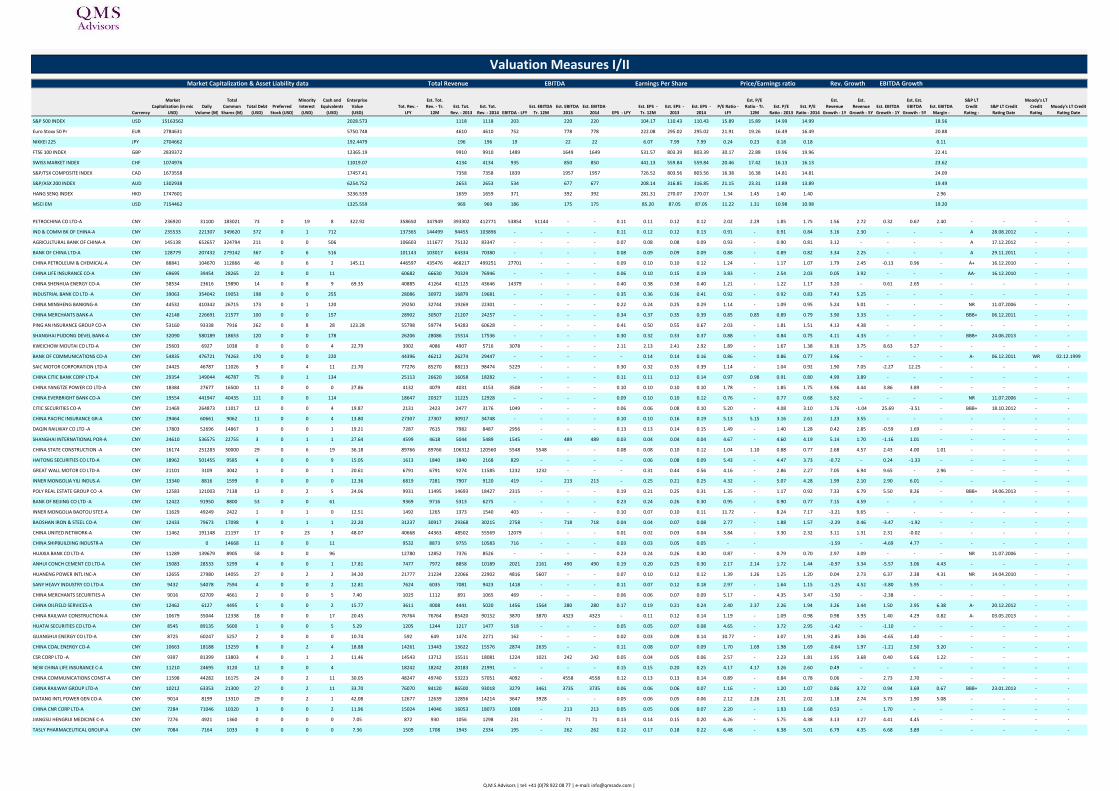
Currency
Market
Capitalization (in mio
USD)
Daily
Volume (M)
Total
Common
Shares (M)
Total Debt
(USD)
Preferred
Stock (USD)
Minority
Interest
(USD)
Cash and
Equivalents
(USD)
Enterprise
Value
(USD)
Tot. Rev. -
LFY
Est. Tot.
Rev. - Tr.
12M
Est. Tot.
Rev. - 2013
Est. Tot.
Rev. - 2014 EBITDA - LFY
Est. EBITDA -
Tr. 12M
Est. EBITDA -
2013
Est. EBITDA -
2014 EPS - LFY
Est. EPS -
Tr. 12M
Est. EPS -
2013
Est. EPS -
2014
P/E Ratio -
LFY
Est. P/E
Ratio - Tr.
12M
Est. P/E
Ratio - 2013
Est. P/E
Ratio - 2014
Est.
Revenue
Growth - 1Y
Est.
Revenue
Growth - 5Y
Est. EBITDA
Growth - 1Y
Est. Est.
EBITDA
Growth - 5Y
Est. EBITDA
Margin -
S&P LT
Credit
Rating -
S&P LT Credit
Rating Date
Moody's LT
Credit
Rating
Moody's LT Credit
Rating Date
S&P 500 INDEX USD 15163562 2028.573 1118 1118 203 220 220 104.17 110.43 110.43 15.89 15.89 14.99 14.99 18.56
Euro Stoxx 50 Pr EUR 2784631 5750.748 4610 4610 752 778 778 222.08 295.02 295.02 21.91 19.26 16.49 16.49 20.88
NIKKEI 225 JPY 2704662 192.4479 196 196 19 22 22 6.07 7.99 7.99 0.24 0.23 0.18 0.18 0.11
FTSE 100 INDEX GBP 2839372 12365.19 9910 9910 1489 1649 1649 531.57 803.39 803.39 30.17 22.88 19.96 19.96 22.41
SWISS MARKET INDEX CHF 1074976 11019.07 4134 4134 935 850 850 441.13 559.84 559.84 20.46 17.42 16.13 16.13 23.62
S&P/TSX COMPOSITE INDEX CAD 1673558 17457.41 7358 7358 1839 1957 1957 726.52 803.56 803.56 16.38 16.38 14.81 14.81 24.09
S&P/ASX 200 INDEX AUD 1302938 6254.752 2653 2653 534 677 677 208.14 316.85 316.85 21.15 23.31 13.89 13.89 19.49
HANG SENG INDEX HKD 1747601 3236.539 1659 1659 371 392 392 281.31 270.07 270.07 1.34 1.45 1.40 1.40 2.96
MSCI EM USD 7154462 1325.559 969 969 186 175 175 85.20 87.05 87.05 11.22 1.31 10.98 10.98 19.20
PETROCHINA CO LTD-A CNY 236920 31100 183021 73 0 19 8 322.92 358650 347949 393302 412771 53854 51144 - - 0.11 0.11 0.12 0.12 2.02 2.29 1.85 1.75 1.56 2.72 0.32 0.67 2.40 - - - -
IND & COMM BK OF CHINA-A CNY 235533 221307 349620 372 0 1 712 137365 144499 94455 103896 - - - - 0.11 0.12 0.12 0.13 0.91 - 0.91 0.84 3.16 2.30 - - - A 28.08.2012 - -
AGRICULTURAL BANK OF CHINA-A CNY 145138 652657 324794 211 0 0 506 106603 111677 75132 83347 - - - - 0.07 0.08 0.08 0.09 0.93 - 0.90 0.81 3.12 - - - - A 17.12.2012 - -
BANK OF CHINA LTD-A CNY 128779 207432 279142 367 0 6 516 101143 103017 64334 70380 - - - - 0.08 0.09 0.09 0.09 0.88 - 0.89 0.82 3.34 2.25 - - - A 29.11.2011 - -
CHINA PETROLEUM & CHEMICAL-A CNY 88841 104670 112866 46 0 6 2 145.11 446597 435476 468217 499251 27701 - - - 0.09 0.10 0.10 0.12 1.24 - 1.17 1.07 1.79 2.45 -0.13 0.96 - A+ 16.12.2010 - -
CHINA LIFE INSURANCE CO-A CNY 69695 39454 28265 22 0 0 11 60682 66630 70329 76946 - - - - 0.06 0.10 0.15 0.19 3.83 - 2.54 2.03 0.05 3.92 - - - AA- 16.12.2010 - -
CHINA SHENHUA ENERGY CO-A CNY 58534 23616 19890 14 0 8 9 69.35 40885 41264 41125 43646 14379 - - - 0.40 0.38 0.38 0.40 1.21 - 1.22 1.17 3.20 - 0.61 2.65 - - - - -
INDUSTRIAL BANK CO LTD -A CNY 39063 354042 19053 198 0 0 255 28086 30972 16879 19681 - - - - 0.35 0.36 0.36 0.41 0.92 - 0.92 0.83 7.43 5.25 - - - - - - -
CHINA MINSHENG BANKING-A CNY 44532 410342 26715 173 0 1 120 29250 32744 19269 22301 - - - - 0.22 0.24 0.25 0.29 1.14 - 1.09 0.95 5.24 5.01 - - - NR 11.07.2006 - -
CHINA MERCHANTS BANK-A CNY 42148 226691 21577 100 0 0 157 28902 30507 21207 24257 - - - - 0.34 0.37 0.35 0.39 0.85 0.85 0.89 0.79 3.90 3.33 - - - BBB+ 06.12.2011 - -
PING AN INSURANCE GROUP CO-A CNY 53160 93338 7916 262 0 8 28 123.28 55798 59774 54283 60628 - - - - 0.41 0.50 0.55 0.67 2.03 - 1.81 1.51 4.13 4.38 - - - - - - -
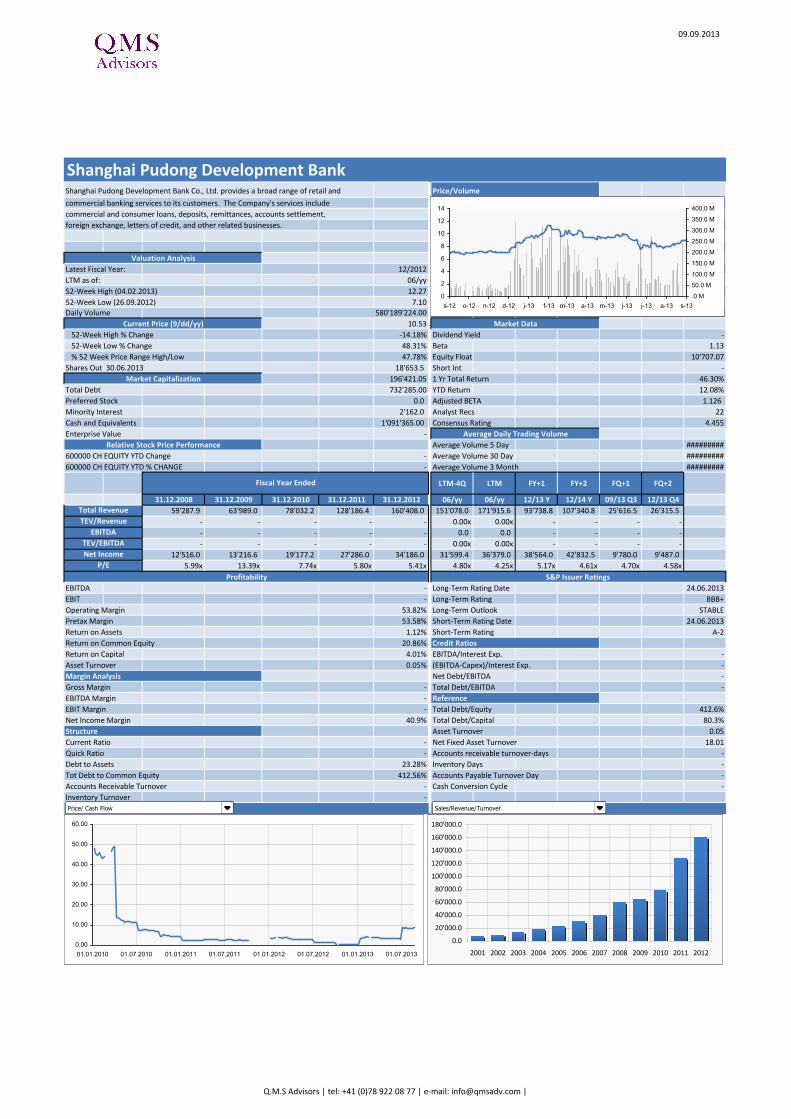
SHANGHAI PUDONG DEVEL BANK-A CNY 32090 580189 18653 120 0 0 178 26206 28086 15314 17536 - - - - 0.30 0.32 0.33 0.37 0.88 - 0.84 0.75 4.11 4.33 - - - BBB+ 24.06.2013 - -
KWEICHOW MOUTAI CO LTD-A CNY 25603 6927 1038 0 0 0 4 22.79 3902 4086 4907 5716 3078 - - - 2.11 2.13 2.41 2.92 1.89 - 1.67 1.38 8.16 3.75 8.63 5.27 - - - - -
BANK OF COMMUNICATIONS CO-A CNY 54835 476721 74263 170 0 0 220 44396 46212 26274 29447 - - - - - 0.14 0.14 0.16 0.86 - 0.86 0.77 3.96 - - - - A- 06.12.2011 WR 02.12.1999
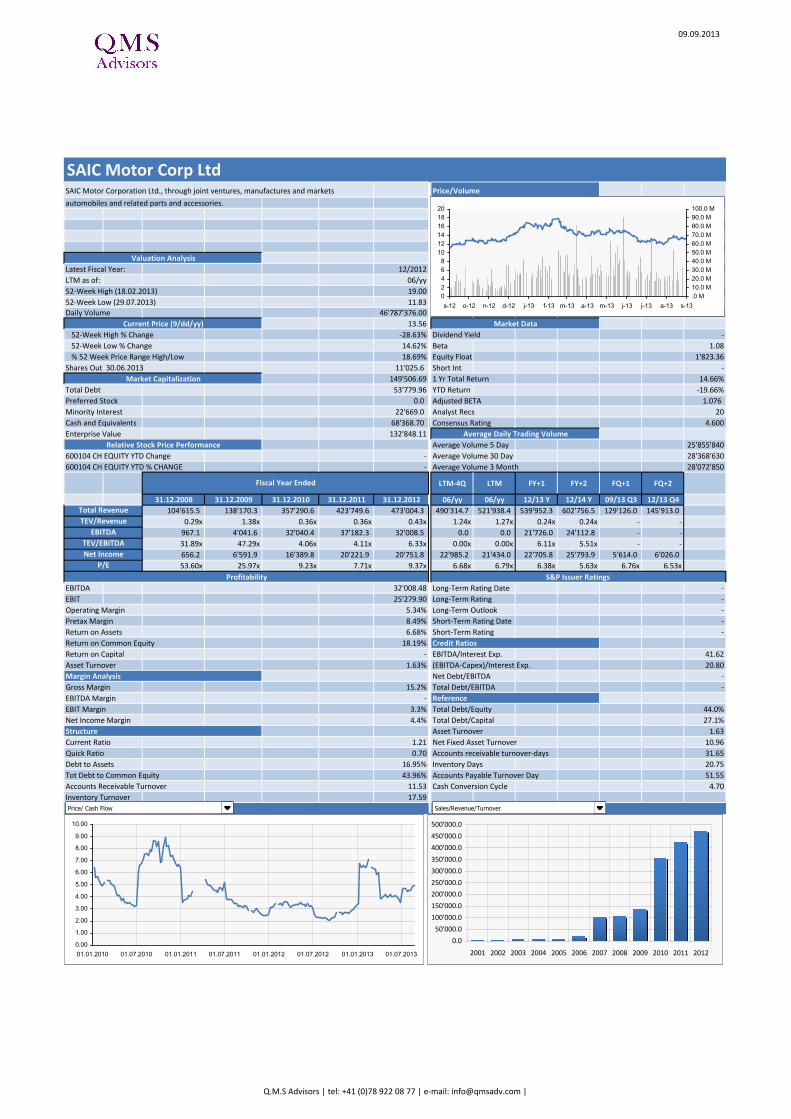
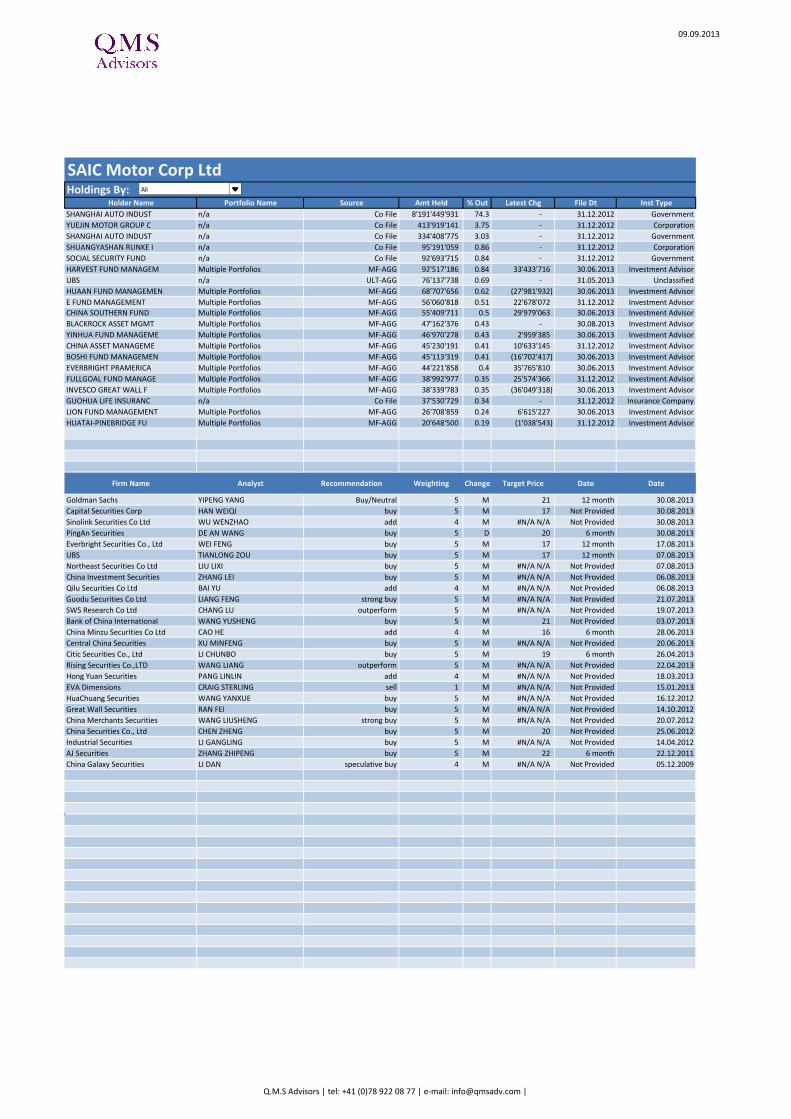
SAIC MOTOR CORPORATION LTD-A CNY 24425 46787 11026 9 0 4 11 21.70 77276 85270 88213 98474 5229 - - - 0.30 0.32 0.35 0.39 1.14 - 1.04 0.92 1.90 7.05 -2.27 12.25 - - - - -
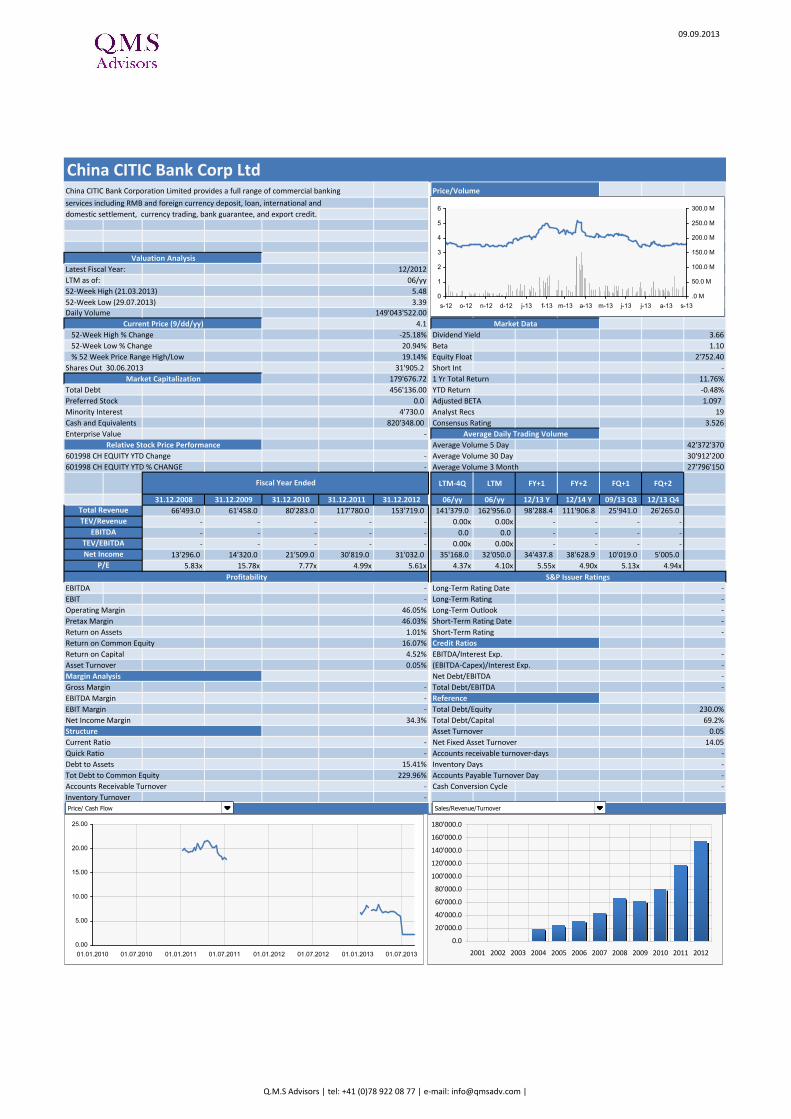
CHINA CITIC BANK CORP LTD-A CNY 29354 149044 46787 75 0 1 134 25113 26620 16058 18282 - - - - 0.11 0.11 0.12 0.14 0.97 0.98 0.91 0.80 4.99 3.89 - - - - - - -
CHINA YANGTZE POWER CO LTD-A CNY 18384 27677 16500 11 0 0 0 27.86 4132 4079 4031 4153 3508 - - - 0.10 0.10 0.10 0.10 1.78 - 1.85 1.75 3.96 4.44 3.86 3.89 - - - - -
CHINA EVERBRIGHT BANK CO-A CNY 19554 441947 40435 111 0 0 114 18647 20327 11225 12928 - - - - 0.09 0.10 0.10 0.12 0.76 - 0.77 0.68 5.62 - - - - NR 11.07.2006 - -
CITIC SECURITIES CO-A CNY 21469 264873 11017 12 0 0 4 19.87 2131 2423 2477 3176 1049 - - - 0.06 0.06 0.08 0.10 5.20 - 4.08 3.10 1.76 -1.04 25.69 -3.51 - BBB+ 18.10.2012 - -
CHINA PACIFIC INSURANCE GR-A CNY 29464 60661 9062 11 0 0 4 13.80 27307 27307 30917 34748 - - - - 0.10 0.10 0.16 0.19 5.13 5.15 3.16 2.61 1.23 3.55 - - - - - - -
DAQIN RAILWAY CO LTD -A CNY 17803 52696 14867 3 0 0 1 19.21 7287 7615 7982 8487 2956 - - - 0.13 0.13 0.14 0.15 1.49 - 1.40 1.28 0.42 2.85 -0.59 1.69 - - - - -
SHANGHAI INTERNATIONAL POR-A CNY 24610 536575 22755 3 0 1 1 27.64 4599 4618 5044 5489 1545 - 489 489 0.03 0.04 0.04 0.04 4.67 - 4.60 4.19 5.14 1.70 -1.16 1.01 - - - - -
CHINA STATE CONSTRUCTION -A CNY 16174 251283 30000 29 0 6 19 36.18 89766 89766 106312 120560 5548 5548 - - 0.08 0.08 0.10 0.12 1.04 1.10 0.88 0.77 2.68 4.57 2.43 4.00 1.01 - - - -
HAITONG SECURITIES CO LTD-A CNY 18962 501455 9585 4 0 0 9 15.05 1613 1840 1840 2168 829 - - - - 0.06 0.08 0.09 5.43 - 4.47 3.73 -0.72 - 0.24 -1.33 - - - - -
GREAT WALL MOTOR CO LTD-A CNY 21101 3109 3042 1 0 0 1 20.61 6791 6791 9274 11585 1232 1232 - - - 0.31 0.44 0.56 4.16 - 2.86 2.27 7.05 6.94 9.65 - 2.96 - - - -
INNER MONGOLIA YILI INDUS-A CNY 13340 8816 1599 0 0 0 0 12.36 6819 7281 7907 9120 419 - 213 213 - 0.25 0.21 0.25 4.32 - 5.07 4.28 1.99 2.10 2.90 6.01 - - - - -
POLY REAL ESTATE GROUP CO -A CNY 12583 121003 7138 13 0 2 5 24.06 9931 11495 14693 18427 2315 - - - 0.19 0.21 0.25 0.31 1.35 - 1.17 0.92 7.33 6.79 5.50 8.26 - BBB+ 14.06.2013 - -
BANK OF BEIJING CO LTD -A CNY 12422 91950 8800 53 0 0 61 9369 9716 5313 6275 - - - - 0.23 0.24 0.26 0.30 0.95 - 0.90 0.77 7.15 4.59 - - - - - - -
INNER MONGOLIA BAOTOU STEE-A CNY 11629 49249 2422 1 0 1 0 12.51 1492 1265 1373 1540 403 - - - 0.10 0.07 0.10 0.11 11.72 - 8.24 7.17 -3.21 9.65 - - - - - - -
BAOSHAN IRON & STEEL CO-A CNY 12433 79673 17098 9 0 1 1 22.20 31237 30917 29368 30215 2758 - 718 718 0.04 0.04 0.07 0.08 2.77 - 1.88 1.57 -2.29 0.46 -3.47 -1.92 - - - - -
CHINA UNITED NETWORK-A CNY 11462 191148 21197 17 0 23 3 48.07 40668 44363 48502 55569 12079 - - - 0.01 0.02 0.03 0.04 3.84 - 3.30 2.32 3.11 1.31 2.31 -0.02 - - - - -
CHINA SHIPBUILDING INDUSTR-A CNY 0 14668 11 0 0 11 9532 8873 9755 10583 716 - - - 0.03 0.03 0.05 0.05 - - -1.59 - -4.69 4.77 - - - - -
HUAXIA BANK CO LTD-A CNY 11289 139679 8905 58 0 0 96 12780 12852 7376 8526 - - - - 0.23 0.24 0.26 0.30 0.87 - 0.79 0.70 2.97 3.09 - - - NR 11.07.2006 - -
ANHUI CONCH CEMENT CO LTD-A CNY 15083 28533 5299 4 0 0 1 17.81 7477 7972 8858 10189 2021 2161 490 490 0.19 0.20 0.25 0.30 2.17 2.14 1.72 1.44 -0.97 3.34 -5.57 3.06 4.43 - - - -
HUANENG POWER INTL INC-A CNY 12655 27980 14055 27 0 2 2 34.20 21777 21234 22066 22902 4816 5607 - - 0.07 0.10 0.12 0.12 1.39 1.26 1.25 1.20 0.04 2.73 6.37 2.38 4.31 NR 14.04.2010 - -
SANY HEAVY INDUSTRY CO LTD-A CNY 9432 54078 7594 4 0 0 2 12.81 7624 6035 7081 9423 1418 - - - 0.11 0.07 0.12 0.18 2.97 - 1.64 1.15 -1.25 4.52 -3.80 5.95 - - - - -
CHINA MERCHANTS SECURITIES-A CNY 9016 62709 4661 2 0 0 5 7.40 1025 1112 891 1065 469 - - - 0.06 0.06 0.07 0.09 5.17 - 4.35 3.47 -1.50 - -2.38 - - - - - -
CHINA OILFIELD SERVICES-A CNY 12462 6127 4495 5 0 0 2 15.77 3611 4008 4441 5020 1456 1564 280 280 0.17 0.19 0.21 0.24 2.40 2.37 2.26 1.94 3.26 3.44 1.50 2.95 6.38 A- 20.12.2012 - -
CHINA RAILWAY CONSTRUCTION-A CNY 10679 35044 12338 18 0 0 17 20.45 76764 76764 85420 90152 3870 3870 4323 4323 - 0.11 0.12 0.14 1.19 - 1.09 0.98 0.98 3.93 1.40 4.29 0.82 A- 03.05.2013 - -
HUATAI SECURITIES CO LTD-A CNY 8545 89135 5600 1 0 0 5 5.29 1205 1244 1217 1477 518 - - - 0.05 0.05 0.07 0.08 4.65 - 3.72 2.95 -1.42 - -1.10 - - - - - -
GUANGHUI ENERGY CO LTD-A CNY 8725 60247 5257 2 0 0 0 10.74 592 649 1474 2271 162 - - - 0.02 0.03 0.09 0.14 10.77 - 3.07 1.91 -2.85 3.06 -4.65 1.40 - - - - -
CHINA COAL ENERGY CO-A CNY 10663 18188 13259 8 0 2 4 18.88 14261 13443 13622 15576 2874 2635 - - 0.11 0.08 0.07 0.09 1.70 1.69 1.98 1.69 -0.64 1.97 -1.21 2.50 3.20 - - - -
CSR CORP LTD -A CNY 9397 81399 13803 4 0 1 2 11.46 14543 13712 15511 18081 1224 1021 242 242 0.05 0.04 0.05 0.06 2.57 - 2.23 1.81 1.95 3.68 0.40 5.66 1.22 - - - -
NEW CHINA LIFE INSURANCE C-A CNY 11210 24695 3120 12 0 0 4 18242 18242 20183 21991 - - - - 0.15 0.15 0.20 0.25 4.17 4.17 3.26 2.60 0.49 - - - - - - - -
CHINA COMMUNICATIONS CONST-A CNY 11598 44282 16175 24 0 2 11 30.05 48247 49740 53223 57051 4092 - 4558 4558 0.12 0.13 0.13 0.14 0.89 - 0.84 0.78 0.06 - 2.73 2.70 - - - - -
CHINA RAILWAY GROUP LTD-A CNY 10212 63353 21300 27 0 2 11 33.70 76070 84120 86500 93018 3279 3461 3735 3735 0.06 0.06 0.06 0.07 1.16 - 1.20 1.07 0.86 3.72 0.94 3.69 0.67 BBB+ 23.01.2013 - -
DATANG INTL POWER GEN CO-A CNY 9014 8199 13310 29 0 2 1 42.08 12677 12639 12856 14214 3647 3928 - - 0.05 0.06 0.05 0.06 2.12 2.26 2.31 2.02 1.18 2.74 3.73 1.90 5.08 - - - -
CHINA CNR CORP LTD-A CNY 7284 71046 10320 3 0 0 2 11.96 15024 14046 16053 18073 1008 - 213 213 0.05 0.05 0.06 0.07 2.20 - 1.93 1.68 0.53 - 1.70 - - - - - -
JIANGSU HENGRUI MEDICINE C-A CNY 7276 4921 1360 0 0 0 0 7.05 872 930 1056 1298 231 - 71 71 0.13 0.14 0.15 0.20 6.26 - 5.75 4.38 3.13 3.27 4.41 4.45 - - - - -
TASLY PHARMACEUTICAL GROUP-A CNY 7084 7164 1033 0 0 0 0 7.36 1509 1708 1943 2334 195 - 262 262 0.12 0.17 0.18 0.22 6.48 - 6.38 5.01 6.79 4.35 6.68 3.89 - - - - -
Valuation Measures I/II
Market Capitalization & Asset Liability data Total Revenue EBITDA Earnings Per Share Price/Earnings ratio Rev. Growth EBITDA Growth
Q.M.S Advisors | tel: +41 (0)78 922 08 77 | e-mail: [email protected] |
Page 3
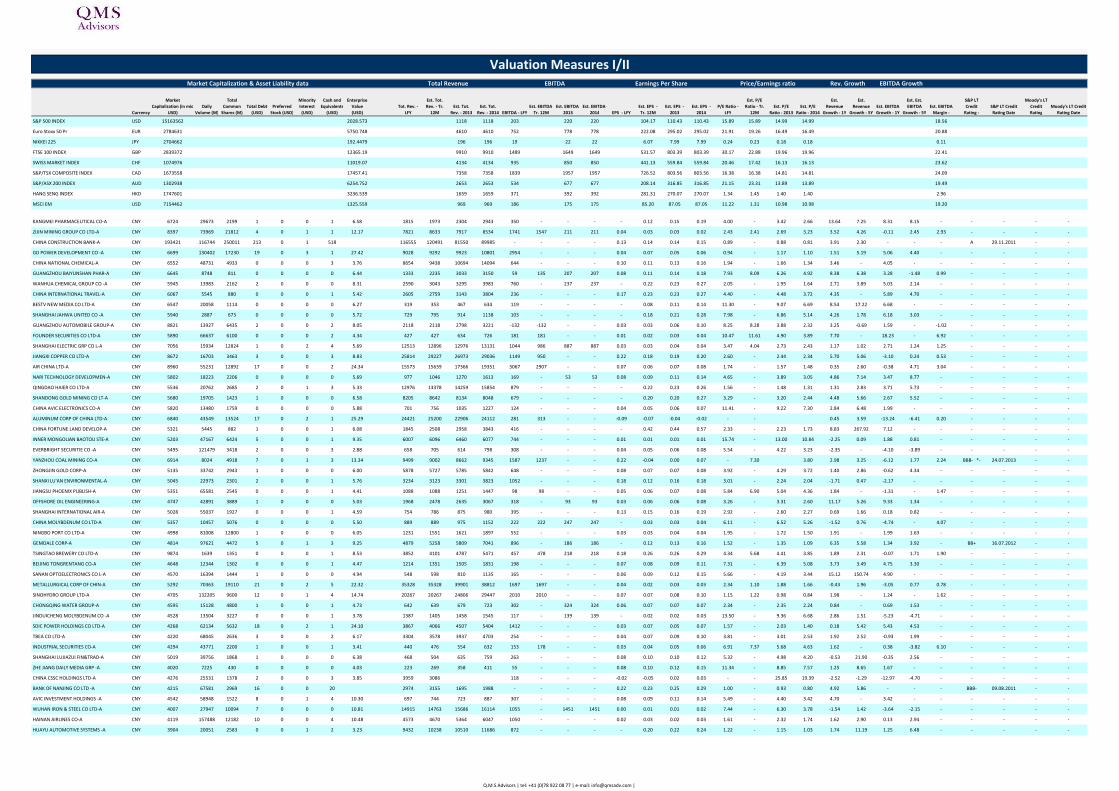
Currency
Market
Capitalization (in mio
USD)
Daily
Volume (M)
Total
Common
Shares (M)
Total Debt
(USD)
Preferred
Stock (USD)
Minority
Interest
(USD)
Cash and
Equivalents
(USD)
Enterprise
Value
(USD)
Tot. Rev. -
LFY
Est. Tot.
Rev. - Tr.
12M
Est. Tot.
Rev. - 2013
Est. Tot.
Rev. - 2014 EBITDA - LFY
Est. EBITDA -
Tr. 12M
Est. EBITDA -
2013
Est. EBITDA -
2014 EPS - LFY
Est. EPS -
Tr. 12M
Est. EPS -
2013
Est. EPS -
2014
P/E Ratio -
LFY
Est. P/E
Ratio - Tr.
12M
Est. P/E
Ratio - 2013
Est. P/E
Ratio - 2014
Est.
Revenue
Growth - 1Y
Est.
Revenue
Growth - 5Y
Est. EBITDA
Growth - 1Y
Est. Est.
EBITDA
Growth - 5Y
Est. EBITDA
Margin -
S&P LT
Credit
Rating -
S&P LT Credit
Rating Date
Moody's LT
Credit
Rating
Moody's LT Credit
Rating Date
S&P 500 INDEX USD 15163562 2028.573 1118 1118 203 220 220 104.17 110.43 110.43 15.89 15.89 14.99 14.99 18.56
Euro Stoxx 50 Pr EUR 2784631 5750.748 4610 4610 752 778 778 222.08 295.02 295.02 21.91 19.26 16.49 16.49 20.88
NIKKEI 225 JPY 2704662 192.4479 196 196 19 22 22 6.07 7.99 7.99 0.24 0.23 0.18 0.18 0.11
FTSE 100 INDEX GBP 2839372 12365.19 9910 9910 1489 1649 1649 531.57 803.39 803.39 30.17 22.88 19.96 19.96 22.41
SWISS MARKET INDEX CHF 1074976 11019.07 4134 4134 935 850 850 441.13 559.84 559.84 20.46 17.42 16.13 16.13 23.62
S&P/TSX COMPOSITE INDEX CAD 1673558 17457.41 7358 7358 1839 1957 1957 726.52 803.56 803.56 16.38 16.38 14.81 14.81 24.09
S&P/ASX 200 INDEX AUD 1302938 6254.752 2653 2653 534 677 677 208.14 316.85 316.85 21.15 23.31 13.89 13.89 19.49
HANG SENG INDEX HKD 1747601 3236.539 1659 1659 371 392 392 281.31 270.07 270.07 1.34 1.45 1.40 1.40 2.96
MSCI EM USD 7154462 1325.559 969 969 186 175 175 85.20 87.05 87.05 11.22 1.31 10.98 10.98 19.20
KANGMEI PHARMACEUTICAL CO-A CNY 6724 29673 2199 1 0 0 1 6.58 1815 1973 2304 2943 350 - - - - 0.12 0.15 0.19 4.00 - 3.42 2.66 13.64 7.25 8.31 8.15 - - - - -
ZIJIN MINING GROUP CO LTD-A CNY 8397 73969 21812 4 0 1 1 12.17 7821 8633 7917 8534 1741 1547 211 211 0.04 0.03 0.03 0.02 2.43 2.41 2.69 3.23 3.52 4.26 -0.11 2.45 2.93 - - - -
CHINA CONSTRUCTION BANK-A CNY 193421 116744 250011 213 0 1 518 116555 120491 81550 89985 - - - - 0.13 0.14 0.14 0.15 0.89 - 0.88 0.81 3.91 2.30 - - - A 29.11.2011 - -
GD POWER DEVELOPMENT CO -A CNY 6699 130402 17230 19 0 3 1 27.42 9028 9292 9923 10801 2954 - - - 0.04 0.07 0.05 0.06 0.94 - 1.17 1.10 1.51 5.19 5.06 4.40 - - - - -
CHINA NATIONAL CHEMICAL-A CNY 6552 48731 4933 0 0 0 3 3.76 8654 9438 10694 14094 644 - - - 0.10 0.11 0.13 0.16 1.94 - 1.66 1.34 3.46 - 4.05 - - - - - -
GUANGZHOU BAIYUNSHAN PHAR-A CNY 6645 8748 811 0 0 0 0 6.44 1333 2235 3033 3150 59 135 207 207 0.08 0.11 0.14 0.18 7.93 8.09 6.26 4.92 8.38 6.38 3.28 -1.48 0.99 - - - -
WANHUA CHEMICAL GROUP CO -A CNY 5945 13983 2162 2 0 0 0 8.31 2590 3043 3295 3983 760 - 237 237 - 0.22 0.23 0.27 2.05 - 1.95 1.64 2.71 3.89 5.03 2.14 - - - - -
CHINA INTERNATIONAL TRAVEL-A CNY 6067 5545 880 0 0 0 1 5.42 2605 2759 3143 3804 236 - - - 0.17 0.23 0.23 0.27 4.40 - 4.48 3.72 4.35 - 5.89 4.70 - - - - -
BESTV NEW MEDIA CO LTD-A CNY 6547 20058 1114 0 0 0 0 6.27 319 353 467 634 119 - - - - 0.08 0.11 0.14 11.30 - 9.07 6.69 8.54 17.22 6.68 - - - - - -
SHANGHAI JAHWA UNITED CO -A CNY 5940 2887 673 0 0 0 0 5.72 729 795 914 1138 103 - - - - 0.18 0.21 0.28 7.98 - 6.86 5.14 4.26 1.78 6.18 3.03 - - - - -
GUANGZHOU AUTOMOBILE GROUP-A CNY 8821 13927 6435 2 0 0 2 8.05 2118 2118 2798 3221 -132 -132 - - 0.03 0.03 0.06 0.10 8.25 8.28 3.88 2.32 3.25 -0.69 1.59 - -1.02 - - - -
FOUNDER SECURITIES CO LTD-A CNY 5890 66637 6100 0 0 0 2 4.34 427 427 634 726 181 181 - - 0.01 0.02 0.03 0.04 10.47 11.61 4.90 3.89 7.70 - 18.23 - 6.92 - - - -
SHANGHAI ELECTRIC GRP CO L-A CNY 7056 15934 12824 1 0 2 4 5.69 12513 12896 12976 13131 1044 986 887 887 0.03 0.03 0.04 0.04 3.47 4.04 2.73 2.43 1.17 1.02 2.71 1.24 1.25 - - - -
JIANGXI COPPER CO LTD-A CNY 8672 16703 3463 3 0 0 3 8.83 25814 29227 26973 29036 1149 950 - - 0.22 0.18 0.19 0.20 2.60 - 2.44 2.34 5.70 5.06 -3.10 0.24 0.53 - - - -
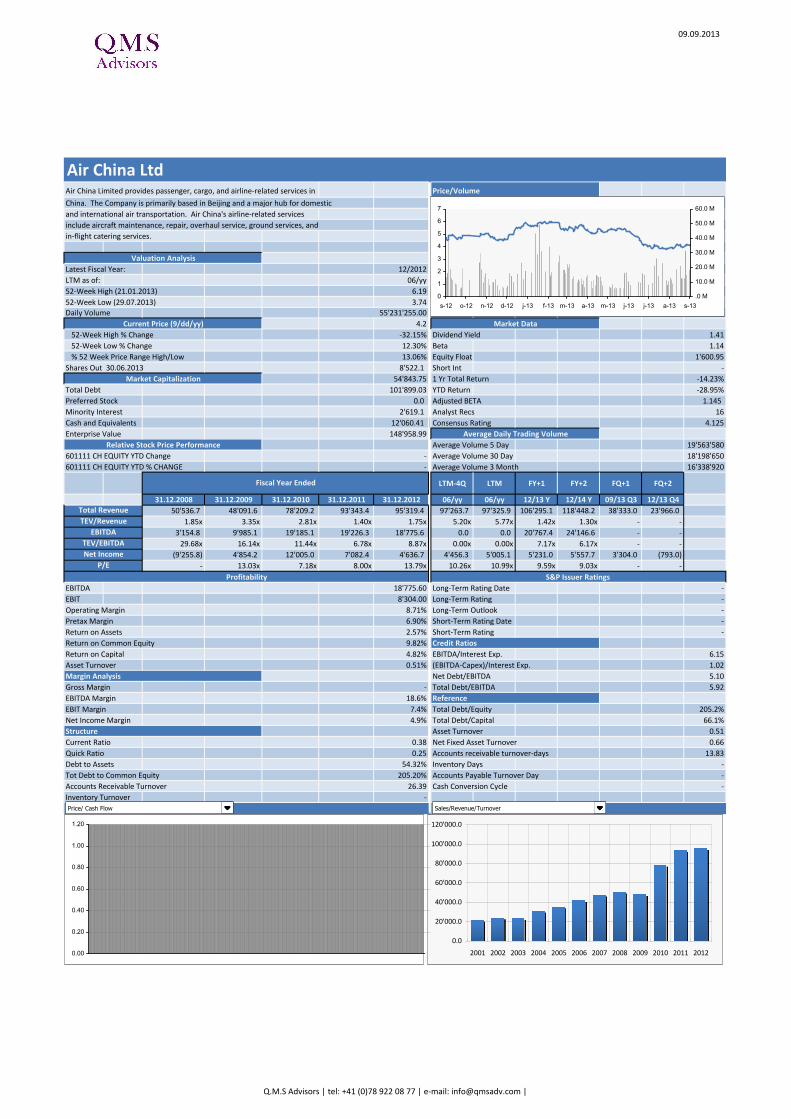
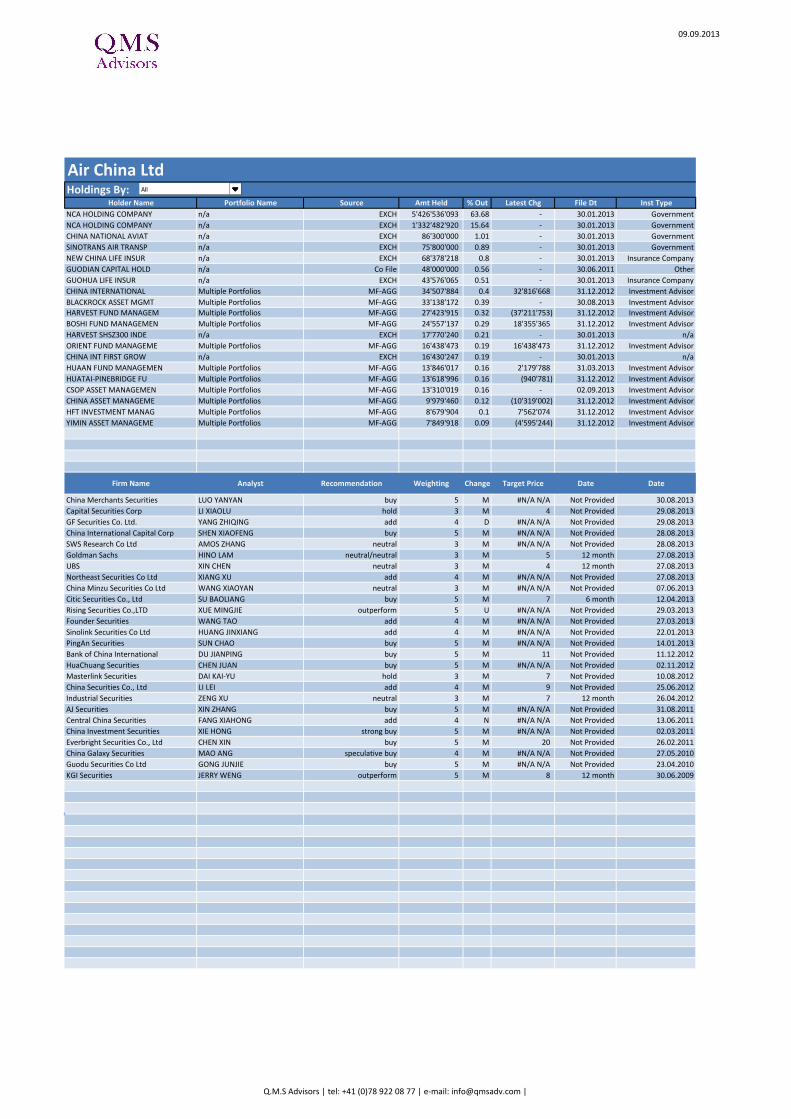
AIR CHINA LTD-A CNY 8960 55231 12892 17 0 0 2 24.34 15573 15639 17366 19351 3067 2907 - - 0.07 0.06 0.07 0.08 1.74 - 1.57 1.48 0.35 2.60 -0.38 4.71 3.04 - - - -
NARI TECHNOLOGY DEVELOPMEN-A CNY 5802 18223 2206 0 0 0 0 5.69 977 1046 1270 1613 169 - 53 53 0.08 0.09 0.11 0.14 4.65 - 3.89 3.05 4.86 7.14 3.47 8.77 - - - - -
QINGDAO HAIER CO LTD-A CNY 5536 20762 2685 2 0 1 3 5.33 12976 13378 14259 15854 879 - - - - 0.22 0.23 0.26 1.56 - 1.48 1.31 1.31 2.83 3.71 5.73 - - - - -
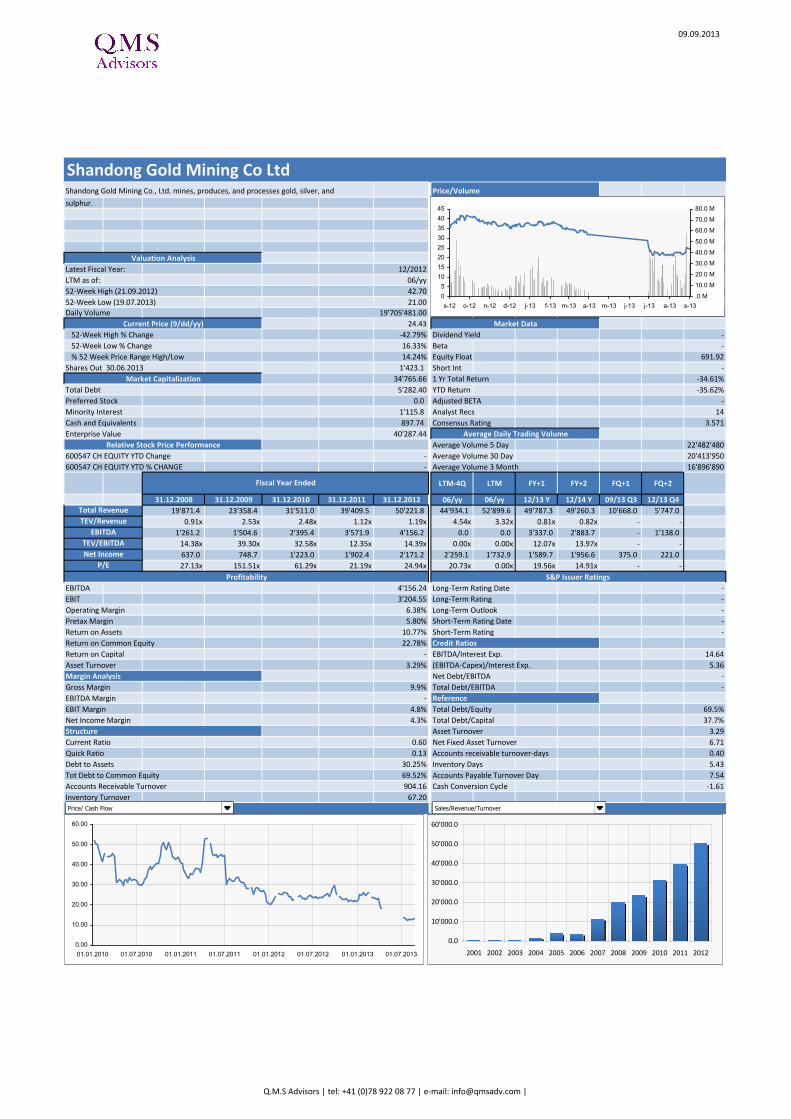
SHANDONG GOLD MINING CO LT-A CNY 5680 19705 1423 1 0 0 0 6.58 8205 8642 8134 8048 679 - - - - 0.20 0.20 0.27 3.29 - 3.20 2.44 4.48 5.66 2.67 5.52 - - - - -
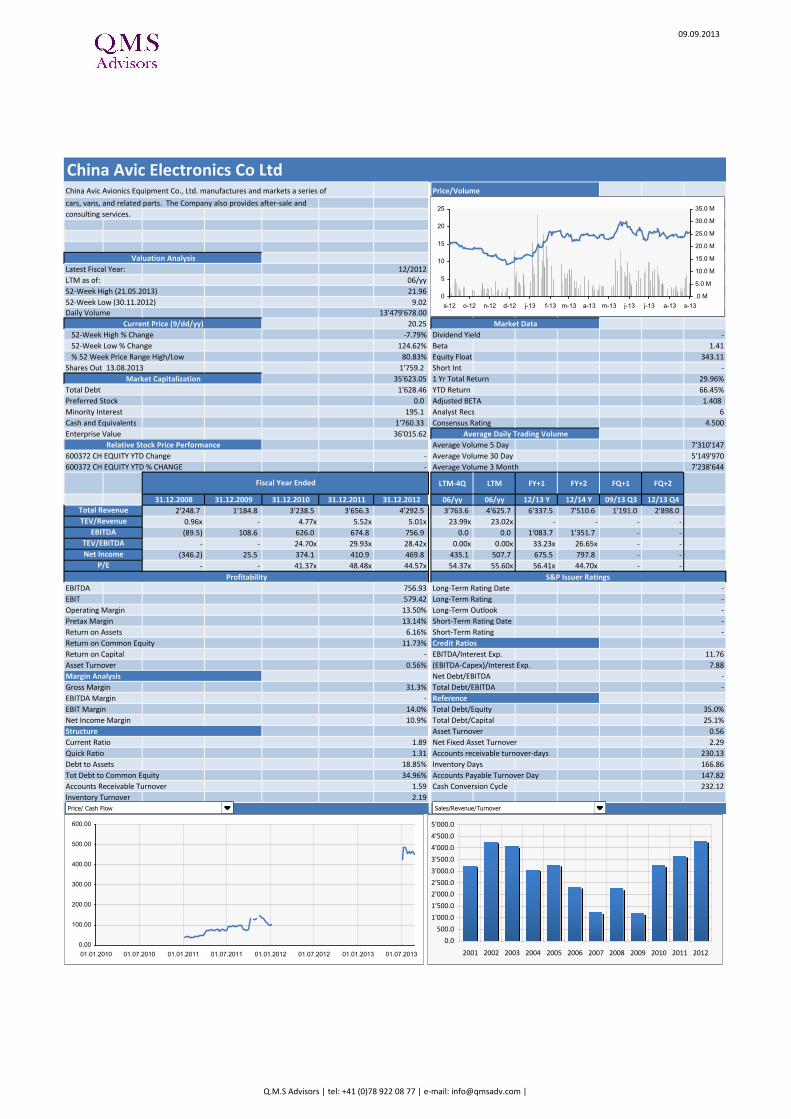
CHINA AVIC ELECTRONICS CO-A CNY 5820 13480 1759 0 0 0 0 5.88 701 756 1035 1227 124 - - - 0.04 0.05 0.06 0.07 11.41 - 9.22 7.30 2.84 6.48 1.99 - - - - - -
ALUMINUM CORP OF CHINA LTD-A CNY 6840 43549 13524 17 0 2 1 25.29 24421 25200 22906 24112 281 313 - - -0.09 -0.07 -0.04 -0.02 - - 0.45 3.59 -13.24 -6.41 0.20 - - - -
CHINA FORTUNE LAND DEVELOP-A CNY 5321 5445 882 1 0 0 1 6.08 1845 2508 2958 3843 416 - - - - 0.42 0.44 0.57 2.33 - 2.23 1.73 8.83 267.92 7.12 - - - - - -
INNER MONGOLIAN BAOTOU STE-A CNY 5203 47167 6424 5 0 0 1 9.35 6007 6096 6460 6077 744 - - - 0.01 0.01 0.01 0.01 15.74 - 13.00 10.84 -2.25 0.09 1.88 0.81 - - - - -
EVERBRIGHT SECURITIE CO -A CNY 5495 121479 3418 2 0 0 3 2.88 658 705 614 798 308 - - - 0.04 0.05 0.06 0.08 5.54 - 4.22 3.23 -2.35 - -4.10 -3.89 - - - - -
YANZHOU COAL MINING CO-A CNY 6914 8024 4918 7 0 1 3 13.34 9499 9002 8662 9345 1587 1237 - - 0.22 -0.04 0.00 0.07 - 7.30 3.80 2.98 3.25 -6.12 1.77 2.24 BBB- *- 24.07.2013 - -
ZHONGJIN GOLD CORP-A CNY 5135 33742 2943 1 0 0 0 6.00 5878 5727 5785 5842 648 - - - 0.08 0.07 0.07 0.08 3.92 - 4.29 3.72 1.40 2.86 -0.62 4.34 - - - - -
SHANXI LU'AN ENVIRONMENTAL-A CNY 5045 22973 2301 2 0 0 1 5.76 3234 3123 3301 3823 1052 - - - 0.18 0.12 0.16 0.18 3.01 - 2.24 2.04 -1.71 0.47 -2.17 - - - - - -
JIANGSU PHOENIX PUBLISH-A CNY 5351 65581 2545 0 0 0 1 4.41 1088 1088 1251 1447 98 98 - - 0.05 0.06 0.07 0.08 5.84 6.90 5.04 4.36 1.84 - -1.31 - 1.47 - - - -
OFFSHORE OIL ENGINEERING-A CNY 4747 42891 3889 1 0 0 0 5.03 1968 2478 2635 3067 318 - 93 93 0.03 0.06 0.06 0.08 3.26 - 3.31 2.60 11.17 5.26 9.33 1.34 - - - - -
SHANGHAI INTERNATIONAL AIR-A CNY 5028 55037 1927 0 0 0 1 4.59 754 786 875 980 395 - - - 0.13 0.15 0.16 0.19 2.92 - 2.60 2.27 0.69 1.66 0.18 0.82 - - - - -
CHINA MOLYBDENUM CO LTD-A CNY 5357 10457 5076 0 0 0 0 5.50 889 889 975 1152 222 222 247 247 - 0.03 0.03 0.04 6.11 - 6.52 5.26 -1.52 0.76 -4.74 - 4.07 - - - -
NINGBO PORT CO LTD-A CNY 4998 81008 12800 1 0 0 0 6.05 1231 1551 1621 1897 552 - - - 0.03 0.03 0.04 0.04 1.95 - 1.72 1.50 1.91 - 1.99 1.63 - - - - -
GEMDALE CORP-A CNY 4814 97621 4472 5 0 1 3 9.25 4879 5258 5809 7041 896 - 186 186 - 0.12 0.13 0.16 1.52 - 1.35 1.09 6.35 5.58 1.34 3.92 - BB+ 16.07.2012 - -
TSINGTAO BREWERY CO LTD-A CNY 9874 1639 1351 0 0 0 1 8.53 3852 4101 4787 5471 457 478 218 218 0.18 0.26 0.26 0.29 4.34 5.68 4.41 3.85 1.89 2.31 -0.07 1.71 1.90 - - - -
BEIJING TONGRENTANG CO-A CNY 4648 12344 1302 0 0 0 1 4.47 1214 1351 1505 1831 198 - - - 0.07 0.08 0.09 0.11 7.31 - 6.39 5.08 3.73 3.49 4.75 3.30 - - - - -
SANAN OPTOELECTRONICS CO L-A CNY 4570 16394 1444 1 0 0 0 4.94 548 598 810 1135 165 - - - 0.06 0.09 0.12 0.15 5.66 - 4.19 3.44 15.12 150.74 4.90 - - - - - -
METALLURGICAL CORP OF CHIN-A CNY 5292 70363 19110 21 0 2 5 22.32 35328 35328 39901 38812 1697 1697 - - 0.04 0.02 0.03 0.03 2.34 1.10 1.88 1.66 -0.43 1.96 -3.05 0.77 0.78 - - - -
SINOHYDRO GROUP LTD-A CNY 4705 132205 9600 12 0 1 4 14.74 20267 20267 24806 29447 2010 2010 - - 0.07 0.07 0.08 0.10 1.15 1.22 0.98 0.84 1.98 - 1.24 - 1.62 - - - -
CHONGQING WATER GROUP-A CNY 4595 15128 4800 1 0 0 1 4.73 642 639 679 723 302 - 324 324 0.06 0.07 0.07 0.07 2.34 - 2.35 2.24 0.84 - 0.69 1.53 - - - - -
JINDUICHENG MOLYBDENUM CO -A CNY 4528 13504 3227 0 0 0 1 3.78 1387 1405 1458 1545 117 - 139 139 - 0.02 0.02 0.03 13.50 - 9.36 6.68 2.86 1.51 -5.23 -4.71 - - - - -
SDIC POWER HOLDINGS CO LTD-A CNY 4268 62134 5632 18 0 2 1 24.10 3867 4066 4507 5404 1412 - - - 0.03 0.07 0.05 0.07 1.57 - 2.03 1.40 0.18 5.42 5.43 4.53 - - - - -
TBEA CO LTD-A CNY 4220 68045 2636 3 0 0 2 6.17 3304 3578 3937 4703 254 - - - 0.04 0.07 0.09 0.10 3.81 - 3.01 2.53 1.92 2.52 -0.93 1.99 - - - - -
INDUSTRIAL SECURITIES CO-A CNY 4294 43771 2200 1 0 0 1 3.41 440 476 554 632 153 178 - - 0.03 0.04 0.05 0.06 6.91 7.37 5.68 4.63 1.62 - 0.38 -3.82 6.10 - - - -
SHANGHAI LUJIAZUI FIN&TRAD-A CNY 5019 39756 1868 1 0 0 0 6.38 468 504 635 759 263 - - - 0.08 0.10 0.10 0.12 5.32 - 4.98 4.20 -0.53 21.90 -0.35 2.56 - - - - -
ZHE JIANG DAILY MEDIA GRP -A CNY 4020 7225 430 0 0 0 0 4.03 223 269 358 411 55 - - - 0.08 0.10 0.12 0.15 11.34 - 8.85 7.57 1.25 8.65 1.67 - - - - - -
CHINA CSSC HOLDINGS LTD-A CNY 4276 25531 1378 2 0 0 3 3.85 3959 3086 118 - - - -0.02 -0.05 0.02 0.03 - - 25.85 19.39 -2.52 -1.29 -12.97 -4.70 - - - - -
BANK OF NANJING CO LTD -A CNY 4215 67581 2969 16 0 0 20 2974 3155 1695 1988 - - - - 0.22 0.23 0.25 0.29 1.00 - 0.93 0.80 4.92 5.86 - - - BBB- 09.08.2011 - -
AVIC INVESTMENT HOLDINGS -A CNY 4542 58948 1522 8 0 1 4 10.30 697 744 723 887 307 - - - 0.08 0.09 0.11 0.14 5.49 - 4.40 3.42 4.70 - 3.42 - - - - - -
WUHAN IRON & STEEL CO LTD-A CNY 4007 27947 10094 7 0 0 0 10.81 14915 14763 15686 16114 1055 - 1451 1451 0.00 0.01 0.01 0.02 7.44 - 6.30 3.78 -1.54 1.42 -3.64 -2.15 - - - - -
HAINAN AIRLINES CO-A CNY 4119 157488 12182 10 0 0 4 10.48 4573 4670 5364 6047 1050 - - - 0.02 0.03 0.02 0.03 1.61 - 2.32 1.74 1.62 2.90 0.13 2.94 - - - - -
HUAYU AUTOMOTIVE SYSTEMS -A CNY 3904 20051 2583 0 0 1 2 3.23 9432 10238 10510 11686 872 - - - - 0.20 0.22 0.24 1.22 - 1.15 1.03 1.74 11.19 1.25 6.48 - - - - -
Valuation Measures I/II
Market Capitalization & Asset Liability data Total Revenue EBITDA Earnings Per Share Price/Earnings ratio Rev. Growth EBITDA Growth
Q.M.S Advisors | tel: +41 (0)78 922 08 77 | e-mail: [email protected] |
Page 4
Currency
Market
Capitalization (in mio
USD)
Daily
Volume (M)
Total
Common
Shares (M)
Total Debt
(USD)
Preferred
Stock (USD)
Minority
Interest
(USD)
Cash and
Equivalents
(USD)
Enterprise
Value
(USD)
Tot. Rev. -
LFY
Est. Tot.
Rev. - Tr.
12M
Est. Tot.
Rev. - 2013
Est. Tot.
Rev. - 2014 EBITDA - LFY
Est. EBITDA -
Tr. 12M
Est. EBITDA -
2013
Est. EBITDA -
2014 EPS - LFY
Est. EPS -
Tr. 12M
Est. EPS -
2013
Est. EPS -
2014
P/E Ratio -
LFY
Est. P/E
Ratio - Tr.
12M
Est. P/E
Ratio - 2013
Est. P/E
Ratio - 2014
Est.
Revenue
Growth - 1Y
Est.
Revenue
Growth - 5Y
Est. EBITDA
Growth - 1Y
Est. Est.
EBITDA
Growth - 5Y
Est. EBITDA
Margin -
S&P LT
Credit
Rating -
S&P LT Credit
Rating Date
Moody's LT
Credit
Rating
Moody's LT Credit
Rating Date
S&P 500 INDEX USD 15163562 2028.573 1118 1118 203 220 220 104.17 110.43 110.43 15.89 15.89 14.99 14.99 18.56
Euro Stoxx 50 Pr EUR 2784631 5750.748 4610 4610 752 778 778 222.08 295.02 295.02 21.91 19.26 16.49 16.49 20.88
NIKKEI 225 JPY 2704662 192.4479 196 196 19 22 22 6.07 7.99 7.99 0.24 0.23 0.18 0.18 0.11
FTSE 100 INDEX GBP 2839372 12365.19 9910 9910 1489 1649 1649 531.57 803.39 803.39 30.17 22.88 19.96 19.96 22.41
SWISS MARKET INDEX CHF 1074976 11019.07 4134 4134 935 850 850 441.13 559.84 559.84 20.46 17.42 16.13 16.13 23.62
S&P/TSX COMPOSITE INDEX CAD 1673558 17457.41 7358 7358 1839 1957 1957 726.52 803.56 803.56 16.38 16.38 14.81 14.81 24.09
S&P/ASX 200 INDEX AUD 1302938 6254.752 2653 2653 534 677 677 208.14 316.85 316.85 21.15 23.31 13.89 13.89 19.49
HANG SENG INDEX HKD 1747601 3236.539 1659 1659 371 392 392 281.31 270.07 270.07 1.34 1.45 1.40 1.40 2.96
MSCI EM USD 7154462 1325.559 969 969 186 175 175 85.20 87.05 87.05 11.22 1.31 10.98 10.98 19.20
ZHENGZHOU YUTONG BUS CO -A CNY 3977 14275 1270 0 0 0 0 3.63 3210 3433 3731 4282 299 - - - 0.19 0.21 0.23 0.27 2.45 - 2.26 1.92 2.71 2.83 2.89 3.72 - - - - -
CHINA COSCO HOLDINGS-A CNY 5635 26867 10216 15 0 3 8 16.07 14431 12397 11827 13001 -635 -447 - - -0.15 -0.09 -0.01 -0.01 - - 0.71 -1.26 9.06 - -0.59 - - - -
HENAN DAYOU ENERGY CO LTD-A CNY 3808 6415 2391 0 0 0 1 3.52 2052 2159 2320 2469 477 - - - 0.11 0.15 0.13 0.14 1.76 - 1.99 1.89 0.73 202.15 -4.26 25.22 - - - - -
SOUTHWEST SECURITIES CO LT-A CNY 3851 36641 2323 0 0 1 3.81 262 287 277 328 102 - - - 0.02 0.03 0.04 0.05 10.12 - 7.18 5.84 4.38 - 8.10 - - - - - -
SICHUAN CHUANTOU ENERGY CO-A CNY 3722 9739 1973 1 0 0 0 4.70 184 190 194 199 109 - - - 0.03 0.08 0.09 0.16 3.92 - 3.34 1.93 -0.20 2.31 -0.27 7.24 - - - - -
CHINA EASTERN AIRLINES CO-A CNY 5564 118542 11277 11 0 0 0 16.29 13928 14101 15097 16877 1862 1533 - - 0.04 0.04 0.05 0.06 1.94 - 1.63 1.39 0.57 3.30 -0.39 5.22 1.78 - - - -
YANGQUAN COAL INDUSTRY GRP-A CNY 3709 19925 2405 1 0 0 1 3.81 11597 12762 12444 13083 862 - 666 666 0.16 0.11 0.11 0.12 2.29 - 2.24 2.04 6.78 7.05 -0.92 - - - - - -
ZHEJIANG CHINT ELECTRICS-A CNY 3540 1350 1005 0 0 0 1 3.52 1737 1910 2021 2416 295 - 369 369 0.19 0.23 0.23 0.28 2.47 - 2.52 2.08 1.62 - 7.01 - - - - - -
CHINA HAINAN RUBBER INDUST-A CNY 4579 241899 3931 0 0 0 0 4.45 1906 1906 1925 2459 81 81 - - 0.01 0.01 0.02 0.03 15.53 19.44 10.13 7.06 1.78 4.77 -8.82 - 0.70 - - - -
BRIGHT DAIRY & FOOD CO LTD-A CNY 3993 15071 1225 0 0 0 0 4.01 2239 2399 2647 3078 130 - - - - 0.05 0.06 0.09 10.63 - 8.54 5.94 2.76 2.57 7.46 6.16 - - - - -
SHANGHAI FOSUN PHARMACEUTI-A CNY 4157 21679 2240 1 0 0 1 4.87 1189 1354 1464 1783 142 - 368 368 0.07 0.16 0.14 0.16 1.98 - 2.21 1.92 2.15 3.02 6.76 3.86 - - - - -
UNIVERSAL SCIENTIFIC INDUS-A CNY 4013 6605 1012 0 0 0 0 3.85 2177 2177 2511 2897 153 153 190 190 - 0.11 0.13 0.15 6.10 - 5.02 4.30 0.81 - 3.91 - 1.14 - - - -
SHANGHAI PHARMACEUTICALS-A CNY 5079 26525 2689 1 0 1 2 4.81 11122 11922 13010 15225 516 - 158 158 0.12 0.14 0.14 0.16 2.21 - 2.26 1.99 3.92 6.71 0.68 9.06 - - - - -
SHANGHAI CHENGTOU HOLDING-A CNY 3636 44300 2988 2 0 0 0 5.31 794 1018 125 - - - 0.03 0.04 0.09 0.13 4.43 - 2.10 1.58 1.60 3.77 -1.85 -0.58 - - - - -
JIANGSU EXPRESSWAY CO LTD-A CNY 4917 2781 5038 1 0 0 0 5.52 1239 1229 1287 1428 706 - 192 192 - 0.08 0.08 0.09 1.86 - 1.86 1.73 0.84 1.15 -0.22 0.58 - - - - -
CHENGDU DR PENG TELECOM-A CNY 3631 64607 1339 0 0 0 0 3.66 405 641 913 1075 70 - - - 0.02 0.04 0.06 0.07 11.18 - 7.77 6.17 2.59 5.05 0.80 1.74 - - - - -
XINHU ZHONGBAO CO LTD-A CNY 3497 78642 6259 3 0 0 1 5.52 1583 1700 1931 2575 472 - - - 0.05 0.06 0.07 0.10 1.55 - 1.30 0.96 8.78 5.67 30.72 7.26 - - - - -
CHINA SOUTH PUBLISHING -A CNY 3688 20441 1796 0 0 0 1 2.57 1120 1120 1294 1489 133 133 - - 0.08 0.08 0.10 0.11 3.95 4.22 3.45 2.93 3.00 - 1.31 - 1.94 - - - -
SHANGHAI ORIENTAL PEARL-A CNY 3498 70284 3186 0 0 0 0 3.74 500 518 128 - - - 0.02 0.03 0.05 0.05 6.16 - 3.72 3.28 3.79 1.62 1.13 0.86 - - - - -
LIAONING CHENG DA CO LTD-A CNY 3293 17967 1365 0 0 0 0 3.66 1677 1550 114 - - - - 0.07 0.14 0.15 5.64 - 2.87 2.62 1.06 2.97 -2.05 2.38 - - - - -
XIAMEN TUNGSTEN CO LTD-A CNY 3312 7275 682 0 0 0 0 4.14 1399 1259 1478 1752 253 - 232 232 0.12 0.06 0.11 0.19 12.21 - 6.93 4.26 -3.81 5.35 -6.43 4.00 - - - - -
SHENERGY COMPANY LIMITED-A CNY 3354 60849 4607 1 0 1 1 4.58 3910 3979 4124 4281 545 - - - - 0.07 0.08 0.08 1.64 - 1.50 1.58 0.92 - 3.42 0.88 - - - - -
SINOPEC SHANGHAI PETROCHE-A CNY 4197 33383 7200 2 0 0 0 5.74 14249 15651 17268 18185 -26 342 - - -0.03 0.00 0.03 0.03 75.88 66.62 4.04 3.25 -0.42 2.84 - - 0.36 - - - -
ZHANGZHOU PIENTZEHUANG PHA-A CNY 3135 1078 140 0 0 0 0 3.16 189 212 230 274 69 - 89 89 0.37 0.47 0.46 0.59 6.77 - 6.88 5.39 2.36 2.98 5.07 3.92 - - - - -
CHINA SOUTHERN AIRLINES CO-A CNY 4403 86204 9818 12 0 1 2 17.35 16258 16137 17811 19781 2181 2644 - - 0.04 0.04 0.06 0.06 1.85 1.86 1.31 1.39 1.65 2.11 1.13 2.16 2.68 - - - -
XI'AN AERO-ENGINE PLC -A CNY 3291 24211 1090 1 0 0 0 3.63 1159 1214 1445 1676 113 - 128 128 - 0.05 0.06 0.08 10.31 - 8.44 6.52 0.72 1.92 0.41 1.68 - - - - -
PEOPLE.CN CO LTD-A CNY 3471 5210 276 0 0 0 0 3.15 110 110 165 233 31 31 9 9 - 0.14 0.18 0.24 15.13 - 11.58 8.58 7.25 - - - 4.58 - - - -
TSINGHUA TONGFANG CO LTD-A CNY 3163 41817 1988 2 0 0 1 4.68 3624 3577 200 - - - 0.02 0.07 0.06 0.07 3.25 - 4.05 3.60 1.08 1.91 4.32 1.13 - - - - -
HUADIAN POWER INTL CORP-A CNY 3576 45136 7371 19 0 1 0 21.15 9652 9971 10532 11046 3324 3360 - - 0.03 0.06 0.07 0.06 1.32 - 1.24 1.32 1.44 2.53 21.28 4.00 5.51 - - - -
GUANGDONG GUANHAO HIGH-TEC-A CNY 0 1190 0 0 0 0 151 153 20 - - - 0.01 0.03 0.02 0.02 - - -0.04 0.79 -0.75 3.40 - - - - -
ZHEJIANG LONGSHENG GROUP C-A CNY 2852 33966 1468 1 0 0 0 3.58 1237 1736 2209 2509 146 - 319 319 0.02 0.12 0.13 0.16 2.55 - 2.43 1.99 -1.21 4.18 -3.36 1.53 - - - - -
DONGFANG ELECTRIC CORP LTD-A CNY 3611 21291 2004 1 0 0 1 3.22 6175 6250 6569 6818 585 560 606 606 - 0.17 0.18 0.19 1.76 - 1.68 1.59 -1.87 1.87 -3.59 0.57 1.46 - - - -
CHINA XD ELECTRIC CO LTD-A CNY 3048 19276 4357 0 0 0 1 2.70 2043 2124 2438 2795 91 - 147 147 - 0.02 0.02 0.03 6.15 - 5.41 3.42 2.03 - - - - - - - -
BEIJING JINGNENG THERMAL-A CNY 2972 6409 1947 2 0 0 0 4.65 1624 2149 1744 1827 567 - - - - 0.27 0.14 0.14 0.78 - 1.55 1.46 2.88 12.14 4.67 8.96 - - - - -
FIBERHOME TELECOM TECH CO-A CNY 2952 21208 965 0 0 0 1 3.21 1329 1434 1601 1985 88 - - - 0.07 0.10 0.11 0.14 4.78 - 4.58 3.63 2.66 4.78 4.45 7.36 - - - - -
SHANGHAI CONSTRUCTION CO-A CNY 3038 56496 2775 2 0 0 4 2.34 14915 15257 398 - - - 0.07 0.10 1.80 - 2.03 5.50 0.57 6.39 - - - - -
YONGHUI SUPERSTORES CO LTD-A CNY 3336 12082 1536 0 0 0 0 3.30 4014 4453 5089 6354 193 231 - - 0.05 0.07 0.07 0.10 4.51 5.09 4.50 3.46 6.41 - 4.43 - 0.85 - - - -
YUNNAN CHIHONG ZINC & GERM-A CNY 2999 16074 1310 2 0 0 0 5.71 1975 2312 2774 3167 217 - 323 323 0.03 0.06 0.05 0.03 5.03 - 6.02 8.41 15.05 6.15 3.28 -1.01 - - - - -
SHANXI XINGHUACUN FEN WINE-A CNY 2932 7918 866 0 0 0 0 2.71 882 924 1296 1584 331 - - - 0.25 0.29 0.31 0.39 1.92 - 1.77 1.42 7.64 6.90 7.41 3.80 - - - - -
GANSU JIU STEEL GROUP HONG-A CNY 2947 8631 4091 4 0 0 1 6.22 10388 12029 13431 13558 551 - - - 0.02 0.01 0.03 0.04 7.35 - 2.30 1.94 2.54 4.22 -2.90 1.96 - - - - -
JOINTOWN PHARMACEUTICAL-A CNY 2875 4437 1421 1 0 0 0 3.94 4813 5072 6055 7270 135 141 174 174 0.03 0.05 0.06 0.07 6.51 9.12 5.90 4.53 3.07 - 5.26 - 0.45 - - - -
SINOVEL WIND GROUP CO LTD-A CNY 2883 6313 4020 1 0 0 1 3.35 663 388 -89 -201 - - - -0.04 - - -9.34 - - - -8.47 - - - -
CHINA SHIPPING CONTAINER-A CNY 4621 79466 11683 3 0 0 1 6.78 5318 5403 5468 6075 130 116 435 435 -0.01 0.01 -0.01 0.01 9.55 - 6.97 2.49 0.92 - - 0.35 - - - -
GANSU YASHENG INDUSTRIAL-A CNY 2885 145365 1947 0 0 0 0 2.87 367 379 442 539 84 - - - 0.03 0.04 0.04 0.06 6.02 - 5.55 4.15 8.63 1.32 8.41 2.73 - - - - -
SINOLINK SECURITIES CO LTD-A CNY 2825 38395 1294 0 0 0 1 2.13 256 267 271 297 70 - - - 0.04 0.03 0.04 0.06 10.36 - 7.94 6.17 7.78 4.37 5.46 -2.89 - - - - -
GUANGXI WUZHOU ZHONGHENG G-A CNY 2636 16210 1092 0 0 0 0 2.64 310 447 528 660 101 - - - 0.06 0.11 0.10 0.13 3.56 - 3.77 3.03 11.25 7.72 5.58 9.90 - - - - -
CHINA SPACESAT CO LTD -A CNY 2944 46738 917 0 0 0 0 2.73 695 746 807 996 57 - 78 78 0.04 0.06 0.05 0.06 7.36 - 8.30 6.50 2.96 4.76 2.27 3.04 - - - - -
XIAMEN C & D INC-A CNY 2742 33071 2238 4 0 0 1 7.08 14667 16011 17488 20415 666 - - - 0.16 0.17 0.20 0.24 1.18 - 1.02 0.82 2.20 3.79 3.57 6.37 - - - - -
INNER MONGOLIA YITAI COAL-B USD 6389 5128 3254 10 0 2 6 46.60 31584 30425 25442 26260 10462 - 7753 7753 2.09 1.84 1.59 1.58 6.70 - 7.73 7.80 16.96 45.67 -5.20 43.63 - - - - -
HUMANWELL HEALTHCARE GROUP-A CNY 2751 3534 493 0 0 0 0 3.10 851 935 1069 1413 131 - 50 50 0.11 0.13 0.15 0.21 6.30 - 5.60 4.12 7.60 6.66 5.28 7.71 - - - - -
Valuation Measures I/II
Market Capitalization & Asset Liability data Total Revenue EBITDA Earnings Per Share Price/Earnings ratio Rev. Growth EBITDA Growth
Q.M.S Advisors | tel: +41 (0)78 922 08 77 | e-mail: [email protected] |
Page 5
2013 2014 2015 2016 2017 2013 2014 2015 2016 2017 2013 2014 2015 2016 2017 2013 2014 2015 2016 2017 2013 2014 2015 2016 2017 2013 2014 2015 2016 2017 2013 %D to Spot
S&P 500 INDEX 2.31 2.31 2.15 1.97 2.31 1.48 1.48 1.42 1.36 1.48 10.55 10.55 9.86 10.23 10.55 9.23 9.23 8.52 7.97 9.23 14.99 14.99 13.52 12.22 14.99 2.12 2.12 2.31 2.46 2.12 1844.6 11.4%
Euro Stoxx 50 Pr 1.23 1.23 1.17 1.10 1.23 0.80 0.80 0.78 0.75 0.80 6.26 6.26 5.74 5.18 6.26 7.39 7.39 6.98 6.60 7.39 12.50 12.50 11.09 9.97 12.50 4.10 4.10 4.32 4.67 4.10 3015.2 7.9%
NIKKEI 225 1.52 1.52 1.43 1.33 1.52 0.73 0.73 0.71 0.69 0.73 9.03 9.03 8.30 7.14 9.03 8.71 8.71 7.98 7.51 8.71 17.89 17.89 15.91 14.33 17.89 1.64 1.64 1.79 1.94 1.64 15127.1 6.5%
FTSE 100 INDEX 1.79 1.79 1.67 1.55 1.79 1.03 1.03 1.00 0.97 1.03 8.58 8.58 7.84 6.61 8.58 7.50 7.50 6.88 6.46 7.50 12.73 12.73 11.58 10.62 12.73 3.79 3.79 4.18 4.47 3.79 7068.2 8.3%
SWISS MARKET INDEX 2.41 2.41 2.23 2.08 2.41 2.05 2.05 1.96 1.87 2.05 12.81 12.81 11.53 10.29 12.81 12.97 12.97 12.02 11.21 12.97 15.10 15.10 13.69 12.43 15.11 3.27 3.26 3.64 4.11 3.26 8656.4 9.3%
S&P/TSX COMPOSITE INDEX 1.73 1.73 1.62 1.52 1.73 1.68 1.68 1.55 1.52 1.68 8.85 8.85 8.03 6.72 8.85 8.92 8.92 7.95 7.37 8.92 15.37 15.37 13.64 12.35 15.37 3.13 3.13 3.26 3.38 3.13 14271.0 11.3%
S&P/ASX 200 INDEX 1.90 1.90 1.81 1.72 1.90 1.80 1.80 1.70 1.63 1.80 10.83 10.83 9.97 9.32 10.83 9.25 9.25 8.41 7.87 9.25 15.07 15.07 13.67 12.61 15.07 4.56 4.56 4.84 5.21 4.56 5315.9 2.6%
HANG SENG INDEX 1.36 1.36 1.25 1.18 1.36 1.77 1.77 1.64 1.52 1.77 8.04 8.04 7.61 7.03 8.04 8.26 8.26 7.57 6.91 8.26 10.86 10.86 10.08 9.18 10.86 3.55 3.55 3.82 4.13 3.55 24937.3 9.6%
MSCI EM 1.37 1.37 1.25 1.06 1.37 0.99 0.99 0.92 0.86 0.99 7.12 7.12 6.47 5.40 7.12 7.57 7.57 6.87 6.33 7.57 10.98 10.98 9.82 8.98 10.98 2.86 2.86 3.13 3.39 2.86 1100.2 15.1%
PETROCHINA CO LTD-A 1.18 1.28 1.22 1.17 0.67 0.60 0.57 0.57 5.51 4.88 4.32 4.18 6.08 5.89 6.16 5.98 12.90 11.35 10.72 10.83 3.54 3.91 3.66 2.86 9.96 23.7%
IND & COMM BK OF CHINA-A 1.28 1.09 0.95 0.86 2.72 2.49 2.27 2.12 1.99 5.23 5.51 5.51 6.13 5.58 5.16 5.15 5.54 6.20 6.59 6.52 4.86 19.2%
AGRICULTURAL BANK OF CHINA-A 1.15 1.02 0.90 0.78 2.12 1.93 1.74 1.59 2.32 2.26 2.28 1.84 6.13 5.48 4.98 4.53 6.03 6.43 6.99 7.65 3.25 19.5%
BANK OF CHINA LTD-A 0.97 0.85 0.77 0.70 2.24 2.00 1.83 1.68 3.96 4.91 5.18 5.09 5.91 5.43 5.03 5.04 5.96 6.42 6.81 7.09 3.24 13.6%
CHINA PETROLEUM & CHEMICAL-A 0.95 0.96 0.87 0.82 0.20 0.19 0.18 0.17 3.57 3.55 3.19 3.05 5.15 4.62 4.36 4.15 9.15 7.18 6.53 6.81 4.01 4.88 4.77 4.88 5.68 23.2%
CHINA LIFE INSURANCE CO-A 1.98 1.74 1.58 1.39 1.14 0.99 0.91 0.80 36.73 15.52 12.45 10.50 1.11 2.00 2.63 3.06 18.73 28.1%
CHINA SHENHUA ENERGY CO-A 1.33 1.24 1.12 0.97 1.50 1.42 1.34 1.25 5.16 4.43 4.31 3.95 5.00 4.83 4.54 4.21 7.44 7.50 7.17 6.86 5.25 5.14 5.31 5.77 22.64 29.8%
INDUSTRIAL BANK CO LTD -A 1.42 1.15 0.96 0.76 2.88 2.31 1.98 1.67 2.27 5.63 4.77 4.04 6.47 5.63 5.06 4.26 2.05 3.08 3.48 3.83 11.41 -9.1%
CHINA MINSHENG BANKING-A 1.75 1.44 1.19 1.01 2.70 2.31 2.00 1.77 23.18 4.68 3.83 2.66 7.85 6.70 5.79 5.24 4.38 2.15 3.39 3.72 4.23 8.54 -16.2%
CHINA MERCHANTS BANK-A 1.31 1.12 0.96 0.80 2.26 1.99 1.74 1.49 2.83 3.19 1.91 1.56 6.15 5.45 4.81 4.52 3.11 5.13 5.43 5.94 14.60 26.1%
PING AN INSURANCE GROUP CO-A 1.92 1.60 1.37 1.14 1.14 0.98 0.88 0.79 13.49 11.10 9.23 7.45 1.11 1.64 2.04 2.43 52.78 40.3%
SHANGHAI PUDONG DEVEL BANK-A 1.12 0.95 0.81 0.69 2.39 2.10 1.83 1.59 2.76 2.40 1.99 2.01 5.89 5.17 4.61 3.94 2.89 4.34 4.64 5.25 10.49 -0.4%
KWEICHOW MOUTAI CO LTD-A 4.56 3.86 3.27 2.45 5.90 5.22 4.48 3.83 12.56 9.73 8.32 6.56 7.44 6.43 5.59 4.73 11.63 10.24 8.45 7.51 2.87 4.82 5.30 6.32 221.42 46.7%
BANK OF COMMUNICATIONS CO-A 0.88 0.79 0.70 0.62 2.30 2.09 1.86 1.70 2.79 5.01 5.31 5.24 5.75 5.24 4.74 4.61 3.55 4.88 5.28 5.06 5.03 11.5%
SAIC MOTOR CORPORATION LTD-A 1.24 1.07 0.94 0.84 0.31 0.28 0.25 0.23 4.27 6.60 7.21 5.36 3.33 6.11 5.51 8.00 6.94 6.38 5.63 5.63 3.15 4.13 4.50 4.78 18.50 36.4%
CHINA CITIC BANK CORP LTD-A 0.94 0.85 0.76 0.68 2.04 1.83 1.61 1.43 3.73 2.54 2.48 2.48 5.52 5.55 4.90 4.67 5.12 4.63 5.05 6.44 4.54 10.6%
CHINA YANGTZE POWER CO LTD-A 1.35 1.36 1.24 1.14 4.45 4.56 4.43 4.47 6.89 7.26 7.03 6.82 8.03 8.56 8.34 8.27 11.39 11.35 10.74 10.66 4.74 4.55 4.77 5.03 8.19 20.2%
CHINA EVERBRIGHT BANK CO-A 1.06 0.88 0.77 0.60 2.06 1.74 1.51 1.26 1.75 5.26 4.74 4.15 3.58 3.85 4.19 4.46 4.22 3.85 30.0%
CITIC SECURITIES CO-A 1.49 1.45 1.39 1.33 11.33 8.67 6.76 5.49 1.52 23.36 21.77 16.13 14.19 30.54 24.95 18.96 15.23 2.00 1.89 2.18 2.77 17.31 46.1%
CHINA PACIFIC INSURANCE GR-A 1.93 1.62 1.47 1.34 1.04 0.95 0.85 0.71 27.62 19.34 15.96 11.74 1.54 2.00 2.45 3.13 23.85 28.7%
DAQIN RAILWAY CO LTD -A 1.58 1.39 1.27 1.15 2.41 2.23 2.10 1.98 7.55 7.03 6.59 6.77 6.35 5.92 5.63 5.25 9.53 8.55 7.85 7.35 5.27 5.87 6.56 7.82 9.36 27.7%
SHANGHAI INTERNATIONAL POR-A 2.99 2.96 2.75 2.55 5.13 4.88 4.48 4.22 20.06 15.50 15.95 17.11 17.68 19.14 18.44 17.55 32.14 28.17 25.66 24.79 1.66 1.93 2.11 2.24 3.88 -41.4%
CHINA STATE CONSTRUCTION -A 0.98 0.84 0.73 0.60 0.17 0.15 0.13 0.11 8.92 7.10 4.55 3.00 5.32 4.63 4.09 6.46 5.40 4.69 4.04 2.58 3.55 4.24 5.15 4.67 41.4%
HAITONG SECURITIES CO LTD-A 2.08 1.93 1.81 1.66 12.64 10.31 8.75 6.67 21.02 16.14 14.00 12.42 34.88 27.37 22.81 17.37 1.03 1.18 1.56 2.37 11.73 -6.8%
GREAT WALL MOTOR CO LTD-A 6.71 5.06 3.81 2.94 3.01 2.28 1.82 1.55 22.96 16.70 12.08 10.42 16.83 11.27 8.78 7.67 26.77 17.53 13.91 11.43 0.93 1.67 1.84 2.11 43.43 -8.8%
INNER MONGOLIA YILI INDUS-A 8.36 5.23 4.66 3.93 1.92 1.69 1.46 1.29 22.84 17.92 16.45 13.77 25.02 20.52 15.93 13.15 38.43 31.03 26.21 21.48 0.48 0.83 0.97 1.21 41.25 3.2%
POLY REAL ESTATE GROUP CO -A 1.79 1.47 1.19 0.96 1.13 0.86 0.68 0.51 8.92 44.40 35.49 11.22 8.07 6.33 5.01 8.91 7.15 5.61 4.49 2.32 2.73 3.49 3.75 14.91 38.2%
BANK OF BEIJING CO LTD -A 1.03 0.92 0.80 0.69 2.82 2.34 1.98 1.76 5.84 5.40 4.65 4.04 6.23 5.51 4.68 4.27 3.47 4.54 5.23 4.09 9.34 8.1%
INNER MONGOLIA BAOTOU STEE-A 10.11 8.67 7.14 5.63 7.08 8.47 7.55 6.27 21.80 20.48 25.83 16.08 19.77 30.65 24.51 20.11 29.72 50.41 43.87 28.93 0.61 0.68 0.73 1.05 26.33 -10.4%
BAOSHAN IRON & STEEL CO-A 0.71 0.68 0.65 0.62 0.57 0.38 0.42 0.41 0.41 0.39 3.49 5.30 4.22 4.27 3.35 5.61 7.36 6.57 6.18 4.72 7.44 11.52 9.63 8.48 5.31 5.41 3.31 4.03 5.09 7.58 5.16 11.8%
CHINA UNITED NETWORK-A 0.96 0.85 0.83 0.77 0.27 0.24 0.21 0.19 0.99 0.78 0.72 0.64 5.13 4.20 3.55 3.06 29.82 20.18 14.21 11.30 2.21 2.54 3.32 4.74 4.28 29.2%
CHINA SHIPBUILDING INDUSTR-A
HUAXIA BANK CO LTD-A 0.94 0.82 0.71 0.59 0.54 1.77 1.53 1.32 1.12 1.01 5.11 4.47 3.92 3.35 2.88 5.89 4.85 4.28 3.87 3.37 3.26 4.16 4.64 5.48 5.93 6.47 -16.6%
ANHUI CONCH CEMENT CO LTD-A 1.72 1.53 1.32 1.18 1.01 2.00 1.70 1.48 1.35 1.22 7.24 6.31 5.83 4.80 9.49 7.11 6.06 5.38 14.26 10.54 8.79 7.46 7.24 1.30 2.00 2.34 2.79 1.54 20.45 26.2%
HUANENG POWER INTL INC-A 1.41 1.22 1.13 1.07 0.57 0.57 0.55 0.52 3.99 2.41 2.51 2.47 7.05 5.71 5.78 5.57 13.42 7.63 7.35 7.11 4.13 7.32 7.03 7.65 6.89 26.4%
SANY HEAVY INDUSTRY CO LTD-A 2.38 2.06 1.69 1.36 1.17 1.33 1.00 1.15 7.03 10.71 9.24 6.48 7.78 10.54 9.03 8.41 9.13 10.01 7.01 9.15 2.01 1.68 1.85 1.42 10.27 35.4%
CHINA MERCHANTS SECURITIES-A 2.14 2.03 1.90 1.89 13.20 10.12 8.46 7.31 32.89 26.61 21.22 17.54 0.84 1.31 1.63 1.82 11.79 -0.4%
CHINA OILFIELD SERVICES-A 2.42 2.20 1.83 1.59 3.54 2.81 2.48 2.23 9.82 10.40 7.49 7.23 10.50 8.94 8.08 8.20 17.50 13.81 11.86 10.84 1.17 1.83 2.02 2.17 19.47 11.4%
CHINA RAILWAY CONSTRUCTION-A 0.88 0.77 0.69 0.62 0.14 0.13 0.12 0.11 29.65 4.00 4.10 2.18 5.50 4.73 4.34 4.50 7.57 6.69 6.00 5.33 2.38 2.44 2.68 3.27 5.60 11.1%
HUATAI SECURITIES CO LTD-A 1.52 1.46 1.38 1.31 8.17 7.02 5.78 4.66 27.55 22.78 18.03 13.34 1.77 1.82 2.89 9.75 4.4%
GUANGHUI ENERGY CO LTD-A 6.91 4.79 5.16 2.19 10.05 5.92 3.84 1.97 181.43 92.36 101.60 5.43 32.15 18.81 11.69 6.55 0.49
CHINA COAL ENERGY CO-A 0.77 0.84 0.81 0.73 0.74 0.78 0.68 0.64 6.08 5.97 5.10 4.19 6.65 7.81 6.51 5.83 7.96 12.11 10.34 8.90 3.41 2.06 2.04 2.35 5.66 4.8%
CSR CORP LTD -A 1.89 1.56 1.41 1.26 0.65 0.61 0.52 0.46 9.86 8.01 9.34 8.93 9.64 10.20 8.65 7.66 13.93 13.65 11.11 10.68 2.24 1.90 2.29 2.58 5.15 25.4%
NEW CHINA LIFE INSURANCE C-A 2.16 1.89 1.67 1.47 0.59 0.56 0.51 0.45 24.05 19.97 15.94 12.60 1.13 0.90 1.13 1.31 22.00 -8.3%
CHINA COMMUNICATIONS CONST-A 0.80 0.70 0.63 0.57 0.24 0.22 0.20 0.20 3.86 4.53 5.05 7.63 6.59 6.05 5.55 5.99 5.13 4.75 4.46 4.30 4.77 5.18 5.49 4.56 8.9%
CHINA RAILWAY GROUP LTD-A 0.77 0.70 0.64 0.59 0.13 0.12 0.11 0.10 0.09 10.22 7.03 3.19 10.49 9.02 8.18 7.41 8.54 7.32 6.55 5.92 1.71 2.14 2.31 2.46 3.45 22.8%
DATANG INTL POWER GEN CO-A 1.50 1.40 1.31 1.20 0.72 0.70 0.63 0.56 3.70 2.82 2.73 2.29 11.07 10.05 9.19 7.79 18.00 14.14 12.38 10.22 2.56 2.52 2.74 3.63 5.60 19.6%
CHINA CNR CORP LTD-A 1.36 1.18 1.08 0.97 0.49 0.45 0.40 0.36 5.89 17.28 9.89 5.05 12.08 10.27 8.88 7.89 13.98 11.84 10.26 8.47 1.69 2.34 2.62 2.94 5.51 27.5%
JIANGSU HENGRUI MEDICINE C-A 8.64 6.83 5.61 4.64 8.01 6.89 5.60 4.55 34.28 35.98 32.42 27.06 28.16 24.47 20.25 16.22 41.13 35.17 26.81 22.33 0.42 0.42 0.50 1.01 35.52 8.5%
TASLY PHARMACEUTICAL GROUP-A 10.63 7.51 6.06 4.78 5.10 3.65 3.04 2.47 441.89 49.98 35.13 34.13 41.18 28.04 22.10 17.76 56.35 39.05 30.64 24.36 0.64 1.23 0.72 1.19 44.88 6.9%
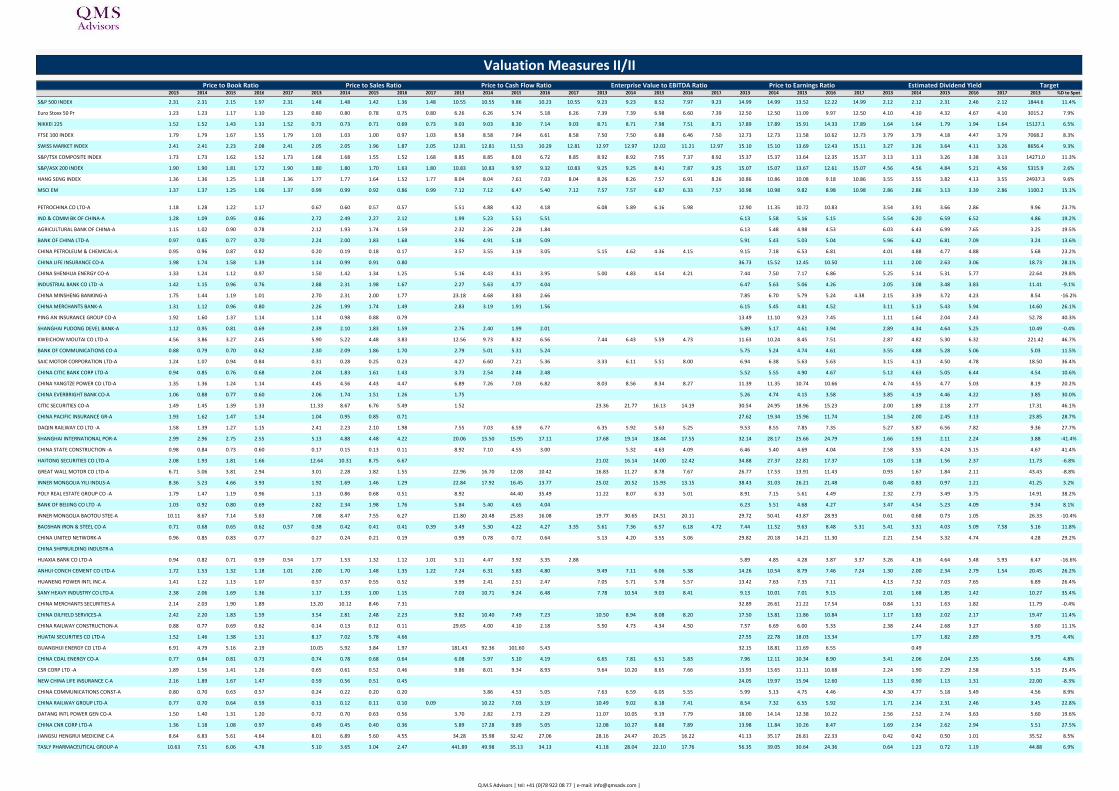
Price to Earnings Ratio
Valuation Measures II/II
Estimated Dividend YieldPrice to Book Ratio Price to Sales Ratio Price to Cash Flow Ratio Enterprise Value to EBITDA Ratio Target
Q.M.S Advisors | tel: +41 (0)78 922 08 77 | e-mail: [email protected] |
Page 6
2013 2014 2015 2016 2017 2013 2014 2015 2016 2017 2013 2014 2015 2016 2017 2013 2014 2015 2016 2017 2013 2014 2015 2016 2017 2013 2014 2015 2016 2017 2013 %D to Spot
S&P 500 INDEX 2.31 2.31 2.15 1.97 2.31 1.48 1.48 1.42 1.36 1.48 10.55 10.55 9.86 10.23 10.55 9.23 9.23 8.52 7.97 9.23 14.99 14.99 13.52 12.22 14.99 2.12 2.12 2.31 2.46 2.12 1844.6 11.4%
Euro Stoxx 50 Pr 1.23 1.23 1.17 1.10 1.23 0.80 0.80 0.78 0.75 0.80 6.26 6.26 5.74 5.18 6.26 7.39 7.39 6.98 6.60 7.39 12.50 12.50 11.09 9.97 12.50 4.10 4.10 4.32 4.67 4.10 3015.2 7.9%
NIKKEI 225 1.52 1.52 1.43 1.33 1.52 0.73 0.73 0.71 0.69 0.73 9.03 9.03 8.30 7.14 9.03 8.71 8.71 7.98 7.51 8.71 17.89 17.89 15.91 14.33 17.89 1.64 1.64 1.79 1.94 1.64 15127.1 6.5%
FTSE 100 INDEX 1.79 1.79 1.67 1.55 1.79 1.03 1.03 1.00 0.97 1.03 8.58 8.58 7.84 6.61 8.58 7.50 7.50 6.88 6.46 7.50 12.73 12.73 11.58 10.62 12.73 3.79 3.79 4.18 4.47 3.79 7068.2 8.3%
SWISS MARKET INDEX 2.41 2.41 2.23 2.08 2.41 2.05 2.05 1.96 1.87 2.05 12.81 12.81 11.53 10.29 12.81 12.97 12.97 12.02 11.21 12.97 15.10 15.10 13.69 12.43 15.11 3.27 3.26 3.64 4.11 3.26 8656.4 9.3%
S&P/TSX COMPOSITE INDEX 1.73 1.73 1.62 1.52 1.73 1.68 1.68 1.55 1.52 1.68 8.85 8.85 8.03 6.72 8.85 8.92 8.92 7.95 7.37 8.92 15.37 15.37 13.64 12.35 15.37 3.13 3.13 3.26 3.38 3.13 14271.0 11.3%
S&P/ASX 200 INDEX 1.90 1.90 1.81 1.72 1.90 1.80 1.80 1.70 1.63 1.80 10.83 10.83 9.97 9.32 10.83 9.25 9.25 8.41 7.87 9.25 15.07 15.07 13.67 12.61 15.07 4.56 4.56 4.84 5.21 4.56 5315.9 2.6%
HANG SENG INDEX 1.36 1.36 1.25 1.18 1.36 1.77 1.77 1.64 1.52 1.77 8.04 8.04 7.61 7.03 8.04 8.26 8.26 7.57 6.91 8.26 10.86 10.86 10.08 9.18 10.86 3.55 3.55 3.82 4.13 3.55 24937.3 9.6%
MSCI EM 1.37 1.37 1.25 1.06 1.37 0.99 0.99 0.92 0.86 0.99 7.12 7.12 6.47 5.40 7.12 7.57 7.57 6.87 6.33 7.57 10.98 10.98 9.82 8.98 10.98 2.86 2.86 3.13 3.39 2.86 1100.2 15.1%
KANGMEI PHARMACEUTICAL CO-A 3.88 3.39 2.85 2.37 4.28 2.92 2.29 1.73 23.40 38.60 21.39 17.41 28.58 20.92 16.28 13.05 0.27 1.07 1.07 1.07 23.00 22.9%
ZIJIN MINING GROUP CO LTD-A 2.00 1.71 1.55 1.38 1.09 1.06 0.98 0.85 9.30 8.67 9.96 8.81 6.87 9.58 10.59 10.22 11.13 16.48 19.78 12.25 2.81 1.69 0.90 1.39 2.55 -4.5%
CHINA CONSTRUCTION BANK-A 1.19 1.03 0.91 0.82 2.68 2.37 2.15 2.03 2.11 5.33 5.52 5.59 5.95 5.41 4.93 4.88 5.96 6.20 6.78 6.47 5.51 21.6%
GD POWER DEVELOPMENT CO -A 1.18 1.06 0.98 0.91 0.73 0.68 0.62 0.59 2.98 2.75 2.28 2.51 8.14 7.57 7.62 6.67 8.56 7.15 6.76 5.85 4.62 5.46 5.59 5.88 3.19 33.9%
CHINA NATIONAL CHEMICAL-A 2.22 1.87 1.54 1.27 0.72 0.61 0.46 0.39 5.81 6.14 4.99 4.57 5.75 4.59 3.88 3.38 12.43 10.18 8.20 6.78 0.62 0.98 1.27 1.23 13.65 67.9%
GUANGZHOU BAIYUNSHAN PHAR-A 6.49 6.24 5.19 4.27 5.85 2.19 2.11 1.57 475.86 34.34 36.21 29.22 172.07 31.05 22.96 16.63 75.70 38.29 30.12 18.33 0.26 0.35 0.37 0.44
WANHUA CHEMICAL GROUP CO -A 4.38 3.24 2.54 1.93 2.26 1.80 1.49 1.10 11.25 10.83 7.00 8.01 11.69 8.61 7.12 5.98 15.85 11.94 10.05 8.19 2.67 3.21 3.57 8.02 22.83 35.7%
CHINA INTERNATIONAL TRAVEL-A 6.05 4.53 3.78 3.33 2.31 1.93 1.59 1.40 27.81 25.48 23.88 32.16 21.95 16.08 12.96 10.16 33.87 27.43 22.78 19.00 0.47 0.91 1.22 1.63 41.13 8.1%
BESTV NEW MEDIA CO LTD-A 12.85 10.58 8.52 6.78 20.92 14.01 10.32 7.62 89.95 62.03 39.54 29.25 48.88 36.20 27.39 20.26 75.59 55.52 40.93 30.57 0.20 0.14 0.22 0.33 34.26 -4.8%
SHANGHAI JAHWA UNITED CO -A 14.81 11.09 9.04 7.12 8.04 6.50 5.22 4.20 62.87 45.51 31.62 27.27 46.87 37.13 25.62 20.02 60.35 42.01 31.49 23.55 0.60 1.12 1.48 1.85 61.80 14.3%
GUANGZHOU AUTOMOBILE GROUP-A 1.88 1.75 1.59 1.43 4.28 3.15 2.74 2.31 363.60 59.41 43.70 60.83 32.43 23.46 35.37 23.73 14.20 11.04 0.74 1.51 2.12 2.75 9.75 7.3%
FOUNDER SECURITIES CO LTD-A 2.48 2.32 2.19 18.52 9.30 8.11 5.83 98.50 30.00 23.83 19.06 1.69 2.20 2.71 7.04 19.1%
SHANGHAI ELECTRIC GRP CO L-A 1.49 1.45 1.35 1.28 0.59 0.54 0.54 0.47 148.80 9.54 10.63 11.27 7.53 6.42 5.61 4.97 14.14 16.68 14.88 13.78 2.18 1.69 1.94 2.20 4.00 7.5%
JIANGXI COPPER CO LTD-A 1.40 1.27 1.18 1.04 0.40 0.32 0.30 0.26 9.67 10.63 12.42 9.57 7.22 9.33 8.92 7.86 10.42 14.93 14.31 10.03 2.03 1.64 1.77 2.14 21.60 25.4%
AIR CHINA LTD-A 0.95 0.97 0.93 0.84 0.54 0.52 0.46 0.42 3.65 3.33 2.70 2.40 8.32 7.17 6.17 5.54 11.60 9.59 9.03 7.64 0.83 1.14 1.21 1.12 4.30 2.4%
NARI TECHNOLOGY DEVELOPMEN-A 8.90 7.17 5.44 4.20 5.44 4.57 3.60 2.91 24.39 31.94 27.15 19.83 30.07 23.59 18.54 14.89 29.33 23.82 18.68 14.70 0.30 0.67 0.60 0.86 19.17 19.1%
QINGDAO HAIER CO LTD-A 2.17 2.41 1.99 0.42 0.39 0.35 0.32 0.31 13.97 10.22 5.87 6.32 5.16 4.49 3.95 10.50 9.04 8.02 7.04 3.78 3.98 3.58 15.71 25.0%
SHANDONG GOLD MINING CO LT-A 4.27 3.79 3.41 3.01 0.69 0.70 0.71 0.68 11.01 12.67 14.91 10.67 9.36 12.07 13.97 12.17 14.29 19.56 14.91 22.17 1.34 0.49 0.30 0.45 22.81 -6.6%
CHINA AVIC ELECTRONICS CO-A 6.42 7.27 6.25 5.56 8.14 5.62 4.74 3.67 59.56 122.73 84.38 44.02 45.19 33.23 26.65 22.01 56.25 56.41 44.70 34.73 0.27 0.44 0.40 19.82 -2.1%
ALUMINUM CORP OF CHINA LTD-A 1.01 1.11 1.12 1.21 0.30 0.30 0.28 0.29 24.54 6.12 8.99 7.69 60.02 26.67 15.33 13.56 0.00 0.00 0.00 0.09 2.93 -15.2%
CHINA FORTUNE LAND DEVELOP-A 7.31 4.87 3.38 2.42 3.17 1.80 1.38 1.14 13.68 56.82 24.70 8.55 11.00 8.07 6.17 16.29 13.68 10.60 8.11 0.89 1.19 1.57 36.42 -1.4%
INNER MONGOLIAN BAOTOU STE-A 1.85 1.78 0.81 0.86 4.98 4.57 56.86 79.60 66.33
EVERBRIGHT SECURITIE CO -A 1.51 1.43 1.36 1.34 8.78 8.96 6.89 7.10 28.19 25.83 19.76 14.53 4.27 1.32 1.73 2.13 10.77 9.4%
YANZHOU COAL MINING CO-A 1.17 1.21 1.14 1.15 0.78 0.80 0.74 0.68 0.63 5.20 8.06 6.95 6.49 8.79 11.40 9.22 8.68 9.68 23.23 22.11 2.97 0.90 1.16 1.58 7.84 -25.3%
ZHONGJIN GOLD CORP-A 3.13 2.96 2.77 2.67 0.87 0.89 0.88 0.82 9.33 12.08 14.24 10.41 9.31 11.44 11.77 10.64 16.85 26.24 22.77 23.84 0.59 0.77 0.66 0.54 9.67 -9.5%
SHANXI LU'AN ENVIRONMENTAL-A 1.86 1.85 1.70 1.43 1.48 1.53 1.32 1.13 0.96 4.84 7.60 5.05 4.07 5.75 5.79 5.08 4.60 10.98 13.71 12.50 9.68 2.91 2.15 2.26 3.35 16.84 25.5%
JIANGSU PHOENIX PUBLISH-A 3.46 3.31 2.98 2.62 4.78 4.28 3.70 3.23 29.25 15.09 23.40 32.18 33.49 26.14 22.41 19.02 32.92 30.86 26.70 23.53 1.34 1.06 1.11 1.36 11.67 -9.3%
OFFSHORE OIL ENGINEERING-A 2.83 2.39 2.18 1.90 2.48 1.80 1.55 1.43 17.49 22.17 6.18 12.92 15.40 10.84 8.70 7.84 40.16 20.24 15.89 13.81 0.27 0.20 0.20 0.20 8.67 16.1%
SHANGHAI INTERNATIONAL AIR-A 1.88 1.81 1.68 1.54 6.17 5.75 5.13 4.69 13.48 12.21 10.15 9.72 11.58 9.88 8.86 8.21 19.43 15.94 13.92 12.40 2.20 2.57 2.50 2.63 17.13 7.3%
CHINA MOLYBDENUM CO LTD-A 3.34 1.09 1.03 0.55 5.51 5.49 4.65 3.64 29.66 13.91 10.41 4.62 22.25 16.80 13.06 34.47 39.90 32.21 23.46 3.82 5.22 6.87
NINGBO PORT CO LTD-A 1.14 1.03 0.94 3.84 3.08 2.64 10.86 29.88 23.90 10.96 10.53 9.19 9.56 2.76
GEMDALE CORP-A 1.23 1.10 0.96 0.81 1.05 0.83 0.68 0.56 9.58 12.85 5.85 10.81 9.21 7.11 5.58 8.59 8.24 6.64 5.26 2.12 1.76 2.09 1.90 8.46 28.4%
TSINGTAO BREWERY CO LTD-A 4.40 3.88 3.44 3.06 2.33 2.06 1.80 1.60 18.47 19.98 17.79 15.73 17.96 15.64 13.65 11.82 31.53 26.97 23.54 20.88 0.57 1.00 1.11 1.31 40.53 -3.9%
BEIJING TONGRENTANG CO-A 7.19 5.93 4.97 4.15 3.69 3.09 2.54 2.11 28.75 17.91 14.23 26.33 24.48 18.57 14.97 12.29 51.65 39.09 31.08 25.14 0.89 1.02 0.81 0.90 23.83 9.1%
SANAN OPTOELECTRONICS CO L-A 4.49 3.73 3.11 8.44 5.64 4.03 2.70 22.79 39.53 30.75 31.56 22.98 16.87 11.07 30.50 25.62 21.03 15.90 0.77 0.94 1.12 2.07 25.67 32.5%
METALLURGICAL CORP OF CHIN-A 0.76 0.70 0.17 0.13 0.14 4.45 6.36 11.48 10.17 2.25 2.81
SINOHYDRO GROUP LTD-A 0.93 0.54 0.51 0.23 0.19 0.16 0.15 3.45 1.53 2.24 7.08 5.82 4.75 6.90 6.02 5.15 4.20 2.10 2.33 2.33 2.33
CHONGQING WATER GROUP-A 2.07 1.90 1.74 6.77 6.35 6.05 13.95 13.02 13.02 14.58 14.07 13.80 16.28 14.40 13.72 12.88
JINDUICHENG MOLYBDENUM CO -A 2.09 2.08 2.02 1.96 3.56 3.11 2.93 2.64 47.72 55.42 23.53 15.34 22.96 27.16 17.58 13.66 38.52 57.27 40.90 35.06 1.69 0.93 1.71 2.29 7.90 -8.0%
SDIC POWER HOLDINGS CO LTD-A 1.79 1.67 1.45 1.23 0.99 0.95 0.79 0.71 4.75 2.60 2.13 2.66 17.02 12.09 9.03 7.39 24.52 12.42 8.59 9.63 0.42 0.96 1.06 1.04 5.11 32.7%
TBEA CO LTD-A 1.78 1.73 1.58 1.41 1.34 1.07 0.90 0.76 5.57 9.58 7.69 6.61 25.73 17.80 14.57 12.69 18.49 18.42 15.48 12.98 0.10 0.61 0.69 0.48 11.70 19.4%
INDUSTRIAL SECURITIES CO-A 2.53 2.11 1.99 1.55 10.22 7.75 6.79 4.54 42.66 34.74 28.32 19.08 1.09 2.08 2.77 11.44 13.2%
SHANGHAI LUJIAZUI FIN&TRAD-A 2.99 2.79 2.56 9.01 7.90 6.62 105.50 36.52 30.48 25.73 0.68 0.79 0.79
ZHE JIANG DAILY MEDIA GRP -A 10.41 5.72 5.10 4.28 17.23 11.24 9.77 8.12 79.65 26.55 29.17 32.11 72.09 37.24 28.63 24.29 74.10 54.14 46.33 34.03 0.51 0.36 0.51 0.58 25.65 -38.1%
CHINA CSSC HOLDINGS LTD-A 26.56 158.25 118.69
BANK OF NANJING CO LTD -A 1.05 0.91 0.80 0.70 2.84 2.49 2.12 1.80 1.40 5.43 4.77 4.20 6.72 5.69 4.92 4.25 3.13 4.23 4.66 5.26 8.84 1.8%
AVIC INVESTMENT HOLDINGS -A 7.82 6.28 5.12 4.18 40.58 26.93 20.92 19.02 21.34 16.9%
WUHAN IRON & STEEL CO LTD-A 0.65 0.68 0.66 0.63 0.27 0.26 0.25 0.27 3.00 2.67 2.59 8.46 7.44 6.23 46.73 38.57 23.14 15.19 1.65 1.23 2.47 4.11 69.0%
HAINAN AIRLINES CO-A 1.36 0.86 0.77 0.68 3.75 9.07 11.91 14.21 10.67 9.36 1.70 2.43 2.43 2.25 9.2%
HUAYU AUTOMOTIVE SYSTEMS -A 1.26 1.07 0.94 0.79 0.41 0.37 0.33 0.30 9.54 6.25 4.08 3.41 3.63 3.04 2.79 3.28 7.63 7.01 6.28 5.79 3.35 4.38 4.70 4.97 13.00 40.5%
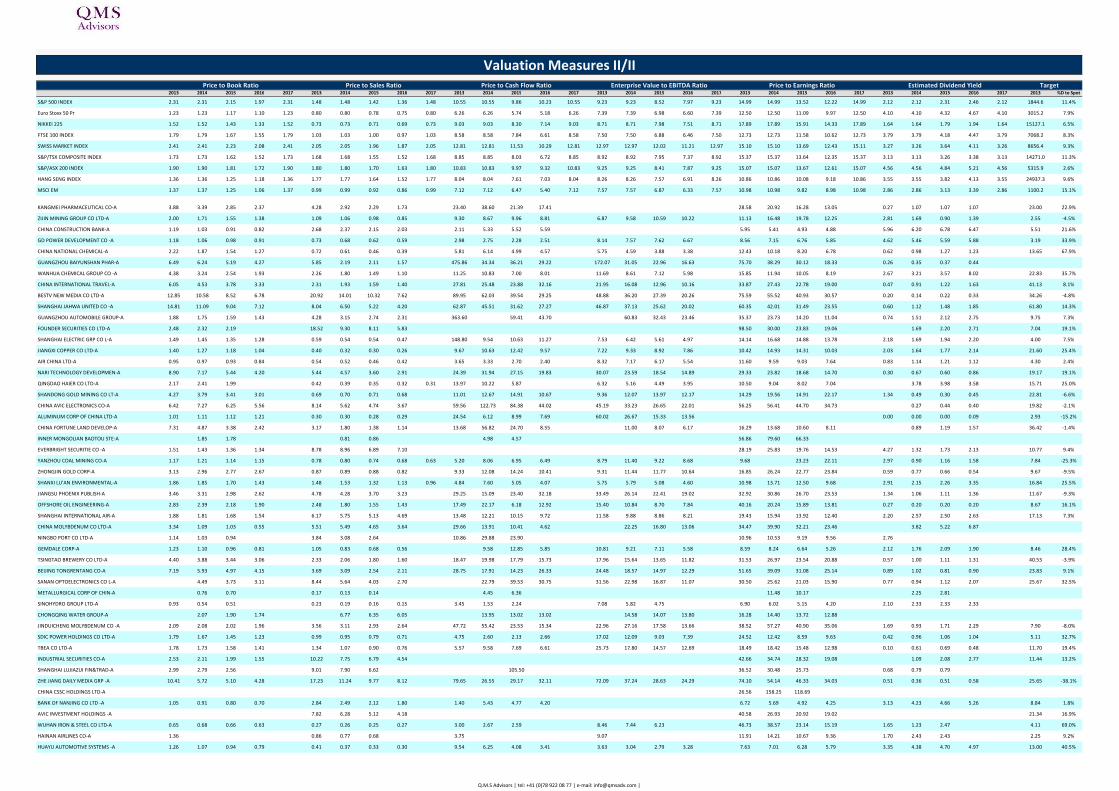
Price to Earnings Ratio
Valuation Measures II/II
Estimated Dividend YieldPrice to Book Ratio Price to Sales Ratio Price to Cash Flow Ratio Enterprise Value to EBITDA Ratio Target
Q.M.S Advisors | tel: +41 (0)78 922 08 77 | e-mail: [email protected] |
Page 7
2013 2014 2015 2016 2017 2013 2014 2015 2016 2017 2013 2014 2015 2016 2017 2013 2014 2015 2016 2017 2013 2014 2015 2016 2017 2013 2014 2015 2016 2017 2013 %D to Spot
S&P 500 INDEX 2.31 2.31 2.15 1.97 2.31 1.48 1.48 1.42 1.36 1.48 10.55 10.55 9.86 10.23 10.55 9.23 9.23 8.52 7.97 9.23 14.99 14.99 13.52 12.22 14.99 2.12 2.12 2.31 2.46 2.12 1844.6 11.4%
Euro Stoxx 50 Pr 1.23 1.23 1.17 1.10 1.23 0.80 0.80 0.78 0.75 0.80 6.26 6.26 5.74 5.18 6.26 7.39 7.39 6.98 6.60 7.39 12.50 12.50 11.09 9.97 12.50 4.10 4.10 4.32 4.67 4.10 3015.2 7.9%
NIKKEI 225 1.52 1.52 1.43 1.33 1.52 0.73 0.73 0.71 0.69 0.73 9.03 9.03 8.30 7.14 9.03 8.71 8.71 7.98 7.51 8.71 17.89 17.89 15.91 14.33 17.89 1.64 1.64 1.79 1.94 1.64 15127.1 6.5%
FTSE 100 INDEX 1.79 1.79 1.67 1.55 1.79 1.03 1.03 1.00 0.97 1.03 8.58 8.58 7.84 6.61 8.58 7.50 7.50 6.88 6.46 7.50 12.73 12.73 11.58 10.62 12.73 3.79 3.79 4.18 4.47 3.79 7068.2 8.3%
SWISS MARKET INDEX 2.41 2.41 2.23 2.08 2.41 2.05 2.05 1.96 1.87 2.05 12.81 12.81 11.53 10.29 12.81 12.97 12.97 12.02 11.21 12.97 15.10 15.10 13.69 12.43 15.11 3.27 3.26 3.64 4.11 3.26 8656.4 9.3%
S&P/TSX COMPOSITE INDEX 1.73 1.73 1.62 1.52 1.73 1.68 1.68 1.55 1.52 1.68 8.85 8.85 8.03 6.72 8.85 8.92 8.92 7.95 7.37 8.92 15.37 15.37 13.64 12.35 15.37 3.13 3.13 3.26 3.38 3.13 14271.0 11.3%
S&P/ASX 200 INDEX 1.90 1.90 1.81 1.72 1.90 1.80 1.80 1.70 1.63 1.80 10.83 10.83 9.97 9.32 10.83 9.25 9.25 8.41 7.87 9.25 15.07 15.07 13.67 12.61 15.07 4.56 4.56 4.84 5.21 4.56 5315.9 2.6%
HANG SENG INDEX 1.36 1.36 1.25 1.18 1.36 1.77 1.77 1.64 1.52 1.77 8.04 8.04 7.61 7.03 8.04 8.26 8.26 7.57 6.91 8.26 10.86 10.86 10.08 9.18 10.86 3.55 3.55 3.82 4.13 3.55 24937.3 9.6%
MSCI EM 1.37 1.37 1.25 1.06 1.37 0.99 0.99 0.92 0.86 0.99 7.12 7.12 6.47 5.40 7.12 7.57 7.57 6.87 6.33 7.57 10.98 10.98 9.82 8.98 10.98 2.86 2.86 3.13 3.39 2.86 1100.2 15.1%
ZHENGZHOU YUTONG BUS CO -A 3.86 2.83 2.40 1.98 1.24 1.07 0.93 0.83 0.79 11.47 9.90 9.54 8.15 11.83 9.28 8.08 7.13 16.93 13.81 11.73 10.44 1.12 2.24 2.51 2.27 20.75 8.6%
CHINA COSCO HOLDINGS-A 1.30 1.49 1.59 1.33 0.47 0.48 0.43 0.40 16.27 6.24 4.18 71.17 15.63 7.99 12.28 0.00 0.00 0.26 1.07 3.05 -11.6%
HENAN DAYOU ENERGY CO LTD-A 1.11 1.22 1.35 1.20 2.23 1.64 1.54 1.47 7.01 6.70 5.42 4.97 12.86 12.16 11.57 10.80 3.59 4.10 4.62 12.79 31.2%
SOUTHWEST SECURITIES CO LT-A 2.31 2.19 2.12 13.90 11.74 8.79 44.13 43.94 35.74 26.71 0.64 0.79 1.08 10.34 1.8%
SICHUAN CHUANTOU ENERGY CO-A 2.56 2.39 2.06 1.74 20.08 19.21 18.69 17.66 75.49 33.48 33.97 38.50 38.91 41.25 20.44 11.79 10.90 0.37 0.82 2.94 0.95 11.94 3.4%
CHINA EASTERN AIRLINES CO-A 1.43 1.33 1.24 1.10 0.37 0.37 0.33 0.30 3.34 3.63 2.71 2.31 7.74 8.16 6.65 5.87 10.13 9.97 8.49 8.74 0.00 0.00 0.00 0.00 2.82 -7.4%
YANGQUAN COAL INDUSTRY GRP-A 1.58 1.57 1.42 1.31 0.34 0.30 0.28 0.28 3.52 3.64 8.41 6.53 5.18 5.71 5.86 5.52 10.17 13.72 12.49 11.24 1.85 1.80 1.64 2.12 10.70 13.3%
ZHEJIANG CHINT ELECTRICS-A 3.99 3.99 3.30 2.75 2.16 1.75 1.47 1.27 23.01 12.78 10.07 8.79 13.49 9.55 7.97 6.64 19.69 15.46 12.73 10.47 28.00 29.9%
CHINA HAINAN RUBBER INDUST-A 2.39 2.38 1.86 1.68 101.86 62.00 43.21
BRIGHT DAIRY & FOOD CO LTD-A 6.26 5.60 4.92 4.11 1.78 1.51 1.30 1.10 45.36 36.76 20.58 17.66 76.77 52.25 36.36 26.54 0.25 1.00 1.23 2.10 19.19 -3.9%
SHANGHAI FOSUN PHARMACEUTI-A 1.84 1.72 1.53 1.36 3.27 2.84 2.33 1.94 50.48 50.48 27.32 22.11 27.48 13.24 10.99 9.45 17.00 13.50 11.77 9.86 0.99 1.34 1.03 1.55 15.00 29.2%
UNIVERSAL SCIENTIFIC INDUS-A 6.65 5.89 4.87 4.01 1.84 1.60 1.39 1.23 29.61 19.27 31.74 25.03 20.24 16.23 12.73 40.00 30.73 26.31 21.02 0.21 29.70 22.3%
SHANGHAI PHARMACEUTICALS-A 1.23 0.69 1.08 1.00 0.47 0.39 0.33 0.29 15.84 16.33 16.80 14.60 8.74 7.88 6.89 5.92 15.54 13.81 12.15 10.92 1.52 1.72 1.92 1.92 13.62 17.0%
SHANGHAI CHENGTOU HOLDING-A 2.31 12.84 9.68
JIANGSU EXPRESSWAY CO LTD-A 1.52 1.49 1.44 1.46 3.92 3.82 3.44 3.31 7.86 7.26 7.75 6.82 7.72 7.62 7.06 6.77 11.62 11.39 10.58 10.05 6.33 6.71 7.03 7.24 7.18 26.9%
CHENGDU DR PENG TELECOM-A 5.74 9.16 3.98 3.38 43.46 42.71 94.59 47.57 37.75 29.78
XINHU ZHONGBAO CO LTD-A 1.75 1.41 1.15 0.94 1.83 1.81 1.36 1.09 8.77 18.00 12.53 10.06 13.52 9.90 6.64 5.96 10.46 7.94 5.86 5.13 0.56 0.70 0.88 1.05 3.84 12.3%
CHINA SOUTH PUBLISHING -A 2.67 2.45 2.20 1.93 3.29 2.85 2.48 2.12 18.90 18.85 17.53 14.53 18.01 19.67 17.45 15.25 23.94 21.09 17.93 15.24 1.34 0.95 1.13 1.47 12.85 2.2%
SHANGHAI ORIENTAL PEARL-A 7.06 39.53 22.78 20.06
LIAONING CHENG DA CO LTD-A 21.72 17.58 16.05
XIAMEN TUNGSTEN CO LTD-A 5.29 4.83 4.37 4.17 2.41 2.24 1.89 1.62 9.92 29.38 16.68 23.26 16.15 17.79 13.46 11.08 33.78 42.41 26.10 25.67 0.67 0.63 0.73 0.94 31.20 4.9%
SHENERGY COMPANY LIMITED-A 0.96 0.90 0.84 0.81 0.78 5.31 5.37 13.26 9.20 9.70 2.22 2.66 4.21 5.63 24.7%
SINOPEC SHANGHAI PETROCHE-A 1.83 1.67 1.57 1.54 0.29 0.24 0.23 0.23 0.19 209.00 11.45 8.12 7.46 5019.58 11.58 9.68 9.20 24.73 19.90 16.08 0.72 0.72 0.72 6.03 44.2%
ZHANGZHOU PIENTZEHUANG PHA-A 13.05 8.72 7.55 6.21 16.38 13.62 11.44 9.53 53.37 45.19 42.45 30.51 43.63 35.59 28.38 22.74 55.07 42.14 32.96 26.30 0.53 0.59 0.76 0.95 141.00 18.2%
CHINA SOUTHERN AIRLINES CO-A 0.90 0.84 0.82 0.77 0.26 0.25 0.22 0.20 2.24 2.63 2.03 1.79 8.07 7.66 6.56 5.47 9.77 8.00 8.54 7.83 1.88 2.09 2.05 0.51 3.20 9.6%
XI'AN AERO-ENGINE PLC -A 4.06 3.26 3.04 2.46 2.78 2.28 1.96 1.78 33.02 95.80 61.02 38.52 31.57 28.38 25.04 22.38 65.80 51.65 39.94 32.84 0.43 0.52 0.69 0.57 22.05 19.3%
PEOPLE.CN CO LTD-A 9.94 9.13 8.04 7.04 28.56 20.99 14.87 11.63 76.10 52.82 64.05 36.25 127.77 74.78 53.30 41.85 113.03 70.90 52.54 40.77 0.18 0.11 0.14 0.16 73.80 -4.0%
TSINGHUA TONGFANG CO LTD-A 25.17 24.82 22.03 10.50 19.2%
HUADIAN POWER INTL CORP-A 1.17 1.08 0.99 0.93 0.37 0.34 0.32 0.30 1.92 1.34 1.35 1.23 9.65 6.98 7.16 6.80 19.20 7.56 8.09 7.58 0.67 4.79 4.57 4.38 3.92 25.2%
GUANGDONG GUANHAO HIGH-TEC-A
ZHEJIANG LONGSHENG GROUP C-A 2.33 1.95 1.70 1.48 2.25 1.29 1.14 1.03 7.48 7.88 19.37 11.20 9.59 8.85 21.00 14.87 12.20 9.45 0.85 1.58 2.05 2.30 11.65 -0.6%
DONGFANG ELECTRIC CORP LTD-A 1.37 1.28 1.13 0.97 0.52 0.55 0.53 0.47 38.81 10.65 12.72 5.52 4.93 5.31 4.92 4.41 8.51 10.26 9.72 8.01 1.14 0.74 0.72 1.22 21.25 85.6%
CHINA XD ELECTRIC CO LTD-A 1.04 1.10 1.05 1.00 1.43 1.25 1.09 1.03 52.00 12.55 9.84 18.57 18.30 16.63 13.67 151.67 33.09 20.92 17.33 4.95 36.0%
BEIJING JINGNENG THERMAL-A 1.77 1.70 1.63 10.30 9.49 8.95 1.27 1.27
FIBERHOME TELECOM TECH CO-A 3.86 3.23 2.95 2.58 2.06 1.84 1.49 1.39 49.24 26.46 16.46 28.11 23.56 16.61 12.92 33.71 28.05 22.22 18.36 0.64 0.94 1.10 1.48 21.50 14.9%
SHANGHAI CONSTRUCTION CO-A 11.75
YONGHUI SUPERSTORES CO LTD-A 4.30 2.41 2.18 1.86 0.81 0.66 0.53 0.43 75.15 28.78 10.88 9.68 15.01 13.51 10.50 8.71 39.34 27.52 21.20 16.87 0.55 0.97 1.25 1.90 15.13 20.5%
YUNNAN CHIHONG ZINC & GERM-A 4.09 2.46 2.40 2.20 1.47 1.08 0.95 0.82 16.07 13.59 10.90 18.08 17.64 15.56 12.83 43.52 36.82 51.45 36.95 0.78 1.18 0.68 1.24 11.05 0.4%
SHANXI XINGHUACUN FEN WINE-A 4.67 3.69 3.18 2.41 2.78 2.26 1.85 1.58 18.54 12.28 10.34 6.00 7.59 6.01 4.92 4.15 13.67 10.81 8.67 7.15 1.83 4.58 4.85 5.47 31.77 53.3%
GANSU JIU STEEL GROUP HONG-A 0.65 0.62 0.53 0.22 0.22 0.23 4.24 4.17 10.67 14.05 11.85 16.00
JOINTOWN PHARMACEUTICAL-A 0.59 0.47 0.40 0.32 30.46 22.60 18.52 41.30 36.12 27.72 23.83
SINOVEL WIND GROUP CO LTD-A
CHINA SHIPPING CONTAINER-A 1.20 1.24 1.21 1.14 0.83 0.85 0.76 0.69 12.13 29.04 11.28 6.83 26.51 29.61 14.88 8.13 78.00 42.66 16.35 0.00 0.00 0.00 0.62 2.40 -12.1%
GANSU YASHENG INDUSTRIAL-A 3.72 3.30 2.88 8.52 6.52 5.35 4.53 32.39 29.26 23.87 39.43 33.97 25.41 22.68 0.28
SINOLINK SECURITIES CO LTD-A 3.38 2.63 2.50 12.66 10.42 9.52 6.21 53.44 48.58 37.74 32.59 0.60 0.60 1.05 14.07 5.3%
GUANGXI WUZHOU ZHONGHENG G-A 6.29 5.10 4.23 9.63 4.99 3.99 2.61 9.21 22.39 18.65 18.10 16.08 25.93 23.09 18.54 14.31 2.17 1.35 1.76 2.23 22.00 48.8%
CHINA SPACESAT CO LTD -A 7.26 4.87 4.38 3.89 4.12 3.65 2.95 2.48 21.17 37.82 24.19 21.99 44.92 35.22 29.53 24.17 58.62 50.80 39.79 36.55
XIAMEN C & D INC-A 7.89 2.26 1.85 0.17 0.16 0.13 0.11 5.56 3.41 7.75 6.26 5.01 4.10 1.20 2.40 3.00 3.60 9.90 32.0%
INNER MONGOLIA YITAI COAL-B 1.55 1.86 1.74 1.19 1.54 1.49 1.39 3.70 4.23 3.59 4.40 6.01 6.01 5.61 5.68 7.73 7.80 8.50 6.74 3.90 4.26 3.65 2.32 15.3%
HUMANWELL HEALTHCARE GROUP-A 4.86 4.31 3.66 3.00 3.43 2.57 1.95 1.52 34.62 67.77 82.09 23.45 21.60 17.96 13.49 10.46 36.48 34.25 25.22 18.92 0.27 0.24 0.32 0.41 36.43 14.4%
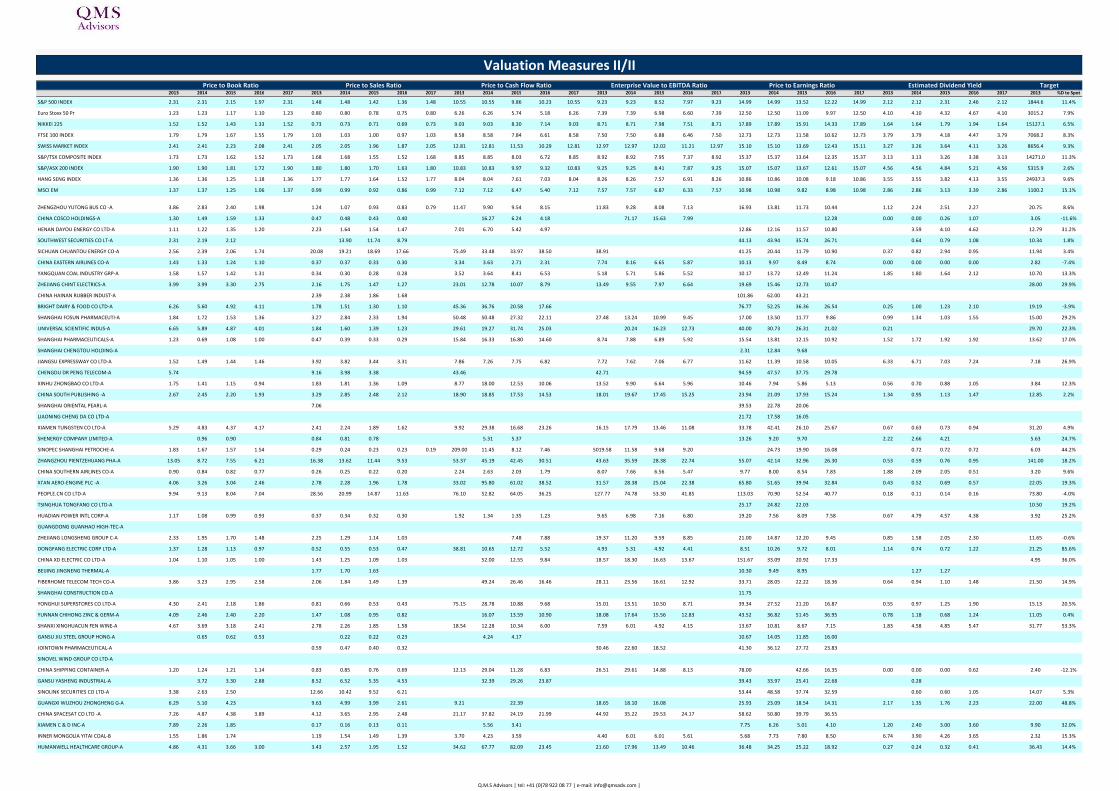
Price to Earnings Ratio
Valuation Measures II/II
Estimated Dividend YieldPrice to Book Ratio Price to Sales Ratio Price to Cash Flow Ratio Enterprise Value to EBITDA Ratio Target
Q.M.S Advisors | tel: +41 (0)78 922 08 77 | e-mail: [email protected] |
Page 8
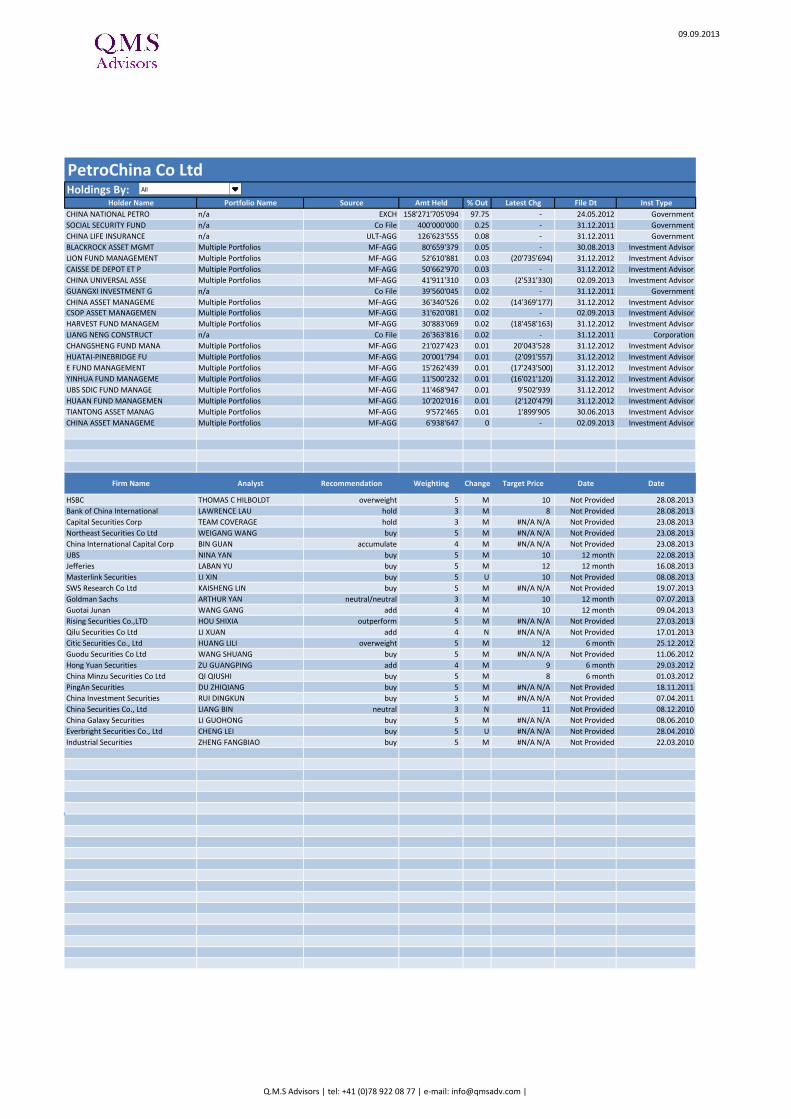
09.09.2013
PetroChina Company Limited explores, develops, and produces crude oil and
natural gas. The Company also refines, transports, and distributes crude oil
and petroleum products, produces and sells chemicals, and transmits, markets
and sells natural gas.
Latest Fiscal Year: 12/2012
LTM as of: 06/yy
52-Week High (04.02.2013) 9.50
52-Week Low (25.06.2013) 7.08
Daily Volume
8.05
52-Week High % Change -15.26% Dividend Yield 3.63
52-Week Low % Change 13.70% Beta 0.68
% 52 Week Price Range High/Low 33.47% Equity Float 3'184.45
Shares Out 30.06.2013 161'922.1 Short Int -
1'450'189.25 1 Yr Total Return -7.58%
Total Debt 444'826.00 YTD Return -9.56%
Preferred Stock 0.0 Adjusted BETA 0.679
Minority Interest 116'738.0 Analyst Recs 14
Cash and Equivalents 46'245.00 Consensus Rating 4.357
Enterprise Value 1'976'613.29
Average Volume 5 Day 15'414'060
601857 CH EQUITY YTD Change - Average Volume 30 Day 15'162'860
601857 CH EQUITY YTD % CHANGE - Average Volume 3 Month 19'996'310
LTM-4Q LTM FY+1 FY+2 FQ+1 FQ+2
31.12.2008 31.12.2009 31.12.2010 31.12.2011 31.12.2012 06/yy 06/yy 12/13 Y 12/14 Y 09/13 Q3 12/13 Q4
1'072'604.0 1'019'275.0 1'465'415.0 2'003'843.0 2'195'296.0 1'969'829 2'071'212 2'407'403 2'526'571 - -
1.78x 2.57x 1.54x 1.04x 0.99x 4.01x 3.83x - - - -
256'680.0 237'168.0 303'643.0 323'368.0 329'642.0 149'425.0 85'592.0 335'813.0 320'871.0 - -
7.45x 11.04x 7.43x 6.43x 6.57x 0.00x 0.00x 5.89x 6.16x - -
114'453.0 103'387.0 139'992.0 132'961.0 115'326.0 129'012.0 118'821.0 122'835.0 130'943.5 - -
9.49x 14.65x 11.33x 10.74x 14.02x 11.62x 9.97x 11.35x 10.72x - -
EBITDA 329'642.00 Long-Term Rating Date -
EBIT 177'667.00 Long-Term Rating -
Operating Margin 8.09% Long-Term Outlook -
Pretax Margin 7.60% Short-Term Rating Date -
Return on Assets 5.41% Short-Term Rating -
Return on Common Equity 11.09%
Return on Capital 8.70% EBITDA/Interest Exp. 17.62
Asset Turnover 0.97% (EBITDA-Capex)/Interest Exp. 0.96
Net Debt/EBITDA 1.26
Gross Margin - Total Debt/EBITDA 1.76
EBITDA Margin 14.7%
EBIT Margin 7.5% Total Debt/Equity 41.8%
Net Income Margin 5.3% Total Debt/Capital 27.4%
Asset Turnover 0.97
Current Ratio 0.72 Net Fixed Asset Turnover 1.85
Quick Ratio 0.21 Accounts receivable turnover-days 15.24
Debt to Assets 20.51% Inventory Days -
Tot Debt to Common Equity 41.81% Accounts Payable Turnover Day -
Accounts Receivable Turnover 23.95 Cash Conversion Cycle -
Inventory Turnover -
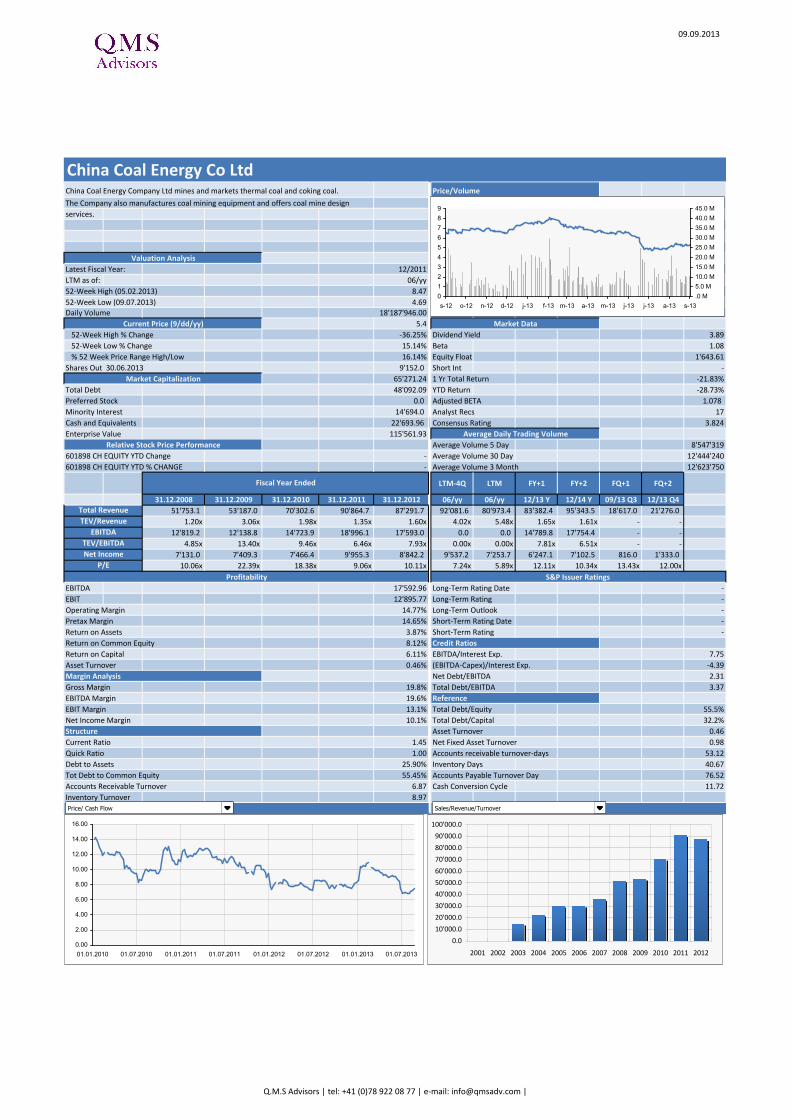
Fiscal Year Ended
PetroChina Co LtdPrice/Volume
Valuation Analysis
31'099'510.00
Current Price (9/dd/yy) Market Data
Net Income
P/E
Market Capitalization
Average Daily Trading Volume
Relative Stock Price Performance
Total Revenue
TEV/Revenue
EBITDA
TEV/EBITDA
Profitability S&P Issuer Ratings
Credit Ratios
Margin Analysis
Reference
Structure
,-.0123456
-,
o!-. l!-. k!-. a!-. g!-0 c!-0 j!-0 Q!-0 j!-0 g!-0 g!-0 Q!-0 o!-0', F
.,', F
1,', F
3,', F
5,', F
-,,', F
-.,', F
0.0
500'000.0
1'000'000.0
1'500'000.0
2'000'000.0
2'500'000.0
2001 2002 2003 2004 2005 2006 2007 2008 2009 2010 2011 2012
,',,
-',,
.',,
0',,
1',,
2',,
3',,
4',,
5',,
6',,
-,',,
,-',-'.,-, ,-',4'.,-, ,-',-'.,-- ,-',4'.,-- ,-',-'.,-. ,-',4'.,-. ,-',-'.,-0 ,-',4'.,-0
FReTn/CTrThoT/PolhirTlAlcST/ !Rna /eis FReTn/CTrThoT/PolhirTlAlcST/ !Rna /eis
Q.M.S Advisors | tel: +41 (0)78 922 08 77 | e-mail: [email protected] |
Page 9
09.09.2013
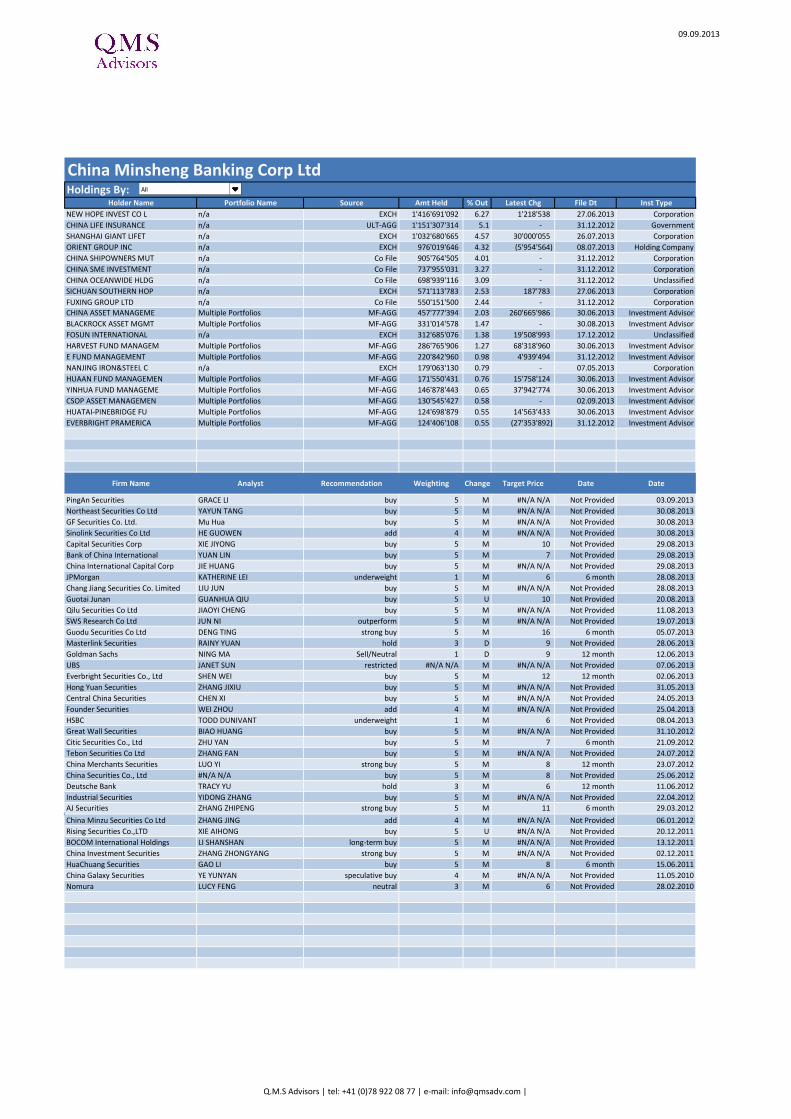
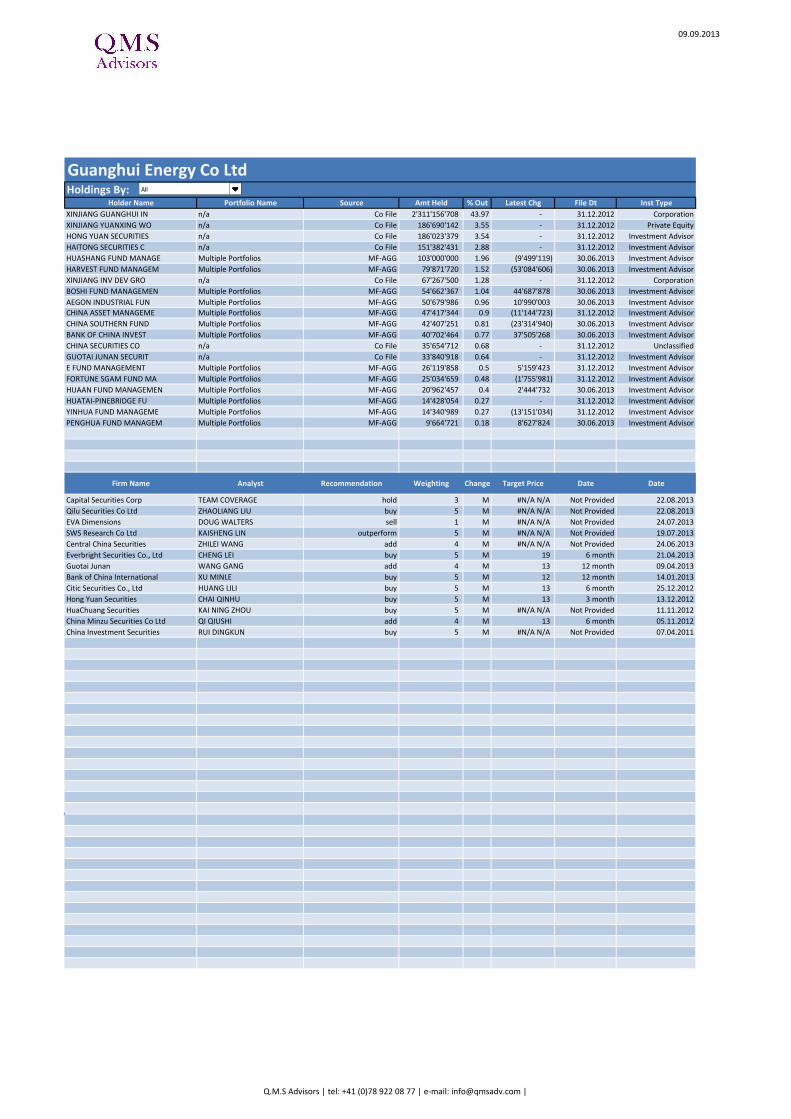
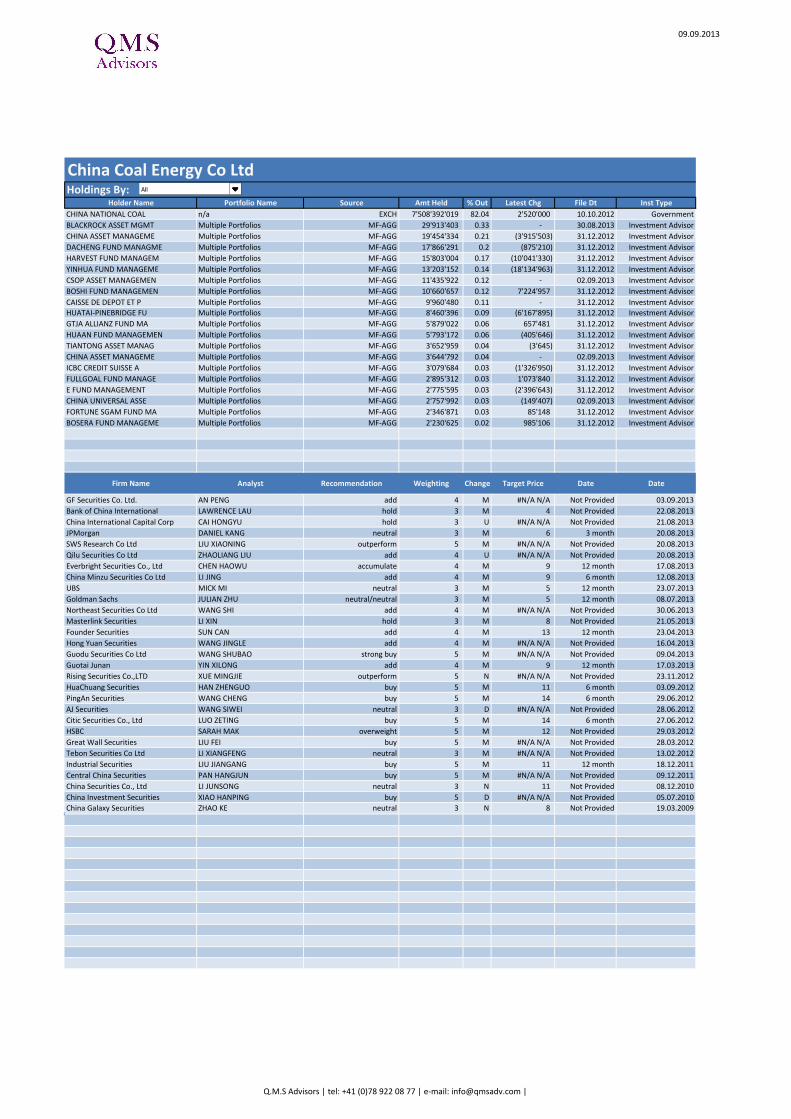
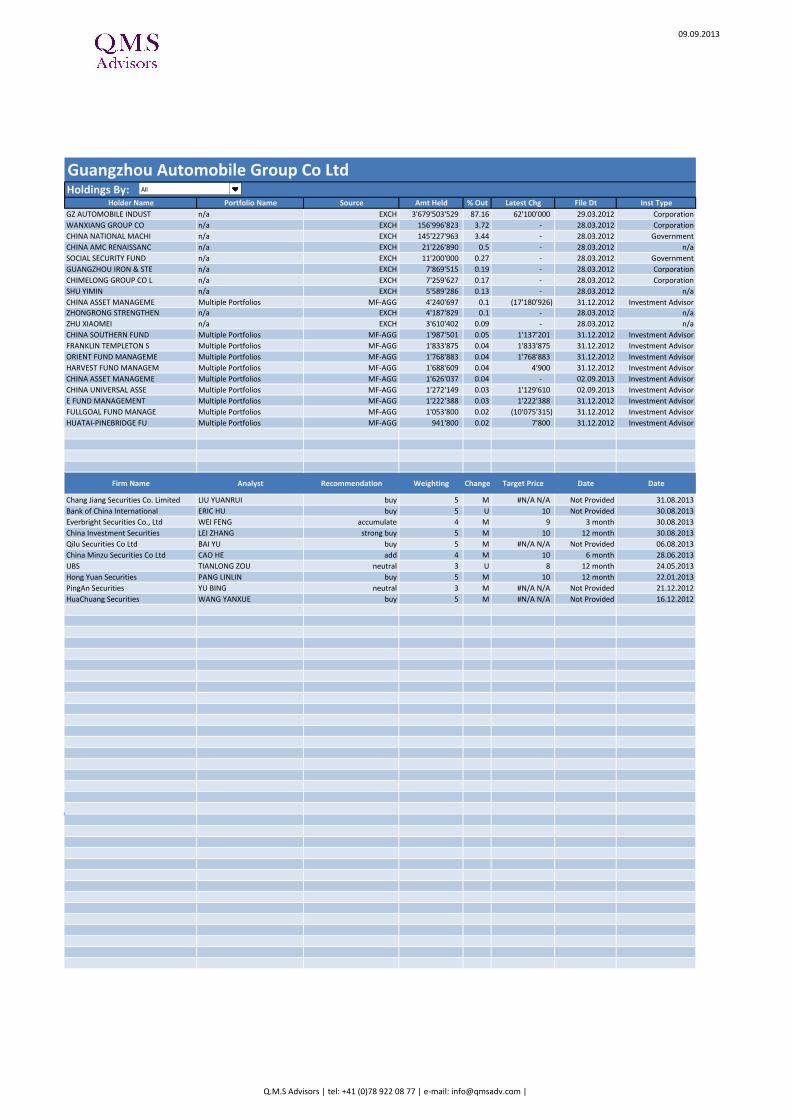
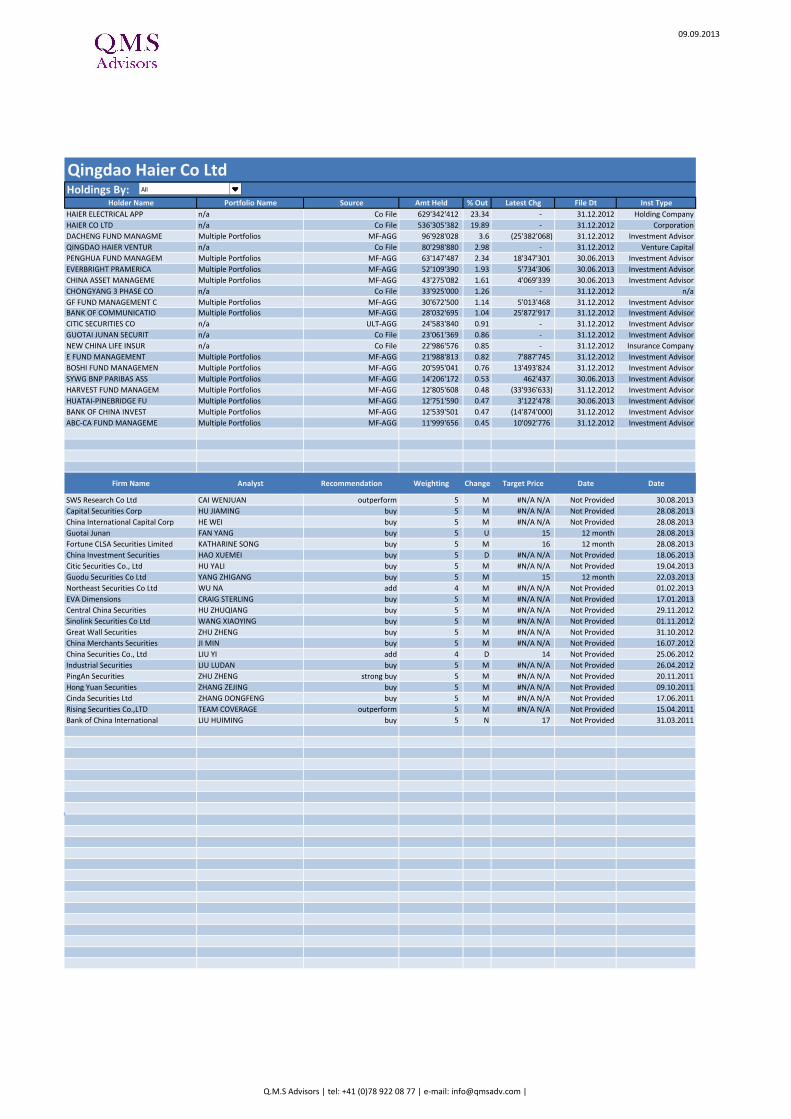
Holder Name Portfolio Name Source Amt Held % Out Latest Chg File Dt Inst Type
CHINA NATIONAL PETRO n/a EXCH 158'271'705'094 97.75 - 24.05.2012 Government
SOCIAL SECURITY FUND n/a Co File 400'000'000 0.25 - 31.12.2011 Government
CHINA LIFE INSURANCE n/a ULT-AGG 126'623'555 0.08 - 31.12.2011 Government
BLACKROCK ASSET MGMT Multiple Portfolios MF-AGG 80'659'379 0.05 - 30.08.2013 Investment Advisor
LION FUND MANAGEMENT Multiple Portfolios MF-AGG 52'610'881 0.03 (20'735'694) 31.12.2012 Investment Advisor
CAISSE DE DEPOT ET P Multiple Portfolios MF-AGG 50'662'970 0.03 - 31.12.2012 Investment Advisor
CHINA UNIVERSAL ASSE Multiple Portfolios MF-AGG 41'911'310 0.03 (2'531'330) 02.09.2013 Investment Advisor
GUANGXI INVESTMENT G n/a Co File 39'560'045 0.02 - 31.12.2011 Government
CHINA ASSET MANAGEME Multiple Portfolios MF-AGG 36'340'526 0.02 (14'369'177) 31.12.2012 Investment Advisor
CSOP ASSET MANAGEMEN Multiple Portfolios MF-AGG 31'620'081 0.02 - 02.09.2013 Investment Advisor
HARVEST FUND MANAGEM Multiple Portfolios MF-AGG 30'883'069 0.02 (18'458'163) 31.12.2012 Investment Advisor
LIANG NENG CONSTRUCT n/a Co File 26'363'816 0.02 - 31.12.2011 Corporation
CHANGSHENG FUND MANA Multiple Portfolios MF-AGG 21'027'423 0.01 20'043'528 31.12.2012 Investment Advisor
HUATAI-PINEBRIDGE FU Multiple Portfolios MF-AGG 20'001'794 0.01 (2'091'557) 31.12.2012 Investment Advisor
E FUND MANAGEMENT Multiple Portfolios MF-AGG 15'262'439 0.01 (17'243'500) 31.12.2012 Investment Advisor
YINHUA FUND MANAGEME Multiple Portfolios MF-AGG 11'500'232 0.01 (16'021'120) 31.12.2012 Investment Advisor
UBS SDIC FUND MANAGE Multiple Portfolios MF-AGG 11'468'947 0.01 9'502'939 31.12.2012 Investment Advisor
HUAAN FUND MANAGEMEN Multiple Portfolios MF-AGG 10'202'016 0.01 (2'120'479) 31.12.2012 Investment Advisor
TIANTONG ASSET MANAG Multiple Portfolios MF-AGG 9'572'465 0.01 1'899'905 30.06.2013 Investment Advisor
CHINA ASSET MANAGEME Multiple Portfolios MF-AGG 6'938'647 0 - 02.09.2013 Investment Advisor
Firm Name Analyst Recommendation Weighting Change Target Price Date Date
HSBC THOMAS C HILBOLDT overweight 5 M 10 Not Provided 28.08.2013
Bank of China International LAWRENCE LAU hold 3 M 8 Not Provided 28.08.2013
Capital Securities Corp TEAM COVERAGE hold 3 M #N/A N/A Not Provided 23.08.2013
Northeast Securities Co Ltd WEIGANG WANG buy 5 M #N/A N/A Not Provided 23.08.2013
China International Capital Corp BIN GUAN accumulate 4 M #N/A N/A Not Provided 23.08.2013
UBS NINA YAN buy 5 M 10 12 month 22.08.2013
Jefferies LABAN YU buy 5 M 12 12 month 16.08.2013
Masterlink Securities LI XIN buy 5 U 10 Not Provided 08.08.2013
SWS Research Co Ltd KAISHENG LIN buy 5 M #N/A N/A Not Provided 19.07.2013
Goldman Sachs ARTHUR YAN neutral/neutral 3 M 10 12 month 07.07.2013
Guotai Junan WANG GANG add 4 M 10 12 month 09.04.2013
Rising Securities Co.,LTD HOU SHIXIA outperform 5 M #N/A N/A Not Provided 27.03.2013
Qilu Securities Co Ltd LI XUAN add 4 N #N/A N/A Not Provided 17.01.2013
Citic Securities Co., Ltd HUANG LILI overweight 5 M 12 6 month 25.12.2012
Guodu Securities Co Ltd WANG SHUANG buy 5 M #N/A N/A Not Provided 11.06.2012
Hong Yuan Securities ZU GUANGPING add 4 M 9 6 month 29.03.2012
China Minzu Securities Co Ltd QI QIUSHI buy 5 M 8 6 month 01.03.2012
PingAn Securities DU ZHIQIANG buy 5 M #N/A N/A Not Provided 18.11.2011
China Investment Securities RUI DINGKUN buy 5 M #N/A N/A Not Provided 07.04.2011
China Securities Co., Ltd LIANG BIN neutral 3 N 11 Not Provided 08.12.2010
China Galaxy Securities LI GUOHONG buy 5 M #N/A N/A Not Provided 08.06.2010
Everbright Securities Co., Ltd CHENG LEI buy 5 U #N/A N/A Not Provided 28.04.2010
Industrial Securities ZHENG FANGBIAO buy 5 M #N/A N/A Not Provided 22.03.2010
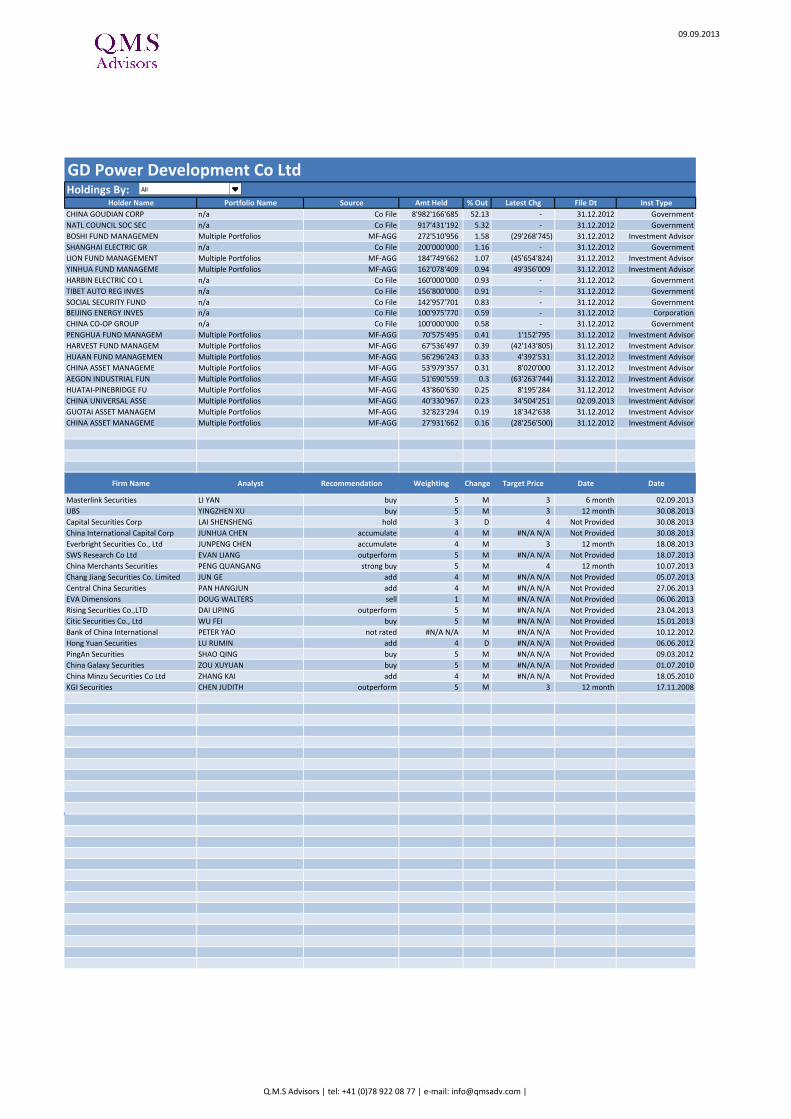
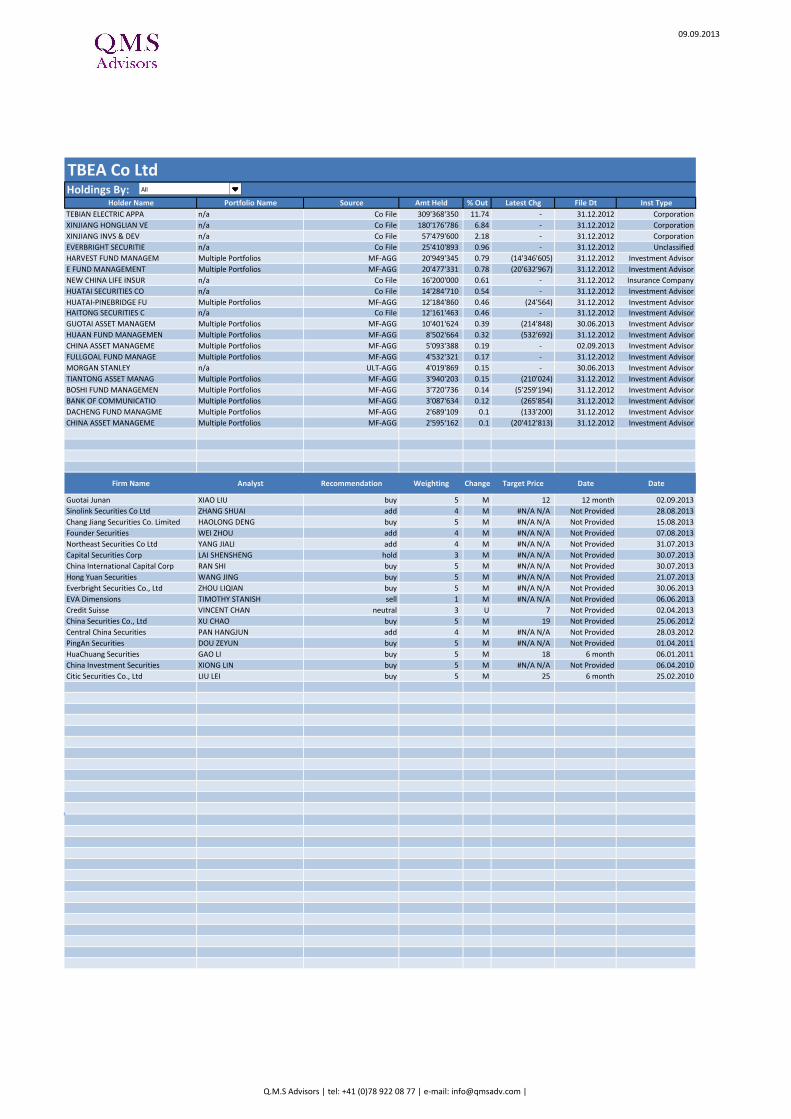
Holdings By:
PetroChina Co Ltd ee
Q.M.S Advisors | tel: +41 (0)78 922 08 77 | e-mail: [email protected] |
Page 10
09.09.2013
Industrial and Commercial Bank of China Ltd provides a broad range of personal
and corporate commercial banking services all over China. The Bank's businesses
include deposit, loan, credit card, fund underwriting and trust, and foreign
currency settlement and trading.
Latest Fiscal Year: 12/2012
LTM as of: 06/yy
52-Week High (04.02.2013) 4.53
52-Week Low (26.06.2013) 3.40
Daily Volume
4.08
52-Week High % Change -9.93% Dividend Yield -
52-Week Low % Change 20.00% Beta 0.62
% 52 Week Price Range High/Low 45.13% Equity Float 15'538.63
Shares Out 30.06.2013 262'854.8 Short Int -
1'441'698.88 1 Yr Total Return 14.23%
Total Debt 2'277'630.00 YTD Return 4.60%
Preferred Stock 0.0 Adjusted BETA 0.618
Minority Interest 3'462.0 Analyst Recs 18
Cash and Equivalents 4'355'972.00 Consensus Rating 4.389
Enterprise Value -
Average Volume 5 Day 38'819'640
601398 CH EQUITY YTD Change - Average Volume 30 Day 41'293'060
601398 CH EQUITY YTD % CHANGE - Average Volume 3 Month 69'426'410
LTM-4Q LTM FY+1 FY+2 FQ+1 FQ+2
31.12.2008 31.12.2009 31.12.2010 31.12.2011 31.12.2012 06/yy 06/yy 12/13 Y 12/14 Y 09/13 Q3 12/13 Q4
469'928.0 470'638.0 544'045.0 704'382.0 840'810.0 791'912.0 884'476.0 578'159.8 635'949.0 - -
- - - - - 0.00x 0.00x - - - -
- - - - - 0.0 0.0 - - - -
- - - - - 0.00x 0.00x - - - -
110'841.0 128'645.0 165'156.0 208'265.0 238'532.0 221'944.0 253'719.0 260'066.1 276'753.6 - -
10.73x 13.95x 8.83x 7.07x 6.10x 6.20x 5.50x 5.58x 5.16x - -
EBITDA - Long-Term Rating Date 09.12.2010
EBIT - Long-Term Rating A
Operating Margin 56.75% Long-Term Outlook STABLE
Pretax Margin 57.46% Short-Term Rating Date 09.12.2010
Return on Assets 1.42% Short-Term Rating A-1
Return on Common Equity 23.19%
Return on Capital 7.70% EBITDA/Interest Exp. -
Asset Turnover 0.05% (EBITDA-Capex)/Interest Exp. -
Net Debt/EBITDA -
Gross Margin - Total Debt/EBITDA -
EBITDA Margin -
EBIT Margin - Total Debt/Equity 202.5%
Net Income Margin 44.4% Total Debt/Capital 66.9%
Asset Turnover 0.05
Current Ratio - Net Fixed Asset Turnover 6.28
Quick Ratio - Accounts receivable turnover-days -
Debt to Assets 12.98% Inventory Days -
Tot Debt to Common Equity 202.46% Accounts Payable Turnover Day -
Accounts Receivable Turnover - Cash Conversion Cycle -
Inventory Turnover -
Profitability S&P Issuer Ratings
Credit Ratios
Margin Analysis
Reference
Structure
Net Income
P/E
Market Capitalization
Average Daily Trading Volume
Relative Stock Price Performance
Total Revenue
TEV/Revenue
EBITDA
TEV/EBITDA
Fiscal Year Ended
Industrial & Commercial Bank of China LtdPrice/Volume
Valuation Analysis
221'307'304.00
Current Price (9/dd/yy) Market Data
,--..00112
o!-. l!-. k!-. a!-. g!-0 c!-0 j!-0 Q!-0 j!-0 g!-0 g!-0 Q!-0 o!-0', F
2,', F
-,,', F
-2,', F
.,,', F
.2,', F
0,,', F
0.0
100'000.0
200'000.0
300'000.0
400'000.0
500'000.0
600'000.0
700'000.0
800'000.0
900'000.0
2001 2002 2003 2004 2005 2006 2007 2008 2009 2010 2011 2012
,',,
2,',,
-,,',,
-2,',,
.,,',,
.2,',,
0,,',,
02,',,
,-',-'.,-, ,-',4'.,-, ,-',-'.,-- ,-',4'.,-- ,-',-'.,-. ,-',4'.,-. ,-',-'.,-0 ,-',4'.,-0
FReTn/CTrThoT/PolhirTlAlcST/ !Rna /eis FReTn/CTrThoT/PolhirTlAlcST/ !Rna /eis
Q.M.S Advisors | tel: +41 (0)78 922 08 77 | e-mail: [email protected] |
Page 11
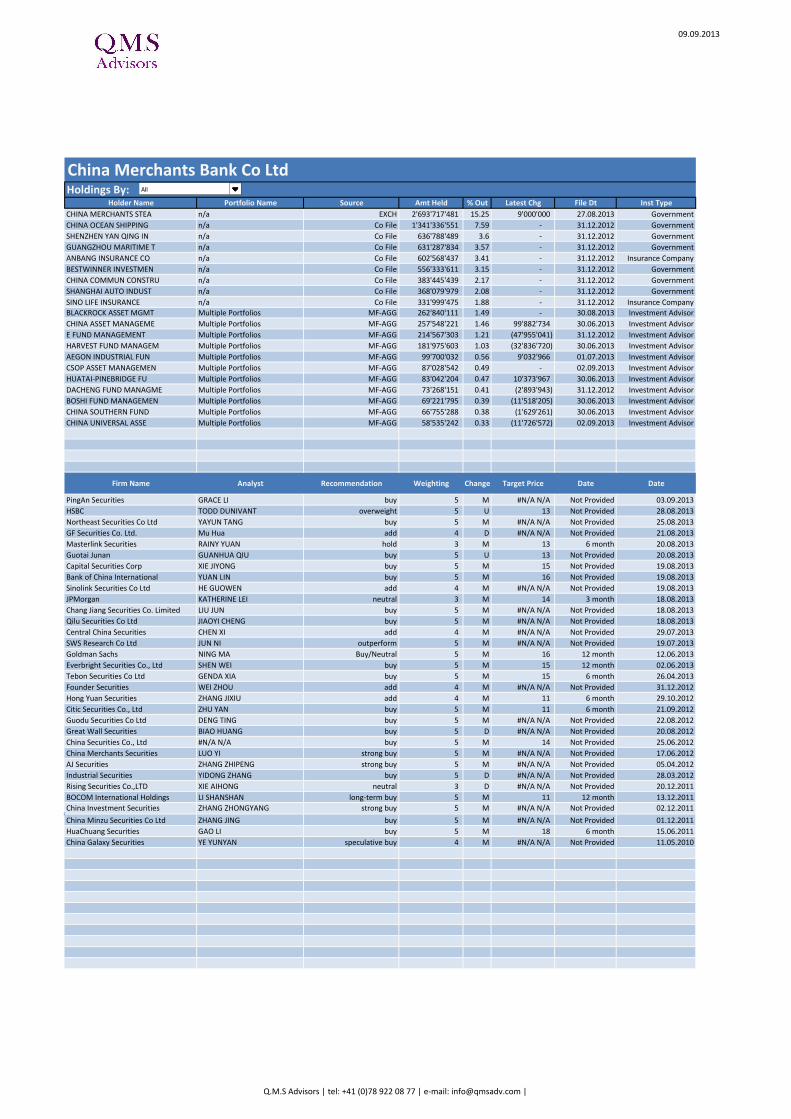
09.09.2013
Holder Name Portfolio Name Source Amt Held % Out Latest Chg File Dt Inst Type
CHINA INVESTMENT COR n/a ULT-AGG 123'999'728'833 47.17 - 17.06.2013 Investment Advisor
CHINA MINISTRY OF FI n/a Co File 123'316'451'864 46.91 - 31.12.2012 Government
PING AN LIFE INSURAN n/a Co File 2'806'269'049 1.07 - 31.12.2012 Insurance Company
ICBC CREDIT SUISSE F n/a Co File 1'053'190'083 0.4 - 31.12.2012 n/a
CHINA LIFE INSURANCE n/a ULT-AGG 869'328'284 0.33 - 31.12.2012 Government
ANBANG ASSETS INSUR n/a Co File 544'890'787 0.21 - 31.12.2012 Insurance Company
SINO LIFE INSURANCE n/a Co File 386'771'556 0.15 - 31.12.2012 Insurance Company
BLACKROCK ASSET MGMT Multiple Portfolios MF-AGG 306'610'064 0.12 - 30.08.2013 Investment Advisor
CHINA PACIFIC LIFE I n/a Co File 283'287'898 0.11 - 31.12.2012 Insurance Company
E FUND MANAGEMENT Multiple Portfolios MF-AGG 181'585'345 0.07 41'746'595 31.12.2012 Investment Advisor
CHINA ASSET MANAGEME Multiple Portfolios MF-AGG 163'198'980 0.06 57'560'575 31.12.2012 Investment Advisor
CAISSE DE DEPOT ET P Multiple Portfolios MF-AGG 161'198'751 0.06 - 31.12.2012 Investment Advisor
BOSHI FUND MANAGEMEN Multiple Portfolios MF-AGG 146'655'568 0.06 3'070'465 31.12.2012 Investment Advisor
HARVEST FUND MANAGEM Multiple Portfolios MF-AGG 128'940'408 0.05 (106'600'883) 31.12.2012 Investment Advisor
CSOP ASSET MANAGEMEN Multiple Portfolios MF-AGG 122'899'590 0.05 - 02.09.2013 Investment Advisor
SCHRODER INVESTMENT SCHRODER ISF-BRIC (B MF-PART 108'022'255 0.04 108'022'255 31.07.2013 Investment Advisor
HUATAI-PINEBRIDGE FU Multiple Portfolios MF-AGG 101'842'733 0.04 6'716'284 30.06.2013 Investment Advisor
PENGHUA FUND MANAGEM Multiple Portfolios MF-AGG 92'910'984 0.04 (9'595'616) 30.06.2013 Investment Advisor
EASTSPRING INVESTMEN Multiple Portfolios MF-AGG 63'601'742 0.02 63'601'742 31.07.2013 Investment Advisor
HUAAN FUND MANAGEMEN Multiple Portfolios MF-AGG 44'766'299 0.02 43'984'165 31.03.2013 Investment Advisor
Firm Name Analyst Recommendation Weighting Change Target Price Date Date
PingAn Securities GRACE LI buy 5 M #N/A N/A Not Provided 03.09.2013
Capital Securities Corp TEAM COVERAGE buy 5 M 6 Not Provided 30.08.2013
Bank of China International YUAN LIN hold 3 M 5 Not Provided 30.08.2013
Northeast Securities Co Ltd YAYUN TANG add 4 M #N/A N/A Not Provided 30.08.2013
China International Capital Corp JIE HUANG buy 5 M #N/A N/A Not Provided 30.08.2013
JPMorgan KATHERINE LEI overweight 5 M 6 6 month 29.08.2013
Guotai Junan GUANHUA QIU add 4 M 4 12 month 20.08.2013
Chang Jiang Securities Co. Limited LIU JUN add 4 M #N/A N/A Not Provided 18.08.2013
Qilu Securities Co Ltd JIAOYI CHENG add 4 M #N/A N/A Not Provided 11.08.2013
Hua Tai Securities Co., Ltd TEAM COVERAGE add 4 N #N/A N/A Not Provided 08.08.2013
UBS JANET SUN buy 5 M 5 12 month 07.08.2013
SWS Research Co Ltd JUN NI outperform 5 M #N/A N/A Not Provided 19.07.2013
Masterlink Securities RAINY YUAN hold 3 M 4 Not Provided 28.06.2013
GF Securities Co. Ltd. Mu Hua add 4 N #N/A N/A Not Provided 19.06.2013
Goldman Sachs NING MA Buy/Neutral 5 M 5 12 month 12.06.2013
Everbright Securities Co., Ltd SHEN WEI accumulate 4 M 4 12 month 02.06.2013
Hong Yuan Securities ZHANG JIXIU add 4 M 4 6 month 31.05.2013
HSBC TODD DUNIVANT overweight 5 M 5 Not Provided 17.09.2012
China Merchants Securities LUO YI strong buy 5 M #N/A N/A Not Provided 23.07.2012
Central China Securities CHEN XI add 4 M #N/A N/A Not Provided 03.07.2012
Citic Securities Co., Ltd ZHU YAN overweight 5 M #N/A N/A Not Provided 29.06.2012
China Securities Co., Ltd #N/A N/A add 4 M 5 Not Provided 25.06.2012
AJ Securities ZHANG ZHIPENG buy 5 N #N/A N/A Not Provided 05.04.2012
Industrial Securities YIDONG ZHANG buy 5 M #N/A N/A Not Provided 29.03.2012
China Minzu Securities Co Ltd ZHANG JING buy 5 M #N/A N/A Not Provided 29.12.2011
Rising Securities Co.,LTD XIE AIHONG neutral 3 D #N/A N/A Not Provided 20.12.2011
BOCOM International Holdings LI SHANSHAN long-term buy 5 M #N/A N/A Not Provided 13.12.2011
China Investment Securities ZHANG ZHONGYANG buy 5 M #N/A N/A Not Provided 02.12.2011
Great Wall Securities CHENG BINBIN neutral 3 D #N/A N/A Not Provided 23.05.2011
HuaChuang Securities GAO LI buy 5 M #N/A N/A Not Provided 31.03.2011
Guodu Securities Co Ltd DENG TING buy 5 N #N/A N/A Not Provided 17.12.2010
China Galaxy Securities YE YUNYAN speculative buy 4 M #N/A N/A Not Provided 11.05.2010
Holdings By:
Industrial & Commercial Bank of China Ltd ee
Q.M.S Advisors | tel: +41 (0)78 922 08 77 | e-mail: [email protected] |
Page 12
09.09.2013
Agricultural Bank of China Limited provides a full range of commercial banking
services. The Banks services includes RMB and foreign currency deposit, loan,
international and domestic settlement, bill discount, currency trading, bank
guarantee, and treasury bill underwriting.
Latest Fiscal Year: 12/2012
LTM as of: 06/yy
52-Week High (04.02.2013) 3.28
52-Week Low (26.09.2012) 2.38
Daily Volume
2.72
52-Week High % Change -17.07% Dividend Yield -
52-Week Low % Change 14.29% Beta 0.75
% 52 Week Price Range High/Low 10.00% Equity Float 24'874.63
Shares Out 16.07.2013 294'055.3 Short Int -
888'387.50 1 Yr Total Return 16.19%
Total Debt 1'293'154.00 YTD Return 3.32%
Preferred Stock 0.0 Adjusted BETA 0.752
Minority Interest 1'539.0 Analyst Recs 17
Cash and Equivalents 3'098'724.00 Consensus Rating 4.471
Enterprise Value -
Average Volume 5 Day 72'958'180
601288 CH EQUITY YTD Change - Average Volume 30 Day 70'977'820
601288 CH EQUITY YTD % CHANGE - Average Volume 3 Month 87'364'590
LTM-4Q LTM FY+1 FY+2 FQ+1 FQ+2
31.12.2008 31.12.2009 31.12.2010 31.12.2011 31.12.2012 06/yy 06/yy 12/13 Y 12/14 Y 09/13 Q3 12/13 Q4
335'717.0 339'235.0 409'295.0 547'924.0 652'516.0 612'421.0 683'573.0 459'885.8 510'168.1 - -
- - - - - 0.00x 0.00x - - - -
- - - - - 0.0 0.0 - - - -
- - - - - 0.00x 0.00x - - - -
51'474.0 64'992.0 94'873.0 121'927.0 145'094.0 135'759.0 156'947.0 161'306.6 178'975.8 - -
- - 10.02x 7.13x 6.85x 6.11x 5.31x 5.48x 4.98x - -
EBITDA - Long-Term Rating Date 17.12.2012
EBIT - Long-Term Rating A
Operating Margin 43.79% Long-Term Outlook STABLE
Pretax Margin 43.87% Short-Term Rating Date 17.12.2012
Return on Assets 1.16% Short-Term Rating A-1
Return on Common Equity 21.19%
Return on Capital 7.25% EBITDA/Interest Exp. -
Asset Turnover 0.05% (EBITDA-Capex)/Interest Exp. -
Net Debt/EBITDA -
Gross Margin - Total Debt/EBITDA -
EBITDA Margin -
EBIT Margin - Total Debt/Equity 172.5%
Net Income Margin 33.9% Total Debt/Capital 63.3%
Asset Turnover 0.05
Current Ratio - Net Fixed Asset Turnover 4.34
Quick Ratio - Accounts receivable turnover-days -
Debt to Assets 9.76% Inventory Days -
Tot Debt to Common Equity 172.46% Accounts Payable Turnover Day -
Accounts Receivable Turnover - Cash Conversion Cycle -
Inventory Turnover -
Profitability S&P Issuer Ratings
Credit Ratios
Margin Analysis
Reference
Structure
Net Income
P/E
Market Capitalization
Average Daily Trading Volume
Relative Stock Price Performance
Total Revenue
TEV/Revenue
EBITDA
TEV/EBITDA
Fiscal Year Ended
Agricultural Bank of China LtdPrice/Volume
Valuation Analysis
652'657'229.00
Current Price (9/dd/yy) Market Data
,
-
-
.
.
0
0
1
o!-. l!-. k!-. a!-. g!-0 c!-0 j!-0 Q!-0 j!-0 g!-0 g!-0 Q!-0 o!-0', F
-,,', F
.,,', F
0,,', F
1,,', F
2,,', F
3,,', F
0.0
100'000.0
200'000.0
300'000.0
400'000.0
500'000.0
600'000.0
700'000.0
2001 2002 2003 2004 2005 2006 2007 2008 2009 2010 2011 2012
,',,
.',,
1',,
3',,
5',,
-,',,
-.',,
-1',,
-3',,
,-',-'.,-, ,-',4'.,-, ,-',-'.,-- ,-',4'.,-- ,-',-'.,-. ,-',4'.,-. ,-',-'.,-0 ,-',4'.,-0
FReTn/CTrThoT/PolhirTlAlcST/ !Rna /eis FReTn/CTrThoT/PolhirTlAlcST/ !Rna /eis
Q.M.S Advisors | tel: +41 (0)78 922 08 77 | e-mail: [email protected] |
Page 13
09.09.2013
Holder Name Portfolio Name Source Amt Held % Out Latest Chg File Dt Inst Type
CHINA INVESTMENT COR n/a ULT-AGG 130'695'462'077 44.45 42'934'902 17.06.2013 Investment Advisor
CHINA MINISTRY OF FI n/a Co File 127'361'764'737 43.31 - 31.12.2011 Government
SOCIAL SECURITY FUND n/a Co File 11'122'941'167 3.78 - 31.12.2011 Government
PING AN LIFE INSURAN n/a Co File 4'010'542'258 1.36 - 31.12.2011 Insurance Company
CHINA LIFE INSURANCE n/a ULT-AGG 1'340'244'522 0.46 151'487'522 31.12.2011 Government
FORTUNE TRUST CO LTD n/a Co File 1'105'576'095 0.38 - 31.12.2011 Investment Advisor
BLACKROCK ASSET MGMT Multiple Portfolios MF-AGG 412'621'693 0.14 - 30.08.2013 Investment Advisor
CHINA ASSET MANAGEME Multiple Portfolios MF-AGG 275'115'216 0.09 205'017'612 30.06.2013 Investment Advisor
HARVEST FUND MANAGEM Multiple Portfolios MF-AGG 248'093'733 0.08 (117'997'149) 30.06.2013 Investment Advisor
E FUND MANAGEMENT Multiple Portfolios MF-AGG 247'744'023 0.08 201'774'801 31.12.2012 Investment Advisor
BOSHI FUND MANAGEMEN Multiple Portfolios MF-AGG 241'562'429 0.08 54'475'315 30.06.2013 Investment Advisor
CSOP ASSET MANAGEMEN Multiple Portfolios MF-AGG 160'766'632 0.05 - 02.09.2013 Investment Advisor
HUATAI-PINEBRIDGE FU Multiple Portfolios MF-AGG 138'251'803 0.05 22'874'231 30.06.2013 Investment Advisor
CHINA UNIVERSAL ASSE Multiple Portfolios MF-AGG 115'904'820 0.04 (143'610'456) 02.09.2013 Investment Advisor
HUAAN FUND MANAGEMEN Multiple Portfolios MF-AGG 100'408'949 0.03 26'631'820 30.06.2013 Investment Advisor
LION FUND MANAGEMENT Multiple Portfolios MF-AGG 83'961'084 0.03 76'843'838 31.12.2012 Investment Advisor
YINHUA FUND MANAGEME Multiple Portfolios MF-AGG 69'354'882 0.02 (47'924'652) 31.12.2012 Investment Advisor
ICBC CREDIT SUISSE A Multiple Portfolios MF-AGG 57'599'700 0.02 9'370'300 30.06.2013 Investment Advisor
CHINA ASSET MANAGEME Multiple Portfolios MF-AGG 49'664'716 0.02 - 02.09.2013 Investment Advisor
CCB PRINCIPAL ASSET Multiple Portfolios MF-AGG 46'460'404 0.02 24'497'172 30.06.2013 Investment Advisor
Firm Name Analyst Recommendation Weighting Change Target Price Date Date
Northeast Securities Co Ltd YAYUN TANG add 4 M #N/A N/A Not Provided 30.08.2013
China International Capital Corp JIE HUANG buy 5 M 4 12 month 29.08.2013
PingAn Securities GRACE LI buy 5 M 3 Not Provided 29.08.2013
HSBC TODD DUNIVANT overweight 5 U 3 Not Provided 28.08.2013
Guotai Junan GUANHUA QIU add 4 M 3 Not Provided 20.08.2013
Chang Jiang Securities Co. Limited LIU JUN buy 5 M #N/A N/A Not Provided 18.08.2013
Qilu Securities Co Ltd JIAOYI CHENG buy 5 M #N/A N/A Not Provided 11.08.2013
UBS JANET SUN neutral 3 M 3 12 month 07.08.2013
GF Securities Co. Ltd. Mu Hua buy 5 U #N/A N/A Not Provided 23.07.2013
SWS Research Co Ltd JUN NI outperform 5 M #N/A N/A Not Provided 19.07.2013
Masterlink Securities RAINY YUAN buy 5 M 3 Not Provided 28.06.2013
Goldman Sachs NING MA Buy/Neutral 5 M 4 12 month 12.06.2013
Everbright Securities Co., Ltd SHEN WEI accumulate 4 M 3 12 month 02.06.2013
Hong Yuan Securities ZHANG JIXIU add 4 M #N/A N/A Not Provided 31.05.2013
Founder Securities WEI ZHOU add 4 M #N/A N/A Not Provided 01.04.2013
Capital Securities Corp TEAM COVERAGE buy 5 M #N/A N/A Not Provided 27.03.2013
Sinolink Securities Co Ltd JIANGANG CHEN neutral 3 N #N/A N/A Not Provided 29.10.2012
Bank of China International JINHUA YIN buy 5 M 3 Not Provided 30.08.2012
China Merchants Securities LUO YI strong buy 5 M #N/A N/A Not Provided 23.07.2012
Citic Securities Co., Ltd ZHU YAN overweight 5 M 3 6 month 29.06.2012
China Securities Co., Ltd #N/A N/A add 4 M 3 Not Provided 25.06.2012
Industrial Securities YIDONG ZHANG buy 5 M #N/A N/A Not Provided 20.04.2012
AJ Securities ZHANG ZHIPENG buy 5 M #N/A N/A Not Provided 05.04.2012
Rising Securities Co.,LTD XIE AIHONG neutral 3 D #N/A N/A Not Provided 20.12.2011
BOCOM International Holdings LI SHANSHAN long-term buy 5 M #N/A N/A Not Provided 13.12.2011
China Investment Securities FAN LIN buy 5 M #N/A N/A Not Provided 02.12.2011
Central China Securities CHEN XI add 4 M #N/A N/A Not Provided 27.10.2011
Guodu Securities Co Ltd DENG TING buy 5 M #N/A N/A Not Provided 11.10.2011
HuaChuang Securities GAO LI buy 5 N #N/A N/A Not Provided 30.03.2011
China Minzu Securities Co Ltd ZHANG JING neutral 3 N 3 6 month 01.09.2010
Holdings By:
Agricultural Bank of China Ltd ee
Q.M.S Advisors | tel: +41 (0)78 922 08 77 | e-mail: [email protected] |
Page 14
09.09.2013
Bank of China Ltd provides a complete range of banking and other financial
services to individual and corporation customers worldwide. The bank's services
include retail banking, Great Wall credit card and debit card services, consumer
credit, foreign currency transaction, corporate banking, settlement and
clearing,investment banking, and fund management businesses.
Latest Fiscal Year: 12/2012
LTM as of: 06/yy
52-Week High (04.02.2013) 3.26
52-Week Low (25.06.2013) 2.48
Daily Volume
2.85
52-Week High % Change -12.58% Dividend Yield 6.14
52-Week Low % Change 14.92% Beta 0.64
% 52 Week Price Range High/Low 25.64% Equity Float 5'915.29
Shares Out 30.06.2013 195'525.2 Short Int -
788'258.31 1 Yr Total Return 10.68%
Total Debt 2'243'457.00 YTD Return 3.86%
Preferred Stock 0.0 Adjusted BETA 0.640
Minority Interest 36'865.0 Analyst Recs 17
Cash and Equivalents 3'157'170.00 Consensus Rating 3.529
Enterprise Value -
Average Volume 5 Day 28'449'400
601988 CH EQUITY YTD Change - Average Volume 30 Day 26'281'740
601988 CH EQUITY YTD % CHANGE - Average Volume 3 Month 30'319'170
LTM-4Q LTM FY+1 FY+2 FQ+1 FQ+2
31.12.2008 31.12.2009 31.12.2010 31.12.2011 31.12.2012 06/yy 06/yy 12/13 Y 12/14 Y 09/13 Q3 12/13 Q4
355'641.0 337'018.0 395'271.0 514'133.0 619'095.0 575'917.0 630'716.0 393'790.4 430'796.9 - -
- - - - - 0.00x 0.00x - - - -
- - - - - 0.0 0.0 - - - -
- - - - - 0.00x 0.00x - - - -
64'360.0 80'819.0 104'418.0 124'276.0 139'432.0 129'238.0 148'552.0 150'422.4 159'650.2 - -
7.47x 11.62x 8.91x 5.16x 5.57x 5.22x 4.74x 5.43x 5.03x - -
EBITDA - Long-Term Rating Date 29.11.2011
EBIT - Long-Term Rating A
Operating Margin 50.02% Long-Term Outlook STABLE
Pretax Margin 50.71% Short-Term Rating Date 29.11.2011
Return on Assets 1.14% Short-Term Rating A-1
Return on Common Equity 18.50%
Return on Capital 5.26% EBITDA/Interest Exp. -
Asset Turnover 0.05% (EBITDA-Capex)/Interest Exp. -
Net Debt/EBITDA -
Gross Margin - Total Debt/EBITDA -
EBITDA Margin -
EBIT Margin - Total Debt/Equity 272.0%
Net Income Margin 37.7% Total Debt/Capital 72.3%
Asset Turnover 0.05
Current Ratio - Net Fixed Asset Turnover 4.10
Quick Ratio - Accounts receivable turnover-days -
Debt to Assets 17.69% Inventory Days -
Tot Debt to Common Equity 272.04% Accounts Payable Turnover Day -
Accounts Receivable Turnover - Cash Conversion Cycle -
Inventory Turnover -
Fiscal Year Ended
Bank of China LtdPrice/Volume
Valuation Analysis
207'431'684.00
Current Price (9/dd/yy) Market Data
Net Income
P/E
Market Capitalization
Average Daily Trading Volume
Relative Stock Price Performance
Total Revenue
TEV/Revenue
EBITDA
TEV/EBITDA
Profitability S&P Issuer Ratings
Credit Ratios
Margin Analysis
Reference
Structure
,
-
-
.
.
0
0
1
o!-. l!-. k!-. a!-. g!-0 c!-0 j!-0 Q!-0 j!-0 g!-0 g!-0 Q!-0 o!-0', F.,', F1,', F3,', F5,', F-,,', F-.,', F-1,', F-3,', F-5,', F.,,', F
0.0
100'000.0
200'000.0
300'000.0
400'000.0
500'000.0
600'000.0
700'000.0
2001 2002 2003 2004 2005 2006 2007 2008 2009 2010 2011 2012
,',,
2,',,
-,,',,
-2,',,
.,,',,
.2,',,
0,,',,
02,',,
1,,',,
,-',-'.,-, ,-',4'.,-, ,-',-'.,-- ,-',4'.,-- ,-',-'.,-. ,-',4'.,-. ,-',-'.,-0 ,-',4'.,-0
FReTn/CTrThoT/PolhirTlAlcST/ !Rna /eis FReTn/CTrThoT/PolhirTlAlcST/ !Rna /eis
Q.M.S Advisors | tel: +41 (0)78 922 08 77 | e-mail: [email protected] |
Page 15
09.09.2013
Holder Name Portfolio Name Source Amt Held % Out Latest Chg File Dt Inst Type
CHINA INVESTMENT COR n/a ULT-AGG 189'084'736'007 96.71 - 17.06.2013 Investment Advisor
CHINA LIFE INSURANCE n/a ULT-AGG 597'786'234 0.31 - 31.03.2012 Government
PICC PROPERTY & CASU n/a Co File 195'759'432 0.1 - 31.12.2011 Government
CAISSE DE DEPOT ET P Multiple Portfolios MF-AGG 178'464'481 0.09 - 31.12.2012 Investment Advisor
BLACKROCK ASSET MGMT Multiple Portfolios MF-AGG 156'494'879 0.08 - 30.08.2013 Investment Advisor
SINO LIFE INSURANCE n/a EXCH 127'044'300 0.06 - 31.03.2012 Insurance Company
SHENHUA GROUP CORP L n/a EXCH 99'999'900 0.05 - 31.03.2012 Government
ALUMINUM CORP OF CHI n/a ULT-AGG 99'999'900 0.05 - 31.03.2012 Holding Company
CHINA SOUTHERN POWER n/a EXCH 90'909'000 0.05 - 31.03.2012 Government
CSOP ASSET MANAGEMEN Multiple Portfolios MF-AGG 61'102'780 0.03 - 02.09.2013 Investment Advisor
HARVEST FUND MANAGEM Multiple Portfolios MF-AGG 60'016'010 0.03 (453'400) 31.12.2012 Investment Advisor
CHINA UNIVERSAL ASSE Multiple Portfolios MF-AGG 59'302'397 0.03 (4'737'806) 02.09.2013 Investment Advisor
BOSHI FUND MANAGEMEN Multiple Portfolios MF-AGG 48'324'421 0.02 16'324'479 30.06.2013 Investment Advisor
PING AN LIFE INSURAN n/a Co File 40'292'342 0.02 - 31.12.2011 Insurance Company
STATE DEVELOPMENT & n/a EXCH 38'550'000 0.02 - 31.03.2012 Government
HUATAI-PINEBRIDGE FU Multiple Portfolios MF-AGG 38'548'036 0.02 (4'239'174) 31.12.2012 Investment Advisor
CHINA MERCHANTS FUND Multiple Portfolios MF-AGG 33'100'151 0.02 33'100'151 31.12.2012 Investment Advisor
GTJA ALLIANZ FUND MA Multiple Portfolios MF-AGG 20'781'288 0.01 310'795 31.12.2012 Investment Advisor
HUAAN FUND MANAGEMEN Multiple Portfolios MF-AGG 16'792'949 0.01 (2'994'600) 31.12.2012 Investment Advisor
E FUND MANAGEMENT Multiple Portfolios MF-AGG 16'513'909 0.01 1'427'300 31.12.2012 Investment Advisor
Firm Name Analyst Recommendation Weighting Change Target Price Date Date
PingAn Securities GRACE LI neutral 3 M #N/A N/A Not Provided 03.09.2013
JPMorgan KATHERINE LEI neutral 3 M 3 3 month 30.08.2013
HSBC TODD DUNIVANT overweight 5 U 3 Not Provided 30.08.2013
Capital Securities Corp TEAM COVERAGE hold 3 M #N/A N/A Not Provided 30.08.2013
Bank of China International YUAN LIN buy 5 M 5 Not Provided 30.08.2013
Northeast Securities Co Ltd YAYUN TANG neutral 3 M #N/A N/A Not Provided 30.08.2013
China International Capital Corp JIE HUANG buy 5 M #N/A N/A Not Provided 30.08.2013
Guotai Junan GUANHUA QIU neutral 3 M 3 Not Provided 20.08.2013
Chang Jiang Securities Co. Limited LIU JUN neutral 3 M #N/A N/A Not Provided 18.08.2013
Qilu Securities Co Ltd JIAOYI CHENG hold 3 M #N/A N/A Not Provided 11.08.2013
UBS JANET SUN neutral 3 M 3 12 month 07.08.2013
SWS Research Co Ltd JUN NI outperform 5 U #N/A N/A Not Provided 19.07.2013
Masterlink Securities RAINY YUAN hold 3 M 3 Not Provided 28.06.2013
GF Securities Co. Ltd. Mu Hua hold 3 M #N/A N/A Not Provided 19.06.2013
Goldman Sachs NING MA neutral/neutral 3 M 3 12 month 12.06.2013
Everbright Securities Co., Ltd SHEN WEI accumulate 4 M 3 12 month 02.06.2013
Hong Yuan Securities ZHANG JIXIU neutral 3 M 3 6 month 01.12.2012
Central China Securities CHEN XI monitored #N/A N/A N #N/A N/A Not Provided 26.10.2012
Sinolink Securities Co Ltd JIANGANG CHEN neutral 3 N #N/A N/A Not Provided 24.08.2012
China Merchants Securities LUO YI buy 5 M #N/A N/A Not Provided 23.07.2012
Citic Securities Co., Ltd ZHU YAN overweight 5 M 4 6 month 29.06.2012
China Securities Co., Ltd #N/A N/A add 4 M 4 Not Provided 25.06.2012
AJ Securities ZHANG ZHIPENG neutral 3 M #N/A N/A Not Provided 05.04.2012
Rising Securities Co.,LTD XIE AIHONG neutral 3 M #N/A N/A Not Provided 20.12.2011
BOCOM International Holdings LI SHANSHAN long-term buy 5 M 5 12 month 13.12.2011
China Investment Securities ZHANG ZHONGYANG buy 5 M #N/A N/A Not Provided 02.12.2011
Industrial Securities YIDONG ZHANG buy 5 M #N/A N/A Not Provided 26.10.2011
Great Wall Securities CHENG BINBIN neutral 3 N #N/A N/A Not Provided 23.05.2011
HuaChuang Securities GAO LI buy 5 U #N/A N/A Not Provided 25.03.2011
China Galaxy Securities YE YUNYAN speculative buy 4 M #N/A N/A Not Provided 04.07.2010
Guodu Securities Co Ltd DENG TING buy 5 N #N/A N/A Not Provided 25.01.2010
Holdings By:
Bank of China Ltd ee
Q.M.S Advisors | tel: +41 (0)78 922 08 77 | e-mail: [email protected] |
Page 16
09.09.2013
China Petroleum and Chemical Corporation (Sinopec) refines, produces and trades
petroleum and petrochemical products such as gasoline, diesel, jet fuel,
kerosene, ethylene, synthetic fibers, synthetic rubber, synthetic resins, and
chemical fertilizers. Also, The company explores for and produces crude oil and
natural gas in China.
Latest Fiscal Year: 12/2011
LTM as of: 06/yy
52-Week High (22.03.2013) 5.95
52-Week Low (26.06.2013) 4.05
Daily Volume
4.61
52-Week High % Change -22.47% Dividend Yield -
52-Week Low % Change 13.83% Beta 0.78
% 52 Week Price Range High/Low 23.73% Equity Float 5'515.56
Shares Out 30.06.2013 91'051.8 Short Int -
543'797.94 1 Yr Total Return 1.83%
Total Debt 284'546.00 YTD Return -10.55%
Preferred Stock 0.0 Adjusted BETA 0.784
Minority Interest 37'122.0 Analyst Recs 12
Cash and Equivalents 10'864.00 Consensus Rating 4.500
Enterprise Value 888'218.91
Average Volume 5 Day 41'081'690
600028 CH EQUITY YTD Change - Average Volume 30 Day 41'694'630
600028 CH EQUITY YTD % CHANGE - Average Volume 3 Month 55'520'030
LTM-4Q LTM FY+1 FY+2 FQ+1 FQ+2
31.12.2008 31.12.2009 31.12.2010 31.12.2011 31.12.2012 06/yy 06/yy 12/13 Y 12/14 Y 09/13 Q3 12/13 Q4
1'413'203.0 1'315'915.0 1'876'758.0 2'463'767.0 2'733'618.0 ######### ######### ######### ######### 725'259.0 722'849.0
0.44x 0.60x 0.41x 0.33x 0.33x 1.35x 1.32x 0.32x 0.33x - -
79'798.0 151'557.0 178'098.0 170'962.0 169'557.0 0.0 0.0 192'071.0 203'508.0 - -
7.84x 5.24x 4.34x 4.83x 5.39x 0.00x 0.00x 4.62x 4.36x - -
28'525.0 63'147.0 71'782.0 73'225.0 63'879.0 55'155.0 69'216.0 70'713.0 75'354.8 19'174.0 20'347.0
12.55x 8.36x 7.62x 7.84x 9.60x 8.86x 7.12x 7.18x 6.53x - -
EBITDA 169'557.00 Long-Term Rating Date 16.12.2010
EBIT 99'101.00 Long-Term Rating A+
Operating Margin 3.63% Long-Term Outlook STABLE
Pretax Margin 3.32% Short-Term Rating Date -
Return on Assets 5.67% Short-Term Rating -
Return on Common Equity 13.45%
Return on Capital - EBITDA/Interest Exp. 14.05
Asset Turnover 2.18% (EBITDA-Capex)/Interest Exp. 1.98
Net Debt/EBITDA -
Gross Margin - Total Debt/EBITDA -
EBITDA Margin -
EBIT Margin 3.9% Total Debt/Equity 55.7%
Net Income Margin 2.3% Total Debt/Capital 34.2%
Asset Turnover 2.18
Current Ratio 0.71 Net Fixed Asset Turnover 3.50
Quick Ratio 0.22 Accounts receivable turnover-days 14.11
Debt to Assets 22.46% Inventory Days 31.75
Tot Debt to Common Equity 55.69% Accounts Payable Turnover Day 26.91
Accounts Receivable Turnover 25.87 Cash Conversion Cycle -
Inventory Turnover 11.50
Profitability S&P Issuer Ratings
Credit Ratios
Margin Analysis
Reference
Structure
Net Income
P/E
Market Capitalization
Average Daily Trading Volume
Relative Stock Price Performance
Total Revenue
TEV/Revenue
EBITDA
TEV/EBITDA
Fiscal Year Ended
China Petroleum & Chemical CorpPrice/Volume
Valuation Analysis
104'670'002.00
Current Price (9/dd/yy) Market Data
,
-
.
0
1
2
3
4
o!-. l!-. k!-. a!-. g!-0 c!-0 j!-0 Q!-0 j!-0 g!-0 g!-0 Q!-0 o!-0', F.,', F1,', F3,', F5,', F-,,', F-.,', F-1,', F-3,', F-5,', F.,,', F
0.0
500'000.0
1'000'000.0
1'500'000.0
2'000'000.0
2'500'000.0
3'000'000.0
2001 2002 2003 2004 2005 2006 2007 2008 2009 2010 2011 2012
,',,
-',,
.',,
0',,
1',,
2',,
3',,
4',,
5',,
,-',-'.,-, ,-',4'.,-, ,-',-'.,-- ,-',4'.,-- ,-',-'.,-. ,-',4'.,-. ,-',-'.,-0 ,-',4'.,-0
FReTn/CTrThoT/PolhirTlAlcST/ !Rna /eis FReTn/CTrThoT/PolhirTlAlcST/ !Rna /eis
Q.M.S Advisors | tel: +41 (0)78 922 08 77 | e-mail: [email protected] |
Page 17
09.09.2013
Holder Name Portfolio Name Source Amt Held % Out Latest Chg File Dt Inst Type
CHINA PETROCHEMICAL n/a EXCH 85'536'265'999 93.94 - 09.01.2012 Government
CHINA ASSET MANAGEME Multiple Portfolios MF-AGG 158'946'828 0.17 24'269'838 30.06.2013 Investment Advisor
BLACKROCK ASSET MGMT Multiple Portfolios MF-AGG 128'332'829 0.14 - 30.08.2013 Investment Advisor
UBS SDIC FUND MANAGE Multiple Portfolios MF-AGG 112'951'167 0.12 109'853'982 31.12.2012 Investment Advisor
HUAAN FUND MANAGEMEN Multiple Portfolios MF-AGG 106'444'393 0.12 82'471'029 30.06.2013 Investment Advisor
CHINA SOUTHERN FUND Multiple Portfolios MF-AGG 89'639'446 0.1 21'338'431 30.06.2013 Investment Advisor
E FUND MANAGEMENT Multiple Portfolios MF-AGG 79'121'060 0.09 28'142'252 31.12.2012 Investment Advisor
HFT INVESTMENT MANAG Multiple Portfolios MF-AGG 74'090'330 0.08 52'429'125 31.12.2012 Investment Advisor
LION FUND MANAGEMENT Multiple Portfolios MF-AGG 65'582'966 0.07 24'157'237 31.12.2012 Investment Advisor
HARVEST FUND MANAGEM Multiple Portfolios MF-AGG 54'525'011 0.06 (90'375'052) 31.12.2012 Investment Advisor
CHINA INTERNATIONAL Multiple Portfolios MF-AGG 49'822'569 0.05 35'148'048 31.12.2012 Investment Advisor
CSOP ASSET MANAGEMEN Multiple Portfolios MF-AGG 49'691'491 0.05 - 02.09.2013 Investment Advisor
CHINA ASSET MANAGEME Multiple Portfolios MF-AGG 45'272'988 0.05 41'685'805 30.06.2013 Investment Advisor
CHANGSHENG FUND MANA Multiple Portfolios MF-AGG 43'288'276 0.05 40'018'512 31.12.2012 Investment Advisor
FULLGOAL FUND MANAGE Multiple Portfolios MF-AGG 42'358'017 0.05 9'656'310 31.12.2012 Investment Advisor
HUATAI-PINEBRIDGE FU Multiple Portfolios MF-AGG 35'539'506 0.04 452'491 31.12.2012 Investment Advisor
BOSHI FUND MANAGEMEN Multiple Portfolios MF-AGG 26'156'052 0.03 4'350'875 31.12.2012 Investment Advisor
CHINA UNIVERSAL ASSE Multiple Portfolios MF-AGG 24'399'706 0.03 (1'193'451) 02.09.2013 Investment Advisor
YINHUA FUND MANAGEME Multiple Portfolios MF-AGG 22'171'874 0.02 (29'841'141) 31.12.2012 Investment Advisor
BOSERA FUND MANAGEME Multiple Portfolios MF-AGG 19'772'350 0.02 2'399'812 31.12.2012 Investment Advisor
Firm Name Analyst Recommendation Weighting Change Target Price Date Date
Masterlink Securities LI XIN buy 5 M 5 6 month 29.08.2013
HSBC THOMAS C HILBOLDT underweight 1 M 4 Not Provided 28.08.2013
Capital Securities Corp ZHENG CHUNMING buy 5 M 6 Not Provided 28.08.2013
Bank of China International LAWRENCE LAU buy 5 M 6 Not Provided 28.08.2013
UBS NINA YAN buy 5 M 6 12 month 27.08.2013
Northeast Securities Co Ltd WEIGANG WANG buy 5 M 9 12 month 27.08.2013
Jefferies LABAN YU hold 3 M 4 12 month 16.08.2013
SWS Research Co Ltd KAISHENG LIN buy 5 M #N/A N/A Not Provided 19.07.2013
Hong Yuan Securities XIXIN WANG buy 5 M 8 6 month 14.07.2013
Goldman Sachs ARTHUR YAN Buy/Neutral 5 M 5 12 month 18.06.2013
Everbright Securities Co., Ltd CHENG LEI buy 5 M #N/A N/A Not Provided 21.04.2013
Rising Securities Co.,LTD HOU SHIXIA outperform 5 M #N/A N/A Not Provided 27.03.2013
Holdings By:
China Petroleum & Chemical Corp ee
Q.M.S Advisors | tel: +41 (0)78 922 08 77 | e-mail: [email protected] |
Page 18
09.09.2013
China Life Insurance Co., Limited offers a wide range of life, accident, and
health insurance products and services.
Latest Fiscal Year: 12/2011
LTM as of: 06/yy
52-Week High (04.01.2013) 22.70
52-Week Low (29.07.2013) 12.88
Daily Volume
14.62
52-Week High % Change -35.59% Dividend Yield 0.96
52-Week Low % Change 13.51% Beta 1.19
% 52 Week Price Range High/Low 11.20% Equity Float 1'500.00
Shares Out 30.06.2013 20'823.5 Short Int -
426'605.41 1 Yr Total Return -21.92%
Total Debt 136'480.00 YTD Return -31.04%
Preferred Stock 0.0 Adjusted BETA 1.193
Minority Interest 2'016.0 Analyst Recs 17
Cash and Equivalents 69'452.00 Consensus Rating 4.294
Enterprise Value -
Average Volume 5 Day 11'892'890
601628 CH EQUITY YTD Change - Average Volume 30 Day 13'216'170
601628 CH EQUITY YTD % CHANGE - Average Volume 3 Month 13'197'750
LTM-4Q LTM FY+1 FY+2 FQ+1 FQ+2
31.12.2008 31.12.2009 31.12.2010 31.12.2011 31.12.2012 06/yy 06/yy 12/13 Y 12/14 Y 09/13 Q3 12/13 Q4
299'478.0 339'262.0 385'446.0 370'352.0 371'436.0 376'887.0 421'555.0 430'486.6 470'987.2 - -
1.74x 2.68x 1.61x 1.27x 1.79x 0.00x 0.00x 0.92x 0.81x - -
- - - - - 0.0 0.0 - - - -
- - - - - 0.00x 0.00x - - - -
19'137.0 32'881.0 33'626.0 18'331.0 11'061.0 15'002.0 17'624.0 27'185.0 34'061.0 4'900.0 4'300.0
30.50x 29.11x 22.62x 23.96x 52.18x 0.00x 23.35x 15.52x 12.45x - -
EBITDA - Long-Term Rating Date -
EBIT - Long-Term Rating AA-
Operating Margin 2.83% Long-Term Outlook NEG
Pretax Margin 2.95% Short-Term Rating Date -
Return on Assets 0.94% Short-Term Rating -
Return on Common Equity 7.94%
Return on Capital 5.76% EBITDA/Interest Exp. -
Asset Turnover 0.22% (EBITDA-Capex)/Interest Exp. -
Net Debt/EBITDA -
Gross Margin - Total Debt/EBITDA -
EBITDA Margin -
EBIT Margin - Total Debt/Equity 61.7%
Net Income Margin 3.0% Total Debt/Capital 38.0%
Asset Turnover 0.22
Current Ratio - Net Fixed Asset Turnover -
Quick Ratio - Accounts receivable turnover-days -
Debt to Assets 7.19% Inventory Days -
Tot Debt to Common Equity 61.73% Accounts Payable Turnover Day -
Accounts Receivable Turnover - Cash Conversion Cycle -
Inventory Turnover -
Fiscal Year Ended
China Life Insurance Co LtdPrice/Volume
Valuation Analysis
39'453'850.00
Current Price (9/dd/yy) Market Data
Net Income
P/E
Market Capitalization
Average Daily Trading Volume
Relative Stock Price Performance
Total Revenue
TEV/Revenue
EBITDA
TEV/EBITDA
Profitability S&P Issuer Ratings
Credit Ratios
Margin Analysis
Reference
Structure
,
2
-,
-2
.,
.2
o!-. l!-. k!-. a!-. g!-0 c!-0 j!-0 Q!-0 j!-0 g!-0 g!-0 Q!-0 o!-0', F
-,', F
.,', F
0,', F
1,', F
2,', F
3,', F
0.0
50'000.0
100'000.0
150'000.0
200'000.0
250'000.0
300'000.0
350'000.0
400'000.0
450'000.0
2001 2002 2003 2004 2005 2006 2007 2008 2009 2010 2011 2012,',,
,'.,
,'1,
,'3,
,'5,
-',,
-'.,
FReTn/CTrThoT/PolhirTlAlcST/ !Rna /eis FReTn/CTrThoT/PolhirTlAlcST/ !Rna /eis
Q.M.S Advisors | tel: +41 (0)78 922 08 77 | e-mail: [email protected] |
Page 19
09.09.2013
Holder Name Portfolio Name Source Amt Held % Out Latest Chg File Dt Inst Type
CHINA LIFE INSURANCE n/a ULT-AGG 19'323'530'000 92.8 - 11.04.2012 Government
BOSHI FUND MANAGEMEN Multiple Portfolios MF-AGG 80'204'977 0.39 25'169'691 30.06.2013 Investment Advisor
DACHENG FUND MANAGME Multiple Portfolios MF-AGG 50'616'467 0.24 19'770'831 31.12.2012 Investment Advisor
BANK OF COMMUNICATIO Multiple Portfolios MF-AGG 34'384'637 0.17 18'219'615 30.06.2013 Investment Advisor
CHANGSHENG FUND MANA Multiple Portfolios MF-AGG 31'080'761 0.15 13'934'196 31.12.2012 Investment Advisor
BLACKROCK ASSET MGMT Multiple Portfolios MF-AGG 29'207'671 0.14 - 30.08.2013 Investment Advisor
GREAT WALL FUND MANA Multiple Portfolios MF-AGG 23'696'531 0.11 13'907'680 30.06.2013 Investment Advisor
CHINA ASSET MANAGEME Multiple Portfolios MF-AGG 20'718'199 0.1 (8'145'067) 31.12.2012 Investment Advisor
HARVEST FUND MANAGEM Multiple Portfolios MF-AGG 19'967'963 0.1 (1'259'693) 31.12.2012 Investment Advisor
GUOTAI ASSET MANAGEM Multiple Portfolios MF-AGG 18'446'882 0.09 4'846'879 31.12.2012 Investment Advisor
CAISSE DE DEPOT ET P Multiple Portfolios MF-AGG 17'919'388 0.09 - 31.12.2012 Investment Advisor
E FUND MANAGEMENT Multiple Portfolios MF-AGG 17'704'212 0.09 13'652'633 31.12.2012 Investment Advisor
INVESCO GREAT WALL F Multiple Portfolios MF-AGG 16'787'146 0.08 (5'666'449) 31.12.2012 Investment Advisor
RONGTONG FUND MANAGE Multiple Portfolios MF-AGG 16'070'766 0.08 11'556'987 31.12.2012 Investment Advisor
CHINA MERCHANTS FUND Multiple Portfolios MF-AGG 13'361'713 0.06 10'228'828 31.12.2012 Investment Advisor
ABC-CA FUND MANAGEME Multiple Portfolios MF-AGG 13'294'033 0.06 3'528'614 31.12.2012 Investment Advisor
SYWG BNP PARIBAS ASS Multiple Portfolios MF-AGG 12'181'845 0.06 4'651'506 30.06.2013 Investment Advisor
CSOP ASSET MANAGEMEN Multiple Portfolios MF-AGG 11'387'463 0.05 - 02.09.2013 Investment Advisor
CHINA UNIVERSAL ASSE Multiple Portfolios MF-AGG 11'134'601 0.05 5'243'804 02.09.2013 Investment Advisor
ABN AMRO TEDA FUND M Multiple Portfolios MF-AGG 10'349'701 0.05 10'349'701 31.12.2012 Investment Advisor
Firm Name Analyst Recommendation Weighting Change Target Price Date Date
Chang Jiang Securities Co. Limited LIU JUN add 4 M #N/A N/A Not Provided 02.09.2013
Guotai Junan PENG YULONG buy 5 M 18 12 month 01.09.2013
Sinolink Securities Co Ltd HE GUOWEN add 4 M 21 12 month 30.08.2013
JPMorgan MW KIM neutral 3 M 18 9 month 29.08.2013
Capital Securities Corp XIE JIYONG buy 5 M #N/A N/A Not Provided 29.08.2013
GF Securities Co. Ltd. CONG LI buy 5 M #N/A N/A Not Provided 29.08.2013
China International Capital Corp TANG SHENGBO hold 3 M #N/A N/A Not Provided 29.08.2013
Credit Suisse ARJAN VAN VEEN neutral 3 M 17 Not Provided 28.08.2013
HSBC JAMES GARNER overweight 5 M 18 Not Provided 28.08.2013
Everbright Securities Co., Ltd ZIPEI TANG accumulate 4 M #N/A N/A Not Provided 05.08.2013
SWS Research Co Ltd TINA SUN outperform 5 M #N/A N/A Not Provided 24.07.2013
UBS JANET SUN buy 5 M 20 12 month 17.07.2013
Goldman Sachs MANCY SUN neutral/neutral 3 M 21 12 month 16.05.2013
HuaChuang Securities GAO LI buy 5 M 26 6 month 12.12.2012
Bank of China International SUN PENG buy 5 M 19 Not Provided 06.12.2012
Hong Yuan Securities HUANG LIJUN add 4 M #N/A N/A Not Provided 27.11.2012
PingAn Securities LUO QI buy 5 M #N/A N/A Not Provided 28.10.2012
China Merchants Securities LUO YI strong buy 5 M 25 6 month 26.07.2012
Citic Securities Co., Ltd PAN HONGWEN buy 5 M 23 6 month 24.07.2012
Industrial Securities ZHANG YING buy 5 M #N/A N/A Not Provided 26.04.2012
Founder Securities WEI ZHOU buy 5 U #N/A N/A Not Provided 09.12.2011
China Minzu Securities Co Ltd SONG JIAN add 4 D 21 6 month 01.12.2011
Guodu Securities Co Ltd DENG TING buy 5 M #N/A N/A Not Provided 23.03.2011
Northeast Securities Co Ltd XINAN ZHAO add 4 M #N/A N/A Not Provided 09.02.2011
China Securities Co., Ltd WEI TAO add 4 M 35 Not Provided 08.12.2010
China Galaxy Securities XU LIPING buy 5 M 30 12 month 29.06.2010
China Investment Securities XU SHOUDE strong buy 5 M 40 12 month 17.07.2009
Holdings By:
China Life Insurance Co Ltd ee
Q.M.S Advisors | tel: +41 (0)78 922 08 77 | e-mail: [email protected] |
Page 20
09.09.2013
China Shenhua Energy Company Limited is an integrated coal-based energy company
focusing on the coal and power businesses in China. The Company also owns and
operates an integrated coal transportation network consisting of dedicated rail
lines and port facilities.
Latest Fiscal Year: 12/2012
LTM as of: 06/yy
52-Week High (04.01.2013) 25.70
52-Week Low (09.07.2013) 15.51
Daily Volume
17.44
52-Week High % Change -32.14% Dividend Yield -
52-Week Low % Change 12.44% Beta 0.99
% 52 Week Price Range High/Low 14.82% Equity Float 1'969.19
Shares Out 31.07.2013 16'491.0 Short Int -
358'287.81 1 Yr Total Return -17.74%
Total Debt 87'184.00 YTD Return -26.99%
Preferred Stock 0.0 Adjusted BETA 0.990
Minority Interest 49'968.0 Analyst Recs 21
Cash and Equivalents 55'599.00 Consensus Rating 4.810
Enterprise Value 424'460.82
Average Volume 5 Day 12'158'580
601088 CH EQUITY YTD Change - Average Volume 30 Day 16'408'150
601088 CH EQUITY YTD % CHANGE - Average Volume 3 Month 14'523'280
LTM-4Q LTM FY+1 FY+2 FQ+1 FQ+2
31.12.2008 31.12.2009 31.12.2010 31.12.2011 31.12.2012 06/yy 06/yy 12/13 Y 12/14 Y 09/13 Q3 12/13 Q4
104'416.0 117'526.0 157'662.0 209'225.0 250'260.0 225'853.0 252'577.0 251'723.3 267'158.1 63'260.0 70'432.0
3.62x 6.12x 3.31x 2.69x 2.37x 9.29x 7.97x 1.70x 1.60x - -
50'621.0 58'355.0 72'181.0 84'836.0 88'014.0 0.0 0.0 87'806.8 93'427.0 - -
7.47x 12.32x 7.22x 6.64x 6.73x 0.00x 0.00x 4.83x 4.54x - -
25'959.0 30'276.0 38'834.0 45'846.0 48'858.0 48'327.0 46'787.0 45'950.1 47'505.2 9'309.5 12'948.0
11.07x 21.98x 14.16x 11.86x 11.12x 9.12x 6.66x 7.50x 7.17x 7.28x 7.69x
EBITDA 88'014.00 Long-Term Rating Date -
EBIT 69'864.00 Long-Term Rating -
Operating Margin 27.92% Long-Term Outlook -
Pretax Margin 27.18% Short-Term Rating Date -
Return on Assets 10.48% Short-Term Rating -
Return on Common Equity 18.98%
Return on Capital - EBITDA/Interest Exp. 23.62
Asset Turnover 0.57% (EBITDA-Capex)/Interest Exp. 9.30
Net Debt/EBITDA -
Gross Margin 33.0% Total Debt/EBITDA -
EBITDA Margin -
EBIT Margin 27.4% Total Debt/Equity 34.0%
Net Income Margin 19.5% Total Debt/Capital 22.1%
Asset Turnover 0.57
Current Ratio 1.05 Net Fixed Asset Turnover 0.87
Quick Ratio 0.72 Accounts receivable turnover-days 32.51
Debt to Assets 19.06% Inventory Days 39.14
Tot Debt to Common Equity 33.98% Accounts Payable Turnover Day 61.65
Accounts Receivable Turnover 11.23 Cash Conversion Cycle -3.13
Inventory Turnover 9.33
Fiscal Year Ended
China Shenhua Energy Co LtdPrice/Volume
Valuation Analysis
23'616'288.00
Current Price (9/dd/yy) Market Data
Net Income
P/E
Market Capitalization
Average Daily Trading Volume
Relative Stock Price Performance
Total Revenue
TEV/Revenue
EBITDA
TEV/EBITDA
Profitability S&P Issuer Ratings
Credit Ratios
Margin Analysis
Reference
Structure
,
2
-,
-2
.,
.2
0,
o!-. l!-. k!-. a!-. g!-0 c!-0 j!-0 Q!-0 j!-0 g!-0 g!-0 Q!-0 o!-0', F
-,', F
.,', F
0,', F
1,', F
2,', F
3,', F
0.0
50'000.0
100'000.0
150'000.0
200'000.0
250'000.0
300'000.0
2001 2002 2003 2004 2005 2006 2007 2008 2009 2010 2011 2012
,',,
.',,
1',,
3',,
5',,
-,',,
-.',,
-1',,
,-',-'.,-, ,-',4'.,-, ,-',-'.,-- ,-',4'.,-- ,-',-'.,-. ,-',4'.,-. ,-',-'.,-0 ,-',4'.,-0
FReTn/CTrThoT/PolhirTlAlcST/ !Rna /eis FReTn/CTrThoT/PolhirTlAlcST/ !Rna /eis
Q.M.S Advisors | tel: +41 (0)78 922 08 77 | e-mail: [email protected] |
Page 21
09.09.2013
Holder Name Portfolio Name Source Amt Held % Out Latest Chg File Dt Inst Type
SHENHUA GROUP CORP L n/a EXCH 14'521'846'560 88.06 10'808'605 09.01.2012 Government
CHINA ASSET MANAGEME Multiple Portfolios MF-AGG 43'501'495 0.26 31'719'216 30.06.2013 Investment Advisor
E FUND MANAGEMENT Multiple Portfolios MF-AGG 40'952'127 0.25 9'702'654 31.12.2012 Investment Advisor
HARVEST FUND MANAGEM Multiple Portfolios MF-AGG 40'705'840 0.25 (16'265'219) 31.12.2012 Investment Advisor
GREAT WALL FUND MANA Multiple Portfolios MF-AGG 38'691'424 0.23 8'890'027 30.06.2013 Investment Advisor
BLACKROCK ASSET MGMT Multiple Portfolios MF-AGG 35'415'391 0.21 - 30.08.2013 Investment Advisor
BOSHI FUND MANAGEMEN Multiple Portfolios MF-AGG 28'890'851 0.18 5'294'388 31.12.2012 Investment Advisor
HUAAN FUND MANAGEMEN Multiple Portfolios MF-AGG 27'730'844 0.17 (17'324'753) 30.06.2013 Investment Advisor
HUATAI-PINEBRIDGE FU Multiple Portfolios MF-AGG 26'609'065 0.16 7'945'609 30.06.2013 Investment Advisor
YINHUA FUND MANAGEME Multiple Portfolios MF-AGG 16'429'576 0.1 (16'545'297) 31.12.2012 Investment Advisor
FULLGOAL FUND MANAGE Multiple Portfolios MF-AGG 14'307'598 0.09 4'066'051 31.12.2012 Investment Advisor
CSOP ASSET MANAGEMEN Multiple Portfolios MF-AGG 14'166'567 0.09 - 02.09.2013 Investment Advisor
CHINA SOUTHERN FUND Multiple Portfolios MF-AGG 13'419'199 0.08 (674'674) 31.12.2012 Investment Advisor
BANK OF COMMUNICATIO Multiple Portfolios MF-AGG 10'222'761 0.06 6'753'492 30.06.2013 Investment Advisor
RONGTONG FUND MANAGE Multiple Portfolios MF-AGG 8'670'991 0.05 6'098'882 31.12.2012 Investment Advisor
CAISSE DE DEPOT ET P Multiple Portfolios MF-AGG 8'383'534 0.05 - 31.12.2012 Investment Advisor
AEGON INDUSTRIAL FUN Multiple Portfolios MF-AGG 8'369'036 0.05 (2'547'158) 01.07.2013 Investment Advisor
TIANTONG ASSET MANAG Multiple Portfolios MF-AGG 7'086'975 0.04 867'627 30.06.2013 Investment Advisor
MORGAN STANLEY n/a ULT-AGG 7'057'443 0.04 1'547'004 30.06.2013 Investment Advisor
CHINA ASSET MANAGEME Multiple Portfolios MF-AGG 6'586'753 0.04 - 02.09.2013 Investment Advisor
Firm Name Analyst Recommendation Weighting Change Target Price Date Date
GF Securities Co. Ltd. AN PENG buy 5 M 19 12 month 03.09.2013
Capital Securities Corp ZHENG CHUNMING buy 5 M 18 Not Provided 28.08.2013
Masterlink Securities LI XIN buy 5 M 22 6 month 27.08.2013
Bank of China International LAWRENCE LAU buy 5 M 29 Not Provided 27.08.2013
Central China Securities ZHILEI WANG buy 5 U #N/A N/A Not Provided 26.08.2013
Goldman Sachs JULIAN ZHU Buy/Neutral 5 M 25 12 month 25.08.2013
JPMorgan DANIEL KANG overweight 5 M 21 12 month 25.08.2013
China International Capital Corp CAI HONGYU accumulate 4 M #N/A N/A Not Provided 25.08.2013
Chang Jiang Securities Co. Limited JUN GE buy 5 M #N/A N/A Not Provided 25.08.2013
SWS Research Co Ltd LIU XIAONING buy 5 M #N/A N/A Not Provided 23.08.2013
Everbright Securities Co., Ltd CHEN HAOWU buy 5 M 27 12 month 17.08.2013
China Minzu Securities Co Ltd LI JING buy 5 M 28 6 month 12.08.2013
UBS MICK MI buy 5 U 20 12 month 23.07.2013
Qilu Securities Co Ltd ZHAOLIANG LIU add 4 M #N/A N/A Not Provided 07.07.2013
Northeast Securities Co Ltd WANG SHI add 4 M #N/A N/A Not Provided 30.06.2013
Hong Yuan Securities WANG JINGLE buy 5 M #N/A N/A Not Provided 16.04.2013
Guodu Securities Co Ltd WANG SHUBAO strong buy 5 M #N/A N/A Not Provided 09.04.2013
Guotai Junan YIN XILONG buy 5 M 26 12 month 24.03.2013
Founder Securities SUN CAN add 4 M #N/A N/A Not Provided 05.02.2013
Rising Securities Co.,LTD XUE MINGJIE outperform 5 M #N/A N/A Not Provided 18.12.2012
Citic Securities Co., Ltd LUO ZETING buy 5 M 35 6 month 24.09.2012
HuaChuang Securities HAN ZHENGUO buy 5 D #N/A N/A Not Provided 03.09.2012
AJ Securities WANG SIWEI buy 5 M #N/A N/A Not Provided 27.08.2012
China Merchants Securities LU PING strong buy 5 M 38 6 month 07.07.2012
PingAn Securities WANG CHENG buy 5 M 35 6 month 29.06.2012
Great Wall Securities LIU FEI strong buy 5 M #N/A N/A Not Provided 28.03.2012
HSBC SARAH MAK overweight 5 M 35 Not Provided 26.03.2012
Industrial Securities LIU JIANGANG strong buy 5 M #N/A N/A Not Provided 24.03.2012
China Securities Co., Ltd LI JUNSONG add 4 M 34 Not Provided 08.12.2010
China Galaxy Securities ZHAO KE buy 5 M #N/A N/A Not Provided 13.07.2010
China Investment Securities XIAO HANPING buy 5 D #N/A N/A Not Provided 05.07.2010
Holdings By:
China Shenhua Energy Co Ltd ee
Q.M.S Advisors | tel: +41 (0)78 922 08 77 | e-mail: [email protected] |
Page 22
09.09.2013
Industrial Bank Company, Ltd. provides personal, corporate, institutional and
electronic banking services. The Bank's businesses include residential
mortgage, loan, savings and time deposit, RMB money management, foreign
currency management advisory service and trading, debit and credit cards.
Latest Fiscal Year: 12/2012
LTM as of: 06/yy
52-Week High (04.02.2013) 14.32
52-Week Low (24.09.2012) 7.73
Daily Volume
12.55
52-Week High % Change -12.36% Dividend Yield -
52-Week Low % Change 62.42% Beta 1.21
% 52 Week Price Range High/Low 55.86% Equity Float 14'336.23
Shares Out 03.07.2013 19'052.3 Short Int -
239'106.81 1 Yr Total Return 58.85%
Total Debt 1'213'656.00 YTD Return 17.54%
Preferred Stock 0.0 Adjusted BETA 1.208
Minority Interest 1'058.0 Analyst Recs 26
Cash and Equivalents 1'563'882.00 Consensus Rating 4.462
Enterprise Value -
Average Volume 5 Day #########
601166 CH EQUITY YTD Change - Average Volume 30 Day #########
601166 CH EQUITY YTD % CHANGE - Average Volume 3 Month #########
LTM-4Q LTM FY+1 FY+2 FQ+1 FQ+2
31.12.2008 31.12.2009 31.12.2010 31.12.2011 31.12.2012 06/yy 06/yy 12/13 Y 12/14 Y 09/13 Q3 12/13 Q4
56'348.1 54'882.3 76'827.6 118'156.0 171'915.0 151'284.0 189'579.0 103'319.1 120'466.6 26'923.0 28'320.7
- - - - - 0.00x 0.00x - - - -
- - - - - 0.0 0.0 - - - -
- - - - - 0.00x 0.00x - - - -
11'385.0 13'281.9 18'520.6 25'505.0 34'718.0 30'375.0 39'254.0 41'737.4 48'683.0 10'625.3 9'908.7
6.40x 15.15x 7.33x 5.31x 5.18x 4.60x 4.44x 5.63x 5.06x 5.26x 5.04x
EBITDA - Long-Term Rating Date -
EBIT - Long-Term Rating -
Operating Margin 52.15% Long-Term Outlook -
Pretax Margin 52.28% Short-Term Rating Date -
Return on Assets 1.23% Short-Term Rating -
Return on Common Equity 25.00%
Return on Capital 2.98% EBITDA/Interest Exp. -
Asset Turnover 0.06% (EBITDA-Capex)/Interest Exp. -
Net Debt/EBITDA -
Gross Margin - Total Debt/EBITDA -
EBITDA Margin -
EBIT Margin - Total Debt/Equity 715.7%
Net Income Margin 39.3% Total Debt/Capital 87.7%
Asset Turnover 0.06
Current Ratio - Net Fixed Asset Turnover 21.41
Quick Ratio - Accounts receivable turnover-days -
Debt to Assets 37.33% Inventory Days -
Tot Debt to Common Equity 715.70% Accounts Payable Turnover Day -
Accounts Receivable Turnover - Cash Conversion Cycle -
Inventory Turnover -
Profitability S&P Issuer Ratings
Credit Ratios
Margin Analysis
Reference
Structure
Net Income
P/E
Market Capitalization
Average Daily Trading Volume
Relative Stock Price Performance
Total Revenue
TEV/Revenue
EBITDA
TEV/EBITDA
Fiscal Year Ended
Industrial Bank Co LtdPrice/Volume
Valuation Analysis
354'041'504.00
Current Price (9/dd/yy) Market Data
,
.
1
3
5
-,
-.
-1
o!-. l!-. k!-. a!-. g!-0 c!-0 j!-0 Q!-0 j!-0 g!-0 g!-0 Q!-0 o!-0', F
-,,', F
.,,', F
0,,', F
1,,', F
2,,', F
3,,', F
0.0
20'000.0
40'000.0
60'000.0
80'000.0
100'000.0
120'000.0
140'000.0
160'000.0
180'000.0
200'000.0
2001 2002 2003 2004 2005 2006 2007 2008 2009 2010 2011 2012
,',,
.',,
1',,
3',,
5',,
-,',,
-.',,
-1',,
-3',,
,-',-'.,-, ,-',4'.,-, ,-',-'.,-- ,-',4'.,-- ,-',-'.,-. ,-',4'.,-. ,-',-'.,-0 ,-',4'.,-0
FReTn/CTrThoT/PolhirTlAlcST/ !Rna /eis FReTn/CTrThoT/PolhirTlAlcST/ !Rna /eis
Q.M.S Advisors | tel: +41 (0)78 922 08 77 | e-mail: [email protected] |
Page 23
09.09.2013
Holder Name Portfolio Name Source Amt Held % Out Latest Chg File Dt Inst Type
FUJIAN PROVINCE FINA n/a Co File 3'402'173'769 17.86 - 31.12.2012 Government
HANG SENG BANK LIMIT n/a Co File 2'070'651'600 10.87 - 31.12.2012 Bank
XINZHENG TAIDA INVES n/a Co File 442'093'800 2.32 - 31.12.2012 Other
FUJIAN TOBACCO CO n/a Co File 441'504'000 2.32 - 31.12.2012 Other
HUAAN FUND MANAGEMEN Multiple Portfolios MF-AGG 368'317'850 1.93 294'466'570 30.06.2013 Investment Advisor
CHINA TOBACCO HUNAN n/a Co File 226'800'000 1.19 - 31.12.2012 Corporation
FJ LONGYAN FIN OFFIC n/a Co File 226'800'000 1.19 - 31.12.2012 Government
HARVEST FUND MANAGEM Multiple Portfolios MF-AGG 221'970'113 1.17 81'372'952 30.06.2013 Investment Advisor
CHINA ASSET MANAGEME Multiple Portfolios MF-AGG 204'264'634 1.07 64'959'309 30.06.2013 Investment Advisor
BLACKROCK ASSET MGMT Multiple Portfolios MF-AGG 180'700'867 0.95 - 30.08.2013 Investment Advisor
IM XISHUI VENTURE CA n/a Co File 174'340'222 0.92 - 31.12.2012 Venture Capital
FULLGOAL FUND MANAGE Multiple Portfolios MF-AGG 138'094'118 0.72 55'267'714 31.12.2012 Investment Advisor
E FUND MANAGEMENT Multiple Portfolios MF-AGG 132'971'682 0.7 (19'262'435) 31.12.2012 Investment Advisor
INTERNATIONAL FINANC n/a Co File 131'003'754 0.69 - 31.12.2012 Government
COFCO LTD n/a Co File 126'225'912 0.66 - 31.12.2012 Government
ZHEJIANG SOUTHEAST E n/a Co File 118'260'000 0.62 - 31.12.2012 Holding Company
CHINA ASSET MANAGEME Multiple Portfolios MF-AGG 75'989'058 0.4 47'027'426 30.06.2013 Investment Advisor
YINHUA FUND MANAGEME Multiple Portfolios MF-AGG 74'244'092 0.39 (5'427'237) 30.06.2013 Investment Advisor
CHINA SOUTHERN FUND Multiple Portfolios MF-AGG 73'841'466 0.39 6'200'818 30.06.2013 Investment Advisor
CSOP ASSET MANAGEMEN Multiple Portfolios MF-AGG 71'433'041 0.37 - 02.09.2013 Investment Advisor
Firm Name Analyst Recommendation Weighting Change Target Price Date Date
PingAn Securities GRACE LI strong buy 5 M #N/A N/A Not Provided 03.09.2013
Capital Securities Corp XIE JIYONG buy 5 M 13 Not Provided 30.08.2013
Northeast Securities Co Ltd YAYUN TANG buy 5 M #N/A N/A Not Provided 23.08.2013
Guotai Junan GUANHUA QIU buy 5 U 12 Not Provided 20.08.2013
Chang Jiang Securities Co. Limited LIU JUN buy 5 M #N/A N/A Not Provided 18.08.2013
Masterlink Securities TEAM COVERAGE buy 5 N 14 Not Provided 14.08.2013
Qilu Securities Co Ltd JIAOYI CHENG buy 5 M #N/A N/A Not Provided 13.08.2013
Morgan Stanley RICHARD XU Equalwt/In-Line 3 M 9 12 month 12.08.2013
HSBC MICHAEL CHU underweight 1 M 10 Not Provided 12.08.2013
GF Securities Co. Ltd. Mu Hua buy 5 M #N/A N/A Not Provided 11.08.2013
UBS JANET SUN neutral 3 D 10 12 month 07.08.2013
Central China Securities CHEN XI add 4 M #N/A N/A Not Provided 29.07.2013
SWS Research Co Ltd JUN NI outperform 5 M #N/A N/A Not Provided 19.07.2013
Standard Chartered DORRIS CHEN outperform 5 M 12 12 month 10.07.2013
Goldman Sachs NING MA Buy/Neutral 5 M 10 12 month 02.07.2013
Everbright Securities Co., Ltd SHEN WEI buy 5 M 14 12 month 02.06.2013
Hong Yuan Securities ZHANG JIXIU add 4 M 10 6 month 11.05.2013
China International Capital Corp MAO JUNHUA buy 5 M #N/A N/A Not Provided 25.04.2013
Sinolink Securities Co Ltd JIANGANG CHEN add 4 M #N/A N/A Not Provided 23.04.2013
Founder Securities WEI ZHOU add 4 M #N/A N/A Not Provided 23.04.2013
Deutsche Bank TRACY YU not rated #N/A N/A M #N/A N/A Not Provided 12.04.2013
Bank of China International YUAN LIN hold 3 M 9 Not Provided 22.03.2013
Guodu Securities Co Ltd DENG TING strong buy 5 U 17 Not Provided 18.03.2013
Citic Securities Co., Ltd ZHU YAN overweight 5 M 13 6 month 22.01.2013
Great Wall Securities BIAO HUANG buy 5 M #N/A N/A Not Provided 31.10.2012
Tebon Securities Co Ltd ZHANG FAN buy 5 M 10 6 month 31.10.2012
China Merchants Securities LUO YI strong buy 5 M #N/A N/A Not Provided 23.07.2012
China Securities Co., Ltd #N/A N/A add 4 M 11 Not Provided 25.06.2012
Industrial Securities YIDONG ZHANG buy 5 M #N/A N/A Not Provided 25.04.2012
AJ Securities ZHANG ZHIPENG buy 5 M 10 6 month 22.03.2012
Rising Securities Co.,LTD XIE AIHONG outperform 5 D #N/A N/A Not Provided 20.03.2012
China Minzu Securities Co Ltd ZHANG JING add 4 M 9 6 month 20.12.2011
China Investment Securities ZHANG ZHONGYANG buy 5 M #N/A N/A Not Provided 02.12.2011
BOCOM International Holdings LI SHANSHAN long-term buy 5 M #N/A N/A Not Provided 07.11.2011
HuaChuang Securities GAO LI buy 5 M 16 6 month 13.05.2011
China Galaxy Securities YE YUNYAN speculative buy 4 M #N/A N/A Not Provided 11.05.2010
Holdings By:
Industrial Bank Co Ltd ee
Q.M.S Advisors | tel: +41 (0)78 922 08 77 | e-mail: [email protected] |
Page 24
09.09.2013
China Minsheng Banking Corp., Ltd. operates in commercial banking businesses.
The Bank provides deposit, loan, settlement, discount, financial bond issuance,
government bond underwriting and trading, letter of credit, bank guarantee, and
other related financial services.
Latest Fiscal Year: 12/2012
LTM as of: 01/yy
52-Week High (06.02.2013) 11.91
52-Week Low (21.09.2012) 5.42
Daily Volume
10.2
52-Week High % Change -14.36% Dividend Yield 3.02
52-Week Low % Change 88.19% Beta 1.14
% 52 Week Price Range High/Low 61.63% Equity Float 17'228.33
Shares Out 30.06.2013 22'587.6 Short Int -
272'578.84 1 Yr Total Return 78.15%
Total Debt 1'057'701.00 YTD Return 32.14%
Preferred Stock 0.0 Adjusted BETA 1.135
Minority Interest 5'467.0 Analyst Recs 22
Cash and Equivalents 736'661.00 Consensus Rating 4.273
Enterprise Value -
Average Volume 5 Day #########
600016 CH EQUITY YTD Change - Average Volume 30 Day #########
600016 CH EQUITY YTD % CHANGE - Average Volume 3 Month #########
LTM-4Q LTM FY+1 FY+2 FQ+1 FQ+2
31.12.2008 31.12.2009 31.12.2010 31.12.2011 31.12.2012 01/yy 01/yy 12/13 Y 12/14 Y 06/13 Q2 09/13 Q3
61'242.0 - 80'034.0 135'546.0 - - - 117'946.9 136'505.9 - -
- - - - - - - - - - -
- - - - - - - - - - -
- - - - - - - - - - -
7'885.0 - 17'581.0 27'920.0 - - - 43'913.0 50'775.9 11'514.0 -
9.69x - 7.61x 5.61x - - - 6.70x 5.79x - -
EBITDA - Long-Term Rating Date -
EBIT - Long-Term Rating NR
Operating Margin 49.39% Long-Term Outlook -
Pretax Margin 48.56% Short-Term Rating Date -
Return on Assets 1.38% Short-Term Rating -
Return on Common Equity 24.76%
Return on Capital 4.50% EBITDA/Interest Exp. -
Asset Turnover 0.07% (EBITDA-Capex)/Interest Exp. -
Net Debt/EBITDA -
Gross Margin - Total Debt/EBITDA -
EBITDA Margin -
EBIT Margin - Total Debt/Equity 648.6%
Net Income Margin 36.0% Total Debt/Capital 86.3%
Asset Turnover 0.07
Current Ratio - Net Fixed Asset Turnover 11.77
Quick Ratio - Accounts receivable turnover-days -
Debt to Assets 32.93% Inventory Days -
Tot Debt to Common Equity 648.59% Accounts Payable Turnover Day -
Accounts Receivable Turnover - Cash Conversion Cycle -
Inventory Turnover -
Profitability S&P Issuer Ratings
Credit Ratios
Margin Analysis
Reference
Structure
Net Income
P/E
Market Capitalization
Average Daily Trading Volume
Relative Stock Price Performance
Total Revenue
TEV/Revenue
EBITDA
TEV/EBITDA
Fiscal Year Ended
China Minsheng Banking Corp LtdPrice/Volume
Valuation Analysis
410'342'026.00
Current Price (9/dd/yy) Market Data
,
.
1
3
5
-,
-.
-1
o!-. l!-. k!-. a!-. g!-0 c!-0 j!-0 Q!-0 j!-0 g!-0 g!-0 Q!-0 o!-0', F
-,,', F
.,,', F
0,,', F
1,,', F
2,,', F
3,,', F
4,,', F
5,,', F
0.0
0.2
0.4
0.6
0.8
1.0
1.2
,',,
,'.,
,'1,
,'3,
,'5,
-',,
-'.,
FReTn/CTrThoT/PolhirTlAlcST/ !Rna /eis FReTn/CTrThoT/PolhirTlAlcST/ !Rna /eis
Q.M.S Advisors | tel: +41 (0)78 922 08 77 | e-mail: [email protected] |
Page 25
09.09.2013
Holder Name Portfolio Name Source Amt Held % Out Latest Chg File Dt Inst Type
NEW HOPE INVEST CO L n/a EXCH 1'416'691'092 6.27 1'218'538 27.06.2013 Corporation
CHINA LIFE INSURANCE n/a ULT-AGG 1'151'307'314 5.1 - 31.12.2012 Government
SHANGHAI GIANT LIFET n/a EXCH 1'032'680'665 4.57 30'000'055 26.07.2013 Corporation
ORIENT GROUP INC n/a EXCH 976'019'646 4.32 (5'954'564) 08.07.2013 Holding Company
CHINA SHIPOWNERS MUT n/a Co File 905'764'505 4.01 - 31.12.2012 Corporation
CHINA SME INVESTMENT n/a Co File 737'955'031 3.27 - 31.12.2012 Corporation
CHINA OCEANWIDE HLDG n/a Co File 698'939'116 3.09 - 31.12.2012 Unclassified
SICHUAN SOUTHERN HOP n/a EXCH 571'113'783 2.53 187'783 27.06.2013 Corporation
FUXING GROUP LTD n/a Co File 550'151'500 2.44 - 31.12.2012 Corporation
CHINA ASSET MANAGEME Multiple Portfolios MF-AGG 457'777'394 2.03 260'665'986 30.06.2013 Investment Advisor
BLACKROCK ASSET MGMT Multiple Portfolios MF-AGG 331'014'578 1.47 - 30.08.2013 Investment Advisor
FOSUN INTERNATIONAL n/a EXCH 312'685'076 1.38 19'508'993 17.12.2012 Unclassified
HARVEST FUND MANAGEM Multiple Portfolios MF-AGG 286'765'906 1.27 68'318'960 30.06.2013 Investment Advisor
E FUND MANAGEMENT Multiple Portfolios MF-AGG 220'842'960 0.98 4'939'494 31.12.2012 Investment Advisor
NANJING IRON&STEEL C n/a EXCH 179'063'130 0.79 - 07.05.2013 Corporation
HUAAN FUND MANAGEMEN Multiple Portfolios MF-AGG 171'550'431 0.76 15'758'124 30.06.2013 Investment Advisor
YINHUA FUND MANAGEME Multiple Portfolios MF-AGG 146'878'443 0.65 37'942'774 30.06.2013 Investment Advisor
CSOP ASSET MANAGEMEN Multiple Portfolios MF-AGG 130'545'427 0.58 - 02.09.2013 Investment Advisor
HUATAI-PINEBRIDGE FU Multiple Portfolios MF-AGG 124'698'879 0.55 14'563'433 30.06.2013 Investment Advisor
EVERBRIGHT PRAMERICA Multiple Portfolios MF-AGG 124'406'108 0.55 (27'353'892) 31.12.2012 Investment Advisor
Firm Name Analyst Recommendation Weighting Change Target Price Date Date
PingAn Securities GRACE LI buy 5 M #N/A N/A Not Provided 03.09.2013
Northeast Securities Co Ltd YAYUN TANG buy 5 M #N/A N/A Not Provided 30.08.2013
GF Securities Co. Ltd. Mu Hua buy 5 M #N/A N/A Not Provided 30.08.2013
Sinolink Securities Co Ltd HE GUOWEN add 4 M #N/A N/A Not Provided 30.08.2013
Capital Securities Corp XIE JIYONG buy 5 M 10 Not Provided 29.08.2013
Bank of China International YUAN LIN buy 5 M 7 Not Provided 29.08.2013
China International Capital Corp JIE HUANG buy 5 M #N/A N/A Not Provided 29.08.2013
JPMorgan KATHERINE LEI underweight 1 M 6 6 month 28.08.2013
Chang Jiang Securities Co. Limited LIU JUN buy 5 M #N/A N/A Not Provided 28.08.2013
Guotai Junan GUANHUA QIU buy 5 U 10 Not Provided 20.08.2013
Qilu Securities Co Ltd JIAOYI CHENG buy 5 M #N/A N/A Not Provided 11.08.2013
SWS Research Co Ltd JUN NI outperform 5 M #N/A N/A Not Provided 19.07.2013
Guodu Securities Co Ltd DENG TING strong buy 5 M 16 6 month 05.07.2013
Masterlink Securities RAINY YUAN hold 3 D 9 Not Provided 28.06.2013
Goldman Sachs NING MA Sell/Neutral 1 D 9 12 month 12.06.2013
UBS JANET SUN restricted #N/A N/A M #N/A N/A Not Provided 07.06.2013
Everbright Securities Co., Ltd SHEN WEI buy 5 M 12 12 month 02.06.2013
Hong Yuan Securities ZHANG JIXIU buy 5 M #N/A N/A Not Provided 31.05.2013
Central China Securities CHEN XI buy 5 M #N/A N/A Not Provided 24.05.2013
Founder Securities WEI ZHOU add 4 M #N/A N/A Not Provided 25.04.2013
HSBC TODD DUNIVANT underweight 1 M 6 Not Provided 08.04.2013
Great Wall Securities BIAO HUANG buy 5 M #N/A N/A Not Provided 31.10.2012
Citic Securities Co., Ltd ZHU YAN buy 5 M 7 6 month 21.09.2012
Tebon Securities Co Ltd ZHANG FAN buy 5 M #N/A N/A Not Provided 24.07.2012
China Merchants Securities LUO YI strong buy 5 M 8 12 month 23.07.2012
China Securities Co., Ltd #N/A N/A buy 5 M 8 Not Provided 25.06.2012
Deutsche Bank TRACY YU hold 3 M 6 12 month 11.06.2012
Industrial Securities YIDONG ZHANG buy 5 M #N/A N/A Not Provided 22.04.2012
AJ Securities ZHANG ZHIPENG strong buy 5 M 11 6 month 29.03.2012
China Minzu Securities Co Ltd ZHANG JING add 4 M #N/A N/A Not Provided 06.01.2012
Rising Securities Co.,LTD XIE AIHONG buy 5 U #N/A N/A Not Provided 20.12.2011
BOCOM International Holdings LI SHANSHAN long-term buy 5 M #N/A N/A Not Provided 13.12.2011
China Investment Securities ZHANG ZHONGYANG strong buy 5 M #N/A N/A Not Provided 02.12.2011
HuaChuang Securities GAO LI buy 5 M 8 6 month 15.06.2011
China Galaxy Securities YE YUNYAN speculative buy 4 M #N/A N/A Not Provided 11.05.2010
Nomura LUCY FENG neutral 3 M 6 Not Provided 28.02.2010
Holdings By:
China Minsheng Banking Corp Ltd ee
Q.M.S Advisors | tel: +41 (0)78 922 08 77 | e-mail: [email protected] |
Page 26
09.09.2013
China Merchants Bank Co., Ltd. provides a wide range of commercial banking
services including deposit, loan, bill discount, government bonds underwriting
and trading, interbank lending, letter of credit, bank guarantee, and other
related services.
Latest Fiscal Year: 12/2012
LTM as of: 06/yy
52-Week High (04.02.2013) 14.72
52-Week Low (21.09.2012) 9.50
Daily Volume
11.58
52-Week High % Change -21.35% Dividend Yield 5.44
52-Week Low % Change 21.95% Beta 1.01
% 52 Week Price Range High/Low 26.67% Equity Float 11'055.14
Shares Out 30.06.2013 17'666.1 Short Int -
257'985.80 1 Yr Total Return 22.13%
Total Debt 610'425.00 YTD Return -9.76%
Preferred Stock 0.0 Adjusted BETA 1.008
Minority Interest 73.0 Analyst Recs 20
Cash and Equivalents 962'670.00 Consensus Rating 4.600
Enterprise Value -
Average Volume 5 Day 39'812'720
600036 CH EQUITY YTD Change - Average Volume 30 Day 53'761'010
600036 CH EQUITY YTD % CHANGE - Average Volume 3 Month 60'796'510
LTM-4Q LTM FY+1 FY+2 FQ+1 FQ+2
31.12.2008 31.12.2009 31.12.2010 31.12.2011 31.12.2012 06/yy 06/yy 12/13 Y 12/14 Y 09/13 Q3 12/13 Q4
82'401.0 78'480.0 100'188.0 142'837.0 176'909.0 164'362.0 186'464.0 129'809.1 148'479.0 32'263.0 33'376.0
- - - - - 0.00x 0.00x - - - -
- - - - - 0.0 0.0 - - - -
- - - - - 0.00x 0.00x - - - -
21'077.0 18'235.0 25'769.0 36'129.0 45'273.0 40'903.0 48'167.0 50'736.4 56'756.5 13'286.0 11'815.0
8.50x 19.00x 10.41x 7.11x 6.55x 5.77x 5.20x 5.45x 4.81x 4.69x 4.49x
EBITDA - Long-Term Rating Date 06.12.2011
EBIT - Long-Term Rating BBB+
Operating Margin 51.66% Long-Term Outlook STABLE
Pretax Margin 51.71% Short-Term Rating Date 15.04.2010
Return on Assets 1.35% Short-Term Rating A-2
Return on Common Equity 24.47%
Return on Capital 5.54% EBITDA/Interest Exp. -
Asset Turnover 0.05% (EBITDA-Capex)/Interest Exp. -
Net Debt/EBITDA -
Gross Margin - Total Debt/EBITDA -
EBITDA Margin -
EBIT Margin - Total Debt/Equity 304.6%
Net Income Margin 39.3% Total Debt/Capital 75.3%
Asset Turnover 0.05
Current Ratio - Net Fixed Asset Turnover 10.08
Quick Ratio - Accounts receivable turnover-days -
Debt to Assets 17.91% Inventory Days -
Tot Debt to Common Equity 304.55% Accounts Payable Turnover Day -
Accounts Receivable Turnover - Cash Conversion Cycle -
Inventory Turnover -
Fiscal Year Ended
China Merchants Bank Co LtdPrice/Volume
Valuation Analysis
226'690'991.00
Current Price (9/dd/yy) Market Data
Net Income
P/E
Market Capitalization
Average Daily Trading Volume
Relative Stock Price Performance
Total Revenue
TEV/Revenue
EBITDA
TEV/EBITDA
Profitability S&P Issuer Ratings
Credit Ratios
Margin Analysis
Reference
Structure
,
.
1
3
5
-,
-.
-1
-3
o!-. l!-. k!-. a!-. g!-0 c!-0 j!-0 Q!-0 j!-0 g!-0 g!-0 Q!-0', F
2,', F
-,,', F
-2,', F
.,,', F
.2,', F
0.0
20'000.0
40'000.0
60'000.0
80'000.0
100'000.0
120'000.0
140'000.0
160'000.0
180'000.0
200'000.0
2001 2002 2003 2004 2005 2006 2007 2008 2009 2010 2011 2012
,',,
.,',,
1,',,
3,',,
5,',,
-,,',,
-.,',,
-1,',,
-3,',,
-5,',,
,-',-'.,-, ,-',4'.,-, ,-',-'.,-- ,-',4'.,-- ,-',-'.,-. ,-',4'.,-. ,-',-'.,-0 ,-',4'.,-0
FReTn/CTrThoT/PolhirTlAlcST/ !Rna /eis FReTn/CTrThoT/PolhirTlAlcST/ !Rna /eis
Q.M.S Advisors | tel: +41 (0)78 922 08 77 | e-mail: [email protected] |
Page 27
09.09.2013
Holder Name Portfolio Name Source Amt Held % Out Latest Chg File Dt Inst Type
CHINA MERCHANTS STEA n/a EXCH 2'693'717'481 15.25 9'000'000 27.08.2013 Government
CHINA OCEAN SHIPPING n/a Co File 1'341'336'551 7.59 - 31.12.2012 Government
SHENZHEN YAN QING IN n/a Co File 636'788'489 3.6 - 31.12.2012 Government
GUANGZHOU MARITIME T n/a Co File 631'287'834 3.57 - 31.12.2012 Government
ANBANG INSURANCE CO n/a Co File 602'568'437 3.41 - 31.12.2012 Insurance Company
BESTWINNER INVESTMEN n/a Co File 556'333'611 3.15 - 31.12.2012 Government
CHINA COMMUN CONSTRU n/a Co File 383'445'439 2.17 - 31.12.2012 Government
SHANGHAI AUTO INDUST n/a Co File 368'079'979 2.08 - 31.12.2012 Government
SINO LIFE INSURANCE n/a Co File 331'999'475 1.88 - 31.12.2012 Insurance Company
BLACKROCK ASSET MGMT Multiple Portfolios MF-AGG 262'840'111 1.49 - 30.08.2013 Investment Advisor
CHINA ASSET MANAGEME Multiple Portfolios MF-AGG 257'548'221 1.46 99'882'734 30.06.2013 Investment Advisor
E FUND MANAGEMENT Multiple Portfolios MF-AGG 214'567'303 1.21 (47'955'041) 31.12.2012 Investment Advisor
HARVEST FUND MANAGEM Multiple Portfolios MF-AGG 181'975'603 1.03 (32'836'720) 30.06.2013 Investment Advisor
AEGON INDUSTRIAL FUN Multiple Portfolios MF-AGG 99'700'032 0.56 9'032'966 01.07.2013 Investment Advisor
CSOP ASSET MANAGEMEN Multiple Portfolios MF-AGG 87'028'542 0.49 - 02.09.2013 Investment Advisor
HUATAI-PINEBRIDGE FU Multiple Portfolios MF-AGG 83'042'204 0.47 10'373'967 30.06.2013 Investment Advisor
DACHENG FUND MANAGME Multiple Portfolios MF-AGG 73'268'151 0.41 (2'893'943) 31.12.2012 Investment Advisor
BOSHI FUND MANAGEMEN Multiple Portfolios MF-AGG 69'221'795 0.39 (11'518'205) 30.06.2013 Investment Advisor
CHINA SOUTHERN FUND Multiple Portfolios MF-AGG 66'755'288 0.38 (1'629'261) 30.06.2013 Investment Advisor
CHINA UNIVERSAL ASSE Multiple Portfolios MF-AGG 58'535'242 0.33 (11'726'572) 02.09.2013 Investment Advisor
Firm Name Analyst Recommendation Weighting Change Target Price Date Date
PingAn Securities GRACE LI buy 5 M #N/A N/A Not Provided 03.09.2013
HSBC TODD DUNIVANT overweight 5 U 13 Not Provided 28.08.2013
Northeast Securities Co Ltd YAYUN TANG buy 5 M #N/A N/A Not Provided 25.08.2013
GF Securities Co. Ltd. Mu Hua add 4 D #N/A N/A Not Provided 21.08.2013
Masterlink Securities RAINY YUAN hold 3 M 13 6 month 20.08.2013
Guotai Junan GUANHUA QIU buy 5 U 13 Not Provided 20.08.2013
Capital Securities Corp XIE JIYONG buy 5 M 15 Not Provided 19.08.2013
Bank of China International YUAN LIN buy 5 M 16 Not Provided 19.08.2013
Sinolink Securities Co Ltd HE GUOWEN add 4 M #N/A N/A Not Provided 19.08.2013
JPMorgan KATHERINE LEI neutral 3 M 14 3 month 18.08.2013
Chang Jiang Securities Co. Limited LIU JUN buy 5 M #N/A N/A Not Provided 18.08.2013
Qilu Securities Co Ltd JIAOYI CHENG buy 5 M #N/A N/A Not Provided 18.08.2013
Central China Securities CHEN XI add 4 M #N/A N/A Not Provided 29.07.2013
SWS Research Co Ltd JUN NI outperform 5 M #N/A N/A Not Provided 19.07.2013
Goldman Sachs NING MA Buy/Neutral 5 M 16 12 month 12.06.2013
Everbright Securities Co., Ltd SHEN WEI buy 5 M 15 12 month 02.06.2013
Tebon Securities Co Ltd GENDA XIA buy 5 M 15 6 month 26.04.2013
Founder Securities WEI ZHOU add 4 M #N/A N/A Not Provided 31.12.2012
Hong Yuan Securities ZHANG JIXIU add 4 M 11 6 month 29.10.2012
Citic Securities Co., Ltd ZHU YAN buy 5 M 11 6 month 21.09.2012
Guodu Securities Co Ltd DENG TING buy 5 M #N/A N/A Not Provided 22.08.2012
Great Wall Securities BIAO HUANG buy 5 D #N/A N/A Not Provided 20.08.2012
China Securities Co., Ltd #N/A N/A buy 5 M 14 Not Provided 25.06.2012
China Merchants Securities LUO YI strong buy 5 M #N/A N/A Not Provided 17.06.2012
AJ Securities ZHANG ZHIPENG strong buy 5 M #N/A N/A Not Provided 05.04.2012
Industrial Securities YIDONG ZHANG buy 5 D #N/A N/A Not Provided 28.03.2012
Rising Securities Co.,LTD XIE AIHONG neutral 3 D #N/A N/A Not Provided 20.12.2011
BOCOM International Holdings LI SHANSHAN long-term buy 5 M 11 12 month 13.12.2011
China Investment Securities ZHANG ZHONGYANG strong buy 5 M #N/A N/A Not Provided 02.12.2011
China Minzu Securities Co Ltd ZHANG JING buy 5 M #N/A N/A Not Provided 01.12.2011
HuaChuang Securities GAO LI buy 5 M 18 6 month 15.06.2011
China Galaxy Securities YE YUNYAN speculative buy 4 M #N/A N/A Not Provided 11.05.2010
Holdings By:
China Merchants Bank Co Ltd ee
Q.M.S Advisors | tel: +41 (0)78 922 08 77 | e-mail: [email protected] |
Page 28
09.09.2013
Ping An Insurance (Group) Company of China Limited provides a variety of
insurance service in China. The Company writes property, casualty, and life
insurance. Ping An Insurance also offers financial services.
Latest Fiscal Year: 12/2011
LTM as of: 06/yy
52-Week High (04.02.2013) 53.27
52-Week Low (29.07.2013) 31.69
Daily Volume
37.61
52-Week High % Change -29.40% Dividend Yield 1.33
52-Week Low % Change 18.68% Beta 1.34
% 52 Week Price Range High/Low 18.91% Equity Float 3'190.19
Shares Out 30.06.2013 4'786.4 Short Int -
325'394.31 1 Yr Total Return -9.57%
Total Debt 1'601'021.00 YTD Return -16.35%
Preferred Stock 0.0 Adjusted BETA 1.345
Minority Interest 50'032.0 Analyst Recs 18
Cash and Equivalents 169'047.00 Consensus Rating 4.889
Enterprise Value 754'568.32
Average Volume 5 Day 34'755'410
601318 CH EQUITY YTD Change - Average Volume 30 Day 31'846'260
601318 CH EQUITY YTD % CHANGE - Average Volume 3 Month 33'050'670
LTM-4Q LTM FY+1 FY+2 FQ+1 FQ+2
31.12.2008 31.12.2009 31.12.2010 31.12.2011 31.12.2012 06/yy 06/yy 12/13 Y 12/14 Y 09/13 Q3 12/13 Q4
87'666.0 152'961.0 195'052.0 272'683.0 341'539.0 306'171.0 357'196.0 332'263.4 371'104.0 - -
4.28x 4.16x 4.27x 5.13x 5.45x 13.05x 8.83x 1.11x 0.93x - -
- - - - - 0.0 0.0 - - - -
- - - - - 0.00x 0.00x - - - -
1'418.0 13'883.0 17'311.0 19'475.0 20'050.0 20'677.0 24'001.0 27'153.0 32'596.0 4'600.0 4'600.0
173.82x 31.68x 32.03x 16.61x 20.64x 19.34x 13.62x 11.10x 9.23x - -
EBITDA - Long-Term Rating Date -
EBIT - Long-Term Rating -
Operating Margin 11.63% Long-Term Outlook -
Pretax Margin 9.47% Short-Term Rating Date -
Return on Assets 0.83% Short-Term Rating -
Return on Common Equity 15.02%
Return on Capital 3.61% EBITDA/Interest Exp. -
Asset Turnover 0.13% (EBITDA-Capex)/Interest Exp. -
Net Debt/EBITDA -
Gross Margin - Total Debt/EBITDA -
EBITDA Margin -
EBIT Margin - Total Debt/Equity 1003.0%
Net Income Margin 5.9% Total Debt/Capital 88.4%
Asset Turnover 0.13
Current Ratio - Net Fixed Asset Turnover -
Quick Ratio - Accounts receivable turnover-days -
Debt to Assets 56.29% Inventory Days -
Tot Debt to Common Equity 1003.04% Accounts Payable Turnover Day -
Accounts Receivable Turnover - Cash Conversion Cycle -
Inventory Turnover -
Fiscal Year Ended
Ping An Insurance Group Co of China LtdPrice/Volume
Valuation Analysis
93'337'527.00
Current Price (9/dd/yy) Market Data
Net Income
P/E
Market Capitalization
Average Daily Trading Volume
Relative Stock Price Performance
Total Revenue
TEV/Revenue
EBITDA
TEV/EBITDA
Profitability S&P Issuer Ratings
Credit Ratios
Margin Analysis
Reference
Structure
,
-,
.,
0,
1,
2,
3,
o!-. l!-. k!-. a!-. g!-0 c!-0 j!-0 Q!-0 j!-0 g!-0 g!-0 Q!-0 o!-0', F
.,', F
1,', F
3,', F
5,', F
-,,', F
-.,', F
0.0
50'000.0
100'000.0
150'000.0
200'000.0
250'000.0
300'000.0
350'000.0
400'000.0
2001 2002 2003 2004 2005 2006 2007 2008 2009 2010 2011 2012
,',,
.',,
1',,
3',,
5',,
-,',,
-.',,
-1',,
,-',-'.,-, ,-',4'.,-, ,-',-'.,-- ,-',4'.,-- ,-',-'.,-. ,-',4'.,-. ,-',-'.,-0 ,-',4'.,-0
FReTn/CTrThoT/PolhirTlAlcST/ !Rna /eis FReTn/CTrThoT/PolhirTlAlcST/ !Rna /eis
Q.M.S Advisors | tel: +41 (0)78 922 08 77 | e-mail: [email protected] |
Page 29
09.09.2013
Holder Name Portfolio Name Source Amt Held % Out Latest Chg File Dt Inst Type
SHENZHEN INVESTMENT n/a Co File 481'359'551 10.06 - 31.12.2011 Government
YUAN TRUST INVESTMEN n/a Co File 380'000'000 7.94 - 31.12.2011 Other
LZ JING'AO INDUST DE n/a EXCH 273'701'889 5.72 - 18.06.2012 Corporation
CHINA FOREIGN ECONOM n/a EXCH 241'770'726 5.05 - 31.01.2013 Corporation
LINZHI XINHAOSHI INV n/a EXCH 230'560'999 4.82 (88'533'188) 19.04.2013 Other
SHUM YIP HOLDINGS CO n/a Co File 179'675'070 3.75 - 31.12.2011 Holding Company
SHENZHEN WUXIN YUFU n/a Co File 178'802'104 3.74 - 31.12.2011 Corporation
GONGBUJIANGDA JIANGN n/a Co File 139'112'886 2.91 - 31.12.2011 Other
SOCIAL SECURITY FUND n/a Co File 111'007'892 2.32 - 31.12.2011 Government
BLACKROCK ASSET MGMT Multiple Portfolios MF-AGG 81'976'019 1.71 - 30.08.2013 Investment Advisor
BOSHI FUND MANAGEMEN Multiple Portfolios MF-AGG 81'514'389 1.7 33'373'891 30.06.2013 Investment Advisor
CHINA ASSET MANAGEME Multiple Portfolios MF-AGG 71'012'998 1.48 43'210'497 30.06.2013 Investment Advisor
E FUND MANAGEMENT Multiple Portfolios MF-AGG 64'039'044 1.34 12'482'322 31.12.2012 Investment Advisor
DACHENG FUND MANAGME Multiple Portfolios MF-AGG 54'559'640 1.14 20'156'697 31.12.2012 Investment Advisor
HUAAN FUND MANAGEMEN Multiple Portfolios MF-AGG 49'658'290 1.04 9'563'462 30.06.2013 Investment Advisor
HARVEST FUND MANAGEM Multiple Portfolios MF-AGG 39'900'868 0.83 (8'005'129) 30.06.2013 Investment Advisor
AEGON INDUSTRIAL FUN Multiple Portfolios MF-AGG 33'850'916 0.71 3'650'641 01.07.2013 Investment Advisor
CSOP ASSET MANAGEMEN Multiple Portfolios MF-AGG 32'525'031 0.68 - 02.09.2013 Investment Advisor
FULLGOAL FUND MANAGE Multiple Portfolios MF-AGG 25'700'753 0.54 (1'994'851) 31.12.2012 Investment Advisor
GREAT WALL FUND MANA Multiple Portfolios MF-AGG 25'060'137 0.52 7'910'936 30.06.2013 Investment Advisor
Firm Name Analyst Recommendation Weighting Change Target Price Date Date
Northeast Securities Co Ltd XINAN ZHAO add 4 M #N/A N/A Not Provided 03.09.2013
Credit Suisse ARJAN VAN VEEN outperform 5 M 60 Not Provided 02.09.2013
Chang Jiang Securities Co. Limited LIU JUN buy 5 M #N/A N/A Not Provided 02.09.2013
JPMorgan MW KIM overweight 5 M 54 9 month 30.08.2013
Capital Securities Corp XIE JIYONG buy 5 M 45 Not Provided 30.08.2013
GF Securities Co. Ltd. CONG LI buy 5 N #N/A N/A Not Provided 30.08.2013
Sinolink Securities Co Ltd HE GUOWEN buy 5 M #N/A N/A Not Provided 30.08.2013
HSBC JAMES GARNER overweight 5 M 50 Not Provided 29.08.2013
China Merchants Securities LUO YI strong buy 5 M 54 12 month 21.08.2013
Everbright Securities Co., Ltd ZIPEI TANG buy 5 M #N/A N/A Not Provided 05.08.2013
SWS Research Co Ltd TINA SUN buy 5 M #N/A N/A Not Provided 24.07.2013
UBS JANET SUN buy 5 M 55 12 month 17.07.2013
Goldman Sachs MANCY SUN Buy/Neutral 5 M 65 12 month 16.05.2013
Guotai Junan PENG YULONG buy 5 M #N/A N/A Not Provided 27.03.2013
Bank of China International SUN PENG buy 5 M 51 Not Provided 15.03.2013
Guodu Securities Co Ltd DENG TING buy 5 M #N/A N/A Not Provided 15.03.2013
Hong Yuan Securities ZHANG JIXIU add 4 M 61 6 month 03.02.2013
HuaChuang Securities GAO LI buy 5 M 62 6 month 12.12.2012
Great Wall Securities BIAO HUANG strong buy 5 M #N/A N/A Not Provided 27.08.2012
Citic Securities Co., Ltd PAN HONGWEN buy 5 M 62 6 month 24.07.2012
China Securities Co., Ltd JIAO WENCHAO buy 5 M 60 Not Provided 25.06.2012
Industrial Securities ZHANG YING buy 5 M #N/A N/A Not Provided 29.03.2012
China Minzu Securities Co Ltd SONG JIAN add 4 D 45 6 month 01.12.2011
PingAn Securities DOU ZEYUN strong buy 5 M 101 6 month 07.01.2011
China Galaxy Securities XU LIPING buy 5 M 68 12 month 29.06.2010
China Investment Securities XU SHOUDE buy 5 M #N/A N/A Not Provided 17.08.2009
Holdings By:
Ping An Insurance Group Co of China Ltd ee
Q.M.S Advisors | tel: +41 (0)78 922 08 77 | e-mail: [email protected] |
Page 30
09.09.2013
Shanghai Pudong Development Bank Co., Ltd. provides a broad range of retail and
commercial banking services to its customers. The Company's services include
commercial and consumer loans, deposits, remittances, accounts settlement,
foreign exchange, letters of credit, and other related businesses.
Latest Fiscal Year: 12/2012
LTM as of: 06/yy
52-Week High (04.02.2013) 12.27
52-Week Low (26.09.2012) 7.10
Daily Volume
10.53
52-Week High % Change -14.18% Dividend Yield -
52-Week Low % Change 48.31% Beta 1.13
% 52 Week Price Range High/Low 47.78% Equity Float 10'707.07
Shares Out 30.06.2013 18'653.5 Short Int -
196'421.05 1 Yr Total Return 46.30%
Total Debt 732'285.00 YTD Return 12.08%
Preferred Stock 0.0 Adjusted BETA 1.126
Minority Interest 2'162.0 Analyst Recs 22
Cash and Equivalents 1'091'365.00 Consensus Rating 4.455
Enterprise Value -
Average Volume 5 Day #########
600000 CH EQUITY YTD Change - Average Volume 30 Day #########
600000 CH EQUITY YTD % CHANGE - Average Volume 3 Month #########
LTM-4Q LTM FY+1 FY+2 FQ+1 FQ+2
31.12.2008 31.12.2009 31.12.2010 31.12.2011 31.12.2012 06/yy 06/yy 12/13 Y 12/14 Y 09/13 Q3 12/13 Q4
59'287.9 63'989.0 78'032.2 128'186.4 160'408.0 151'078.0 171'915.6 93'738.8 107'340.8 25'616.5 26'315.5
- - - - - 0.00x 0.00x - - - -
- - - - - 0.0 0.0 - - - -
- - - - - 0.00x 0.00x - - - -
12'516.0 13'216.6 19'177.2 27'286.0 34'186.0 31'599.4 36'379.0 38'564.0 42'832.5 9'780.0 9'487.0
5.99x 13.39x 7.74x 5.80x 5.41x 4.80x 4.25x 5.17x 4.61x 4.70x 4.58x
EBITDA - Long-Term Rating Date 24.06.2013
EBIT - Long-Term Rating BBB+
Operating Margin 53.82% Long-Term Outlook STABLE
Pretax Margin 53.58% Short-Term Rating Date 24.06.2013
Return on Assets 1.12% Short-Term Rating A-2
Return on Common Equity 20.86%
Return on Capital 4.01% EBITDA/Interest Exp. -
Asset Turnover 0.05% (EBITDA-Capex)/Interest Exp. -
Net Debt/EBITDA -
Gross Margin - Total Debt/EBITDA -
EBITDA Margin -
EBIT Margin - Total Debt/Equity 412.6%
Net Income Margin 40.9% Total Debt/Capital 80.3%
Asset Turnover 0.05
Current Ratio - Net Fixed Asset Turnover 18.01
Quick Ratio - Accounts receivable turnover-days -
Debt to Assets 23.28% Inventory Days -
Tot Debt to Common Equity 412.56% Accounts Payable Turnover Day -
Accounts Receivable Turnover - Cash Conversion Cycle -
Inventory Turnover -
Profitability S&P Issuer Ratings
Credit Ratios
Margin Analysis
Reference
Structure
Net Income
P/E
Market Capitalization
Average Daily Trading Volume
Relative Stock Price Performance
Total Revenue
TEV/Revenue
EBITDA
TEV/EBITDA
Fiscal Year Ended
Shanghai Pudong Development BankPrice/Volume
Valuation Analysis
580'189'224.00
Current Price (9/dd/yy) Market Data
,
.
1
3
5
-,
-.
-1
o!-. l!-. k!-. a!-. g!-0 c!-0 j!-0 Q!-0 j!-0 g!-0 g!-0 Q!-0 o!-0', F
2,', F
-,,', F
-2,', F
.,,', F
.2,', F
0,,', F
02,', F
1,,', F
0.0
20'000.0
40'000.0
60'000.0
80'000.0
100'000.0
120'000.0
140'000.0
160'000.0
180'000.0
2001 2002 2003 2004 2005 2006 2007 2008 2009 2010 2011 2012
,',,
-,',,
.,',,
0,',,
1,',,
2,',,
3,',,
,-',-'.,-, ,-',4'.,-, ,-',-'.,-- ,-',4'.,-- ,-',-'.,-. ,-',4'.,-. ,-',-'.,-0 ,-',4'.,-0
FReTn/CTrThoT/PolhirTlAlcST/ !Rna /eis FReTn/CTrThoT/PolhirTlAlcST/ !Rna /eis
Q.M.S Advisors | tel: +41 (0)78 922 08 77 | e-mail: [email protected] |
Page 31
09.09.2013
Holder Name Portfolio Name Source Amt Held % Out Latest Chg File Dt Inst Type
CHINA MOBILE GROUP C n/a Co File 3'730'694'283 20 - 31.12.2012 Corporation
SHANGHAI INTERNATION n/a Co File 3'157'513'917 16.93 - 31.12.2012 Corporation
SHANGHAI INTERNATION n/a Co File 975'923'794 5.23 - 31.12.2012 Investment Advisor
SH GUOXIN INVEST DEV n/a Co File 377'101'999 2.02 - 31.12.2012 Other
CHINA ASSET MANAGEME Multiple Portfolios MF-AGG 217'859'714 1.17 141'095'094 30.06.2013 Investment Advisor
BLACKROCK ASSET MGMT Multiple Portfolios MF-AGG 194'741'528 1.04 - 30.08.2013 Investment Advisor
BAILIAN GROUP CO LTD n/a Co File 190'083'517 1.02 - 31.12.2012 Corporation
YOUNGOR GROUP CO n/a Co File 176'900'000 0.95 - 31.12.2012 Corporation
CHINA NATL TOBACCO C n/a Co File 160'880'407 0.86 - 31.12.2012 Corporation
CITIC SECURITIES CO n/a ULT-AGG 156'086'170 0.84 - 31.12.2012 Investment Advisor
NICE GROUP BV n/a Co File 153'224'629 0.82 - 31.12.2012 Other
CHINA SOUTHERN FUND Multiple Portfolios MF-AGG 149'689'245 0.8 45'754'802 30.06.2013 Investment Advisor
CHINA PACIFIC LIFE I n/a Co File 126'343'926 0.68 - 31.12.2012 Insurance Company
HARVEST FUND MANAGEM Multiple Portfolios MF-AGG 124'145'321 0.67 27'771'457 30.06.2013 Investment Advisor
CHINA LIFE INSURANCE n/a ULT-AGG 121'822'864 0.65 - 31.12.2012 Government
E FUND MANAGEMENT Multiple Portfolios MF-AGG 114'745'699 0.62 (57'481'300) 31.12.2012 Investment Advisor
EVERBRIGHT PRAMERICA Multiple Portfolios MF-AGG 112'817'257 0.6 64'118'944 30.06.2013 Investment Advisor
HUAAN FUND MANAGEMEN Multiple Portfolios MF-AGG 102'929'820 0.55 57'817'950 30.06.2013 Investment Advisor
ICBC CREDIT SUISSE A Multiple Portfolios MF-AGG 80'638'588 0.43 31'505'772 30.06.2013 Investment Advisor
CSOP ASSET MANAGEMEN Multiple Portfolios MF-AGG 77'222'901 0.41 - 02.09.2013 Investment Advisor
Firm Name Analyst Recommendation Weighting Change Target Price Date Date
Guotai Junan GUANHUA QIU add 4 U 9 Not Provided 20.08.2013
Chang Jiang Securities Co. Limited LIU JUN add 4 M #N/A N/A Not Provided 18.08.2013
Northeast Securities Co Ltd YAYUN TANG add 4 M #N/A N/A Not Provided 15.08.2013
Qilu Securities Co Ltd JIAOYI CHENG buy 5 M #N/A N/A Not Provided 14.08.2013
HSBC MICHAEL CHU neutral 3 M 11 Not Provided 13.08.2013
GF Securities Co. Ltd. Mu Hua buy 5 M #N/A N/A Not Provided 11.08.2013
UBS JANET SUN buy 5 M 11 12 month 07.08.2013
PingAn Securities GRACE LI buy 5 M #N/A N/A Not Provided 06.08.2013
Central China Securities CHEN XI add 4 M #N/A N/A Not Provided 29.07.2013
Standard Chartered DORRIS CHEN outperform 5 M 10 12 month 10.07.2013
Goldman Sachs NING MA neutral/neutral 3 M 11 12 month 12.06.2013
EVA Dimensions DOUG WALTERS buy 5 M #N/A N/A Not Provided 06.06.2013
Everbright Securities Co., Ltd SHEN WEI buy 5 M 15 12 month 02.06.2013
Deutsche Bank TRACY YU not rated #N/A N/A M #N/A N/A Not Provided 12.04.2013
Bank of China International YUAN LIN hold 3 M 16 Not Provided 22.03.2013
Guodu Securities Co Ltd DENG TING buy 5 M #N/A N/A Not Provided 18.03.2013
Founder Securities WEI ZHOU add 4 M #N/A N/A Not Provided 15.03.2013
Capital Securities Corp XIE JIYONG buy 5 M 12 Not Provided 14.03.2013
Sinolink Securities Co Ltd JIANGANG CHEN add 4 N #N/A N/A Not Provided 14.03.2013
China International Capital Corp MAO JUNHUA buy 5 M #N/A N/A Not Provided 14.03.2013
Citic Securities Co., Ltd ZHU YAN overweight 5 M 12 6 month 22.01.2013
Hong Yuan Securities ZHANG JIXIU add 4 M 9 6 month 07.01.2013
Great Wall Securities BIAO HUANG neutral 3 M #N/A N/A Not Provided 15.08.2012
China Merchants Securities LUO YI strong buy 5 M #N/A N/A Not Provided 23.07.2012
China Securities Co., Ltd #N/A N/A add 4 M 11 Not Provided 25.06.2012
Industrial Securities YIDONG ZHANG buy 5 M #N/A N/A Not Provided 12.04.2012
AJ Securities ZHANG ZHIPENG buy 5 M 10 6 month 19.03.2012
Rising Securities Co.,LTD XIE AIHONG outperform 5 M #N/A N/A Not Provided 16.03.2012
China Minzu Securities Co Ltd ZHANG JING buy 5 M #N/A N/A Not Provided 05.01.2012
BOCOM International Holdings LI SHANSHAN buy 5 M #N/A N/A Not Provided 07.11.2011
Tebon Securities Co Ltd TEAM COVERAGE outperform 5 N 11 6 month 16.08.2011
HuaChuang Securities GAO LI buy 5 M #N/A N/A Not Provided 28.04.2011
China Galaxy Securities YE YUNYAN speculative buy 4 M #N/A N/A Not Provided 11.05.2010
China Investment Securities CHEN SHUIXIANG buy 5 M #N/A N/A Not Provided 12.04.2010
Holdings By:
Shanghai Pudong Development Bank ee
Q.M.S Advisors | tel: +41 (0)78 922 08 77 | e-mail: [email protected] |
Page 32
09.09.2013
Kweichow Moutai Co., Ltd. manufactures spirits. The Company's spirit products
are distilled from sorghum and wheat. Kweichow Moutai markets its products
worldwide.
Latest Fiscal Year: 12/2012
LTM as of: 06/yy
52-Week High (19.10.2012) 254.96
52-Week Low (03.09.2013) 149.00
Daily Volume
150.95
52-Week High % Change -40.79% Dividend Yield -
52-Week Low % Change 1.31% Beta 0.64
% 52 Week Price Range High/Low 1.21% Equity Float 346.48
Shares Out 30.06.2013 1'038.2 Short Int -
156'713.28 1 Yr Total Return -35.48%
Total Debt 0.00 YTD Return -25.42%
Preferred Stock 0.0 Adjusted BETA 0.639
Minority Interest 1'304.4 Analyst Recs 23
Cash and Equivalents 22'062.00 Consensus Rating 4.696
Enterprise Value 139'483.90
Average Volume 5 Day 10'680'770
600519 CH EQUITY YTD Change - Average Volume 30 Day 3'829'704
600519 CH EQUITY YTD % CHANGE - Average Volume 3 Month 3'572'046
LTM-4Q LTM FY+1 FY+2 FQ+1 FQ+2
31.12.2008 31.12.2009 31.12.2010 31.12.2011 31.12.2012 06/yy 06/yy 12/13 Y 12/14 Y 09/13 Q3 12/13 Q4
7'559.9 8'729.5 10'056.3 15'925.0 23'882.7 19'284.6 25'012.7 30'037.0 34'986.6 6'657.0 7'058.0
12.53x 17.26x 15.99x 11.48x 8.22x 40.28x 23.50x 4.39x 3.55x - -
5'451.2 6'148.2 7'269.4 12'330.1 18'841.5 0.0 0.0 21'697.3 24'963.5 - -
17.38x 24.51x 22.13x 14.83x 10.42x 0.00x 0.00x 6.43x 5.59x - -
3'799.5 4'312.4 5'051.2 8'763.1 13'308.1 10'851.7 13'560.3 15'277.2 18'073.5 3'834.0 3'442.5
26.97x 37.16x 34.38x 22.90x 16.30x 22.88x 14.73x 10.24x 8.45x - -
EBITDA 18'841.46 Long-Term Rating Date -
EBIT 18'406.66 Long-Term Rating -
Operating Margin 77.07% Long-Term Outlook -
Pretax Margin 78.30% Short-Term Rating Date -
Return on Assets 32.55% Short-Term Rating -
Return on Common Equity 43.34%
Return on Capital - EBITDA/Interest Exp. 142498.46
Asset Turnover 0.60% (EBITDA-Capex)/Interest Exp. 110643.75
Net Debt/EBITDA -
Gross Margin 91.4% Total Debt/EBITDA -
EBITDA Margin -
EBIT Margin 75.8% Total Debt/Equity 0.0%
Net Income Margin 55.7% Total Debt/Capital 0.0%
Asset Turnover 0.60
Current Ratio 3.80 Net Fixed Asset Turnover 3.25
Quick Ratio 2.34 Accounts receivable turnover-days 2.80
Debt to Assets 0.00% Inventory Days 1724.15
Tot Debt to Common Equity 0.00% Accounts Payable Turnover Day 13.53
Accounts Receivable Turnover 130.42 Cash Conversion Cycle 1491.32
Inventory Turnover 0.21
Fiscal Year Ended
Kweichow Moutai Co LtdPrice/Volume
Valuation Analysis
6'927'092.00
Current Price (9/dd/yy) Market Data
Net Income
P/E
Market Capitalization
Average Daily Trading Volume
Relative Stock Price Performance
Total Revenue
TEV/Revenue
EBITDA
TEV/EBITDA
Profitability S&P Issuer Ratings
Credit Ratios
Margin Analysis
Reference
Structure
,
2,
-,,
-2,
.,,
.2,
0,,
o!-. l!-. k!-. a!-. g!-0 c!-0 j!-0 Q!-0 j!-0 g!-0 g!-0 Q!-0', F
2', F
-,', F
-2', F
.,', F
.2', F
0.0
5'000.0
10'000.0
15'000.0
20'000.0
25'000.0
30'000.0
2001 2002 2003 2004 2005 2006 2007 2008 2009 2010 2011 2012
,',,
2',,
-,',,
-2',,
.,',,
.2',,
0,',,
02',,
1,',,
12',,
,-',-'.,-, ,-',4'.,-, ,-',-'.,-- ,-',4'.,-- ,-',-'.,-. ,-',4'.,-. ,-',-'.,-0 ,-',4'.,-0
FReTn/CTrThoT/PolhirTlAlcST/ !Rna /eis FReTn/CTrThoT/PolhirTlAlcST/ !Rna /eis
Q.M.S Advisors | tel: +41 (0)78 922 08 77 | e-mail: [email protected] |
Page 33
09.09.2013
Holder Name Portfolio Name Source Amt Held % Out Latest Chg File Dt Inst Type
CHINA KWEICHOW MOUTA n/a EXCH 641'698'212 61.81 - 14.06.2013 Government
CHINA KWEICHOW MOUTA n/a Co File 29'584'372 2.85 - 31.12.2012 Government
GREAT WALL FUND MANA Multiple Portfolios MF-AGG 14'255'545 1.37 8'854'883 30.06.2013 Investment Advisor
BOSHI FUND MANAGEMEN Multiple Portfolios MF-AGG 13'277'210 1.28 6'922'794 30.06.2013 Investment Advisor
GF FUND MANAGEMENT C Multiple Portfolios MF-AGG 13'117'054 1.26 (653'237) 31.12.2012 Investment Advisor
E FUND MANAGEMENT Multiple Portfolios MF-AGG 11'283'791 1.09 2'681'002 31.12.2012 Investment Advisor
HARVEST FUND MANAGEM Multiple Portfolios MF-AGG 10'091'394 0.97 (7'970'615) 31.12.2012 Investment Advisor
CHINA SOUTHERN FUND Multiple Portfolios MF-AGG 9'096'275 0.88 (854'558) 30.06.2013 Investment Advisor
CHINA ASSET MANAGEME Multiple Portfolios MF-AGG 8'554'452 0.82 6'494'344 30.06.2013 Investment Advisor
FULLGOAL FUND MANAGE Multiple Portfolios MF-AGG 8'455'553 0.81 (445'055) 31.12.2012 Investment Advisor
DACHENG FUND MANAGME Multiple Portfolios MF-AGG 7'680'798 0.74 (3'529'198) 31.12.2012 Investment Advisor
BLACKROCK ASSET MGMT Multiple Portfolios MF-AGG 7'375'193 0.71 - 30.08.2013 Investment Advisor
HUAAN FUND MANAGEMEN Multiple Portfolios MF-AGG 6'899'928 0.66 853'218 30.06.2013 Investment Advisor
CHINA LIFE INSURANCE n/a ULT-AGG 6'484'459 0.62 - 31.12.2012 Government
CHINA MERCHANTS FUND Multiple Portfolios MF-AGG 5'992'353 0.58 3'568'411 30.06.2013 Investment Advisor
ICBC CREDIT SUISSE A Multiple Portfolios MF-AGG 5'905'659 0.57 521'183 30.06.2013 Investment Advisor
CHINA UNIVERSAL ASSE Multiple Portfolios MF-AGG 5'598'894 0.54 (2'364'144) 02.09.2013 Investment Advisor
COFCO LTD n/a Co File 5'499'416 0.53 - 31.12.2012 Government
SINO LIFE INSURANCE n/a Co File 5'324'536 0.51 - 31.12.2012 Insurance Company
AEGON INDUSTRIAL FUN Multiple Portfolios MF-AGG 4'967'018 0.48 2'172'118 30.06.2013 Investment Advisor
Firm Name Analyst Recommendation Weighting Change Target Price Date Date
Capital Securities Corp LIU HUI hold 3 M 170 Not Provided 03.09.2013
Sinolink Securities Co Ltd CHEN GANG buy 5 M #N/A N/A Not Provided 03.09.2013
China International Capital Corp QIAO YANG buy 5 M #N/A N/A Not Provided 03.09.2013
UBS DENNIS WANG buy 5 M 238 12 month 02.09.2013
SWS Research Co Ltd MICHAEL TONG buy 5 M #N/A N/A Not Provided 02.09.2013
Guotai Junan HU CHUNXIA buy 5 M 200 12 month 02.09.2013
PingAn Securities WEN XIAN buy 5 M #N/A N/A Not Provided 02.09.2013
Fortune CLSA Securities Limited KATHARINE SONG buy 5 M 228 Not Provided 02.09.2013
Morgan Stanley LILLIAN LOU Overwt/In-Line 5 M 209 12 month 01.09.2013
Chang Jiang Securities Co. Limited ZHIJIAN CHEN buy 5 M #N/A N/A Not Provided 01.09.2013
Everbright Securities Co., Ltd TINGZHI XING buy 5 M 262 12 month 12.08.2013
HSBC CHRISTOPHER K LEUNG overweight 5 N 226 Not Provided 28.07.2013
China Merchants Securities LONG JUN strong buy 5 M 238 12 month 24.07.2013
Hong Yuan Securities SU QINGQING buy 5 M #N/A N/A Not Provided 06.07.2013
Guodu Securities Co Ltd ZHAO XIANDONG buy 5 M #N/A N/A Not Provided 27.06.2013
EVA Dimensions CRAIG STERLING buy 5 M #N/A N/A Not Provided 06.06.2013
AJ Securities WU ZHENGWU neutral 3 M #N/A N/A Not Provided 25.04.2013
Rising Securities Co.,LTD ZHAO YUE outperform 5 M #N/A N/A Not Provided 22.04.2013
Credit Suisse VINCENT CHAN neutral 3 M 184 Not Provided 17.04.2013
Founder Securities BAOPING ZHANG add 4 M 283 6 month 29.03.2013
Citic Securities Co., Ltd HUANG WEI buy 5 M 270 6 month 04.03.2013
Masterlink Securities LIU WEI buy 5 M 246 Not Provided 25.01.2013
Bank of China International SU CHENG buy 5 M 274 Not Provided 25.01.2013
HuaChuang Securities GAO LI strong buy 5 M 255 6 month 24.01.2013
China Securities Co., Ltd FUSHENG HUANG buy 5 M 240 Not Provided 25.06.2012
Northeast Securities Co Ltd ZHU CHENGLIANG buy 5 M #N/A N/A Not Provided 21.06.2012
China Investment Securities KE HAIDONG strong buy 5 M #N/A N/A Not Provided 02.03.2011
Central China Securities LIU RAN buy 5 M #N/A N/A Not Provided 09.09.2010
China Galaxy Securities DONG JUNFENG speculative buy 4 M 146 12 month 02.04.2010
KGI Securities SABRINA LEE neutral 3 M 145 12 month 17.08.2009
Holdings By:
Kweichow Moutai Co Ltd ee
Q.M.S Advisors | tel: +41 (0)78 922 08 77 | e-mail: [email protected] |
Page 34
09.09.2013
Bank of Communications Co. Ltd. provides a full range of commercial banking
services including RMB and foreign currency deposit, loan, international and
domestic settlement, discount, currency trading, letter of credit, bank
guarantee, and other related services.
Latest Fiscal Year: 12/2012
LTM as of: 06/yy
52-Week High (04.02.2013) 5.68
52-Week Low (29.07.2013) 3.68
Daily Volume
4.51
52-Week High % Change -20.60% Dividend Yield -
52-Week Low % Change 22.55% Beta 0.85
% 52 Week Price Range High/Low 21.00% Equity Float 17'295.79
Shares Out 30.06.2013 39'250.9 Short Int -
335'645.97 1 Yr Total Return 10.36%
Total Debt 1'040'404.00 YTD Return -3.27%
Preferred Stock 0.0 Adjusted BETA 0.850
Minority Interest 1'529.0 Analyst Recs 16
Cash and Equivalents 1'349'429.00 Consensus Rating 4.250
Enterprise Value -
Average Volume 5 Day 80'540'190
601328 CH EQUITY YTD Change - Average Volume 30 Day 67'351'940
601328 CH EQUITY YTD % CHANGE - Average Volume 3 Month 74'254'960
LTM-4Q LTM FY+1 FY+2 FQ+1 FQ+2
31.12.2008 31.12.2009 31.12.2010 31.12.2011 31.12.2012 06/yy 06/yy 12/13 Y 12/14 Y 09/13 Q3 12/13 Q4
129'757.0 132'775.0 164'124.0 218'749.0 271'747.0 251'346.0 282'864.0 160'821.4 180'243.4 41'607.0 40'911.0
- - - - - 0.00x 0.00x - - - -
- - - - - 0.0 0.0 - - - -
- - - - - 0.00x 0.00x - - - -
28'524.0 30'118.0 39'042.0 50'735.0 58'373.0 55'428.0 62'112.0 63'300.1 69'687.9 13'582.0 12'181.0
8.49x 13.01x 9.09x 5.37x 5.34x 4.92x 4.62x 5.24x 4.74x 5.18x 4.90x
EBITDA - Long-Term Rating Date 06.12.2011
EBIT - Long-Term Rating A-
Operating Margin 49.62% Long-Term Outlook STABLE
Pretax Margin 49.72% Short-Term Rating Date 28.11.2012
Return on Assets 1.14% Short-Term Rating A-2
Return on Common Equity 17.89%
Return on Capital 4.07% EBITDA/Interest Exp. -
Asset Turnover 0.05% (EBITDA-Capex)/Interest Exp. -
Net Debt/EBITDA -
Gross Margin - Total Debt/EBITDA -
EBITDA Margin -
EBIT Margin - Total Debt/Equity 273.8%
Net Income Margin 38.6% Total Debt/Capital 73.2%
Asset Turnover 0.05
Current Ratio - Net Fixed Asset Turnover 6.40
Quick Ratio - Accounts receivable turnover-days -
Debt to Assets 19.73% Inventory Days -
Tot Debt to Common Equity 273.85% Accounts Payable Turnover Day -
Accounts Receivable Turnover - Cash Conversion Cycle -
Inventory Turnover -
Profitability S&P Issuer Ratings
Credit Ratios
Margin Analysis
Reference
Structure
Net Income
P/E
Market Capitalization
Average Daily Trading Volume
Relative Stock Price Performance
Total Revenue
TEV/Revenue
EBITDA
TEV/EBITDA
Fiscal Year Ended
Bank of Communications Co LtdPrice/Volume
Valuation Analysis
476'720'758.00
Current Price (9/dd/yy) Market Data
,
-
.
0
1
2
3
o!-. l!-. k!-. a!-. g!-0 c!-0 j!-0 Q!-0 j!-0 g!-0 g!-0 Q!-0 o!-0', F
2,', F
-,,', F
-2,', F
.,,', F
.2,', F
0,,', F
0.0
50'000.0
100'000.0
150'000.0
200'000.0
250'000.0
300'000.0
2001 2002 2003 2004 2005 2006 2007 2008 2009 2010 2011 2012
,',,
.',,
1',,
3',,
5',,
-,',,
-.',,
,-',-'.,-, ,-',4'.,-, ,-',-'.,-- ,-',4'.,-- ,-',-'.,-. ,-',4'.,-. ,-',-'.,-0 ,-',4'.,-0
FReTn/CTrThoT/PolhirTlAlcST/ !Rna /eis FReTn/CTrThoT/PolhirTlAlcST/ !Rna /eis
Q.M.S Advisors | tel: +41 (0)78 922 08 77 | e-mail: [email protected] |
Page 35
09.09.2013
Holder Name Portfolio Name Source Amt Held % Out Latest Chg File Dt Inst Type
CHINA MINISTRY OF FI n/a EXCH 15'148'693'829 38.59 2'530'340'780 23.08.2012 Government
SOCIAL SECURITY FUND n/a EXCH 1'877'513'451 4.78 - 23.08.2012 Government
CAPITAL AIRPORT HOLD n/a EXCH 1'246'591'087 3.18 - 23.08.2012 Corporation
SHANGHAI TOBACCO GRO n/a EXCH 808'145'417 2.06 439'560'439 23.08.2012 Corporation
PING AN LIFE INSURAN n/a EXCH 705'385'012 1.8 - 23.08.2012 Insurance Company
CHINA FAW GROUP CORP n/a EXCH 663'941'711 1.69 - 23.08.2012 Government
YUNNAN HONGTA GROUP n/a EXCH 658'467'013 1.68 219'780'219 23.08.2012 Corporation
STATE GRID CORP OF C n/a EXCH 571'078'169 1.45 - 23.08.2012 Government
CHINA PETROCHEMICAL n/a EXCH 374'901'733 0.96 (560'000) 17.08.2012 Government
BLACKROCK ASSET MGMT Multiple Portfolios MF-AGG 329'576'070 0.84 - 30.08.2013 Investment Advisor
AVIATION INDUSTRY CO n/a ULT-AGG 310'678'434 0.79 - 17.08.2012 Corporation
CHINA NATIONAL PETRO n/a EXCH 294'936'165 0.75 - 17.08.2012 Government
CHINA ASSET MANAGEME Multiple Portfolios MF-AGG 269'944'695 0.69 238'752'320 30.06.2013 Investment Advisor
HARVEST FUND MANAGEM Multiple Portfolios MF-AGG 175'925'036 0.45 (155'754'585) 30.06.2013 Investment Advisor
CHINA SOUTHERN FUND Multiple Portfolios MF-AGG 152'376'214 0.39 33'965'778 30.06.2013 Investment Advisor
CSOP ASSET MANAGEMEN Multiple Portfolios MF-AGG 131'821'233 0.34 - 02.09.2013 Investment Advisor
HUATAI-PINEBRIDGE FU Multiple Portfolios MF-AGG 90'715'369 0.23 (3'000'000) 31.12.2012 Investment Advisor
AEGON INDUSTRIAL FUN Multiple Portfolios MF-AGG 68'067'922 0.17 61'400'572 01.07.2013 Investment Advisor
INVESCO GREAT WALL F Multiple Portfolios MF-AGG 66'101'350 0.17 49'861'861 31.12.2012 Investment Advisor
EVERBRIGHT PRAMERICA Multiple Portfolios MF-AGG 49'993'170 0.13 45'493'203 31.12.2012 Investment Advisor
Firm Name Analyst Recommendation Weighting Change Target Price Date Date
PingAn Securities GRACE LI buy 5 M #N/A N/A Not Provided 03.09.2013
HSBC TODD DUNIVANT overweight 5 U 5 Not Provided 28.08.2013
Northeast Securities Co Ltd YAYUN TANG buy 5 M #N/A N/A Not Provided 25.08.2013
Masterlink Securities RAINY YUAN hold 3 M 4 6 month 23.08.2013
Capital Securities Corp XIE JIYONG buy 5 M 5 Not Provided 22.08.2013
Bank of China International YUAN LIN hold 3 M 7 Not Provided 22.08.2013
China International Capital Corp MAO JUNHUA buy 5 M #N/A N/A Not Provided 22.08.2013
Guotai Junan GUANHUA QIU buy 5 U 5 Not Provided 20.08.2013
Chang Jiang Securities Co. Limited LIU JUN buy 5 M #N/A N/A Not Provided 18.08.2013
Qilu Securities Co Ltd JIAOYI CHENG add 4 M #N/A N/A Not Provided 11.08.2013
UBS JANET SUN neutral 3 D 4 12 month 07.08.2013
SWS Research Co Ltd BECKY XU buy 5 M #N/A N/A Not Provided 19.07.2013
GF Securities Co. Ltd. Mu Hua add 4 M #N/A N/A Not Provided 19.06.2013
Goldman Sachs NING MA neutral/neutral 3 M 4 12 month 12.06.2013
Everbright Securities Co., Ltd SHEN WEI accumulate 4 M 5 12 month 02.06.2013
Hong Yuan Securities ZHANG JIXIU add 4 M #N/A N/A Not Provided 25.04.2013
China Merchants Securities LUO YI buy 5 M #N/A N/A Not Provided 23.07.2012
Citic Securities Co., Ltd ZHU YAN overweight 5 M #N/A N/A Not Provided 29.06.2012
Industrial Securities YIDONG ZHANG buy 5 M #N/A N/A Not Provided 28.03.2012
Central China Securities CHEN XI add 4 M #N/A N/A Not Provided 12.01.2012
Rising Securities Co.,LTD XIE AIHONG neutral 3 D #N/A N/A Not Provided 20.12.2011
China Investment Securities ZHANG ZHONGYANG buy 5 M #N/A N/A Not Provided 02.12.2011
Great Wall Securities CHENG BINBIN neutral 3 N #N/A N/A Not Provided 23.05.2011
BOCOM International Holdings LI SHANSHAN restricted #N/A N/A M #N/A N/A Not Provided 11.04.2011
China Securities Co., Ltd WEI TAO add 4 M 6 Not Provided 08.12.2010
China Minzu Securities Co Ltd ZHANG JING add 4 M 7 6 month 25.11.2010
China Galaxy Securities YE YUNYAN speculative buy 4 M #N/A N/A Not Provided 11.05.2010
Holdings By:
Bank of Communications Co Ltd ee
Q.M.S Advisors | tel: +41 (0)78 922 08 77 | e-mail: [email protected] |
Page 36
09.09.2013
SAIC Motor Corporation Ltd., through joint ventures, manufactures and markets
automobiles and related parts and accessories.
Latest Fiscal Year: 12/2012
LTM as of: 06/yy
52-Week High (18.02.2013) 19.00
52-Week Low (29.07.2013) 11.83
Daily Volume
13.56
52-Week High % Change -28.63% Dividend Yield -
52-Week Low % Change 14.62% Beta 1.08
% 52 Week Price Range High/Low 18.69% Equity Float 1'823.36
Shares Out 30.06.2013 11'025.6 Short Int -
149'506.69 1 Yr Total Return 14.66%
Total Debt 53'779.96 YTD Return -19.66%
Preferred Stock 0.0 Adjusted BETA 1.076
Minority Interest 22'669.0 Analyst Recs 20
Cash and Equivalents 68'368.70 Consensus Rating 4.600
Enterprise Value 132'848.11
Average Volume 5 Day 25'855'840
600104 CH EQUITY YTD Change - Average Volume 30 Day 28'368'630
600104 CH EQUITY YTD % CHANGE - Average Volume 3 Month 28'072'850
LTM-4Q LTM FY+1 FY+2 FQ+1 FQ+2
31.12.2008 31.12.2009 31.12.2010 31.12.2011 31.12.2012 06/yy 06/yy 12/13 Y 12/14 Y 09/13 Q3 12/13 Q4
104'615.5 138'170.3 357'290.6 423'749.6 473'004.3 490'314.7 521'938.4 539'952.3 602'756.5 129'126.0 145'913.0
0.29x 1.38x 0.36x 0.36x 0.43x 1.24x 1.27x 0.24x 0.24x - -
967.1 4'041.6 32'040.4 37'182.3 32'008.5 0.0 0.0 21'726.0 24'112.8 - -
31.89x 47.29x 4.06x 4.11x 6.33x 0.00x 0.00x 6.11x 5.51x - -
656.2 6'591.9 16'389.8 20'221.9 20'751.8 22'985.2 21'434.0 22'705.8 25'793.9 5'614.0 6'026.0
53.60x 25.97x 9.23x 7.71x 9.37x 6.68x 6.79x 6.38x 5.63x 6.76x 6.53x
EBITDA 32'008.48 Long-Term Rating Date -
EBIT 25'279.90 Long-Term Rating -
Operating Margin 5.34% Long-Term Outlook -
Pretax Margin 8.49% Short-Term Rating Date -
Return on Assets 6.68% Short-Term Rating -
Return on Common Equity 18.19%
Return on Capital - EBITDA/Interest Exp. 41.62
Asset Turnover 1.63% (EBITDA-Capex)/Interest Exp. 20.80
Net Debt/EBITDA -
Gross Margin 15.2% Total Debt/EBITDA -
EBITDA Margin -
EBIT Margin 3.3% Total Debt/Equity 44.0%
Net Income Margin 4.4% Total Debt/Capital 27.1%
Asset Turnover 1.63
Current Ratio 1.21 Net Fixed Asset Turnover 10.96
Quick Ratio 0.70 Accounts receivable turnover-days 31.65
Debt to Assets 16.95% Inventory Days 20.75
Tot Debt to Common Equity 43.96% Accounts Payable Turnover Day 51.55
Accounts Receivable Turnover 11.53 Cash Conversion Cycle 4.70
Inventory Turnover 17.59
Profitability S&P Issuer Ratings
Credit Ratios
Margin Analysis
Reference
Structure
Net Income
P/E
Market Capitalization
Average Daily Trading Volume
Relative Stock Price Performance
Total Revenue
TEV/Revenue
EBITDA
TEV/EBITDA
Fiscal Year Ended
SAIC Motor Corp LtdPrice/Volume
Valuation Analysis
46'787'376.00
Current Price (9/dd/yy) Market Data
,.135
-,-.-1-3-5.,
o!-. l!-. k!-. a!-. g!-0 c!-0 j!-0 Q!-0 j!-0 g!-0 g!-0 Q!-0 o!-0', F-,', F.,', F0,', F1,', F2,', F3,', F4,', F5,', F6,', F-,,', F
0.0
50'000.0
100'000.0
150'000.0
200'000.0
250'000.0
300'000.0
350'000.0
400'000.0
450'000.0
500'000.0
2001 2002 2003 2004 2005 2006 2007 2008 2009 2010 2011 2012
,',,
-',,
.',,
0',,
1',,
2',,
3',,
4',,
5',,
6',,
-,',,
,-',-'.,-, ,-',4'.,-, ,-',-'.,-- ,-',4'.,-- ,-',-'.,-. ,-',4'.,-. ,-',-'.,-0 ,-',4'.,-0
FReTn/CTrThoT/PolhirTlAlcST/ !Rna /eis FReTn/CTrThoT/PolhirTlAlcST/ !Rna /eis
Q.M.S Advisors | tel: +41 (0)78 922 08 77 | e-mail: [email protected] |
Page 37
09.09.2013
Holder Name Portfolio Name Source Amt Held % Out Latest Chg File Dt Inst Type
SHANGHAI AUTO INDUST n/a Co File 8'191'449'931 74.3 - 31.12.2012 Government
YUEJIN MOTOR GROUP C n/a Co File 413'919'141 3.75 - 31.12.2012 Corporation
SHANGHAI AUTO INDUST n/a Co File 334'408'775 3.03 - 31.12.2012 Government
SHUANGYASHAN RUNKE I n/a Co File 95'191'059 0.86 - 31.12.2012 Corporation
SOCIAL SECURITY FUND n/a Co File 92'693'715 0.84 - 31.12.2012 Government
HARVEST FUND MANAGEM Multiple Portfolios MF-AGG 92'517'186 0.84 33'433'716 30.06.2013 Investment Advisor
UBS n/a ULT-AGG 76'137'738 0.69 - 31.05.2013 Unclassified
HUAAN FUND MANAGEMEN Multiple Portfolios MF-AGG 68'707'656 0.62 (27'981'932) 30.06.2013 Investment Advisor
E FUND MANAGEMENT Multiple Portfolios MF-AGG 56'060'818 0.51 22'678'072 31.12.2012 Investment Advisor
CHINA SOUTHERN FUND Multiple Portfolios MF-AGG 55'409'711 0.5 29'979'063 30.06.2013 Investment Advisor
BLACKROCK ASSET MGMT Multiple Portfolios MF-AGG 47'162'376 0.43 - 30.08.2013 Investment Advisor
YINHUA FUND MANAGEME Multiple Portfolios MF-AGG 46'970'278 0.43 2'959'385 30.06.2013 Investment Advisor
CHINA ASSET MANAGEME Multiple Portfolios MF-AGG 45'230'191 0.41 10'633'145 31.12.2012 Investment Advisor
BOSHI FUND MANAGEMEN Multiple Portfolios MF-AGG 45'113'319 0.41 (16'702'417) 30.06.2013 Investment Advisor
EVERBRIGHT PRAMERICA Multiple Portfolios MF-AGG 44'221'858 0.4 35'765'810 30.06.2013 Investment Advisor
FULLGOAL FUND MANAGE Multiple Portfolios MF-AGG 38'992'977 0.35 25'574'366 31.12.2012 Investment Advisor
INVESCO GREAT WALL F Multiple Portfolios MF-AGG 38'339'783 0.35 (36'049'318) 30.06.2013 Investment Advisor
GUOHUA LIFE INSURANC n/a Co File 37'530'729 0.34 - 31.12.2012 Insurance Company
LION FUND MANAGEMENT Multiple Portfolios MF-AGG 26'708'859 0.24 6'615'227 30.06.2013 Investment Advisor
HUATAI-PINEBRIDGE FU Multiple Portfolios MF-AGG 20'648'500 0.19 (1'038'543) 31.12.2012 Investment Advisor
Firm Name Analyst Recommendation Weighting Change Target Price Date Date
Goldman Sachs YIPENG YANG Buy/Neutral 5 M 21 12 month 30.08.2013
Capital Securities Corp HAN WEIQI buy 5 M 17 Not Provided 30.08.2013
Sinolink Securities Co Ltd WU WENZHAO add 4 M #N/A N/A Not Provided 30.08.2013
PingAn Securities DE AN WANG buy 5 D 20 6 month 30.08.2013
Everbright Securities Co., Ltd WEI FENG buy 5 M 17 12 month 17.08.2013
UBS TIANLONG ZOU buy 5 M 17 12 month 07.08.2013
Northeast Securities Co Ltd LIU LIXI buy 5 M #N/A N/A Not Provided 07.08.2013
China Investment Securities ZHANG LEI buy 5 M #N/A N/A Not Provided 06.08.2013
Qilu Securities Co Ltd BAI YU add 4 M #N/A N/A Not Provided 06.08.2013
Guodu Securities Co Ltd LIANG FENG strong buy 5 M #N/A N/A Not Provided 21.07.2013
SWS Research Co Ltd CHANG LU outperform 5 M #N/A N/A Not Provided 19.07.2013
Bank of China International WANG YUSHENG buy 5 M 21 Not Provided 03.07.2013
China Minzu Securities Co Ltd CAO HE add 4 M 16 6 month 28.06.2013
Central China Securities XU MINFENG buy 5 M #N/A N/A Not Provided 20.06.2013
Citic Securities Co., Ltd LI CHUNBO buy 5 M 19 6 month 26.04.2013
Rising Securities Co.,LTD WANG LIANG outperform 5 M #N/A N/A Not Provided 22.04.2013
Hong Yuan Securities PANG LINLIN add 4 M #N/A N/A Not Provided 18.03.2013
EVA Dimensions CRAIG STERLING sell 1 M #N/A N/A Not Provided 15.01.2013
HuaChuang Securities WANG YANXUE buy 5 M #N/A N/A Not Provided 16.12.2012
Great Wall Securities RAN FEI buy 5 M #N/A N/A Not Provided 14.10.2012
China Merchants Securities WANG LIUSHENG strong buy 5 M #N/A N/A Not Provided 20.07.2012
China Securities Co., Ltd CHEN ZHENG buy 5 M 20 Not Provided 25.06.2012
Industrial Securities LI GANGLING buy 5 M #N/A N/A Not Provided 14.04.2012
AJ Securities ZHANG ZHIPENG buy 5 M 22 6 month 22.12.2011
China Galaxy Securities LI DAN speculative buy 4 M #N/A N/A Not Provided 05.12.2009
Holdings By:
SAIC Motor Corp Ltd ee
Q.M.S Advisors | tel: +41 (0)78 922 08 77 | e-mail: [email protected] |
Page 38
09.09.2013
China CITIC Bank Corporation Limited provides a full range of commercial banking
services including RMB and foreign currency deposit, loan, international and
domestic settlement, currency trading, bank guarantee, and export credit.
Latest Fiscal Year: 12/2012
LTM as of: 06/yy
52-Week High (21.03.2013) 5.48
52-Week Low (29.07.2013) 3.39
Daily Volume
4.1
52-Week High % Change -25.18% Dividend Yield 3.66
52-Week Low % Change 20.94% Beta 1.10
% 52 Week Price Range High/Low 19.14% Equity Float 2'752.40
Shares Out 30.06.2013 31'905.2 Short Int -
179'676.72 1 Yr Total Return 11.76%
Total Debt 456'136.00 YTD Return -0.48%
Preferred Stock 0.0 Adjusted BETA 1.097
Minority Interest 4'730.0 Analyst Recs 19
Cash and Equivalents 820'348.00 Consensus Rating 3.526
Enterprise Value -
Average Volume 5 Day 42'372'370
601998 CH EQUITY YTD Change - Average Volume 30 Day 30'912'200
601998 CH EQUITY YTD % CHANGE - Average Volume 3 Month 27'796'150
LTM-4Q LTM FY+1 FY+2 FQ+1 FQ+2
31.12.2008 31.12.2009 31.12.2010 31.12.2011 31.12.2012 06/yy 06/yy 12/13 Y 12/14 Y 09/13 Q3 12/13 Q4
66'493.0 61'458.0 80'283.0 117'780.0 153'719.0 141'379.0 162'956.0 98'288.4 111'906.8 25'941.0 26'265.0
- - - - - 0.00x 0.00x - - - -
- - - - - 0.0 0.0 - - - -
- - - - - 0.00x 0.00x - - - -
13'296.0 14'320.0 21'509.0 30'819.0 31'032.0 35'168.0 32'050.0 34'437.8 38'628.9 10'019.0 5'005.0
5.83x 15.78x 7.77x 4.99x 5.61x 4.37x 4.10x 5.55x 4.90x 5.13x 4.94x
EBITDA - Long-Term Rating Date -
EBIT - Long-Term Rating -
Operating Margin 46.05% Long-Term Outlook -
Pretax Margin 46.03% Short-Term Rating Date -
Return on Assets 1.01% Short-Term Rating -
Return on Common Equity 16.07%
Return on Capital 4.52% EBITDA/Interest Exp. -
Asset Turnover 0.05% (EBITDA-Capex)/Interest Exp. -
Net Debt/EBITDA -
Gross Margin - Total Debt/EBITDA -
EBITDA Margin -
EBIT Margin - Total Debt/Equity 230.0%
Net Income Margin 34.3% Total Debt/Capital 69.2%
Asset Turnover 0.05
Current Ratio - Net Fixed Asset Turnover 14.05
Quick Ratio - Accounts receivable turnover-days -
Debt to Assets 15.41% Inventory Days -
Tot Debt to Common Equity 229.96% Accounts Payable Turnover Day -
Accounts Receivable Turnover - Cash Conversion Cycle -
Inventory Turnover -
Profitability S&P Issuer Ratings
Credit Ratios
Margin Analysis
Reference
Structure
Net Income
P/E
Market Capitalization
Average Daily Trading Volume
Relative Stock Price Performance
Total Revenue
TEV/Revenue
EBITDA
TEV/EBITDA
Fiscal Year Ended
China CITIC Bank Corp LtdPrice/Volume
Valuation Analysis
149'043'522.00
Current Price (9/dd/yy) Market Data
,
-
.
0
1
2
3
o!-. l!-. k!-. a!-. g!-0 c!-0 j!-0 Q!-0 j!-0 g!-0 g!-0 Q!-0 o!-0', F
2,', F
-,,', F
-2,', F
.,,', F
.2,', F
0,,', F
0.0
20'000.0
40'000.0
60'000.0
80'000.0
100'000.0
120'000.0
140'000.0
160'000.0
180'000.0
2001 2002 2003 2004 2005 2006 2007 2008 2009 2010 2011 2012
,',,
2',,
-,',,
-2',,
.,',,
.2',,
,-',-'.,-, ,-',4'.,-, ,-',-'.,-- ,-',4'.,-- ,-',-'.,-. ,-',4'.,-. ,-',-'.,-0 ,-',4'.,-0
FReTn/CTrThoT/PolhirTlAlcST/ !Rna /eis FReTn/CTrThoT/PolhirTlAlcST/ !Rna /eis
Q.M.S Advisors | tel: +41 (0)78 922 08 77 | e-mail: [email protected] |
Page 39
09.09.2013
Holder Name Portfolio Name Source Amt Held % Out Latest Chg File Dt Inst Type
CITIC GROUP n/a ULT-AGG 28'938'928'294 90.7 - 25.02.2013 Government
SOCIAL SECURITY FUND n/a Co File 213'835'341 0.67 - 31.12.2009 Government
BLACKROCK ASSET MGMT Multiple Portfolios MF-AGG 93'289'494 0.29 - 30.08.2013 Investment Advisor
CHANG XIN ASSET MANA Multiple Portfolios MF-AGG 60'969'257 0.19 60'857'010 31.12.2012 Investment Advisor
CHINA POST & CAPITAL CHINA POST CORE GROW MF-PART 58'825'881 0.18 58'825'881 30.06.2013 Investment Advisor
HARVEST FUND MANAGEM Multiple Portfolios MF-AGG 38'800'574 0.12 (5'059'491) 31.12.2012 Investment Advisor
CSOP ASSET MANAGEMEN Multiple Portfolios MF-AGG 37'432'313 0.12 - 02.09.2013 Investment Advisor
HUAAN FUND MANAGEMEN Multiple Portfolios MF-AGG 26'494'834 0.08 6'448'067 31.12.2012 Investment Advisor
CAISSE DE DEPOT ET P Multiple Portfolios MF-AGG 18'305'733 0.06 - 31.12.2012 Investment Advisor
LION FUND MANAGEMENT Multiple Portfolios MF-AGG 15'779'197 0.05 14'818'373 31.12.2012 Investment Advisor
BOSHI FUND MANAGEMEN Multiple Portfolios MF-AGG 14'830'196 0.05 9'788'232 31.12.2012 Investment Advisor
HUATAI-PINEBRIDGE FU Multiple Portfolios MF-AGG 14'204'193 0.04 1'474'246 31.12.2012 Investment Advisor
ICBC CREDIT SUISSE A Multiple Portfolios MF-AGG 11'303'380 0.04 1'718'600 31.12.2012 Investment Advisor
E FUND MANAGEMENT Multiple Portfolios MF-AGG 10'413'312 0.03 4'287'616 31.12.2012 Investment Advisor
CHINA SOUTHERN FUND Multiple Portfolios MF-AGG 9'358'881 0.03 55'500 31.12.2012 Investment Advisor
CHINA UNIVERSAL ASSE Multiple Portfolios MF-AGG 9'062'826 0.03 (370'106) 02.09.2013 Investment Advisor
FRANKLIN TEMPLETON S Multiple Portfolios MF-AGG 7'999'972 0.03 5'546'048 31.12.2012 Investment Advisor
CITIC PRUDENTIAL FUN Multiple Portfolios MF-AGG 7'595'157 0.02 6'806'957 31.12.2012 Investment Advisor
CHINA INTERNATIONAL Multiple Portfolios MF-AGG 7'575'864 0.02 7'509'964 31.12.2012 Investment Advisor
GUOLIAN FUND MANAGEM Multiple Portfolios MF-AGG 5'892'210 0.02 5'892'210 31.12.2012 Investment Advisor
Firm Name Analyst Recommendation Weighting Change Target Price Date Date
PingAn Securities GRACE LI buy 5 M #N/A N/A Not Provided 03.09.2013
Masterlink Securities RAINY YUAN hold 3 M 4 6 month 29.08.2013
Northeast Securities Co Ltd YAYUN TANG add 4 M #N/A N/A Not Provided 29.08.2013
HSBC TODD DUNIVANT overweight 5 U 5 Not Provided 28.08.2013
Capital Securities Corp TEAM COVERAGE hold 3 M #N/A N/A Not Provided 28.08.2013
Bank of China International YUAN LIN sell 1 M 6 Not Provided 28.08.2013
China International Capital Corp JIE HUANG hold 3 M #N/A N/A Not Provided 28.08.2013
Chang Jiang Securities Co. Limited LIU JUN add 4 M #N/A N/A Not Provided 27.08.2013
Guotai Junan GUANHUA QIU add 4 U 4 Not Provided 20.08.2013
Qilu Securities Co Ltd JIAOYI CHENG add 4 M #N/A N/A Not Provided 11.08.2013
UBS JANET SUN neutral 3 M 4 12 month 07.08.2013
SWS Research Co Ltd JUN NI neutral 3 M #N/A N/A Not Provided 19.07.2013
Central China Securities CHEN XI add 4 M #N/A N/A Not Provided 28.06.2013
GF Securities Co. Ltd. Mu Hua hold 3 M #N/A N/A Not Provided 19.06.2013
Goldman Sachs NING MA neutral/neutral 3 M 4 12 month 12.06.2013
Everbright Securities Co., Ltd SHEN WEI accumulate 4 M 6 12 month 02.06.2013
Founder Securities WEI ZHOU add 4 M #N/A N/A Not Provided 24.01.2013
Hong Yuan Securities ZHANG JIXIU add 4 U 4 6 month 12.01.2013
Sinolink Securities Co Ltd JIANGANG CHEN neutral 3 N #N/A N/A Not Provided 30.10.2012
China Merchants Securities LUO YI strong buy 5 M #N/A N/A Not Provided 23.07.2012
Citic Securities Co., Ltd ZHU YAN overweight 5 M 5 6 month 29.06.2012
China Securities Co., Ltd #N/A N/A add 4 M 5 Not Provided 25.06.2012
Industrial Securities YIDONG ZHANG buy 5 M #N/A N/A Not Provided 30.03.2012
Rising Securities Co.,LTD XIE AIHONG buy 5 U #N/A N/A Not Provided 20.12.2011
BOCOM International Holdings LI SHANSHAN long-term buy 5 M 7 12 month 13.12.2011
China Minzu Securities Co Ltd ZHANG JING neutral 3 M 7 6 month 25.11.2010
China Investment Securities CHEN SHUIXIANG buy 5 M #N/A N/A Not Provided 12.04.2010
Holdings By:
China CITIC Bank Corp Ltd ee
Q.M.S Advisors | tel: +41 (0)78 922 08 77 | e-mail: [email protected] |
Page 40
09.09.2013
China Yangtze Power Company Ltd. owns the Gezhouba Power Station and the Three
Gorges Power Station. The Company generates hydroelectric power, which is
supplied to central China, east China, Guangdong province, Chongqing city, and
other areas.
Latest Fiscal Year: 12/2012
LTM as of: 06/yy
52-Week High (21.05.2013) 7.87
52-Week Low (24.09.2012) 6.13
Daily Volume
6.82
52-Week High % Change -13.34% Dividend Yield -
52-Week Low % Change 11.26% Beta 0.71
% 52 Week Price Range High/Low 33.91% Equity Float 3'514.64
Shares Out 30.06.2013 16'500.0 Short Int -
112'530.00 1 Yr Total Return 11.06%
Total Debt 65'149.32 YTD Return 4.27%
Preferred Stock 0.0 Adjusted BETA 0.705
Minority Interest 7.5 Analyst Recs 12
Cash and Equivalents 1'549.95 Consensus Rating 4.583
Enterprise Value 170'526.89
Average Volume 5 Day 13'804'570
600900 CH EQUITY YTD Change - Average Volume 30 Day 15'903'470
600900 CH EQUITY YTD % CHANGE - Average Volume 3 Month 19'319'120
LTM-4Q LTM FY+1 FY+2 FQ+1 FQ+2
31.12.2008 31.12.2009 31.12.2010 31.12.2011 31.12.2012 06/yy 06/yy 12/13 Y 12/14 Y 09/13 Q3 12/13 Q4
9'205.5 10'820.1 21'536.4 20'362.5 25'292.3 21'284.6 24'965.2 24'674.2 25'418.0 10'898.5 3'851.0
- 21.15x 9.77x 9.27x 7.00x 35.53x 29.03x 6.89x 6.46x - 47.50x
6'972.1 8'652.9 18'557.8 17'369.3 21'470.8 0.0 0.0 19'912.3 20'437.3 - -
- 26.44x 11.34x 10.87x 8.24x 0.00x 0.00x 8.56x 8.34x - -
4'002.9 4'617.3 8'225.1 7'699.9 10'352.0 7'860.2 10'352.8 9'908.3 10'416.7 4'669.5 1'516.0
- 28.47x 15.19x 13.63x 10.95x 14.27x 11.03x 11.35x 10.74x - -
EBITDA 21'470.77 Long-Term Rating Date -
EBIT 15'324.65 Long-Term Rating -
Operating Margin 60.59% Long-Term Outlook -
Pretax Margin 53.68% Short-Term Rating Date -
Return on Assets 6.60% Short-Term Rating -
Return on Common Equity 14.96%
Return on Capital - EBITDA/Interest Exp. 4.68
Asset Turnover 0.16% (EBITDA-Capex)/Interest Exp. 3.79
Net Debt/EBITDA -
Gross Margin 63.0% Total Debt/EBITDA -
EBITDA Margin -
EBIT Margin 59.1% Total Debt/Equity 87.0%
Net Income Margin 40.9% Total Debt/Capital 46.5%
Asset Turnover 0.16
Current Ratio 0.09 Net Fixed Asset Turnover 0.19
Quick Ratio 0.06 Accounts receivable turnover-days 42.97
Debt to Assets 41.97% Inventory Days 14.95
Tot Debt to Common Equity 87.01% Accounts Payable Turnover Day 3.84
Accounts Receivable Turnover 8.49 Cash Conversion Cycle 37.29
Inventory Turnover 24.42
Fiscal Year Ended
China Yangtze Power Co LtdPrice/Volume
Valuation Analysis
27'677'045.00
Current Price (9/dd/yy) Market Data
Net Income
P/E
Market Capitalization
Average Daily Trading Volume
Relative Stock Price Performance
Total Revenue
TEV/Revenue
EBITDA
TEV/EBITDA
Profitability S&P Issuer Ratings
Credit Ratios
Margin Analysis
Reference
Structure
,
-
.
0
1
2
3
4
5
o!-. l!-. k!-. a!-. g!-0 c!-0 j!-0 Q!-0 j!-0 g!-0 g!-0 Q!-0 o!-0', F
-,', F
.,', F
0,', F
1,', F
2,', F
3,', F
4,', F
0.0
5'000.0
10'000.0
15'000.0
20'000.0
25'000.0
30'000.0
2001 2002 2003 2004 2005 2006 2007 2008 2009 2010 2011 2012
,',,
.',,
1',,
3',,
5',,
-,',,
-.',,
-1',,
-3',,
-5',,
.,',,
,-',-'.,-, ,-',4'.,-, ,-',-'.,-- ,-',4'.,-- ,-',-'.,-. ,-',4'.,-. ,-',-'.,-0 ,-',4'.,-0
FReTn/CTrThoT/PolhirTlAlcST/ !Rna /eis FReTn/CTrThoT/PolhirTlAlcST/ !Rna /eis
Q.M.S Advisors | tel: +41 (0)78 922 08 77 | e-mail: [email protected] |
Page 41
09.09.2013
Holder Name Portfolio Name Source Amt Held % Out Latest Chg File Dt Inst Type
CHINA THREE GORGES P n/a EXCH 12'099'532'950 73.33 - 10.04.2013 Government
CHINA NATIONAL NUCLE n/a Co File 261'594'750 1.59 - 31.12.2012 Government
CHINA NATIONAL PETRO n/a Co File 257'559'750 1.56 - 31.12.2012 Government
HUANENG POWER INTERN n/a Co File 257'559'750 1.56 - 31.12.2012 Holding Company
SHANGHAI CHONGYANG I n/a Co File 82'600'000 0.5 - 31.12.2012 Investment Advisor
CHINA PACIFIC LIFE I n/a Co File 80'839'206 0.49 - 31.12.2012 Insurance Company
CHINA MERCHANTS SECU n/a Co File 71'252'261 0.43 - 31.12.2012 Corporation
BLACKROCK ASSET MGMT Multiple Portfolios MF-AGG 69'710'167 0.42 - 30.08.2013 Investment Advisor
HARVEST FUND MANAGEM Multiple Portfolios MF-AGG 62'248'892 0.38 (7'353'359) 31.12.2012 Investment Advisor
THREE GORGES FINANCE n/a Co File 56'400'000 0.34 - 31.12.2012 Investment Advisor
CHINA LIFE INSURANCE n/a ULT-AGG 56'038'661 0.34 - 31.12.2012 Government
GUANGDONG POWER GRID n/a Co File 52'521'975 0.32 - 31.12.2012 Corporation
HUATAI-PINEBRIDGE FU Multiple Portfolios MF-AGG 31'391'614 0.19 28'577 31.12.2012 Investment Advisor
CSOP ASSET MANAGEMEN Multiple Portfolios MF-AGG 28'356'020 0.17 - 02.09.2013 Investment Advisor
GUOTAI ASSET MANAGEM Multiple Portfolios MF-AGG 23'272'928 0.14 12'925'277 31.12.2012 Investment Advisor
CHINA ASSET MANAGEME Multiple Portfolios MF-AGG 22'856'384 0.14 (65'359'473) 31.12.2012 Investment Advisor
ICBC CREDIT SUISSE A Multiple Portfolios MF-AGG 22'657'106 0.14 16'541'343 31.12.2012 Investment Advisor
E FUND MANAGEMENT Multiple Portfolios MF-AGG 16'115'766 0.1 (18'763'723) 31.12.2012 Investment Advisor
HUAAN FUND MANAGEMEN Multiple Portfolios MF-AGG 15'726'555 0.1 (1'613'651) 31.12.2012 Investment Advisor
DACHENG FUND MANAGME Multiple Portfolios MF-AGG 12'995'794 0.08 6'951'032 31.12.2012 Investment Advisor
Firm Name Analyst Recommendation Weighting Change Target Price Date Date
Credit Suisse VINCENT CHAN outperform 5 M 8 Not Provided 02.09.2013
Masterlink Securities LI YAN buy 5 M 8 Not Provided 20.08.2013
Everbright Securities Co., Ltd JUNPENG CHEN buy 5 M 8 12 month 18.08.2013
SWS Research Co Ltd EVAN LIANG outperform 5 M #N/A N/A Not Provided 18.07.2013
Central China Securities PAN HANGJUN add 4 M #N/A N/A Not Provided 27.06.2013
EVA Dimensions DOUG WALTERS underweight 1 M #N/A N/A Not Provided 06.06.2013
Goldman Sachs FRANKLIN CHOW Buy/Neutral 5 M 9 12 month 20.05.2013
Capital Securities Corp LAI SHENSHENG buy 5 M 9 Not Provided 08.05.2013
Rising Securities Co.,LTD DAI LIPING outperform 5 M #N/A N/A Not Provided 23.04.2013
Citic Securities Co., Ltd WU FEI buy 5 M #N/A N/A Not Provided 15.01.2013
UBS YINGZHEN XU buy 5 M 10 12 month 10.01.2013
Bank of China International PETER YAO not rated #N/A N/A M #N/A N/A Not Provided 10.12.2012
Great Wall Securities GUI FANGXIAO buy 5 M #N/A N/A Not Provided 23.10.2012
China Merchants Securities PENG QUANGANG strong buy 5 M 8 6 month 19.07.2012
PingAn Securities FAN WANG buy 5 M #N/A N/A Not Provided 30.11.2011
China Galaxy Securities ZOU XUYUAN buy 5 M 11 12 month 08.01.2010
KGI Securities CHEN JUDITH neutral 3 M 11 12 month 20.05.2009
Holdings By:
China Yangtze Power Co Ltd ee
Q.M.S Advisors | tel: +41 (0)78 922 08 77 | e-mail: [email protected] |
Page 42
09.09.2013
China Everbright Bank Company Limited provides a full range of commercial
banking services including deposit, loan, domestic and international
settlement, currency trading, discount, financial and government bonds,
interbank lending, receipt and payment, insurance, letter of credit, bank
guarantee, deposit box services, and other related services.
Latest Fiscal Year: 12/2012
LTM as of: 06/yy
52-Week High (06.02.2013) 3.80
52-Week Low (25.06.2013) 2.53
Daily Volume
2.96
52-Week High % Change -22.11% Dividend Yield -
52-Week Low % Change 17.00% Beta 0.88
% 52 Week Price Range High/Low 16.54% Equity Float 12'107.88
Shares Out 19.08.2013 40'434.8 Short Int -
119'686.98 1 Yr Total Return 8.53%
Total Debt 677'751.00 YTD Return -1.07%
Preferred Stock 0.0 Adjusted BETA 0.875
Minority Interest 144.0 Analyst Recs 17
Cash and Equivalents 699'202.00 Consensus Rating 3.471
Enterprise Value -
Average Volume 5 Day 88'803'580
601818 CH EQUITY YTD Change - Average Volume 30 Day 72'576'840
601818 CH EQUITY YTD % CHANGE - Average Volume 3 Month 77'447'740
LTM-4Q LTM FY+1 FY+2 FQ+1 FQ+2
31.12.2008 31.12.2009 31.12.2010 31.12.2011 31.12.2012 06/yy 06/yy 12/13 Y 12/14 Y 09/13 Q3 12/13 Q4
45'902.0 42'457.0 59'635.8 84'924.9 114'139.0 100'728.9 124'419.5 68'705.5 79'130.9 16'524.0 17'966.5
- - - - - 0.00x 0.00x - - - -
- - - - - 0.0 0.0 - - - -
- - - - - 0.00x 0.00x - - - -
7'316.0 7'643.0 12'790.2 18'067.9 23'591.0 21'778.0 25'587.5 27'135.8 30'422.9 7'243.0 5'621.5
- - 11.00x 6.40x 5.26x 5.29x 4.55x 4.74x 4.15x 4.29x 4.17x
EBITDA - Long-Term Rating Date -
EBIT - Long-Term Rating NR
Operating Margin 52.14% Long-Term Outlook -
Pretax Margin 52.27% Short-Term Rating Date -
Return on Assets 1.12% Short-Term Rating -
Return on Common Equity 22.11%
Return on Capital 3.43% EBITDA/Interest Exp. -
Asset Turnover 0.05% (EBITDA-Capex)/Interest Exp. -
Net Debt/EBITDA -
Gross Margin - Total Debt/EBITDA -
EBITDA Margin -
EBIT Margin - Total Debt/Equity 593.6%
Net Income Margin 39.0% Total Debt/Capital 85.6%
Asset Turnover 0.05
Current Ratio - Net Fixed Asset Turnover 10.95
Quick Ratio - Accounts receivable turnover-days -
Debt to Assets 29.74% Inventory Days -
Tot Debt to Common Equity 593.59% Accounts Payable Turnover Day -
Accounts Receivable Turnover - Cash Conversion Cycle -
Inventory Turnover -
Fiscal Year Ended
China Everbright Bank Co LtdPrice/Volume
Valuation Analysis
441'947'070.00
Current Price (9/dd/yy) Market Data
Net Income
P/E
Market Capitalization
Average Daily Trading Volume
Relative Stock Price Performance
Total Revenue
TEV/Revenue
EBITDA
TEV/EBITDA
Profitability S&P Issuer Ratings
Credit Ratios
Margin Analysis
Reference
Structure
,
-
-
.
.
0
0
1
1
o!-. l!-. k!-. a!-. g!-0 c!-0 j!-0 Q!-0 j!-0 g!-0 g!-0 Q!-0 o!-0', F
-,,', F
.,,', F
0,,', F
1,,', F
2,,', F
3,,', F
4,,', F
0.0
20'000.0
40'000.0
60'000.0
80'000.0
100'000.0
120'000.0
2001 2002 2003 2004 2005 2006 2007 2008 2009 2010 2011 2012
,',,
.',,
1',,
3',,
5',,
-,',,
-.',,
,-',-'.,-, ,-',4'.,-, ,-',-'.,-- ,-',4'.,-- ,-',-'.,-. ,-',4'.,-. ,-',-'.,-0 ,-',4'.,-0
FReTn/CTrThoT/PolhirTlAlcST/ !Rna /eis FReTn/CTrThoT/PolhirTlAlcST/ !Rna /eis
Q.M.S Advisors | tel: +41 (0)78 922 08 77 | e-mail: [email protected] |
Page 43
09.09.2013
Holder Name Portfolio Name Source Amt Held % Out Latest Chg File Dt Inst Type
CHINA INVESTMENT COR n/a ULT-AGG 19'580'382'099 48.42 22'046'246 14.06.2013 Investment Advisor
CHINA EVERBRIGHT GRO n/a Co File 2'093'991'629 5.18 - 31.12.2012 Corporation
CHINA EVERBRIGHT LTD n/a Co File 1'757'581'229 4.35 - 31.12.2012 Holding Company
CHINA REINSURANCE GR n/a Co File 1'466'875'189 3.63 - 31.12.2012 Government
CHINA POWER FINANCE n/a Co File 799'887'815 1.98 - 31.12.2012 Other
SHENERGY GROUP CO LT n/a Co File 782'333'434 1.93 - 31.12.2012 Government
HONGTA TOBACCO GROUP n/a Co File 549'896'819 1.36 - 31.12.2012 Corporation
SOCIAL SECURITY FUND n/a Co File 543'598'286 1.34 - 31.12.2012 Government
AEROSPACE SCI & TECH n/a Co File 383'404'248 0.95 - 31.12.2012 Government
BAOSTEEL GROUP CORP n/a Co File 368'958'396 0.91 - 31.12.2012 Government
BLACKROCK ASSET MGMT Multiple Portfolios MF-AGG 163'436'442 0.4 - 30.08.2013 Investment Advisor
CHINA ASSET MANAGEME Multiple Portfolios MF-AGG 108'363'210 0.27 (53'843'364) 31.12.2012 Investment Advisor
HARVEST FUND MANAGEM Multiple Portfolios MF-AGG 105'799'323 0.26 (59'750'970) 31.12.2012 Investment Advisor
HUATAI-PINEBRIDGE FU Multiple Portfolios MF-AGG 69'133'258 0.17 13'521'700 30.06.2013 Investment Advisor
CSOP ASSET MANAGEMEN Multiple Portfolios MF-AGG 63'168'100 0.16 - 02.09.2013 Investment Advisor
INVESCO GREAT WALL F Multiple Portfolios MF-AGG 47'216'154 0.12 41'715'500 31.12.2012 Investment Advisor
CHANGSHENG FUND MANA Multiple Portfolios MF-AGG 43'633'617 0.11 40'291'466 31.12.2012 Investment Advisor
YINHUA FUND MANAGEME Multiple Portfolios MF-AGG 34'921'356 0.09 (53'932'971) 31.12.2012 Investment Advisor
FULLGOAL FUND MANAGE Multiple Portfolios MF-AGG 34'321'700 0.08 32'380'300 31.12.2012 Investment Advisor
CHINA ASSET MANAGEME Multiple Portfolios MF-AGG 32'227'757 0.08 - 02.09.2013 Investment Advisor
Firm Name Analyst Recommendation Weighting Change Target Price Date Date
PingAn Securities GRACE LI buy 5 M #N/A N/A Not Provided 03.09.2013
Masterlink Securities RAINY YUAN hold 3 M 3 6 month 28.08.2013
Capital Securities Corp XIE JIYONG hold 3 M 5 Not Provided 27.08.2013
Northeast Securities Co Ltd YAYUN TANG neutral 3 M #N/A N/A Not Provided 27.08.2013
Guotai Junan GUANHUA QIU neutral 3 M 3 Not Provided 20.08.2013
Chang Jiang Securities Co. Limited LIU JUN neutral 3 M #N/A N/A Not Provided 18.08.2013
SWS Research Co Ltd BECKY XU outperform 5 M #N/A N/A Not Provided 19.07.2013
Standard Chartered DORRIS CHEN in-line 3 M 3 12 month 16.07.2013
GF Securities Co. Ltd. Mu Hua hold 3 N #N/A N/A Not Provided 19.06.2013
EVA Dimensions DOUG WALTERS buy 5 M #N/A N/A Not Provided 06.06.2013
Everbright Securities Co., Ltd SHEN WEI accumulate 4 M 4 12 month 02.06.2013
Deutsche Bank TRACY YU hold 3 M 3 12 month 12.04.2013
Founder Securities WEI ZHOU add 4 N #N/A N/A Not Provided 08.03.2013
Hong Yuan Securities ZHANG JIXIU add 4 M 3 6 month 31.01.2013
Sinolink Securities Co Ltd JIANGANG CHEN neutral 3 N #N/A N/A Not Provided 29.10.2012
Central China Securities CHEN XI add 4 N #N/A N/A Not Provided 29.10.2012
Goldman Sachs NING MA Sell/Neutral 1 D 3 12 month 11.10.2012
China Merchants Securities LUO YI buy 5 M #N/A N/A Not Provided 23.07.2012
Citic Securities Co., Ltd ZHU YAN overweight 5 M #N/A N/A Not Provided 29.06.2012
China Securities Co., Ltd #N/A N/A add 4 M 4 Not Provided 25.06.2012
Industrial Securities YIDONG ZHANG buy 5 M #N/A N/A Not Provided 26.04.2012
AJ Securities ZHANG ZHIPENG buy 5 M 3 6 month 01.02.2012
Rising Securities Co.,LTD XIE AIHONG neutral 3 M #N/A N/A Not Provided 20.12.2011
BOCOM International Holdings LI SHANSHAN long-term buy 5 M #N/A N/A Not Provided 07.11.2011
Guodu Securities Co Ltd DENG TING buy 5 U #N/A N/A Not Provided 12.08.2011
Bank of China International YUAN LIN hold 3 D 4 Not Provided 12.04.2011
Holdings By:
China Everbright Bank Co Ltd ee
Q.M.S Advisors | tel: +41 (0)78 922 08 77 | e-mail: [email protected] |
Page 44
09.09.2013
CITIC Securities Co., Ltd. provides securities brokerage, trading, underwriting,
investment banking, asset management, and investment consulting services.
Latest Fiscal Year: 12/2012
LTM as of: 06/yy
52-Week High (04.02.2013) 15.97
52-Week Low (25.06.2013) 9.29
Daily Volume
11.85
52-Week High % Change -25.80% Dividend Yield -
52-Week Low % Change 27.56% Beta 1.54
% 52 Week Price Range High/Low 26.65% Equity Float 7'279.19
Shares Out 31.03.2013 9'838.6 Short Int -
131'412.30 1 Yr Total Return 6.11%
Total Debt 75'060.24 YTD Return -8.82%
Preferred Stock 0.0 Adjusted BETA 1.542
Minority Interest 219.3 Analyst Recs 20
Cash and Equivalents 25'835.77 Consensus Rating 4.300
Enterprise Value 121'617.84
Average Volume 5 Day 64'964'660
600030 CH EQUITY YTD Change - Average Volume 30 Day 87'542'340
600030 CH EQUITY YTD % CHANGE - Average Volume 3 Month 90'058'480
LTM-4Q LTM FY+1 FY+2 FQ+1 FQ+2
31.12.2008 31.12.2009 31.12.2010 31.12.2011 31.12.2012 06/yy 06/yy 12/13 Y 12/14 Y 09/13 Q3 12/13 Q4
19'123.6 24'178.0 24'527.0 11'775.9 13'041.2 23'700.7 14'832.9 15'161.7 19'440.9 - -
8.38x 12.44x 7.01x 10.79x 15.30x 13.52x 29.43x 4.20x 3.14x - -
11'377.6 14'125.4 11'609.5 2'496.3 6'421.6 0.0 0.0 5'587.0 7'539.0 - -
14.08x 21.29x 14.81x 50.88x 31.06x 0.00x 0.00x 21.77x 16.13x - -
7'305.0 8'984.0 11'311.3 12'576.5 4'237.4 11'851.8 4'098.3 5'360.4 6'920.6 - -
16.31x 23.45x 11.04x 7.89x 35.16x 11.64x 27.19x 24.95x 18.96x - -
EBITDA 6'421.63 Long-Term Rating Date 18.10.2012
EBIT - Long-Term Rating BBB+
Operating Margin 41.78% Long-Term Outlook STABLE
Pretax Margin 42.08% Short-Term Rating Date 18.10.2012
Return on Assets 2.35% Short-Term Rating A-2
Return on Common Equity 4.86%
Return on Capital 3.62% EBITDA/Interest Exp. -
Asset Turnover 0.09% (EBITDA-Capex)/Interest Exp. -
Net Debt/EBITDA -
Gross Margin - Total Debt/EBITDA -
EBITDA Margin -
EBIT Margin - Total Debt/Equity 86.8%
Net Income Margin 32.5% Total Debt/Capital 46.4%
Asset Turnover 0.09
Current Ratio - Net Fixed Asset Turnover 4.58
Quick Ratio - Accounts receivable turnover-days -
Debt to Assets 44.54% Inventory Days -
Tot Debt to Common Equity 86.81% Accounts Payable Turnover Day -
Accounts Receivable Turnover - Cash Conversion Cycle -
Inventory Turnover -
Profitability S&P Issuer Ratings
Credit Ratios
Margin Analysis
Reference
Structure
Net Income
P/E
Market Capitalization
Average Daily Trading Volume
Relative Stock Price Performance
Total Revenue
TEV/Revenue
EBITDA
TEV/EBITDA
Fiscal Year Ended
CITIC Securities Co LtdPrice/Volume
Valuation Analysis
264'873'010.00
Current Price (9/dd/yy) Market Data
,.135
-,-.-1-3-5
o!-. l!-. k!-. a!-. g!-0 c!-0 j!-0 Q!-0 j!-0 g!-0 g!-0 Q!-0 o!-0', F
2,', F
-,,', F
-2,', F
.,,', F
.2,', F
0,,', F
0.0
5'000.0
10'000.0
15'000.0
20'000.0
25'000.0
30'000.0
35'000.0
2001 2002 2003 2004 2005 2006 2007 2008 2009 2010 2011 2012
,',,
.',,
1',,
3',,
5',,
-,',,
-.',,
-1',,
,-',-'.,-, ,-',4'.,-, ,-',-'.,-- ,-',4'.,-- ,-',-'.,-. ,-',4'.,-. ,-',-'.,-0 ,-',4'.,-0
FReTn/CTrThoT/PolhirTlAlcST/ !Rna /eis FReTn/CTrThoT/PolhirTlAlcST/ !Rna /eis
Q.M.S Advisors | tel: +41 (0)78 922 08 77 | e-mail: [email protected] |
Page 45
09.09.2013
Holder Name Portfolio Name Source Amt Held % Out Latest Chg File Dt Inst Type
CITIC GROUP n/a ULT-AGG 2'303'963'550 23.42 - 25.02.2013 Government
CHINA LIFE INSURANCE n/a ULT-AGG 592'201'934 6.02 - 31.12.2012 Government
BLACKROCK ASSET MGMT Multiple Portfolios MF-AGG 137'116'998 1.39 - 30.08.2013 Investment Advisor
BOSHI FUND MANAGEMEN Multiple Portfolios MF-AGG 127'927'843 1.3 82'234'470 30.06.2013 Investment Advisor
CHINA ACADEMY OF LAU n/a Co File 106'478'308 1.08 - 31.12.2012 Corporation
YINHUA FUND MANAGEME Multiple Portfolios MF-AGG 94'039'153 0.96 (26'958'954) 30.06.2013 Investment Advisor
HARVEST FUND MANAGEM Multiple Portfolios MF-AGG 91'483'569 0.93 (38'464'950) 31.12.2012 Investment Advisor
CHINA SOUTHERN FUND Multiple Portfolios MF-AGG 73'149'583 0.74 31'271'828 30.06.2013 Investment Advisor
NANJING XINGANG HIGH n/a Co File 71'223'634 0.72 - 31.12.2012 Holding Company
DACHENG FUND MANAGME Multiple Portfolios MF-AGG 70'230'811 0.71 10'105'797 31.12.2012 Investment Advisor
E FUND MANAGEMENT Multiple Portfolios MF-AGG 68'607'829 0.7 20'846'117 31.12.2012 Investment Advisor
EVERBRIGHT SECURITIE n/a Co File 66'737'803 0.68 - 31.12.2012 Unclassified
CITIC GUOAN GROUP n/a Co File 63'739'930 0.65 - 31.12.2012 Government
NEW TIMES TRUST CO L n/a Co File 58'000'000 0.59 - 31.12.2012 Other
CSOP ASSET MANAGEMEN Multiple Portfolios MF-AGG 54'550'984 0.55 - 02.09.2013 Investment Advisor
RONGTONG FUND MANAGE Multiple Portfolios MF-AGG 48'634'288 0.49 8'798'611 30.06.2013 Investment Advisor
LION FUND MANAGEMENT Multiple Portfolios MF-AGG 42'852'898 0.44 (582'826) 31.12.2012 Investment Advisor
HUATAI-PINEBRIDGE FU Multiple Portfolios MF-AGG 41'269'162 0.42 (27'799'044) 30.06.2013 Investment Advisor
HFT INVESTMENT MANAG Multiple Portfolios MF-AGG 39'450'653 0.4 (24'948'494) 31.12.2012 Investment Advisor
CHANGSHENG FUND MANA Multiple Portfolios MF-AGG 37'281'556 0.38 20'660'472 30.06.2013 Investment Advisor
Firm Name Analyst Recommendation Weighting Change Target Price Date Date
Northeast Securities Co Ltd XINAN ZHAO add 4 M #N/A N/A Not Provided 02.09.2013
Chang Jiang Securities Co. Limited LIU JUN add 4 M #N/A N/A Not Provided 02.09.2013
Credit Suisse FRANCES FENG neutral 3 M 12 Not Provided 30.08.2013
GF Securities Co. Ltd. CONG LI buy 5 M #N/A N/A Not Provided 30.08.2013
Sinolink Securities Co Ltd WANG KUN buy 5 M #N/A N/A Not Provided 30.08.2013
China International Capital Corp JIE HUANG buy 5 M #N/A N/A Not Provided 30.08.2013
Guotai Junan ZHAO XIANGHUAI buy 5 M 13 12 month 30.08.2013
Everbright Securities Co., Ltd ZIPEI TANG buy 5 M 15 12 month 06.08.2013
China Minzu Securities Co Ltd SONG JIAN add 4 D 15 6 month 23.07.2013
Bank of China International ZHANG JIAN buy 5 M 38 Not Provided 22.07.2013
SWS Research Co Ltd HE ZONGYAN outperform 5 M #N/A N/A Not Provided 22.07.2013
PingAn Securities WU JIE buy 5 M #N/A N/A Not Provided 28.06.2013
Goldman Sachs NING MA Buy/Neutral 5 M 14 12 month 24.06.2013
HSBC YORK PUN neutral 3 D 13 Not Provided 24.06.2013
Guodu Securities Co Ltd DENG TING buy 5 M #N/A N/A Not Provided 21.06.2013
EVA Dimensions DOUG WALTERS sell 1 M #N/A N/A Not Provided 06.06.2013
Deutsche Bank TRACY YU not rated #N/A N/A M #N/A N/A Not Provided 12.04.2013
JPMorgan JOSHUA KLACZEK neutral 3 M 12 3 month 31.01.2013
Capital Securities Corp TEAM COVERAGE buy 5 M #N/A N/A Not Provided 24.01.2013
Central China Securities XIE PEIJIE add 4 M #N/A N/A Not Provided 06.12.2012
Hong Yuan Securities HUANG LIJUN buy 5 M #N/A N/A Not Provided 30.11.2012
China Merchants Securities HONG JINPING strong buy 5 M 15 6 month 23.07.2012
Industrial Securities ZHANG YING buy 5 M #N/A N/A Not Provided 30.03.2012
Tebon Securities Co Ltd TEAM COVERAGE outperform 5 N 14 6 month 21.08.2011
China Securities Co., Ltd WEI TAO add 4 M 22 Not Provided 08.12.2010
China Investment Securities CHEN JIANTAO neutral 3 M #N/A N/A Not Provided 07.06.2010
China Galaxy Securities XIAOHUI CHI buy 5 U 26 12 month 30.06.2009
Holdings By:
CITIC Securities Co Ltd ee
Q.M.S Advisors | tel: +41 (0)78 922 08 77 | e-mail: [email protected] |
Page 46
09.09.2013
China Pacific Insurance (Group) Company, Ltd. is an integrated insurance
services provider. The Company offers life and property insurance products
through its subsidiaries.
Latest Fiscal Year: 12/2012
LTM as of: 06/yy
52-Week High (04.02.2013) 23.88
52-Week Low (25.06.2013) 15.01
Daily Volume
18.53
52-Week High % Change -22.40% Dividend Yield 1.89
52-Week Low % Change 23.45% Beta 1.31
% 52 Week Price Range High/Low 29.43% Equity Float 2'370.12
Shares Out 30.06.2013 6'286.7 Short Int -
180'347.11 1 Yr Total Return -9.00%
Total Debt 65'722.00 YTD Return -15.87%
Preferred Stock 0.0 Adjusted BETA 1.313
Minority Interest 1'392.0 Analyst Recs 19
Cash and Equivalents 23'875.00 Consensus Rating 4.737
Enterprise Value 84'480.11
Average Volume 5 Day 19'399'840
601601 CH EQUITY YTD Change - Average Volume 30 Day 17'104'680
601601 CH EQUITY YTD % CHANGE - Average Volume 3 Month 19'271'300
LTM-4Q LTM FY+1 FY+2 FQ+1 FQ+2
31.12.2008 31.12.2009 31.12.2010 31.12.2011 31.12.2012 06/yy 06/yy 12/13 Y 12/14 Y 09/13 Q3 12/13 Q4
76'135.0 104'175.0 141'127.0 155'446.0 167'146.0 164'384.0 184'010.0 189'243.0 212'691.7 - -
1.03x 1.92x 1.45x 1.21x 1.49x 2.15x 1.59x 0.97x 0.86x - -
- - - - - 0.0 0.0 - - - -
- - - - - 0.00x 0.00x - - - -
2'569.0 7'356.0 8'557.0 8'313.0 5'077.0 5'135.0 7'903.0 8'923.4 11'250.3 1'300.0 2'300.0
33.70x 26.97x 22.90x 19.80x 38.14x 37.15x 18.05x 19.34x 15.96x - -
EBITDA - Long-Term Rating Date -
EBIT - Long-Term Rating -
Operating Margin 5.01% Long-Term Outlook -
Pretax Margin 3.66% Short-Term Rating Date -
Return on Assets 0.81% Short-Term Rating -
Return on Common Equity 5.87%
Return on Capital 5.01% EBITDA/Interest Exp. -
Asset Turnover 0.27% (EBITDA-Capex)/Interest Exp. -
Net Debt/EBITDA -
Gross Margin - Total Debt/EBITDA -
EBITDA Margin -
EBIT Margin - Total Debt/Equity 68.3%
Net Income Margin 3.0% Total Debt/Capital 40.2%
Asset Turnover 0.27
Current Ratio - Net Fixed Asset Turnover -
Quick Ratio - Accounts receivable turnover-days -
Debt to Assets 9.64% Inventory Days -
Tot Debt to Common Equity 68.33% Accounts Payable Turnover Day -
Accounts Receivable Turnover - Cash Conversion Cycle -
Inventory Turnover -
Fiscal Year Ended
China Pacific Insurance Group Co LtdPrice/Volume
Valuation Analysis
60'660'673.00
Current Price (9/dd/yy) Market Data
Net Income
P/E
Market Capitalization
Average Daily Trading Volume
Relative Stock Price Performance
Total Revenue
TEV/Revenue
EBITDA
TEV/EBITDA
Profitability S&P Issuer Ratings
Credit Ratios
Margin Analysis
Reference
Structure
,
2
-,
-2
.,
.2
o!-. l!-. k!-. a!-. g!-0 c!-0 j!-0 Q!-0 j!-0 g!-0 g!-0 Q!-0 o!-0', F
-,', F
.,', F
0,', F
1,', F
2,', F
3,', F
4,', F
5,', F
0.0
20'000.0
40'000.0
60'000.0
80'000.0
100'000.0
120'000.0
140'000.0
160'000.0
180'000.0
2001 2002 2003 2004 2005 2006 2007 2008 2009 2010 2011 2012
,',,
,'2,
-',,
-'2,
.',,
.'2,
0',,
0'2,
1',,
1'2,
,-',-'.,-, ,-',4'.,-, ,-',-'.,-- ,-',4'.,-- ,-',-'.,-. ,-',4'.,-. ,-',-'.,-0 ,-',4'.,-0
FReTn/CTrThoT/PolhirTlAlcST/ !Rna /eis FReTn/CTrThoT/PolhirTlAlcST/ !Rna /eis
Q.M.S Advisors | tel: +41 (0)78 922 08 77 | e-mail: [email protected] |
Page 47
09.09.2013
Holder Name Portfolio Name Source Amt Held % Out Latest Chg File Dt Inst Type
FORTUNE INV CO LTD n/a Co File 1'284'277'846 20.43 - 31.12.2012 Government
SHENERGY GROUP CO LT n/a Co File 1'235'291'781 19.65 - 31.12.2012 Government
SHANGHAI TOBACCO GRO n/a Co File 468'828'104 7.46 - 31.12.2012 Corporation
SHANGHAI STATE OWNED n/a Co File 424'099'214 6.75 - 31.12.2012 Investment Advisor
SHANGHAI JIUSHI CORP n/a Co File 250'949'460 3.99 - 31.12.2012 Holding Company
NORGES BANK Multiple Portfolios MF-AGG 242'413'639 3.86 - 31.12.2012 Government
YUNNAN HONGTA GROUP n/a Co File 174'339'390 2.77 - 31.12.2012 Corporation
BOSHI FUND MANAGEMEN Multiple Portfolios MF-AGG 138'099'859 2.2 72'702'483 30.06.2013 Investment Advisor
SOCIAL SECURITY FUND n/a Co File 78'412'727 1.25 - 31.12.2012 Government
E FUND MANAGEMENT Multiple Portfolios MF-AGG 61'159'439 0.97 2'261'689 31.12.2012 Investment Advisor
DACHENG FUND MANAGME Multiple Portfolios MF-AGG 61'031'021 0.97 21'433'631 31.12.2012 Investment Advisor
BLACKROCK ASSET MGMT Multiple Portfolios MF-AGG 50'466'857 0.8 - 30.08.2013 Investment Advisor
CHINA ASSET MANAGEME Multiple Portfolios MF-AGG 46'450'978 0.74 (7'400'869) 31.12.2012 Investment Advisor
EVERBRIGHT PRAMERICA Multiple Portfolios MF-AGG 38'076'481 0.61 7'959'643 30.06.2013 Investment Advisor
HARVEST FUND MANAGEM Multiple Portfolios MF-AGG 34'475'142 0.55 (48'034'505) 31.12.2012 Investment Advisor
SCHRODER INVESTMENT SCHRODER ISF-BRIC (B MF-PART 26'451'186 0.42 26'451'186 31.07.2013 Investment Advisor
AEGON INDUSTRIAL FUN Multiple Portfolios MF-AGG 24'640'399 0.39 3'368'857 31.12.2012 Investment Advisor
YINHUA FUND MANAGEME Multiple Portfolios MF-AGG 22'402'265 0.36 (10'235'169) 31.12.2012 Investment Advisor
GREAT WALL FUND MANA Multiple Portfolios MF-AGG 19'909'247 0.32 3'910'047 30.06.2013 Investment Advisor
CSOP ASSET MANAGEMEN Multiple Portfolios MF-AGG 19'679'050 0.31 - 02.09.2013 Investment Advisor
Firm Name Analyst Recommendation Weighting Change Target Price Date Date
Chang Jiang Securities Co. Limited LIU JUN add 4 M #N/A N/A Not Provided 02.09.2013
Guotai Junan PENG YULONG buy 5 M 22 12 month 01.09.2013
Northeast Securities Co Ltd XINAN ZHAO add 4 M #N/A N/A Not Provided 27.08.2013
Credit Suisse ARJAN VAN VEEN outperform 5 M 30 Not Provided 26.08.2013
GF Securities Co. Ltd. CONG LI buy 5 M #N/A N/A Not Provided 26.08.2013
China International Capital Corp TANG SHENGBO accumulate 4 M 19 Not Provided 26.08.2013
JPMorgan MW KIM overweight 5 M 23 12 month 25.08.2013
Capital Securities Corp XIE JIYONG strong buy 5 M 23 Not Provided 13.08.2013
Everbright Securities Co., Ltd ZIPEI TANG buy 5 M #N/A N/A Not Provided 05.08.2013
SWS Research Co Ltd TINA SUN outperform 5 D #N/A N/A Not Provided 24.07.2013
UBS JANET SUN buy 5 M 24 12 month 17.07.2013
HSBC JAMES GARNER overweight 5 M 26 Not Provided 07.07.2013
Goldman Sachs MANCY SUN Buy/Neutral 5 U 26 12 month 16.05.2013
Sinolink Securities Co Ltd JIANGANG CHEN add 4 M 22 Not Provided 26.04.2013
Guodu Securities Co Ltd DENG TING buy 5 M 25 6 month 16.04.2013
HuaChuang Securities GAO LI buy 5 M 25 6 month 12.12.2012
Bank of China International SUN PENG buy 5 M 23 Not Provided 06.12.2012
Hong Yuan Securities HUANG LIJUN add 4 M #N/A N/A Not Provided 27.11.2012
PingAn Securities LUO QI buy 5 M #N/A N/A Not Provided 29.10.2012
Great Wall Securities BIAO HUANG strong buy 5 M #N/A N/A Not Provided 21.08.2012
China Merchants Securities LUO YI strong buy 5 M 28 6 month 26.07.2012
Citic Securities Co., Ltd PAN HONGWEN buy 5 M 26 6 month 24.07.2012
China Securities Co., Ltd JIAO WENCHAO buy 5 M 30 Not Provided 25.06.2012
Masterlink Securities LI YAN buy 5 M 26 Not Provided 07.06.2012
Industrial Securities ZHANG YING buy 5 M #N/A N/A Not Provided 29.03.2012
China Minzu Securities Co Ltd SONG JIAN add 4 M 30 6 month 01.03.2012
China Galaxy Securities XU LIPING buy 5 M 33 12 month 29.06.2010
China Investment Securities XU SHOUDE neutral 3 M #N/A N/A Not Provided 30.06.2009
Holdings By:
China Pacific Insurance Group Co Ltd ee
Q.M.S Advisors | tel: +41 (0)78 922 08 77 | e-mail: [email protected] |
Page 48
09.09.2013
Daqin Railway Co., Ltd. mainly provides coal transportation service in Northern
China. It also operates passenger transportation business.
Latest Fiscal Year: 12/2012
LTM as of: 06/yy
52-Week High (04.03.2013) 8.26
52-Week Low (25.06.2013) 5.41
Daily Volume
7.33
52-Week High % Change -11.26% Dividend Yield -
52-Week Low % Change 35.49% Beta 0.73
% 52 Week Price Range High/Low 69.47% Equity Float 5'013.89
Shares Out 30.06.2013 14'866.8 Short Int -
108'973.58 1 Yr Total Return 27.44%
Total Debt 16'459.58 YTD Return 14.81%
Preferred Stock 0.0 Adjusted BETA 0.731
Minority Interest 158.4 Analyst Recs 21
Cash and Equivalents 7'753.98 Consensus Rating 4.762
Enterprise Value 117'598.81
Average Volume 5 Day 39'460'940
601006 CH EQUITY YTD Change - Average Volume 30 Day 38'888'840
601006 CH EQUITY YTD % CHANGE - Average Volume 3 Month 34'559'680
LTM-4Q LTM FY+1 FY+2 FQ+1 FQ+2
31.12.2008 31.12.2009 31.12.2010 31.12.2011 31.12.2012 06/yy 06/yy 12/13 Y 12/14 Y 09/13 Q3 12/13 Q4
21'852.0 32'090.3 40'643.5 43'497.0 44'604.1 43'962.6 46'614.2 48'859.5 51'951.2 11'889.0 13'226.0
3.25x 2.84x 2.45x 10.95x 9.14x 2.39x 2.05x - -
11'630.8 13'896.8 18'332.3 18'765.2 18'091.3 0.0 0.0 19'875.3 20'870.1 - -
7.20x 6.59x 6.05x 0.00x 0.00x 5.92x 5.63x - -
6'679.5 7'146.7 10'410.8 11'698.6 11'502.6 11'579.1 11'917.5 12'805.7 13'956.1 3'192.0 3'314.0
10.02x 9.44x 8.78x 9.06x 7.41x 8.55x 7.85x - -
EBITDA 18'091.28 Long-Term Rating Date -
EBIT 13'581.39 Long-Term Rating -
Operating Margin 30.45% Long-Term Outlook -
Pretax Margin 32.96% Short-Term Rating Date -
Return on Assets 12.15% Short-Term Rating -
Return on Common Equity 17.79%
Return on Capital - EBITDA/Interest Exp. 21.00
Asset Turnover 0.48% (EBITDA-Capex)/Interest Exp. 16.42
Net Debt/EBITDA -
Gross Margin 36.5% Total Debt/EBITDA -
EBITDA Margin -
EBIT Margin 29.3% Total Debt/Equity 23.5%
Net Income Margin 25.8% Total Debt/Capital 19.0%
Asset Turnover 0.48
Current Ratio 0.83 Net Fixed Asset Turnover 0.67
Quick Ratio 0.60 Accounts receivable turnover-days 15.03
Debt to Assets 16.40% Inventory Days 19.00
Tot Debt to Common Equity 23.45% Accounts Payable Turnover Day 41.33
Accounts Receivable Turnover 24.29 Cash Conversion Cycle -15.08
Inventory Turnover 19.21
Profitability S&P Issuer Ratings
Credit Ratios
Margin Analysis
Reference
Structure
Net Income
P/E
Market Capitalization
Average Daily Trading Volume
Relative Stock Price Performance
Total Revenue
TEV/Revenue
EBITDA
TEV/EBITDA
Fiscal Year Ended
Daqin Railway Co LtdPrice/Volume
Valuation Analysis
52'695'644.00
Current Price (9/dd/yy) Market Data
,-.0123456
o!-. l!-. k!-. a!-. g!-0 c!-0 j!-0 Q!-0 j!-0 g!-0 g!-0 Q!-0 o!-0', F.,', F1,', F3,', F5,', F-,,', F-.,', F-1,', F-3,', F-5,', F.,,', F
0.0
5'000.0
10'000.0
15'000.0
20'000.0
25'000.0
30'000.0
35'000.0
40'000.0
45'000.0
50'000.0
2001 2002 2003 2004 2005 2006 2007 2008 2009 2010 2011 2012
,',,
.',,
1',,
3',,
5',,
-,',,
-.',,
-1',,
-3',,
-5',,
,-',-'.,-, ,-',4'.,-, ,-',-'.,-- ,-',4'.,-- ,-',-'.,-. ,-',4'.,-. ,-',-'.,-0 ,-',4'.,-0
FReTn/CTrThoT/PolhirTlAlcST/ !Rna /eis FReTn/CTrThoT/PolhirTlAlcST/ !Rna /eis
Q.M.S Advisors | tel: +41 (0)78 922 08 77 | e-mail: [email protected] |
Page 49
09.09.2013
Holder Name Portfolio Name Source Amt Held % Out Latest Chg File Dt Inst Type
TAIYUAN RAILWAY ADMI n/a Co File 9'172'093'536 61.7 - 31.12.2012 Government
CHINA PACIFIC LIFE I n/a Co File 407'750'040 2.74 - 31.12.2012 Insurance Company
SOCIAL SECURITY FUND n/a Co File 303'076'719 2.04 - 31.12.2012 Government
CHINA SOUTHERN FUND Multiple Portfolios MF-AGG 177'463'105 1.19 53'017'394 30.06.2013 Investment Advisor
HEIBEI PORT GROUP CO n/a Co File 158'702'841 1.07 - 31.12.2012 Corporation
CHINA NATIONAL COAL n/a Co File 139'308'018 0.94 - 31.12.2012 Government
HARVEST FUND MANAGEM Multiple Portfolios MF-AGG 124'292'911 0.84 (77'313'943) 31.12.2012 Investment Advisor
BLACKROCK ASSET MGMT Multiple Portfolios MF-AGG 118'895'847 0.8 - 30.08.2013 Investment Advisor
PENGHUA FUND MANAGEM Multiple Portfolios MF-AGG 97'004'588 0.65 27'787'915 30.06.2013 Investment Advisor
GUOTAI JUNAN SECURIT n/a Co File 86'322'980 0.58 - 31.12.2012 Investment Advisor
CHINA RAILWAY CONS I n/a Co File 79'719'060 0.54 - 31.12.2012 Government
CHINA ASSET MANAGEME Multiple Portfolios MF-AGG 73'290'090 0.49 (46'832'537) 31.12.2012 Investment Advisor
E FUND MANAGEMENT Multiple Portfolios MF-AGG 51'668'717 0.35 18'881'214 31.12.2012 Investment Advisor
CSOP ASSET MANAGEMEN Multiple Portfolios MF-AGG 46'210'901 0.31 - 02.09.2013 Investment Advisor
BOSERA FUND MANAGEME Multiple Portfolios MF-AGG 43'926'925 0.3 134'202 30.06.2013 Investment Advisor
HUATAI-PINEBRIDGE FU Multiple Portfolios MF-AGG 40'987'998 0.28 13'719'675 30.06.2013 Investment Advisor
AEGON INDUSTRIAL FUN Multiple Portfolios MF-AGG 38'173'963 0.26 28'191'597 30.06.2013 Investment Advisor
BOSHI FUND MANAGEMEN Multiple Portfolios MF-AGG 38'144'208 0.26 (21'054'726) 31.12.2012 Investment Advisor
YINHUA FUND MANAGEME Multiple Portfolios MF-AGG 36'210'714 0.24 (30'291'063) 31.12.2012 Investment Advisor
FRANKLIN TEMPLETON S Multiple Portfolios MF-AGG 28'003'445 0.19 2'268'511 30.06.2013 Investment Advisor
Firm Name Analyst Recommendation Weighting Change Target Price Date Date
Northeast Securities Co Ltd XIANG XU add 4 M #N/A N/A Not Provided 03.09.2013
China International Capital Corp REN ZHONG buy 5 M 8 12 month 31.08.2013
Capital Securities Corp LI XIAOLU buy 5 M 8 Not Provided 30.08.2013
SWS Research Co Ltd JINGDONG DENG buy 5 M #N/A N/A Not Provided 30.08.2013
Fortune CLSA Securities Limited JIE LI buy 5 M 10 12 month 30.08.2013
Morgan Stanley EDWARD XU Overwt/Attractive 5 M 9 12 month 29.08.2013
Guotai Junan CUI SHUTIAN buy 5 M 9 12 month 29.08.2013
Chang Jiang Securities Co. Limited HAN YICHAO buy 5 M #N/A N/A Not Provided 28.08.2013
EVA Dimensions TIMOTHY STANISH hold 3 D #N/A N/A Not Provided 16.08.2013
Hong Yuan Securities QU YONGZHONG buy 5 M 13 6 month 24.07.2013
Standard Chartered CLAIRE TENG outperform 5 M 9 12 month 09.07.2013
Goldman Sachs RONALD KEUNG Buy/Neutral 5 M 9 12 month 02.07.2013
Credit Suisse VINCENT CHAN outperform 5 N 12 Not Provided 18.06.2013
China Minzu Securities Co Ltd WANG XIAOYAN add 4 M 9 6 month 07.06.2013
Qilu Securities Co Ltd ZHOU LI buy 5 N 9 12 month 24.03.2013
Rising Securities Co.,LTD XUE MINGJIE outperform 5 M #N/A N/A Not Provided 21.03.2013
UBS RICHARD WEI buy 5 M 11 12 month 05.03.2013
HuaChuang Securities CHEN JUAN buy 5 M #N/A N/A Not Provided 20.02.2013
Bank of China International DU JIANPING buy 5 M 8 12 month 25.01.2013
Founder Securities WANG TAO add 4 N #N/A N/A Not Provided 30.10.2012
Everbright Securities Co., Ltd DING XIANDA accumulate 4 N 7 6 month 28.08.2012
China Securities Co., Ltd LI LEI add 4 M 9 Not Provided 25.06.2012
China Merchants Securities TAO CHANG strong buy 5 N #N/A N/A Not Provided 10.06.2012
Citic Securities Co., Ltd ZHANG HONGBO buy 5 M #N/A N/A Not Provided 02.05.2012
Industrial Securities ZENG XU strong buy 5 M #N/A N/A Not Provided 26.04.2012
PingAn Securities CHU HAI buy 5 M 16 6 month 11.03.2012
China Investment Securities OUYANG JUN strong buy 5 M #N/A N/A Not Provided 07.01.2011
China Galaxy Securities MAO ANG buy 5 M #N/A N/A Not Provided 27.05.2010
Holdings By:
Daqin Railway Co Ltd ee
Q.M.S Advisors | tel: +41 (0)78 922 08 77 | e-mail: [email protected] |
Page 50
09.09.2013
Shanghai International Port (Group) Co., Ltd is a holding company that owns
interests in container and port service companies.
Latest Fiscal Year: 12/2012
LTM as of: 06/yy
52-Week High (09.09.2013) 6.62
52-Week Low (25.06.2013) 2.33
Daily Volume
6.62
52-Week High % Change 0.00% Dividend Yield -
52-Week Low % Change 184.12% Beta 1.11
% 52 Week Price Range High/Low 100.00% Equity Float 7'663.14
Shares Out 30.06.2013 22'755.2 Short Int -
150'639.30 1 Yr Total Return 175.63%
Total Debt 21'196.55 YTD Return 165.15%
Preferred Stock 0.0 Adjusted BETA 1.113
Minority Interest 5'852.9 Analyst Recs 12
Cash and Equivalents 8'977.05 Consensus Rating 4.000
Enterprise Value 169'169.57
Average Volume 5 Day #########
600018 CH EQUITY YTD Change - Average Volume 30 Day 97'135'630
600018 CH EQUITY YTD % CHANGE - Average Volume 3 Month 49'880'820
LTM-4Q LTM FY+1 FY+2 FQ+1 FQ+2
31.12.2008 31.12.2009 31.12.2010 31.12.2011 31.12.2012 06/yy 06/yy 12/13 Y 12/14 Y 09/13 Q3 12/13 Q4
17'486.3 16'046.0 18'768.9 21'414.9 28'151.3 24'552.4 28'264.4 30'875.6 33'597.8 9'458.0 8'427.0
4.50x 8.38x 4.91x 3.50x 2.77x 12.84x 7.93x 5.47x 4.99x - 20.16x
8'109.5 6'782.7 8'660.0 10'176.7 9'455.7 0.0 0.0 8'839.0 9'174.5 2'995.0 2'137.0
9.70x 19.82x 10.64x 7.37x 8.24x 0.00x 0.00x 19.14x 18.44x 16.95x 16.74x
4'619.3 3'760.0 5'417.1 4'724.2 4'969.3 4'487.2 5'266.5 5'300.4 5'846.0 1'395.0 1'678.0
15.04x 32.38x 14.76x 12.15x 12.04x 13.50x 10.73x 28.17x 25.66x 27.58x 28.05x
EBITDA 9'455.73 Long-Term Rating Date -
EBIT 6'638.21 Long-Term Rating -
Operating Margin 23.58% Long-Term Outlook -
Pretax Margin 25.53% Short-Term Rating Date -
Return on Assets 6.15% Short-Term Rating -
Return on Common Equity 11.45%
Return on Capital - EBITDA/Interest Exp. 10.48
Asset Turnover 0.33% (EBITDA-Capex)/Interest Exp. 8.67
Net Debt/EBITDA -
Gross Margin 31.5% Total Debt/EBITDA -
EBITDA Margin -
EBIT Margin 23.4% Total Debt/Equity 44.4%
Net Income Margin 17.7% Total Debt/Capital 28.3%
Asset Turnover 0.33
Current Ratio 1.17 Net Fixed Asset Turnover 0.55
Quick Ratio 0.71 Accounts receivable turnover-days 37.58
Debt to Assets 24.34% Inventory Days 36.72
Tot Debt to Common Equity 44.40% Accounts Payable Turnover Day 23.05
Accounts Receivable Turnover 9.71 Cash Conversion Cycle 42.41
Inventory Turnover 9.94
Profitability S&P Issuer Ratings
Credit Ratios
Margin Analysis
Reference
Structure
Net Income
P/E
Market Capitalization
Average Daily Trading Volume
Relative Stock Price Performance
Total Revenue
TEV/Revenue
EBITDA
TEV/EBITDA
Fiscal Year Ended
Shanghai International Port Group Co LtdPrice/Volume
Valuation Analysis
536'574'502.00
Current Price (9/dd/yy) Market Data
,
-
.
0
1
2
3
o!-. l!-. k!-. a!-. g!-0 c!-0 j!-0 Q!-0 j!-0 g!-0 g!-0 Q!-0 o!-0', F
-,,', F
.,,', F
0,,', F
1,,', F
2,,', F
3,,', F
0.0
5'000.0
10'000.0
15'000.0
20'000.0
25'000.0
30'000.0
2001 2002 2003 2004 2005 2006 2007 2008 2009 2010 2011 2012
,',,
2',,
-,',,
-2',,
.,',,
.2',,
0,',,
02',,
1,',,
12',,
2,',,
,-',-'.,-, ,-',4'.,-, ,-',-'.,-- ,-',4'.,-- ,-',-'.,-. ,-',4'.,-. ,-',-'.,-0 ,-',4'.,-0
FReTn/CTrThoT/PolhirTlAlcST/ !Rna /eis FReTn/CTrThoT/PolhirTlAlcST/ !Rna /eis
Q.M.S Advisors | tel: +41 (0)78 922 08 77 | e-mail: [email protected] |
Page 51
09.09.2013
Holder Name Portfolio Name Source Amt Held % Out Latest Chg File Dt Inst Type
SHANGHAI MUNICIPAL A n/a Co File 9'284'491'490 40.8 - 31.12.2011 Corporation
YAJI INVEST CO LTD n/a Co File 5'570'694'894 24.48 - 31.12.2011 Other
SHANGHAI TONGSHENG I n/a Co File 5'292'486'284 23.26 - 31.12.2011 Investment Advisor
SHANGHAI STATE OWNED n/a Co File 293'235'050 1.29 - 31.12.2011 Investment Advisor
SHANGHAI JIUSHI CORP n/a Co File 92'844'915 0.41 - 31.12.2011 Holding Company
SHANGHAI DASHENG ASS n/a Co File 92'844'915 0.41 - 31.12.2011 Holding Company
BOSHI FUND MANAGEMEN Multiple Portfolios MF-AGG 29'335'257 0.13 (381'217) 31.12.2012 Investment Advisor
SHANGHAI TRANSPORTAT n/a Co File 29'070'000 0.13 - 31.12.2011 Government
ORIENT INTL HOLDING n/a Co File 20'564'802 0.09 - 31.12.2011 Holding Company
CH OCEAN SHIPPING AG n/a Co File 15'570'000 0.07 - 31.12.2011 Corporation
CHINA UNIVERSAL ASSE Multiple Portfolios MF-AGG 6'163'003 0.03 (297'172) 31.12.2012 Investment Advisor
NORGES BANK Multiple Portfolios MF-AGG 2'557'590 0.01 - 31.12.2012 Government
HUAAN FUND MANAGEMEN Multiple Portfolios MF-AGG 2'241'997 0.01 (552'847) 31.12.2012 Investment Advisor
HARVEST FUND MANAGEM Multiple Portfolios MF-AGG 1'821'300 0.01 360'900 31.12.2012 Investment Advisor
EVERBRIGHT PRAMERICA Multiple Portfolios MF-AGG 1'471'968 0.01 1'471'968 31.12.2012 Investment Advisor
RONGTONG FUND MANAGE Multiple Portfolios MF-AGG 1'350'439 0.01 (116'800) 31.12.2012 Investment Advisor
SUMITOMO MITSUI TRUS n/a ULT-AGG 1'149'500 0.01 - 15.03.2013 Bank
CHINA ASSET MANAGEME Multiple Portfolios MF-AGG 590'382 0 450'000 31.12.2012 Investment Advisor
HARVEST GLOBAL INVES Multiple Portfolios MF-AGG 553'300 0 - 02.09.2013 Investment Advisor
DIAM n/a ULT-AGG 552'124 0 - 17.12.2012 Unclassified
Firm Name Analyst Recommendation Weighting Change Target Price Date Date
Chang Jiang Securities Co. Limited HAN YICHAO buy 5 M #N/A N/A Not Provided 01.09.2013
Credit Suisse DAVIN CHUNPONG WU outperform 5 M 5 Not Provided 30.08.2013
UBS JEAN RAO buy 5 M 4 12 month 30.08.2013
GF Securities Co. Ltd. ZHANG LIANG hold 3 N #N/A N/A Not Provided 29.08.2013
EVA Dimensions TIMOTHY STANISH sell 1 D #N/A N/A Not Provided 28.08.2013
Northeast Securities Co Ltd XIANG XU add 4 M #N/A N/A Not Provided 13.08.2013
Goldman Sachs JANET LU neutral/neutral 3 M 3 12 month 22.07.2013
SWS Research Co Ltd AMOS ZHANG outperform 5 D #N/A N/A Not Provided 18.07.2013
Capital Securities Corp ZHANG LU buy 5 M 3 Not Provided 15.05.2013
Sinolink Securities Co Ltd JIANG MING add 4 M #N/A N/A Not Provided 26.04.2013
Qilu Securities Co Ltd ZHOU LI add 4 M #N/A N/A Not Provided 26.03.2013
Everbright Securities Co., Ltd DING XIANDA accumulate 4 M 3 12 month 20.11.2012
China Securities Co., Ltd LI LEI neutral 3 M 3 Not Provided 25.06.2012
Industrial Securities YUNTAO JI strong buy 5 M #N/A N/A Not Provided 27.03.2012
PingAn Securities CHU HAI buy 5 M #N/A N/A Not Provided 11.03.2012
Hong Yuan Securities PANG LINLIN add 4 N 4 6 month 29.08.2011
Citic Securities Co., Ltd ZHANG HONGBO add 4 M 6 Not Provided 03.05.2011
China Investment Securities SUN MIN buy 5 N #N/A N/A Not Provided 02.03.2011
China Merchants Securities JI MIN buy 5 M #N/A N/A Not Provided 29.10.2010
AJ Securities LE MINYANG neutral 3 N #N/A N/A Not Provided 14.07.2010
China Galaxy Securities QIUSHENG ZHANG buy 5 M #N/A N/A Not Provided 14.05.2010
Holdings By:
Shanghai International Port Group Co Ltd ee
Q.M.S Advisors | tel: +41 (0)78 922 08 77 | e-mail: [email protected] |
Page 52
09.09.2013
China State Construction Engineering Corporation Limited is a state-owned
enterprise. The Company engages in housing construction, international building
contracting, property development and investment, and infrastructure
construction.
Latest Fiscal Year: 12/2012
LTM as of: 06/yy
52-Week High (18.02.2013) 4.18
52-Week Low (24.09.2012) 2.90
Daily Volume
3.3
52-Week High % Change -21.05% Dividend Yield 3.18
52-Week Low % Change 13.79% Beta 1.00
% 52 Week Price Range High/Low 23.44% Equity Float 11'099.93
Shares Out 08.07.2013 30'000.0 Short Int -
99'000.00 1 Yr Total Return 8.22%
Total Debt 175'054.19 YTD Return -12.59%
Preferred Stock 0.0 Adjusted BETA 0.998
Minority Interest 37'695.8 Analyst Recs 7
Cash and Equivalents 118'365.25 Consensus Rating 5.000
Enterprise Value 221'433.70
Average Volume 5 Day 93'247'690
601668 CH EQUITY YTD Change - Average Volume 30 Day 89'071'860
601668 CH EQUITY YTD % CHANGE - Average Volume 3 Month 89'898'500
LTM-4Q LTM FY+1 FY+2 FQ+1 FQ+2
31.12.2008 31.12.2009 31.12.2010 31.12.2011 31.12.2012 06/yy 06/yy 12/13 Y 12/14 Y 09/13 Q3 12/13 Q4
194'406.7 250'346.0 355'530.6 472'108.7 549'458.9 505'705.9 596'126.8 650'733.6 737'948.4 - -
- 0.52x 0.37x 0.34x 0.38x 1.47x 1.43x - - - -
9'524.0 15'040.8 20'823.3 29'560.6 33'960.2 0.0 0.0 41'648.0 47'789.0 - -
- 8.74x 6.38x 5.44x 6.22x 0.00x 0.00x 5.32x 4.63x - -
2'746.0 6'091.8 9'240.2 13'644.3 15'735.2 14'210.9 17'350.7 18'292.0 21'182.8 - -
- 18.15x 11.03x 6.47x 7.50x 7.17x 5.61x 5.40x 4.69x - -
EBITDA 33'960.21 Long-Term Rating Date -
EBIT 30'311.95 Long-Term Rating -
Operating Margin 5.52% Long-Term Outlook -
Pretax Margin 5.49% Short-Term Rating Date -
Return on Assets 2.70% Short-Term Rating -
Return on Common Equity 16.44%
Return on Capital 9.42% EBITDA/Interest Exp. 4.18
Asset Turnover 0.94% (EBITDA-Capex)/Interest Exp. 2.98
Net Debt/EBITDA 1.67
Gross Margin 8.4% Total Debt/EBITDA 5.15
EBITDA Margin 6.2%
EBIT Margin 5.5% Total Debt/Equity 171.9%
Net Income Margin 2.9% Total Debt/Capital 55.6%
Asset Turnover 0.94
Current Ratio 1.35 Net Fixed Asset Turnover 24.73
Quick Ratio 0.54 Accounts receivable turnover-days 52.66
Debt to Assets 26.86% Inventory Days 169.50
Tot Debt to Common Equity 171.86% Accounts Payable Turnover Day 107.72
Accounts Receivable Turnover 6.95 Cash Conversion Cycle 114.44
Inventory Turnover 2.16
Fiscal Year Ended
China State Construction Engineering Corp LtdPrice/Volume
Valuation Analysis
251'282'783.00
Current Price (9/dd/yy) Market Data
Net Income
P/E
Market Capitalization
Average Daily Trading Volume
Relative Stock Price Performance
Total Revenue
TEV/Revenue
EBITDA
TEV/EBITDA
Profitability S&P Issuer Ratings
Credit Ratios
Margin Analysis
Reference
Structure
,--..00112
o!-. l!-. k!-. a!-. g!-0 c!-0 j!-0 Q!-0 j!-0 g!-0 g!-0 Q!-0 o!-0', F
-,,', F
.,,', F
0,,', F
1,,', F
2,,', F
3,,', F
4,,', F
0.0
100'000.0
200'000.0
300'000.0
400'000.0
500'000.0
600'000.0
2001 2002 2003 2004 2005 2006 2007 2008 2009 2010 2011 2012
,',,
-',,
.',,
0',,
1',,
2',,
3',,
4',,
5',,
6',,
-,',,
,-',-'.,-, ,-',4'.,-, ,-',-'.,-- ,-',4'.,-- ,-',-'.,-. ,-',4'.,-. ,-',-'.,-0 ,-',4'.,-0
FReTn/CTrThoT/PolhirTlAlcST/ !Rna /eis FReTn/CTrThoT/PolhirTlAlcST/ !Rna /eis
Q.M.S Advisors | tel: +41 (0)78 922 08 77 | e-mail: [email protected] |
Page 53
09.09.2013
Holder Name Portfolio Name Source Amt Held % Out Latest Chg File Dt Inst Type
CHINA STATE CONSTRUC n/a Co File 16'521'065'218 55.07 - 31.12.2012 Government
SOCIAL SECURITY FUND n/a Co File 1'128'000'000 3.76 - 31.12.2012 Government
CHINA LIFE INSURANCE n/a ULT-AGG 386'140'548 1.29 - 31.12.2012 Government
SINOCHEM CORP n/a Co File 336'000'000 1.12 - 31.12.2012 Government
BAOSTEEL GROUP CORP n/a Co File 336'000'000 1.12 - 31.12.2012 Government
CHINA NATIONAL PETRO n/a Co File 336'000'000 1.12 - 31.12.2012 Government
E FUND MANAGEMENT Multiple Portfolios MF-AGG 290'098'919 0.97 110'819'507 31.12.2012 Investment Advisor
BOSHI FUND MANAGEMEN Multiple Portfolios MF-AGG 287'332'362 0.96 (41'784'064) 30.06.2013 Investment Advisor
CHINA SOUTHERN FUND Multiple Portfolios MF-AGG 281'350'564 0.94 120'078'519 30.06.2013 Investment Advisor
HARVEST FUND MANAGEM Multiple Portfolios MF-AGG 267'338'008 0.89 (46'417'523) 30.06.2013 Investment Advisor
CHINA PACIFIC INSURA n/a Co File 253'537'466 0.85 - 31.12.2012 Insurance Company
SOCIAL SECURITY FUND n/a Co File 243'004'050 0.81 - 31.12.2012 Government
BLACKROCK ASSET MGMT Multiple Portfolios MF-AGG 241'337'214 0.8 - 30.08.2013 Investment Advisor
PENGHUA FUND MANAGEM Multiple Portfolios MF-AGG 220'265'420 0.73 (780'103) 30.06.2013 Investment Advisor
BANK OF COMMUNICATIO Multiple Portfolios MF-AGG 214'725'071 0.72 194'024'812 31.12.2012 Investment Advisor
CHINA ASSET MANAGEME Multiple Portfolios MF-AGG 179'457'213 0.6 (51'233'430) 31.12.2012 Investment Advisor
AEGON INDUSTRIAL FUN Multiple Portfolios MF-AGG 95'881'662 0.32 74'234'852 31.12.2012 Investment Advisor
CSOP ASSET MANAGEMEN Multiple Portfolios MF-AGG 93'719'044 0.31 - 02.09.2013 Investment Advisor
YINHUA FUND MANAGEME Multiple Portfolios MF-AGG 88'383'243 0.29 (46'499'577) 31.12.2012 Investment Advisor
GF FUND MANAGEMENT C Multiple Portfolios MF-AGG 82'274'482 0.27 67'361'672 31.12.2012 Investment Advisor
Firm Name Analyst Recommendation Weighting Change Target Price Date Date
Capital Securities Corp ZHU JIXIANG buy 5 M 5 Not Provided 29.08.2013
China International Capital Corp YUE DING buy 5 M #N/A N/A Not Provided 29.08.2013
Guotai Junan ZHANG KUN buy 5 M 5 Not Provided 26.08.2013
GF Securities Co. Ltd. XIAO TANG buy 5 M #N/A N/A Not Provided 06.08.2013
Hong Yuan Securities ZHOU RONGZI buy 5 M 5 Not Provided 17.07.2013
SWS Research Co Ltd LU LINGLING outperform 5 M #N/A N/A Not Provided 16.07.2013
Citic Securities Co., Ltd YANG TAO buy 5 M #N/A N/A Not Provided 03.05.2013
China Securities Co., Ltd TIAN DONGHONG buy 5 U 5 Not Provided 25.06.2012
Northeast Securities Co Ltd XIE WENJIE buy 5 N #N/A N/A Not Provided 20.06.2012
China Merchants Securities MENG QUN strong buy 5 M #N/A N/A Not Provided 11.06.2012
AJ Securities ZUO HONGYING buy 5 M 5 6 month 14.10.2011
Industrial Securities WANG SHUANG strong buy 5 M #N/A N/A Not Provided 05.09.2011
HuaChuang Securities ZHANG CHI strong buy 5 M #N/A N/A Not Provided 31.08.2011
China Investment Securities LI FAN strong buy 5 M #N/A N/A Not Provided 03.08.2011
China Minzu Securities Co Ltd XU YONGCHAO add 4 N 5 6 month 31.08.2010
China Galaxy Securities HAO FEIFEI speculative buy 4 M #N/A N/A Not Provided 21.06.2010
Founder Securities WEI ZHOU add 4 N #N/A N/A Not Provided 14.10.2009
Holdings By:
China State Construction Engineering Corp Ltd ee
Q.M.S Advisors | tel: +41 (0)78 922 08 77 | e-mail: [email protected] |
Page 54
09.09.2013
Haitong Securities Co., Ltd. is a securities firm which acts as a broker, dealer
for securities. The Company also provides investment advisory, placing and
underwriting, nominee and custodian services.
Latest Fiscal Year: 12/2012
LTM as of: 06/yy
52-Week High (08.02.2013) 13.50
52-Week Low (30.11.2012) 7.55
Daily Volume
12.59
52-Week High % Change -6.74% Dividend Yield -
52-Week Low % Change 66.75% Beta 1.66
% 52 Week Price Range High/Low 67.90% Equity Float 5'713.07
Shares Out 31.03.2013 8'092.1 Short Int -
116'064.31 1 Yr Total Return 37.19%
Total Debt 24'666.87 YTD Return 24.21%
Preferred Stock 0.0 Adjusted BETA 1.662
Minority Interest 1'750.9 Analyst Recs 21
Cash and Equivalents 52'312.05 Consensus Rating 4.333
Enterprise Value 92'105.40
Average Volume 5 Day #########
600837 CH EQUITY YTD Change - Average Volume 30 Day #########
600837 CH EQUITY YTD % CHANGE - Average Volume 3 Month #########
LTM-4Q LTM FY+1 FY+2 FQ+1 FQ+2
31.12.2008 31.12.2009 31.12.2010 31.12.2011 31.12.2012 06/yy 06/yy 12/13 Y 12/14 Y 09/13 Q3 12/13 Q4
7'926.5 11'309.5 11'299.1 10'329.3 9'874.1 10'142.0 11'263.4 11'259.8 13'270.0 - -
5.51x 12.24x 7.88x 2.29x 7.40x 13.31x 23.41x 5.37x 4.12x - -
4'148.7 6'394.0 5'478.0 5'000.3 5'074.0 0.0 2'349.3 5'706.0 6'581.0 - -
10.53x 21.65x 16.25x 4.74x 14.39x 0.00x 0.00x 16.14x 14.00x - -
3'301.7 4'548.2 3'686.3 3'103.0 3'019.8 2'893.8 3'659.6 4'204.2 5'071.3 - -
20.28x 34.89x 21.42x 19.50x 31.06x 28.14x 24.75x 27.37x 22.81x - -
EBITDA 5'073.98 Long-Term Rating Date -
EBIT - Long-Term Rating -
Operating Margin 44.20% Long-Term Outlook -
Pretax Margin 41.62% Short-Term Rating Date -
Return on Assets 2.87% Short-Term Rating -
Return on Common Equity 6.24%
Return on Capital 4.70% EBITDA/Interest Exp. -
Asset Turnover 0.09% (EBITDA-Capex)/Interest Exp. -
Net Debt/EBITDA -
Gross Margin - Total Debt/EBITDA -
EBITDA Margin -
EBIT Margin - Total Debt/Equity 42.0%
Net Income Margin 30.6% Total Debt/Capital 29.0%
Asset Turnover 0.09
Current Ratio - Net Fixed Asset Turnover 11.49
Quick Ratio - Accounts receivable turnover-days -
Debt to Assets 19.52% Inventory Days -
Tot Debt to Common Equity 42.04% Accounts Payable Turnover Day -
Accounts Receivable Turnover - Cash Conversion Cycle -
Inventory Turnover -
Fiscal Year Ended
Haitong Securities Co LtdPrice/Volume
Valuation Analysis
501'454'662.00
Current Price (9/dd/yy) Market Data
Net Income
P/E
Market Capitalization
Average Daily Trading Volume
Relative Stock Price Performance
Total Revenue
TEV/Revenue
EBITDA
TEV/EBITDA
Profitability S&P Issuer Ratings
Credit Ratios
Margin Analysis
Reference
Structure
,
.
1
3
5
-,
-.
-1
o!-. l!-. k!-. a!-. g!-0 c!-0 j!-0 Q!-0 j!-0 g!-0 g!-0 Q!-0 o!-0', F
2,', F
-,,', F
-2,', F
.,,', F
.2,', F
0,,', F
02,', F
0.0
2'000.0
4'000.0
6'000.0
8'000.0
10'000.0
12'000.0
14'000.0
2001 2002 2003 2004 2005 2006 2007 2008 2009 2010 2011 2012
,',,
2',,
-,',,
-2',,
.,',,
.2',,
,-',-'.,-, ,-',4'.,-, ,-',-'.,-- ,-',4'.,-- ,-',-'.,-. ,-',4'.,-. ,-',-'.,-0 ,-',4'.,-0
FReTn/CTrThoT/PolhirTlAlcST/ !Rna /eis FReTn/CTrThoT/PolhirTlAlcST/ !Rna /eis
Q.M.S Advisors | tel: +41 (0)78 922 08 77 | e-mail: [email protected] |
Page 55
09.09.2013
Holder Name Portfolio Name Source Amt Held % Out Latest Chg File Dt Inst Type
BRIGHT FOOD GROUP CO n/a Co File 450'220'026 5.56 - 31.12.2012 Other
SHANGHAI TOBACCO GRO n/a Co File 400'709'623 4.95 - 31.12.2012 Corporation
SHANGHAI ELECTRIC CO n/a Co File 377'667'258 4.67 - 31.12.2012 Government
SHENERGY GROUP CO LT n/a Co File 322'162'086 3.98 - 31.12.2012 Government
SHANGHAI JIUSHI CORP n/a Co File 235'247'280 2.91 - 31.12.2012 Holding Company
CHINA ASSET MANAGEME Multiple Portfolios MF-AGG 227'378'619 2.81 155'184'847 30.06.2013 Investment Advisor
SHANGHAI FRIENDSHIP n/a Co File 214'471'652 2.65 - 31.12.2012 Holding Company
SHANGHAI LANSHENG CO n/a Co File 190'950'000 2.36 - 31.12.2012 Government
WENHUI XINMIN UTD PR n/a Co File 187'629'853 2.32 - 31.12.2012 Corporation
CHINA LIFE INSURANCE n/a ULT-AGG 167'789'759 2.07 - 31.12.2012 Government
BLACKROCK ASSET MGMT Multiple Portfolios MF-AGG 111'223'489 1.37 - 30.08.2013 Investment Advisor
HARVEST FUND MANAGEM Multiple Portfolios MF-AGG 102'464'150 1.27 (56'625'982) 31.12.2012 Investment Advisor
BOSHI FUND MANAGEMEN Multiple Portfolios MF-AGG 93'738'899 1.16 30'746'838 30.06.2013 Investment Advisor
DACHENG FUND MANAGME Multiple Portfolios MF-AGG 91'042'326 1.13 9'272'770 31.12.2012 Investment Advisor
YINHUA FUND MANAGEME Multiple Portfolios MF-AGG 79'655'352 0.98 (4'191'838) 30.06.2013 Investment Advisor
E FUND MANAGEMENT Multiple Portfolios MF-AGG 55'009'591 0.68 12'255'444 31.12.2012 Investment Advisor
CHINA SOUTHERN FUND Multiple Portfolios MF-AGG 49'121'932 0.61 29'688'368 30.06.2013 Investment Advisor
HUATAI-PINEBRIDGE FU Multiple Portfolios MF-AGG 45'950'689 0.57 (28'534'194) 31.12.2012 Investment Advisor
CSOP ASSET MANAGEMEN Multiple Portfolios MF-AGG 44'316'137 0.55 - 02.09.2013 Investment Advisor
RONGTONG FUND MANAGE Multiple Portfolios MF-AGG 40'829'310 0.5 9'264'487 30.06.2013 Investment Advisor
Firm Name Analyst Recommendation Weighting Change Target Price Date Date
Chang Jiang Securities Co. Limited LIU JUN buy 5 M #N/A N/A Not Provided 02.09.2013
Sinolink Securities Co Ltd JIANGANG CHEN buy 5 M #N/A N/A Not Provided 26.08.2013
GF Securities Co. Ltd. CONG LI buy 5 M #N/A N/A Not Provided 23.08.2013
China International Capital Corp JIE HUANG accumulate 4 M #N/A N/A Not Provided 23.08.2013
Guotai Junan ZHAO XIANGHUAI buy 5 M 13 12 month 23.08.2013
Credit Suisse FRANCES FENG neutral 3 M 11 Not Provided 22.08.2013
Tebon Securities Co Ltd LI XIANGFENG buy 5 M 14 6 month 19.08.2013
Everbright Securities Co., Ltd ZIPEI TANG buy 5 M 14 12 month 06.08.2013
China Minzu Securities Co Ltd SONG JIAN add 4 M 15 6 month 23.07.2013
SWS Research Co Ltd HE ZONGYAN buy 5 M #N/A N/A Not Provided 22.07.2013
Hong Yuan Securities HUANG LIJUN buy 5 M #N/A N/A Not Provided 21.07.2013
Capital Securities Corp XIE JIYONG buy 5 M #N/A N/A Not Provided 17.07.2013
Northeast Securities Co Ltd XINAN ZHAO add 4 M #N/A N/A Not Provided 30.06.2013
PingAn Securities WU JIE buy 5 M #N/A N/A Not Provided 28.06.2013
Goldman Sachs NING MA neutral/neutral 3 M 10 12 month 24.06.2013
HSBC YORK PUN neutral 3 M 11 Not Provided 24.06.2013
Guodu Securities Co Ltd DENG TING buy 5 M #N/A N/A Not Provided 21.06.2013
Citic Securities Co., Ltd PAN HONGWEN buy 5 M 11 6 month 15.03.2013
JPMorgan JOSHUA KLACZEK neutral 3 M 9 3 month 31.01.2013
Bank of China International ZHANG JIAN hold 3 M 16 Not Provided 10.01.2013
Central China Securities XIE PEIJIE add 4 M #N/A N/A Not Provided 06.12.2012
Founder Securities WEI ZHOU add 4 D #N/A N/A Not Provided 27.08.2012
China Merchants Securities LUO YI strong buy 5 M 12 6 month 19.07.2012
Industrial Securities ZHANG YING buy 5 D #N/A N/A Not Provided 16.03.2012
China Investment Securities CHEN JIANTAO buy 5 M #N/A N/A Not Provided 02.03.2011
China Securities Co., Ltd WEI TAO add 4 M 18 Not Provided 08.12.2010
China Galaxy Securities XIAOHUI CHI neutral 3 M #N/A N/A Not Provided 30.06.2009
Holdings By:
Haitong Securities Co Ltd ee
Q.M.S Advisors | tel: +41 (0)78 922 08 77 | e-mail: [email protected] |
Page 56
09.09.2013
Great Wall Motor Company Limited, through its subsidiaries, manufactures and
sells pick-up trucks and sport-utility vehicles (SUVs) in China under branded
names. The Company also researches and develops, and manufactures principal
automotive parts and components for use in the assembly of pick-up trucks and
SUVs.
Latest Fiscal Year: 12/2012
LTM as of: 06/yy
52-Week High (09.09.2013) 48.00
52-Week Low (11.09.2012) 15.75
Daily Volume
47.6
52-Week High % Change -0.83% Dividend Yield 1.20
52-Week Low % Change 202.22% Beta 0.83
% 52 Week Price Range High/Low 94.95% Equity Float 304.24
Shares Out 31.03.2013 2'009.2 Short Int -
129'156.66 1 Yr Total Return 204.60%
Total Debt 4'393.38 YTD Return 103.97%
Preferred Stock 0.0 Adjusted BETA 0.831
Minority Interest 129.1 Analyst Recs 19
Cash and Equivalents 6'348.63 Consensus Rating 4.737
Enterprise Value 126'133.07
Average Volume 5 Day 2'152'626
601633 CH EQUITY YTD Change - Average Volume 30 Day 3'405'555
601633 CH EQUITY YTD % CHANGE - Average Volume 3 Month 4'032'116
LTM-4Q LTM FY+1 FY+2 FQ+1 FQ+2
31.12.2008 31.12.2009 31.12.2010 31.12.2011 31.12.2012 06/yy 06/yy 12/13 Y 12/14 Y 09/13 Q3 12/13 Q4
8'207.3 12'396.4 22'175.0 29'037.2 41'565.2 32'992.1 49'402.7 56'766.2 70'910.1 12'978.0 15'407.0
- 0.41x 0.71x 1.06x 1.59x 2.80x 4.98x 2.16x 1.66x - -
- 1'269.1 3'511.9 4'740.6 7'539.4 1'942.3 0.0 11'188.2 14'362.8 - -
- 4.00x 4.46x 6.48x 8.77x 0.00x 0.00x 11.27x 8.78x - -
514.1 1'022.6 2'700.7 3'426.2 5'692.4 3'967.9 7'426.3 8'444.0 10'515.1 1'800.0 1'840.0
12.52x 9.17x 8.25x 7.54x 10.52x 6.66x 10.85x 17.53x 13.91x 15.11x -
EBITDA 7'539.45 Long-Term Rating Date -
EBIT 6'590.22 Long-Term Rating -
Operating Margin 15.86% Long-Term Outlook -
Pretax Margin 16.46% Short-Term Rating Date -
Return on Assets 15.04% Short-Term Rating -
Return on Common Equity 29.76%
Return on Capital 24.37% EBITDA/Interest Exp. 721.07
Asset Turnover 1.10% (EBITDA-Capex)/Interest Exp. 295.99
Net Debt/EBITDA -0.26
Gross Margin 24.1% Total Debt/EBITDA 0.58
EBITDA Margin 18.1%
EBIT Margin 15.9% Total Debt/Equity 20.4%
Net Income Margin 13.7% Total Debt/Capital 16.9%
Asset Turnover 1.10
Current Ratio 1.34 Net Fixed Asset Turnover 2.92
Quick Ratio 1.13 Accounts receivable turnover-days 109.47
Debt to Assets 10.32% Inventory Days 31.72
Tot Debt to Common Equity 20.42% Accounts Payable Turnover Day 85.63
Accounts Receivable Turnover 3.34 Cash Conversion Cycle 55.57
Inventory Turnover 11.54
Profitability S&P Issuer Ratings
Credit Ratios
Margin Analysis
Reference
Structure
Net Income
P/E
Market Capitalization
Average Daily Trading Volume
Relative Stock Price Performance
Total Revenue
TEV/Revenue
EBITDA
TEV/EBITDA
Fiscal Year Ended
Great Wall Motor Co LtdPrice/Volume
Valuation Analysis
3'108'699.00
Current Price (9/dd/yy) Market Data
,2
-,-2.,.20,021,122,
o!-. l!-. k!-. a!-. g!-0 c!-0 j!-0 Q!-0 j!-0 g!-0 g!-0 Q!-0 o!-0', F
.', F
1', F
3', F
5', F
-,', F
-.', F
-1', F
0.0
5'000.0
10'000.0
15'000.0
20'000.0
25'000.0
30'000.0
35'000.0
40'000.0
45'000.0
2000 2001 2002 2003 2004 2005 2006 2007 2008 2009 2010 2011 2012
,',,
2',,
-,',,
-2',,
.,',,
.2',,
0,',,
02',,
,-',-'.,-, ,-',4'.,-, ,-',-'.,-- ,-',4'.,-- ,-',-'.,-. ,-',4'.,-. ,-',-'.,-0 ,-',4'.,-0
FReTn/CTrThoT/PolhirTlAlcST/ !Rna /eis FReTn/CTrThoT/PolhirTlAlcST/ !Rna /eis
Q.M.S Advisors | tel: +41 (0)78 922 08 77 | e-mail: [email protected] |
Page 57
09.09.2013
Holder Name Portfolio Name Source Amt Held % Out Latest Chg File Dt Inst Type
BAODING INNOVATION G n/a EXCH 1'705'000'000 84.86 - 08.02.2013 Unclassified
HARVEST FUND MANAGEM Multiple Portfolios MF-AGG 48'217'346 2.4 19'939'521 30.06.2013 Investment Advisor
TAIKANG LIFE INSURAN n/a EXCH 31'710'239 1.58 - 27.09.2011 Insurance Company
CHINA INTERNATIONAL Multiple Portfolios MF-AGG 28'224'413 1.4 6'614'546 30.06.2013 Investment Advisor
BOSHI FUND MANAGEMEN Multiple Portfolios MF-AGG 17'401'955 0.87 752'737 30.06.2013 Investment Advisor
JIASHI FUND MANAGEME Multiple Portfolios MF-AGG 14'803'920 0.74 325'602 30.06.2013 Investment Advisor
INVESCO GREAT WALL F Multiple Portfolios MF-AGG 14'197'643 0.71 1'649'171 31.03.2013 Investment Advisor
CHINA ASSET MANAGEME Multiple Portfolios MF-AGG 12'137'899 0.6 3'823'717 31.12.2012 Investment Advisor
FOUNDER SECURITIES C n/a EXCH 10'287'200 0.51 - 27.09.2011 Unclassified
RONGTONG FUND MANAGE Multiple Portfolios MF-AGG 8'543'639 0.43 (165'686) 30.06.2013 Investment Advisor
SOOCHOW ASSET MANAGE Multiple Portfolios MF-AGG 7'655'160 0.38 961'968 30.06.2013 Investment Advisor
E FUND MANAGEMENT Multiple Portfolios MF-AGG 7'304'332 0.36 1'605'969 31.12.2012 Investment Advisor
PENGHUA FUND MANAGEM Multiple Portfolios MF-AGG 6'653'847 0.33 (962'945) 30.06.2013 Investment Advisor
BLACKROCK ASSET MGMT Multiple Portfolios MF-AGG 6'342'748 0.32 - 30.08.2013 Investment Advisor
DACHENG FUND MANAGME Multiple Portfolios MF-AGG 6'036'846 0.3 5'288'528 31.12.2012 Investment Advisor
AEGON INDUSTRIAL FUN Multiple Portfolios MF-AGG 4'098'225 0.2 (100'023) 31.12.2012 Investment Advisor
GUOTAI ASSET MANAGEM Multiple Portfolios MF-AGG 3'829'331 0.19 (4'682'403) 30.06.2013 Investment Advisor
HFT INVESTMENT MANAG Multiple Portfolios MF-AGG 3'827'238 0.19 (1'755'104) 31.12.2012 Investment Advisor
CHINA MERCHANTS FUND Multiple Portfolios MF-AGG 3'552'422 0.18 (1'250'096) 31.12.2012 Investment Advisor
FIRST STATE CINDA FU Multiple Portfolios MF-AGG 3'314'060 0.16 3'314'060 31.12.2012 Government
Firm Name Analyst Recommendation Weighting Change Target Price Date Date
Sinolink Securities Co Ltd WU WENZHAO buy 5 M 53 6 month 26.08.2013
Chang Jiang Securities Co. Limited LIU YUANRUI buy 5 M #N/A N/A Not Provided 25.08.2013
Capital Securities Corp HAN WEIQI buy 5 M 50 Not Provided 23.08.2013
Bank of China International ERIC HU buy 5 M 53 Not Provided 23.08.2013
Northeast Securities Co Ltd LIU LIXI buy 5 M #N/A N/A Not Provided 23.08.2013
China International Capital Corp LUO WEI buy 5 M #N/A N/A Not Provided 23.08.2013
PingAn Securities DE AN WANG strong buy 5 M 55 12 month 23.08.2013
Goldman Sachs YIPENG YANG neutral/neutral 3 M 36 12 month 22.08.2013
Everbright Securities Co., Ltd WEI FENG buy 5 M 41 12 month 17.08.2013
SWS Research Co Ltd CHANG LU outperform 5 M #N/A N/A Not Provided 15.08.2013
China Investment Securities ZHANG LEI strong buy 5 M 42 12 month 06.08.2013
Qilu Securities Co Ltd BAI YU buy 5 M 45 12 month 06.08.2013
UBS TIANLONG ZOU neutral 3 M 37 12 month 23.07.2013
Guodu Securities Co Ltd XIAO SHIJUN strong buy 5 M #N/A N/A Not Provided 21.07.2013
China Minzu Securities Co Ltd CAO HE add 4 M 40 6 month 28.06.2013
Citic Securities Co., Ltd LI CHUNBO buy 5 M 20 6 month 26.04.2013
Guotai Junan BAI XIAOLAN buy 5 M 30 Not Provided 08.02.2013
HuaChuang Securities WANG YANXUE buy 5 D #N/A N/A Not Provided 21.01.2013
Great Wall Securities RAN FEI strong buy 5 M 19 6 month 26.10.2012
Founder Securities WANG YUQIONG add 4 N #N/A N/A Not Provided 09.09.2012
China Merchants Securities WANG LIUSHENG buy 5 M #N/A N/A Not Provided 15.06.2012
Industrial Securities LI GANGLING neutral 3 M #N/A N/A Not Provided 14.04.2012
AJ Securities ZHANG ZHIPENG buy 5 M 16 6 month 22.12.2011
Holdings By:
Great Wall Motor Co Ltd ee
Q.M.S Advisors | tel: +41 (0)78 922 08 77 | e-mail: [email protected] |
Page 58
09.09.2013
Inner Mongolia Yili Industrial Group Co., Ltd. produces milk, powdered milk, ice
cream, and other dairy products. The Company also produces frozen food and
noodles.
Latest Fiscal Year: 12/2012
LTM as of: 06/yy
52-Week High (09.09.2013) 40.34
52-Week Low (05.12.2012) 18.99
Daily Volume
39.97
52-Week High % Change -0.92% Dividend Yield -
52-Week Low % Change 110.48% Beta 0.91
% 52 Week Price Range High/Low 97.54% Equity Float 1'628.17
Shares Out 02.07.2013 2'042.9 Short Int -
81'655.27 1 Yr Total Return 88.74%
Total Debt 2'584.97 YTD Return 83.67%
Preferred Stock 0.0 Adjusted BETA 0.909
Minority Interest 190.1 Analyst Recs 21
Cash and Equivalents 2'004.20 Consensus Rating 4.667
Enterprise Value 75'670.71
Average Volume 5 Day 22'251'370
600887 CH EQUITY YTD Change - Average Volume 30 Day 11'476'740
600887 CH EQUITY YTD % CHANGE - Average Volume 3 Month 12'834'290
LTM-4Q LTM FY+1 FY+2 FQ+1 FQ+2
31.12.2008 31.12.2009 31.12.2010 31.12.2011 31.12.2012 06/yy 06/yy 12/13 Y 12/14 Y 09/13 Q3 12/13 Q4
21'537.1 24'214.7 29'577.2 37'218.5 41'741.2 39'420.4 44'566.8 48'396.1 55'823.1 13'278.0 10'069.0
0.33x 0.85x 1.03x 0.86x 0.86x 3.29x 4.09x 1.59x 1.36x - -
(1'515.2) 1'171.6 1'184.9 2'176.3 2'563.3 0.0 0.0 3'687.3 4'751.0 1'304.0 1'147.0
- 17.54x 25.75x 14.78x 14.01x 0.00x 0.00x 20.52x 15.93x - -
(1'687.4) 647.7 777.2 1'809.2 1'717.2 1'754.8 2'693.6 2'683.5 3'104.1 1'087.0 881.0
- 32.69x 39.44x 18.08x 20.54x 18.64x 20.69x 31.03x 26.21x 26.74x 24.01x
EBITDA 2'563.30 Long-Term Rating Date -
EBIT 1'648.76 Long-Term Rating -
Operating Margin 3.95% Long-Term Outlook -
Pretax Margin 5.00% Short-Term Rating Date -
Return on Assets 10.87% Short-Term Rating -
Return on Common Equity 25.75%
Return on Capital - EBITDA/Interest Exp. 25.55
Asset Turnover 1.80% (EBITDA-Capex)/Interest Exp. -5.37
Net Debt/EBITDA -
Gross Margin 29.3% Total Debt/EBITDA -
EBITDA Margin -
EBIT Margin 5.0% Total Debt/Equity 35.2%
Net Income Margin 4.1% Total Debt/Capital 25.6%
Asset Turnover 1.80
Current Ratio 0.54 Net Fixed Asset Turnover 4.13
Quick Ratio 0.21 Accounts receivable turnover-days 4.11
Debt to Assets 13.05% Inventory Days 35.56
Tot Debt to Common Equity 35.24% Accounts Payable Turnover Day 70.58
Accounts Receivable Turnover 88.88 Cash Conversion Cycle -12.15
Inventory Turnover 10.26
Profitability S&P Issuer Ratings
Credit Ratios
Margin Analysis
Reference
Structure
Net Income
P/E
Market Capitalization
Average Daily Trading Volume
Relative Stock Price Performance
Total Revenue
TEV/Revenue
EBITDA
TEV/EBITDA
Fiscal Year Ended
Inner Mongolia Yili Industrial Group Co LtdPrice/Volume
Valuation Analysis
8'815'520.00
Current Price (9/dd/yy) Market Data
,
2
-,
-2
.,
.2
0,
02
1,
o!-. l!-. k!-. a!-. g!-0 c!-0 j!-0 Q!-0 j!-0 g!-0 g!-0 Q!-0 o!-0', F
-,', F
.,', F
0,', F
1,', F
2,', F
3,', F
4,', F
0.0
5'000.0
10'000.0
15'000.0
20'000.0
25'000.0
30'000.0
35'000.0
40'000.0
45'000.0
2001 2002 2003 2004 2005 2006 2007 2008 2009 2010 2011 2012
,',,
2',,
-,',,
-2',,
.,',,
.2',,
0,',,
02',,
1,',,
,-',-'.,-, ,-',4'.,-, ,-',-'.,-- ,-',4'.,-- ,-',-'.,-. ,-',4'.,-. ,-',-'.,-0 ,-',4'.,-0
FReTn/CTrThoT/PolhirTlAlcST/ !Rna /eis FReTn/CTrThoT/PolhirTlAlcST/ !Rna /eis
Q.M.S Advisors | tel: +41 (0)78 922 08 77 | e-mail: [email protected] |
Page 59
09.09.2013
Holder Name Portfolio Name Source Amt Held % Out Latest Chg File Dt Inst Type
HOHHOT INVESTMENT CO n/a EXCH 190'013'958 9.3 - 10.01.2013 Corporation
HARVEST FUND MANAGEM Multiple Portfolios MF-AGG 108'004'438 5.29 14'936'049 30.06.2013 Investment Advisor
E FUND MANAGEMENT Multiple Portfolios MF-AGG 74'982'481 3.67 (1'293'778) 31.12.2012 Investment Advisor
SOCIAL SECURITY FUND n/a EXCH 63'808'863 3.12 - 10.01.2013 Government
CHINA ASSET MANAGEME Multiple Portfolios MF-AGG 61'610'907 3.02 (11'310'111) 30.06.2013 Investment Advisor
CHINA ASSET MANAGEME Multiple Portfolios MF-AGG 61'568'308 3.01 1'474'731 30.06.2013 Investment Advisor
MORGAN STANLEY n/a ULT-AGG 49'682'034 2.43 - 10.01.2013 Investment Advisor
PENGHUA FUND MANAGEM Multiple Portfolios MF-AGG 45'483'997 2.23 4'953'599 30.06.2013 Investment Advisor
BOSHI FUND MANAGEMEN Multiple Portfolios MF-AGG 40'834'378 2 30'131'227 30.06.2013 Investment Advisor
MERRILL LYNCH INTERN n/a EXCH 40'620'259 1.99 - 10.01.2013 Bank
TAIKANG LIFE INSURAN n/a EXCH 36'458'375 1.78 - 10.01.2013 Insurance Company
BANK OF COMMUNICATIO Multiple Portfolios MF-AGG 34'923'606 1.71 10'622'369 30.06.2013 Investment Advisor
CHINA AMC RETURN FUN n/a EXCH 33'711'947 1.65 - 10.01.2013 n/a
CITIGROUP INCORPORAT n/a ULT-AGG 32'651'073 1.6 - 10.01.2013 Investment Advisor
NEW CHINA LIFE INSUR n/a EXCH 32'400'000 1.59 - 10.01.2013 Insurance Company
YINHUA FUND MANAGEME Multiple Portfolios MF-AGG 28'866'119 1.41 6'347'490 31.12.2012 Investment Advisor
HARVEST THEMATIC FUN n/a EXCH 25'063'579 1.23 - 10.01.2013 n/a
GF FUND MANAGEMENT C Multiple Portfolios MF-AGG 23'233'749 1.14 765'310 31.12.2012 Investment Advisor
YALE UNIVERSITY n/a Co File 22'056'237 1.08 - 31.12.2012 Endowment
FULLGOAL FUND MANAGE Multiple Portfolios MF-AGG 17'006'077 0.83 16'251'165 31.12.2012 Investment Advisor
Firm Name Analyst Recommendation Weighting Change Target Price Date Date
Capital Securities Corp LIU HUI buy 5 M 42 Not Provided 03.09.2013
China International Capital Corp FEIYANG YUAN buy 5 M 43 12 month 03.09.2013
UBS ERICA POON WERKUN buy 5 M 48 12 month 02.09.2013
Guotai Junan HU CHUNXIA buy 5 M 45 12 month 02.09.2013
PingAn Securities WEN XIAN strong buy 5 M 45 12 month 02.09.2013
China Investment Securities JIANG XIN strong buy 5 M 46 12 month 02.09.2013
Morgan Stanley LILLIAN LOU Equalwt/In-Line 3 M 33 12 month 01.09.2013
SWS Research Co Ltd JASMINE ZHOU buy 5 M #N/A N/A Not Provided 01.09.2013
Chang Jiang Securities Co. Limited ZHIJIAN CHEN buy 5 M #N/A N/A Not Provided 31.08.2013
Everbright Securities Co., Ltd TINGZHI XING accumulate 4 M 28 12 month 12.08.2013
China Merchants Securities LONG JUN buy 5 M #N/A N/A Not Provided 29.07.2013
Hong Yuan Securities SU QINGQING buy 5 M 30 6 month 14.07.2013
Qilu Securities Co Ltd XIE GANG buy 5 M #N/A N/A Not Provided 07.07.2013
Northeast Securities Co Ltd ZHU CHENGLIANG buy 5 U #N/A N/A Not Provided 28.06.2013
Guodu Securities Co Ltd ZHAO XIANDONG strong buy 5 M #N/A N/A Not Provided 27.06.2013
EVA Dimensions CRAIG STERLING sell 1 M #N/A N/A Not Provided 06.06.2013
Rising Securities Co.,LTD ZHAO YUE outperform 5 M 29 6 month 22.04.2013
Citic Securities Co., Ltd HUANG WEI buy 5 M 26 6 month 06.02.2013
Bank of China International SU CHENG buy 5 M #N/A N/A Not Provided 24.01.2013
HuaChuang Securities GAO LI buy 5 M #N/A N/A Not Provided 17.12.2012
Sinolink Securities Co Ltd XIAO ZHE buy 5 U #N/A N/A Not Provided 01.11.2012
China Securities Co., Ltd FUSHENG HUANG buy 5 M 30 Not Provided 25.06.2012
Industrial Securities CHEN YU buy 5 N #N/A N/A Not Provided 18.07.2011
Central China Securities FANG XIAHONG buy 5 M #N/A N/A Not Provided 28.05.2011
China Galaxy Securities DONG JUNFENG buy 5 M #N/A N/A Not Provided 29.06.2010
Holdings By:
Inner Mongolia Yili Industrial Group Co Ltd ee
Q.M.S Advisors | tel: +41 (0)78 922 08 77 | e-mail: [email protected] |
Page 60
09.09.2013
Poly Real Estate Group Co., Ltd. mainly develops and sells residential homes.
The company is also in the business of leasing and rental of real estates, and
property management.
Latest Fiscal Year: 12/2012
LTM as of: 06/yy
52-Week High (21.01.2013) 14.64
52-Week Low (25.06.2013) 8.59
Daily Volume
10.79
52-Week High % Change -26.30% Dividend Yield -
52-Week Low % Change 25.61% Beta 1.37
% 52 Week Price Range High/Low 29.26% Equity Float 3'673.65
Shares Out 30.06.2013 7'138.0 Short Int -
77'018.96 1 Yr Total Return 3.22%
Total Debt 81'522.44 YTD Return -19.17%
Preferred Stock 0.0 Adjusted BETA 1.370
Minority Interest 12'293.1 Analyst Recs 25
Cash and Equivalents 32'672.70 Consensus Rating 4.920
Enterprise Value 147'292.67
Average Volume 5 Day 76'397'900
600048 CH EQUITY YTD Change - Average Volume 30 Day 58'968'700
600048 CH EQUITY YTD % CHANGE - Average Volume 3 Month 65'615'560
LTM-4Q LTM FY+1 FY+2 FQ+1 FQ+2
31.12.2008 31.12.2009 31.12.2010 31.12.2011 31.12.2012 06/yy 06/yy 12/13 Y 12/14 Y 09/13 Q3 12/13 Q4
13'973.9 20'450.2 32'309.9 41'962.8 60'785.5 46'473.1 70'363.8 89'933.7 112'793.1 21'667.0 35'217.5
3.87x 4.60x 3.09x 2.77x 2.60x 10.57x 8.18x 1.25x 0.71x - -
3'731.6 5'204.4 7'480.3 10'601.4 14'172.4 0.0 0.0 18'258.0 23'262.4 - -
14.48x 18.06x 13.36x 10.97x 11.16x 0.00x 0.00x 8.07x 6.33x - -
2'238.9 3'519.2 4'920.0 6'530.9 8'438.2 6'246.9 9'334.5 10'718.1 13'631.1 3'933.0 3'933.0
15.82x 21.13x 11.76x 9.09x 11.53x 13.00x 7.62x 7.15x 5.61x 6.26x 5.21x
EBITDA 14'172.40 Long-Term Rating Date 14.06.2013
EBIT 13'874.30 Long-Term Rating BBB+
Operating Margin 22.83% Long-Term Outlook STABLE
Pretax Margin 22.26% Short-Term Rating Date -
Return on Assets 3.73% Short-Term Rating -
Return on Common Equity 23.09%
Return on Capital - EBITDA/Interest Exp. 17.81
Asset Turnover 0.28% (EBITDA-Capex)/Interest Exp. 17.72
Net Debt/EBITDA -
Gross Margin 27.7% Total Debt/EBITDA -
EBITDA Margin -
EBIT Margin 21.0% Total Debt/Equity 191.9%
Net Income Margin 13.9% Total Debt/Capital 59.8%
Asset Turnover 0.28
Current Ratio 1.73 Net Fixed Asset Turnover 64.16
Quick Ratio 0.25 Accounts receivable turnover-days 6.30
Debt to Assets 32.46% Inventory Days 1337.06
Tot Debt to Common Equity 191.88% Accounts Payable Turnover Day 33.27
Accounts Receivable Turnover 57.91 Cash Conversion Cycle 1380.97
Inventory Turnover 0.27
Fiscal Year Ended
Poly Real Estate Group Co LtdPrice/Volume
Valuation Analysis
121'003'185.00
Current Price (9/dd/yy) Market Data
Net Income
P/E
Market Capitalization
Average Daily Trading Volume
Relative Stock Price Performance
Total Revenue
TEV/Revenue
EBITDA
TEV/EBITDA
Profitability S&P Issuer Ratings
Credit Ratios
Margin Analysis
Reference
Structure
,
.
1
3
5
-,
-.
-1
-3
o!-. l!-. k!-. a!-. g!-0 c!-0 j!-0 Q!-0 j!-0 g!-0 g!-0 Q!-0 o!-0', F.,', F1,', F3,', F5,', F-,,', F-.,', F-1,', F-3,', F-5,', F
0.0
10'000.0
20'000.0
30'000.0
40'000.0
50'000.0
60'000.0
70'000.0
2001 2002 2003 2004 2005 2006 2007 2008 2009 2010 2011 2012
,',,
.',,
1',,
3',,
5',,
-,',,
-.',,
-1',,
-3',,
-5',,
.,',,
,-',-'.,-, ,-',4'.,-, ,-',-'.,-- ,-',4'.,-- ,-',-'.,-. ,-',4'.,-. ,-',-'.,-0 ,-',4'.,-0
FReTn/CTrThoT/PolhirTlAlcST/ !Rna /eis FReTn/CTrThoT/PolhirTlAlcST/ !Rna /eis
Q.M.S Advisors | tel: +41 (0)78 922 08 77 | e-mail: [email protected] |
Page 61
09.09.2013
Holder Name Portfolio Name Source Amt Held % Out Latest Chg File Dt Inst Type
POLY SOUTHERN GROUP n/a Co File 3'007'916'449 42.14 - 31.12.2012 Other
SOCIAL SECURITY FUND n/a Co File 159'888'115 2.24 - 31.12.2012 Government
GUANGDONG HUAMEI INT n/a Co File 148'983'000 2.09 - 31.12.2012 Corporation
CHINA POLY GROUP COR n/a Co File 139'031'682 1.95 - 31.12.2012 Government
CHINA ASSET MANAGEME Multiple Portfolios MF-AGG 121'047'581 1.7 (5'206'154) 31.12.2012 Investment Advisor
GF FUND MANAGEMENT C Multiple Portfolios MF-AGG 118'144'042 1.66 25'846'046 31.12.2012 Investment Advisor
HUAAN FUND MANAGEMEN Multiple Portfolios MF-AGG 105'239'066 1.47 (8'481'780) 30.06.2013 Investment Advisor
HARVEST FUND MANAGEM Multiple Portfolios MF-AGG 105'049'685 1.47 (10'827'091) 30.06.2013 Investment Advisor
GUOSEN SECURITIES CO n/a Co File 81'849'101 1.15 - 31.12.2012 Corporation
BLACKROCK ASSET MGMT Multiple Portfolios MF-AGG 80'189'127 1.12 - 30.08.2013 Investment Advisor
YINHUA FUND MANAGEME Multiple Portfolios MF-AGG 74'096'725 1.04 (13'762'200) 30.06.2013 Investment Advisor
E FUND MANAGEMENT Multiple Portfolios MF-AGG 59'438'475 0.83 (25'592'351) 31.12.2012 Investment Advisor
QIANJI ZHU n/a Co File 57'454'590 0.8 - 31.12.2012 n/a
CHINA ASSET MANAGEME Multiple Portfolios MF-AGG 57'124'119 0.8 1'292'974 30.06.2013 Investment Advisor
CHINA LIFE INSURANCE n/a ULT-AGG 56'716'856 0.79 - 31.12.2012 Government
INVESCO GREAT WALL F Multiple Portfolios MF-AGG 52'503'306 0.74 6'727'615 30.06.2013 Investment Advisor
CCB PRINCIPAL ASSET Multiple Portfolios MF-AGG 51'634'221 0.72 3'623'598 30.06.2013 Investment Advisor
PENGHUA FUND MANAGEM Multiple Portfolios MF-AGG 49'880'270 0.7 (20'588'941) 31.12.2012 Investment Advisor
KEQIANG ZHANG n/a Co File 49'247'000 0.69 - 31.12.2012 n/a
BOSHI FUND MANAGEMEN Multiple Portfolios MF-AGG 49'073'966 0.69 28'252'888 31.12.2012 Investment Advisor
Firm Name Analyst Recommendation Weighting Change Target Price Date Date
GF Securities Co. Ltd. ZOU GE buy 5 M #N/A N/A Not Provided 02.09.2013
PingAn Securities YATING ZHOU buy 5 M #N/A N/A Not Provided 02.09.2013
China Investment Securities LI SHAOMING buy 5 M 16 12 month 02.09.2013
Central China Securities WU JIANXIONG buy 5 M #N/A N/A Not Provided 30.08.2013
Chang Jiang Securities Co. Limited LIU JUN buy 5 M #N/A N/A Not Provided 30.08.2013
Capital Securities Corp ZHU JIXIANG strong buy 5 M 15 Not Provided 28.08.2013
Northeast Securities Co Ltd GAO JIAN buy 5 M #N/A N/A Not Provided 27.08.2013
China International Capital Corp ANSON JINGBIAN NING buy 5 M #N/A N/A Not Provided 27.08.2013
Guotai Junan LI PINKE buy 5 M 16 12 month 27.08.2013
Goldman Sachs WANG YI Buy/Neutral 5 M 13 12 month 26.08.2013
Everbright Securities Co., Ltd ZIPEI TANG accumulate 4 M 15 12 month 18.08.2013
Credit Suisse JINSONG DU outperform 5 M 15 Not Provided 07.08.2013
UBS MICHAEL LI buy 5 M 15 12 month 02.08.2013
SWS Research Co Ltd SIYI HAN buy 5 M #N/A N/A Not Provided 19.07.2013
Hong Yuan Securities HONG JUNHUA buy 5 M 15 6 month 16.07.2013
Qilu Securities Co Ltd DING CHEN buy 5 M #N/A N/A Not Provided 30.06.2013
Guodu Securities Co Ltd ZHANG WEI buy 5 M #N/A N/A Not Provided 24.06.2013
Masterlink Securities DAI KAI-YU buy 5 M 14 Not Provided 19.06.2013
EVA Dimensions DOUG WALTERS sell 1 M #N/A N/A Not Provided 06.06.2013
Citic Securities Co., Ltd CONG CHEN buy 5 M 18 6 month 14.05.2013
Fortune CLSA Securities Limited YANG YAN buy 5 N 15 Not Provided 09.05.2013
Bank of China International TIAN SHIXIN buy 5 M 14 12 month 29.01.2013
Sinolink Securities Co Ltd ZHANG WEI add 4 N #N/A N/A Not Provided 30.10.2012
Great Wall Securities SU XUSHENG strong buy 5 M #N/A N/A Not Provided 30.10.2012
AJ Securities ZUO HONGYING buy 5 M 11 6 month 09.10.2012
China Merchants Securities ZUGUO JIA buy 5 M 11 6 month 12.06.2012
Industrial Securities YU MIAO buy 5 M #N/A N/A Not Provided 19.04.2012
HuaChuang Securities GAO LI buy 5 N #N/A N/A Not Provided 11.01.2012
China Minzu Securities Co Ltd CUI JUAN buy 5 M 11 6 month 02.12.2011
Tebon Securities Co Ltd ZHANG FAN outperform 5 M #N/A N/A Not Provided 08.11.2011
Founder Securities WEI ZHOU add 4 M #N/A N/A Not Provided 07.03.2011
China Galaxy Securities DING WEN speculative buy 4 U #N/A N/A Not Provided 04.02.2010
China Securities Co., Ltd ZHANG CHAOHUI add 4 D 14 Not Provided 02.12.2009
Holdings By:
Poly Real Estate Group Co Ltd ee
Q.M.S Advisors | tel: +41 (0)78 922 08 77 | e-mail: [email protected] |
Page 62
09.09.2013
Bank of Beijing Company Ltd. attracts deposits and offers commercial banking
services. The Bank offers short-, medium- and long-term loans, insurance,
foreign exchange, international settlement, government bonds, and other
products and services.
Latest Fiscal Year: 12/2012
LTM as of: 06/yy
52-Week High (04.02.2013) 10.70
52-Week Low (26.09.2012) 6.60
Daily Volume
8.64
52-Week High % Change -19.25% Dividend Yield -
52-Week Low % Change 30.91% Beta 0.93
% 52 Week Price Range High/Low 35.85% Equity Float 6'239.47
Shares Out 30.06.2013 8'800.2 Short Int -
76'033.38 1 Yr Total Return 24.59%
Total Debt 321'597.22 YTD Return -2.07%
Preferred Stock 0.0 Adjusted BETA 0.929
Minority Interest 73.9 Analyst Recs 17
Cash and Equivalents 370'400.20 Consensus Rating 4.412
Enterprise Value -
Average Volume 5 Day 25'123'510
601169 CH EQUITY YTD Change - Average Volume 30 Day 25'565'080
601169 CH EQUITY YTD % CHANGE - Average Volume 3 Month 26'864'460
LTM-4Q LTM FY+1 FY+2 FQ+1 FQ+2
31.12.2008 31.12.2009 31.12.2010 31.12.2011 31.12.2012 06/yy 06/yy 12/13 Y 12/14 Y 09/13 Q3 12/13 Q4
19'894.7 18'479.5 24'834.6 39'891.9 57'347.9 50'512.9 59'473.7 32'521.5 38'409.2 8'173.0 8'497.0
- - - - - 0.00x 0.00x - - - -
- - - - - 0.0 0.0 - - - -
- - - - - 0.00x 0.00x - - - -
5'417.2 5'633.9 6'803.0 8'946.7 11'674.8 10'247.8 13'074.5 13'732.4 16'272.0 3'497.5 2'431.0
10.24x 21.49x 10.50x 6.44x 6.74x 6.54x 5.36x 5.51x 4.68x 5.14x 4.91x
EBITDA - Long-Term Rating Date -
EBIT - Long-Term Rating -
Operating Margin 52.47% Long-Term Outlook -
Pretax Margin 52.66% Short-Term Rating Date -
Return on Assets 1.14% Short-Term Rating -
Return on Common Equity 18.23%
Return on Capital 3.34% EBITDA/Interest Exp. -
Asset Turnover 0.05% (EBITDA-Capex)/Interest Exp. -
Net Debt/EBITDA -
Gross Margin - Total Debt/EBITDA -
EBITDA Margin -
EBIT Margin - Total Debt/Equity 449.1%
Net Income Margin 41.6% Total Debt/Capital 81.8%
Asset Turnover 0.05
Current Ratio - Net Fixed Asset Turnover 18.14
Quick Ratio - Accounts receivable turnover-days -
Debt to Assets 28.71% Inventory Days -
Tot Debt to Common Equity 449.05% Accounts Payable Turnover Day -
Accounts Receivable Turnover - Cash Conversion Cycle -
Inventory Turnover -
Profitability S&P Issuer Ratings
Credit Ratios
Margin Analysis
Reference
Structure
Net Income
P/E
Market Capitalization
Average Daily Trading Volume
Relative Stock Price Performance
Total Revenue
TEV/Revenue
EBITDA
TEV/EBITDA
Fiscal Year Ended
Bank of Beijing Co LtdPrice/Volume
Valuation Analysis
91'950'322.00
Current Price (9/dd/yy) Market Data
,
.
1
3
5
-,
-.
o!-. l!-. k!-. a!-. g!-0 c!-0 j!-0 Q!-0 j!-0 g!-0 g!-0 Q!-0 o!-0', F
.,', F
1,', F
3,', F
5,', F
-,,', F
-.,', F
-1,', F
-3,', F
0.0
10'000.0
20'000.0
30'000.0
40'000.0
50'000.0
60'000.0
70'000.0
2001 2002 2003 2004 2005 2006 2007 2008 2009 2010 2011 2012
,',,
.',,
1',,
3',,
5',,
-,',,
-.',,
-1',,
-3',,
-5',,
,-',-'.,-, ,-',4'.,-, ,-',-'.,-- ,-',4'.,-- ,-',-'.,-. ,-',4'.,-. ,-',-'.,-0 ,-',4'.,-0
FReTn/CTrThoT/PolhirTlAlcST/ !Rna /eis FReTn/CTrThoT/PolhirTlAlcST/ !Rna /eis
Q.M.S Advisors | tel: +41 (0)78 922 08 77 | e-mail: [email protected] |
Page 63
09.09.2013
Holder Name Portfolio Name Source Amt Held % Out Latest Chg File Dt Inst Type
ING BANK NV n/a Co File 1'200'581'777 13.64 - 31.12.2012 Bank
BEIJING STATE-OWNED n/a Co File 777'796'427 8.84 - 31.12.2012 Investment Advisor
BEIJING ENERGY INVES n/a Co File 446'648'700 5.08 - 31.12.2012 Corporation
HUATAI MOTOR GRP n/a Co File 393'626'991 4.47 - 31.12.2012 Corporation
CITIC SECURITIES CO n/a ULT-AGG 348'209'452 3.96 - 31.12.2012 Investment Advisor
INTERNATIONAL FINANC n/a Co File 301'653'713 3.43 - 31.12.2012 Government
CHINA FOREIGN ECON & n/a Co File 169'106'987 1.92 - 31.12.2012 Corporation
TAIKANG LIFE INSURAN n/a Co File 146'989'709 1.67 - 31.12.2012 Insurance Company
CENTURY GOLDEN RESOU n/a Co File 132'300'000 1.5 - 31.12.2012 Investment Advisor
CHINA HI-TECH GROUP n/a Co File 127'412'427 1.45 - 31.12.2012 Holding Company
STATE DEVELOPMENT & n/a EXCH 89'971'882 1.02 - 26.03.2012 Government
BLACKROCK ASSET MGMT Multiple Portfolios MF-AGG 88'291'828 1 - 30.08.2013 Investment Advisor
HARVEST FUND MANAGEM Multiple Portfolios MF-AGG 73'059'836 0.83 (25'780'936) 31.12.2012 Investment Advisor
CHINA ASSET MANAGEME Multiple Portfolios MF-AGG 66'912'396 0.76 (8'558'388) 31.12.2012 Investment Advisor
CHINA HUANENG GROUP n/a EXCH 56'232'427 0.64 - 26.03.2012 Government
CH SOUTH INDUST ASSE n/a EXCH 56'232'427 0.64 - 26.03.2012 Other
LIQIN INVEST CO n/a EXCH 56'232'427 0.64 - 26.03.2012 Other
XA KAIYUAN INTL INVE n/a EXCH 56'232'427 0.64 - 26.03.2012 Other
E FUND MANAGEMENT Multiple Portfolios MF-AGG 50'903'766 0.58 4'537'112 31.12.2012 Investment Advisor
CHINA SOUTHERN FUND Multiple Portfolios MF-AGG 50'345'854 0.57 44'962'005 30.06.2013 Investment Advisor
Firm Name Analyst Recommendation Weighting Change Target Price Date Date
PingAn Securities GRACE LI buy 5 M #N/A N/A Not Provided 03.09.2013
Northeast Securities Co Ltd YAYUN TANG add 4 M #N/A N/A Not Provided 30.08.2013
Capital Securities Corp XIE JIYONG buy 5 M 10 Not Provided 29.08.2013
China International Capital Corp JIE HUANG buy 5 M #N/A N/A Not Provided 29.08.2013
Guotai Junan GUANHUA QIU buy 5 U 10 Not Provided 20.08.2013
Chang Jiang Securities Co. Limited LIU JUN add 4 M #N/A N/A Not Provided 18.08.2013
GF Securities Co. Ltd. Mu Hua buy 5 M #N/A N/A Not Provided 11.08.2013
Qilu Securities Co Ltd JIAOYI CHENG add 4 M #N/A N/A Not Provided 11.08.2013
UBS JANET SUN buy 5 M 10 12 month 07.08.2013
Central China Securities CHEN XI add 4 M #N/A N/A Not Provided 29.07.2013
SWS Research Co Ltd BECKY XU outperform 5 M #N/A N/A Not Provided 19.07.2013
Standard Chartered DORRIS CHEN in-line 3 M 9 12 month 16.07.2013
Goldman Sachs NING MA neutral/neutral 3 M 8 12 month 12.06.2013
Hong Yuan Securities ZHANG JIXIU add 4 M 8 6 month 04.06.2013
Everbright Securities Co., Ltd SHEN WEI accumulate 4 M 10 12 month 02.06.2013
Tebon Securities Co Ltd GENDA XIA outperform 5 N 10 6 month 02.05.2013
Deutsche Bank TRACY YU not rated #N/A N/A M #N/A N/A Not Provided 26.04.2013
Citic Securities Co., Ltd ZHU YAN overweight 5 M 10 6 month 22.01.2013
China Merchants Securities LUO YI strong buy 5 M #N/A N/A Not Provided 23.07.2012
China Securities Co., Ltd #N/A N/A buy 5 M 10 Not Provided 25.06.2012
Rising Securities Co.,LTD XIE AIHONG neutral 3 D #N/A N/A Not Provided 20.12.2011
China Investment Securities ZHANG ZHONGYANG buy 5 M #N/A N/A Not Provided 02.12.2011
BOCOM International Holdings LI SHANSHAN long-term buy 5 M #N/A N/A Not Provided 07.11.2011
Industrial Securities YIDONG ZHANG buy 5 M #N/A N/A Not Provided 30.08.2011
Great Wall Securities WU XIAOLING neutral 3 M #N/A N/A Not Provided 23.05.2011
China Minzu Securities Co Ltd ZHANG JING add 4 D 13 6 month 12.04.2011
Guodu Securities Co Ltd DENG TING buy 5 M 13 6 month 21.02.2011
China Galaxy Securities YE YUNYAN speculative buy 4 M #N/A N/A Not Provided 11.05.2010
HuaChuang Securities GAO LI buy 5 N #N/A N/A Not Provided 06.04.2010
Bank of China International SUN PENG hold 3 D 13 Not Provided 26.02.2010
Holdings By:
Bank of Beijing Co Ltd ee
Q.M.S Advisors | tel: +41 (0)78 922 08 77 | e-mail: [email protected] |
Page 64
09.09.2013
Inner Mongolia Baotou Steel Rare-Earth Hi-Tech Co., Ltd. explores and refines
rare earth concentrates and processes rare earth products. The Company also
produces and exports rechargeable batteries and mineral products.
Latest Fiscal Year: 12/2012
LTM as of: 06/yy
52-Week High (21.12.2012) 38.84
52-Week Low (04.07.2013) 19.32
Daily Volume
29.39
52-Week High % Change -24.33% Dividend Yield -
52-Week Low % Change 52.12% Beta 1.32
% 52 Week Price Range High/Low 48.10% Equity Float 1'220.59
Shares Out 30.06.2013 2'422.0 Short Int -
71'183.87 1 Yr Total Return -17.22%
Total Debt 6'184.18 YTD Return -20.96%
Preferred Stock 0.0 Adjusted BETA 1.319
Minority Interest 3'214.0 Analyst Recs 15
Cash and Equivalents 2'957.60 Consensus Rating 3.467
Enterprise Value 76'567.03
Average Volume 5 Day 38'447'520
600111 CH EQUITY YTD Change - Average Volume 30 Day 64'506'520
600111 CH EQUITY YTD % CHANGE - Average Volume 3 Month 52'979'840
LTM-4Q LTM FY+1 FY+2 FQ+1 FQ+2
31.12.2008 31.12.2009 31.12.2010 31.12.2011 31.12.2012 06/yy 06/yy 12/13 Y 12/14 Y 09/13 Q3 12/13 Q4
3'204.2 2'570.7 5'215.7 11'370.3 9'135.3 11'672.6 7'740.3 8'406.1 9'425.6 2'098.0 1'417.0
2.30x 9.30x 11.56x 4.35x 10.63x 26.18x 41.63x 8.74x 7.66x - -
495.8 366.1 2'155.8 - 2'467.3 0.0 0.0 2'497.8 3'123.5 - -
14.83x 65.28x 27.97x - 39.37x 0.00x 0.00x 30.65x 24.51x - -
167.1 55.8 750.7 3'478.4 1'510.4 3'071.3 991.9 1'434.5 1'641.2 411.0 459.0
33.91x 397.39x 76.82x 13.11x 60.02x 31.11x 50.93x 50.41x 43.87x 39.72x 36.51x
EBITDA 2'467.26 Long-Term Rating Date -
EBIT 2'257.34 Long-Term Rating -
Operating Margin 24.71% Long-Term Outlook -
Pretax Margin 22.94% Short-Term Rating Date -
Return on Assets 5.38% Short-Term Rating -
Return on Common Equity 14.10%
Return on Capital - EBITDA/Interest Exp. 9.30
Asset Turnover 0.42% (EBITDA-Capex)/Interest Exp. 7.56
Net Debt/EBITDA -
Gross Margin 34.1% Total Debt/EBITDA -
EBITDA Margin -
EBIT Margin 6.1% Total Debt/Equity 92.0%
Net Income Margin 16.5% Total Debt/Capital 38.4%
Asset Turnover 0.42
Current Ratio 1.65 Net Fixed Asset Turnover 3.00
Quick Ratio 0.50 Accounts receivable turnover-days 68.89
Debt to Assets 35.04% Inventory Days 414.68
Tot Debt to Common Equity 92.03% Accounts Payable Turnover Day 75.26
Accounts Receivable Turnover 5.30 Cash Conversion Cycle 394.16
Inventory Turnover 0.88
Fiscal Year Ended
Inner Mongolia Baotou Steel Rare-Earth Hi-Tech Co LtdPrice/Volume
Valuation Analysis
49'248'542.00
Current Price (9/dd/yy) Market Data
Net Income
P/E
Market Capitalization
Average Daily Trading Volume
Relative Stock Price Performance
Total Revenue
TEV/Revenue
EBITDA
TEV/EBITDA
Profitability S&P Issuer Ratings
Credit Ratios
Margin Analysis
Reference
Structure
,
2
-,
-2
.,
.2
0,
02
1,
o!-. l!-. k!-. a!-. g!-0 c!-0 j!-0 Q!-0 j!-0 g!-0 g!-0 Q!-0 o!-0', F.,', F1,', F3,', F5,', F-,,', F-.,', F-1,', F-3,', F-5,', F
0.0
2'000.0
4'000.0
6'000.0
8'000.0
10'000.0
12'000.0
2001 2002 2003 2004 2005 2006 2007 2008 2009 2010 2011 2012
,',,
2,',,
-,,',,
-2,',,
.,,',,
.2,',,
0,,',,
,-',-'.,-, ,-',4'.,-, ,-',-'.,-- ,-',4'.,-- ,-',-'.,-. ,-',4'.,-. ,-',-'.,-0 ,-',4'.,-0
FReTn/CTrThoT/PolhirTlAlcST/ !Rna /eis FReTn/CTrThoT/PolhirTlAlcST/ !Rna /eis
Q.M.S Advisors | tel: +41 (0)78 922 08 77 | e-mail: [email protected] |
Page 65
09.09.2013
Holder Name Portfolio Name Source Amt Held % Out Latest Chg File Dt Inst Type
BAOTOU IRON AND STEE n/a Co File 942'574'146 38.92 - 31.12.2012 Corporation
JIAXIN (HK) CO LTD n/a Co File 239'050'000 9.87 - 31.12.2012 Corporation
BLACKROCK ASSET MGMT Multiple Portfolios MF-AGG 24'474'928 1.01 - 30.08.2013 Investment Advisor
HARVEST FUND MANAGEM Multiple Portfolios MF-AGG 17'552'422 0.72 (1'634'235) 31.12.2012 Investment Advisor
E FUND MANAGEMENT Multiple Portfolios MF-AGG 12'953'151 0.53 669'050 31.12.2012 Investment Advisor
CHINA ASSET MANAGEME Multiple Portfolios MF-AGG 12'585'821 0.52 (5'579'060) 31.12.2012 Investment Advisor
BAOGANG INTEGRATED E n/a Co File 12'000'000 0.5 - 31.12.2012 Holding Company
CSOP ASSET MANAGEMEN Multiple Portfolios MF-AGG 9'462'841 0.39 - 02.09.2013 Investment Advisor
UBS n/a ULT-AGG 8'571'180 0.35 - 31.12.2012 Unclassified
HUATAI-PINEBRIDGE FU Multiple Portfolios MF-AGG 7'766'201 0.32 1'085'945 31.12.2012 Investment Advisor
ZHOU LELI n/a Co File 7'465'905 0.31 - 31.12.2012 n/a
UBS SDIC FUND MANAGE Multiple Portfolios MF-AGG 6'655'440 0.27 (2'586'744) 31.12.2012 Investment Advisor
FIL LIMITED n/a ULT-AGG 5'778'599 0.24 10'464 31.10.2012 Investment Advisor
HUAAN FUND MANAGEMEN Multiple Portfolios MF-AGG 4'730'313 0.2 (316'650) 31.12.2012 Investment Advisor
DACHENG FUND MANAGME Multiple Portfolios MF-AGG 3'915'066 0.16 (6'924'972) 31.12.2012 Investment Advisor
HFT INVESTMENT MANAG Multiple Portfolios MF-AGG 3'381'409 0.14 2'677'535 31.12.2012 Investment Advisor
MANULIFE TEDA FUND M Multiple Portfolios MF-AGG 3'065'858 0.13 3'052'744 31.12.2012 Investment Advisor
CHINA ASSET MANAGEME Multiple Portfolios MF-AGG 2'904'368 0.12 - 02.09.2013 Investment Advisor
ZHONG HAI FUND MANAG Multiple Portfolios MF-AGG 2'768'452 0.11 2'605'786 31.12.2012 Investment Advisor
YINHUA FUND MANAGEME Multiple Portfolios MF-AGG 2'768'339 0.11 (3'845'416) 31.12.2012 Investment Advisor
Firm Name Analyst Recommendation Weighting Change Target Price Date Date
GF Securities Co. Ltd. GUOXIAN JU buy 5 M #N/A N/A Not Provided 01.09.2013
Credit Suisse VINCENT CHAN underperform 1 M 24 Not Provided 26.08.2013
Capital Securities Corp LI XIAOLU neutral 3 M 29 Not Provided 19.08.2013
China International Capital Corp CAI HONGYU hold 3 M #N/A N/A Not Provided 16.08.2013
Guotai Junan YONGLIANG SANG buy 5 M 36 12 month 16.08.2013
Everbright Securities Co., Ltd WANG QIANMING accumulate 4 U 33 6 month 16.08.2013
Founder Securities LIU WEIYUAN add 4 M #N/A N/A Not Provided 16.08.2013
Fortune CLSA Securities Limited JIE LI sell 1 M 17 12 month 16.08.2013
SWS Research Co Ltd PEGGY YE outperform 5 M #N/A N/A Not Provided 19.07.2013
UBS HAOXIANG LIN neutral 3 D 31 12 month 02.04.2013
Northeast Securities Co Ltd CHEN BINGHUI neutral 3 D #N/A N/A Not Provided 02.04.2013
Hong Yuan Securities MIN DAN add 4 M #N/A N/A Not Provided 30.03.2013
Bank of China International LE YUKUN buy 5 N #N/A N/A Not Provided 31.12.2012
Masterlink Securities DAI KAI-YU hold 3 N 5 6 month 01.11.2012
HuaChuang Securities GAO LI neutral 3 M #N/A N/A Not Provided 21.10.2012
AJ Securities ZHANG ZHIPENG buy 5 M #N/A N/A Not Provided 28.06.2012
China Securities Co., Ltd ZHANG FANG add 4 M 65 Not Provided 25.06.2012
Rising Securities Co.,LTD ZHAO YUE outperform 5 M #N/A N/A Not Provided 18.06.2012
China Merchants Securities WANG XIAODAN buy 5 M #N/A N/A Not Provided 11.06.2012
Tebon Securities Co Ltd TEAM COVERAGE buy 5 U #N/A N/A Not Provided 08.04.2012
Great Wall Securities LIU FEI buy 5 N #N/A N/A Not Provided 30.03.2012
Central China Securities HE WEIJIANG monitored #N/A N/A N #N/A N/A Not Provided 09.08.2011
China Minzu Securities Co Ltd GUAN JIANXIN buy 5 M 30 6 month 07.12.2010
Citic Securities Co., Ltd LI ZHUIYANG add 4 M #N/A N/A Not Provided 18.06.2008
Holdings By:
Inner Mongolia Baotou Steel Rare-Earth Hi-Tech Co Ltd ee
Q.M.S Advisors | tel: +41 (0)78 922 08 77 | e-mail: [email protected] |
Page 66
09.09.2013
Baoshan Iron & Steel Co., Ltd. manufactures and markets a variety of iron and
steel products including cold rolled plates and coils, hot rolled plates and
coils, seamless steel tubes, high-speed wire rods, and steel billets. The
company also operates in related energy production businesses.
Latest Fiscal Year: 12/2012
LTM as of: 06/yy
52-Week High (08.02.2013) 5.21
52-Week Low (25.06.2013) 3.85
Daily Volume
4.62
52-Week High % Change -11.32% Dividend Yield -
52-Week Low % Change 20.00% Beta 0.72
% 52 Week Price Range High/Low 47.06% Equity Float 3'057.25
Shares Out 30.06.2013 16'471.7 Short Int -
76'099.37 1 Yr Total Return 5.95%
Total Debt 57'699.51 YTD Return -2.50%
Preferred Stock 0.0 Adjusted BETA 0.718
Minority Interest 5'954.5 Analyst Recs 21
Cash and Equivalents 8'922.20 Consensus Rating 4.095
Enterprise Value 135'857.99
Average Volume 5 Day 60'521'830
600019 CH EQUITY YTD Change - Average Volume 30 Day 26'612'790
600019 CH EQUITY YTD % CHANGE - Average Volume 3 Month 23'767'310
LTM-4Q LTM FY+1 FY+2 FQ+1 FQ+2
31.12.2008 31.12.2009 31.12.2010 31.12.2011 31.12.2012 06/yy 06/yy 12/13 Y 12/14 Y 09/13 Q3 12/13 Q4
199'418.9 147'955.6 201'888.4 222'415.3 191'204.2 209'472.7 189'240.8 179'762.9 184'948.4 44'568.5 44'892.0
0.72x 1.57x 0.86x 0.72x 0.72x 2.92x 2.83x 0.64x 0.58x - -
24'383.2 21'382.5 29'878.5 21'441.5 16'884.1 0.0 0.0 18'464.8 20'675.0 4'396.0 4'770.0
5.86x 10.83x 5.84x 7.47x 8.19x 0.00x 0.00x 7.36x 6.57x 7.04x 6.96x
6'459.2 5'816.2 12'868.8 7'362.0 10'386.4 11'892.5 4'479.2 6'601.6 8'021.0 1'437.0 1'178.0
12.54x 29.27x 8.75x 11.55x 8.15x 6.36x 14.43x 11.52x 9.63x 11.13x 10.74x
EBITDA 16'884.15 Long-Term Rating Date 24.08.2009
EBIT 5'480.27 Long-Term Rating -
Operating Margin 2.87% Long-Term Outlook -
Pretax Margin 6.87% Short-Term Rating Date -
Return on Assets 1.98% Short-Term Rating -
Return on Common Equity 4.05%
Return on Capital - EBITDA/Interest Exp. 8.12
Asset Turnover 0.83% (EBITDA-Capex)/Interest Exp. 2.18
Net Debt/EBITDA -
Gross Margin 7.8% Total Debt/EBITDA -
EBITDA Margin -
EBIT Margin 3.8% Total Debt/Equity 51.8%
Net Income Margin 5.4% Total Debt/Capital 33.0%
Asset Turnover 0.83
Current Ratio 0.84 Net Fixed Asset Turnover 1.77
Quick Ratio 0.36 Accounts receivable turnover-days 37.25
Debt to Assets 26.92% Inventory Days 69.82
Tot Debt to Common Equity 51.80% Accounts Payable Turnover Day 44.38
Accounts Receivable Turnover 9.80 Cash Conversion Cycle 66.35
Inventory Turnover 5.23
Fiscal Year Ended
Baoshan Iron & Steel Co LtdPrice/Volume
Valuation Analysis
79'672'763.00
Current Price (9/dd/yy) Market Data
Net Income
P/E
Market Capitalization
Average Daily Trading Volume
Relative Stock Price Performance
Total Revenue
TEV/Revenue
EBITDA
TEV/EBITDA
Profitability S&P Issuer Ratings
Credit Ratios
Margin Analysis
Reference
Structure
,
-
.
0
1
2
3
o!-. l!-. k!-. a!-. g!-0 c!-0 j!-0 Q!-0 j!-0 g!-0 g!-0 Q!-0 o!-0', F
.,', F
1,', F
3,', F
5,', F
-,,', F
-.,', F
-1,', F
0.0
50'000.0
100'000.0
150'000.0
200'000.0
250'000.0
2001 2002 2003 2004 2005 2006 2007 2008 2009 2010 2011 2012
,',,
.',,
1',,
3',,
5',,
-,',,
-.',,
,-',-'.,-, ,-',4'.,-, ,-',-'.,-- ,-',4'.,-- ,-',-'.,-. ,-',4'.,-. ,-',-'.,-0 ,-',4'.,-0
FReTn/CTrThoT/PolhirTlAlcST/ !Rna /eis FReTn/CTrThoT/PolhirTlAlcST/ !Rna /eis
Q.M.S Advisors | tel: +41 (0)78 922 08 77 | e-mail: [email protected] |
Page 67
09.09.2013
Holder Name Portfolio Name Source Amt Held % Out Latest Chg File Dt Inst Type
BAOSTEEL GROUP CORP n/a Co File 13'128'825'267 79.71 - 31.12.2012 Government
BLACKROCK ASSET MGMT Multiple Portfolios MF-AGG 77'329'118 0.47 - 30.08.2013 Investment Advisor
FRANKLIN TEMPLETON S Multiple Portfolios MF-AGG 65'753'429 0.4 65'095'829 31.12.2012 Investment Advisor
ZJG DUTY FREE ZONE Q n/a Co File 63'419'861 0.39 - 31.12.2012 Corporation
RUGAO CHANGRONG ORE n/a Co File 62'777'182 0.38 - 31.12.2012 Other
HARVEST FUND MANAGEM Multiple Portfolios MF-AGG 52'206'234 0.32 (27'575'353) 31.12.2012 Investment Advisor
GOVERNMENT OF SINGAP n/a ULT-AGG 52'009'386 0.32 - 31.12.2012 Government
CHINA ASSET MANAGEME Multiple Portfolios MF-AGG 49'609'232 0.3 (17'651'437) 31.12.2012 Investment Advisor
ZJG DUTY FREE ZONE L n/a Co File 48'894'600 0.3 - 31.12.2012 Investment Advisor
ZHANGJIAGANG FTZ RON n/a Co File 45'524'951 0.28 - 31.12.2012 Other
ZJG DUTY FREE ZONE R n/a Co File 42'120'356 0.26 - 31.12.2012 Corporation
CHINA UNIVERSAL ASSE Multiple Portfolios MF-AGG 41'892'033 0.25 34'144'116 02.09.2013 Investment Advisor
ZJG HONGDA TRANS CO n/a Co File 41'544'158 0.25 - 31.12.2012 Corporation
NINGBO HONGGUANG TRA n/a Co File 40'804'594 0.25 - 31.12.2012 Corporation
E FUND MANAGEMENT Multiple Portfolios MF-AGG 34'968'787 0.21 (31'256'103) 31.12.2012 Investment Advisor
FULLGOAL FUND MANAGE Multiple Portfolios MF-AGG 31'992'485 0.19 (391'985) 31.12.2012 Investment Advisor
CSOP ASSET MANAGEMEN Multiple Portfolios MF-AGG 30'760'764 0.19 - 02.09.2013 Investment Advisor
HUATAI-PINEBRIDGE FU Multiple Portfolios MF-AGG 29'398'708 0.18 (3'173'603) 31.12.2012 Investment Advisor
BOSHI FUND MANAGEMEN Multiple Portfolios MF-AGG 21'320'401 0.13 (5'860'824) 31.12.2012 Investment Advisor
YINHUA FUND MANAGEME Multiple Portfolios MF-AGG 21'105'640 0.13 (61'298'547) 31.12.2012 Investment Advisor
Firm Name Analyst Recommendation Weighting Change Target Price Date Date
Chang Jiang Securities Co. Limited LIU YUANRUI buy 5 M #N/A N/A Not Provided 02.09.2013
Capital Securities Corp LI XIAOLU buy 5 M 5 Not Provided 27.08.2013
Morgan Stanley RACHEL L ZHANG Equalwt/In-Line 3 M 5 12 month 26.08.2013
Credit Suisse TRINA CHEN neutral 3 M 4 Not Provided 26.08.2013
HSBC CHRIS CHEN overweight 5 U 6 Not Provided 26.08.2013
GF Securities Co. Ltd. FENG GANGYONG buy 5 M 7 12 month 26.08.2013
China International Capital Corp YUE DING buy 5 M #N/A N/A Not Provided 26.08.2013
JPMorgan DANIEL KANG overweight 5 M 5 12 month 25.08.2013
Masterlink Securities SARAH WANG hold 3 M 5 Not Provided 20.08.2013
Jefferies PO WEI buy 5 M 6 12 month 05.08.2013
VTB Capital WIKTOR BIELSKI hold 3 M 5 12 month 05.08.2013
SWS Research Co Ltd KERRY HE buy 5 M #N/A N/A Not Provided 22.07.2013
UBS JANET SUN buy 5 M 6 12 month 17.07.2013
Macquarie LAURA SHI neutral 3 M 4 12 month 15.07.2013
Qilu Securities Co Ltd DU HUI add 4 M #N/A N/A Not Provided 30.06.2013
EVA Dimensions TIMOTHY STANISH underweight 1 M #N/A N/A Not Provided 06.06.2013
Goldman Sachs JULIAN ZHU Buy/Neutral 5 M 6 12 month 24.01.2013
Bank of China International HANG YIJUN hold 3 M #N/A N/A Not Provided 23.01.2013
IBT Securities Co Ltd PETER TZENG neutral 3 N #N/A N/A Not Provided 26.12.2012
Hong Yuan Securities ZHAO LIMING buy 5 N #N/A N/A Not Provided 28.08.2012
Guodu Securities Co Ltd WANG SHUBAO buy 5 M #N/A N/A Not Provided 28.08.2012
China Merchants Securities ZHANG SHIBAO buy 5 M #N/A N/A Not Provided 19.07.2012
China Securities Co., Ltd WANG ZHE buy 5 U 6 Not Provided 25.06.2012
Citic Securities Co., Ltd YUJIAO JIANG buy 5 M #N/A N/A Not Provided 18.05.2012
Industrial Securities LAN JIE buy 5 M #N/A N/A Not Provided 12.04.2012
HuaChuang Securities HAN ZHENGUO buy 5 M #N/A N/A Not Provided 04.04.2012
Tebon Securities Co Ltd TEAM COVERAGE buy 5 M 9 6 month 18.02.2012
China Investment Securities CHU XUELIANG buy 5 M #N/A N/A Not Provided 11.01.2012
Northeast Securities Co Ltd XIFENG PAN buy 5 N #N/A N/A Not Provided 14.03.2011
China Galaxy Securities SUN YONG speculative buy 4 M #N/A N/A Not Provided 18.05.2010
Holdings By:
Baoshan Iron & Steel Co Ltd ee
Q.M.S Advisors | tel: +41 (0)78 922 08 77 | e-mail: [email protected] |
Page 68
09.09.2013
China United Network Communications Limited provides a variety of
telecommunication services, including GSM and CDMA wireless telecommunication
services, international and domestic long distance communication services, data
communication and Internet services, as well as paging services.
Latest Fiscal Year: 12/2012
LTM as of: 06/yy
52-Week High (10.09.2012) 3.87
52-Week Low (25.06.2013) 2.97
Daily Volume
3.31
52-Week High % Change -14.47% Dividend Yield -
52-Week Low % Change 11.45% Beta 0.94
% 52 Week Price Range High/Low 31.11% Equity Float 7'836.18
Shares Out 30.06.2013 21'196.6 Short Int -
70'160.73 1 Yr Total Return -13.14%
Total Debt 104'405.99 YTD Return -4.20%
Preferred Stock 0.0 Adjusted BETA 0.943
Minority Interest 139'937.0 Analyst Recs 12
Cash and Equivalents 18'320.08 Consensus Rating 4.167
Enterprise Value 294'215.19
Average Volume 5 Day 84'864'720
600050 CH EQUITY YTD Change - Average Volume 30 Day #########
600050 CH EQUITY YTD % CHANGE - Average Volume 3 Month 96'107'230
LTM-4Q LTM FY+1 FY+2 FQ+1 FQ+2
31.12.2008 31.12.2009 31.12.2010 31.12.2011 31.12.2012 06/yy 06/yy 12/13 Y 12/14 Y 09/13 Q3 12/13 Q4
159'487.0 153'881.8 171'370.0 209'166.9 248'926.0 229'462.0 271'542.9 296'883.6 340'139.4 75'005.0 73'790.0
1.67x 2.32x 1.75x 1.44x 1.21x 5.18x 4.33x 1.05x 0.90x - -
70'927.3 60'190.4 61'766.1 64'768.2 73'936.0 0.0 0.0 70'110.3 82'920.5 - -
3.76x 5.93x 4.87x 4.65x 4.06x 0.00x 0.00x 4.20x 3.55x - -
20'235.9 3'137.0 1'234.5 1'412.2 2'368.1 1'696.1 2'981.0 3'552.3 5'123.6 815.0 734.0
5.27x 49.26x 91.92x 78.68x 31.33x 46.50x 22.18x 20.18x 14.21x - -
EBITDA 73'936.03 Long-Term Rating Date -
EBIT 10'997.50 Long-Term Rating -
Operating Margin 4.42% Long-Term Outlook -
Pretax Margin 3.83% Short-Term Rating Date -
Return on Assets 0.61% Short-Term Rating -
Return on Common Equity 4.14%
Return on Capital - EBITDA/Interest Exp. 15.98
Asset Turnover 0.55% (EBITDA-Capex)/Interest Exp. -3.64
Net Debt/EBITDA -
Gross Margin 28.0% Total Debt/EBITDA -
EBITDA Margin -
EBIT Margin 5.0% Total Debt/Equity 144.4%
Net Income Margin 1.0% Total Debt/Capital 33.0%
Asset Turnover 0.55
Current Ratio 0.16 Net Fixed Asset Turnover 0.65
Quick Ratio 0.11 Accounts receivable turnover-days 21.21
Debt to Assets 20.14% Inventory Days 10.13
Tot Debt to Common Equity 144.41% Accounts Payable Turnover Day 175.25
Accounts Receivable Turnover 17.21 Cash Conversion Cycle -167.05
Inventory Turnover 36.03
Profitability S&P Issuer Ratings
Credit Ratios
Margin Analysis
Reference
Structure
Net Income
P/E
Market Capitalization
Average Daily Trading Volume
Relative Stock Price Performance
Total Revenue
TEV/Revenue
EBITDA
TEV/EBITDA
Fiscal Year Ended
China United Network Communications LtdPrice/Volume
Valuation Analysis
191'148'231.00
Current Price (9/dd/yy) Market Data
,--..00112
o!-. l!-. k!-. a!-. g!-0 c!-0 j!-0 Q!-0 j!-0 g!-0 g!-0 Q!-0 o!-0', F
2,', F
-,,', F
-2,', F
.,,', F
.2,', F
0,,', F
0.0
50'000.0
100'000.0
150'000.0
200'000.0
250'000.0
300'000.0
2001 2002 2003 2004 2005 2006 2007 2008 2009 2010 2011 2012
,',,
,'2,
-',,
-'2,
.',,
.'2,
0',,
,-',-'.,-, ,-',4'.,-, ,-',-'.,-- ,-',4'.,-- ,-',-'.,-. ,-',4'.,-. ,-',-'.,-0 ,-',4'.,-0
FReTn/CTrThoT/PolhirTlAlcST/ !Rna /eis FReTn/CTrThoT/PolhirTlAlcST/ !Rna /eis
Q.M.S Advisors | tel: +41 (0)78 922 08 77 | e-mail: [email protected] |
Page 69
09.09.2013
Holder Name Portfolio Name Source Amt Held % Out Latest Chg File Dt Inst Type
CHINA UNITED TELECOM n/a EXCH 13'211'103'654 62.33 - 03.05.2013 Government
CHINA ASSET MANAGEME Multiple Portfolios MF-AGG 275'054'941 1.3 83'969'005 30.06.2013 Investment Advisor
BLACKROCK ASSET MGMT Multiple Portfolios MF-AGG 170'224'712 0.8 - 30.08.2013 Investment Advisor
PENGHUA FUND MANAGEM Multiple Portfolios MF-AGG 165'578'761 0.78 (8'096'455) 30.06.2013 Investment Advisor
CHINA LIFE INSURANCE n/a ULT-AGG 135'119'092 0.64 - 31.12.2012 Government
CHANGSHENG FUND MANA Multiple Portfolios MF-AGG 102'494'286 0.48 166'655 31.12.2012 Investment Advisor
HARVEST FUND MANAGEM Multiple Portfolios MF-AGG 84'493'930 0.4 (43'475'991) 30.06.2013 Investment Advisor
ZHANG DAZHONG n/a Co File 78'237'247 0.37 - 31.12.2012 n/a
SOCIAL SECURITY FUND n/a Co File 71'048'325 0.34 - 31.12.2012 Government
CSOP ASSET MANAGEMEN Multiple Portfolios MF-AGG 66'228'042 0.31 - 02.09.2013 Investment Advisor
HUAAN FUND MANAGEMEN Multiple Portfolios MF-AGG 62'308'096 0.29 20'363'049 30.06.2013 Investment Advisor
E FUND MANAGEMENT Multiple Portfolios MF-AGG 55'087'676 0.26 (9'305'000) 31.12.2012 Investment Advisor
FRANKLIN TEMPLETON S Multiple Portfolios MF-AGG 46'386'307 0.22 44'750'002 31.12.2012 Investment Advisor
HUATAI-PINEBRIDGE FU Multiple Portfolios MF-AGG 39'080'418 0.18 221'500 31.12.2012 Investment Advisor
YINHUA FUND MANAGEME Multiple Portfolios MF-AGG 38'655'249 0.18 (118'326'636) 31.12.2012 Investment Advisor
FULLGOAL FUND MANAGE Multiple Portfolios MF-AGG 35'080'363 0.17 34'556'877 31.12.2012 Investment Advisor
CHINA MERCHANTS FUND Multiple Portfolios MF-AGG 32'004'233 0.15 10'200'000 31.12.2012 Investment Advisor
BOSHI FUND MANAGEMEN Multiple Portfolios MF-AGG 29'066'151 0.14 (28'653'706) 31.12.2012 Investment Advisor
CHINA SOUTHERN FUND Multiple Portfolios MF-AGG 22'834'970 0.11 10'525'067 30.06.2013 Investment Advisor
TIANTONG ASSET MANAG Multiple Portfolios MF-AGG 22'601'854 0.11 5'358'498 30.06.2013 Investment Advisor
Firm Name Analyst Recommendation Weighting Change Target Price Date Date
Masterlink Securities LV HAN buy 5 M 4 6 month 02.09.2013
China Investment Securities QI NING strong buy 5 M 5 12 month 15.08.2013
UBS WANG JINJIN buy 5 M 5 12 month 14.08.2013
Capital Securities Corp HU JIAMING hold 3 M 4 Not Provided 12.08.2013
Qilu Securities Co Ltd YANG HONG buy 5 M 4 12 month 11.08.2013
Everbright Securities Co., Ltd ZHOU LIQIAN buy 5 M 5 6 month 09.08.2013
Chang Jiang Securities Co. Limited ZHIJIAN CHEN buy 5 M #N/A N/A Not Provided 08.08.2013
SWS Research Co Ltd WANG JING neutral 3 M #N/A N/A Not Provided 19.07.2013
Goldman Sachs DONALD LU neutral/neutral 3 D 4 12 month 23.05.2013
HuaChuang Securities MA JUN strong buy 5 M 5 6 month 21.02.2013
EVA Dimensions ANDREW S ZAMFOTIS sell 1 M #N/A N/A Not Provided 15.01.2013
Guodu Securities Co Ltd DENG TING buy 5 M #N/A N/A Not Provided 08.10.2012
PingAn Securities LU SHAN buy 5 M #N/A N/A Not Provided 24.08.2012
Bank of China International YANG TONY buy 5 M 6 Not Provided 03.08.2012
China Merchants Securities ZHANG LIANGYONG strong buy 5 M 5 6 month 23.07.2012
China Securities Co., Ltd DAI CHUNRONG add 4 M 6 Not Provided 25.06.2012
Great Wall Securities LIU SHEN strong buy 5 M 6 6 month 26.04.2012
Industrial Securities LIU LIANG buy 5 M #N/A N/A Not Provided 11.04.2012
Founder Securities WANG HUI add 4 M 8 6 month 23.03.2012
Citic Securities Co., Ltd JUNTAO GONG buy 5 M 8 6 month 29.12.2011
Tebon Securities Co Ltd TEAM COVERAGE buy 5 M #N/A N/A Not Provided 20.12.2011
Northeast Securities Co Ltd ZHOU SILI buy 5 N #N/A N/A Not Provided 05.12.2011
China Minzu Securities Co Ltd WANG XIAOYAN buy 5 M 7 6 month 16.05.2011
JPMorgan LUCY LIU neutral 3 M 7 Not Provided 27.04.2011
China Galaxy Securities XU YAOWEN speculative buy 4 N #N/A N/A Not Provided 26.03.2010
Hong Yuan Securities HU YING buy 5 N #N/A N/A Not Provided 05.12.2009
Holdings By:
China United Network Communications Ltd ee
Q.M.S Advisors | tel: +41 (0)78 922 08 77 | e-mail: [email protected] |
Page 70
09.09.2013
China Shipbuilding Industry Company Limited designs, manufactures, sells and
leases ship parts. The Company's products include engines and parts, auxiliay
engines and transportation equipment.
Latest Fiscal Year: 12/2012
LTM as of: 06/yy
52-Week High (06.03.2013) 5.63
52-Week Low (21.11.2012) 3.91
Daily Volume
-
52-Week High % Change - Dividend Yield -
52-Week Low % Change - Beta -
% 52 Week Price Range High/Low 35.47% Equity Float 3'297.69
Shares Out 31.03.2013 14'667.7 Short Int -
- 1 Yr Total Return -
Total Debt 67'467.53 YTD Return -
Preferred Stock 0.0 Adjusted BETA -
Minority Interest 2'636.1 Analyst Recs 5
Cash and Equivalents 67'268.15 Consensus Rating 4.600
Enterprise Value -
Average Volume 5 Day 0
601989 CH EQUITY YTD Change - Average Volume 30 Day 0
601989 CH EQUITY YTD % CHANGE - Average Volume 3 Month 0
LTM-4Q LTM FY+1 FY+2 FQ+1 FQ+2
31.12.2008 31.12.2009 31.12.2010 31.12.2011 31.12.2012 06/yy 06/yy 12/13 Y 12/14 Y 09/13 Q3 12/13 Q4
15'974.4 18'463.7 53'971.6 64'643.8 58'343.3 61'869.1 54'313.5 59'712.7 64'777.0 - -
- 2.01x 0.87x 0.96x 1.25x 4.70x 4.12x - - - -
1'536.7 1'878.5 5'530.0 6'149.9 4'385.5 0.0 0.0 - - - -
- 19.75x 8.49x 10.10x 16.60x 0.00x 0.00x - - - -
1'220.9 1'490.5 4'321.0 5'019.7 3'577.1 4'076.9 2'460.6 3'689.3 4'100.7 - -
- 25.19x 40.66x 14.60x 19.88x 18.67x 0.00x - - - -
EBITDA 4'385.51 Long-Term Rating Date -
EBIT 2'573.59 Long-Term Rating -
Operating Margin 4.41% Long-Term Outlook -
Pretax Margin 7.55% Short-Term Rating Date -
Return on Assets 1.39% Short-Term Rating -
Return on Common Equity 5.92%
Return on Capital - EBITDA/Interest Exp. 1.79
Asset Turnover 0.31% (EBITDA-Capex)/Interest Exp. 0.36
Net Debt/EBITDA -
Gross Margin 13.0% Total Debt/EBITDA -
EBITDA Margin -
EBIT Margin 1.6% Total Debt/Equity 161.4%
Net Income Margin 6.1% Total Debt/Capital 60.3%
Asset Turnover 0.31
Current Ratio 1.36 Net Fixed Asset Turnover 1.41
Quick Ratio 0.93 Accounts receivable turnover-days 183.82
Debt to Assets 37.66% Inventory Days 219.80
Tot Debt to Common Equity 161.37% Accounts Payable Turnover Day 184.35
Accounts Receivable Turnover 1.99 Cash Conversion Cycle 199.34
Inventory Turnover 1.66
Fiscal Year Ended
China Shipbuilding Industry Co LtdPrice/Volume
Valuation Analysis
0.00
Current Price (9/dd/yy) Market Data
Net Income
P/E
Market Capitalization
Average Daily Trading Volume
Relative Stock Price Performance
Total Revenue
TEV/Revenue
EBITDA
TEV/EBITDA
Profitability S&P Issuer Ratings
Credit Ratios
Margin Analysis
Reference
Structure
,
-
.
0
1
2
3
o!-. l!-. k!-. a!-. g!-0 c!-0 j!-0 Q!-0 j!-0', F
.,', F
1,', F
3,', F
5,', F
-,,', F
-.,', F
-1,', F
-3,', F
0.0
10'000.0
20'000.0
30'000.0
40'000.0
50'000.0
60'000.0
70'000.0
2001 2002 2003 2004 2005 2006 2007 2008 2009 2010 2011 2012,',,
,'.,
,'1,
,'3,
,'5,
-',,
-'.,
FReTn/CTrThoT/PolhirTlAlcST/ !Rna /eis FReTn/CTrThoT/PolhirTlAlcST/ !Rna /eis
Q.M.S Advisors | tel: +41 (0)78 922 08 77 | e-mail: [email protected] |
Page 71
09.09.2013
Holder Name Portfolio Name Source Amt Held % Out Latest Chg File Dt Inst Type
CHINA SHIPBUILDING I n/a Co File 8'029'035'174 54.74 - 31.12.2012 Government
DL SHIPBUILDING INDU n/a Co File 1'621'341'182 11.05 - 31.12.2012 Government
CITIC SECURITIES CO n/a ULT-AGG 585'584'140 3.99 - 31.12.2012 Investment Advisor
BOHAI SHIPBUILDING C n/a Co File 540'640'446 3.69 - 31.12.2012 Government
CHINA HUARONG ASSET n/a Co File 393'750'127 2.68 - 31.12.2012 Government
SOCIAL SECURITY FUND n/a Co File 310'287'629 2.12 - 31.12.2012 Government
ANSHAN IRON & STEEL n/a Co File 153'144'330 1.04 - 31.12.2012 Government
CHINA CONSTRUCTION B n/a Co File 130'000'053 0.89 - 31.12.2012 Government
CHINA SOUTHERN FUND Multiple Portfolios MF-AGG 129'879'042 0.89 (6'197'580) 30.06.2013 Investment Advisor
CHINA DEVELOPMENT BA n/a Co File 100'058'363 0.68 - 31.12.2012 Bank
BLACKROCK ASSET MGMT Multiple Portfolios MF-AGG 87'152'528 0.59 - 30.08.2013 Investment Advisor
YINHUA FUND MANAGEME Multiple Portfolios MF-AGG 65'510'670 0.45 (32'167'218) 31.12.2012 Investment Advisor
CHANGSHENG FUND MANA Multiple Portfolios MF-AGG 58'095'781 0.4 (54'666'439) 31.12.2012 Investment Advisor
CHINA ASSET MANAGEME Multiple Portfolios MF-AGG 56'972'772 0.39 (11'815'146) 31.12.2012 Investment Advisor
DACHENG FUND MANAGME Multiple Portfolios MF-AGG 51'198'510 0.35 42'558'684 31.12.2012 Investment Advisor
FULLGOAL FUND MANAGE Multiple Portfolios MF-AGG 39'618'069 0.27 (4'452'774) 31.12.2012 Investment Advisor
HFT INVESTMENT MANAG Multiple Portfolios MF-AGG 39'408'657 0.27 (123'694'789) 31.12.2012 Investment Advisor
HUATAI-PINEBRIDGE FU Multiple Portfolios MF-AGG 36'934'730 0.25 13'755'669 31.12.2012 Investment Advisor
CSOP ASSET MANAGEMEN Multiple Portfolios MF-AGG 36'628'959 0.25 - 02.09.2013 Investment Advisor
HARVEST FUND MANAGEM Multiple Portfolios MF-AGG 34'976'609 0.24 (23'118'190) 31.12.2012 Investment Advisor
Firm Name Analyst Recommendation Weighting Change Target Price Date Date
China International Capital Corp JIN ZHANG accumulate 4 M #N/A N/A Not Provided 02.09.2013
Northeast Securities Co Ltd LI KUN add 4 M #N/A N/A Not Provided 30.06.2013
PingAn Securities HAITAO ZHU buy 5 M #N/A N/A Not Provided 25.06.2013
Everbright Securities Co., Ltd LU ZHOU buy 5 M 6 12 month 20.05.2013
Hong Yuan Securities PANG LINLIN buy 5 M #N/A N/A Not Provided 15.04.2013
China Securities Co., Ltd GAO XIAOCHUN buy 5 M 8 Not Provided 25.06.2012
SWS Research Co Ltd MILLER LI outperform 5 M #N/A N/A Not Provided 08.06.2012
Citic Securities Co., Ltd ZHANG TING not rated #N/A N/A M #N/A N/A Not Provided 19.03.2012
Industrial Securities WU HUA neutral 3 D #N/A N/A Not Provided 18.01.2012
Great Wall Securities YAN FUYIN buy 5 N #N/A N/A Not Provided 30.12.2011
China Merchants Securities TEAM COVERAGE neutral 3 M #N/A N/A Not Provided 27.07.2011
China Investment Securities LI QIN buy 5 M #N/A N/A Not Provided 04.05.2011
China Minzu Securities Co Ltd CAIXIA FU add 4 N 8 6 month 03.05.2011
Central China Securities LU YONGGUANG add 4 N #N/A N/A Not Provided 26.11.2010
China Galaxy Securities TIAN SHUHUA buy 5 M #N/A N/A Not Provided 01.06.2010
Holdings By:
China Shipbuilding Industry Co Ltd ee
Q.M.S Advisors | tel: +41 (0)78 922 08 77 | e-mail: [email protected] |
Page 72
09.09.2013
Huaxia Bank Co., Ltd. provides a full range of commercial banking services i
ncluding RMB and foreign currency deposit, loan, international and domestic s
ettlement, discount, currency trading, letter of credit, bank guarantee, and o
ther related services.
Latest Fiscal Year: 12/2012
LTM as of: 06/yy
52-Week High (04.02.2013) 9.56
52-Week Low (27.09.2012) 5.99
Daily Volume
7.76
52-Week High % Change -18.84% Dividend Yield -
52-Week Low % Change 29.67% Beta 0.99
% 52 Week Price Range High/Low 34.26% Equity Float 4'536.45
Shares Out 24.07.2013 8'904.6 Short Int -
69'100.03 1 Yr Total Return 24.16%
Total Debt 356'921.94 YTD Return 2.81%
Preferred Stock 0.0 Adjusted BETA 0.987
Minority Interest 28.4 Analyst Recs 16
Cash and Equivalents 585'104.04 Consensus Rating 3.625
Enterprise Value -
Average Volume 5 Day 40'009'300
600015 CH EQUITY YTD Change - Average Volume 30 Day 38'167'660
600015 CH EQUITY YTD % CHANGE - Average Volume 3 Month 36'236'360
LTM-4Q LTM FY+1 FY+2 FQ+1 FQ+2
31.12.2008 31.12.2009 31.12.2010 31.12.2011 31.12.2012 06/yy 06/yy 12/13 Y 12/14 Y 09/13 Q3 12/13 Q4
38'762.0 34'108.4 45'434.0 66'205.8 78'225.9 73'875.6 78'665.6 45'151.4 52'186.1 11'576.0 11'576.0
- - - - - 0.00x 0.00x - - - -
- - - - - 0.0 0.0 - - - -
- - - - - 0.00x 0.00x - - - -
3'070.8 3'760.2 5'989.6 9'221.9 12'796.3 11'029.7 14'021.0 14'355.4 16'343.7 3'400.0 3'400.0
10.33x 16.48x 9.08x 7.59x 5.54x 5.90x 4.76x 4.85x 4.28x 4.46x 4.41x
EBITDA - Long-Term Rating Date -
EBIT - Long-Term Rating NR
Operating Margin 42.83% Long-Term Outlook -
Pretax Margin 42.94% Short-Term Rating Date -
Return on Assets 0.98% Short-Term Rating -
Return on Common Equity 18.61%
Return on Capital 3.71% EBITDA/Interest Exp. -
Asset Turnover 0.05% (EBITDA-Capex)/Interest Exp. -
Net Debt/EBITDA -
Gross Margin - Total Debt/EBITDA -
EBITDA Margin -
EBIT Margin - Total Debt/Equity 477.8%
Net Income Margin 31.9% Total Debt/Capital 82.7%
Asset Turnover 0.05
Current Ratio - Net Fixed Asset Turnover 10.87
Quick Ratio - Accounts receivable turnover-days -
Debt to Assets 23.97% Inventory Days -
Tot Debt to Common Equity 477.84% Accounts Payable Turnover Day -
Accounts Receivable Turnover - Cash Conversion Cycle -
Inventory Turnover -
Profitability S&P Issuer Ratings
Credit Ratios
Margin Analysis
Reference
Structure
Net Income
P/E
Market Capitalization
Average Daily Trading Volume
Relative Stock Price Performance
Total Revenue
TEV/Revenue
EBITDA
TEV/EBITDA
Fiscal Year Ended
Huaxia Bank Co LtdPrice/Volume
Valuation Analysis
139'679'234.00
Current Price (9/dd/yy) Market Data
,-.0123456
-,
o!-. l!-. k!-. a!-. g!-0 c!-0 j!-0 Q!-0 j!-0 g!-0 g!-0 Q!-0 o!-0', F
.,', F
1,', F
3,', F
5,', F
-,,', F
-.,', F
-1,', F
-3,', F
0.0
10'000.0
20'000.0
30'000.0
40'000.0
50'000.0
60'000.0
70'000.0
80'000.0
90'000.0
2001 2002 2003 2004 2005 2006 2007 2008 2009 2010 2011 2012
,',,
,'2,
-',,
-'2,
.',,
.'2,
0',,
0'2,
1',,
1'2,
,-',-'.,-, ,-',4'.,-, ,-',-'.,-- ,-',4'.,-- ,-',-'.,-. ,-',4'.,-. ,-',-'.,-0 ,-',4'.,-0
FReTn/CTrThoT/PolhirTlAlcST/ !Rna /eis FReTn/CTrThoT/PolhirTlAlcST/ !Rna /eis
Q.M.S Advisors | tel: +41 (0)78 922 08 77 | e-mail: [email protected] |
Page 73
09.09.2013
Holder Name Portfolio Name Source Amt Held % Out Latest Chg File Dt Inst Type
SHOUGANG CORP n/a Co File 1'805'506'535 20.28 - 31.12.2012 Government
STATE GRID CORP OF C n/a Co File 1'623'994'959 18.24 - 31.12.2012 Government
DEUTSCHE BANK AG n/a ULT-AGG 1'557'478'237 17.49 - 31.12.2012 Investment Advisor
HONGTA TOBACCO GROUP n/a Co File 389'480'000 4.37 - 31.12.2012 Corporation
RUNHUA GROUP CO LTD n/a Co File 277'388'945 3.12 - 31.12.2012 Corporation
SAL OPPENHEIM JR & C n/a Co File 222'560'000 2.5 - 31.12.2012 Bank
BEIJING SANJILI ENER n/a Co File 155'385'033 1.74 - 31.12.2012 Corporation
SHANGHAI JIANTE BIOT n/a Co File 116'438'818 1.31 - 31.12.2012 Corporation
E FUND MANAGEMENT Multiple Portfolios MF-AGG 103'979'019 1.17 (11'971'192) 31.12.2012 Investment Advisor
CHINA ASSET MANAGEME Multiple Portfolios MF-AGG 77'756'753 0.87 (9'178'671) 31.12.2012 Investment Advisor
BLACKROCK ASSET MGMT Multiple Portfolios MF-AGG 57'681'691 0.65 - 30.08.2013 Investment Advisor
BANK OF COMMUNICATIO Multiple Portfolios MF-AGG 40'472'967 0.45 33'673'982 31.12.2012 Investment Advisor
BOSHI FUND MANAGEMEN Multiple Portfolios MF-AGG 39'937'270 0.45 (22'138'714) 31.12.2012 Investment Advisor
HARVEST FUND MANAGEM Multiple Portfolios MF-AGG 39'833'624 0.45 (21'541'493) 31.12.2012 Investment Advisor
ICBC CREDIT SUISSE A Multiple Portfolios MF-AGG 37'547'930 0.42 29'323'380 31.12.2012 Investment Advisor
PENGHUA FUND MANAGEM Multiple Portfolios MF-AGG 31'909'797 0.36 8'312'283 31.12.2012 Investment Advisor
CHINA SOUTHERN FUND Multiple Portfolios MF-AGG 27'565'579 0.31 (8'748'917) 30.06.2013 Investment Advisor
HUATAI-PINEBRIDGE FU Multiple Portfolios MF-AGG 25'359'022 0.28 (2'744'332) 31.12.2012 Investment Advisor
FULLGOAL FUND MANAGE Multiple Portfolios MF-AGG 24'694'357 0.28 2'612'276 31.12.2012 Investment Advisor
GREAT WALL FUND MANA Multiple Portfolios MF-AGG 24'009'060 0.27 21'881 30.06.2013 Investment Advisor
Firm Name Analyst Recommendation Weighting Change Target Price Date Date
PingAn Securities GRACE LI buy 5 M #N/A N/A Not Provided 03.09.2013
Guotai Junan GUANHUA QIU neutral 3 M 8 Not Provided 20.08.2013
Chang Jiang Securities Co. Limited LIU JUN add 4 M #N/A N/A Not Provided 18.08.2013
Northeast Securities Co Ltd YAYUN TANG add 4 M #N/A N/A Not Provided 12.08.2013
Qilu Securities Co Ltd JIAOYI CHENG buy 5 M #N/A N/A Not Provided 11.08.2013
Capital Securities Corp XIE JIYONG hold 3 M #N/A N/A Not Provided 09.08.2013
Sinolink Securities Co Ltd HE GUOWEN neutral 3 M #N/A N/A Not Provided 09.08.2013
UBS JANET SUN neutral 3 M 7 12 month 07.08.2013
Goldman Sachs NING MA Sell/Neutral 1 M 5 12 month 23.07.2013
SWS Research Co Ltd BECKY XU neutral 3 M #N/A N/A Not Provided 19.07.2013
GF Securities Co. Ltd. Mu Hua hold 3 N #N/A N/A Not Provided 19.06.2013
EVA Dimensions DOUG WALTERS buy 5 M #N/A N/A Not Provided 06.06.2013
Everbright Securities Co., Ltd SHEN WEI accumulate 4 M 9 12 month 02.06.2013
Hong Yuan Securities ZHANG JIXIU add 4 M #N/A N/A Not Provided 25.04.2013
Bank of China International SUN PENG hold 3 M 10 Not Provided 05.12.2012
Guodu Securities Co Ltd DENG TING buy 5 M #N/A N/A Not Provided 26.10.2012
China Merchants Securities LUO YI strong buy 5 M #N/A N/A Not Provided 23.07.2012
Citic Securities Co., Ltd ZHU YAN overweight 5 M 11 6 month 29.06.2012
China Securities Co., Ltd #N/A N/A buy 5 M 10 Not Provided 25.06.2012
Industrial Securities YIDONG ZHANG buy 5 D #N/A N/A Not Provided 12.04.2012
AJ Securities ZHANG ZHIPENG strong buy 5 M 12 6 month 29.03.2012
Rising Securities Co.,LTD XIE AIHONG buy 5 U #N/A N/A Not Provided 20.12.2011
China Investment Securities ZHANG ZHONGYANG strong buy 5 M #N/A N/A Not Provided 02.12.2011
China Minzu Securities Co Ltd ZHANG JING add 4 M #N/A N/A Not Provided 01.12.2011
BOCOM International Holdings LI SHANSHAN long-term buy 5 M #N/A N/A Not Provided 07.11.2011
Great Wall Securities CHENG BINBIN neutral 3 N #N/A N/A Not Provided 23.05.2011
HuaChuang Securities GAO LI buy 5 M #N/A N/A Not Provided 29.04.2011
Holdings By:
Huaxia Bank Co Ltd ee
Q.M.S Advisors | tel: +41 (0)78 922 08 77 | e-mail: [email protected] |
Page 74
09.09.2013
Anhui Conch Cement Company Limited produces and sells ordinary portland cement,
portland cement, portland blast furnace slag cement, compound cement, and
commercial clinker. The Company sells its products under the Conch, Hailuo, and
Huangshan trademarks.
Latest Fiscal Year: 12/2011
LTM as of: 06/yy
52-Week High (18.02.2013) 22.10
52-Week Low (25.06.2013) 11.88
Daily Volume
16.21
52-Week High % Change -26.65% Dividend Yield 1.54
52-Week Low % Change 36.45% Beta 1.49
% 52 Week Price Range High/Low 38.45% Equity Float 1'765.71
Shares Out 30.06.2013 3'999.7 Short Int -
92'326.01 1 Yr Total Return 9.42%
Total Debt 23'810.06 YTD Return -10.62%
Preferred Stock 0.0 Adjusted BETA 1.488
Minority Interest 2'265.6 Analyst Recs 22
Cash and Equivalents 8'231.30 Consensus Rating 4.864
Enterprise Value 109'033.26
Average Volume 5 Day 15'458'500
600585 CH EQUITY YTD Change - Average Volume 30 Day 22'406'500
600585 CH EQUITY YTD % CHANGE - Average Volume 3 Month 26'875'920
LTM-4Q LTM FY+1 FY+2 FQ+1 FQ+2
31.12.2008 31.12.2009 31.12.2010 31.12.2011 31.12.2012 06/yy 06/yy 12/13 Y 12/14 Y 09/13 Q3 12/13 Q4
24'228.3 24'998.0 34'508.3 48'653.8 45'766.2 46'627.6 48'537.2 54'219.0 62'368.2 14'040.0 16'580.0
2.18x 10.56x 3.42x 2.13x 2.65x 9.86x 10.10x 2.02x 1.68x - -
5'396.1 6'530.7 10'630.0 18'761.3 12'367.9 0.0 0.0 15'325.7 17'993.3 2'999.0 4'603.0
9.77x 40.43x 11.12x 5.51x 9.79x 0.00x 0.00x 7.11x 6.06x 7.64x 7.66x
2'607.2 3'505.9 6'159.6 11'586.4 6'331.1 8'513.1 6'450.1 8'397.4 9'943.7 2'085.0 3'032.0
20.26x 22.19x 17.76x 8.54x 19.06x 10.64x 13.76x 10.54x 8.79x 8.69x 8.88x
EBITDA 12'367.89 Long-Term Rating Date -
EBIT 9'091.94 Long-Term Rating -
Operating Margin 19.87% Long-Term Outlook -
Pretax Margin 17.75% Short-Term Rating Date -
Return on Assets 7.70% Short-Term Rating -
Return on Common Equity 13.65%
Return on Capital 10.47% EBITDA/Interest Exp. 10.02
Asset Turnover 0.58% (EBITDA-Capex)/Interest Exp. 4.58
Net Debt/EBITDA 1.09
Gross Margin 27.3% Total Debt/EBITDA 1.78
EBITDA Margin 27.1%
EBIT Margin 20.0% Total Debt/Equity 49.1%
Net Income Margin 13.8% Total Debt/Capital 31.9%
Asset Turnover 0.58
Current Ratio 1.63 Net Fixed Asset Turnover 0.87
Quick Ratio 1.14 Accounts receivable turnover-days 42.15
Debt to Assets 27.20% Inventory Days 46.04
Tot Debt to Common Equity 49.05% Accounts Payable Turnover Day 45.07
Accounts Receivable Turnover 8.66 Cash Conversion Cycle 67.13
Inventory Turnover 7.93
Fiscal Year Ended
Anhui Conch Cement Co LtdPrice/Volume
Valuation Analysis
28'533'126.00
Current Price (9/dd/yy) Market Data
Net Income
P/E
Market Capitalization
Average Daily Trading Volume
Relative Stock Price Performance
Total Revenue
TEV/Revenue
EBITDA
TEV/EBITDA
Profitability S&P Issuer Ratings
Credit Ratios
Margin Analysis
Reference
Structure
,
2
-,
-2
.,
.2
o!-. l!-. k!-. a!-. g!-0 c!-0 j!-0 Q!-0 j!-0 g!-0 g!-0 Q!-0 o!-0', F-,', F.,', F0,', F1,', F2,', F3,', F4,', F5,', F6,', F
0.0
10'000.0
20'000.0
30'000.0
40'000.0
50'000.0
60'000.0
2001 2002 2003 2004 2005 2006 2007 2008 2009 2010 2011 2012,',,
,'.,
,'1,
,'3,
,'5,
-',,
-'.,
FReTn/CTrThoT/PolhirTlAlcST/ !Rna /eis FReTn/CTrThoT/PolhirTlAlcST/ !Rna /eis
Q.M.S Advisors | tel: +41 (0)78 922 08 77 | e-mail: [email protected] |
Page 75
09.09.2013
Holder Name Portfolio Name Source Amt Held % Out Latest Chg File Dt Inst Type
ANHUI CONCH HLDGS CO n/a EXCH 1'947'282'844 48.69 - 20.03.2012 Holding Company
ANHUI CONCH VENTURE n/a Co File 286'713'246 7.17 - 31.12.2011 Other
BANK OF COMMUNICATIO Multiple Portfolios MF-AGG 79'116'552 1.98 69'586'653 31.12.2012 Investment Advisor
PINGAN TRUST CO LTD n/a Co File 74'425'633 1.86 - 31.12.2011 Other
HARVEST FUND MANAGEM Multiple Portfolios MF-AGG 56'208'243 1.41 (6'524'390) 31.12.2012 Investment Advisor
BOSHI FUND MANAGEMEN Multiple Portfolios MF-AGG 51'068'696 1.28 8'162'475 31.12.2012 Investment Advisor
BLACKROCK ASSET MGMT Multiple Portfolios MF-AGG 35'382'552 0.88 - 30.08.2013 Investment Advisor
FULLGOAL FUND MANAGE Multiple Portfolios MF-AGG 34'796'368 0.87 9'556'353 31.12.2012 Investment Advisor
PENGHUA FUND MANAGEM Multiple Portfolios MF-AGG 32'580'531 0.81 31'407'596 30.06.2013 Investment Advisor
YINHUA FUND MANAGEME Multiple Portfolios MF-AGG 29'796'033 0.74 (3'220'011) 30.06.2013 Investment Advisor
CHINA ASSET MANAGEME Multiple Portfolios MF-AGG 29'733'536 0.74 (4'218'588) 31.12.2012 Investment Advisor
DACHENG FUND MANAGME Multiple Portfolios MF-AGG 27'371'273 0.68 (18'141'058) 31.12.2012 Investment Advisor
EVERBRIGHT PRAMERICA Multiple Portfolios MF-AGG 26'788'250 0.67 (15'828'865) 31.12.2012 Investment Advisor
RONGTONG FUND MANAGE Multiple Portfolios MF-AGG 26'261'142 0.66 7'344'075 31.12.2012 Investment Advisor
MORGAN STANLEY INTER n/a Co File 25'181'353 0.63 - 31.12.2011 Investment Advisor
E FUND MANAGEMENT Multiple Portfolios MF-AGG 21'749'027 0.54 (248'861) 31.12.2012 Investment Advisor
CHINA SOUTHERN FUND Multiple Portfolios MF-AGG 17'918'821 0.45 7'989'536 30.06.2013 Investment Advisor
CCB PRINCIPAL ASSET Multiple Portfolios MF-AGG 15'518'364 0.39 5'538'029 30.06.2013 Investment Advisor
INVESCO GREAT WALL F Multiple Portfolios MF-AGG 15'410'686 0.39 (10'360'524) 28.03.2013 Investment Advisor
CSOP ASSET MANAGEMEN Multiple Portfolios MF-AGG 13'743'250 0.34 - 02.09.2013 Investment Advisor
Firm Name Analyst Recommendation Weighting Change Target Price Date Date
Chang Jiang Securities Co. Limited FAN CHAO buy 5 M #N/A N/A Not Provided 03.09.2013
Guotai Junan YANXIN BAO buy 5 M 21 12 month 02.09.2013
Masterlink Securities DAI KAI-YU buy 5 M 20 6 month 29.08.2013
Northeast Securities Co Ltd XIE WENJIE buy 5 M #N/A N/A Not Provided 20.08.2013
Capital Securities Corp ZHU JIXIANG buy 5 M 20 Not Provided 19.08.2013
GF Securities Co. Ltd. ZOU GE buy 5 M #N/A N/A Not Provided 19.08.2013
Sinolink Securities Co Ltd HUANG SHITAO buy 5 N #N/A N/A Not Provided 19.08.2013
China Merchants Securities WANG JINGJING strong buy 5 M #N/A N/A Not Provided 19.08.2013
Everbright Securities Co., Ltd CHEN HAOWU buy 5 M 21 12 month 17.08.2013
JPMorgan NICK LAI overweight 5 M 22 3 month 16.08.2013
Bank of China International MICHELLE LEUNG buy 5 M 20 Not Provided 16.08.2013
China International Capital Corp LUO WEI buy 5 M #N/A N/A Not Provided 16.08.2013
China Investment Securities LI FAN strong buy 5 M 20 12 month 15.08.2013
SWS Research Co Ltd KATHY WANG buy 5 M #N/A N/A Not Provided 22.07.2013
China Minzu Securities Co Ltd Pengcheng Yu buy 5 U 20 6 month 17.07.2013
UBS MICK MI buy 5 M 20 12 month 15.07.2013
Goldman Sachs JULIAN ZHU neutral/neutral 3 M 19 12 month 08.05.2013
Guodu Securities Co Ltd WANG SHUANG buy 5 D 27 6 month 25.04.2013
Founder Securities WEI ZHOU add 4 U #N/A N/A Not Provided 25.03.2013
HuaChuang Securities LI LONG strong buy 5 M #N/A N/A Not Provided 03.02.2013
Hong Yuan Securities DENG HAIQING buy 5 M 20 6 month 01.02.2013
Citic Securities Co., Ltd ZENG HAO buy 5 M #N/A N/A Not Provided 28.01.2013
China Securities Co., Ltd TIAN DONGHONG buy 5 U 20 Not Provided 25.06.2012
Industrial Securities YIDONG ZHANG buy 5 M 31 12 month 19.04.2012
AJ Securities ZUO HONGYING strong buy 5 M 25 6 month 26.10.2011
PingAn Securities XU WEI strong buy 5 M #N/A N/A Not Provided 25.10.2011
China Galaxy Securities HONG LIANG buy 5 M 33 12 month 01.07.2010
KGI Securities YANG HAN outperform 5 U 16 12 month 24.08.2009
Holdings By:
Anhui Conch Cement Co Ltd ee
Q.M.S Advisors | tel: +41 (0)78 922 08 77 | e-mail: [email protected] |
Page 76
09.09.2013
Huaneng Power International, Inc. develops, constructs, owns and operates
coal-fired power plants throughout China.
Latest Fiscal Year: 12/2011
LTM as of: 06/yy
52-Week High (05.12.2012) 7.40
52-Week Low (25.06.2013) 4.76
Daily Volume
5.45
52-Week High % Change -26.35% Dividend Yield 3.85
52-Week Low % Change 14.50% Beta 0.74
% 52 Week Price Range High/Low 21.59% Equity Float 1'760.07
Shares Out 30.06.2013 10'500.0 Short Int -
77'458.23 1 Yr Total Return -14.58%
Total Debt 167'398.05 YTD Return -20.56%
Preferred Stock 0.0 Adjusted BETA 0.743
Minority Interest 9'830.2 Analyst Recs 18
Cash and Equivalents 10'718.25 Consensus Rating 4.556
Enterprise Value 209'345.19
Average Volume 5 Day 20'617'000
600011 CH EQUITY YTD Change - Average Volume 30 Day 26'238'740
600011 CH EQUITY YTD % CHANGE - Average Volume 3 Month 26'456'360
LTM-4Q LTM FY+1 FY+2 FQ+1 FQ+2
31.12.2008 31.12.2009 31.12.2010 31.12.2011 31.12.2012 06/yy 06/yy 12/13 Y 12/14 Y 09/13 Q3 12/13 Q4
67'728.7 76'711.0 104'170.5 132'936.8 133'294.6 135'962.5 129'973.8 135'068.3 140'181.9 34'281.5 35'661.0
2.75x 2.33x 1.97x 1.77x 1.97x 6.04x 6.57x 1.77x 1.75x - -
6'911.4 18'639.8 19'363.9 21'207.5 29'477.3 0.0 0.0 36'634.6 36'249.6 - -
26.99x 9.59x 10.60x 11.08x 8.89x 0.00x 0.00x 5.71x 5.78x - -
(3'937.7) 4'929.5 3'348.0 1'180.5 5'512.5 2'298.0 9'554.8 10'458.5 10'500.1 2'200.5 2'452.5
- 9.43x 12.44x 41.87x 14.79x 27.79x 8.98x 7.63x 7.35x - -
EBITDA 29'477.29 Long-Term Rating Date 14.04.2010
EBIT 18'220.88 Long-Term Rating NR
Operating Margin 13.67% Long-Term Outlook -
Pretax Margin 6.66% Short-Term Rating Date -
Return on Assets 3.44% Short-Term Rating -
Return on Common Equity 16.40%
Return on Capital 7.25% EBITDA/Interest Exp. 3.09
Asset Turnover 0.50% (EBITDA-Capex)/Interest Exp. 1.46
Net Debt/EBITDA 4.27
Gross Margin - Total Debt/EBITDA 4.72
EBITDA Margin 26.4%
EBIT Margin 17.8% Total Debt/Equity 298.2%
Net Income Margin 4.1% Total Debt/Capital 71.7%
Asset Turnover 0.50
Current Ratio 0.39 Net Fixed Asset Turnover 0.72
Quick Ratio 0.28 Accounts receivable turnover-days 39.45
Debt to Assets 64.61% Inventory Days -
Tot Debt to Common Equity 298.23% Accounts Payable Turnover Day -
Accounts Receivable Turnover 9.25 Cash Conversion Cycle -
Inventory Turnover -
Fiscal Year Ended
Huaneng Power International IncPrice/Volume
Valuation Analysis
27'980'303.00
Current Price (9/dd/yy) Market Data
Net Income
P/E
Market Capitalization
Average Daily Trading Volume
Relative Stock Price Performance
Total Revenue
TEV/Revenue
EBITDA
TEV/EBITDA
Profitability S&P Issuer Ratings
Credit Ratios
Margin Analysis
Reference
Structure
,
-
.
0
1
2
3
4
5
o!-. l!-. k!-. a!-. g!-0 c!-0 j!-0 Q!-0 j!-0 g!-0 g!-0 Q!-0 o!-0', F
.,', F
1,', F
3,', F
5,', F
-,,', F
-.,', F
0.0
20'000.0
40'000.0
60'000.0
80'000.0
100'000.0
120'000.0
140'000.0
2001 2002 2003 2004 2005 2006 2007 2008 2009 2010 2011 2012
,',,
.',,
1',,
3',,
5',,
-,',,
-.',,
,-',-'.,-, ,-',4'.,-, ,-',-'.,-- ,-',4'.,-- ,-',-'.,-. ,-',4'.,-. ,-',-'.,-0 ,-',4'.,-0
FReTn/CTrThoT/PolhirTlAlcST/ !Rna /eis FReTn/CTrThoT/PolhirTlAlcST/ !Rna /eis
Q.M.S Advisors | tel: +41 (0)78 922 08 77 | e-mail: [email protected] |
Page 77
09.09.2013
Holder Name Portfolio Name Source Amt Held % Out Latest Chg File Dt Inst Type
HUANENG INTL POWER D n/a Co File 5'066'662'118 48.25 - 30.06.2011 Corporation
CHINA HUANENG GROUP n/a 20F 1'555'124'549 14.81 - 31.03.2012 Government
HEBEI PROVINCIAL CON n/a Co File 603'000'000 5.74 - 30.06.2011 Investment Advisor
LIAONING ENERGY INVE n/a Co File 422'679'939 4.03 - 30.06.2011 Corporation
JIANGSU INVESTMENT M n/a Co File 416'500'000 3.97 - 30.06.2011 Corporation
FUJIAN INVESTMENT EN n/a Co File 374'466'667 3.57 - 30.06.2011 Other
DALIAN CONSTRUCTION n/a Co File 301'500'000 2.87 - 30.06.2011 Corporation
LION FUND MANAGEMENT Multiple Portfolios MF-AGG 145'144'418 1.38 (10'584'275) 30.06.2013 Investment Advisor
YINHUA FUND MANAGEME Multiple Portfolios MF-AGG 45'123'674 0.43 (6'989'431) 31.12.2012 Investment Advisor
HARVEST FUND MANAGEM Multiple Portfolios MF-AGG 43'574'216 0.41 (13'189'647) 31.12.2012 Investment Advisor
HFT INVESTMENT MANAG Multiple Portfolios MF-AGG 42'074'297 0.4 8'843'928 31.12.2012 Investment Advisor
GUOTAI ASSET MANAGEM Multiple Portfolios MF-AGG 34'965'115 0.33 23'161'669 31.12.2012 Investment Advisor
BOSHI FUND MANAGEMEN Multiple Portfolios MF-AGG 34'510'296 0.33 (78'902'656) 31.12.2012 Investment Advisor
HUATAI-PINEBRIDGE FU Multiple Portfolios MF-AGG 33'595'480 0.32 8'997'535 31.12.2012 Investment Advisor
CHINA ASSET MANAGEME Multiple Portfolios MF-AGG 33'079'812 0.32 18'072'308 31.12.2012 Investment Advisor
HUAAN FUND MANAGEMEN Multiple Portfolios MF-AGG 30'894'208 0.29 10'520'694 31.12.2012 Investment Advisor
BLACKROCK ASSET MGMT Multiple Portfolios MF-AGG 29'396'480 0.28 - 30.08.2013 Investment Advisor
E FUND MANAGEMENT Multiple Portfolios MF-AGG 26'415'455 0.25 2'587'803 31.12.2012 Investment Advisor
CHINA UNIVERSAL ASSE Multiple Portfolios MF-AGG 25'780'134 0.25 3'694'359 02.09.2013 Investment Advisor
FULLGOAL FUND MANAGE Multiple Portfolios MF-AGG 20'687'249 0.2 (24'281'346) 31.12.2012 Investment Advisor
Firm Name Analyst Recommendation Weighting Change Target Price Date Date
Goldman Sachs FRANKLIN CHOW Buy/Neutral 5 M 8 12 month 23.08.2013
Chang Jiang Securities Co. Limited JUN GE add 4 M #N/A N/A Not Provided 21.08.2013
Masterlink Securities LI YAN buy 5 M 7 Not Provided 20.08.2013
Everbright Securities Co., Ltd JUNPENG CHEN accumulate 4 M 6 12 month 18.08.2013
Guotai Junan WANG WEI buy 5 N 7 12 month 08.08.2013
Capital Securities Corp LAI SHENSHENG buy 5 M 7 Not Provided 01.08.2013
Bank of China International KEVIN XING hold 3 M 6 Not Provided 01.08.2013
Jefferies JOSEPH FONG buy 5 M 8 12 month 31.07.2013
China International Capital Corp JUNHUA CHEN accumulate 4 M #N/A N/A Not Provided 31.07.2013
SWS Research Co Ltd EVAN LIANG buy 5 M #N/A N/A Not Provided 18.07.2013
JPMorgan BORIS KAN neutral 3 U 6 9 month 12.07.2013
UBS YINGZHEN XU buy 5 M 7 12 month 10.07.2013
Central China Securities PAN HANGJUN add 4 M #N/A N/A Not Provided 27.06.2013
Rising Securities Co.,LTD DAI LIPING outperform 5 M #N/A N/A Not Provided 23.04.2013
Guodu Securities Co Ltd WANG SHUBAO strong buy 5 N #N/A N/A Not Provided 26.12.2012
Citic Securities Co., Ltd WU FEI overweight 5 D #N/A N/A Not Provided 18.12.2012
Hong Yuan Securities LU RUMIN buy 5 M #N/A N/A Not Provided 28.11.2012
Great Wall Securities GUI FANGXIAO buy 5 M #N/A N/A Not Provided 23.10.2012
China Merchants Securities PENG QUANGANG strong buy 5 M #N/A N/A Not Provided 19.07.2012
PingAn Securities SHAO QING buy 5 M #N/A N/A Not Provided 09.03.2012
China Galaxy Securities ZOU XUYUAN speculative buy 4 M #N/A N/A Not Provided 21.10.2009
Holdings By:
Huaneng Power International Inc ee
Q.M.S Advisors | tel: +41 (0)78 922 08 77 | e-mail: [email protected] |
Page 78
09.09.2013
Sany Heavy Industry Co., Ltd. manufactures and markets construction machinery
and related parts. The Company's products include concrete pumps, concrete
pump vehicles, road rollers, pavers, and other related products. Sany Heavy
Industry sells its products under the "Sany" trade mark.
Latest Fiscal Year: 12/2012
LTM as of: 06/yy
52-Week High (04.02.2013) 13.19
52-Week Low (09.07.2013) 6.75
Daily Volume
7.58
52-Week High % Change -42.53% Dividend Yield -
52-Week Low % Change 12.30% Beta 1.38
% 52 Week Price Range High/Low 10.25% Equity Float 2'788.26
Shares Out 30.06.2013 7'616.5 Short Int -
57'733.10 1 Yr Total Return -20.98%
Total Debt 25'132.98 YTD Return -25.91%
Preferred Stock 0.0 Adjusted BETA 1.380
Minority Interest 1'594.1 Analyst Recs 21
Cash and Equivalents 9'644.77 Consensus Rating 4.143
Enterprise Value 78'408.06
Average Volume 5 Day 42'433'490
600031 CH EQUITY YTD Change - Average Volume 30 Day 31'948'610
600031 CH EQUITY YTD % CHANGE - Average Volume 3 Month 30'300'990
LTM-4Q LTM FY+1 FY+2 FQ+1 FQ+2
31.12.2008 31.12.2009 31.12.2010 31.12.2011 31.12.2012 06/yy 06/yy 12/13 Y 12/14 Y 09/13 Q3 12/13 Q4
13'727.5 18'917.0 33'823.7 50'516.8 46'663.7 51'985.1 36'942.4 43'342.1 57'676.0 8'289.0 7'231.0
1.65x 3.00x 3.37x 2.11x 2.09x 9.00x 9.95x 1.53x 1.05x 7.13x 8.17x
2'116.6 3'880.8 7'628.2 11'310.3 8'678.9 0.0 0.0 7'440.0 8'684.0 - -
10.71x 14.63x 14.95x 9.44x 11.23x 0.00x 0.00x 10.54x 9.03x - -
1'232.2 2'639.9 5'615.5 8'648.9 5'686.1 7'869.8 3'176.9 5'342.1 7'985.5 1'059.0 1'018.0
16.88x 20.80x 19.50x 11.01x 14.12x 13.41x 18.02x 10.01x 7.01x - -
EBITDA 8'678.91 Long-Term Rating Date -
EBIT 7'445.57 Long-Term Rating -
Operating Margin 15.96% Long-Term Outlook -
Pretax Margin 14.75% Short-Term Rating Date -
Return on Assets 4.50% Short-Term Rating -
Return on Common Equity 13.80%
Return on Capital - EBITDA/Interest Exp. 5.82
Asset Turnover 0.52% (EBITDA-Capex)/Interest Exp. 2.61
Net Debt/EBITDA -
Gross Margin 31.4% Total Debt/EBITDA -
EBITDA Margin -
EBIT Margin 11.2% Total Debt/Equity 109.2%
Net Income Margin 12.2% Total Debt/Capital 50.5%
Asset Turnover 0.52
Current Ratio 1.76 Net Fixed Asset Turnover 1.79
Quick Ratio 1.16 Accounts receivable turnover-days 238.33
Debt to Assets 38.99% Inventory Days 148.30
Tot Debt to Common Equity 109.18% Accounts Payable Turnover Day 106.36
Accounts Receivable Turnover 1.53 Cash Conversion Cycle 176.51
Inventory Turnover 2.46
Fiscal Year Ended
Sany Heavy Industry Co LtdPrice/Volume
Valuation Analysis
54'077'723.00
Current Price (9/dd/yy) Market Data
Net Income
P/E
Market Capitalization
Average Daily Trading Volume
Relative Stock Price Performance
Total Revenue
TEV/Revenue
EBITDA
TEV/EBITDA
Profitability S&P Issuer Ratings
Credit Ratios
Margin Analysis
Reference
Structure
,
.
1
3
5
-,
-.
-1
o!-. l!-. k!-. a!-. g!-0 c!-0 j!-0 Q!-0 j!-0 g!-0 g!-0 Q!-0 o!-0', F
.,', F
1,', F
3,', F
5,', F
-,,', F
-.,', F
-1,', F
0.0
10'000.0
20'000.0
30'000.0
40'000.0
50'000.0
60'000.0
2001 2002 2003 2004 2005 2006 2007 2008 2009 2010 2011 2012
,',,
2,',,
-,,',,
-2,',,
.,,',,
.2,',,
0,,',,
02,',,
1,,',,
12,',,
,-',-'.,-, ,-',4'.,-, ,-',-'.,-- ,-',4'.,-- ,-',-'.,-. ,-',4'.,-. ,-',-'.,-0 ,-',4'.,-0
FReTn/CTrThoT/PolhirTlAlcST/ !Rna /eis FReTn/CTrThoT/PolhirTlAlcST/ !Rna /eis
Q.M.S Advisors | tel: +41 (0)78 922 08 77 | e-mail: [email protected] |
Page 79
09.09.2013
Holder Name Portfolio Name Source Amt Held % Out Latest Chg File Dt Inst Type
SANY GROUP CO LTD n/a Co File 4'281'311'012 56.21 - 31.12.2012 Corporation
WENGEN LIANG n/a Co File 286'575'517 3.76 - 31.12.2012 n/a
BLACKROCK ASSET MGMT Multiple Portfolios MF-AGG 56'029'753 0.74 - 30.08.2013 Investment Advisor
HARVEST FUND MANAGEM Multiple Portfolios MF-AGG 53'565'891 0.7 (43'422'383) 31.12.2012 Investment Advisor
FULLGOAL FUND MANAGE Multiple Portfolios MF-AGG 52'523'220 0.69 (1'121'149) 31.12.2012 Investment Advisor
XIUGUO TANG n/a Co File 47'284'115 0.62 - 31.12.2012 n/a
ZHONGWU MAO n/a Co File 43'231'190 0.57 - 31.12.2012 n/a
WENBO XIANG n/a Co File 43'231'189 0.57 - 31.12.2012 n/a
DI CHUN n/a Co File 37'436'485 0.49 - 31.12.2012 n/a
DACHENG FUND MANAGME Multiple Portfolios MF-AGG 36'074'644 0.47 (19'034'287) 31.12.2012 Investment Advisor
CHINA LIFE INSURANCE n/a ULT-AGG 34'366'660 0.45 - 31.12.2012 Government
JIASHI FUND MANAGEME Multiple Portfolios MF-AGG 29'314'318 0.38 (2'995'360) 31.12.2012 Investment Advisor
GUO LIANGBAO n/a Co File 28'145'307 0.37 - 31.12.2012 n/a
CHINA ASSET MANAGEME Multiple Portfolios MF-AGG 26'353'564 0.35 (21'151'677) 31.12.2012 Investment Advisor
E FUND MANAGEMENT Multiple Portfolios MF-AGG 26'101'850 0.34 (25'170'912) 31.12.2012 Investment Advisor
JINHUA YUAN n/a Co File 25'668'519 0.34 - 31.12.2012 n/a
CSOP ASSET MANAGEMEN Multiple Portfolios MF-AGG 21'946'098 0.29 - 02.09.2013 Investment Advisor
BOSHI FUND MANAGEMEN Multiple Portfolios MF-AGG 21'231'122 0.28 (83'583'785) 31.12.2012 Investment Advisor
FUGUI ZHOU n/a Co File 18'913'646 0.25 - 31.12.2012 n/a
MANULIFE TEDA FUND M Multiple Portfolios MF-AGG 18'666'441 0.25 17'417'753 31.12.2012 Investment Advisor
Firm Name Analyst Recommendation Weighting Change Target Price Date Date
China International Capital Corp WU HUIMIN accumulate 4 D #N/A N/A Not Provided 02.09.2013
GF Securities Co. Ltd. DONG YAGUANG add 4 M #N/A N/A Not Provided 01.09.2013
SWS Research Co Ltd MILLER LI buy 5 M #N/A N/A Not Provided 28.08.2013
UBS WEIQI FU buy 5 M 10 12 month 13.08.2013
Goldman Sachs TIAN LU neutral/neutral 3 M 7 12 month 11.08.2013
Jefferies JULIAN BU hold 3 M 14 12 month 16.07.2013
China Investment Securities OUYANG JUN buy 5 M #N/A N/A Not Provided 25.06.2013
Morgan Stanley CEDRIC SHI restricted #N/A N/A M #N/A N/A Not Provided 12.06.2013
EVA Dimensions TIMOTHY STANISH sell 1 M #N/A N/A Not Provided 06.06.2013
Chang Jiang Securities Co. Limited Cheng Zhang buy 5 N #N/A N/A Not Provided 03.06.2013
Sun Hung Kai Securities VIK CHOPRA not rated #N/A N/A M #N/A N/A Not Provided 08.05.2013
Credit Suisse YANG SONG underperform 1 M 9 Not Provided 06.05.2013
Capital Securities Corp HAN WEIQI hold 3 M 14 Not Provided 03.05.2013
Guotai Junan LU JUAN buy 5 M 12 12 month 21.04.2013
Hong Yuan Securities PANG LINLIN add 4 M #N/A N/A Not Provided 15.04.2013
PingAn Securities ZHANG WEI buy 5 M #N/A N/A Not Provided 04.03.2013
Everbright Securities Co., Ltd LU ZHOU buy 5 M 13 12 month 09.02.2013
Northeast Securities Co Ltd JIANGTAO WU buy 5 M #N/A N/A Not Provided 31.01.2013
Citic Securities Co., Ltd GUO YALING buy 5 M #N/A N/A Not Provided 30.01.2013
Bank of China International XU MINLE buy 5 U 13 12 month 28.01.2013
HuaChuang Securities GAO LI buy 5 M #N/A N/A Not Provided 17.12.2012
Fortune CLSA Securities Limited YANG YAN outperform 5 M 10 12 month 15.11.2012
Sinolink Securities Co Ltd DONGYA GUANG add 4 M #N/A N/A Not Provided 07.11.2012
China Securities Co., Ltd FUZHANG FENG buy 5 M 16 Not Provided 25.06.2012
Industrial Securities WU HUA buy 5 M #N/A N/A Not Provided 16.04.2012
Central China Securities XU MINFENG buy 5 M #N/A N/A Not Provided 09.04.2012
China Merchants Securities LIU RONG strong buy 5 M 20 6 month 06.04.2012
Great Wall Securities YAN FUYIN buy 5 M #N/A N/A Not Provided 31.01.2012
Guodu Securities Co Ltd WEI JING strong buy 5 M #N/A N/A Not Provided 13.05.2011
China Galaxy Securities JU HOULIN speculative buy 4 M #N/A N/A Not Provided 27.01.2010
Holdings By:
Sany Heavy Industry Co Ltd ee
Q.M.S Advisors | tel: +41 (0)78 922 08 77 | e-mail: [email protected] |
Page 80
09.09.2013
China Merchants Securities Company, Ltd. provides brokerage services,
securities placement services and, asset management services. The Company
operates securities trading outlets in multiple cities in China.
Latest Fiscal Year: 12/2012
LTM as of: 06/yy
52-Week High (07.03.2013) 14.86
52-Week Low (30.11.2012) 8.04
Daily Volume
11.84
52-Week High % Change -20.32% Dividend Yield -
52-Week Low % Change 47.26% Beta 1.64
% 52 Week Price Range High/Low 47.95% Equity Float 1'067.47
Shares Out 30.06.2013 4'661.1 Short Int -
55'187.42 1 Yr Total Return 14.47%
Total Debt 14'913.73 YTD Return 13.71%
Preferred Stock 0.0 Adjusted BETA 1.639
Minority Interest 2.0 Analyst Recs 10
Cash and Equivalents 28'913.20 Consensus Rating 3.700
Enterprise Value 45'280.50
Average Volume 5 Day 19'242'100
600999 CH EQUITY YTD Change - Average Volume 30 Day 23'164'870
600999 CH EQUITY YTD % CHANGE - Average Volume 3 Month 24'413'170
LTM-4Q LTM FY+1 FY+2 FQ+1 FQ+2
31.12.2008 31.12.2009 31.12.2010 31.12.2011 31.12.2012 06/yy 06/yy 12/13 Y 12/14 Y 09/13 Q3 12/13 Q4
5'197.0 10'460.8 8'517.9 6'908.3 6'276.0 6'154.8 6'806.3 5'454.0 6'520.8 - -
- 4.40x 4.08x 3.72x 5.61x 19.75x 22.18x - - - -
2'950.2 5'789.5 4'798.2 3'357.7 2'868.2 0.0 1'231.4 - - - -
- 7.95x 7.24x 7.65x 12.26x 0.00x 0.00x - - - -
2'020.7 3'727.7 3'228.9 2'008.3 1'646.0 1'481.0 1'744.4 2'022.4 2'542.0 - -
- 25.78x 21.07x 23.67x 29.88x 36.00x 27.79x 26.61x 21.22x - -
EBITDA 2'868.18 Long-Term Rating Date -
EBIT - Long-Term Rating -
Operating Margin 37.60% Long-Term Outlook -
Pretax Margin 29.88% Short-Term Rating Date -
Return on Assets 2.11% Short-Term Rating -
Return on Common Equity 6.82%
Return on Capital 4.07% EBITDA/Interest Exp. -
Asset Turnover 0.08% (EBITDA-Capex)/Interest Exp. -
Net Debt/EBITDA -
Gross Margin - Total Debt/EBITDA -
EBITDA Margin -
EBIT Margin - Total Debt/Equity 57.9%
Net Income Margin 26.2% Total Debt/Capital 36.7%
Asset Turnover 0.08
Current Ratio - Net Fixed Asset Turnover 7.37
Quick Ratio - Accounts receivable turnover-days -
Debt to Assets 19.74% Inventory Days -
Tot Debt to Common Equity 57.88% Accounts Payable Turnover Day -
Accounts Receivable Turnover - Cash Conversion Cycle -
Inventory Turnover -
Profitability S&P Issuer Ratings
Credit Ratios
Margin Analysis
Reference
Structure
Net Income
P/E
Market Capitalization
Average Daily Trading Volume
Relative Stock Price Performance
Total Revenue
TEV/Revenue
EBITDA
TEV/EBITDA
Fiscal Year Ended
China Merchants Securities Co LtdPrice/Volume
Valuation Analysis
62'708'721.00
Current Price (9/dd/yy) Market Data
,
.
1
3
5
-,
-.
-1
-3
o!-. l!-. k!-. a!-. g!-0 c!-0 j!-0 Q!-0 j!-0 g!-0 g!-0 Q!-0 o!-0', F
.,', F
1,', F
3,', F
5,', F
-,,', F
-.,', F
-1,', F
0.0
2'000.0
4'000.0
6'000.0
8'000.0
10'000.0
12'000.0
2001 2002 2003 2004 2005 2006 2007 2008 2009 2010 2011 2012,',,
,'.,
,'1,
,'3,
,'5,
-',,
-'.,
FReTn/CTrThoT/PolhirTlAlcST/ !Rna /eis FReTn/CTrThoT/PolhirTlAlcST/ !Rna /eis
Q.M.S Advisors | tel: +41 (0)78 922 08 77 | e-mail: [email protected] |
Page 81
09.09.2013
Holder Name Portfolio Name Source Amt Held % Out Latest Chg File Dt Inst Type
SZ JISHENG INVEST DE n/a Co File 1'341'378'000 28.78 - 31.12.2012 Government
CHINA MERCHANTS FIN n/a Co File 619'802'023 13.3 - 31.12.2012 Government
CHINA OCEAN SHIPPING n/a Co File 505'951'852 10.85 - 31.12.2012 Government
HEBEI PORT GROUP CO n/a Co File 225'127'284 4.83 - 31.12.2012 Government
CHINA COMMUN CONSTRU n/a Co File 214'297'546 4.6 - 31.12.2012 Government
GUANGZHOU MARITIME T n/a Co File 187'729'772 4.03 - 31.12.2012 Government
CHINA MERCHANTS STEA n/a Co File 177'244'952 3.8 - 31.12.2012 Government
SHENZHEN HUAQIANG NE n/a Co File 167'799'593 3.6 - 31.12.2012 Corporation
CHINA SHIPPING HAISH n/a Co File 82'923'000 1.78 - 31.12.2012 Holding Company
COFCO PROPERTY GROUP n/a Co File 71'374'097 1.53 - 31.12.2012 Corporation
DACHENG FUND MANAGME Multiple Portfolios MF-AGG 48'189'538 1.03 6'405'344 31.12.2012 Investment Advisor
CHINA ASSET MANAGEME Multiple Portfolios MF-AGG 22'483'373 0.48 3'620'643 31.12.2012 Investment Advisor
HARVEST FUND MANAGEM Multiple Portfolios MF-AGG 18'523'941 0.4 (18'491'331) 31.12.2012 Investment Advisor
HUATAI-PINEBRIDGE FU Multiple Portfolios MF-AGG 13'647'810 0.29 (3'944'986) 31.12.2012 Investment Advisor
E FUND MANAGEMENT Multiple Portfolios MF-AGG 7'369'261 0.16 1'695'341 31.12.2012 Investment Advisor
HUAAN FUND MANAGEMEN Multiple Portfolios MF-AGG 7'190'384 0.15 (540'936) 31.12.2012 Investment Advisor
CHINA SOUTHERN FUND Multiple Portfolios MF-AGG 7'041'021 0.15 4'851'063 31.12.2012 Investment Advisor
CHINA ASSET MANAGEME Multiple Portfolios MF-AGG 4'628'004 0.1 - 02.09.2013 Investment Advisor
GUOTAI ASSET MANAGEM Multiple Portfolios MF-AGG 4'027'035 0.09 (14'501'413) 31.12.2012 Investment Advisor
BANK OF COMMUNICATIO Multiple Portfolios MF-AGG 3'834'466 0.08 (9'075'524) 31.12.2012 Investment Advisor
Firm Name Analyst Recommendation Weighting Change Target Price Date Date
Chang Jiang Securities Co. Limited LIU JUN neutral 3 M #N/A N/A Not Provided 02.09.2013
GF Securities Co. Ltd. CONG LI add 4 N #N/A N/A Not Provided 21.08.2013
Sinolink Securities Co Ltd HE GUOWEN add 4 M #N/A N/A Not Provided 21.08.2013
Guotai Junan ZHAO XIANGHUAI buy 5 M 14 12 month 21.08.2013
Everbright Securities Co., Ltd ZIPEI TANG accumulate 4 M 12 12 month 06.08.2013
Hong Yuan Securities HUANG LIJUN buy 5 M #N/A N/A Not Provided 21.07.2013
Northeast Securities Co Ltd XINAN ZHAO add 4 M #N/A N/A Not Provided 30.06.2013
Goldman Sachs NING MA Sell/Neutral 1 M 9 12 month 24.06.2013
Deutsche Bank PANDORA LEE hold 3 M 15 12 month 12.04.2013
China International Capital Corp JIE HUANG accumulate 4 N #N/A N/A Not Provided 10.09.2012
Citic Securities Co., Ltd PAN HONGWEN buy 5 M 14 6 month 03.05.2012
Industrial Securities ZHANG YING buy 5 M #N/A N/A Not Provided 28.10.2011
Central China Securities XIE PEIJIE add 4 M #N/A N/A Not Provided 12.10.2011
China Minzu Securities Co Ltd SONG JIAN neutral 3 M 22 6 month 15.09.2011
Guodu Securities Co Ltd DENG TING buy 5 U #N/A N/A Not Provided 15.02.2011
PingAn Securities DOU ZEYUN buy 5 M #N/A N/A Not Provided 24.12.2010
China Investment Securities WANG PENG buy 5 M #N/A N/A Not Provided 21.07.2010
Holdings By:
China Merchants Securities Co Ltd ee
Q.M.S Advisors | tel: +41 (0)78 922 08 77 | e-mail: [email protected] |
Page 82
09.09.2013
China Oilfield Services Limited provides drilling services, well services,
marine support and transportation services, and geophysical services to the oil
field industry in the offshore China market.
Latest Fiscal Year: 12/2011
LTM as of: 06/yy
52-Week High (28.08.2013) 18.46
52-Week Low (04.07.2013) 13.55
Daily Volume
17.48
52-Week High % Change -5.31% Dividend Yield 1.77
52-Week Low % Change 29.00% Beta 0.97
% 52 Week Price Range High/Low 77.80% Equity Float 493.64
Shares Out 30.06.2013 2'960.5 Short Int -
76'281.09 1 Yr Total Return 4.83%
Total Debt 33'369.96 YTD Return 8.80%
Preferred Stock 0.0 Adjusted BETA 0.970
Minority Interest 11.0 Analyst Recs 11
Cash and Equivalents 13'769.08 Consensus Rating 4.636
Enterprise Value 96'522.01
Average Volume 5 Day 5'656'140
601808 CH EQUITY YTD Change - Average Volume 30 Day 7'048'334
601808 CH EQUITY YTD % CHANGE - Average Volume 3 Month 5'990'528
LTM-4Q LTM FY+1 FY+2 FQ+1 FQ+2
31.12.2008 31.12.2009 31.12.2010 31.12.2011 31.12.2012 06/yy 06/yy 12/13 Y 12/14 Y 09/13 Q3 12/13 Q4
12'142.9 17'878.7 17'561.0 18'426.1 22'104.7 20'297.6 24'535.1 27'182.0 30'729.9 7'022.0 6'107.0
5.57x 4.91x 6.90x 4.33x 3.98x 12.22x 12.34x 3.23x 2.79x - -
5'228.0 8'139.6 8'564.8 8'159.6 8'911.0 0.0 0.0 10'792.3 11'939.8 1'715.0 4'671.0
12.93x 10.79x 14.14x 9.77x 9.86x 0.00x 0.00x 8.94x 8.08x - -
3'102.2 3'135.3 4'128.5 4'039.3 4'559.4 4'365.8 5'341.9 5'721.8 6'552.1 1'516.5 1'094.0
7.98x 11.74x 15.55x 11.07x 12.67x 9.30x 10.08x 13.81x 11.86x - -
EBITDA 8'911.00 Long-Term Rating Date 20.12.2012
EBIT 5'737.54 Long-Term Rating A-
Operating Margin 25.96% Long-Term Outlook STABLE
Pretax Margin 24.60% Short-Term Rating Date -
Return on Assets 7.59% Short-Term Rating -
Return on Common Equity 16.71%
Return on Capital 9.50% EBITDA/Interest Exp. 14.19
Asset Turnover 0.35% (EBITDA-Capex)/Interest Exp. 8.39
Net Debt/EBITDA 2.12
Gross Margin - Total Debt/EBITDA 3.34
EBITDA Margin 39.0%
EBIT Margin 26.1% Total Debt/Equity 103.7%
Net Income Margin 20.6% Total Debt/Capital 50.9%
Asset Turnover 0.35
Current Ratio 2.80 Net Fixed Asset Turnover 0.53
Quick Ratio 2.34 Accounts receivable turnover-days 94.19
Debt to Assets 44.70% Inventory Days -
Tot Debt to Common Equity 103.65% Accounts Payable Turnover Day -
Accounts Receivable Turnover 3.88 Cash Conversion Cycle -
Inventory Turnover -
Profitability S&P Issuer Ratings
Credit Ratios
Margin Analysis
Reference
Structure
Net Income
P/E
Market Capitalization
Average Daily Trading Volume
Relative Stock Price Performance
Total Revenue
TEV/Revenue
EBITDA
TEV/EBITDA
Fiscal Year Ended
China Oilfield Services LtdPrice/Volume
Valuation Analysis
6'127'101.00
Current Price (9/dd/yy) Market Data
,.135
-,-.-1-3-5.,
o!-. l!-. k!-. a!-. g!-0 c!-0 j!-0 Q!-0 j!-0 g!-0 g!-0 Q!-0 o!-0', F
2', F
-,', F
-2', F
.,', F
.2', F
0,', F
02', F
0.0
5'000.0
10'000.0
15'000.0
20'000.0
25'000.0
2001 2002 2003 2004 2005 2006 2007 2008 2009 2010 2011 2012,',,
,'.,
,'1,
,'3,
,'5,
-',,
-'.,
FReTn/CTrThoT/PolhirTlAlcST/ !Rna /eis FReTn/CTrThoT/PolhirTlAlcST/ !Rna /eis
Q.M.S Advisors | tel: +41 (0)78 922 08 77 | e-mail: [email protected] |
Page 83
09.09.2013
Holder Name Portfolio Name Source Amt Held % Out Latest Chg File Dt Inst Type
CHINA NATIONAL OFFSH n/a Co File 2'410'468'000 81.42 - 31.12.2009 Government
SOCIAL SECURITY FUND n/a Co File 50'000'000 1.69 - 31.12.2009 Government
CHINA SOUTHERN FUND Multiple Portfolios MF-AGG 17'766'349 0.6 (853'911) 30.06.2013 Investment Advisor
BLACKROCK ASSET MGMT Multiple Portfolios MF-AGG 11'699'341 0.4 - 30.08.2013 Investment Advisor
EVERBRIGHT PRAMERICA Multiple Portfolios MF-AGG 9'449'600 0.32 7'072'555 31.12.2012 Investment Advisor
CHINA ASSET MANAGEME Multiple Portfolios MF-AGG 8'156'652 0.28 1'607'966 31.12.2012 Investment Advisor
CHANGSHENG FUND MANA Multiple Portfolios MF-AGG 8'062'106 0.27 7'898'092 31.12.2012 Investment Advisor
WU XIANGFEN n/a Co File 6'344'533 0.21 - 31.12.2009 n/a
BOSHI FUND MANAGEMEN Multiple Portfolios MF-AGG 6'179'433 0.21 2'964'025 31.12.2012 Investment Advisor
HARVEST FUND MANAGEM Multiple Portfolios MF-AGG 4'694'262 0.16 (5'894'389) 31.12.2012 Investment Advisor
CSOP ASSET MANAGEMEN Multiple Portfolios MF-AGG 4'627'889 0.16 - 02.09.2013 Investment Advisor
CAISSE DE DEPOT ET P Multiple Portfolios MF-AGG 3'732'811 0.13 - 31.12.2012 Investment Advisor
CHINA MERCHANTS FUND Multiple Portfolios MF-AGG 3'706'387 0.13 1'076'612 31.12.2012 Investment Advisor
BOSERA FUND MANAGEME Multiple Portfolios MF-AGG 3'697'658 0.12 3'111'621 31.12.2012 Investment Advisor
FULLGOAL FUND MANAGE Multiple Portfolios MF-AGG 3'109'810 0.11 2'274'962 31.12.2012 Investment Advisor
HUATAI-PINEBRIDGE FU Multiple Portfolios MF-AGG 2'750'862 0.09 (1'449'166) 31.12.2012 Investment Advisor
HUAAN FUND MANAGEMEN Multiple Portfolios MF-AGG 2'559'050 0.09 (3'401'518) 31.12.2012 Investment Advisor
GUOTAI ASSET MANAGEM Multiple Portfolios MF-AGG 2'193'285 0.07 650'323 31.12.2012 Investment Advisor
GREAT WALL FUND MANA Multiple Portfolios MF-AGG 1'899'540 0.06 673'024 31.12.2012 Investment Advisor
AEGON INDUSTRIAL FUN Multiple Portfolios MF-AGG 1'628'162 0.05 1'628'162 31.12.2012 Investment Advisor
Firm Name Analyst Recommendation Weighting Change Target Price Date Date
PingAn Securities SHAOHUI YANG buy 5 M #N/A N/A Not Provided 29.08.2013
Northeast Securities Co Ltd WEIGANG WANG buy 5 M #N/A N/A Not Provided 25.08.2013
Masterlink Securities LI XIN buy 5 U 21 6 month 22.08.2013
Bank of China International LAWRENCE LAU buy 5 M 21 Not Provided 21.08.2013
China International Capital Corp BIN GUAN buy 5 M #N/A N/A Not Provided 20.08.2013
Founder Securities LIQUAN HUANG add 4 M #N/A N/A Not Provided 20.08.2013
SWS Research Co Ltd KAISHENG LIN buy 5 M #N/A N/A Not Provided 19.07.2013
Goldman Sachs ARTHUR YAN neutral/neutral 3 M 18 12 month 13.06.2013
China Minzu Securities Co Ltd QI QIUSHI add 4 M 19 6 month 01.04.2013
Sinolink Securities Co Ltd LIU BO buy 5 N 23 Not Provided 14.03.2013
Citic Securities Co., Ltd HUANG LILI buy 5 M #N/A N/A Not Provided 25.12.2012
UBS NINA YAN buy 5 M 20 12 month 09.08.2012
HuaChuang Securities GAO LI buy 5 N #N/A N/A Not Provided 18.05.2012
China Investment Securities ZHEJIAN SONG strong buy 5 M #N/A N/A Not Provided 02.12.2011
Jefferies LABAN YU underperform 1 N 15 12 month 20.05.2011
Central China Securities LU YONGGUANG add 4 N #N/A N/A Not Provided 26.11.2010
China Galaxy Securities LI GUOHONG buy 5 N #N/A N/A Not Provided 20.07.2010
Industrial Securities ZHENG FANGBIAO buy 5 M #N/A N/A Not Provided 22.03.2010
Holdings By:
China Oilfield Services Ltd ee
Q.M.S Advisors | tel: +41 (0)78 922 08 77 | e-mail: [email protected] |
Page 84
09.09.2013
China Railway Construction Corporation Ltd is a full service construction
company. The Company's services include construction operations, survey design
and consulting. China Railway also has manufacturing operations, real estate
operations, and logistics. The Company specializes in railway construction.
Latest Fiscal Year: 12/2011
LTM as of: 06/yy
52-Week High (07.01.2013) 6.49
52-Week Low (25.06.2013) 3.95
Daily Volume
5.04
52-Week High % Change -22.34% Dividend Yield 2.18
52-Week Low % Change 27.59% Beta 1.06
% 52 Week Price Range High/Low 37.01% Equity Float 2'404.50
Shares Out 30.06.2013 10'261.3 Short Int -
65'368.09 1 Yr Total Return 11.79%
Total Debt 107'283.34 YTD Return -12.01%
Preferred Stock 0.0 Adjusted BETA 1.064
Minority Interest 1'365.6 Analyst Recs 11
Cash and Equivalents 105'817.06 Consensus Rating 4.727
Enterprise Value 125'192.13
Average Volume 5 Day 22'463'400
601186 CH EQUITY YTD Change - Average Volume 30 Day 21'357'640
601186 CH EQUITY YTD % CHANGE - Average Volume 3 Month 23'167'950
LTM-4Q LTM FY+1 FY+2 FQ+1 FQ+2
31.12.2008 31.12.2009 31.12.2010 31.12.2011 31.12.2012 06/yy 06/yy 12/13 Y 12/14 Y 09/13 Q3 12/13 Q4
219'410.2 344'976.2 456'187.2 443'319.3 469'871.7 417'448.9 519'951.8 522'853.8 551'818.8 - -
0.42x 0.22x 0.18x 0.15x 0.17x 0.67x 0.75x - - - -
9'883.9 13'754.6 14'427.2 21'822.9 23'688.9 0.0 0.0 26'460.0 28'821.0 - -
9.43x 5.41x 5.59x 3.08x 3.28x 0.00x 0.00x 4.73x 4.34x - -
3'643.8 6'599.1 4'246.2 7'854.3 8'478.9 7'403.6 9'964.2 9'376.5 10'133.5 - -
31.76x 16.38x 23.34x 5.42x 10.27x 8.72x 6.66x 6.69x 6.00x - -
EBITDA 23'688.89 Long-Term Rating Date 03.05.2013
EBIT 13'999.85 Long-Term Rating A-
Operating Margin 2.98% Long-Term Outlook STABLE
Pretax Margin 2.32% Short-Term Rating Date -
Return on Assets 1.88% Short-Term Rating -
Return on Common Equity 12.40%
Return on Capital 7.09% EBITDA/Interest Exp. 4.06
Asset Turnover 1.04% (EBITDA-Capex)/Interest Exp. 2.26
Net Debt/EBITDA 0.06
Gross Margin 7.8% Total Debt/EBITDA 4.53
EBITDA Margin 5.0%
EBIT Margin 3.0% Total Debt/Equity 149.1%
Net Income Margin 1.8% Total Debt/Capital 59.4%
Asset Turnover 1.04
Current Ratio 1.13 Net Fixed Asset Turnover 10.29
Quick Ratio 0.49 Accounts receivable turnover-days 54.11
Debt to Assets 22.32% Inventory Days 135.86
Tot Debt to Common Equity 149.08% Accounts Payable Turnover Day 124.19
Accounts Receivable Turnover 6.76 Cash Conversion Cycle 65.78
Inventory Turnover 2.69
Fiscal Year Ended
China Railway Construction Corp LtdPrice/Volume
Valuation Analysis
35'044'126.00
Current Price (9/dd/yy) Market Data
Net Income
P/E
Market Capitalization
Average Daily Trading Volume
Relative Stock Price Performance
Total Revenue
TEV/Revenue
EBITDA
TEV/EBITDA
Profitability S&P Issuer Ratings
Credit Ratios
Margin Analysis
Reference
Structure
,
-
.
0
1
2
3
4
o!-. l!-. k!-. a!-. g!-0 c!-0 j!-0 Q!-0 j!-0 g!-0 g!-0 Q!-0 o!-0', F
.,', F
1,', F
3,', F
5,', F
-,,', F
-.,', F
-1,', F
-3,', F
0.0
50'000.0
100'000.0
150'000.0
200'000.0
250'000.0
300'000.0
350'000.0
400'000.0
450'000.0
500'000.0
2001 2002 2003 2004 2005 2006 2007 2008 2009 2010 2011 2012
,',,
-,',,,',,
.,',,,',,
0,',,,',,
1,',,,',,
2,',,,',,
3,',,,',,
4,',,,',,
5,',,,',,
6,',,,',,
-,,',,,',,
,-',-'.,-, ,-',4'.,-, ,-',-'.,-- ,-',4'.,-- ,-',-'.,-. ,-',4'.,-. ,-',-'.,-0 ,-',4'.,-0
FReTn/CTrThoT/PolhirTlAlcST/ !Rna /eis FReTn/CTrThoT/PolhirTlAlcST/ !Rna /eis
Q.M.S Advisors | tel: +41 (0)78 922 08 77 | e-mail: [email protected] |
Page 85
09.09.2013
Holder Name Portfolio Name Source Amt Held % Out Latest Chg File Dt Inst Type
CHINA RAILWAY CONSTR n/a Co File 7'566'245'500 73.74 - 31.12.2009 Government
SOCIAL SECURITY FUND n/a Co File 290'499'901 2.83 - 31.12.2009 Government
BOSHI FUND MANAGEMEN Multiple Portfolios MF-AGG 131'103'520 1.28 105'220'276 30.06.2013 Investment Advisor
HARVEST FUND MANAGEM Multiple Portfolios MF-AGG 55'152'199 0.54 6'689'555 31.12.2012 Investment Advisor
CHANGSHENG FUND MANA Multiple Portfolios MF-AGG 50'441'420 0.49 49'580'139 31.12.2012 Investment Advisor
BLACKROCK ASSET MGMT Multiple Portfolios MF-AGG 48'355'759 0.47 - 30.08.2013 Investment Advisor
UBS n/a ULT-AGG 23'116'605 0.23 - 30.06.2008 Unclassified
FULLGOAL FUND MANAGE Multiple Portfolios MF-AGG 20'835'776 0.2 (5'476'910) 31.12.2012 Investment Advisor
CSOP ASSET MANAGEMEN Multiple Portfolios MF-AGG 19'236'503 0.19 - 02.09.2013 Investment Advisor
HUATAI-PINEBRIDGE FU Multiple Portfolios MF-AGG 14'234'616 0.14 (28'843) 31.12.2012 Investment Advisor
RONGTONG FUND MANAGE Multiple Portfolios MF-AGG 11'612'282 0.11 9'925'347 31.12.2012 Investment Advisor
HUAAN FUND MANAGEMEN Multiple Portfolios MF-AGG 9'275'738 0.09 150'533 31.12.2012 Investment Advisor
INVESCO LTD n/a ULT-AGG 7'999'926 0.08 7'999'926 28.02.2013 Investment Advisor
E FUND MANAGEMENT Multiple Portfolios MF-AGG 7'564'464 0.07 713'906 31.12.2012 Investment Advisor
CHINA ASSET MANAGEME Multiple Portfolios MF-AGG 6'179'553 0.06 (8'852'182) 31.12.2012 Investment Advisor
CHINA ASSET MANAGEME Multiple Portfolios MF-AGG 6'141'089 0.06 - 02.09.2013 Investment Advisor
HSBC-JINTRUST FUND M Multiple Portfolios MF-AGG 5'960'500 0.06 3'918'000 31.12.2012 Investment Advisor
BOSERA FUND MANAGEME Multiple Portfolios MF-AGG 5'771'483 0.06 2'264'192 31.12.2012 Investment Advisor
CAISSE DE DEPOT ET P Multiple Portfolios MF-AGG 5'065'615 0.05 - 31.12.2012 Investment Advisor
HUAFU FUND MANAGEMEN Multiple Portfolios MF-AGG 4'797'829 0.05 2'631'259 31.12.2012 Investment Advisor
Firm Name Analyst Recommendation Weighting Change Target Price Date Date
Capital Securities Corp LI XIAOLU buy 5 M 5 Not Provided 03.09.2013
China International Capital Corp YUE DING accumulate 4 M #N/A N/A Not Provided 03.09.2013
Bank of China International LI PAN buy 5 M 6 Not Provided 02.09.2013
Guotai Junan ZHANG KUN buy 5 M #N/A N/A Not Provided 26.08.2013
Chang Jiang Securities Co. Limited SHI HENGHUI buy 5 M #N/A N/A Not Provided 26.08.2013
Goldman Sachs TIAN LU Buy/Neutral 5 M 6 12 month 11.08.2013
SWS Research Co Ltd ERNEST ZHANG outperform 5 M #N/A N/A Not Provided 16.07.2013
Everbright Securities Co., Ltd WANG TIANRUI accumulate 4 N 6 Not Provided 15.04.2013
Citic Securities Co., Ltd YANG TAO buy 5 M #N/A N/A Not Provided 04.12.2012
Hong Yuan Securities ZHOU RONGZI add 4 N #N/A N/A Not Provided 30.11.2012
Jefferies JULIAN BU buy 5 U 6 12 month 31.10.2012
China Investment Securities LI FAN buy 5 M #N/A N/A Not Provided 03.08.2011
China Galaxy Securities HAO FEIFEI speculative buy 4 M #N/A N/A Not Provided 23.06.2010
China Minzu Securities Co Ltd XU YONGCHAO add 4 M #N/A N/A Not Provided 18.05.2010
China Securities Co., Ltd TIAN DONGHONG add 4 M 12 Not Provided 02.12.2009
Holdings By:
China Railway Construction Corp Ltd ee
Q.M.S Advisors | tel: +41 (0)78 922 08 77 | e-mail: [email protected] |
Page 86
09.09.2013
Huatai Securities Co., Ltd. provides securities brokerage services, research
consulting services, investment banking services and direct investment
services, fixed-income services and asset management services.
Latest Fiscal Year: 12/2012
LTM as of: 06/yy
52-Week High (04.02.2013) 12.49
52-Week Low (29.11.2012) 7.19
Daily Volume
9.34
52-Week High % Change -25.22% Dividend Yield -
52-Week Low % Change 29.90% Beta 1.59
% 52 Week Price Range High/Low 30.57% Equity Float 1'628.04
Shares Out 30.06.2013 5'600.0 Short Int -
52'304.00 1 Yr Total Return 1.31%
Total Debt 6'328.17 YTD Return -3.14%
Preferred Stock 0.0 Adjusted BETA 1.589
Minority Interest 455.7 Analyst Recs 11
Cash and Equivalents 33'088.22 Consensus Rating 4.455
Enterprise Value 32'402.00
Average Volume 5 Day 23'067'160
601688 CH EQUITY YTD Change - Average Volume 30 Day 28'549'360
601688 CH EQUITY YTD % CHANGE - Average Volume 3 Month 30'446'780
LTM-4Q LTM FY+1 FY+2 FQ+1 FQ+2
31.12.2008 31.12.2009 31.12.2010 31.12.2011 31.12.2012 06/yy 06/yy 12/13 Y 12/14 Y 09/13 Q3 12/13 Q4
6'770.3 9'897.9 11'298.3 8'078.9 7'377.7 7'935.6 7'616.3 7'447.2 9'041.5 - -
- - 1.79x 1.45x 3.87x 9.11x 14.14x - - - -
- - 5'427.1 3'401.1 3'171.1 156.8 0.0 - - - -
- - 3.73x 3.43x 9.01x 0.00x 0.00x - - - -
1'253.1 3'795.3 3'425.0 1'784.4 1'615.7 1'698.9 1'846.1 2'441.5 3'071.2 - -
- - 21.78x 24.54x 33.97x 34.56x 24.55x 22.78x 18.03x - -
EBITDA 3'171.11 Long-Term Rating Date -
EBIT - Long-Term Rating -
Operating Margin 33.40% Long-Term Outlook -
Pretax Margin 28.77% Short-Term Rating Date -
Return on Assets 2.05% Short-Term Rating -
Return on Common Equity 5.42%
Return on Capital 4.02% EBITDA/Interest Exp. -
Asset Turnover 0.08% (EBITDA-Capex)/Interest Exp. -
Net Debt/EBITDA -
Gross Margin - Total Debt/EBITDA -
EBITDA Margin -
EBIT Margin - Total Debt/Equity 18.5%
Net Income Margin 21.9% Total Debt/Capital 15.4%
Asset Turnover 0.08
Current Ratio - Net Fixed Asset Turnover 4.16
Quick Ratio - Accounts receivable turnover-days -
Debt to Assets 7.98% Inventory Days -
Tot Debt to Common Equity 18.51% Accounts Payable Turnover Day -
Accounts Receivable Turnover - Cash Conversion Cycle -
Inventory Turnover -
Profitability S&P Issuer Ratings
Credit Ratios
Margin Analysis
Reference
Structure
Net Income
P/E
Market Capitalization
Average Daily Trading Volume
Relative Stock Price Performance
Total Revenue
TEV/Revenue
EBITDA
TEV/EBITDA
Fiscal Year Ended
Huatai Securities Co LtdPrice/Volume
Valuation Analysis
89'134'699.00
Current Price (9/dd/yy) Market Data
,
.
1
3
5
-,
-.
-1
o!-. l!-. k!-. a!-. g!-0 c!-0 j!-0 Q!-0 j!-0 g!-0 g!-0 Q!-0 o!-0', F
.,', F
1,', F
3,', F
5,', F
-,,', F
-.,', F
-1,', F
-3,', F
0.0
2'000.0
4'000.0
6'000.0
8'000.0
10'000.0
12'000.0
14'000.0
16'000.0
2001 2002 2003 2004 2005 2006 2007 2008 2009 2010 2011 2012,',,
,'.,
,'1,
,'3,
,'5,
-',,
-'.,
FReTn/CTrThoT/PolhirTlAlcST/ !Rna /eis FReTn/CTrThoT/PolhirTlAlcST/ !Rna /eis
Q.M.S Advisors | tel: +41 (0)78 922 08 77 | e-mail: [email protected] |
Page 87
09.09.2013
Holder Name Portfolio Name Source Amt Held % Out Latest Chg File Dt Inst Type
JIANGSU GUOXIN ASSET n/a Co File 1'367'687'495 24.42 - 31.12.2012 Corporation
JIANGSU CMNS HLDG CO n/a Co File 475'819'370 8.5 - 31.12.2012 Other
JIANGSU HIGH HOPE IN n/a Co File 439'588'150 7.85 - 31.12.2012 Corporation
JIANGSU HIGH TECH IN n/a Co File 426'096'799 7.61 - 31.12.2012 Corporation
JS SOHO HOLDING GRP n/a Co File 341'418'259 6.1 - 31.12.2012 Corporation
SHENHUA GROUP CORP L n/a EXCH 304'620'662 5.44 - 09.03.2012 Government
SHENHUA GUOHUA ENERG n/a Co File 228'730'503 4.08 - 31.12.2012 Corporation
JIANGSU HONGTU HI-TE n/a Co File 147'618'708 2.64 - 31.12.2012 Holding Company
SHANGHAI XINGJU INVS n/a Co File 143'786'827 2.57 - 31.12.2012 Other
JS SOHO INTL GRP n/a Co File 131'447'067 2.35 - 31.12.2012 Corporation
JINCHENG GROUP CO LT n/a Co File 108'929'397 1.95 - 31.12.2012 Corporation
CHINA ASSET MANAGEME Multiple Portfolios MF-AGG 50'929'490 0.91 (11'473'619) 31.12.2012 Investment Advisor
BOSHI FUND MANAGEMEN Multiple Portfolios MF-AGG 46'360'594 0.83 37'819'241 31.12.2012 Investment Advisor
CHANG XIN ASSET MANA Multiple Portfolios MF-AGG 43'042'222 0.77 8'267'932 31.12.2012 Investment Advisor
DACHENG FUND MANAGME Multiple Portfolios MF-AGG 40'884'132 0.73 16'462'388 31.12.2012 Investment Advisor
HARVEST FUND MANAGEM Multiple Portfolios MF-AGG 17'783'897 0.32 (9'257'456) 31.12.2012 Investment Advisor
GF FUND MANAGEMENT C Multiple Portfolios MF-AGG 13'768'047 0.25 (9'717'335) 31.12.2012 Investment Advisor
CHANGSHENG FUND MANA Multiple Portfolios MF-AGG 11'774'344 0.21 (2'842'498) 31.12.2012 Investment Advisor
YINHUA FUND MANAGEME Multiple Portfolios MF-AGG 10'923'825 0.2 10'430'641 31.12.2012 Investment Advisor
CHINA ASSET MANAGEME Multiple Portfolios MF-AGG 5'571'453 0.1 - 02.09.2013 Investment Advisor
Firm Name Analyst Recommendation Weighting Change Target Price Date Date
Chang Jiang Securities Co. Limited LIU JUN buy 5 M #N/A N/A Not Provided 02.09.2013
GF Securities Co. Ltd. CONG LI add 4 N #N/A N/A Not Provided 19.08.2013
Tebon Securities Co Ltd LI XIANGFENG outperform 5 M #N/A N/A Not Provided 19.08.2013
Guotai Junan ZHAO XIANGHUAI add 4 M 9 12 month 18.08.2013
Everbright Securities Co., Ltd ZIPEI TANG buy 5 M 10 12 month 06.08.2013
China Minzu Securities Co Ltd SONG JIAN add 4 M 11 6 month 23.07.2013
SWS Research Co Ltd HE ZONGYAN buy 5 M #N/A N/A Not Provided 22.07.2013
PingAn Securities WU JIE buy 5 M #N/A N/A Not Provided 01.04.2013
Great Wall Securities BIAO HUANG buy 5 N #N/A N/A Not Provided 29.10.2012
Hong Yuan Securities HUANG LIJUN add 4 M #N/A N/A Not Provided 27.10.2012
China International Capital Corp JIE HUANG hold 3 N #N/A N/A Not Provided 10.09.2012
Sinolink Securities Co Ltd JIANGANG CHEN add 4 N #N/A N/A Not Provided 20.08.2012
China Merchants Securities HONG JINPING strong buy 5 N #N/A N/A Not Provided 19.07.2012
Northeast Securities Co Ltd XINAN ZHAO add 4 M #N/A N/A Not Provided 30.06.2012
Citic Securities Co., Ltd PAN HONGWEN buy 5 M 13 6 month 03.05.2012
Industrial Securities ZHANG YING neutral 3 M #N/A N/A Not Provided 29.10.2011
Central China Securities XIE PEIJIE add 4 M #N/A N/A Not Provided 12.10.2011
China Investment Securities CHEN JIANTAO buy 5 M #N/A N/A Not Provided 02.03.2011
Guodu Securities Co Ltd DENG TING buy 5 M #N/A N/A Not Provided 07.12.2010
Holdings By:
Huatai Securities Co Ltd ee
Q.M.S Advisors | tel: +41 (0)78 922 08 77 | e-mail: [email protected] |
Page 88
09.09.2013
Guanghui Energy Co., Ltd. is principally engaged in energy development,
automotive services and real estate property leasing. The Company is in the
business of coal mining and related coal chemical manufacturing. The Company is
also engaged in the processing and distributing of granite materials and
trading of general merchandise such as plastic doors and windows.
Latest Fiscal Year: 12/2012
LTM as of: 06/yy
52-Week High (25.03.2013) 14.69
52-Week Low (30.07.2013) 8.15
Daily Volume
10.16
52-Week High % Change -30.82% Dividend Yield -
52-Week Low % Change 24.66% Beta 1.02
% 52 Week Price Range High/Low 30.90% Equity Float 2'877.89
Shares Out 30.06.2013 5'256.5 Short Int -
53'406.48 1 Yr Total Return 11.45%
Total Debt 10'969.34 YTD Return -6.78%
Preferred Stock 0.0 Adjusted BETA 1.021
Minority Interest 653.5 Analyst Recs 12
Cash and Equivalents 1'906.37 Consensus Rating 4.250
Enterprise Value 65'769.06
Average Volume 5 Day 56'691'140
600256 CH EQUITY YTD Change - Average Volume 30 Day 51'708'110
600256 CH EQUITY YTD % CHANGE - Average Volume 3 Month 44'468'100
LTM-4Q LTM FY+1 FY+2 FQ+1 FQ+2
31.12.2008 31.12.2009 31.12.2010 31.12.2011 31.12.2012 06/yy 06/yy 12/13 Y 12/14 Y 09/13 Q3 12/13 Q4
1'989.9 2'962.2 3'634.5 4'390.3 3'625.4 3'860.6 3'970.1 9'020.0 13'903.0 - -
4.74x 10.58x 16.17x 10.97x 18.52x 54.64x 74.02x - - - -
784.5 921.4 1'153.6 1'386.7 992.2 0.0 0.0 - - - -
12.03x 34.01x 50.95x 34.73x 67.68x 0.00x 0.00x - - - -
463.1 537.4 688.4 976.6 964.0 1'055.7 804.1 2'837.3 4'816.3 - -
17.07x 40.60x 75.44x 40.24x 59.58x 44.71x 84.06x 18.81x 11.69x - -
EBITDA 992.20 Long-Term Rating Date -
EBIT 760.84 Long-Term Rating -
Operating Margin 20.99% Long-Term Outlook -
Pretax Margin 34.35% Short-Term Rating Date -
Return on Assets 3.48% Short-Term Rating -
Return on Common Equity 9.82%
Return on Capital - EBITDA/Interest Exp. 1.47
Asset Turnover 0.17% (EBITDA-Capex)/Interest Exp. -2.59
Net Debt/EBITDA -
Gross Margin 29.8% Total Debt/EBITDA -
EBITDA Margin -
EBIT Margin 24.8% Total Debt/Equity 135.4%
Net Income Margin 26.6% Total Debt/Capital 55.6%
Asset Turnover 0.17
Current Ratio 0.79 Net Fixed Asset Turnover 0.28
Quick Ratio 0.36 Accounts receivable turnover-days 81.83
Debt to Assets 47.26% Inventory Days 58.49
Tot Debt to Common Equity 135.44% Accounts Payable Turnover Day 130.04
Accounts Receivable Turnover 4.46 Cash Conversion Cycle 10.76
Inventory Turnover 6.24
Fiscal Year Ended
Guanghui Energy Co LtdPrice/Volume
Valuation Analysis
60'246'760.00
Current Price (9/dd/yy) Market Data
Net Income
P/E
Market Capitalization
Average Daily Trading Volume
Relative Stock Price Performance
Total Revenue
TEV/Revenue
EBITDA
TEV/EBITDA
Profitability S&P Issuer Ratings
Credit Ratios
Margin Analysis
Reference
Structure
,
.
1
3
5
-,
-.
-1
-3
o!-. l!-. k!-. a!-. g!-0 c!-0 j!-0 Q!-0 j!-0 g!-0 g!-0 Q!-0 o!-0', F
.,', F
1,', F
3,', F
5,', F
-,,', F
-.,', F
-1,', F
0.0
500.0
1'000.0
1'500.0
2'000.0
2'500.0
3'000.0
3'500.0
4'000.0
4'500.0
5'000.0
2001 2002 2003 2004 2005 2006 2007 2008 2009 2010 2011 2012
,',,
-,,',,
.,,',,
0,,',,
1,,',,
2,,',,
3,,',,
4,,',,
5,,',,
,-',-'.,-, ,-',4'.,-, ,-',-'.,-- ,-',4'.,-- ,-',-'.,-. ,-',4'.,-. ,-',-'.,-0 ,-',4'.,-0
FReTn/CTrThoT/PolhirTlAlcST/ !Rna /eis FReTn/CTrThoT/PolhirTlAlcST/ !Rna /eis
Q.M.S Advisors | tel: +41 (0)78 922 08 77 | e-mail: [email protected] |
Page 89
09.09.2013
Holder Name Portfolio Name Source Amt Held % Out Latest Chg File Dt Inst Type
XINJIANG GUANGHUI IN n/a Co File 2'311'156'708 43.97 - 31.12.2012 Corporation
XINJIANG YUANXING WO n/a Co File 186'690'142 3.55 - 31.12.2012 Private Equity
HONG YUAN SECURITIES n/a Co File 186'023'379 3.54 - 31.12.2012 Investment Advisor
HAITONG SECURITIES C n/a Co File 151'382'431 2.88 - 31.12.2012 Investment Advisor
HUASHANG FUND MANAGE Multiple Portfolios MF-AGG 103'000'000 1.96 (9'499'119) 30.06.2013 Investment Advisor
HARVEST FUND MANAGEM Multiple Portfolios MF-AGG 79'871'720 1.52 (53'084'606) 30.06.2013 Investment Advisor
XINJIANG INV DEV GRO n/a Co File 67'267'500 1.28 - 31.12.2012 Corporation
BOSHI FUND MANAGEMEN Multiple Portfolios MF-AGG 54'662'367 1.04 44'687'878 30.06.2013 Investment Advisor
AEGON INDUSTRIAL FUN Multiple Portfolios MF-AGG 50'679'986 0.96 10'990'003 30.06.2013 Investment Advisor
CHINA ASSET MANAGEME Multiple Portfolios MF-AGG 47'417'344 0.9 (11'144'723) 31.12.2012 Investment Advisor
CHINA SOUTHERN FUND Multiple Portfolios MF-AGG 42'407'251 0.81 (23'314'940) 30.06.2013 Investment Advisor
BANK OF CHINA INVEST Multiple Portfolios MF-AGG 40'702'464 0.77 37'505'268 30.06.2013 Investment Advisor
CHINA SECURITIES CO n/a Co File 35'654'712 0.68 - 31.12.2012 Unclassified
GUOTAI JUNAN SECURIT n/a Co File 33'840'918 0.64 - 31.12.2012 Investment Advisor
E FUND MANAGEMENT Multiple Portfolios MF-AGG 26'119'858 0.5 5'159'423 31.12.2012 Investment Advisor
FORTUNE SGAM FUND MA Multiple Portfolios MF-AGG 25'034'659 0.48 (1'755'981) 31.12.2012 Investment Advisor
HUAAN FUND MANAGEMEN Multiple Portfolios MF-AGG 20'962'457 0.4 2'444'732 30.06.2013 Investment Advisor
HUATAI-PINEBRIDGE FU Multiple Portfolios MF-AGG 14'428'054 0.27 - 31.12.2012 Investment Advisor
YINHUA FUND MANAGEME Multiple Portfolios MF-AGG 14'340'989 0.27 (13'151'034) 31.12.2012 Investment Advisor
PENGHUA FUND MANAGEM Multiple Portfolios MF-AGG 9'664'721 0.18 8'627'824 30.06.2013 Investment Advisor
Firm Name Analyst Recommendation Weighting Change Target Price Date Date
Capital Securities Corp TEAM COVERAGE hold 3 M #N/A N/A Not Provided 22.08.2013
Qilu Securities Co Ltd ZHAOLIANG LIU buy 5 M #N/A N/A Not Provided 22.08.2013
EVA Dimensions DOUG WALTERS sell 1 M #N/A N/A Not Provided 24.07.2013
SWS Research Co Ltd KAISHENG LIN outperform 5 M #N/A N/A Not Provided 19.07.2013
Central China Securities ZHILEI WANG add 4 M #N/A N/A Not Provided 24.06.2013
Everbright Securities Co., Ltd CHENG LEI buy 5 M 19 6 month 21.04.2013
Guotai Junan WANG GANG add 4 M 13 12 month 09.04.2013
Bank of China International XU MINLE buy 5 M 12 12 month 14.01.2013
Citic Securities Co., Ltd HUANG LILI buy 5 M 13 6 month 25.12.2012
Hong Yuan Securities CHAI QINHU buy 5 M 13 3 month 13.12.2012
HuaChuang Securities KAI NING ZHOU buy 5 M #N/A N/A Not Provided 11.11.2012
China Minzu Securities Co Ltd QI QIUSHI add 4 M 13 6 month 05.11.2012
China Investment Securities RUI DINGKUN buy 5 M #N/A N/A Not Provided 07.04.2011
Holdings By:
Guanghui Energy Co Ltd ee
Q.M.S Advisors | tel: +41 (0)78 922 08 77 | e-mail: [email protected] |
Page 90
09.09.2013
China Coal Energy Company Ltd mines and markets thermal coal and coking coal.
The Company also manufactures coal mining equipment and offers coal mine design
services.
Latest Fiscal Year: 12/2011
LTM as of: 06/yy
52-Week High (05.02.2013) 8.47
52-Week Low (09.07.2013) 4.69
Daily Volume
5.4
52-Week High % Change -36.25% Dividend Yield 3.89
52-Week Low % Change 15.14% Beta 1.08
% 52 Week Price Range High/Low 16.14% Equity Float 1'643.61
Shares Out 30.06.2013 9'152.0 Short Int -
65'271.24 1 Yr Total Return -21.83%
Total Debt 48'092.09 YTD Return -28.73%
Preferred Stock 0.0 Adjusted BETA 1.078
Minority Interest 14'694.0 Analyst Recs 17
Cash and Equivalents 22'693.96 Consensus Rating 3.824
Enterprise Value 115'561.93
Average Volume 5 Day 8'547'319
601898 CH EQUITY YTD Change - Average Volume 30 Day 12'444'240
601898 CH EQUITY YTD % CHANGE - Average Volume 3 Month 12'623'750
LTM-4Q LTM FY+1 FY+2 FQ+1 FQ+2
31.12.2008 31.12.2009 31.12.2010 31.12.2011 31.12.2012 06/yy 06/yy 12/13 Y 12/14 Y 09/13 Q3 12/13 Q4
51'753.1 53'187.0 70'302.6 90'864.7 87'291.7 92'081.6 80'973.4 83'382.4 95'343.5 18'617.0 21'276.0
1.20x 3.06x 1.98x 1.35x 1.60x 4.02x 5.48x 1.65x 1.61x - -
12'819.2 12'138.8 14'723.9 18'996.1 17'593.0 0.0 0.0 14'789.8 17'754.4 - -
4.85x 13.40x 9.46x 6.46x 7.93x 0.00x 0.00x 7.81x 6.51x - -
7'131.0 7'409.3 7'466.4 9'955.3 8'842.2 9'537.2 7'253.7 6'247.1 7'102.5 816.0 1'333.0
10.06x 22.39x 18.38x 9.06x 10.11x 7.24x 5.89x 12.11x 10.34x 13.43x 12.00x
EBITDA 17'592.96 Long-Term Rating Date -
EBIT 12'895.77 Long-Term Rating -
Operating Margin 14.77% Long-Term Outlook -
Pretax Margin 14.65% Short-Term Rating Date -
Return on Assets 3.87% Short-Term Rating -
Return on Common Equity 8.12%
Return on Capital 6.11% EBITDA/Interest Exp. 7.75
Asset Turnover 0.46% (EBITDA-Capex)/Interest Exp. -4.39
Net Debt/EBITDA 2.31
Gross Margin 19.8% Total Debt/EBITDA 3.37
EBITDA Margin 19.6%
EBIT Margin 13.1% Total Debt/Equity 55.5%
Net Income Margin 10.1% Total Debt/Capital 32.2%
Asset Turnover 0.46
Current Ratio 1.45 Net Fixed Asset Turnover 0.98
Quick Ratio 1.00 Accounts receivable turnover-days 53.12
Debt to Assets 25.90% Inventory Days 40.67
Tot Debt to Common Equity 55.45% Accounts Payable Turnover Day 76.52
Accounts Receivable Turnover 6.87 Cash Conversion Cycle 11.72
Inventory Turnover 8.97
Fiscal Year Ended
China Coal Energy Co LtdPrice/Volume
Valuation Analysis
18'187'946.00
Current Price (9/dd/yy) Market Data
Net Income
P/E
Market Capitalization
Average Daily Trading Volume
Relative Stock Price Performance
Total Revenue
TEV/Revenue
EBITDA
TEV/EBITDA
Profitability S&P Issuer Ratings
Credit Ratios
Margin Analysis
Reference
Structure
,-.0123456
o!-. l!-. k!-. a!-. g!-0 c!-0 j!-0 Q!-0 j!-0 g!-0 g!-0 Q!-0 o!-0', F2', F-,', F-2', F.,', F.2', F0,', F02', F1,', F12', F
0.0
10'000.0
20'000.0
30'000.0
40'000.0
50'000.0
60'000.0
70'000.0
80'000.0
90'000.0
100'000.0
2001 2002 2003 2004 2005 2006 2007 2008 2009 2010 2011 2012
,',,
.',,
1',,
3',,
5',,
-,',,
-.',,
-1',,
-3',,
,-',-'.,-, ,-',4'.,-, ,-',-'.,-- ,-',4'.,-- ,-',-'.,-. ,-',4'.,-. ,-',-'.,-0 ,-',4'.,-0
FReTn/CTrThoT/PolhirTlAlcST/ !Rna /eis FReTn/CTrThoT/PolhirTlAlcST/ !Rna /eis
Q.M.S Advisors | tel: +41 (0)78 922 08 77 | e-mail: [email protected] |
Page 91
09.09.2013
Holder Name Portfolio Name Source Amt Held % Out Latest Chg File Dt Inst Type
CHINA NATIONAL COAL n/a EXCH 7'508'392'019 82.04 2'520'000 10.10.2012 Government
BLACKROCK ASSET MGMT Multiple Portfolios MF-AGG 29'913'403 0.33 - 30.08.2013 Investment Advisor
CHINA ASSET MANAGEME Multiple Portfolios MF-AGG 19'454'334 0.21 (3'915'503) 31.12.2012 Investment Advisor
DACHENG FUND MANAGME Multiple Portfolios MF-AGG 17'866'291 0.2 (875'210) 31.12.2012 Investment Advisor
HARVEST FUND MANAGEM Multiple Portfolios MF-AGG 15'803'004 0.17 (10'041'330) 31.12.2012 Investment Advisor
YINHUA FUND MANAGEME Multiple Portfolios MF-AGG 13'203'152 0.14 (18'134'963) 31.12.2012 Investment Advisor
CSOP ASSET MANAGEMEN Multiple Portfolios MF-AGG 11'435'922 0.12 - 02.09.2013 Investment Advisor
BOSHI FUND MANAGEMEN Multiple Portfolios MF-AGG 10'660'657 0.12 7'224'957 31.12.2012 Investment Advisor
CAISSE DE DEPOT ET P Multiple Portfolios MF-AGG 9'960'480 0.11 - 31.12.2012 Investment Advisor
HUATAI-PINEBRIDGE FU Multiple Portfolios MF-AGG 8'460'396 0.09 (6'167'895) 31.12.2012 Investment Advisor
GTJA ALLIANZ FUND MA Multiple Portfolios MF-AGG 5'879'022 0.06 657'481 31.12.2012 Investment Advisor
HUAAN FUND MANAGEMEN Multiple Portfolios MF-AGG 5'793'172 0.06 (405'646) 31.12.2012 Investment Advisor
TIANTONG ASSET MANAG Multiple Portfolios MF-AGG 3'652'959 0.04 (3'645) 31.12.2012 Investment Advisor
CHINA ASSET MANAGEME Multiple Portfolios MF-AGG 3'644'792 0.04 - 02.09.2013 Investment Advisor
ICBC CREDIT SUISSE A Multiple Portfolios MF-AGG 3'079'684 0.03 (1'326'950) 31.12.2012 Investment Advisor
FULLGOAL FUND MANAGE Multiple Portfolios MF-AGG 2'895'312 0.03 1'073'840 31.12.2012 Investment Advisor
E FUND MANAGEMENT Multiple Portfolios MF-AGG 2'775'595 0.03 (2'396'643) 31.12.2012 Investment Advisor
CHINA UNIVERSAL ASSE Multiple Portfolios MF-AGG 2'757'992 0.03 (149'407) 02.09.2013 Investment Advisor
FORTUNE SGAM FUND MA Multiple Portfolios MF-AGG 2'346'871 0.03 85'148 31.12.2012 Investment Advisor
BOSERA FUND MANAGEME Multiple Portfolios MF-AGG 2'230'625 0.02 985'106 31.12.2012 Investment Advisor
Firm Name Analyst Recommendation Weighting Change Target Price Date Date
GF Securities Co. Ltd. AN PENG add 4 M #N/A N/A Not Provided 03.09.2013
Bank of China International LAWRENCE LAU hold 3 M 4 Not Provided 22.08.2013
China International Capital Corp CAI HONGYU hold 3 U #N/A N/A Not Provided 21.08.2013
JPMorgan DANIEL KANG neutral 3 M 6 3 month 20.08.2013
SWS Research Co Ltd LIU XIAONING outperform 5 M #N/A N/A Not Provided 20.08.2013
Qilu Securities Co Ltd ZHAOLIANG LIU add 4 U #N/A N/A Not Provided 20.08.2013
Everbright Securities Co., Ltd CHEN HAOWU accumulate 4 M 9 12 month 17.08.2013
China Minzu Securities Co Ltd LI JING add 4 M 9 6 month 12.08.2013
UBS MICK MI neutral 3 M 5 12 month 23.07.2013
Goldman Sachs JULIAN ZHU neutral/neutral 3 M 5 12 month 08.07.2013
Northeast Securities Co Ltd WANG SHI add 4 M #N/A N/A Not Provided 30.06.2013
Masterlink Securities LI XIN hold 3 M 8 Not Provided 21.05.2013
Founder Securities SUN CAN add 4 M 13 12 month 23.04.2013
Hong Yuan Securities WANG JINGLE add 4 M #N/A N/A Not Provided 16.04.2013
Guodu Securities Co Ltd WANG SHUBAO strong buy 5 M #N/A N/A Not Provided 09.04.2013
Guotai Junan YIN XILONG add 4 M 9 12 month 17.03.2013
Rising Securities Co.,LTD XUE MINGJIE outperform 5 N #N/A N/A Not Provided 23.11.2012
HuaChuang Securities HAN ZHENGUO buy 5 M 11 6 month 03.09.2012
PingAn Securities WANG CHENG buy 5 M 14 6 month 29.06.2012
AJ Securities WANG SIWEI neutral 3 D #N/A N/A Not Provided 28.06.2012
Citic Securities Co., Ltd LUO ZETING buy 5 M 14 6 month 27.06.2012
HSBC SARAH MAK overweight 5 M 12 Not Provided 29.03.2012
Great Wall Securities LIU FEI buy 5 M #N/A N/A Not Provided 28.03.2012
Tebon Securities Co Ltd LI XIANGFENG neutral 3 M #N/A N/A Not Provided 13.02.2012
Industrial Securities LIU JIANGANG buy 5 M 11 12 month 18.12.2011
Central China Securities PAN HANGJUN buy 5 M #N/A N/A Not Provided 09.12.2011
China Securities Co., Ltd LI JUNSONG neutral 3 N 11 Not Provided 08.12.2010
China Investment Securities XIAO HANPING buy 5 D #N/A N/A Not Provided 05.07.2010
China Galaxy Securities ZHAO KE neutral 3 N 8 Not Provided 19.03.2009
Holdings By:
China Coal Energy Co Ltd ee
Q.M.S Advisors | tel: +41 (0)78 922 08 77 | e-mail: [email protected] |
Page 92
09.09.2013
CSR Corp Ltd provides a wide range of rolling stock products and services. The
Company's products include locomotives, passenger carriages, freight wagons,
MUs, rapid transit vehicles and key related components.
Latest Fiscal Year: 12/2012
LTM as of: 06/yy
52-Week High (05.02.2013) 5.24
52-Week Low (09.07.2013) 3.32
Daily Volume
4.11
52-Week High % Change -21.56% Dividend Yield -
52-Week Low % Change 23.80% Beta 1.11
% 52 Week Price Range High/Low 34.90% Equity Float 2'887.02
Shares Out 30.06.2013 11'779.0 Short Int -
57'517.71 1 Yr Total Return -1.61%
Total Debt 22'271.08 YTD Return -14.90%
Preferred Stock 0.0 Adjusted BETA 1.105
Minority Interest 6'754.4 Analyst Recs 19
Cash and Equivalents 14'504.61 Consensus Rating 4.526
Enterprise Value 70'169.41
Average Volume 5 Day 30'922'970
601766 CH EQUITY YTD Change - Average Volume 30 Day 42'622'570
601766 CH EQUITY YTD % CHANGE - Average Volume 3 Month 44'507'610
LTM-4Q LTM FY+1 FY+2 FQ+1 FQ+2
31.12.2008 31.12.2009 31.12.2010 31.12.2011 31.12.2012 06/yy 06/yy 12/13 Y 12/14 Y 06/12 Q2 09/12 Q3
35'092.8 45'620.8 64'132.4 79'517.0 89'019.4 82'637.1 84'496.7 94'943.8 110'672.0 21'293.0 21'866.0
1.37x 1.49x 1.55x 0.75x 0.84x 3.28x 3.38x 0.60x 0.52x - -
2'788.2 3'293.5 4'943.7 7'310.0 7'490.2 0.0 0.0 6'879.4 8'116.0 1'480.0 1'368.0
17.27x 20.63x 20.10x 8.11x 10.03x 0.00x 0.00x 10.20x 8.65x - -
1'384.2 1'678.2 2'526.3 3'864.2 4'009.5 3'738.2 3'552.2 4'004.3 4'938.0 1'082.5 957.0
27.45x 40.07x 35.45x 13.28x 16.59x 14.72x 13.80x 13.65x 11.11x - -
EBITDA 7'490.23 Long-Term Rating Date -
EBIT 5'707.26 Long-Term Rating -
Operating Margin 6.41% Long-Term Outlook -
Pretax Margin 6.28% Short-Term Rating Date -
Return on Assets 3.41% Short-Term Rating -
Return on Common Equity 11.17%
Return on Capital 7.86% EBITDA/Interest Exp. 9.04
Asset Turnover 0.80% (EBITDA-Capex)/Interest Exp. 3.25
Net Debt/EBITDA 0.79
Gross Margin 17.7% Total Debt/EBITDA 3.01
EBITDA Margin 7.4%
EBIT Margin 5.2% Total Debt/Equity 68.0%
Net Income Margin 4.5% Total Debt/Capital 36.0%
Asset Turnover 0.80
Current Ratio 1.17 Net Fixed Asset Turnover 3.08
Quick Ratio 0.73 Accounts receivable turnover-days 145.25
Debt to Assets 21.17% Inventory Days 103.96
Tot Debt to Common Equity 67.99% Accounts Payable Turnover Day 135.27
Accounts Receivable Turnover 2.51 Cash Conversion Cycle 72.35
Inventory Turnover 3.51
Profitability S&P Issuer Ratings
Credit Ratios
Margin Analysis
Reference
Structure
Net Income
P/E
Market Capitalization
Average Daily Trading Volume
Relative Stock Price Performance
Total Revenue
TEV/Revenue
EBITDA
TEV/EBITDA
Fiscal Year Ended
CSR Corp LtdPrice/Volume
Valuation Analysis
81'398'925.00
Current Price (9/dd/yy) Market Data
,
-
.
0
1
2
3
o!-. l!-. k!-. a!-. g!-0 c!-0 j!-0 Q!-0 j!-0 g!-0 g!-0 Q!-0 o!-0', F
2,', F
-,,', F
-2,', F
.,,', F
.2,', F
0,,', F
0.0
10'000.0
20'000.0
30'000.0
40'000.0
50'000.0
60'000.0
70'000.0
80'000.0
90'000.0
100'000.0
2001 2002 2003 2004 2005 2006 2007 2008 2009 2010 2011 2012,',,
,'.,
,'1,
,'3,
,'5,
-',,
-'.,
FReTn/CTrThoT/PolhirTlAlcST/ !Rna /eis FReTn/CTrThoT/PolhirTlAlcST/ !Rna /eis
Q.M.S Advisors | tel: +41 (0)78 922 08 77 | e-mail: [email protected] |
Page 93
09.09.2013
Holder Name Portfolio Name Source Amt Held % Out Latest Chg File Dt Inst Type
CHINA SOUTH LOCOMOTI n/a EXCH 7'796'321'142 66.19 - 29.08.2013 Government
SOCIAL SECURITY FUND n/a Co File 479'465'300 4.07 - 31.12.2012 Government
CHINA POST CORE GROW n/a EXCH 150'750'000 1.28 - 15.03.2012 n/a
GREAT WALL FUND MANA Multiple Portfolios MF-AGG 146'187'448 1.24 7'270'232 30.06.2013 Investment Advisor
EFUND MGMT CO LTD n/a EXCH 107'623'300 0.91 - 15.03.2012 n/a
GREAT WALL BRAND STO n/a EXCH 105'030'845 0.89 - 15.03.2012 n/a
CHINA SOUTHERN FUND Multiple Portfolios MF-AGG 104'155'155 0.88 (3'001'917) 31.12.2012 Investment Advisor
CSR CAPITAL COMPANY n/a EXCH 93'085'715 0.79 - 29.08.2013 Government
HARVEST FUND MANAGEM Multiple Portfolios MF-AGG 90'375'189 0.77 43'471'799 31.12.2012 Investment Advisor
YINHUA FUND MANAGEME Multiple Portfolios MF-AGG 81'974'839 0.7 29'053'080 31.12.2012 Investment Advisor
CHINA SOUTH LONG YUA n/a EXCH 78'000'000 0.66 - 15.03.2012 n/a
PENGHUA FUND MGMT CO n/a EXCH 71'748'800 0.61 - 15.03.2012 n/a
RONGTONG FUND MANAGE Multiple Portfolios MF-AGG 71'232'024 0.6 57'253'141 31.12.2012 Investment Advisor
ANHUI INVESTMENT GRO n/a Co File 69'506'700 0.59 - 31.12.2012 Government
HARVEST FUND MGMT CO n/a EXCH 67'264'500 0.57 - 15.03.2012 n/a
CHINA NATIONAL MACHI n/a Co File 67'264'500 0.57 - 31.12.2012 Government
CH RAILWAY MATERIALS n/a Co File 67'264'500 0.57 - 31.12.2012 Corporation
CHINA ASSET MANAGEME Multiple Portfolios MF-AGG 40'513'846 0.34 (16'688'910) 31.12.2012 Investment Advisor
AEGON-INDUST FUND MG n/a EXCH 38'116'500 0.32 - 15.03.2012 n/a
CHANGSHENG FUND MANA Multiple Portfolios MF-AGG 37'572'928 0.32 33'299'991 31.12.2012 Investment Advisor
Firm Name Analyst Recommendation Weighting Change Target Price Date Date
Capital Securities Corp LI XIAOLU buy 5 U 5 Not Provided 28.08.2013
Bank of China International XU MINLE buy 5 M 5 Not Provided 28.08.2013
GF Securities Co. Ltd. LUO LIBO add 4 M #N/A N/A Not Provided 28.08.2013
China International Capital Corp WU HUIMIN accumulate 4 M #N/A N/A Not Provided 28.08.2013
Fortune CLSA Securities Limited JIE LI buy 5 M 6 12 month 28.08.2013
Chang Jiang Securities Co. Limited LI JIA buy 5 N #N/A N/A Not Provided 27.08.2013
Everbright Securities Co., Ltd LU ZHOU buy 5 M 5 12 month 18.08.2013
Goldman Sachs TIAN LU neutral/neutral 3 M 5 12 month 11.08.2013
UBS RICHARD WEI buy 5 M 5 12 month 08.08.2013
Guodu Securities Co Ltd XIAO SHIJUN buy 5 N #N/A N/A Not Provided 06.08.2013
Hong Yuan Securities QU YONGZHONG buy 5 M #N/A N/A Not Provided 24.07.2013
Guotai Junan WANG FAN buy 5 M 6 Not Provided 24.07.2013
SWS Research Co Ltd SANFORD ZHAO outperform 5 M #N/A N/A Not Provided 19.07.2013
Jefferies JULIAN BU underperform 1 M 3 12 month 02.04.2013
PingAn Securities GUOJI YE buy 5 M #N/A N/A Not Provided 04.03.2013
HuaChuang Securities QU XIAOXI strong buy 5 M #N/A N/A Not Provided 13.01.2013
Tebon Securities Co Ltd LI XIANGFENG outperform 5 N #N/A N/A Not Provided 31.12.2012
Northeast Securities Co Ltd LI KUN buy 5 U #N/A N/A Not Provided 04.12.2012
Central China Securities XU MINFENG add 4 M #N/A N/A Not Provided 26.11.2012
China Securities Co., Ltd FUZHANG FENG add 4 M 5 Not Provided 25.06.2012
China Merchants Securities LIU RONG buy 5 M #N/A N/A Not Provided 08.05.2012
Founder Securities PENG MIN add 4 M #N/A N/A Not Provided 04.05.2012
Industrial Securities WU HUA buy 5 M #N/A N/A Not Provided 19.04.2012
China Minzu Securities Co Ltd CAIXIA FU add 4 M #N/A N/A Not Provided 05.03.2012
Citic Securities Co., Ltd TEAM COVERAGE buy 5 M #N/A N/A Not Provided 12.08.2010
China Galaxy Securities JU HOULIN buy 5 M 5 Not Provided 01.06.2010
Holdings By:
CSR Corp Ltd ee
Q.M.S Advisors | tel: +41 (0)78 922 08 77 | e-mail: [email protected] |
Page 94
09.09.2013
New China Life Insurance Company Limited provides life insurance in local and
foreign currencies, acts as an insurance agent, provides checks, claims and
insurance consulting. The Company's main products include life insurance,
accident insurance, health insurance products and services.
Latest Fiscal Year: 12/2011
LTM as of: 06/yy
52-Week High (04.02.2013) 32.36
52-Week Low (30.11.2012) 17.63
Daily Volume
23.98
52-Week High % Change -25.90% Dividend Yield 0.00
52-Week Low % Change 36.02% Beta -
% 52 Week Price Range High/Low 35.44% Equity Float 633.64
Shares Out 30.06.2013 2'085.4 Short Int -
68'618.72 1 Yr Total Return -13.86%
Total Debt 70'437.00 YTD Return -16.79%
Preferred Stock 0.0 Adjusted BETA -
Minority Interest 8.0 Analyst Recs 17
Cash and Equivalents 25'066.00 Consensus Rating 4.000
Enterprise Value -
Average Volume 5 Day 6'208'551
601336 CH EQUITY YTD Change - Average Volume 30 Day 7'639'924
601336 CH EQUITY YTD % CHANGE - Average Volume 3 Month 10'726'520
LTM-4Q LTM FY+1 FY+2 FQ+1 FQ+2
31.12.2008 31.12.2009 31.12.2010 31.12.2011 31.12.2012 06/yy 06/yy 12/13 Y 12/14 Y 09/13 Q3 12/13 Q4
48'899.0 73'904.0 102'657.0 108'404.0 111'662.0 64'887.0 109'452.0 123'542.0 134'604.0 - -
- - - 0.93x 1.16x 0.00x 0.00x 0.49x 0.42x - -
- - - - - 0.0 0.0 - - - -
- - - - - 0.00x 0.00x - - - -
649.0 2'660.0 2'249.0 2'799.0 2'933.0 1'904.0 3'216.0 3'808.3 5'028.8 600.0 1'500.0
- - - 16.81x 25.20x 0.00x 18.35x 19.97x 15.94x - -
EBITDA - Long-Term Rating Date -
EBIT - Long-Term Rating -
Operating Margin 3.61% Long-Term Outlook -
Pretax Margin 2.05% Short-Term Rating Date -
Return on Assets 0.67% Short-Term Rating -
Return on Common Equity 8.73%
Return on Capital - EBITDA/Interest Exp. -
Asset Turnover 0.25% (EBITDA-Capex)/Interest Exp. -
Net Debt/EBITDA -
Gross Margin - Total Debt/EBITDA -
EBITDA Margin -
EBIT Margin - Total Debt/Equity 196.4%
Net Income Margin 2.6% Total Debt/Capital 66.3%
Asset Turnover 0.25
Current Ratio - Net Fixed Asset Turnover -
Quick Ratio - Accounts receivable turnover-days -
Debt to Assets 14.27% Inventory Days -
Tot Debt to Common Equity 196.37% Accounts Payable Turnover Day -
Accounts Receivable Turnover - Cash Conversion Cycle -
Inventory Turnover -
Profitability S&P Issuer Ratings
Credit Ratios
Margin Analysis
Reference
Structure
Net Income
P/E
Market Capitalization
Average Daily Trading Volume
Relative Stock Price Performance
Total Revenue
TEV/Revenue
EBITDA
TEV/EBITDA
Fiscal Year Ended
New China Life Insurance Co LtdPrice/Volume
Valuation Analysis
24'694'949.00
Current Price (9/dd/yy) Market Data
,
2
-,
-2
.,
.2
0,
02
o!-. l!-. k!-. a!-. g!-0 c!-0 j!-0 Q!-0 j!-0 g!-0 g!-0 Q!-0 o!-0', F2', F-,', F-2', F.,', F.2', F0,', F02', F1,', F12', F
0.0
20'000.0
40'000.0
60'000.0
80'000.0
100'000.0
120'000.0
2001 2002 2003 2004 2005 2006 2007 2008 2009 2010 2011 2012
,',,
,'.,
,'1,
,'3,
,'5,
-',,
-'.,
-'1,
-'3,
,-',-'.,-, ,-',4'.,-, ,-',-'.,-- ,-',4'.,-- ,-',-'.,-. ,-',4'.,-. ,-',-'.,-0 ,-',4'.,-0
FReTn/CTrThoT/PolhirTlAlcST/ !Rna /eis FReTn/CTrThoT/PolhirTlAlcST/ !Rna /eis
Q.M.S Advisors | tel: +41 (0)78 922 08 77 | e-mail: [email protected] |
Page 95
09.09.2013
Holder Name Portfolio Name Source Amt Held % Out Latest Chg File Dt Inst Type
CHINA INVESTMENT COR n/a ULT-AGG 976'233'686 46.81 2'060'532 16.06.2013 Investment Advisor
BAOSTEEL GROUP CORP n/a Co File 471'212'186 22.6 - 31.12.2012 Government
HB DEREN INVEST n/a Co File 124'825'942 5.99 - 31.12.2012 Other
CENTURY GOLDEN RESOU n/a Co File 78'000'000 3.74 - 31.12.2012 Investment Advisor
TIBET SHANNAN XINSHA n/a Co File 45'288'722 2.17 - 31.12.2012 Other
DACHENG FUND MANAGME Multiple Portfolios MF-AGG 21'393'672 1.03 15'231'645 31.12.2012 Investment Advisor
BOSHI FUND MANAGEMEN Multiple Portfolios MF-AGG 15'577'219 0.75 7'973'622 30.06.2013 Investment Advisor
BLACKROCK ASSET MGMT Multiple Portfolios MF-AGG 12'224'505 0.59 - 30.08.2013 Investment Advisor
CHINA ASSET MANAGEME Multiple Portfolios MF-AGG 7'596'337 0.36 4'430'922 31.12.2012 Investment Advisor
CSOP ASSET MANAGEMEN Multiple Portfolios MF-AGG 4'887'259 0.23 - 02.09.2013 Investment Advisor
CCB PRINCIPAL ASSET Multiple Portfolios MF-AGG 4'565'437 0.22 (10'732'141) 31.12.2012 Investment Advisor
NANSONG ZHU n/a Co File 4'350'000 0.21 - 31.12.2012 n/a
YINHUA FUND MANAGEME Multiple Portfolios MF-AGG 4'156'340 0.2 (4'024'023) 31.12.2012 Investment Advisor
BANK OF COMMUNICATIO Multiple Portfolios MF-AGG 3'673'015 0.18 (6'202'365) 31.12.2012 Investment Advisor
HARVEST FUND MANAGEM Multiple Portfolios MF-AGG 2'701'336 0.13 (926'549) 31.12.2012 Investment Advisor
CHANGSHENG FUND MANA Multiple Portfolios MF-AGG 2'382'868 0.11 2'377'668 31.12.2012 Investment Advisor
ABC-CA FUND MANAGEME Multiple Portfolios MF-AGG 2'255'222 0.11 614'358 31.12.2012 Investment Advisor
INVESCO GREAT WALL F Multiple Portfolios MF-AGG 2'010'843 0.1 (2'515'910) 31.12.2012 Investment Advisor
HUAAN FUND MANAGEMEN Multiple Portfolios MF-AGG 1'689'090 0.08 399'925 31.12.2012 Investment Advisor
NEW CAPITAL FUND MAN NEW CAPITAL UCITS FU MF-PART 1'648'008 0.08 - 28.06.2013 Investment Advisor
Firm Name Analyst Recommendation Weighting Change Target Price Date Date
Chang Jiang Securities Co. Limited LIU JUN add 4 M #N/A N/A Not Provided 02.09.2013
Guotai Junan PENG YULONG buy 5 M 25 12 month 01.09.2013
Northeast Securities Co Ltd XINAN ZHAO add 4 M #N/A N/A Not Provided 29.08.2013
JPMorgan MW KIM neutral 3 M 25 9 month 28.08.2013
HSBC MICHAEL P CHANG neutral 3 M 24 Not Provided 28.08.2013
Capital Securities Corp TEAM COVERAGE hold 3 M #N/A N/A Not Provided 28.08.2013
GF Securities Co. Ltd. CONG LI buy 5 M #N/A N/A Not Provided 28.08.2013
China International Capital Corp TANG SHENGBO hold 3 M 19 12 month 28.08.2013
PingAn Securities GRACE LI buy 5 M #N/A N/A Not Provided 28.08.2013
Credit Suisse FRANCES FENG neutral 3 M 21 Not Provided 27.08.2013
Everbright Securities Co., Ltd ZIPEI TANG accumulate 4 M #N/A N/A Not Provided 05.08.2013
SWS Research Co Ltd TINA SUN outperform 5 M #N/A N/A Not Provided 24.07.2013
Goldman Sachs MANCY SUN neutral/neutral 3 D 30 12 month 16.05.2013
Sinolink Securities Co Ltd JIANGANG CHEN add 4 N #N/A N/A Not Provided 02.05.2013
Bank of China International SUN PENG buy 5 M 23 Not Provided 23.01.2013
HuaChuang Securities GAO LI buy 5 M 30 6 month 12.12.2012
Hong Yuan Securities HUANG LIJUN add 4 M #N/A N/A Not Provided 27.11.2012
Founder Securities WEI ZHOU add 4 N #N/A N/A Not Provided 30.08.2012
China Merchants Securities LUO YI strong buy 5 M 35 6 month 26.07.2012
Citic Securities Co., Ltd PAN HONGWEN buy 5 M #N/A N/A Not Provided 24.07.2012
Industrial Securities ZHANG YINGJUAN buy 5 M #N/A N/A Not Provided 27.04.2012
Holdings By:
New China Life Insurance Co Ltd ee
Q.M.S Advisors | tel: +41 (0)78 922 08 77 | e-mail: [email protected] |
Page 96
09.09.2013
China Communications Construction Company Ltd. is a transportation
infrastructure group. The Company is involved in infrastructure construction,
infrastructure design, dredging, and port machinery manufacturing. China
Communications has operations worldwide.
Latest Fiscal Year: 12/2011
LTM as of: 06/yy
52-Week High (05.02.2013) 5.79
52-Week Low (22.07.2013) 3.80
Daily Volume
4.19
52-Week High % Change -27.63% Dividend Yield -
52-Week Low % Change 10.26% Beta -
% 52 Week Price Range High/Low 12.06% Equity Float 1'154.55
Shares Out 30.06.2013 11'747.2 Short Int -
70'992.50 1 Yr Total Return -1.96%
Total Debt 144'245.00 YTD Return -17.31%
Preferred Stock 0.0 Adjusted BETA -
Minority Interest 9'454.0 Analyst Recs 4
Cash and Equivalents 69'029.00 Consensus Rating 4.250
Enterprise Value 183'939.88
Average Volume 5 Day 19'761'460
601800 CH EQUITY YTD Change - Average Volume 30 Day 16'919'600
601800 CH EQUITY YTD % CHANGE - Average Volume 3 Month 17'954'280
LTM-4Q LTM FY+1 FY+2 FQ+1 FQ+2
31.12.2008 31.12.2009 31.12.2010 31.12.2011 31.12.2012 06/yy 06/yy 12/13 Y 12/14 Y 09/13 Q3 12/13 Q4
176'054.1 226'920.0 272'734.0 294'281.0 295'321.0 121'783.9 307'727.4 325'776.0 349'208.0 - -
0.92x 0.64x 0.51x 0.49x 0.59x 2.92x 1.68x - - - -
13'432.1 16'122.0 18'384.0 21'463.0 25'045.0 0.0 0.0 27'900.0 30'425.5 - -
12.11x 9.02x 7.55x 6.73x 6.93x 0.00x 0.00x 6.59x 6.05x - -
5'875.4 7'200.0 9'599.0 11'761.0 12'248.0 4'850.0 12'828.3 13'237.3 14'176.0 - -
21.05x 13.35x 8.87x 6.23x 7.81x 0.00x 3.34x 5.13x 4.75x - -
EBITDA 25'045.00 Long-Term Rating Date -
EBIT 18'058.00 Long-Term Rating -
Operating Margin 6.11% Long-Term Outlook -
Pretax Margin 5.25% Short-Term Rating Date -
Return on Assets 2.85% Short-Term Rating -
Return on Common Equity 14.83%
Return on Capital - EBITDA/Interest Exp. 3.64
Asset Turnover 0.70% (EBITDA-Capex)/Interest Exp. 2.52
Net Debt/EBITDA -
Gross Margin 11.0% Total Debt/EBITDA -
EBITDA Margin -
EBIT Margin 6.0% Total Debt/Equity 166.3%
Net Income Margin 4.1% Total Debt/Capital 60.0%
Asset Turnover 0.70
Current Ratio 1.07 Net Fixed Asset Turnover 4.94
Quick Ratio 0.47 Accounts receivable turnover-days 68.71
Debt to Assets 33.25% Inventory Days 132.00
Tot Debt to Common Equity 166.28% Accounts Payable Turnover Day 121.23
Accounts Receivable Turnover 5.31 Cash Conversion Cycle 39.20
Inventory Turnover 2.77
Fiscal Year Ended
China Communications Construction Co LtdPrice/Volume
Valuation Analysis
44'281'661.00
Current Price (9/dd/yy) Market Data
Net Income
P/E
Market Capitalization
Average Daily Trading Volume
Relative Stock Price Performance
Total Revenue
TEV/Revenue
EBITDA
TEV/EBITDA
Profitability S&P Issuer Ratings
Credit Ratios
Margin Analysis
Reference
Structure
,
-
.
0
1
2
3
o!-. l!-. k!-. a!-. g!-0 c!-0 j!-0 Q!-0 j!-0 g!-0 g!-0 Q!-0 o!-0', F-,', F.,', F0,', F1,', F2,', F3,', F4,', F5,', F6,', F
0.0
50'000.0
100'000.0
150'000.0
200'000.0
250'000.0
300'000.0
350'000.0
2001 2002 2003 2004 2005 2006 2007 2008 2009 2010 2011 2012
,',,
.',,
1',,
3',,
5',,
-,',,
-.',,
-1',,
,-',-'.,-, ,-',4'.,-, ,-',-'.,-- ,-',4'.,-- ,-',-'.,-. ,-',4'.,-. ,-',-'.,-0 ,-',4'.,-0
FReTn/CTrThoT/PolhirTlAlcST/ !Rna /eis FReTn/CTrThoT/PolhirTlAlcST/ !Rna /eis
Q.M.S Advisors | tel: +41 (0)78 922 08 77 | e-mail: [email protected] |
Page 97
09.09.2013
Holder Name Portfolio Name Source Amt Held % Out Latest Chg File Dt Inst Type
CHINA COMM CONSTRUCT n/a EXCH 10'314'907'379 87.81 9'999'972 18.10.2012 Corporation
SOCIAL SECURITY FUND n/a EXCH 92'592'593 0.79 - 08.03.2012 Government
CHINA SHIPPING INVES n/a EXCH 92'592'000 0.79 - 08.03.2012 Corporation
SANY GROUP CO LTD n/a EXCH 55'555'000 0.47 - 08.03.2012 Corporation
CHINA ASSET MANAGEME Multiple Portfolios MF-AGG 44'602'343 0.38 44'602'343 31.12.2012 Investment Advisor
BOSHI FUND MANAGEMEN Multiple Portfolios MF-AGG 38'236'845 0.33 38'236'845 31.12.2012 Investment Advisor
SHANGHAI PORT & SHIP n/a EXCH 37'037'000 0.32 - 08.03.2012 Government
HARVEST FUND MANAGEM Multiple Portfolios MF-AGG 34'220'370 0.29 7'344'845 31.12.2012 Investment Advisor
CITIC SECURITIES CO n/a ULT-AGG 34'106'863 0.29 - 08.03.2012 Investment Advisor
BOCI CHINA LTD n/a EXCH 34'096'642 0.29 - 08.03.2012 Corporation
GUOTAI JUNAN SECURIT n/a EXCH 34'096'642 0.29 - 08.03.2012 Investment Advisor
E FUND INVESTMENT BO n/a EXCH 25'400'000 0.22 - 08.03.2012 n/a
BLACKROCK ASSET MGMT Multiple Portfolios MF-AGG 23'262'479 0.2 - 30.08.2013 Investment Advisor
HUAAN TACTICAL SELEC n/a EXCH 20'000'000 0.17 - 08.03.2012 n/a
CHINA LIFE INSURANCE n/a ULT-AGG 20'000'000 0.17 - 08.03.2012 Government
YINHUA FUND MANAGEME Multiple Portfolios MF-AGG 19'767'149 0.17 19'063'449 31.12.2012 Investment Advisor
TIANHONG ASSET MANAG Multiple Portfolios MF-AGG 16'565'626 0.14 16'565'626 31.12.2012 Investment Advisor
CHINA SOUTHERN FUND Multiple Portfolios MF-AGG 14'174'634 0.12 14'174'634 31.12.2012 Investment Advisor
E FUND MANAGEMENT Multiple Portfolios MF-AGG 10'865'722 0.09 5'015'722 31.12.2012 Investment Advisor
CAISSE DE DEPOT ET P Multiple Portfolios MF-AGG 10'604'955 0.09 - 31.12.2012 Investment Advisor
Firm Name Analyst Recommendation Weighting Change Target Price Date Date
Bank of China International LI PAN buy 5 M 5 Not Provided 28.08.2013
China International Capital Corp YUE DING accumulate 4 M #N/A N/A Not Provided 28.08.2013
Goldman Sachs TIAN LU neutral/neutral 3 M 4 12 month 11.08.2013
Citic Securities Co., Ltd YANG TAO buy 5 M #N/A N/A Not Provided 04.12.2012
Holdings By:
China Communications Construction Co Ltd ee
Q.M.S Advisors | tel: +41 (0)78 922 08 77 | e-mail: [email protected] |
Page 98
09.09.2013
China Railway Group Ltd. offers transportation systems construction services.
The Company builds railroads, roads, tunnels, and bridges.
Latest Fiscal Year: 12/2011
LTM as of: 06/yy
52-Week High (15.01.2013) 3.41
52-Week Low (25.06.2013) 2.30
Daily Volume
2.81
52-Week High % Change -17.60% Dividend Yield 1.85
52-Week Low % Change 22.17% Beta 1.02
% 52 Week Price Range High/Low 39.64% Equity Float 5'142.14
Shares Out 30.06.2013 17'092.5 Short Int -
62'509.09 1 Yr Total Return 10.95%
Total Debt 163'026.00 YTD Return -5.84%
Preferred Stock 0.0 Adjusted BETA 1.020
Minority Interest 10'199.0 Analyst Recs 9
Cash and Equivalents 67'943.00 Consensus Rating 4.444
Enterprise Value 206'303.77
Average Volume 5 Day 31'253'460
601390 CH EQUITY YTD Change - Average Volume 30 Day 30'065'320
601390 CH EQUITY YTD % CHANGE - Average Volume 3 Month 31'760'050
LTM-4Q LTM FY+1 FY+2 FQ+1 FQ+2
31.12.2008 31.12.2009 31.12.2010 31.12.2011 31.12.2012 06/yy 06/yy 12/13 Y 12/14 Y 09/13 Q3 12/13 Q4
227'245.5 334'045.0 456'162.0 442'216.0 465'625.0 422'280.1 516'632.8 529'463.6 569'363.2 - -
0.55x 0.43x 0.29x 0.30x 0.37x 1.35x 1.51x - - - -
10'036.8 12'946.0 15'702.0 18'977.0 20'070.0 0.0 0.0 22'862.0 25'230.5 - -
12.52x 11.00x 8.38x 6.90x 8.60x 0.00x 0.00x 9.02x 8.18x - -
1'115.2 6'875.0 7'398.0 6'690.0 7'354.0 6'593.5 8'452.3 8'274.0 9'081.0 - -
94.59x 16.47x 13.71x 6.28x 10.56x 8.81x 7.10x 7.32x 6.55x - -
EBITDA 20'070.00 Long-Term Rating Date 23.01.2013
EBIT 13'885.00 Long-Term Rating BBB+
Operating Margin 2.98% Long-Term Outlook STABLE
Pretax Margin 2.38% Short-Term Rating Date -
Return on Assets 1.53% Short-Term Rating -
Return on Common Equity 11.02%
Return on Capital 5.09% EBITDA/Interest Exp. 2.03
Asset Turnover 0.93% (EBITDA-Capex)/Interest Exp. 1.23
Net Debt/EBITDA 6.29
Gross Margin 7.6% Total Debt/EBITDA 10.22
EBITDA Margin 4.1%
EBIT Margin 2.9% Total Debt/Equity 208.5%
Net Income Margin 1.6% Total Debt/Capital 64.8%
Asset Turnover 0.93
Current Ratio 1.19 Net Fixed Asset Turnover 10.53
Quick Ratio 0.48 Accounts receivable turnover-days 75.19
Debt to Assets 29.61% Inventory Days 150.05
Tot Debt to Common Equity 208.49% Accounts Payable Turnover Day 113.78
Accounts Receivable Turnover 4.85 Cash Conversion Cycle 99.63
Inventory Turnover 2.43
Fiscal Year Ended
China Railway Group LtdPrice/Volume
Valuation Analysis
63'352'835.00
Current Price (9/dd/yy) Market Data
Net Income
P/E
Market Capitalization
Average Daily Trading Volume
Relative Stock Price Performance
Total Revenue
TEV/Revenue
EBITDA
TEV/EBITDA
Profitability S&P Issuer Ratings
Credit Ratios
Margin Analysis
Reference
Structure
,
-
-
.
.
0
0
1
o!-. l!-. k!-. a!-. g!-0 c!-0 j!-0 Q!-0 j!-0 g!-0 g!-0 Q!-0 o!-0', F.,', F1,', F3,', F5,', F-,,', F-.,', F-1,', F-3,', F-5,', F
0.0
50'000.0
100'000.0
150'000.0
200'000.0
250'000.0
300'000.0
350'000.0
400'000.0
450'000.0
500'000.0
2001 2002 2003 2004 2005 2006 2007 2008 2009 2010 2011 2012
,',,
-',,
.',,
0',,
1',,
2',,
3',,
4',,
5',,
6',,
-,',,
,-',-'.,-, ,-',4'.,-, ,-',-'.,-- ,-',4'.,-- ,-',-'.,-. ,-',4'.,-. ,-',-'.,-0 ,-',4'.,-0
FReTn/CTrThoT/PolhirTlAlcST/ !Rna /eis FReTn/CTrThoT/PolhirTlAlcST/ !Rna /eis
Q.M.S Advisors | tel: +41 (0)78 922 08 77 | e-mail: [email protected] |
Page 99
09.09.2013
Holder Name Portfolio Name Source Amt Held % Out Latest Chg File Dt Inst Type
CHINA RAILWAY ENGINE n/a Co File 11'950'010'000 69.91 - 31.12.2010 Government
HARVEST FUND MANAGEM Multiple Portfolios MF-AGG 85'666'042 0.5 9'172'778 31.12.2012 Investment Advisor
CHANGSHENG FUND MANA Multiple Portfolios MF-AGG 57'291'375 0.34 55'858'003 31.12.2012 Investment Advisor
BOSHI FUND MANAGEMEN Multiple Portfolios MF-AGG 36'922'255 0.22 27'409'672 31.12.2012 Investment Advisor
CITIGROUP INCORPORAT n/a ULT-AGG 25'864'422 0.15 - 30.06.2008 Investment Advisor
HUATAI-PINEBRIDGE FU Multiple Portfolios MF-AGG 23'697'612 0.14 (48'045) 31.12.2012 Investment Advisor
HUAAN FUND MANAGEMEN Multiple Portfolios MF-AGG 22'241'119 0.13 2'646'383 31.12.2012 Investment Advisor
FULLGOAL FUND MANAGE Multiple Portfolios MF-AGG 22'171'050 0.13 21'568'050 31.12.2012 Investment Advisor
CHINA SOUTHERN FUND Multiple Portfolios MF-AGG 19'146'322 0.11 13'094'979 31.12.2012 Investment Advisor
E FUND MANAGEMENT Multiple Portfolios MF-AGG 15'600'405 0.09 4'159'600 31.12.2012 Investment Advisor
CAISSE DE DEPOT ET P Multiple Portfolios MF-AGG 10'338'437 0.06 - 31.12.2012 Investment Advisor
CHINA ASSET MANAGEME Multiple Portfolios MF-AGG 10'240'322 0.06 - 02.09.2013 Investment Advisor
BOSERA FUND MANAGEME Multiple Portfolios MF-AGG 8'703'166 0.05 7'398'266 31.12.2012 Investment Advisor
CHINA INTERNATIONAL Multiple Portfolios MF-AGG 8'537'101 0.05 8'537'100 31.12.2012 Investment Advisor
HSBC-JINTRUST FUND M Multiple Portfolios MF-AGG 8'328'800 0.05 8'328'800 31.12.2012 Investment Advisor
TIANTONG ASSET MANAG Multiple Portfolios MF-AGG 7'570'902 0.04 (512'601) 31.12.2012 Investment Advisor
BANK OF COMMUNICATIO Multiple Portfolios MF-AGG 6'010'282 0.04 (478'620) 31.12.2012 Investment Advisor
GUOTAI ASSET MANAGEM Multiple Portfolios MF-AGG 5'961'529 0.03 640'965 31.12.2012 Investment Advisor
ICBC CREDIT SUISSE A Multiple Portfolios MF-AGG 5'764'309 0.03 (518'600) 31.12.2012 Investment Advisor
CHINA UNIVERSAL ASSE Multiple Portfolios MF-AGG 5'414'426 0.03 (306'037) 02.09.2013 Investment Advisor
Firm Name Analyst Recommendation Weighting Change Target Price Date Date
Capital Securities Corp LI XIAOLU buy 5 M 3 Not Provided 02.09.2013
Bank of China International LI PAN buy 5 M 3 Not Provided 02.09.2013
Goldman Sachs TIAN LU neutral/neutral 3 M 3 12 month 11.08.2013
SWS Research Co Ltd ERNEST ZHANG outperform 5 M #N/A N/A Not Provided 16.07.2013
Everbright Securities Co., Ltd WANG TIANRUI accumulate 4 N 3 Not Provided 15.04.2013
China International Capital Corp WU HUIMIN accumulate 4 M #N/A N/A Not Provided 21.01.2013
Citic Securities Co., Ltd YANG TAO buy 5 M #N/A N/A Not Provided 04.12.2012
Hong Yuan Securities ZHOU RONGZI add 4 N #N/A N/A Not Provided 30.11.2012
Jefferies JULIAN BU buy 5 M 3 12 month 31.10.2012
China Investment Securities LI FAN buy 5 M #N/A N/A Not Provided 03.08.2011
China Galaxy Securities HAO FEIFEI speculative buy 4 M 7 12 month 30.06.2010
China Minzu Securities Co Ltd XU YONGCHAO add 4 M #N/A N/A Not Provided 18.05.2010
China Securities Co., Ltd TIAN DONGHONG add 4 M 8 Not Provided 02.12.2009
Holdings By:
China Railway Group Ltd ee
Q.M.S Advisors | tel: +41 (0)78 922 08 77 | e-mail: [email protected] |
Page 100
09.09.2013
Datang International Power Generation Company Limited develops and operates
power plants, sells electricity, repairs and maintains power equipment, and
provides power-related technical services.
Latest Fiscal Year: 12/2011
LTM as of: 06/yy
52-Week High (02.07.2013) 5.56
52-Week Low (05.12.2012) 3.68
Daily Volume
4.68
52-Week High % Change -15.83% Dividend Yield 4.49
52-Week Low % Change 27.17% Beta 0.62
% 52 Week Price Range High/Low 50.53% Equity Float 748.43
Shares Out 30.06.2013 9'894.4 Short Int -
55'177.48 1 Yr Total Return 1.09%
Total Debt 179'453.00 YTD Return 18.40%
Preferred Stock 0.0 Adjusted BETA 0.621
Minority Interest 15'001.2 Analyst Recs 11
Cash and Equivalents 4'612.69 Consensus Rating 3.636
Enterprise Value 257'583.64
Average Volume 5 Day 7'439'833
601991 CH EQUITY YTD Change - Average Volume 30 Day 6'956'765
601991 CH EQUITY YTD % CHANGE - Average Volume 3 Month 11'310'620
LTM-4Q LTM FY+1 FY+2 FQ+1 FQ+2
31.12.2008 31.12.2009 31.12.2010 31.12.2011 31.12.2012 06/yy 06/yy 12/13 Y 12/14 Y 09/13 Q3 12/13 Q4
36'900.1 47'942.9 60'672.4 72'381.9 77'598.1 75'326.9 76'975.6 78'691.6 87'005.2 20'659.5 21'071.5
4.90x 4.76x 3.64x 3.08x 3.07x 10.97x 11.84x 3.37x 3.16x - -
9'069.3 14'183.6 16'490.8 18'171.6 22'323.0 0.0 0.0 25'626.3 28'034.0 - -
19.94x 16.09x 13.40x 12.28x 10.66x 0.00x 0.00x 10.05x 9.19x - -
749.4 1'536.6 2'569.7 1'971.2 4'062.3 2'145.1 4'807.1 4'237.3 4'817.3 1'080.0 1'146.5
56.42x 22.69x 11.02x 13.90x 7.68x 15.46x 6.88x 14.14x 12.38x - -
EBITDA 22'322.97 Long-Term Rating Date 25.02.2009
EBIT 13'422.49 Long-Term Rating -
Operating Margin 17.30% Long-Term Outlook -
Pretax Margin 9.78% Short-Term Rating Date -
Return on Assets 1.76% Short-Term Rating -
Return on Common Equity 11.91%
Return on Capital 5.72% EBITDA/Interest Exp. 1.89
Asset Turnover 0.28% (EBITDA-Capex)/Interest Exp. -0.36
Net Debt/EBITDA 7.77
Gross Margin - Total Debt/EBITDA 8.08
EBITDA Margin 31.1%
EBIT Margin 18.9% Total Debt/Equity 430.8%
Net Income Margin 5.2% Total Debt/Capital 76.0%
Asset Turnover 0.28
Current Ratio 0.46 Net Fixed Asset Turnover 0.35
Quick Ratio 0.23 Accounts receivable turnover-days 46.75
Debt to Assets 65.19% Inventory Days -
Tot Debt to Common Equity 430.77% Accounts Payable Turnover Day -
Accounts Receivable Turnover 7.81 Cash Conversion Cycle -
Inventory Turnover -
Profitability S&P Issuer Ratings
Credit Ratios
Margin Analysis
Reference
Structure
Net Income
P/E
Market Capitalization
Average Daily Trading Volume
Relative Stock Price Performance
Total Revenue
TEV/Revenue
EBITDA
TEV/EBITDA
Fiscal Year Ended
Datang International Power Generation Co LtdPrice/Volume
Valuation Analysis
8'199'460.00
Current Price (9/dd/yy) Market Data
,
-
.
0
1
2
3
o!-. l!-. k!-. a!-. g!-0 c!-0 j!-0 Q!-0 j!-0 g!-0 g!-0 Q!-0 o!-0', F2', F-,', F-2', F.,', F.2', F0,', F02', F1,', F12', F2,', F
0.0
10'000.0
20'000.0
30'000.0
40'000.0
50'000.0
60'000.0
70'000.0
80'000.0
90'000.0
2001 2002 2003 2004 2005 2006 2007 2008 2009 2010 2011 2012
,',,
.',,
1',,
3',,
5',,
-,',,
-.',,
-1',,
-3',,
-5',,
.,',,
,-',-'.,-, ,-',4'.,-, ,-',-'.,-- ,-',4'.,-- ,-',-'.,-. ,-',4'.,-. ,-',-'.,-0 ,-',4'.,-0
FReTn/CTrThoT/PolhirTlAlcST/ !Rna /eis FReTn/CTrThoT/PolhirTlAlcST/ !Rna /eis
Q.M.S Advisors | tel: +41 (0)78 922 08 77 | e-mail: [email protected] |
Page 101
09.09.2013
Holder Name Portfolio Name Source Amt Held % Out Latest Chg File Dt Inst Type
CHINA DATANG CORPORA n/a EXCH 4'138'977'414 41.83 - 04.05.2012 Government
TIANJIN JINNENG INVE n/a EXCH 1'311'012'600 13.25 - 30.05.2011 Government
HEBEI PROVINCIAL CON n/a EXCH 1'281'872'927 12.96 - 30.05.2011 Investment Advisor
BEIJING ENERGY INVES n/a EXCH 1'278'988'672 12.93 - 30.05.2011 Holding Company
DONGFANG ELECTRIC CO n/a EXCH 239'960'000 2.43 - 30.05.2011 Government
HARBIN POWER EQUIPME n/a EXCH 200'000'000 2.02 - 30.05.2011 Corporation
AEROSPACE S & I FIN n/a EXCH 169'097'023 1.71 - 30.05.2011 Other
SH TONGHUI INDUST CO n/a EXCH 166'000'000 1.68 - 30.05.2011 Corporation
ZHONGRONGHUI INVEST n/a EXCH 160'000'000 1.62 - 30.05.2011 Corporation
SHANGHAI ELECTRIC GR n/a EXCH 100'000'000 1.01 - 30.05.2011 Government
INNER MONGOLIA YITAI n/a EXCH 100'000'000 1.01 - 30.05.2011 Corporation
LION FUND MANAGEMENT Multiple Portfolios MF-AGG 21'118'097 0.21 (4'721'165) 31.12.2012 Investment Advisor
CAISSE DE DEPOT ET P Multiple Portfolios MF-AGG 7'233'688 0.07 - 31.12.2012 Investment Advisor
ICBC CREDIT SUISSE A Multiple Portfolios MF-AGG 6'989'438 0.07 (13'940'671) 31.12.2012 Investment Advisor
CHINA ASSET MANAGEME Multiple Portfolios MF-AGG 6'619'918 0.07 6'619'918 31.12.2012 Investment Advisor
CHINA ASSET MANAGEME Multiple Portfolios MF-AGG 5'966'400 0.06 - 02.09.2013 Investment Advisor
CHINA ASSET MANAGEME Multiple Portfolios MF-AGG 4'218'103 0.04 (3'408'299) 31.12.2012 Investment Advisor
CHINA UNIVERSAL ASSE Multiple Portfolios MF-AGG 3'166'869 0.03 165'426 02.09.2013 Investment Advisor
HARVEST FUND MANAGEM Multiple Portfolios MF-AGG 3'062'091 0.03 (9'156'569) 31.12.2012 Investment Advisor
GUOTAI ASSET MANAGEM Multiple Portfolios MF-AGG 2'256'533 0.02 244'616 31.12.2012 Investment Advisor
Firm Name Analyst Recommendation Weighting Change Target Price Date Date
Everbright Securities Co., Ltd CHEN SHUWEI accumulate 4 M 6 12 month 31.08.2013
Goldman Sachs FRANKLIN CHOW neutral/neutral 3 M 5 12 month 30.08.2013
Masterlink Securities LI YAN hold 3 D 6 Not Provided 28.08.2013
Bank of China International KEVIN XING hold 3 M 5 Not Provided 27.08.2013
China International Capital Corp JUNHUA CHEN hold 3 M #N/A N/A Not Provided 26.08.2013
Capital Securities Corp LAI SHENSHENG hold 3 M 7 Not Provided 17.07.2013
UBS YINGZHEN XU neutral 3 M 6 12 month 10.07.2013
Qilu Securities Co Ltd ZHAOLIANG LIU buy 5 M #N/A N/A Not Provided 01.07.2013
SWS Research Co Ltd EVAN LIANG neutral 3 M #N/A N/A Not Provided 12.04.2013
Jefferies JOSEPH FONG buy 5 M 6 12 month 25.02.2013
Rising Securities Co.,LTD DAI LIPING outperform 5 M #N/A N/A Not Provided 26.11.2012
Hong Yuan Securities LU RUMIN buy 5 M #N/A N/A Not Provided 26.06.2012
Citic Securities Co., Ltd WU FEI overweight 5 M #N/A N/A Not Provided 25.06.2012
Central China Securities PAN HANGJUN monitored #N/A N/A N #N/A N/A Not Provided 16.09.2009
China Galaxy Securities ZOU XUYUAN neutral 3 N #N/A N/A Not Provided 17.02.2009
Holdings By:
Datang International Power Generation Co Ltd ee
Q.M.S Advisors | tel: +41 (0)78 922 08 77 | e-mail: [email protected] |
Page 102
09.09.2013
China CNR Corp Ltd. manufactures rail cars. The Company designs, manufactures,
refurbishes, overhauls, and maintains electric locomotives, diesel locomotives,
passenger coaches and freight wagons, electric and diesel multiple units,
traction motors, and rolling stock.
Latest Fiscal Year: 12/2012
LTM as of: 06/yy
52-Week High (19.02.2013) 5.20
52-Week Low (24.09.2012) 3.39
Daily Volume
4.32
52-Week High % Change -16.92% Dividend Yield -
52-Week Low % Change 27.43% Beta 1.09
% 52 Week Price Range High/Low 47.51% Equity Float 3'116.17
Shares Out 30.06.2013 10'320.1 Short Int -
44'582.64 1 Yr Total Return 16.51%
Total Debt 15'809.39 YTD Return -2.09%
Preferred Stock 0.0 Adjusted BETA 1.092
Minority Interest 1'578.6 Analyst Recs 18
Cash and Equivalents 10'065.37 Consensus Rating 4.722
Enterprise Value 73'225.09
Average Volume 5 Day 39'366'400
601299 CH EQUITY YTD Change - Average Volume 30 Day 41'236'430
601299 CH EQUITY YTD % CHANGE - Average Volume 3 Month 42'461'310
LTM-4Q LTM FY+1 FY+2 FQ+1 FQ+2
31.12.2008 31.12.2009 31.12.2010 31.12.2011 31.12.2012 06/yy 06/yy 12/13 Y 12/14 Y 09/13 Q3 12/13 Q4
34'577.8 40'406.5 64'141.8 89'055.0 91'962.3 90'688.1 85'974.2 98'260.4 110'626.1 29'901.0 35'320.0
- 1.23x 0.98x 0.56x 0.59x 2.43x 2.63x 0.56x 0.50x - -
2'557.3 2'081.0 3'567.3 5'591.5 6'172.1 0.0 0.0 7'130.0 8'246.2 1'304.0 3'602.0
- 23.82x 17.69x 8.85x 8.73x 0.00x 0.00x 10.27x 8.88x - -
1'130.7 1'315.6 1'923.9 2'985.2 3'383.8 3'038.4 3'294.5 3'791.5 4'378.6 937.0 1'301.0
- 26.65x 30.83x 11.81x 13.26x 11.74x 11.73x 11.84x 10.26x - -
EBITDA 6'172.15 Long-Term Rating Date -
EBIT 4'448.70 Long-Term Rating -
Operating Margin 4.84% Long-Term Outlook -
Pretax Margin 4.50% Short-Term Rating Date -
Return on Assets 2.92% Short-Term Rating -
Return on Common Equity 9.64%
Return on Capital - EBITDA/Interest Exp. 5.00
Asset Turnover 0.76% (EBITDA-Capex)/Interest Exp. 0.06
Net Debt/EBITDA -
Gross Margin 14.1% Total Debt/EBITDA -
EBITDA Margin -
EBIT Margin 5.4% Total Debt/Equity 45.4%
Net Income Margin 3.7% Total Debt/Capital 30.3%
Asset Turnover 0.76
Current Ratio 0.98 Net Fixed Asset Turnover 2.62
Quick Ratio 0.50 Accounts receivable turnover-days 115.89
Debt to Assets 14.85% Inventory Days 140.14
Tot Debt to Common Equity 45.41% Accounts Payable Turnover Day 143.36
Accounts Receivable Turnover 3.15 Cash Conversion Cycle 90.88
Inventory Turnover 2.60
Fiscal Year Ended
China CNR Corp LtdPrice/Volume
Valuation Analysis
71'046'499.00
Current Price (9/dd/yy) Market Data
Net Income
P/E
Market Capitalization
Average Daily Trading Volume
Relative Stock Price Performance
Total Revenue
TEV/Revenue
EBITDA
TEV/EBITDA
Profitability S&P Issuer Ratings
Credit Ratios
Margin Analysis
Reference
Structure
,
-
.
0
1
2
3
o!-. l!-. k!-. a!-. g!-0 c!-0 j!-0 Q!-0 j!-0 g!-0 g!-0 Q!-0 o!-0', F
2,', F
-,,', F
-2,', F
.,,', F
.2,', F
0.0
10'000.0
20'000.0
30'000.0
40'000.0
50'000.0
60'000.0
70'000.0
80'000.0
90'000.0
100'000.0
2001 2002 2003 2004 2005 2006 2007 2008 2009 2010 2011 2012
,',,
-,',,
.,',,
0,',,
1,',,
2,',,
3,',,
4,',,
5,',,
6,',,
-,,',,
,-',-'.,-, ,-',4'.,-, ,-',-'.,-- ,-',4'.,-- ,-',-'.,-. ,-',4'.,-. ,-',-'.,-0 ,-',4'.,-0
FReTn/CTrThoT/PolhirTlAlcST/ !Rna /eis FReTn/CTrThoT/PolhirTlAlcST/ !Rna /eis
Q.M.S Advisors | tel: +41 (0)78 922 08 77 | e-mail: [email protected] |
Page 103
09.09.2013
Holder Name Portfolio Name Source Amt Held % Out Latest Chg File Dt Inst Type
CHINA NORTH LOCOMOTI n/a EXCH 6'354'045'554 61.57 8'104'400 09.07.2013 Government
CHINA CNR INVESTMENT n/a EXCH 539'583'320 5.23 - 09.07.2013 Government
SOCIAL SECURITY FUND n/a Co File 309'393'275 3 - 31.12.2012 Government
GREAT WALL FUND MANA Multiple Portfolios MF-AGG 176'791'561 1.71 81'717'774 30.06.2013 Investment Advisor
HARVEST FUND MANAGEM Multiple Portfolios MF-AGG 171'820'975 1.66 114'620'715 31.12.2012 Investment Advisor
CHINA SOUTHERN FUND Multiple Portfolios MF-AGG 79'332'428 0.77 (3'647'885) 31.12.2012 Investment Advisor
INVESCO GREAT WALL F Multiple Portfolios MF-AGG 56'939'872 0.55 29'067'744 30.06.2013 Investment Advisor
NEW CHINA LIFE INSUR n/a Co File 50'440'504 0.49 - 31.12.2012 Insurance Company
YINHUA FUND MANAGEME Multiple Portfolios MF-AGG 48'651'978 0.47 (13'601'122) 31.12.2012 Investment Advisor
CHINA ASSET MANAGEME Multiple Portfolios MF-AGG 45'387'068 0.44 (8'921'739) 31.12.2012 Investment Advisor
E FUND MANAGEMENT Multiple Portfolios MF-AGG 40'884'555 0.4 1'558'800 31.12.2012 Investment Advisor
CHANGSHENG FUND MANA Multiple Portfolios MF-AGG 39'289'097 0.38 37'268'485 31.12.2012 Investment Advisor
CHINA INTERNATIONAL Multiple Portfolios MF-AGG 31'994'602 0.31 27'852'616 31.12.2012 Investment Advisor
INVESCO LTD n/a ULT-AGG 24'999'990 0.24 24'999'990 28.02.2013 Investment Advisor
SOOCHOW ASSET MANAGE Multiple Portfolios MF-AGG 24'598'038 0.24 20'191'134 31.12.2012 Investment Advisor
ICBC CREDIT SUISSE A Multiple Portfolios MF-AGG 22'248'125 0.22 17'122'100 31.12.2012 Investment Advisor
BOSHI FUND MANAGEMEN Multiple Portfolios MF-AGG 21'133'547 0.2 13'349'638 31.12.2012 Investment Advisor
HUATAI-PINEBRIDGE FU Multiple Portfolios MF-AGG 18'940'468 0.18 - 31.12.2012 Investment Advisor
HUAAN FUND MANAGEMEN Multiple Portfolios MF-AGG 18'202'459 0.18 4'637'366 31.12.2012 Investment Advisor
HUASHANG FUND MANAGE Multiple Portfolios MF-AGG 11'051'788 0.11 11'051'788 31.12.2012 Investment Advisor
Firm Name Analyst Recommendation Weighting Change Target Price Date Date
Northeast Securities Co Ltd JIANGTAO WU buy 5 M #N/A N/A Not Provided 02.09.2013
GF Securities Co. Ltd. DONG YAGUANG buy 5 M 6 12 month 02.09.2013
Goldman Sachs TIAN LU Buy/Neutral 5 M 6 12 month 28.08.2013
Capital Securities Corp LI XIAOLU buy 5 U 5 Not Provided 28.08.2013
China International Capital Corp WU HUIMIN buy 5 M #N/A N/A Not Provided 28.08.2013
SWS Research Co Ltd SANFORD ZHAO outperform 5 U #N/A N/A Not Provided 28.08.2013
Chang Jiang Securities Co. Limited Cheng Zhang buy 5 M #N/A N/A Not Provided 27.08.2013
Guotai Junan WANG FAN buy 5 M 6 12 month 19.08.2013
Everbright Securities Co., Ltd LU ZHOU buy 5 M 5 12 month 18.08.2013
Morgan Stanley KEVIN LUO Equalwt/Cautious 3 M 6 12 month 16.08.2013
UBS JEAN RAO buy 5 M 5 12 month 08.08.2013
Guodu Securities Co Ltd XIAO SHIJUN strong buy 5 M #N/A N/A Not Provided 06.08.2013
Hong Yuan Securities QU YONGZHONG buy 5 M #N/A N/A Not Provided 24.07.2013
Credit Suisse YANG SONG neutral 3 M 4 Not Provided 09.04.2013
PingAn Securities GUOJI YE buy 5 M #N/A N/A Not Provided 04.03.2013
Bank of China International XU MINLE buy 5 M 6 12 month 28.01.2013
HuaChuang Securities GAO LI strong buy 5 U #N/A N/A Not Provided 17.12.2012
Central China Securities XU MINFENG add 4 M #N/A N/A Not Provided 26.11.2012
Industrial Securities WU HUA buy 5 M #N/A N/A Not Provided 19.04.2012
Citic Securities Co., Ltd XIAOBO XUE buy 5 M 8 6 month 08.07.2011
China Securities Co., Ltd GAO XIAOCHUN add 4 N 8 Not Provided 08.12.2010
China Galaxy Securities TIAN SHUHUA buy 5 M #N/A N/A Not Provided 01.06.2010
Holdings By:
China CNR Corp Ltd ee
Q.M.S Advisors | tel: +41 (0)78 922 08 77 | e-mail: [email protected] |
Page 104
09.09.2013
Jiangsu Hengrui Medicine Co., Ltd. develops, manufactures, and markets a
variety of medicines and medicine packing materials. The Company's products
include anti-tumor medicines, pain-killers, anti-infection medicines, aluminum
foil, and other related products.
Latest Fiscal Year: 12/2012
LTM as of: 06/yy
52-Week High (08.08.2013) 36.80
52-Week Low (04.12.2012) 24.16
Daily Volume
32.74
52-Week High % Change -11.03% Dividend Yield -
52-Week Low % Change 35.49% Beta 0.72
% 52 Week Price Range High/Low 70.24% Equity Float 1'130.80
Shares Out 05.07.2013 1'360.2 Short Int -
44'533.64 1 Yr Total Return 14.77%
Total Debt 10.00 YTD Return 19.96%
Preferred Stock 0.0 Adjusted BETA 0.722
Minority Interest 228.4 Analyst Recs 12
Cash and Equivalents 1'329.47 Consensus Rating 5.000
Enterprise Value 43'130.14
Average Volume 5 Day 5'331'448
600276 CH EQUITY YTD Change - Average Volume 30 Day 6'874'471
600276 CH EQUITY YTD % CHANGE - Average Volume 3 Month 7'708'624
LTM-4Q LTM FY+1 FY+2 FQ+1 FQ+2
31.12.2008 31.12.2009 31.12.2010 31.12.2011 31.12.2012 06/yy 06/yy 12/13 Y 12/14 Y 09/13 Q3 12/13 Q4
2'354.9 2'983.7 3'688.0 4'481.7 5'340.0 4'914.8 5'691.4 6'464.4 7'946.9 1'631.0 1'631.0
8.27x 10.71x 11.86x 7.21x 6.77x 25.95x 25.87x 6.60x 5.29x - -
674.0 752.7 907.6 1'114.7 1'415.6 0.0 0.0 1'762.7 2'129.7 435.0 435.0
28.91x 42.44x 48.20x 28.99x 25.52x 0.00x 0.00x 24.47x 20.25x 22.49x 21.49x
422.9 665.7 724.2 876.6 1'077.4 966.2 1'162.2 1'274.3 1'570.0 322.0 322.0
47.10x 48.95x 61.42x 37.75x 34.55x 36.75x 30.85x 35.17x 26.81x 30.89x 29.50x
EBITDA 1'415.56 Long-Term Rating Date -
EBIT 1'283.53 Long-Term Rating -
Operating Margin 24.04% Long-Term Outlook -
Pretax Margin 25.22% Short-Term Rating Date -
Return on Assets 19.45% Short-Term Rating -
Return on Common Equity 22.24%
Return on Capital - EBITDA/Interest Exp. 26751.40
Asset Turnover 0.95% (EBITDA-Capex)/Interest Exp. 17929.31
Net Debt/EBITDA -
Gross Margin 83.7% Total Debt/EBITDA -
EBITDA Margin -
EBIT Margin 24.0% Total Debt/Equity 0.2%
Net Income Margin 20.2% Total Debt/Capital 0.2%
Asset Turnover 0.95
Current Ratio 10.26 Net Fixed Asset Turnover 4.30
Quick Ratio 8.21 Accounts receivable turnover-days 145.81
Debt to Assets 0.17% Inventory Days 115.40
Tot Debt to Common Equity 0.19% Accounts Payable Turnover Day 78.09
Accounts Receivable Turnover 2.50 Cash Conversion Cycle 196.88
Inventory Turnover 3.16
Profitability S&P Issuer Ratings
Credit Ratios
Margin Analysis
Reference
Structure
Net Income
P/E
Market Capitalization
Average Daily Trading Volume
Relative Stock Price Performance
Total Revenue
TEV/Revenue
EBITDA
TEV/EBITDA
Fiscal Year Ended
Jiangsu Hengrui Medicine Co LtdPrice/Volume
Valuation Analysis
4'921'380.00
Current Price (9/dd/yy) Market Data
,
2
-,
-2
.,
.2
0,
02
1,
o!-. l!-. k!-. a!-. g!-0 c!-0 j!-0 Q!-0 j!-0 g!-0 g!-0 Q!-0 o!-0', F
2', F
-,', F
-2', F
.,', F
.2', F
0,', F
0.0
1'000.0
2'000.0
3'000.0
4'000.0
5'000.0
6'000.0
2001 2002 2003 2004 2005 2006 2007 2008 2009 2010 2011 2012
,',,
.,',,
1,',,
3,',,
5,',,
-,,',,
-.,',,
-1,',,
-3,',,
,-',-'.,-, ,-',4'.,-, ,-',-'.,-- ,-',4'.,-- ,-',-'.,-. ,-',4'.,-. ,-',-'.,-0 ,-',4'.,-0
FReTn/CTrThoT/PolhirTlAlcST/ !Rna /eis FReTn/CTrThoT/PolhirTlAlcST/ !Rna /eis
Q.M.S Advisors | tel: +41 (0)78 922 08 77 | e-mail: [email protected] |
Page 105
09.09.2013
Holder Name Portfolio Name Source Amt Held % Out Latest Chg File Dt Inst Type
LIANYUNGANG TIANYU I n/a Co File 332'523'790 24.45 - 31.12.2012 Other
LIANYUNGANG DAYUAN I n/a Co File 229'034'682 16.84 - 31.12.2012 Other
LIANYUNGANG HENGCHUA n/a Co File 102'794'052 7.56 - 31.12.2012 Other
CHINA NATIONAL PHARM n/a ULT-AGG 72'441'316 5.33 - 31.12.2012 Government
JIANGSU JINHAI INVES n/a Co File 50'367'369 3.7 - 31.12.2012 Holding Company
UBS SDIC FUND MANAGE Multiple Portfolios MF-AGG 34'079'797 2.51 4'272'919 31.12.2012 Investment Advisor
AEGON INDUSTRIAL FUN Multiple Portfolios MF-AGG 31'513'328 2.32 3'344'580 30.06.2013 Investment Advisor
FRANKLIN TEMPLETON S Multiple Portfolios MF-AGG 20'661'668 1.52 504'786 30.06.2013 Investment Advisor
CHINA LIFE INSURANCE n/a ULT-AGG 19'288'964 1.42 - 31.12.2012 Government
GREAT WALL FUND MANA Multiple Portfolios MF-AGG 16'892'934 1.24 (1'494'773) 31.12.2012 Investment Advisor
E FUND MANAGEMENT Multiple Portfolios MF-AGG 15'692'232 1.15 5'550'636 31.12.2012 Investment Advisor
BANK OF COMMUNICATIO Multiple Portfolios MF-AGG 14'790'141 1.09 (3'130'192) 30.06.2013 Investment Advisor
HUAAN FUND MANAGEMEN Multiple Portfolios MF-AGG 12'905'397 0.95 (4'762'870) 30.06.2013 Investment Advisor
GUOTAI ASSET MANAGEM Multiple Portfolios MF-AGG 10'726'013 0.79 2'118'458 30.06.2013 Investment Advisor
GF FUND MANAGEMENT C Multiple Portfolios MF-AGG 10'618'352 0.78 7'950'911 31.12.2012 Investment Advisor
CHANGSHENG FUND MANA Multiple Portfolios MF-AGG 9'832'219 0.72 1'447'501 30.06.2013 Investment Advisor
BANK OF CHINA INVEST Multiple Portfolios MF-AGG 9'698'265 0.71 8'285'509 30.06.2013 Investment Advisor
HARVEST FUND MANAGEM Multiple Portfolios MF-AGG 9'566'075 0.7 (5'207'032) 31.12.2012 Investment Advisor
CHINA INTERNATIONAL Multiple Portfolios MF-AGG 8'979'802 0.66 2'974'948 30.06.2013 Investment Advisor
HUATAI-PINEBRIDGE FU Multiple Portfolios MF-AGG 8'869'641 0.65 4'705'818 31.12.2012 Investment Advisor
Firm Name Analyst Recommendation Weighting Change Target Price Date Date
SWS Research Co Ltd LUO JIARONG buy 5 M #N/A N/A Not Provided 30.08.2013
UBS JI XUWO buy 5 M 37 12 month 20.08.2013
Capital Securities Corp LI YING buy 5 M 37 Not Provided 19.08.2013
GF Securities Co. Ltd. ZHANG QILI buy 5 M #N/A N/A Not Provided 19.08.2013
China International Capital Corp QIANG JING buy 5 M #N/A N/A Not Provided 19.08.2013
Tebon Securities Co Ltd ZHENG YINING outperform 5 M 33 6 month 19.08.2013
Chang Jiang Securities Co. Limited Liu Shuchang buy 5 N #N/A N/A Not Provided 19.08.2013
Morgan Stanley BIN LI Overwt/In-Line 5 M 33 12 month 16.08.2013
EVA Dimensions TIMOTHY STANISH overweight 5 M #N/A N/A Not Provided 06.06.2013
Guotai Junan LI QIUSHI buy 5 M 32 12 month 31.03.2013
Rising Securities Co.,LTD XIE NINGNING outperform 5 N #N/A N/A Not Provided 06.12.2012
HuaChuang Securities LIAO WANGUO buy 5 M 30 6 month 28.10.2012
Sinolink Securities Co Ltd LI JINGLEI add 4 N #N/A N/A Not Provided 13.08.2012
China Merchants Securities LI SHANSHAN buy 5 M #N/A N/A Not Provided 02.07.2012
Northeast Securities Co Ltd ZHOU SILI buy 5 N #N/A N/A Not Provided 21.06.2012
Citic Securities Co., Ltd LI CHAO add 4 M #N/A N/A Not Provided 03.05.2012
Industrial Securities WANG XI buy 5 M #N/A N/A Not Provided 26.04.2012
China Investment Securities ZHOU RUI strong buy 5 M #N/A N/A Not Provided 02.12.2011
PingAn Securities LING JUN buy 5 M #N/A N/A Not Provided 18.11.2011
Founder Securities KUAI XUEZHANG add 4 M #N/A N/A Not Provided 09.08.2010
Central China Securities WANG BO add 4 M #N/A N/A Not Provided 02.06.2010
China Securities Co., Ltd XI LUO add 4 M 18 Not Provided 02.12.2009
Holdings By:
Jiangsu Hengrui Medicine Co Ltd ee
Q.M.S Advisors | tel: +41 (0)78 922 08 77 | e-mail: [email protected] |
Page 106
09.09.2013
Tasly Pharmaceutical Group Co researches, produces, and sells Chinese
medicines which are mainly derived from the root of red-rooted salvia. The
Company's products focus on the treatment of cardiovascular and brain blood
vessel diseases.
Latest Fiscal Year: 12/2012
LTM as of: 06/yy
52-Week High (25.07.2013) 50.05
52-Week Low (28.11.2012) 23.75
Daily Volume
41.98
52-Week High % Change -16.12% Dividend Yield -
52-Week Low % Change 76.76% Beta 0.76
% 52 Week Price Range High/Low 70.11% Equity Float 521.98
Shares Out 30.06.2013 1'032.8 Short Int -
43'358.73 1 Yr Total Return 64.46%
Total Debt 1'459.80 YTD Return 52.29%
Preferred Stock 0.0 Adjusted BETA 0.764
Minority Interest 194.9 Analyst Recs 16
Cash and Equivalents 1'011.71 Consensus Rating 4.813
Enterprise Value 45'026.15
Average Volume 5 Day 5'649'569
600535 CH EQUITY YTD Change - Average Volume 30 Day 7'545'707
600535 CH EQUITY YTD % CHANGE - Average Volume 3 Month 6'798'917
LTM-4Q LTM FY+1 FY+2 FQ+1 FQ+2
31.12.2008 31.12.2009 31.12.2010 31.12.2011 31.12.2012 06/yy 06/yy 12/13 Y 12/14 Y 09/13 Q3 12/13 Q4
3'411.0 3'966.9 4'620.4 6'524.7 9'237.5 7'712.7 10'456.8 11'894.3 14'285.0 - -
2.01x 3.03x 4.58x 3.37x 3.16x 10.95x 12.92x - - - -
502.8 540.1 707.7 848.0 1'194.8 0.0 0.0 1'605.8 2'037.0 - -
13.63x 22.26x 29.88x 25.93x 24.43x 0.00x 0.00x 28.04x 22.10x - -
255.9 316.7 450.3 610.8 769.2 696.0 966.1 1'117.8 1'420.0 - -
23.79x 34.46x 44.30x 35.54x 37.09x 32.33x 36.99x 39.05x 30.64x - -
EBITDA 1'194.83 Long-Term Rating Date -
EBIT 1'038.24 Long-Term Rating -
Operating Margin 11.24% Long-Term Outlook -
Pretax Margin 10.39% Short-Term Rating Date -
Return on Assets 12.40% Short-Term Rating -
Return on Common Equity 27.61%
Return on Capital - EBITDA/Interest Exp. 10.92
Asset Turnover 1.34% (EBITDA-Capex)/Interest Exp. 7.36
Net Debt/EBITDA -
Gross Margin 29.8% Total Debt/EBITDA -
EBITDA Margin -
EBIT Margin 12.7% Total Debt/Equity 36.4%
Net Income Margin 8.3% Total Debt/Capital 25.8%
Asset Turnover 1.34
Current Ratio 1.65 Net Fixed Asset Turnover 4.30
Quick Ratio 1.14 Accounts receivable turnover-days 79.39
Debt to Assets 19.50% Inventory Days 48.74
Tot Debt to Common Equity 36.39% Accounts Payable Turnover Day 37.67
Accounts Receivable Turnover 4.60 Cash Conversion Cycle 91.08
Inventory Turnover 7.49
Profitability S&P Issuer Ratings
Credit Ratios
Margin Analysis
Reference
Structure
Net Income
P/E
Market Capitalization
Average Daily Trading Volume
Relative Stock Price Performance
Total Revenue
TEV/Revenue
EBITDA
TEV/EBITDA
Fiscal Year Ended
Tasly Pharmaceutical Group Co LtdPrice/Volume
Valuation Analysis
7'163'988.00
Current Price (9/dd/yy) Market Data
,
-,
.,
0,
1,
2,
3,
o!-. l!-. k!-. a!-. g!-0 c!-0 j!-0 Q!-0 j!-0 g!-0 g!-0 Q!-0 o!-0', F
2', F
-,', F
-2', F
.,', F
.2', F
0.0
1'000.0
2'000.0
3'000.0
4'000.0
5'000.0
6'000.0
7'000.0
8'000.0
9'000.0
10'000.0
2001 2002 2003 2004 2005 2006 2007 2008 2009 2010 2011 2012
,',,
.,,',,
1,,',,
3,,',,
5,,',,
-',,,',,
-'.,,',,
-'1,,',,
-'3,,',,
-'5,,',,
.',,,',,
,-',-'.,-, ,-',4'.,-, ,-',-'.,-- ,-',4'.,-- ,-',-'.,-. ,-',4'.,-. ,-',-'.,-0 ,-',4'.,-0
FReTn/CTrThoT/PolhirTlAlcST/ !Rna /eis FReTn/CTrThoT/PolhirTlAlcST/ !Rna /eis
Q.M.S Advisors | tel: +41 (0)78 922 08 77 | e-mail: [email protected] |
Page 107
09.09.2013
Holder Name Portfolio Name Source Amt Held % Out Latest Chg File Dt Inst Type
TIANJIN TASLY GROUP n/a Co File 488'201'106 47.27 - 31.12.2012 Other
CHINA UNIVERSAL ASSE Multiple Portfolios MF-AGG 64'694'513 6.26 30'701'788 02.09.2013 Investment Advisor
GF FUND MANAGEMENT C Multiple Portfolios MF-AGG 31'359'344 3.04 9'723'222 31.12.2012 Investment Advisor
BANK OF COMMUNICATIO Multiple Portfolios MF-AGG 30'812'668 2.98 (2'343'128) 30.06.2013 Investment Advisor
HARVEST FUND MANAGEM Multiple Portfolios MF-AGG 22'668'072 2.19 (4'760'114) 30.06.2013 Investment Advisor
BOSHI FUND MANAGEMEN Multiple Portfolios MF-AGG 19'082'282 1.85 (23'718'146) 30.06.2013 Investment Advisor
E FUND MANAGEMENT Multiple Portfolios MF-AGG 17'371'460 1.68 2'149'106 31.12.2012 Investment Advisor
GREAT WALL FUND MANA Multiple Portfolios MF-AGG 14'909'332 1.44 3'863'484 30.06.2013 Investment Advisor
SOCIAL SECURITY FUND n/a Co File 13'427'040 1.3 - 31.12.2012 Government
MANULIFE TEDA FUND M Multiple Portfolios MF-AGG 10'695'108 1.04 2'676'352 30.06.2013 Investment Advisor
ABN AMRO TEDA FUND M Multiple Portfolios MF-AGG 10'055'968 0.97 (1'130'850) 30.06.2013 Investment Advisor
CHINA INTERNATIONAL Multiple Portfolios MF-AGG 9'589'456 0.93 (721'788) 30.06.2013 Investment Advisor
SH HAOYI INDUSTRY CO n/a Co File 9'233'540 0.89 - 31.12.2012 Corporation
PENGHUA FUND MANAGEM Multiple Portfolios MF-AGG 8'148'301 0.79 (4'753'647) 30.06.2013 Investment Advisor
GUOTAI ASSET MANAGEM Multiple Portfolios MF-AGG 8'004'046 0.77 1'362'806 31.12.2012 Investment Advisor
RONGTONG FUND MANAGE Multiple Portfolios MF-AGG 7'541'526 0.73 4'388'286 30.06.2013 Investment Advisor
CHINA ASSET MANAGEME Multiple Portfolios MF-AGG 7'351'726 0.71 2'149'056 31.12.2012 Investment Advisor
HUASHANG FUND MANAGE Multiple Portfolios MF-AGG 5'791'892 0.56 (4'917'374) 31.12.2012 Investment Advisor
AEGON INDUSTRIAL FUN Multiple Portfolios MF-AGG 5'442'485 0.53 (74'133) 30.06.2013 Investment Advisor
FORTUNE SGAM FUND MA Multiple Portfolios MF-AGG 4'059'106 0.39 3'691'038 31.12.2012 Investment Advisor
Firm Name Analyst Recommendation Weighting Change Target Price Date Date
Chang Jiang Securities Co. Limited Liu Shuchang buy 5 M #N/A N/A Not Provided 02.09.2013
SWS Research Co Ltd SELINA LUO buy 5 M #N/A N/A Not Provided 30.08.2013
GF Securities Co. Ltd. HE JUYING buy 5 M 56 12 month 29.08.2013
China Minzu Securities Co Ltd WANG XIAOYAN buy 5 N #N/A N/A Not Provided 13.08.2013
Morgan Stanley BIN LI Overwt/Attractive 5 M 55 12 month 08.08.2013
Capital Securities Corp LI YING buy 5 M 51 Not Provided 08.08.2013
Tebon Securities Co Ltd ZHENG YINING outperform 5 M 55 6 month 07.08.2013
China Investment Securities ZHOU RUI strong buy 5 M #N/A N/A Not Provided 07.08.2013
Hong Yuan Securities WEI WENQING buy 5 M #N/A N/A Not Provided 21.07.2013
Everbright Securities Co., Ltd YAO JIE buy 5 M 32 12 month 08.07.2013
Guotai Junan LI QIUSHI buy 5 M 30 12 month 03.07.2013
China International Capital Corp SUN LIANG accumulate 4 M #N/A N/A Not Provided 20.06.2013
Goldman Sachs DU WEI neutral/neutral 3 M 40 12 month 28.05.2013
Citic Securities Co., Ltd LI CHAO buy 5 M 21 6 month 07.05.2013
Guodu Securities Co Ltd WANG YIN buy 5 M #N/A N/A Not Provided 22.04.2013
Rising Securities Co.,LTD XIE NINGNING outperform 5 M #N/A N/A Not Provided 08.04.2013
HuaChuang Securities LIAO WANGUO buy 5 N #N/A N/A Not Provided 08.08.2012
China Merchants Securities LI SHANSHAN strong buy 5 M #N/A N/A Not Provided 02.07.2012
Industrial Securities WANG XI buy 5 M #N/A N/A Not Provided 04.04.2012
PingAn Securities LING JUN buy 5 M #N/A N/A Not Provided 27.02.2012
Great Wall Securities YANG YUE buy 5 N #N/A N/A Not Provided 23.06.2011
China Securities Co., Ltd XI LUO add 4 M 21 Not Provided 08.12.2010
Central China Securities WANG BO add 4 M #N/A N/A Not Provided 02.06.2010
Holdings By:
Tasly Pharmaceutical Group Co Ltd ee
Q.M.S Advisors | tel: +41 (0)78 922 08 77 | e-mail: [email protected] |
Page 108
09.09.2013
Kangmei Pharmaceutical Co., Ltd. develops, produces, and sells medicines that
are used for the treatment of high blood pressure and cold. The Company also pr
oduces antibiotic drugs and health care products. Kangmei also sells other
manufacturers' medical products through its wholesale and retail chain.
Latest Fiscal Year: 12/2012
LTM as of: 06/yy
52-Week High (16.08.2013) 23.22
52-Week Low (20.12.2012) 12.05
Daily Volume
18.72
52-Week High % Change -19.38% Dividend Yield -
52-Week Low % Change 55.35% Beta 0.86
% 52 Week Price Range High/Low 62.40% Equity Float 1'354.75
Shares Out 30.06.2013 2'198.7 Short Int -
41'159.93 1 Yr Total Return 19.07%
Total Debt 5'611.47 YTD Return 43.81%
Preferred Stock 0.0 Adjusted BETA 0.860
Minority Interest 2.2 Analyst Recs 5
Cash and Equivalents 6'105.81 Consensus Rating 5.000
Enterprise Value 40'279.18
Average Volume 5 Day 25'689'460
600518 CH EQUITY YTD Change - Average Volume 30 Day 22'586'850
600518 CH EQUITY YTD % CHANGE - Average Volume 3 Month 24'269'440
LTM-4Q LTM FY+1 FY+2 FQ+1 FQ+2
31.12.2008 31.12.2009 31.12.2010 31.12.2011 31.12.2012 06/yy 06/yy 12/13 Y 12/14 Y 09/13 Q3 12/13 Q4
1'723.9 2'370.5 3'291.2 6'053.5 11'107.3 8'368.3 12'079.4 14'101.5 18'013.0 - -
3.26x 7.46x 10.18x 3.86x 2.56x 13.52x 11.73x - - - -
391.8 666.3 947.9 1'418.8 2'140.8 0.0 0.0 - - - -
14.37x 26.56x 35.33x 16.45x 13.27x 0.00x 0.00x - - - -
294.6 501.5 715.5 1'005.0 1'441.2 1'277.3 1'677.8 1'979.0 2'550.0 - -
23.66x 34.40x 46.71x 24.08x 20.06x 26.56x 25.18x 20.92x 16.28x - -
EBITDA 2'140.83 Long-Term Rating Date -
EBIT 1'962.64 Long-Term Rating -
Operating Margin 17.67% Long-Term Outlook -
Pretax Margin 15.24% Short-Term Rating Date -
Return on Assets 9.29% Short-Term Rating -
Return on Common Equity 16.03%
Return on Capital - EBITDA/Interest Exp. 5.94
Asset Turnover 0.67% (EBITDA-Capex)/Interest Exp. 2.04
Net Debt/EBITDA -
Gross Margin 24.7% Total Debt/EBITDA -
EBITDA Margin -
EBIT Margin 18.8% Total Debt/Equity 53.0%
Net Income Margin 13.0% Total Debt/Capital 34.7%
Asset Turnover 0.67
Current Ratio 3.07 Net Fixed Asset Turnover 1.93
Quick Ratio 2.00 Accounts receivable turnover-days 42.48
Debt to Assets 31.25% Inventory Days 119.10
Tot Debt to Common Equity 53.03% Accounts Payable Turnover Day 24.74
Accounts Receivable Turnover 8.59 Cash Conversion Cycle 133.01
Inventory Turnover 3.06
Profitability S&P Issuer Ratings
Credit Ratios
Margin Analysis
Reference
Structure
Net Income
P/E
Market Capitalization
Average Daily Trading Volume
Relative Stock Price Performance
Total Revenue
TEV/Revenue
EBITDA
TEV/EBITDA
Fiscal Year Ended
Kangmei Pharmaceutical Co LtdPrice/Volume
Valuation Analysis
29'673'374.00
Current Price (9/dd/yy) Market Data
,
2
-,
-2
.,
.2
o!-. l!-. k!-. a!-. g!-0 c!-0 j!-0 Q!-0 j!-0 g!-0 g!-0 Q!-0 o!-0', F.,', F1,', F3,', F5,', F-,,', F-.,', F-1,', F-3,', F-5,', F.,,', F
0.0
2'000.0
4'000.0
6'000.0
8'000.0
10'000.0
12'000.0
2001 2002 2003 2004 2005 2006 2007 2008 2009 2010 2011 2012
,',,
.,,',,
1,,',,
3,,',,
5,,',,
-',,,',,
-'.,,',,
,-',-'.,-, ,-',4'.,-, ,-',-'.,-- ,-',4'.,-- ,-',-'.,-. ,-',4'.,-. ,-',-'.,-0 ,-',4'.,-0
FReTn/CTrThoT/PolhirTlAlcST/ !Rna /eis FReTn/CTrThoT/PolhirTlAlcST/ !Rna /eis
Q.M.S Advisors | tel: +41 (0)78 922 08 77 | e-mail: [email protected] |
Page 109
09.09.2013
Holder Name Portfolio Name Source Amt Held % Out Latest Chg File Dt Inst Type
PUNING KANGMEI INDUS n/a Co File 668'874'274 30.42 - 31.12.2012 Corporation
DACHENG FUND MANAGME Multiple Portfolios MF-AGG 104'590'163 4.76 8'378'400 31.12.2012 Investment Advisor
BANK OF CHINA INVEST Multiple Portfolios MF-AGG 62'110'911 2.82 18'036'768 30.06.2013 Investment Advisor
HARVEST FUND MANAGEM Multiple Portfolios MF-AGG 56'104'847 2.55 (63'079'887) 30.06.2013 Investment Advisor
PUNING JINXIN PAWN C n/a Co File 46'557'358 2.12 - 31.12.2012 Corporation
DONGJIN XU n/a Co File 46'557'350 2.12 - 31.12.2012 n/a
PUNING INTL INFO CON n/a Co File 46'557'350 2.12 - 31.12.2012 Corporation
CHINA INTERNATIONAL Multiple Portfolios MF-AGG 41'753'407 1.9 (2'783'604) 30.06.2013 Investment Advisor
CHINA ASSET MANAGEME Multiple Portfolios MF-AGG 38'350'513 1.74 14'860'085 30.06.2013 Investment Advisor
YANJUN XU n/a Co File 34'918'028 1.59 - 31.12.2012 n/a
YINHUA FUND MANAGEME Multiple Portfolios MF-AGG 34'700'598 1.58 9'476'917 30.06.2013 Investment Advisor
HUAAN FUND MANAGEMEN Multiple Portfolios MF-AGG 31'983'609 1.45 (5'879'911) 30.06.2013 Investment Advisor
FORTUNE SGAM FUND MA Multiple Portfolios MF-AGG 31'933'323 1.45 16'933'585 31.12.2012 Investment Advisor
CHINA ASSET MANAGEME Multiple Portfolios MF-AGG 29'736'367 1.35 17'898'170 30.06.2013 Investment Advisor
GUOTAI ASSET MANAGEM Multiple Portfolios MF-AGG 26'075'085 1.19 (689'848) 30.06.2013 Investment Advisor
INVESCO GREAT WALL F Multiple Portfolios MF-AGG 24'096'856 1.1 (14'963'897) 30.06.2013 Investment Advisor
CHINA SOUTHERN FUND Multiple Portfolios MF-AGG 24'012'850 1.09 1'947'406 30.06.2013 Investment Advisor
E FUND MANAGEMENT Multiple Portfolios MF-AGG 23'547'193 1.07 (2'460'141) 31.12.2012 Investment Advisor
BAOYING FUND MANAGEM Multiple Portfolios MF-AGG 14'228'264 0.65 11'027'274 30.06.2013 Investment Advisor
PENGHUA FUND MANAGEM Multiple Portfolios MF-AGG 14'176'003 0.64 (17'641'871) 30.06.2013 Investment Advisor
Firm Name Analyst Recommendation Weighting Change Target Price Date Date
SWS Research Co Ltd TU WEINING buy 5 M #N/A N/A Not Provided 30.08.2013
Capital Securities Corp LI YING buy 5 M 19 Not Provided 28.08.2013
Everbright Securities Co., Ltd LI JIE buy 5 M 27 Not Provided 05.08.2013
China Investment Securities ZHOU RUI buy 5 D #N/A N/A Not Provided 28.05.2013
Guotai Junan LI QIUSHI buy 5 M 18 12 month 31.03.2013
Tebon Securities Co Ltd ZHENG YINING buy 5 M #N/A N/A Not Provided 03.09.2012
Sinolink Securities Co Ltd LI JINGLEI add 4 D #N/A N/A Not Provided 29.08.2012
China Merchants Securities LI SHANSHAN strong buy 5 M #N/A N/A Not Provided 02.07.2012
Citic Securities Co., Ltd LI CHAO buy 5 M #N/A N/A Not Provided 03.05.2012
Great Wall Securities YAO WENQI buy 5 M #N/A N/A Not Provided 29.03.2012
Northeast Securities Co Ltd ZHOU SILI buy 5 M #N/A N/A Not Provided 02.12.2011
HuaChuang Securities LIAO WANGUO buy 5 M 18 6 month 16.12.2010
Central China Securities WANG BO add 4 M #N/A N/A Not Provided 02.06.2010
Holdings By:
Kangmei Pharmaceutical Co Ltd ee
Q.M.S Advisors | tel: +41 (0)78 922 08 77 | e-mail: [email protected] |
Page 110
09.09.2013
Zijin Mining Group Co., Ltd., through its subsidiaries, explores, mines,
produces, refines, and sells gold and other mineral resources in China.
Latest Fiscal Year: 12/2011
LTM as of: 06/yy
52-Week High (21.09.2012) 4.18
52-Week Low (25.06.2013) 2.27
Daily Volume
2.67
52-Week High % Change -36.12% Dividend Yield -
52-Week Low % Change 17.62% Beta 1.11
% 52 Week Price Range High/Low 19.37% Equity Float 5'707.09
Shares Out 30.06.2013 15'803.8 Short Int -
51'396.13 1 Yr Total Return -29.16%
Total Debt 23'412.70 YTD Return -27.68%
Preferred Stock 0.0 Adjusted BETA 1.107
Minority Interest 5'401.4 Analyst Recs 10
Cash and Equivalents 8'144.34 Consensus Rating 3.600
Enterprise Value 74'492.93
Average Volume 5 Day 71'326'160
601899 CH EQUITY YTD Change - Average Volume 30 Day 73'347'010
601899 CH EQUITY YTD % CHANGE - Average Volume 3 Month 63'186'510
LTM-4Q LTM FY+1 FY+2 FQ+1 FQ+2
31.12.2008 31.12.2009 31.12.2010 31.12.2011 31.12.2012 06/yy 06/yy 12/13 Y 12/14 Y 09/13 Q3 12/13 Q4
16'744.7 20'215.1 28'186.6 39'381.9 47'873.6 44'459.7 52'843.3 48'462.0 52'235.8 7'859.0 9'261.5
4.10x 6.50x 4.18x 2.12x 2.00x 5.54x 4.98x 1.44x 1.34x - -
5'615.7 6'038.3 8'635.6 10'731.6 10'658.6 0.0 0.0 7'777.5 7'036.5 1'290.0 2'599.0
12.23x 21.75x 13.64x 7.78x 9.00x 0.00x 0.00x 9.58x 10.59x 15.51x 21.20x
3'005.3 3'552.3 4'827.9 5'712.6 5'211.2 4'947.9 3'924.5 3'282.9 2'954.5 765.5 968.5
19.71x 27.22x 18.41x 9.11x 10.22x 9.39x 6.01x 16.48x 19.78x - -
EBITDA 10'658.62 Long-Term Rating Date -
EBIT 8'978.60 Long-Term Rating -
Operating Margin 18.75% Long-Term Outlook -
Pretax Margin 17.87% Short-Term Rating Date -
Return on Assets 6.15% Short-Term Rating -
Return on Common Equity 15.07%
Return on Capital 10.49% EBITDA/Interest Exp. 11.30
Asset Turnover 0.83% (EBITDA-Capex)/Interest Exp. 2.82
Net Debt/EBITDA 1.88
Gross Margin 23.9% Total Debt/EBITDA 2.55
EBITDA Margin 17.9%
EBIT Margin 14.4% Total Debt/Equity 83.1%
Net Income Margin 10.9% Total Debt/Capital 41.1%
Asset Turnover 0.83
Current Ratio 1.06 Net Fixed Asset Turnover 2.16
Quick Ratio 0.42 Accounts receivable turnover-days 12.44
Debt to Assets 34.76% Inventory Days 78.40
Tot Debt to Common Equity 83.08% Accounts Payable Turnover Day 28.80
Accounts Receivable Turnover 29.33 Cash Conversion Cycle 70.60
Inventory Turnover 4.66
Fiscal Year Ended
Zijin Mining Group Co LtdPrice/Volume
Valuation Analysis
73'969'064.00
Current Price (9/dd/yy) Market Data
Net Income
P/E
Market Capitalization
Average Daily Trading Volume
Relative Stock Price Performance
Total Revenue
TEV/Revenue
EBITDA
TEV/EBITDA
Profitability S&P Issuer Ratings
Credit Ratios
Margin Analysis
Reference
Structure
,--..00112
o!-. l!-. k!-. a!-. g!-0 c!-0 j!-0 Q!-0 j!-0 g!-0 g!-0 Q!-0 o!-0', F
2,', F
-,,', F
-2,', F
.,,', F
.2,', F
0,,', F
02,', F
1,,', F
0.0
10'000.0
20'000.0
30'000.0
40'000.0
50'000.0
60'000.0
2001 2002 2003 2004 2005 2006 2007 2008 2009 2010 2011 2012
,',,
2',,
-,',,
-2',,
.,',,
.2',,
,-',-'.,-, ,-',4'.,-, ,-',-'.,-- ,-',4'.,-- ,-',-'.,-. ,-',4'.,-. ,-',-'.,-0 ,-',4'.,-0
FReTn/CTrThoT/PolhirTlAlcST/ !Rna /eis FReTn/CTrThoT/PolhirTlAlcST/ !Rna /eis
Q.M.S Advisors | tel: +41 (0)78 922 08 77 | e-mail: [email protected] |
Page 111
09.09.2013
Holder Name Portfolio Name Source Amt Held % Out Latest Chg File Dt Inst Type
MINXI XINGHANG STE-O n/a EXCH 6'316'353'180 39.97 - 08.07.2013 Other
NEWHUADU INDUS GROUP n/a EXCH 2'451'864'106 15.51 - 05.07.2011 Corporation
XIAMEN HENGXING INDU n/a Co File 509'772'757 3.23 - 31.12.2009 Corporation
XIPING KE n/a EXCH 376'624'720 2.38 - 05.05.2009 n/a
SHANGHANG COUNTY JIN n/a Co File 256'245'000 1.62 - 31.12.2009 Other
CHEN JINGHE n/a EXCH 132'000'000 0.84 - 05.07.2011 n/a
CHINA ASSET MANAGEME Multiple Portfolios MF-AGG 77'840'216 0.49 (27'619'772) 31.12.2012 Investment Advisor
E FUND MANAGEMENT Multiple Portfolios MF-AGG 71'563'706 0.45 (22'459'162) 31.12.2012 Investment Advisor
HARVEST FUND MANAGEM Multiple Portfolios MF-AGG 62'809'698 0.4 (41'514'858) 31.12.2012 Investment Advisor
CITIC SECURITIES CO n/a ULT-AGG 53'995'470 0.34 - 31.12.2009 Investment Advisor
CHINA SOUTHERN FUND Multiple Portfolios MF-AGG 53'623'704 0.34 (9'612'383) 31.12.2012 Investment Advisor
CHINA UNIVERSAL ASSE Multiple Portfolios MF-AGG 50'486'801 0.32 (57'149'178) 02.09.2013 Investment Advisor
HUATAI-PINEBRIDGE FU Multiple Portfolios MF-AGG 36'240'383 0.23 - 31.12.2012 Investment Advisor
YINHUA FUND MANAGEME Multiple Portfolios MF-AGG 27'233'415 0.17 (37'458'243) 31.12.2012 Investment Advisor
HUAAN FUND MANAGEMEN Multiple Portfolios MF-AGG 23'167'839 0.15 (1'960'416) 31.12.2012 Investment Advisor
GUOTAI ASSET MANAGEM Multiple Portfolios MF-AGG 18'981'963 0.12 10'983'290 31.12.2012 Investment Advisor
BOSERA FUND MANAGEME Multiple Portfolios MF-AGG 18'135'343 0.11 162'339 31.12.2012 Investment Advisor
AEGON INDUSTRIAL FUN Multiple Portfolios MF-AGG 16'894'803 0.11 (134'862) 31.12.2012 Investment Advisor
FULLGOAL FUND MANAGE Multiple Portfolios MF-AGG 15'999'943 0.1 (1'685'590) 31.12.2012 Investment Advisor
CHINA ASSET MANAGEME Multiple Portfolios MF-AGG 15'747'470 0.1 - 02.09.2013 Investment Advisor
Firm Name Analyst Recommendation Weighting Change Target Price Date Date
UBS HAOXIANG LIN neutral 3 D 3 12 month 26.08.2013
Founder Securities LIU WEIYUAN neutral 3 M #N/A N/A Not Provided 26.08.2013
Masterlink Securities SARAH WANG buy 5 M 3 6 month 16.08.2013
China International Capital Corp CAI HONGYU hold 3 M #N/A N/A Not Provided 14.08.2013
SWS Research Co Ltd PEGGY YE neutral 3 D #N/A N/A Not Provided 19.07.2013
Capital Securities Corp LI XIAOLU neutral 3 M 3 Not Provided 10.07.2013
Goldman Sachs JULIAN ZHU neutral/neutral 3 M 2 12 month 07.07.2013
Everbright Securities Co., Ltd WANG QIANMING neutral 3 D 4 6 month 28.03.2013
Bank of China International ROBIN TSUI buy 5 M 6 Not Provided 29.10.2012
Citic Securities Co., Ltd SONG XIAOQING overweight 5 M #N/A N/A Not Provided 21.09.2012
China Merchants Securities WANG XIAODAN neutral 3 M #N/A N/A Not Provided 25.05.2012
Hong Yuan Securities MIN DAN not rated #N/A N/A M #N/A N/A Not Provided 27.04.2012
Industrial Securities RENYUAN LUO strong buy 5 M 9 6 month 04.04.2012
Central China Securities HE WEIJIANG add 4 M #N/A N/A Not Provided 29.03.2012
Cinda Securities Ltd FAN HAIBO buy 5 M 8 6 month 20.06.2011
Tebon Securities Co Ltd TEAM COVERAGE add 4 M #N/A N/A Not Provided 11.04.2011
China Securities Co., Ltd ZHANG FANG neutral 3 N #N/A N/A Not Provided 08.12.2010
China Minzu Securities Co Ltd GUAN JIANXIN buy 5 M 5 6 month 10.08.2010
Rising Securities Co.,LTD WANG HUACHUN neutral 3 N #N/A N/A Not Provided 02.08.2010
China Investment Securities ZHANG LEI neutral 3 M #N/A N/A Not Provided 02.11.2009
Holdings By:
Zijin Mining Group Co Ltd ee
Q.M.S Advisors | tel: +41 (0)78 922 08 77 | e-mail: [email protected] |
Page 112
09.09.2013
China Construction Bank Corporation provides a complete range of banking
services and other financial services to individual and corporate customers. The
bank's services include retail banking, international settlement, project
finance, and credit card services.
Latest Fiscal Year: 12/2012
LTM as of: 06/yy
52-Week High (04.02.2013) 5.19
52-Week Low (24.09.2012) 3.82
Daily Volume
4.53
52-Week High % Change -12.72% Dividend Yield -
52-Week Low % Change 18.59% Beta 0.75
% 52 Week Price Range High/Low 35.04% Equity Float 8'782.17
Shares Out 30.06.2013 9'593.7 Short Int -
1'183'928.50 1 Yr Total Return 20.39%
Total Debt 1'305'403.00 YTD Return 4.95%
Preferred Stock 0.0 Adjusted BETA 0.751
Minority Interest 7'877.0 Analyst Recs 17
Cash and Equivalents 3'173'620.00 Consensus Rating 4.176
Enterprise Value -
Average Volume 5 Day 20'383'050
601939 CH EQUITY YTD Change - Average Volume 30 Day 20'578'690
601939 CH EQUITY YTD % CHANGE - Average Volume 3 Month 29'254'510
LTM-4Q LTM FY+1 FY+2 FQ+1 FQ+2
31.12.2008 31.12.2009 31.12.2010 31.12.2011 31.12.2012 06/yy 06/yy 12/13 Y 12/14 Y 09/13 Q3 12/13 Q4
388'058.0 396'529.0 449'841.0 575'537.0 713'433.0 654'757.0 737'005.0 499'166.4 550'798.5 121'665.0 124'242.0
- - - - - 0.00x 0.00x - - - -
- - - - - 0.0 0.0 - - - -
- - - - - 0.00x 0.00x - - - -
92'599.0 106'756.0 134'844.0 169'258.0 193'179.0 182'716.0 206'607.0 212'524.9 231'699.4 57'878.0 44'750.0
9.36x 12.77x 10.55x 6.47x 6.50x 5.90x 5.23x 5.41x 4.93x 4.82x 4.62x
EBITDA - Long-Term Rating Date 29.11.2011
EBIT - Long-Term Rating A
Operating Margin 54.22% Long-Term Outlook STABLE
Pretax Margin 54.26% Short-Term Rating Date 29.11.2011
Return on Assets 1.46% Short-Term Rating A-1
Return on Common Equity 22.26%
Return on Capital 9.48% EBITDA/Interest Exp. -
Asset Turnover 0.05% (EBITDA-Capex)/Interest Exp. -
Net Debt/EBITDA -
Gross Margin - Total Debt/EBITDA -
EBITDA Margin -
EBIT Margin - Total Debt/Equity 138.6%
Net Income Margin 41.7% Total Debt/Capital 57.9%
Asset Turnover 0.05
Current Ratio - Net Fixed Asset Turnover 5.86
Quick Ratio - Accounts receivable turnover-days -
Debt to Assets 9.34% Inventory Days -
Tot Debt to Common Equity 138.62% Accounts Payable Turnover Day -
Accounts Receivable Turnover - Cash Conversion Cycle -
Inventory Turnover -
Fiscal Year Ended
China Construction Bank CorpPrice/Volume
Valuation Analysis
116'744'306.00
Current Price (9/dd/yy) Market Data
Net Income
P/E
Market Capitalization
Average Daily Trading Volume
Relative Stock Price Performance
Total Revenue
TEV/Revenue
EBITDA
TEV/EBITDA
Profitability S&P Issuer Ratings
Credit Ratios
Margin Analysis
Reference
Structure
,
-
.
0
1
2
3
o!-. l!-. k!-. a!-. g!-0 c!-0 j!-0 Q!-0 j!-0 g!-0 g!-0 Q!-0 o!-0', F
.,', F
1,', F
3,', F
5,', F
-,,', F
-.,', F
-1,', F
-3,', F
0.0
100'000.0
200'000.0
300'000.0
400'000.0
500'000.0
600'000.0
700'000.0
800'000.0
2001 2002 2003 2004 2005 2006 2007 2008 2009 2010 2011 2012
,',,
-',,
.',,
0',,
1',,
2',,
3',,
4',,
5',,
6',,
-,',,
,-',-'.,-, ,-',4'.,-, ,-',-'.,-- ,-',4'.,-- ,-',-'.,-. ,-',4'.,-. ,-',-'.,-0 ,-',4'.,-0
FReTn/CTrThoT/PolhirTlAlcST/ !Rna /eis FReTn/CTrThoT/PolhirTlAlcST/ !Rna /eis
Q.M.S Advisors | tel: +41 (0)78 922 08 77 | e-mail: [email protected] |
Page 113
09.09.2013
Holder Name Portfolio Name Source Amt Held % Out Latest Chg File Dt Inst Type
CHINA LIFE INSURANCE n/a Co File 1'626'830'229 16.96 - 30.06.2011 Government
CHINA INVESTMENT COR n/a ULT-AGG 492'631'014 5.13 - 17.06.2013 Investment Advisor
BAOSTEEL GROUP CORP n/a Co File 318'860'498 3.32 - 30.06.2011 Government
CHINA LIFE INSURANCE n/a ULT-AGG 204'563'395 2.13 - 30.06.2011 Government
CAISSE DE DEPOT ET P Multiple Portfolios MF-AGG 180'211'848 1.88 - 31.12.2012 Investment Advisor
BLACKROCK ASSET MGMT Multiple Portfolios MF-AGG 178'769'823 1.86 - 30.08.2013 Investment Advisor
BOSHI FUND MANAGEMEN Multiple Portfolios MF-AGG 125'999'629 1.31 76'399'753 30.06.2013 Investment Advisor
HARVEST FUND MANAGEM Multiple Portfolios MF-AGG 98'437'675 1.03 (42'401'318) 31.12.2012 Investment Advisor
CSOP ASSET MANAGEMEN Multiple Portfolios MF-AGG 70'698'036 0.74 - 02.09.2013 Investment Advisor
HUATAI-PINEBRIDGE FU Multiple Portfolios MF-AGG 53'056'557 0.55 (3'308'689) 30.06.2013 Investment Advisor
LION FUND MANAGEMENT Multiple Portfolios MF-AGG 43'059'664 0.45 33'359'845 30.06.2013 Investment Advisor
MORGAN STANLEY n/a ULT-AGG 39'285'859 0.41 13'126'641 30.06.2013 Investment Advisor
PICTET FUNDS n/a ULT-AGG 25'330'830 0.26 - 30.04.2013 Investment Advisor
DACHENG FUND MANAGME Multiple Portfolios MF-AGG 25'272'998 0.26 2'153'200 31.12.2012 Investment Advisor
UBS SDIC FUND MANAGE Multiple Portfolios MF-AGG 23'699'777 0.25 2'340'321 30.06.2013 Investment Advisor
PENGHUA FUND MANAGEM Multiple Portfolios MF-AGG 21'557'451 0.22 17'079'585 31.12.2012 Investment Advisor
CHINA ASSET MANAGEME Multiple Portfolios MF-AGG 19'110'892 0.2 - 02.09.2013 Investment Advisor
GRANTHAM MAYO VAN OT Multiple Portfolios MF-AGG 17'969'856 0.19 - 31.05.2013 Investment Advisor
TIANTONG ASSET MANAG Multiple Portfolios MF-AGG 17'419'691 0.18 (1'422'540) 31.12.2012 Investment Advisor
GUOTAI ASSET MANAGEM Multiple Portfolios MF-AGG 17'309'471 0.18 2'671'753 31.12.2012 Investment Advisor
Firm Name Analyst Recommendation Weighting Change Target Price Date Date
PingAn Securities GRACE LI neutral 3 M #N/A N/A Not Provided 03.09.2013
Masterlink Securities RAINY YUAN hold 3 D 5 6 month 27.08.2013
Bank of China International YUAN LIN buy 5 M 7 Not Provided 27.08.2013
Northeast Securities Co Ltd YAYUN TANG add 4 M #N/A N/A Not Provided 27.08.2013
China International Capital Corp JIE HUANG accumulate 4 M #N/A N/A Not Provided 26.08.2013
Chang Jiang Securities Co. Limited LIU JUN add 4 M #N/A N/A Not Provided 25.08.2013
Guotai Junan GUANHUA QIU add 4 U 5 Not Provided 20.08.2013
Qilu Securities Co Ltd JIAOYI CHENG add 4 M #N/A N/A Not Provided 11.08.2013
UBS JANET SUN buy 5 M 5 12 month 07.08.2013
SWS Research Co Ltd JUN NI outperform 5 M #N/A N/A Not Provided 19.07.2013
GF Securities Co. Ltd. Mu Hua add 4 M #N/A N/A Not Provided 19.06.2013
Goldman Sachs NING MA Buy/Neutral 5 M 5 12 month 12.06.2013
Everbright Securities Co., Ltd SHEN WEI accumulate 4 M 5 12 month 02.06.2013
Hong Yuan Securities ZHANG JIXIU add 4 M 5 6 month 11.05.2013
Capital Securities Corp TEAM COVERAGE buy 5 M #N/A N/A Not Provided 25.03.2013
Sinolink Securities Co Ltd JIANGANG CHEN neutral 3 M #N/A N/A Not Provided 25.03.2013
HSBC TODD DUNIVANT overweight 5 M 6 Not Provided 17.09.2012
China Merchants Securities LUO YI buy 5 M #N/A N/A Not Provided 23.07.2012
Citic Securities Co., Ltd ZHU YAN overweight 5 M #N/A N/A Not Provided 29.06.2012
China Securities Co., Ltd #N/A N/A add 4 M 5 Not Provided 25.06.2012
Central China Securities CHEN XI add 4 M #N/A N/A Not Provided 26.03.2012
Industrial Securities YIDONG ZHANG buy 5 M #N/A N/A Not Provided 25.03.2012
Rising Securities Co.,LTD XIE AIHONG neutral 3 D #N/A N/A Not Provided 20.12.2011
BOCOM International Holdings LI SHANSHAN long-term buy 5 M #N/A N/A Not Provided 13.12.2011
China Investment Securities ZHANG ZHONGYANG buy 5 M #N/A N/A Not Provided 02.12.2011
China Minzu Securities Co Ltd ZHANG JING buy 5 M 6 6 month 30.06.2011
Great Wall Securities CHENG BINBIN neutral 3 D #N/A N/A Not Provided 23.05.2011
China Galaxy Securities YE YUNYAN speculative buy 4 M #N/A N/A Not Provided 11.05.2010
Guodu Securities Co Ltd DENG TING buy 5 N #N/A N/A Not Provided 23.08.2009
Holdings By:
China Construction Bank Corp ee
Q.M.S Advisors | tel: +41 (0)78 922 08 77 | e-mail: [email protected] |
Page 114
09.09.2013
GD Power Development Co., Ltd. generates and distributes electric power and
heat throughout China. The Company also invests in new energy development and
environmental protection projects.
Latest Fiscal Year: 12/2012
LTM as of: 06/yy
52-Week High (12.03.2013) 3.05
52-Week Low (25.06.2013) 2.15
Daily Volume
2.38
52-Week High % Change -21.97% Dividend Yield -
52-Week Low % Change 10.70% Beta 0.76
% 52 Week Price Range High/Low 18.89% Equity Float 6'469.55
Shares Out 01.07.2013 17'229.9 Short Int -
41'007.15 1 Yr Total Return -2.88%
Total Debt 116'263.73 YTD Return -5.10%
Preferred Stock 0.0 Adjusted BETA 0.757
Minority Interest 16'755.6 Analyst Recs 12
Cash and Equivalents 5'291.98 Consensus Rating 4.167
Enterprise Value 167'867.23
Average Volume 5 Day 53'434'480
600795 CH EQUITY YTD Change - Average Volume 30 Day 60'799'650
600795 CH EQUITY YTD % CHANGE - Average Volume 3 Month 61'441'760
LTM-4Q LTM FY+1 FY+2 FQ+1 FQ+2
31.12.2008 31.12.2009 31.12.2010 31.12.2011 31.12.2012 06/yy 06/yy 12/13 Y 12/14 Y 09/13 Q3 12/13 Q4
16'271.3 33'694.3 40'797.1 50'579.6 55'259.8 53'337.8 56'874.5 60'737.8 66'111.8 15'917.0 15'692.0
4.70x 3.67x 3.62x 3.30x 3.13x 12.44x 12.25x 2.89x 2.95x - -
3'435.2 10'139.6 11'269.2 13'805.6 18'082.2 0.0 0.0 22'188.0 22'036.0 - -
22.24x 12.20x 13.12x 12.10x 9.57x 0.00x 0.00x 7.57x 7.62x - -
178.9 2'496.9 2'429.2 3'648.1 5'050.6 3'716.7 6'808.2 6'053.2 5'893.4 1'723.0 1'600.5
168.79x 16.10x 14.64x 11.77x 8.02x 11.20x 5.54x 7.15x 6.76x - -
EBITDA 18'082.18 Long-Term Rating Date -
EBIT 10'818.38 Long-Term Rating -
Operating Margin 19.58% Long-Term Outlook -
Pretax Margin 14.26% Short-Term Rating Date -
Return on Assets 3.32% Short-Term Rating -
Return on Common Equity 21.72%
Return on Capital - EBITDA/Interest Exp. 2.18
Asset Turnover 0.28% (EBITDA-Capex)/Interest Exp. -0.92
Net Debt/EBITDA -
Gross Margin 21.2% Total Debt/EBITDA -
EBITDA Margin -
EBIT Margin 23.5% Total Debt/Equity 335.6%
Net Income Margin 9.1% Total Debt/Capital 69.3%
Asset Turnover 0.28
Current Ratio 0.29 Net Fixed Asset Turnover 0.34
Quick Ratio 0.20 Accounts receivable turnover-days 46.85
Debt to Assets 56.00% Inventory Days 25.82
Tot Debt to Common Equity 335.57% Accounts Payable Turnover Day 99.86
Accounts Receivable Turnover 7.79 Cash Conversion Cycle -26.08
Inventory Turnover 14.14
Profitability S&P Issuer Ratings
Credit Ratios
Margin Analysis
Reference
Structure
Net Income
P/E
Market Capitalization
Average Daily Trading Volume
Relative Stock Price Performance
Total Revenue
TEV/Revenue
EBITDA
TEV/EBITDA
Fiscal Year Ended
GD Power Development Co LtdPrice/Volume
Valuation Analysis
130'402'487.00
Current Price (9/dd/yy) Market Data
,
-
-
.
.
0
0
1
o!-. l!-. k!-. a!-. g!-0 c!-0 j!-0 Q!-0 j!-0 g!-0 g!-0 Q!-0 o!-0', F
2,', F
-,,', F
-2,', F
.,,', F
.2,', F
0,,', F
0.0
10'000.0
20'000.0
30'000.0
40'000.0
50'000.0
60'000.0
2001 2002 2003 2004 2005 2006 2007 2008 2009 2010 2011 2012
,',,
2',,
-,',,
-2',,
.,',,
.2',,
0,',,
02',,
1,',,
12',,
2,',,
,-',-'.,-, ,-',4'.,-, ,-',-'.,-- ,-',4'.,-- ,-',-'.,-. ,-',4'.,-. ,-',-'.,-0 ,-',4'.,-0
FReTn/CTrThoT/PolhirTlAlcST/ !Rna /eis FReTn/CTrThoT/PolhirTlAlcST/ !Rna /eis
Q.M.S Advisors | tel: +41 (0)78 922 08 77 | e-mail: [email protected] |
Page 115
09.09.2013
Holder Name Portfolio Name Source Amt Held % Out Latest Chg File Dt Inst Type
CHINA GOUDIAN CORP n/a Co File 8'982'166'685 52.13 - 31.12.2012 Government
NATL COUNCIL SOC SEC n/a Co File 917'431'192 5.32 - 31.12.2012 Government
BOSHI FUND MANAGEMEN Multiple Portfolios MF-AGG 272'510'956 1.58 (29'268'745) 31.12.2012 Investment Advisor
SHANGHAI ELECTRIC GR n/a Co File 200'000'000 1.16 - 31.12.2012 Government
LION FUND MANAGEMENT Multiple Portfolios MF-AGG 184'749'662 1.07 (45'654'824) 31.12.2012 Investment Advisor
YINHUA FUND MANAGEME Multiple Portfolios MF-AGG 162'078'409 0.94 49'356'009 31.12.2012 Investment Advisor
HARBIN ELECTRIC CO L n/a Co File 160'000'000 0.93 - 31.12.2012 Government
TIBET AUTO REG INVES n/a Co File 156'800'000 0.91 - 31.12.2012 Government
SOCIAL SECURITY FUND n/a Co File 142'957'701 0.83 - 31.12.2012 Government
BEIJING ENERGY INVES n/a Co File 100'975'770 0.59 - 31.12.2012 Corporation
CHINA CO-OP GROUP n/a Co File 100'000'000 0.58 - 31.12.2012 Government
PENGHUA FUND MANAGEM Multiple Portfolios MF-AGG 70'575'495 0.41 1'152'795 31.12.2012 Investment Advisor
HARVEST FUND MANAGEM Multiple Portfolios MF-AGG 67'536'497 0.39 (42'143'805) 31.12.2012 Investment Advisor
HUAAN FUND MANAGEMEN Multiple Portfolios MF-AGG 56'296'243 0.33 4'392'531 31.12.2012 Investment Advisor
CHINA ASSET MANAGEME Multiple Portfolios MF-AGG 53'979'357 0.31 8'020'000 31.12.2012 Investment Advisor
AEGON INDUSTRIAL FUN Multiple Portfolios MF-AGG 51'690'559 0.3 (63'263'744) 31.12.2012 Investment Advisor
HUATAI-PINEBRIDGE FU Multiple Portfolios MF-AGG 43'860'630 0.25 8'195'284 31.12.2012 Investment Advisor
CHINA UNIVERSAL ASSE Multiple Portfolios MF-AGG 40'330'967 0.23 34'504'251 02.09.2013 Investment Advisor
GUOTAI ASSET MANAGEM Multiple Portfolios MF-AGG 32'823'294 0.19 18'342'638 31.12.2012 Investment Advisor
CHINA ASSET MANAGEME Multiple Portfolios MF-AGG 27'931'662 0.16 (28'256'500) 31.12.2012 Investment Advisor
Firm Name Analyst Recommendation Weighting Change Target Price Date Date
Masterlink Securities LI YAN buy 5 M 3 6 month 02.09.2013
UBS YINGZHEN XU buy 5 M 3 12 month 30.08.2013
Capital Securities Corp LAI SHENSHENG hold 3 D 4 Not Provided 30.08.2013
China International Capital Corp JUNHUA CHEN accumulate 4 M #N/A N/A Not Provided 30.08.2013
Everbright Securities Co., Ltd JUNPENG CHEN accumulate 4 M 3 12 month 18.08.2013
SWS Research Co Ltd EVAN LIANG outperform 5 M #N/A N/A Not Provided 18.07.2013
China Merchants Securities PENG QUANGANG strong buy 5 M 4 12 month 10.07.2013
Chang Jiang Securities Co. Limited JUN GE add 4 M #N/A N/A Not Provided 05.07.2013
Central China Securities PAN HANGJUN add 4 M #N/A N/A Not Provided 27.06.2013
EVA Dimensions DOUG WALTERS sell 1 M #N/A N/A Not Provided 06.06.2013
Rising Securities Co.,LTD DAI LIPING outperform 5 M #N/A N/A Not Provided 23.04.2013
Citic Securities Co., Ltd WU FEI buy 5 M #N/A N/A Not Provided 15.01.2013
Bank of China International PETER YAO not rated #N/A N/A M #N/A N/A Not Provided 10.12.2012
Hong Yuan Securities LU RUMIN add 4 D #N/A N/A Not Provided 06.06.2012
PingAn Securities SHAO QING buy 5 M #N/A N/A Not Provided 09.03.2012
China Galaxy Securities ZOU XUYUAN buy 5 M #N/A N/A Not Provided 01.07.2010
China Minzu Securities Co Ltd ZHANG KAI add 4 M #N/A N/A Not Provided 18.05.2010
KGI Securities CHEN JUDITH outperform 5 M 3 12 month 17.11.2008
Holdings By:
GD Power Development Co Ltd ee
Q.M.S Advisors | tel: +41 (0)78 922 08 77 | e-mail: [email protected] |
Page 116
09.09.2013
China National Chemical Engineering Company Ltd. offers construction services.
The Company builds chemical, petrochemical, pharmaceutical and power plants,
and coal industry facilities.
Latest Fiscal Year: 12/2012
LTM as of: 06/yy
52-Week High (31.05.2013) 12.24
52-Week Low (24.09.2012) 6.21
Daily Volume
8.13
52-Week High % Change -33.58% Dividend Yield -
52-Week Low % Change 30.92% Beta 1.39
% 52 Week Price Range High/Low 29.19% Equity Float 1'236.83
Shares Out 30.06.2013 4'933.0 Short Int -
40'105.29 1 Yr Total Return 22.68%
Total Debt 1'230.18 YTD Return -0.69%
Preferred Stock 0.0 Adjusted BETA 1.390
Minority Interest 1'207.9 Analyst Recs 15
Cash and Equivalents 18'868.46 Consensus Rating 4.867
Enterprise Value 22'989.17
Average Volume 5 Day 31'362'490
601117 CH EQUITY YTD Change - Average Volume 30 Day 52'983'940
601117 CH EQUITY YTD % CHANGE - Average Volume 3 Month 44'944'020
LTM-4Q LTM FY+1 FY+2 FQ+1 FQ+2
31.12.2008 31.12.2009 31.12.2010 31.12.2011 31.12.2012 06/yy 06/yy 12/13 Y 12/14 Y 09/13 Q3 12/13 Q4
22'107.9 27'409.5 33'240.2 43'718.5 52'970.5 49'040.5 57'769.9 65'457.4 86'270.3 - -
- - 0.47x 0.28x 0.46x 1.22x 1.78x - - - -
1'546.3 1'649.1 2'460.3 3'161.8 3'945.0 0.0 0.0 5'006.0 5'931.0 - -
- - 6.37x 3.85x 6.14x 0.00x 0.00x 4.59x 3.88x - -
634.4 979.2 1'681.2 2'380.4 3'083.6 2'847.8 3'310.1 3'900.2 4'945.8 - -
- - 17.00x 11.88x 13.08x 9.98x 13.93x 10.18x 8.20x - -
EBITDA 3'944.98 Long-Term Rating Date -
EBIT 3'451.89 Long-Term Rating -
Operating Margin 6.52% Long-Term Outlook -
Pretax Margin 7.33% Short-Term Rating Date -
Return on Assets 5.63% Short-Term Rating -
Return on Common Equity 18.54%
Return on Capital - EBITDA/Interest Exp. 54.22
Asset Turnover 0.98% (EBITDA-Capex)/Interest Exp. 30.05
Net Debt/EBITDA -
Gross Margin 12.9% Total Debt/EBITDA -
EBITDA Margin -
EBIT Margin 6.5% Total Debt/Equity 6.8%
Net Income Margin 5.8% Total Debt/Capital 6.0%
Asset Turnover 0.98
Current Ratio 1.29 Net Fixed Asset Turnover 8.40
Quick Ratio 0.69 Accounts receivable turnover-days 50.76
Debt to Assets 2.08% Inventory Days 68.96
Tot Debt to Common Equity 6.84% Accounts Payable Turnover Day 83.00
Accounts Receivable Turnover 7.19 Cash Conversion Cycle 17.67
Inventory Turnover 5.29
Fiscal Year Ended
China National Chemical Engineering Co LtdPrice/Volume
Valuation Analysis
48'731'142.00
Current Price (9/dd/yy) Market Data
Net Income
P/E
Market Capitalization
Average Daily Trading Volume
Relative Stock Price Performance
Total Revenue
TEV/Revenue
EBITDA
TEV/EBITDA
Profitability S&P Issuer Ratings
Credit Ratios
Margin Analysis
Reference
Structure
,
.
1
3
5
-,
-.
-1
o!-. l!-. k!-. a!-. g!-0 c!-0 j!-0 Q!-0 j!-0 g!-0 g!-0 Q!-0 o!-0', F
.,', F
1,', F
3,', F
5,', F
-,,', F
-.,', F
-1,', F
0.0
10'000.0
20'000.0
30'000.0
40'000.0
50'000.0
60'000.0
2001 2002 2003 2004 2005 2006 2007 2008 2009 2010 2011 2012
,',,
2',,
-,',,
-2',,
.,',,
.2',,
0,',,
,-',-'.,-, ,-',4'.,-, ,-',-'.,-- ,-',4'.,-- ,-',-'.,-. ,-',4'.,-. ,-',-'.,-0 ,-',4'.,-0
FReTn/CTrThoT/PolhirTlAlcST/ !Rna /eis FReTn/CTrThoT/PolhirTlAlcST/ !Rna /eis
Q.M.S Advisors | tel: +41 (0)78 922 08 77 | e-mail: [email protected] |
Page 117
09.09.2013
Holder Name Portfolio Name Source Amt Held % Out Latest Chg File Dt Inst Type
CHINA NATIONAL CHEMI n/a Co File 3'290'564'000 66.71 - 31.12.2012 Government
SHENHUA GROUP CORP L n/a Co File 143'068'000 2.9 - 31.12.2012 Government
SOCIAL SECURITY FUND n/a Co File 135'327'537 2.74 - 31.12.2012 Government
SINOCHEM CORP n/a Co File 127'206'129 2.58 - 31.12.2012 Government
BANK OF COMMUNICATIO Multiple Portfolios MF-AGG 86'073'527 1.74 79'073'733 31.12.2012 Investment Advisor
GF FUND MANAGEMENT C Multiple Portfolios MF-AGG 79'616'685 1.61 (10'628'893) 31.12.2012 Investment Advisor
BANK OF CHINA INVEST Multiple Portfolios MF-AGG 46'540'571 0.94 44'742'752 31.12.2012 Investment Advisor
INVESCO GREAT WALL F Multiple Portfolios MF-AGG 39'270'354 0.8 27'383'442 31.12.2012 Investment Advisor
ABC-CA FUND MANAGEME Multiple Portfolios MF-AGG 33'246'589 0.67 31'694'713 31.12.2012 Investment Advisor
HUATAI-PINEBRIDGE FU Multiple Portfolios MF-AGG 32'138'283 0.65 11'752'507 31.12.2012 Investment Advisor
GUOTAI ASSET MANAGEM Multiple Portfolios MF-AGG 30'421'376 0.62 24'163'681 30.06.2013 Investment Advisor
CHINA ASSET MANAGEME Multiple Portfolios MF-AGG 20'594'051 0.42 (5'724'014) 31.12.2012 Investment Advisor
E FUND MANAGEMENT Multiple Portfolios MF-AGG 20'448'732 0.41 (527'582) 31.12.2012 Investment Advisor
ORIENT FUND MANAGEME Multiple Portfolios MF-AGG 18'158'275 0.37 12'098'275 31.12.2012 Investment Advisor
HARVEST FUND MANAGEM Multiple Portfolios MF-AGG 18'127'197 0.37 (36'776'000) 31.12.2012 Investment Advisor
CHINA POST & CAPITAL Multiple Portfolios MF-AGG 18'000'000 0.36 (50'213'660) 31.12.2012 Investment Advisor
CHINA SOUTHERN FUND Multiple Portfolios MF-AGG 15'728'246 0.32 (8'053'109) 31.12.2012 Investment Advisor
SOOCHOW ASSET MANAGE Multiple Portfolios MF-AGG 14'052'061 0.28 (500'000) 31.12.2012 Investment Advisor
GALAXY ASSET MANAGEM Multiple Portfolios MF-AGG 13'634'473 0.28 13'284'524 31.12.2012 Investment Advisor
CHINA INTERNATIONAL Multiple Portfolios MF-AGG 12'734'185 0.26 12'734'185 31.12.2012 Investment Advisor
Firm Name Analyst Recommendation Weighting Change Target Price Date Date
Guotai Junan ZHANG KUN buy 5 M 12 12 month 26.08.2013
Central China Securities MINHAO GU buy 5 M #N/A N/A Not Provided 15.08.2013
Sinolink Securities Co Ltd HE GUOWEN add 4 M #N/A N/A Not Provided 14.08.2013
Capital Securities Corp ZHENG CHUNMING buy 5 M 15 Not Provided 13.08.2013
GF Securities Co. Ltd. XIAO TANG buy 5 M #N/A N/A Not Provided 13.08.2013
Hong Yuan Securities ZHOU RONGZI buy 5 M 13 6 month 21.07.2013
SWS Research Co Ltd LU LINGLING outperform 5 M #N/A N/A Not Provided 16.07.2013
Qilu Securities Co Ltd ZHAOLIANG LIU buy 5 M #N/A N/A Not Provided 01.07.2013
Guodu Securities Co Ltd WANG SHUANG strong buy 5 M 10 6 month 28.06.2013
China International Capital Corp BIN GUAN buy 5 M #N/A N/A Not Provided 17.06.2013
China Minzu Securities Co Ltd YU WALI add 4 M 7 6 month 17.06.2013
EVA Dimensions TIMOTHY STANISH buy 5 M #N/A N/A Not Provided 06.06.2013
Citic Securities Co., Ltd YANG TAO buy 5 M #N/A N/A Not Provided 03.05.2013
Bank of China International NI XIAOMAN buy 5 N #N/A N/A Not Provided 14.01.2013
HuaChuang Securities GAO LI buy 5 M #N/A N/A Not Provided 06.12.2012
China Securities Co., Ltd TIAN DONGHONG buy 5 N 9 Not Provided 25.06.2012
Industrial Securities WANG SHUANG buy 5 M #N/A N/A Not Provided 20.04.2012
Great Wall Securities RAN FEI buy 5 N #N/A N/A Not Provided 30.03.2012
Rising Securities Co.,LTD SONG HUAISONG outperform 5 M #N/A N/A Not Provided 09.01.2012
Everbright Securities Co., Ltd WANG XIXIN accumulate 4 N 10 12 month 27.06.2011
Holdings By:
China National Chemical Engineering Co Ltd ee
Q.M.S Advisors | tel: +41 (0)78 922 08 77 | e-mail: [email protected] |
Page 118
09.09.2013
Guangzhou Baiyunshan Pharmaceutical Holdings Co., Ltd. manufactures and
sells Chinese patent medicine. The Company also wholesales, retails, imports,
and exports Western and Chinese pharmaceutical products and various medical
apparatus.
Latest Fiscal Year: 12/2011
LTM as of: 06/yy
52-Week High (15.05.2013) 40.73
52-Week Low (04.12.2012) 15.10
Daily Volume
33.31
52-Week High % Change -18.22% Dividend Yield -
52-Week Low % Change 120.60% Beta -
% 52 Week Price Range High/Low 71.56% Equity Float 677.32
Shares Out 05.07.2013 1'071.4 Short Int -
40'671.08 1 Yr Total Return 37.76%
Total Debt 121.40 YTD Return 71.52%
Preferred Stock 0.0 Adjusted BETA -
Minority Interest 127.7 Analyst Recs 5
Cash and Equivalents 732.41 Consensus Rating 4.000
Enterprise Value 39'404.10
Average Volume 5 Day 7'488'921
600332 CH EQUITY YTD Change - Average Volume 30 Day 10'612'200
600332 CH EQUITY YTD % CHANGE - Average Volume 3 Month 13'281'070
LTM-4Q LTM FY+1 FY+2 FQ+1 FQ+2
31.12.2008 31.12.2009 31.12.2010 31.12.2011 31.12.2012 06/yy 06/yy 12/13 Y 12/14 Y 09/13 Q3 12/13 Q4
3'450.6 3'802.4 4'455.9 5'395.6 8'161.9 6'072.0 13'680.8 18'562.5 19'282.0 - -
1.16x 1.93x 3.17x 0.72x 1.65x 3.31x 2.44x - - - -
104.8 163.0 316.3 298.2 358.1 0.0 0.0 1'269.0 1'716.0 - -
38.21x 44.97x 44.69x 13.07x 37.50x 0.00x 0.00x 31.05x 22.96x - -
181.8 214.9 267.1 287.5 395.3 325.0 765.4 1'037.8 1'384.0 - -
10.30x 19.44x 33.14x 13.87x 22.73x 28.14x 9.36x 38.29x 30.12x - -
EBITDA 358.12 Long-Term Rating Date -
EBIT 247.73 Long-Term Rating -
Operating Margin 3.04% Long-Term Outlook -
Pretax Margin 5.61% Short-Term Rating Date -
Return on Assets 8.65% Short-Term Rating -
Return on Common Equity 14.68%
Return on Capital 14.04% EBITDA/Interest Exp. 30.62
Asset Turnover 1.55% (EBITDA-Capex)/Interest Exp. 26.12
Net Debt/EBITDA -1.76
Gross Margin 27.0% Total Debt/EBITDA 0.83
EBITDA Margin 6.0%
EBIT Margin 5.0% Total Debt/Equity 3.0%
Net Income Margin 4.8% Total Debt/Capital 2.8%
Asset Turnover 1.55
Current Ratio 1.85 Net Fixed Asset Turnover 8.32
Quick Ratio 0.92 Accounts receivable turnover-days 43.22
Debt to Assets 1.95% Inventory Days 61.39
Tot Debt to Common Equity 2.96% Accounts Payable Turnover Day 38.16
Accounts Receivable Turnover 8.45 Cash Conversion Cycle 77.20
Inventory Turnover 5.95
Profitability S&P Issuer Ratings
Credit Ratios
Margin Analysis
Reference
Structure
Net Income
P/E
Market Capitalization
Average Daily Trading Volume
Relative Stock Price Performance
Total Revenue
TEV/Revenue
EBITDA
TEV/EBITDA
Fiscal Year Ended
Guangzhou Baiyunshan Pharmaceutical Holdings Co LtdPrice/Volume
Valuation Analysis
8'748'480.00
Current Price (9/dd/yy) Market Data
,2
-,-2.,.20,021,12
o!-. l!-. k!-. a!-. g!-0 c!-0 j!-0 Q!-0 j!-0 g!-0 g!-0 Q!-0 o!-0', F2', F-,', F-2', F.,', F.2', F0,', F02', F1,', F12', F
0.0
2'000.0
4'000.0
6'000.0
8'000.0
10'000.0
12'000.0
14'000.0
2001 2002 2003 2004 2005 2006 2007 2008 2009 2010 2011 2012
,',,
-,,',,
.,,',,
0,,',,
1,,',,
2,,',,
3,,',,
,-',-'.,-, ,-',4'.,-, ,-',-'.,-- ,-',4'.,-- ,-',-'.,-. ,-',4'.,-. ,-',-'.,-0 ,-',4'.,-0
FReTn/CTrThoT/PolhirTlAlcST/ !Rna /eis FReTn/CTrThoT/PolhirTlAlcST/ !Rna /eis
Q.M.S Advisors | tel: +41 (0)78 922 08 77 | e-mail: [email protected] |
Page 119
09.09.2013
Holder Name Portfolio Name Source Amt Held % Out Latest Chg File Dt Inst Type
GUANGZHOU PHARMACEUT n/a Co File 390'833'391 36.48 - 31.12.2012 Holding Company
AEGON INDUSTRIAL FUN Multiple Portfolios MF-AGG 7'654'819 0.71 4'705'715 30.06.2013 Investment Advisor
MORGAN STANLEY HUAXI Multiple Portfolios MF-AGG 6'270'000 0.59 4'088'213 30.06.2013 Investment Advisor
HFT INVESTMENT MANAG Multiple Portfolios MF-AGG 6'064'696 0.57 6'064'696 31.12.2012 Investment Advisor
INVESCO GREAT WALL F Multiple Portfolios MF-AGG 4'609'500 0.43 1'069'950 30.06.2013 Investment Advisor
GZ XINJIAO RURAL CRE n/a EXCH 3'276'750 0.31 - 30.06.2008 Other
GF FUND MANAGEMENT C Multiple Portfolios MF-AGG 3'028'864 0.28 2'319'295 31.12.2012 Investment Advisor
HUAAN FUND MANAGEMEN Multiple Portfolios MF-AGG 2'416'423 0.23 1'916'423 31.12.2012 Investment Advisor
BOSHI FUND MANAGEMEN Multiple Portfolios MF-AGG 1'390'379 0.13 1'390'379 31.12.2012 Investment Advisor
E FUND MANAGEMENT Multiple Portfolios MF-AGG 1'311'058 0.12 1'111'118 31.12.2012 Investment Advisor
BOSERA FUND MANAGEME Multiple Portfolios MF-AGG 1'175'734 0.11 1'175'734 30.06.2013 Investment Advisor
CHINA ASSET MANAGEME Multiple Portfolios MF-AGG 988'201 0.09 - 02.09.2013 Investment Advisor
MINSHENG ROYAL FUND Multiple Portfolios MF-AGG 545'273 0.05 (463'275) 30.06.2013 Investment Advisor
HUAFU FUND MANAGEMEN Multiple Portfolios MF-AGG 459'938 0.04 459'938 31.12.2012 Investment Advisor
LION FUND MANAGEMENT Multiple Portfolios MF-AGG 457'685 0.04 452'685 31.12.2012 Investment Advisor
CHINA MERCHANTS FUND Multiple Portfolios MF-AGG 441'580 0.04 (39'048) 31.12.2012 Investment Advisor
CHINA ASSET MANAGEME Multiple Portfolios MF-AGG 370'000 0.03 370'000 31.12.2012 Investment Advisor
CITIC PRUDENTIAL FUN Multiple Portfolios MF-AGG 300'000 0.03 (571'006) 31.12.2012 Investment Advisor
BANK OF COMMUNICATIO Multiple Portfolios MF-AGG 277'590 0.03 277'590 31.12.2012 Investment Advisor
FULLGOAL FUND MANAGE Multiple Portfolios MF-AGG 168'000 0.02 168'000 31.12.2012 Investment Advisor
Firm Name Analyst Recommendation Weighting Change Target Price Date Date
SWS Research Co Ltd SELINA LUO outperform 5 M #N/A N/A Not Provided 19.07.2013
Guotai Junan LI QIUSHI buy 5 M 45 12 month 29.05.2013
Morgan Stanley BIN LI Equalwt/In-Line 3 M 29 12 month 19.03.2013
Capital Securities Corp LI YING hold 3 M 16 Not Provided 01.03.2013
China International Capital Corp SUN LIANG accumulate 4 M #N/A N/A Not Provided 01.03.2013
Citic Securities Co., Ltd LI CHAO add 4 M #N/A N/A Not Provided 03.05.2012
Industrial Securities WANG XI buy 5 M #N/A N/A Not Provided 17.02.2012
China Investment Securities ZHOU RUI neutral 3 M #N/A N/A Not Provided 02.12.2011
HuaChuang Securities LIAO WANGUO buy 5 M 21 12 month 30.10.2011
Founder Securities NA XUE add 4 N #N/A N/A Not Provided 29.03.2010
Everbright Securities Co., Ltd YAO JIE accumulate 4 N 9 Not Provided 19.08.2009
Holdings By:
Guangzhou Baiyunshan Pharmaceutical Holdings Co Ltd ee
Q.M.S Advisors | tel: +41 (0)78 922 08 77 | e-mail: [email protected] |
Page 120
09.09.2013
Wanhua Chemical Group Co., Ltd. develops, manufactures, and markets pure
isocyanate, polymeric isocyanate, polyurethane, and other related chemical
products.
Latest Fiscal Year: 12/2012
LTM as of: 06/yy
52-Week High (25.04.2013) 19.73
52-Week Low (19.09.2012) 12.56
Daily Volume
16.83
52-Week High % Change -14.70% Dividend Yield -
52-Week Low % Change 34.00% Beta 1.08
% 52 Week Price Range High/Low 54.53% Equity Float 1'038.34
Shares Out 30.06.2013 2'162.3 Short Int -
36'392.09 1 Yr Total Return 30.68%
Total Debt 10'686.58 YTD Return 11.84%
Preferred Stock 0.0 Adjusted BETA 1.083
Minority Interest 1'538.4 Analyst Recs 21
Cash and Equivalents 1'400.51 Consensus Rating 4.762
Enterprise Value 50'874.13
Average Volume 5 Day 12'720'180
600309 CH EQUITY YTD Change - Average Volume 30 Day 15'301'610
600309 CH EQUITY YTD % CHANGE - Average Volume 3 Month 12'665'720
LTM-4Q LTM FY+1 FY+2 FQ+1 FQ+2
31.12.2008 31.12.2009 31.12.2010 31.12.2011 31.12.2012 06/yy 06/yy 12/13 Y 12/14 Y 09/13 Q3 12/13 Q4
7'655.8 6'465.4 9'402.5 13'601.7 15'853.9 13'878.2 18'624.8 20'167.5 24'381.2 4'500.0 6'750.0
2.31x 6.57x 3.94x 2.50x 2.81x 10.72x 9.97x 2.25x 1.62x - -
2'006.1 1'453.3 1'839.8 3'555.4 4'651.1 0.0 0.0 5'907.2 7'145.2 1'453.0 1'180.0
8.82x 29.23x 20.12x 9.58x 9.58x 0.00x 0.00x 8.61x 7.12x - -
1'548.8 1'066.4 1'530.2 1'853.9 2'348.9 1'839.4 2'903.0 3'007.7 3'590.3 619.0 929.0
10.75x 37.52x 20.86x 15.00x 14.32x 15.77x 11.94x 11.94x 10.05x - -
EBITDA 4'651.06 Long-Term Rating Date -
EBIT 3'896.31 Long-Term Rating -
Operating Margin 24.58% Long-Term Outlook -
Pretax Margin 22.49% Short-Term Rating Date -
Return on Assets 12.87% Short-Term Rating -
Return on Common Equity 38.02%
Return on Capital - EBITDA/Interest Exp. 11.56
Asset Turnover 0.83% (EBITDA-Capex)/Interest Exp. 1.78
Net Debt/EBITDA -
Gross Margin 34.5% Total Debt/EBITDA -
EBITDA Margin -
EBIT Margin 25.4% Total Debt/Equity 128.7%
Net Income Margin 14.8% Total Debt/Capital 52.1%
Asset Turnover 0.83
Current Ratio 1.02 Net Fixed Asset Turnover 1.53
Quick Ratio 0.71 Accounts receivable turnover-days 86.33
Debt to Assets 47.41% Inventory Days 59.75
Tot Debt to Common Equity 128.69% Accounts Payable Turnover Day 27.24
Accounts Receivable Turnover 4.23 Cash Conversion Cycle 124.42
Inventory Turnover 6.11
Profitability S&P Issuer Ratings
Credit Ratios
Margin Analysis
Reference
Structure
Net Income
P/E
Market Capitalization
Average Daily Trading Volume
Relative Stock Price Performance
Total Revenue
TEV/Revenue
EBITDA
TEV/EBITDA
Fiscal Year Ended
Wanhua Chemical Group Co LtdPrice/Volume
Valuation Analysis
13'983'445.00
Current Price (9/dd/yy) Market Data
,.135
-,-.-1-3-5.,
o!-. l!-. k!-. a!-. g!-0 c!-0 j!-0 Q!-0 j!-0 g!-0 g!-0 Q!-0 o!-0', F2', F-,', F-2', F.,', F.2', F0,', F02', F1,', F12', F2,', F
0.0
2'000.0
4'000.0
6'000.0
8'000.0
10'000.0
12'000.0
14'000.0
16'000.0
18'000.0
2001 2002 2003 2004 2005 2006 2007 2008 2009 2010 2011 2012
,',,
2,',,
-,,',,
-2,',,
.,,',,
.2,',,
,-',-'.,-, ,-',4'.,-, ,-',-'.,-- ,-',4'.,-- ,-',-'.,-. ,-',4'.,-. ,-',-'.,-0 ,-',4'.,-0
FReTn/CTrThoT/PolhirTlAlcST/ !Rna /eis FReTn/CTrThoT/PolhirTlAlcST/ !Rna /eis
Q.M.S Advisors | tel: +41 (0)78 922 08 77 | e-mail: [email protected] |
Page 121
09.09.2013
Holder Name Portfolio Name Source Amt Held % Out Latest Chg File Dt Inst Type
WANHUA INDUSTRIAL GR n/a Co File 1'091'880'317 50.5 - 31.12.2011 Government
GF FUND MANAGEMENT C Multiple Portfolios MF-AGG 56'169'861 2.6 (1'013'748) 31.12.2012 Investment Advisor
HARVEST FUND MANAGEM Multiple Portfolios MF-AGG 48'218'491 2.23 22'513'121 30.06.2013 Investment Advisor
HUAAN FUND MANAGEMEN Multiple Portfolios MF-AGG 47'663'074 2.2 694'369 30.06.2013 Investment Advisor
E FUND MANAGEMENT Multiple Portfolios MF-AGG 40'556'675 1.88 650'773 31.12.2012 Investment Advisor
YANTAI MOON GROUP CO n/a Co File 32'115'799 1.49 - 31.12.2011 Corporation
CHANGSHENG FUND MANA Multiple Portfolios MF-AGG 31'267'491 1.45 9'405'488 30.06.2013 Investment Advisor
FULLGOAL FUND MANAGE Multiple Portfolios MF-AGG 21'444'726 0.99 6'533'896 31.12.2012 Investment Advisor
CHINA SOUTHERN FUND Multiple Portfolios MF-AGG 17'358'513 0.8 6'055'191 31.12.2012 Investment Advisor
TAIKANG LIFE INSURAN n/a Co File 15'802'538 0.73 - 31.12.2011 Insurance Company
RONGTONG FUND MANAGE Multiple Portfolios MF-AGG 15'780'081 0.73 13'051'418 31.12.2012 Investment Advisor
PENGHUA FUND MANAGEM Multiple Portfolios MF-AGG 14'939'829 0.69 997'600 30.06.2013 Investment Advisor
CHINA LIFE INSURANCE n/a ULT-AGG 14'352'494 0.66 - 31.12.2011 Government
DACHENG FUND MANAGME Multiple Portfolios MF-AGG 11'973'919 0.55 (8'647'550) 31.12.2012 Investment Advisor
ICBC CREDIT SUISSE A Multiple Portfolios MF-AGG 10'853'114 0.5 (5'118'877) 31.12.2012 Investment Advisor
GTJA ALLIANZ FUND MA Multiple Portfolios MF-AGG 10'312'583 0.48 9'272'382 31.12.2012 Investment Advisor
HUATAI-PINEBRIDGE FU Multiple Portfolios MF-AGG 9'553'551 0.44 1'372'794 31.12.2012 Investment Advisor
HFT INVESTMENT MANAG Multiple Portfolios MF-AGG 7'447'933 0.34 1'175'547 31.12.2012 Investment Advisor
CHINA MERCHANTS FUND Multiple Portfolios MF-AGG 7'367'936 0.34 2'664'364 31.12.2012 Investment Advisor
ORIENT FUND MANAGEME Multiple Portfolios MF-AGG 7'259'334 0.34 190'900 31.12.2012 Investment Advisor
Firm Name Analyst Recommendation Weighting Change Target Price Date Date
PingAn Securities YAN ZHUBING strong buy 5 M #N/A N/A Not Provided 02.09.2013
GF Securities Co. Ltd. WANG JIANYU buy 5 M 23 12 month 19.08.2013
Guotai Junan KANG KAI buy 5 M 21 12 month 11.08.2013
EVA Dimensions TIMOTHY STANISH hold 3 U #N/A N/A Not Provided 31.07.2013
Fortune CLSA Securities Limited XUAN LI buy 5 M 25 12 month 30.07.2013
Chang Jiang Securities Co. Limited ZHANG XIANG buy 5 M #N/A N/A Not Provided 29.07.2013
SWS Research Co Ltd SHAWN ZHOU outperform 5 M #N/A N/A Not Provided 17.07.2013
Hong Yuan Securities ZU GUANGPING buy 5 M 23 6 month 14.07.2013
China Minzu Securities Co Ltd YU WALI add 4 M 15 6 month 08.07.2013
Guodu Securities Co Ltd WANG SHUANG buy 5 M 23 6 month 28.06.2013
Central China Securities LI LINLIN add 4 M #N/A N/A Not Provided 21.06.2013
Everbright Securities Co., Ltd CHENG LEI buy 5 M #N/A N/A Not Provided 21.04.2013
Rising Securities Co.,LTD ZENG WEIQIANG outperform 5 M #N/A N/A Not Provided 18.04.2013
China International Capital Corp GAO ZHENG buy 5 M #N/A N/A Not Provided 12.04.2013
UBS NINA YAN buy 5 M 21 12 month 11.04.2013
Capital Securities Corp ZHENG CHUNMING buy 5 M 25 Not Provided 27.03.2013
Northeast Securities Co Ltd TIAN BEI buy 5 M #N/A N/A Not Provided 25.03.2013
HuaChuang Securities GAO LI buy 5 M 18 6 month 03.02.2013
Citic Securities Co., Ltd YIN XIAODONG buy 5 M 19 6 month 29.01.2013
Bank of China International SU WENJIE buy 5 M 20 12 month 28.01.2013
Qilu Securities Co Ltd LI XUAN add 4 N #N/A N/A Not Provided 17.01.2013
China Securities Co., Ltd LIANG BIN add 4 D 18 Not Provided 25.06.2012
China Merchants Securities LU PING buy 5 M #N/A N/A Not Provided 10.06.2012
Industrial Securities ZHENG FANGBIAO buy 5 M #N/A N/A Not Provided 17.04.2012
Great Wall Securities LING XUELIANG buy 5 M #N/A N/A Not Provided 16.04.2012
China Investment Securities LIANG HAO strong buy 5 M #N/A N/A Not Provided 07.09.2011
Founder Securities ZHENGHUA ZHANG add 4 M #N/A N/A Not Provided 30.10.2010
China Galaxy Securities LI GUOHONG speculative buy 4 U #N/A N/A Not Provided 30.11.2009
Holdings By:
Wanhua Chemical Group Co Ltd ee
Q.M.S Advisors | tel: +41 (0)78 922 08 77 | e-mail: [email protected] |
Page 122
09.09.2013
China International Travel Service Corp Ltd. operates travel agencies that
offer a wide range of travel packages. The Company also operates duty free
shops.
Latest Fiscal Year: 12/2012
LTM as of: 06/yy
52-Week High (03.09.2013) 38.98
52-Week Low (07.12.2012) 23.90
Daily Volume
38.04
52-Week High % Change -2.41% Dividend Yield -
52-Week Low % Change 59.16% Beta 0.86
% 52 Week Price Range High/Low 93.77% Equity Float 289.95
Shares Out 15.07.2013 976.2 Short Int -
37'136.09 1 Yr Total Return 30.68%
Total Debt 35.00 YTD Return 40.21%
Preferred Stock 0.0 Adjusted BETA 0.863
Minority Interest 593.3 Analyst Recs 17
Cash and Equivalents 3'959.33 Consensus Rating 4.824
Enterprise Value 33'172.98
Average Volume 5 Day 5'847'706
601888 CH EQUITY YTD Change - Average Volume 30 Day 4'700'717
601888 CH EQUITY YTD % CHANGE - Average Volume 3 Month 4'583'009
LTM-4Q LTM FY+1 FY+2 FQ+1 FQ+2
31.12.2008 31.12.2009 31.12.2010 31.12.2011 31.12.2012 06/yy 06/yy 12/13 Y 12/14 Y 09/13 Q3 12/13 Q4
5'770.4 6'014.9 9'539.0 12'589.0 15'944.0 14'382.2 16'887.5 19'235.3 23'286.9 5'257.5 5'445.0
- 2.57x 2.52x 1.64x 1.30x 5.62x 4.02x 1.60x 1.26x - -
423.4 537.0 676.0 1'061.2 1'443.8 0.0 0.0 2'062.5 2'560.0 - -
- 28.82x 35.59x 19.42x 14.41x 0.00x 0.00x 16.08x 12.96x - -
221.2 312.8 409.7 684.9 1'005.6 922.7 1'241.7 1'335.0 1'596.7 273.0 296.0
- 47.59x 65.89x 33.71x 23.99x 26.91x 20.69x 27.43x 22.78x - -
EBITDA 1'443.80 Long-Term Rating Date -
EBIT 1'310.82 Long-Term Rating -
Operating Margin 8.22% Long-Term Outlook -
Pretax Margin 9.80% Short-Term Rating Date -
Return on Assets 13.52% Short-Term Rating -
Return on Common Equity 22.07%
Return on Capital - EBITDA/Interest Exp. 13.27
Asset Turnover 1.84% (EBITDA-Capex)/Interest Exp. 10.43
Net Debt/EBITDA -
Gross Margin 20.6% Total Debt/EBITDA -
EBITDA Margin -
EBIT Margin 9.4% Total Debt/Equity 0.6%
Net Income Margin 6.3% Total Debt/Capital 0.6%
Asset Turnover 1.84
Current Ratio 2.45 Net Fixed Asset Turnover 13.25
Quick Ratio 1.76 Accounts receivable turnover-days 21.61
Debt to Assets 0.39% Inventory Days 29.96
Tot Debt to Common Equity 0.63% Accounts Payable Turnover Day 33.54
Accounts Receivable Turnover 16.89 Cash Conversion Cycle 16.55
Inventory Turnover 12.18
Fiscal Year Ended
China International Travel Service Corp LtdPrice/Volume
Valuation Analysis
5'544'894.00
Current Price (9/dd/yy) Market Data
Net Income
P/E
Market Capitalization
Average Daily Trading Volume
Relative Stock Price Performance
Total Revenue
TEV/Revenue
EBITDA
TEV/EBITDA
Profitability S&P Issuer Ratings
Credit Ratios
Margin Analysis
Reference
Structure
,
2
-,
-2
.,
.2
0,
02
1,
o!-. l!-. k!-. a!-. g!-0 c!-0 j!-0 Q!-0 j!-0 g!-0 g!-0 Q!-0 o!-0', F
.', F
1', F
3', F
5', F
-,', F
-.', F
-1', F
0.0
2'000.0
4'000.0
6'000.0
8'000.0
10'000.0
12'000.0
14'000.0
16'000.0
18'000.0
2001 2002 2003 2004 2005 2006 2007 2008 2009 2010 2011 2012
,',,
-,',,
.,',,
0,',,
1,',,
2,',,
3,',,
4,',,
,-',-'.,-, ,-',4'.,-, ,-',-'.,-- ,-',4'.,-- ,-',-'.,-. ,-',4'.,-. ,-',-'.,-0 ,-',4'.,-0
FReTn/CTrThoT/PolhirTlAlcST/ !Rna /eis FReTn/CTrThoT/PolhirTlAlcST/ !Rna /eis
Q.M.S Advisors | tel: +41 (0)78 922 08 77 | e-mail: [email protected] |
Page 123
09.09.2013
Holder Name Portfolio Name Source Amt Held % Out Latest Chg File Dt Inst Type
CITS GROUP CORP n/a Co File 539'846'100 55.3 - 31.12.2012 Government
OVERSEAS CHINESE TOW n/a Co File 98'153'900 10.05 - 31.12.2012 Government
SOCIAL SECURITY FUND n/a Co File 26'782'145 2.74 - 31.12.2012 Government
CHINA CONSTRUCTION B n/a Co File 21'510'613 2.2 - 31.12.2012 Government
YINHUA FUND MANAGEME Multiple Portfolios MF-AGG 16'356'393 1.68 530'890 30.06.2013 Investment Advisor
FORTUNE SGAM FUND MA Multiple Portfolios MF-AGG 8'071'024 0.83 5'535'013 31.12.2012 Investment Advisor
FIDELITY LTD n/a Co File 5'780'910 0.59 - 31.12.2012 Investment Advisor
RONGTONG FUND MANAGE Multiple Portfolios MF-AGG 5'631'424 0.58 1'570'910 31.12.2012 Investment Advisor
BANK OF CHINA INVEST Multiple Portfolios MF-AGG 5'479'459 0.56 (1'759'433) 31.12.2012 Investment Advisor
E FUND MANAGEMENT Multiple Portfolios MF-AGG 5'432'664 0.56 1'878'157 31.12.2012 Investment Advisor
HUATAI-PINEBRIDGE FU Multiple Portfolios MF-AGG 4'511'109 0.46 (2'035'351) 31.12.2012 Investment Advisor
GF FUND MANAGEMENT C Multiple Portfolios MF-AGG 4'491'742 0.46 4'350'789 31.12.2012 Investment Advisor
CCB PRINCIPAL ASSET Multiple Portfolios MF-AGG 4'277'163 0.44 (215'401) 31.12.2012 Investment Advisor
CHINA ASSET MANAGEME Multiple Portfolios MF-AGG 3'806'851 0.39 (5'990'852) 31.12.2012 Investment Advisor
HUAAN FUND MANAGEMEN Multiple Portfolios MF-AGG 3'650'657 0.37 2'130'952 31.12.2012 Investment Advisor
HARVEST FUND MANAGEM Multiple Portfolios MF-AGG 3'198'211 0.33 (386'951) 31.12.2012 Investment Advisor
GUOTAI ASSET MANAGEM Multiple Portfolios MF-AGG 2'918'290 0.3 499'246 30.06.2013 Investment Advisor
ABC-CA FUND MANAGEME Multiple Portfolios MF-AGG 2'876'891 0.29 (5'534'740) 31.12.2012 Investment Advisor
FIRST-TRUST FUND MAN Multiple Portfolios MF-AGG 2'840'443 0.29 (1'559'500) 31.12.2012 Investment Advisor
FRANKLIN TEMPLETON S Multiple Portfolios MF-AGG 2'817'245 0.29 763'228 31.12.2012 Investment Advisor
Firm Name Analyst Recommendation Weighting Change Target Price Date Date
Capital Securities Corp ZHANG LU buy 5 M 43 Not Provided 03.09.2013
Northeast Securities Co Ltd LI LIANG buy 5 M #N/A N/A Not Provided 03.09.2013
Sinolink Securities Co Ltd MAO ZHENGRONG buy 5 M #N/A N/A Not Provided 02.09.2013
China International Capital Corp HAIYAN GUO buy 5 M #N/A N/A Not Provided 02.09.2013
Guotai Junan XU JUANJUAN buy 5 M 41 12 month 01.09.2013
SWS Research Co Ltd JENNIFER JIN outperform 5 M #N/A N/A Not Provided 19.07.2013
Guodu Securities Co Ltd YANG ZHIGANG buy 5 M 34 6 month 16.07.2013
Hong Yuan Securities SUN YAN buy 5 U 30 6 month 12.07.2013
Goldman Sachs LIAO XUFA buy/attractive 5 M 37 12 month 30.06.2013
Everbright Securities Co., Ltd LIN YUHONG accumulate 4 M 33 6 month 26.06.2013
Citic Securities Co., Ltd ZHAO XUEQIN buy 5 M 35 6 month 11.04.2013
Tebon Securities Co Ltd LI XIANGFENG buy 5 M 38 12 month 19.02.2013
Bank of China International TRACY FENG buy 5 M 28 Not Provided 04.01.2013
China Securities Co., Ltd SHEN ZHOUXIANG add 4 M 35 6 month 02.11.2012
UBS DENNIS WANG buy 5 M 37 12 month 31.10.2012
Central China Securities CHEN SHANSHAN add 4 M #N/A N/A Not Provided 25.10.2012
Founder Securities WANG LANGQI buy 5 M #N/A N/A Not Provided 19.09.2012
China Merchants Securities ZHU WEIHUA buy 5 M #N/A N/A Not Provided 12.07.2012
AJ Securities HOU JIALIN buy 5 M #N/A N/A Not Provided 06.07.2012
Industrial Securities LIU LUDAN strong buy 5 M #N/A N/A Not Provided 26.04.2012
China Investment Securities CHEN QINGQING strong buy 5 M #N/A N/A Not Provided 04.05.2011
Holdings By:
China International Travel Service Corp Ltd ee
Q.M.S Advisors | tel: +41 (0)78 922 08 77 | e-mail: [email protected] |
Page 124
09.09.2013
BesTV New Media Co Ltd manufactures and sells a variety of electronic products.
The Company's products include television sets, radios, CDand cassette players,
VCRs, and DVD players. The Company also develops Internet switches and security
software, produces LCDs (Liquid Crystal Display), and provides import and
export service.
Latest Fiscal Year: 12/2012
LTM as of: 06/yy
52-Week High (09.09.2013) 37.88
52-Week Low (04.12.2012) 13.00
Daily Volume
35.98
52-Week High % Change -5.02% Dividend Yield -
52-Week Low % Change 176.77% Beta 0.97
% 52 Week Price Range High/Low 94.91% Equity Float 506.16
Shares Out 30.06.2013 1'113.7 Short Int -
40'072.22 1 Yr Total Return 113.66%
Total Debt 1.26 YTD Return 126.72%
Preferred Stock 0.0 Adjusted BETA 0.967
Minority Interest 56.3 Analyst Recs 14
Cash and Equivalents 1'943.07 Consensus Rating 4.643
Enterprise Value 38'370.94
Average Volume 5 Day 12'915'650
600637 CH EQUITY YTD Change - Average Volume 30 Day 14'210'360
600637 CH EQUITY YTD % CHANGE - Average Volume 3 Month 16'854'170
LTM-4Q LTM FY+1 FY+2 FQ+1 FQ+2
31.12.2008 31.12.2009 31.12.2010 31.12.2011 31.12.2012 06/yy 06/yy 12/13 Y 12/14 Y 09/13 Q3 12/13 Q4
3'461.9 2'332.3 898.1 1'284.3 1'955.3 1'212.9 2'161.1 2'860.2 3'881.1 - -
1.00x 2.24x - 11.91x 8.08x 42.57x 36.30x - - - -
(696.1) 164.1 315.0 515.4 726.3 0.0 0.0 1'060.0 1'401.0 - -
- 31.85x - 29.69x 21.74x 0.00x 0.00x 36.20x 27.39x - -
(984.1) 35.4 257.8 355.1 516.5 664.2 580.9 719.3 976.9 - -
- 136.60x - 23.89x 34.50x 17.92x 53.85x 55.52x 40.93x - -
EBITDA 726.26 Long-Term Rating Date -
EBIT 497.07 Long-Term Rating -
Operating Margin 25.42% Long-Term Outlook -
Pretax Margin 29.83% Short-Term Rating Date -
Return on Assets 14.95% Short-Term Rating -
Return on Common Equity 18.59%
Return on Capital - EBITDA/Interest Exp. 2056.67
Asset Turnover 0.56% (EBITDA-Capex)/Interest Exp. 1099.87
Net Debt/EBITDA -
Gross Margin 41.8% Total Debt/EBITDA -
EBITDA Margin -
EBIT Margin 27.4% Total Debt/Equity 0.0%
Net Income Margin 26.4% Total Debt/Capital 0.0%
Asset Turnover 0.56
Current Ratio 3.27 Net Fixed Asset Turnover 7.29
Quick Ratio 3.00 Accounts receivable turnover-days 76.02
Debt to Assets 0.03% Inventory Days 39.31
Tot Debt to Common Equity 0.04% Accounts Payable Turnover Day 107.99
Accounts Receivable Turnover 4.80 Cash Conversion Cycle -16.95
Inventory Turnover 9.29
Fiscal Year Ended
BesTV New Media Co LtdPrice/Volume
Valuation Analysis
20'058'057.00
Current Price (9/dd/yy) Market Data
Net Income
P/E
Market Capitalization
Average Daily Trading Volume
Relative Stock Price Performance
Total Revenue
TEV/Revenue
EBITDA
TEV/EBITDA
Profitability S&P Issuer Ratings
Credit Ratios
Margin Analysis
Reference
Structure
,
2
-,
-2
.,
.2
0,
02
1,
o!-. l!-. k!-. a!-. g!-0 c!-0 j!-0 Q!-0 j!-0 g!-0 g!-0 Q!-0 o!-0', F
2', F
-,', F
-2', F
.,', F
.2', F
0,', F
02', F
1,', F
0.0
500.0
1'000.0
1'500.0
2'000.0
2'500.0
3'000.0
3'500.0
4'000.0
4'500.0
5'000.0
2001 2002 2003 2004 2005 2006 2007 2008 2009 2010 2011 2012
,',,
.,',,
1,',,
3,',,
5,',,
-,,',,
-.,',,
-1,',,
-3,',,
,-',-'.,-, ,-',4'.,-, ,-',-'.,-- ,-',4'.,-- ,-',-'.,-. ,-',4'.,-. ,-',-'.,-0 ,-',4'.,-0
FReTn/CTrThoT/PolhirTlAlcST/ !Rna /eis FReTn/CTrThoT/PolhirTlAlcST/ !Rna /eis
Q.M.S Advisors | tel: +41 (0)78 922 08 77 | e-mail: [email protected] |
Page 125
09.09.2013
Holder Name Portfolio Name Source Amt Held % Out Latest Chg File Dt Inst Type
SHANGHAI MEDIA GROUP n/a Co File 466'885'075 41.92 - 31.12.2012 Government
TSINGHUA TONGFANG CO n/a EXCH 53'333'339 4.79 (10'000'000) 09.01.2013 Corporation
SHANGHAI YIDIAN HLDG n/a Co File 40'000'000 3.59 - 31.12.2012 Government
SH CHENGBEI INVEST C n/a Co File 29'842'081 2.68 - 31.12.2012 Investment Advisor
INVESCO GREAT WALL F Multiple Portfolios MF-AGG 28'341'027 2.54 14'322'605 30.06.2013 Investment Advisor
TAIKANG LIFE INSURAN n/a Co File 22'242'879 2 - 31.12.2012 Insurance Company
SHANGHAI LIANHE INVE n/a Co File 17'514'081 1.57 - 31.12.2012 Government
BJ HENGSHENG JIAYE I n/a Co File 17'101'014 1.54 - 31.12.2012 Other
GUOTAI JUNAN SECURIT n/a Co File 16'633'000 1.49 - 31.12.2012 Investment Advisor
CHENGDU YUANHONG INN n/a Co File 14'184'325 1.27 - 31.12.2012 Venture Capital
HUAAN FUND MANAGEMEN Multiple Portfolios MF-AGG 13'896'315 1.25 13'667'878 31.12.2012 Investment Advisor
UBS SDIC FUND MANAGE Multiple Portfolios MF-AGG 9'786'033 0.88 (1'294'053) 31.12.2012 Investment Advisor
MORGAN STANLEY HUAXI Multiple Portfolios MF-AGG 8'786'868 0.79 3'987'043 30.06.2013 Investment Advisor
BANK OF CHINA INVEST Multiple Portfolios MF-AGG 5'458'742 0.49 92'285 31.12.2012 Investment Advisor
CHINA UNIVERSAL ASSE Multiple Portfolios MF-AGG 5'398'215 0.48 1'572'214 02.09.2013 Investment Advisor
CHANGSHENG FUND MANA Multiple Portfolios MF-AGG 4'786'690 0.43 3'134'882 31.12.2012 Investment Advisor
CCB PRINCIPAL ASSET Multiple Portfolios MF-AGG 4'500'278 0.4 4'500'278 31.12.2012 Investment Advisor
HARVEST FUND MANAGEM Multiple Portfolios MF-AGG 4'422'792 0.4 12'820 31.12.2012 Investment Advisor
ABN AMRO TEDA FUND M Multiple Portfolios MF-AGG 4'000'000 0.36 4'000'000 31.12.2012 Investment Advisor
FORTUNE SGAM FUND MA Multiple Portfolios MF-AGG 3'149'797 0.28 (1'450'134) 31.12.2012 Investment Advisor
Firm Name Analyst Recommendation Weighting Change Target Price Date Date
Chang Jiang Securities Co. Limited ZHIJIAN CHEN buy 5 M #N/A N/A Not Provided 02.09.2013
Tebon Securities Co Ltd LI XIANGFENG outperform 5 M 20 6 month 16.08.2013
Capital Securities Corp HU JIAMING buy 5 M 37 Not Provided 15.08.2013
Sinolink Securities Co Ltd ZHANG YAN buy 5 M 30 Not Provided 15.08.2013
Guotai Junan GAO HUI buy 5 M 40 12 month 15.08.2013
Everbright Securities Co., Ltd ZHANG LIANGWEI buy 5 M 40 6 month 15.08.2013
Goldman Sachs LIAO XUFA neutral/neutral 3 M 30 12 month 14.08.2013
SWS Research Co Ltd ZHANG HENG buy 5 M #N/A N/A Not Provided 16.07.2013
China Minzu Securities Co Ltd XUEFEI LUAN buy 5 U #N/A N/A Not Provided 12.07.2013
Hong Yuan Securities ZHANG ZEJING add 4 M #N/A N/A Not Provided 08.07.2013
Qilu Securities Co Ltd LIU JIANGXIAO buy 5 M #N/A N/A Not Provided 30.06.2013
EVA Dimensions CRAIG STERLING hold 3 D #N/A N/A Not Provided 07.05.2013
Great Wall Securities JIN WEI strong buy 5 M #N/A N/A Not Provided 10.10.2012
Rising Securities Co.,LTD ZHAO YUE outperform 5 D #N/A N/A Not Provided 07.09.2012
Citic Securities Co., Ltd HU YALI buy 5 M #N/A N/A Not Provided 21.03.2012
HuaChuang Securities GAO LI buy 5 M #N/A N/A Not Provided 20.06.2011
Holdings By:
BesTV New Media Co Ltd ee
Q.M.S Advisors | tel: +41 (0)78 922 08 77 | e-mail: [email protected] |
Page 126
09.09.2013
Shanghai Jahwa United Co., Ltd. develops, manufactures and wholesales skin care
and hair care products, cosmetics, perfumes, detergents, and other household
chemical products. The Company also provides technical and food services.
Latest Fiscal Year: 12/2012
LTM as of: 06/yy
52-Week High (28.08.2013) 57.76
52-Week Low (28.11.2012) 29.40
Daily Volume
54.07
52-Week High % Change -6.39% Dividend Yield -
52-Week Low % Change 83.91% Beta 0.59
% 52 Week Price Range High/Low 89.21% Equity Float 439.74
Shares Out 24.07.2013 672.4 Short Int -
36'359.00 1 Yr Total Return 75.13%
Total Debt 0.00 YTD Return 60.74%
Preferred Stock 0.0 Adjusted BETA 0.590
Minority Interest 21.4 Analyst Recs 14
Cash and Equivalents 1'328.50 Consensus Rating 4.571
Enterprise Value 35'029.04
Average Volume 5 Day 2'159'072
600315 CH EQUITY YTD Change - Average Volume 30 Day 3'674'819
600315 CH EQUITY YTD % CHANGE - Average Volume 3 Month 4'915'850
LTM-4Q LTM FY+1 FY+2 FQ+1 FQ+2
31.12.2008 31.12.2009 31.12.2010 31.12.2011 31.12.2012 06/yy 06/yy 12/13 Y 12/14 Y 09/13 Q3 12/13 Q4
2'467.4 2'673.0 3'069.1 3'539.3 4'461.4 3'954.5 4'867.4 5'594.3 6'967.8 1'445.0 1'400.0
2.33x 3.77x 4.88x 3.84x 4.83x 13.65x 20.48x 6.23x 4.94x 25.18x 25.98x
298.9 402.5 328.0 455.3 627.4 0.0 0.0 943.3 1'367.3 - -
19.26x 25.02x 45.65x 29.83x 34.35x 0.00x 0.00x 37.13x 25.62x - -
185.0 233.3 275.6 361.3 614.6 514.4 744.1 863.7 1'197.7 149.0 178.0
32.59x 45.69x 57.12x 40.11x 36.16x 32.66x 40.64x 42.01x 31.49x - -
EBITDA 627.44 Long-Term Rating Date -
EBIT 524.06 Long-Term Rating -
Operating Margin 11.75% Long-Term Outlook -
Pretax Margin 16.21% Short-Term Rating Date -
Return on Assets 19.17% Short-Term Rating -
Return on Common Equity 26.78%
Return on Capital - EBITDA/Interest Exp. 993.09
Asset Turnover 1.25% (EBITDA-Capex)/Interest Exp. 780.18
Net Debt/EBITDA -
Gross Margin 54.4% Total Debt/EBITDA -
EBITDA Margin -
EBIT Margin 14.3% Total Debt/Equity 0.0%
Net Income Margin 13.8% Total Debt/Capital 0.0%
Asset Turnover 1.25
Current Ratio 2.43 Net Fixed Asset Turnover 13.61
Quick Ratio 1.95 Accounts receivable turnover-days 45.37
Debt to Assets 0.00% Inventory Days 69.58
Tot Debt to Common Equity 0.00% Accounts Payable Turnover Day 87.58
Accounts Receivable Turnover 8.05 Cash Conversion Cycle 30.94
Inventory Turnover 5.25
Profitability S&P Issuer Ratings
Credit Ratios
Margin Analysis
Reference
Structure
Net Income
P/E
Market Capitalization
Average Daily Trading Volume
Relative Stock Price Performance
Total Revenue
TEV/Revenue
EBITDA
TEV/EBITDA
Fiscal Year Ended
Shanghai Jahwa United Co LtdPrice/Volume
Valuation Analysis
2'886'941.00
Current Price (9/dd/yy) Market Data
,
-,
.,
0,
1,
2,
3,
4,
o!-. l!-. k!-. a!-. g!-0 c!-0 j!-0 Q!-0 j!-0 g!-0 g!-0 Q!-0 o!-0', F2', F-,', F-2', F.,', F.2', F0,', F02', F1,', F12', F2,', F
0.0
500.0
1'000.0
1'500.0
2'000.0
2'500.0
3'000.0
3'500.0
4'000.0
4'500.0
5'000.0
2001 2002 2003 2004 2005 2006 2007 2008 2009 2010 2011 2012
,',,
2',,
-,',,
-2',,
.,',,
.2',,
0,',,
02',,
1,',,
12',,
,-',-'.,-, ,-',4'.,-, ,-',-'.,-- ,-',4'.,-- ,-',-'.,-. ,-',4'.,-. ,-',-'.,-0 ,-',4'.,-0
FReTn/CTrThoT/PolhirTlAlcST/ !Rna /eis FReTn/CTrThoT/PolhirTlAlcST/ !Rna /eis
Q.M.S Advisors | tel: +41 (0)78 922 08 77 | e-mail: [email protected] |
Page 127
09.09.2013
Holder Name Portfolio Name Source Amt Held % Out Latest Chg File Dt Inst Type
SHANGHAI JAHWA UNITE n/a Co File 180'090'282 26.78 - 31.12.2012 n/a
CHINA UNIVERSAL ASSE Multiple Portfolios MF-AGG 92'693'158 13.78 66'714'255 02.09.2013 Investment Advisor
HARVEST FUND MANAGEM Multiple Portfolios MF-AGG 42'690'109 6.35 (4'727'222) 30.06.2013 Investment Advisor
HUASHANG FUND MANAGE Multiple Portfolios MF-AGG 37'644'057 5.6 (4'460'759) 30.06.2013 Investment Advisor
E FUND MANAGEMENT Multiple Portfolios MF-AGG 33'513'368 4.98 6'586'418 31.12.2012 Investment Advisor
SHANGHAI JIUSHI CORP n/a Co File 31'092'856 4.62 - 31.12.2012 Holding Company
BANK OF CHINA INVEST Multiple Portfolios MF-AGG 18'149'921 2.7 (1'870'489) 30.06.2013 Investment Advisor
SH CITY CONSTR INVES n/a Co File 15'546'427 2.31 - 31.12.2012 Corporation
BOSHI FUND MANAGEMEN Multiple Portfolios MF-AGG 12'033'230 1.79 10'008'856 30.06.2013 Investment Advisor
GUOTAI ASSET MANAGEM Multiple Portfolios MF-AGG 9'948'539 1.48 (3'116'056) 30.06.2013 Investment Advisor
GALAXY ASSET MANAGEM Multiple Portfolios MF-AGG 9'634'357 1.43 (762'519) 31.12.2012 Investment Advisor
AEGON INDUSTRIAL FUN Multiple Portfolios MF-AGG 9'307'599 1.38 4'016'202 31.12.2012 Investment Advisor
UBS SDIC FUND MANAGE Multiple Portfolios MF-AGG 5'979'286 0.89 697'830 31.12.2012 Investment Advisor
FIRST-TRUST FUND MAN Multiple Portfolios MF-AGG 5'950'770 0.88 (533'175) 30.06.2013 Investment Advisor
CHINA SOUTHERN FUND Multiple Portfolios MF-AGG 5'672'981 0.84 (7'682'690) 31.12.2012 Investment Advisor
CHINA POST & CAPITAL Multiple Portfolios MF-AGG 5'292'021 0.79 3'769'065 31.12.2012 Investment Advisor
FULLGOAL FUND MANAGE Multiple Portfolios MF-AGG 4'550'949 0.68 (331'864) 31.12.2012 Investment Advisor
SOOCHOW ASSET MANAGE Multiple Portfolios MF-AGG 4'483'955 0.67 (2'558'190) 31.12.2012 Investment Advisor
RONGTONG FUND MANAGE Multiple Portfolios MF-AGG 4'399'115 0.65 3'349'015 30.06.2013 Investment Advisor
MANULIFE TEDA FUND M Multiple Portfolios MF-AGG 4'061'370 0.6 985'286 30.06.2013 Investment Advisor
Firm Name Analyst Recommendation Weighting Change Target Price Date Date
UBS YUNYUN HU buy 5 M 64 12 month 28.08.2013
GF Securities Co. Ltd. Zi Meng buy 5 M 63 12 month 28.08.2013
China International Capital Corp GAO ZHENG buy 5 M #N/A N/A Not Provided 28.08.2013
Fortune CLSA Securities Limited KATHARINE SONG underperform 1 M 59 12 month 28.08.2013
Qilu Securities Co Ltd XIE GANG buy 5 M #N/A N/A Not Provided 08.08.2013
Hong Yuan Securities CHEN XU buy 5 M 82 6 month 22.07.2013
SWS Research Co Ltd MAGGIE WANG buy 5 M #N/A N/A Not Provided 19.07.2013
EVA Dimensions TIMOTHY STANISH overweight 5 M #N/A N/A Not Provided 06.06.2013
Citic Securities Co., Ltd ZHAO XUEQIN buy 5 M 52 6 month 03.05.2013
Sinolink Securities Co Ltd WANG XIAOYING add 4 M #N/A N/A Not Provided 02.05.2013
Everbright Securities Co., Ltd WANG XIXIN buy 5 M 54 12 month 26.04.2013
Bank of China International SU WENJIE buy 5 M 40 12 month 28.01.2013
Rising Securities Co.,LTD ZHAO YUE outperform 5 N #N/A N/A Not Provided 18.12.2012
China Minzu Securities Co Ltd YU WALI add 4 N #N/A N/A Not Provided 30.11.2012
Founder Securities ZHENGHUA ZHANG add 4 M 25 6 month 15.08.2012
China Merchants Securities LI SHANSHAN buy 5 M #N/A N/A Not Provided 10.07.2012
Tebon Securities Co Ltd LI XIANGFENG outperform 5 M #N/A N/A Not Provided 25.06.2012
China Galaxy Securities XIYAN PENG buy 5 M 17 12 month 03.08.2009
China Securities Co., Ltd JING LI add 4 N 13 Not Provided 31.05.2009
China Investment Securities HOU HONGSEN buy 5 M #N/A N/A Not Provided 19.05.2009
Holdings By:
Shanghai Jahwa United Co Ltd ee
Q.M.S Advisors | tel: +41 (0)78 922 08 77 | e-mail: [email protected] |
Page 128
09.09.2013
Guangzhou Automobile Group Company, Ltd. manufactures, sells, and services
automobiles. The Company is also involved in automobile parts and components,
and auto finance and related services for both overseas and domestic markets.
Latest Fiscal Year: 12/2008
LTM as of: 06/yy
52-Week High (30.05.2013) 10.20
52-Week Low (15.11.2012) 4.87
Daily Volume
9.09
52-Week High % Change -10.88% Dividend Yield 0.99
52-Week Low % Change 86.65% Beta -
% 52 Week Price Range High/Low 74.30% Equity Float 204.46
Shares Out 31.03.2013 4'221.7 Short Int -
53'993.28 1 Yr Total Return 51.63%
Total Debt 11'401.71 YTD Return 49.12%
Preferred Stock 0.0 Adjusted BETA -
Minority Interest 921.8 Analyst Recs 10
Cash and Equivalents 14'905.92 Consensus Rating 4.400
Enterprise Value 49'289.58
Average Volume 5 Day 10'789'480
601238 CH EQUITY YTD Change - Average Volume 30 Day 10'115'000
601238 CH EQUITY YTD % CHANGE - Average Volume 3 Month 10'861'010
LTM-4Q LTM FY+1 FY+2 FQ+1 FQ+2
31.12.2008 31.12.2009 31.12.2010 31.12.2011 31.12.2012 06/yy 06/yy 12/13 Y 12/14 Y 09/13 Q3 12/13 Q4
43'769.7 50'253.6 8'742.3 10'814.3 12'963.9 7'418.9 15'176.2 17'124.5 19'715.9 - -
- - 5.77x 2.61x 2.73x 5.02x 7.85x 2.77x 2.25x - -
3'793.7 4'346.2 99.6 (895.2) (808.2) 0.0 0.0 810.3 1'519.7 - -
- - 506.49x - - 0.00x 0.00x 60.83x 32.43x - -
1'566.8 2'031.8 4'295.1 4'271.6 1'134.0 2'830.5 870.5 2'266.0 3'830.6 654.0 662.0
- - 9.89x 7.62x 30.70x 0.00x 42.81x 23.73x 14.20x - -
EBITDA -808.21 Long-Term Rating Date -
EBIT -1'475.82 Long-Term Rating -
Operating Margin -11.38% Long-Term Outlook -
Pretax Margin 7.71% Short-Term Rating Date -
Return on Assets 2.41% Short-Term Rating -
Return on Common Equity 3.76%
Return on Capital - EBITDA/Interest Exp. -1.44
Asset Turnover 0.28% (EBITDA-Capex)/Interest Exp. -6.70
Net Debt/EBITDA -
Gross Margin 5.3% Total Debt/EBITDA -14.11
EBITDA Margin -6.2%
EBIT Margin -11.4% Total Debt/Equity 36.6%
Net Income Margin 8.7% Total Debt/Capital 26.2%
Asset Turnover 0.28
Current Ratio 2.25 Net Fixed Asset Turnover 2.13
Quick Ratio 1.77 Accounts receivable turnover-days 27.13
Debt to Assets 23.06% Inventory Days 43.75
Tot Debt to Common Equity 36.61% Accounts Payable Turnover Day 70.39
Accounts Receivable Turnover 13.49 Cash Conversion Cycle 0.48
Inventory Turnover 8.37
Profitability S&P Issuer Ratings
Credit Ratios
Margin Analysis
Reference
Structure
Net Income
P/E
Market Capitalization
Average Daily Trading Volume
Relative Stock Price Performance
Total Revenue
TEV/Revenue
EBITDA
TEV/EBITDA
Fiscal Year Ended
Guangzhou Automobile Group Co LtdPrice/Volume
Valuation Analysis
13'927'195.00
Current Price (9/dd/yy) Market Data
,
.
1
3
5
-,
-.
o!-. l!-. k!-. a!-. g!-0 c!-0 j!-0 Q!-0 j!-0 g!-0 g!-0 Q!-0 o!-0', F2', F-,', F-2', F.,', F.2', F0,', F02', F1,', F12', F
0.0
10'000.0
20'000.0
30'000.0
40'000.0
50'000.0
60'000.0
2001 2002 2003 2004 2005 2006 2007 2008 2009 2010 2011 2012
,',,
.',,
1',,
3',,
5',,
-,',,
-.',,
-1',,
-3',,
,-',-'.,-, ,-',4'.,-, ,-',-'.,-- ,-',4'.,-- ,-',-'.,-. ,-',4'.,-. ,-',-'.,-0 ,-',4'.,-0
FReTn/CTrThoT/PolhirTlAlcST/ !Rna /eis FReTn/CTrThoT/PolhirTlAlcST/ !Rna /eis
Q.M.S Advisors | tel: +41 (0)78 922 08 77 | e-mail: [email protected] |
Page 129
09.09.2013
Holder Name Portfolio Name Source Amt Held % Out Latest Chg File Dt Inst Type
GZ AUTOMOBILE INDUST n/a EXCH 3'679'503'529 87.16 62'100'000 29.03.2012 Corporation
WANXIANG GROUP CO n/a EXCH 156'996'823 3.72 - 28.03.2012 Corporation
CHINA NATIONAL MACHI n/a EXCH 145'227'963 3.44 - 28.03.2012 Government
CHINA AMC RENAISSANC n/a EXCH 21'226'890 0.5 - 28.03.2012 n/a
SOCIAL SECURITY FUND n/a EXCH 11'200'000 0.27 - 28.03.2012 Government
GUANGZHOU IRON & STE n/a EXCH 7'869'515 0.19 - 28.03.2012 Corporation
CHIMELONG GROUP CO L n/a EXCH 7'259'627 0.17 - 28.03.2012 Corporation
SHU YIMIN n/a EXCH 5'589'286 0.13 - 28.03.2012 n/a
CHINA ASSET MANAGEME Multiple Portfolios MF-AGG 4'240'697 0.1 (17'180'926) 31.12.2012 Investment Advisor
ZHONGRONG STRENGTHEN n/a EXCH 4'187'829 0.1 - 28.03.2012 n/a
ZHU XIAOMEI n/a EXCH 3'610'402 0.09 - 28.03.2012 n/a
CHINA SOUTHERN FUND Multiple Portfolios MF-AGG 1'987'501 0.05 1'137'201 31.12.2012 Investment Advisor
FRANKLIN TEMPLETON S Multiple Portfolios MF-AGG 1'833'875 0.04 1'833'875 31.12.2012 Investment Advisor
ORIENT FUND MANAGEME Multiple Portfolios MF-AGG 1'768'883 0.04 1'768'883 31.12.2012 Investment Advisor
HARVEST FUND MANAGEM Multiple Portfolios MF-AGG 1'688'609 0.04 4'900 31.12.2012 Investment Advisor
CHINA ASSET MANAGEME Multiple Portfolios MF-AGG 1'626'037 0.04 - 02.09.2013 Investment Advisor
CHINA UNIVERSAL ASSE Multiple Portfolios MF-AGG 1'272'149 0.03 1'129'610 02.09.2013 Investment Advisor
E FUND MANAGEMENT Multiple Portfolios MF-AGG 1'222'388 0.03 1'222'388 31.12.2012 Investment Advisor
FULLGOAL FUND MANAGE Multiple Portfolios MF-AGG 1'053'800 0.02 (10'075'315) 31.12.2012 Investment Advisor
HUATAI-PINEBRIDGE FU Multiple Portfolios MF-AGG 941'800 0.02 7'800 31.12.2012 Investment Advisor
Firm Name Analyst Recommendation Weighting Change Target Price Date Date
Chang Jiang Securities Co. Limited LIU YUANRUI buy 5 M #N/A N/A Not Provided 31.08.2013
Bank of China International ERIC HU buy 5 U 10 Not Provided 30.08.2013
Everbright Securities Co., Ltd WEI FENG accumulate 4 M 9 3 month 30.08.2013
China Investment Securities LEI ZHANG strong buy 5 M 10 12 month 30.08.2013
Qilu Securities Co Ltd BAI YU buy 5 M #N/A N/A Not Provided 06.08.2013
China Minzu Securities Co Ltd CAO HE add 4 M 10 6 month 28.06.2013
UBS TIANLONG ZOU neutral 3 U 8 12 month 24.05.2013
Hong Yuan Securities PANG LINLIN buy 5 M 10 12 month 22.01.2013
PingAn Securities YU BING neutral 3 M #N/A N/A Not Provided 21.12.2012
HuaChuang Securities WANG YANXUE buy 5 M #N/A N/A Not Provided 16.12.2012
Holdings By:
Guangzhou Automobile Group Co Ltd ee
Q.M.S Advisors | tel: +41 (0)78 922 08 77 | e-mail: [email protected] |
Page 130
09.09.2013
Founder Securities Company Limited's major business includes securities
brokerage, securities investment consulting, securities trading, financial
advisory on securities investment and trading activities, proprietary trading,
securities asset management, investment fund distribution, margin business, and
provide intermediate agency services for Founder Futures Limited.
Latest Fiscal Year: 12/2012
LTM as of: 06/yy
52-Week High (25.03.2013) 8.25
52-Week Low (04.12.2012) 3.60
Daily Volume
5.91
52-Week High % Change -28.36% Dividend Yield 0.63
52-Week Low % Change 64.17% Beta 1.62
% 52 Week Price Range High/Low 49.68% Equity Float 2'230.37
Shares Out 19.08.2013 6'100.0 Short Int -
36'051.00 1 Yr Total Return 33.91%
Total Debt 779.27 YTD Return 34.82%
Preferred Stock 0.0 Adjusted BETA 1.624
Minority Interest 385.6 Analyst Recs 8
Cash and Equivalents 12'179.54 Consensus Rating 4.250
Enterprise Value 26'578.52
Average Volume 5 Day 0
601901 CH EQUITY YTD Change - Average Volume 30 Day 73'524'920
601901 CH EQUITY YTD % CHANGE - Average Volume 3 Month #########
LTM-4Q LTM FY+1 FY+2 FQ+1 FQ+2
31.12.2008 31.12.2009 31.12.2010 31.12.2011 31.12.2012 06/yy 06/yy 12/13 Y 12/14 Y 09/13 Q3 12/13 Q4
2'152.5 3'312.7 3'088.0 1'776.8 2'614.1 1'610.5 2'850.3 3'878.5 4'443.8 - -
- - - 5.03x 6.08x 30.80x 22.51x - - - -
- - - 523.6 1'108.0 359.9 0.0 - - - -
- - - 17.06x 14.34x 0.00x 0.00x - - - -
859.1 1'385.4 1'248.1 256.9 562.2 343.5 627.9 1'061.0 1'419.3 - -
- - - 82.74x 47.83x 0.00x 56.10x 30.00x 23.83x - -
EBITDA 1'107.99 Long-Term Rating Date -
EBIT - Long-Term Rating -
Operating Margin 35.57% Long-Term Outlook -
Pretax Margin 25.49% Short-Term Rating Date -
Return on Assets 2.08% Short-Term Rating -
Return on Common Equity 3.93%
Return on Capital 3.71% EBITDA/Interest Exp. -
Asset Turnover 0.10% (EBITDA-Capex)/Interest Exp. -
Net Debt/EBITDA -10.29
Gross Margin - Total Debt/EBITDA 0.70
EBITDA Margin 42.4%
EBIT Margin - Total Debt/Equity 5.4%
Net Income Margin 21.5% Total Debt/Capital 5.0%
Asset Turnover 0.10
Current Ratio - Net Fixed Asset Turnover 6.31
Quick Ratio - Accounts receivable turnover-days -
Debt to Assets 2.78% Inventory Days -
Tot Debt to Common Equity 5.40% Accounts Payable Turnover Day -
Accounts Receivable Turnover - Cash Conversion Cycle -
Inventory Turnover -
Fiscal Year Ended
Founder Securities Co LtdPrice/Volume
Valuation Analysis
66'637'195.00
Current Price (9/dd/yy) Market Data
Net Income
P/E
Market Capitalization
Average Daily Trading Volume
Relative Stock Price Performance
Total Revenue
TEV/Revenue
EBITDA
TEV/EBITDA
Profitability S&P Issuer Ratings
Credit Ratios
Margin Analysis
Reference
Structure
,-.0123456
o!-. l!-. k!-. a!-. g!-0 c!-0 j!-0 Q!-0 j!-0 g!-0 g!-0 Q!-0', F
2,', F
-,,', F
-2,', F
.,,', F
.2,', F
0,,', F
02,', F
1,,', F
0.0
500.0
1'000.0
1'500.0
2'000.0
2'500.0
3'000.0
3'500.0
2001 2002 2003 2004 2005 2006 2007 2008 2009 2010 2011 2012,',,
,'.,
,'1,
,'3,
,'5,
-',,
-'.,
FReTn/CTrThoT/PolhirTlAlcST/ !Rna /eis FReTn/CTrThoT/PolhirTlAlcST/ !Rna /eis
Q.M.S Advisors | tel: +41 (0)78 922 08 77 | e-mail: [email protected] |
Page 131
09.09.2013
Holder Name Portfolio Name Source Amt Held % Out Latest Chg File Dt Inst Type
PEKING UNIVERSITY FO n/a Research 2'514'420'000 41.22 2'167'768 17.04.2013 Corporation
LIDE TECH DEVELOP CO n/a EXCH 301'791'148 4.95 (28'174'261) 18.04.2013 Corporation
HAERBIN HATOU INVEST n/a Co File 296'234'942 4.86 - 31.12.2012 Other
JIAXIN INVEST CO n/a Co File 139'066'991 2.28 - 31.12.2012 Corporation
BJ WANHUA INVEST CON n/a Co File 139'066'991 2.28 - 31.12.2012 Investment Advisor
SOCIAL SECURITY FUND n/a Co File 97'307'846 1.6 - 31.12.2012 Government
SH YUANRONG LEASE GU n/a Co File 83'440'195 1.37 - 31.12.2012 Other
LI BAOQING n/a Co File 82'806'991 1.36 - 31.12.2012 n/a
ZHENGZHOU COAL INDUS n/a Co File 79'963'520 1.31 - 31.12.2012 Holding Company
CS XIANDAO INVEST HL n/a Co File 79'274'451 1.3 - 31.12.2012 Government
ZHEJIANG SILK HOLDIN n/a EXCH 74'957'108 1.23 - 09.08.2011 Corporation
ZJ ECON CONSTRUCT GR n/a EXCH 74'888'965 1.23 - 09.08.2011 Government
ZJ XINGFA CHEM FIBER n/a EXCH 73'177'051 1.2 - 09.08.2011 Corporation
SH RONGDA TRAD DEVEL n/a EXCH 54'613'810 0.9 - 09.08.2011 Corporation
WZ LIANCHUANG HLD CO n/a EXCH 54'236'127 0.89 - 09.08.2011 Holding Company
HN HEXIN NEW BUILD M n/a EXCH 48'770'794 0.8 - 09.08.2011 Corporation
CHINA ASSET MANAGEME Multiple Portfolios MF-AGG 36'207'782 0.59 12'420'953 31.12.2012 Investment Advisor
GUANGDONG YUECAI INV n/a EXCH 33'017'809 0.54 - 09.08.2011 Corporation
GF FUND MANAGEMENT C Multiple Portfolios MF-AGG 31'806'219 0.52 (15'490'456) 31.12.2012 Investment Advisor
CHINA AEROSPACE SCIE n/a ULT-AGG 27'320'618 0.45 - 09.08.2011 Government
Firm Name Analyst Recommendation Weighting Change Target Price Date Date
Northeast Securities Co Ltd XINAN ZHAO add 4 M #N/A N/A Not Provided 02.09.2013
Chang Jiang Securities Co. Limited LIU JUN neutral 3 M #N/A N/A Not Provided 02.09.2013
Everbright Securities Co., Ltd ZIPEI TANG accumulate 4 M 7 12 month 06.08.2013
China Minzu Securities Co Ltd SONG JIAN add 4 M 7 6 month 23.07.2013
Hong Yuan Securities ZHANG JIXIU add 4 M #N/A N/A Not Provided 21.07.2013
Guotai Junan ZHAO XIANGHUAI add 4 M 8 12 month 07.07.2013
Guodu Securities Co Ltd DENG TING buy 5 M #N/A N/A Not Provided 21.06.2013
Sinolink Securities Co Ltd JIANGANG CHEN buy 5 U 6 Not Provided 02.05.2013
Industrial Securities ZHANG YING buy 5 M #N/A N/A Not Provided 31.10.2011
Holdings By:
Founder Securities Co Ltd ee
Q.M.S Advisors | tel: +41 (0)78 922 08 77 | e-mail: [email protected] |
Page 132
09.09.2013
Shanghai Electric Group Company Limited, through its subsidiaries, designs,
manufactures, sells, and services a wide range of products and services in the
power equipment, electromechanical equipment, transportation equipment and
environmental system industries.
Latest Fiscal Year: 12/2011
LTM as of: 06/yy
52-Week High (25.10.2012) 4.66
52-Week Low (25.06.2013) 3.13
Daily Volume
3.72
52-Week High % Change -20.17% Dividend Yield -
52-Week Low % Change 18.85% Beta 1.01
% 52 Week Price Range High/Low 35.95% Equity Float 1'668.05
Shares Out 31.03.2013 9'850.7 Short Int -
43'191.46 1 Yr Total Return -10.14%
Total Debt 7'904.69 YTD Return -6.82%
Preferred Stock 0.0 Adjusted BETA 1.006
Minority Interest 10'175.7 Analyst Recs 5
Cash and Equivalents 25'247.25 Consensus Rating 3.600
Enterprise Value 34'827.28
Average Volume 5 Day 17'290'520
601727 CH EQUITY YTD Change - Average Volume 30 Day 8'658'607
601727 CH EQUITY YTD % CHANGE - Average Volume 3 Month 6'351'115
LTM-4Q LTM FY+1 FY+2 FQ+1 FQ+2
31.12.2008 31.12.2009 31.12.2010 31.12.2011 31.12.2012 06/yy 06/yy 12/13 Y 12/14 Y 09/13 Q3 12/13 Q4
59'057.9 57'622.4 62'957.5 71'461.3 76'591.0 76'329.0 78'937.5 79'427.7 80'375.3 - -
0.98x 1.65x 1.33x 0.69x 0.53x 1.57x 1.29x - - - -
3'967.7 3'516.9 4'107.2 5'481.1 6'391.1 0.0 0.0 5'428.0 6'209.0 - -
14.61x 27.10x 20.39x 8.97x 6.39x 0.00x 0.00x 6.42x 5.61x - -
2'566.2 2'453.4 2'783.6 3'183.1 2'714.9 3'462.7 2'253.1 2'850.5 3'170.8 - -
12.87x 16.11x 19.86x 11.73x 12.58x 9.50x 11.71x 16.68x 14.88x - -
EBITDA 6'391.09 Long-Term Rating Date -
EBIT 4'883.72 Long-Term Rating -
Operating Margin 6.38% Long-Term Outlook -
Pretax Margin 7.48% Short-Term Rating Date -
Return on Assets 1.92% Short-Term Rating -
Return on Common Equity 7.32%
Return on Capital 8.52% EBITDA/Interest Exp. 32.69
Asset Turnover 0.67% (EBITDA-Capex)/Interest Exp. 22.06
Net Debt/EBITDA -2.96
Gross Margin 18.3% Total Debt/EBITDA 1.55
EBITDA Margin 7.6%
EBIT Margin 5.6% Total Debt/Equity 25.9%
Net Income Margin 3.5% Total Debt/Capital 16.3%
Asset Turnover 0.67
Current Ratio 1.24 Net Fixed Asset Turnover 4.84
Quick Ratio 0.70 Accounts receivable turnover-days 129.95
Debt to Assets 6.66% Inventory Days 124.69
Tot Debt to Common Equity 25.91% Accounts Payable Turnover Day 133.60
Accounts Receivable Turnover 2.81 Cash Conversion Cycle 125.27
Inventory Turnover 2.93
Profitability S&P Issuer Ratings
Credit Ratios
Margin Analysis
Reference
Structure
Net Income
P/E
Market Capitalization
Average Daily Trading Volume
Relative Stock Price Performance
Total Revenue
TEV/Revenue
EBITDA
TEV/EBITDA
Fiscal Year Ended
Shanghai Electric Group Co LtdPrice/Volume
Valuation Analysis
15'934'280.00
Current Price (9/dd/yy) Market Data
,--..001122
o!-. l!-. k!-. a!-. g!-0 c!-0 j!-0 Q!-0 j!-0 g!-0 g!-0 Q!-0 o!-0', F2', F-,', F-2', F.,', F.2', F0,', F02', F1,', F12', F
0.0
10'000.0
20'000.0
30'000.0
40'000.0
50'000.0
60'000.0
70'000.0
80'000.0
90'000.0
2001 2002 2003 2004 2005 2006 2007 2008 2009 2010 2011 2012
,',,
-,',,
.,',,
0,',,
1,',,
2,',,
3,',,
,-',-'.,-, ,-',4'.,-, ,-',-'.,-- ,-',4'.,-- ,-',-'.,-. ,-',4'.,-. ,-',-'.,-0 ,-',4'.,-0
FReTn/CTrThoT/PolhirTlAlcST/ !Rna /eis FReTn/CTrThoT/PolhirTlAlcST/ !Rna /eis
Q.M.S Advisors | tel: +41 (0)78 922 08 77 | e-mail: [email protected] |
Page 133
09.09.2013
Holder Name Portfolio Name Source Amt Held % Out Latest Chg File Dt Inst Type
SHANGHAI ELECTRIC GR n/a EXCH 7'411'997'802 75.24 929'304 26.06.2013 Government
FUNG CHI SHENZHEN IN n/a Co File 910'986'654 9.25 - 31.12.2012 Other
SHENERGY GROUP CO LT n/a Co File 489'892'122 4.97 - 31.12.2012 Government
WESTERN JIANYUAN HLD n/a Co File 104'000'000 1.06 - 31.12.2012 Corporation
YUNNAN METROPOLITAN n/a Co File 56'877'667 0.58 - 31.12.2012 Government
ST MINGGUANG INVEST n/a Co File 50'988'612 0.52 - 31.12.2012 Corporation
SINOMACH FINANCE CO n/a Co File 50'853'485 0.52 - 31.12.2012 Corporation
SHANGHAI CHENGTOU CO n/a Co File 40'937'826 0.42 - 31.12.2012 Government
HUNAN LIGHT INDUS SA n/a Co File 28'106'700 0.29 - 31.12.2012 Government
CHINA ASSET MANAGEME Multiple Portfolios MF-AGG 9'525'017 0.1 9'525'017 31.12.2012 Investment Advisor
CAISSE DE DEPOT ET P Multiple Portfolios MF-AGG 6'691'473 0.07 - 31.12.2012 Investment Advisor
CHINA UNIVERSAL ASSE Multiple Portfolios MF-AGG 2'667'962 0.03 (128'651) 31.12.2012 Investment Advisor
LION FUND MANAGEMENT Multiple Portfolios MF-AGG 2'580'782 0.03 (618'321) 31.12.2012 Investment Advisor
DIMENSIONAL FUND ADV n/a ULT-AGG 2'392'000 0.02 - 31.07.2012 Investment Advisor
RONGTONG FUND MANAGE Multiple Portfolios MF-AGG 972'110 0.01 (40'700) 31.12.2012 Investment Advisor
HFT INVESTMENT MANAG Multiple Portfolios MF-AGG 416'578 0 (88'100) 31.12.2012 Investment Advisor
FULLGOAL FUND MANAGE Multiple Portfolios MF-AGG 393'205 0 4'800 31.12.2012 Investment Advisor
CHINA SOUTHERN FUND Multiple Portfolios MF-AGG 277'700 0 (63'800) 31.12.2012 Investment Advisor
DBS ASSET MANAGEMENT Multiple Portfolios MF-AGG 240'000 0 240'000 31.12.2010 Investment Advisor
ZHONG HAI FUND MANAG Multiple Portfolios MF-AGG 119'372 0 - 31.12.2012 Investment Advisor
Firm Name Analyst Recommendation Weighting Change Target Price Date Date
Bank of China International KEVIN XING hold 3 M 4 Not Provided 03.09.2013
China International Capital Corp RAN SHI hold 3 M #N/A N/A Not Provided 02.09.2013
SWS Research Co Ltd DANIEL ZHOU neutral 3 M #N/A N/A Not Provided 19.07.2013
PingAn Securities ZHANG HAI buy 5 M #N/A N/A Not Provided 10.07.2013
Qilu Securities Co Ltd LIU JIANGXIAO add 4 D #N/A N/A Not Provided 20.02.2013
China Merchants Securities PENG QUANGANG buy 5 M 7 6 month 04.07.2012
Everbright Securities Co., Ltd ZHOU LIQIAN buy 5 M #N/A N/A Not Provided 06.06.2012
China Securities Co., Ltd CHEN YIHUA add 4 U 10 Not Provided 08.12.2010
Holdings By:
Shanghai Electric Group Co Ltd ee
Q.M.S Advisors | tel: +41 (0)78 922 08 77 | e-mail: [email protected] |
Page 134
09.09.2013
Jiangxi Copper Company Ltd. operates in the copper mining, milling, smelting and
refining to produce copper cathode and other related products, including pyrite
concentrates, sulphuric acid and electrolytic gold and silver businesses. The
Company also provides smelting and refining services pursuant to tolling
arrangements for customers.
Latest Fiscal Year: 12/2011
LTM as of: 06/yy
52-Week High (04.02.2013) 28.30
52-Week Low (25.06.2013) 14.80
Daily Volume
17.22
52-Week High % Change -39.15% Dividend Yield 2.90
52-Week Low % Change 16.35% Beta 1.42
% 52 Week Price Range High/Low 14.37% Equity Float 741.09
Shares Out 30.06.2013 2'075.2 Short Int -
53'082.82 1 Yr Total Return -18.47%
Total Debt 19'645.74 YTD Return -25.54%
Preferred Stock 0.0 Adjusted BETA 1.422
Minority Interest 1'087.6 Analyst Recs 11
Cash and Equivalents 18'670.36 Consensus Rating 4.273
Enterprise Value 54'019.02
Average Volume 5 Day 9'199'807
600362 CH EQUITY YTD Change - Average Volume 30 Day 11'869'010
600362 CH EQUITY YTD % CHANGE - Average Volume 3 Month 10'969'780
LTM-4Q LTM FY+1 FY+2 FQ+1 FQ+2
31.12.2008 31.12.2009 31.12.2010 31.12.2011 31.12.2012 06/yy 06/yy 12/13 Y 12/14 Y 12/12 Q4 03/13 Q1
53'693.4 51'430.6 76'138.9 117'119.2 158'006.0 124'838.6 178'897.9 165'103.5 177'731.7 32'660.0 38'950.0
0.52x 1.87x 1.75x 0.58x 0.47x 1.58x 1.14x - - - -
5'583.5 4'522.3 7'575.6 8'684.2 7'034.4 0.0 0.0 5'790.0 6'059.0 - -
5.01x 21.25x 17.55x 7.82x 10.57x 0.00x 0.00x 9.33x 8.92x - -
2'285.1 2'383.2 4'987.6 6'586.9 5'169.7 4'897.1 3'880.1 3'777.7 4'163.0 1'608.0 935.0
6.58x 20.46x 13.62x 7.16x 11.01x 9.76x 9.29x 14.93x 14.31x 18.03x 25.32x
EBITDA 7'034.40 Long-Term Rating Date -
EBIT 5'753.49 Long-Term Rating -
Operating Margin 3.64% Long-Term Outlook -
Pretax Margin 3.97% Short-Term Rating Date -
Return on Assets 4.60% Short-Term Rating -
Return on Common Equity 9.05%
Return on Capital 6.86% EBITDA/Interest Exp. 8.46
Asset Turnover 2.20% (EBITDA-Capex)/Interest Exp. 5.63
Net Debt/EBITDA -0.02
Gross Margin 4.7% Total Debt/EBITDA 4.25
EBITDA Margin 3.3%
EBIT Margin 2.5% Total Debt/Equity 45.9%
Net Income Margin 3.3% Total Debt/Capital 30.9%
Asset Turnover 2.20
Current Ratio 1.93 Net Fixed Asset Turnover 8.94
Quick Ratio 1.03 Accounts receivable turnover-days 21.58
Debt to Assets 25.16% Inventory Days 27.91
Tot Debt to Common Equity 45.93% Accounts Payable Turnover Day 15.11
Accounts Receivable Turnover 16.91 Cash Conversion Cycle 41.28
Inventory Turnover 13.08
Fiscal Year Ended
Jiangxi Copper Co LtdPrice/Volume
Valuation Analysis
16'703'368.00
Current Price (9/dd/yy) Market Data
Net Income
P/E
Market Capitalization
Average Daily Trading Volume
Relative Stock Price Performance
Total Revenue
TEV/Revenue
EBITDA
TEV/EBITDA
Profitability S&P Issuer Ratings
Credit Ratios
Margin Analysis
Reference
Structure
,
2
-,
-2
.,
.2
0,
o!-. l!-. k!-. a!-. g!-0 c!-0 j!-0 Q!-0 j!-0 g!-0 g!-0 Q!-0 o!-0', F
-,', F
.,', F
0,', F
1,', F
2,', F
3,', F
0.0
20'000.0
40'000.0
60'000.0
80'000.0
100'000.0
120'000.0
140'000.0
160'000.0
180'000.0
2001 2002 2003 2004 2005 2006 2007 2008 2009 2010 2011 2012
,',,
-,',,
.,',,
0,',,
1,',,
2,',,
3,',,
4,',,
5,',,
6,',,
-,,',,
,-',-'.,-, ,-',4'.,-, ,-',-'.,-- ,-',4'.,-- ,-',-'.,-. ,-',4'.,-. ,-',-'.,-0 ,-',4'.,-0
FReTn/CTrThoT/PolhirTlAlcST/ !Rna /eis FReTn/CTrThoT/PolhirTlAlcST/ !Rna /eis
Q.M.S Advisors | tel: +41 (0)78 922 08 77 | e-mail: [email protected] |
Page 135
09.09.2013
Holder Name Portfolio Name Source Amt Held % Out Latest Chg File Dt Inst Type
JIANGXI COPPER CORP n/a EXCH 1'329'999'325 64.09 47'924'432 30.07.2012 Corporation
HARVEST FUND MANAGEM Multiple Portfolios MF-AGG 22'435'359 1.08 9'760'750 31.12.2012 Investment Advisor
BLACKROCK ASSET MGMT Multiple Portfolios MF-AGG 16'255'255 0.78 - 30.08.2013 Investment Advisor
YINHUA FUND MANAGEME Multiple Portfolios MF-AGG 13'143'539 0.63 2'526'578 31.12.2012 Investment Advisor
CHINA ASSET MANAGEME Multiple Portfolios MF-AGG 8'349'683 0.4 (7'493'713) 31.12.2012 Investment Advisor
CHINA SOUTHERN FUND Multiple Portfolios MF-AGG 7'726'943 0.37 1'133'585 31.12.2012 Investment Advisor
HUAAN FUND MANAGEMEN Multiple Portfolios MF-AGG 7'218'872 0.35 4'212'637 31.12.2012 Investment Advisor
E FUND MANAGEMENT Multiple Portfolios MF-AGG 7'101'939 0.34 (451'941) 31.12.2012 Investment Advisor
DACHENG FUND MANAGME Multiple Portfolios MF-AGG 6'731'597 0.32 (4'681'549) 31.12.2012 Investment Advisor
CSOP ASSET MANAGEMEN Multiple Portfolios MF-AGG 6'485'970 0.31 - 02.09.2013 Investment Advisor
HUATAI-PINEBRIDGE FU Multiple Portfolios MF-AGG 6'151'817 0.3 2'315'617 31.12.2012 Investment Advisor
SOOCHOW ASSET MANAGE Multiple Portfolios MF-AGG 4'704'322 0.23 1'200'007 31.12.2012 Investment Advisor
FULLGOAL FUND MANAGE Multiple Portfolios MF-AGG 4'195'762 0.2 (2'570'128) 31.12.2012 Investment Advisor
SANJIANG AEROSPACE G n/a Co File 4'160'000 0.2 - 31.12.2009 Corporation
PENGHUA FUND MANAGEM Multiple Portfolios MF-AGG 3'557'618 0.17 3'278'456 31.12.2012 Investment Advisor
CAISSE DE DEPOT ET P Multiple Portfolios MF-AGG 3'435'493 0.17 - 31.12.2012 Investment Advisor
BOSERA FUND MANAGEME Multiple Portfolios MF-AGG 2'878'133 0.14 (342'760) 31.12.2012 Investment Advisor
JIASHI FUND MANAGEME Multiple Portfolios MF-AGG 2'861'679 0.14 2'261'737 31.12.2012 Investment Advisor
DAI ICHI LIFE INSURA n/a Co File 2'499'947 0.12 - 31.12.2009 Insurance Company
EVERBRIGHT PRAMERICA Multiple Portfolios MF-AGG 2'050'233 0.1 - 31.12.2012 Investment Advisor
Firm Name Analyst Recommendation Weighting Change Target Price Date Date
Masterlink Securities SARAH WANG hold 3 M 19 6 month 30.08.2013
China International Capital Corp CAI HONGYU hold 3 M #N/A N/A Not Provided 29.08.2013
Founder Securities LIU WEIYUAN add 4 M #N/A N/A Not Provided 26.08.2013
SWS Research Co Ltd ARTHUR WANG outperform 5 U #N/A N/A Not Provided 16.07.2013
Goldman Sachs JULIAN ZHU Buy/Neutral 5 M 22 12 month 07.07.2013
Everbright Securities Co., Ltd WANG QIANMING accumulate 4 M 24 6 month 27.03.2013
HuaChuang Securities GAO LI buy 5 M #N/A N/A Not Provided 03.02.2013
Rising Securities Co.,LTD ZHAO YUE outperform 5 M #N/A N/A Not Provided 17.12.2012
Bank of China International ROBIN TSUI hold 3 M 20 Not Provided 30.10.2012
Tebon Securities Co Ltd CAI PEIPEI buy 5 M #N/A N/A Not Provided 20.10.2012
Citic Securities Co., Ltd SONG XIAOQING overweight 5 M #N/A N/A Not Provided 21.09.2012
PingAn Securities LIANG ZHIGANG buy 5 N #N/A N/A Not Provided 02.07.2012
AJ Securities ZHANG ZHIPENG buy 5 M #N/A N/A Not Provided 28.06.2012
China Securities Co., Ltd ZHANG FANG add 4 M 30 Not Provided 25.06.2012
China Merchants Securities WANG XIAODAN buy 5 M #N/A N/A Not Provided 22.06.2012
Central China Securities HE WEIJIANG add 4 M #N/A N/A Not Provided 08.06.2012
China Investment Securities YANG GUOPING buy 5 M #N/A N/A Not Provided 19.04.2012
Great Wall Securities LIU FEI buy 5 M 26 6 month 30.03.2012
Industrial Securities RENYUAN LUO neutral 3 D #N/A N/A Not Provided 27.03.2012
China Minzu Securities Co Ltd GUAN JIANXIN buy 5 M 35 6 month 10.10.2011
Northeast Securities Co Ltd XIFENG PAN buy 5 M #N/A N/A Not Provided 22.06.2011
Cinda Securities Ltd FAN HAIBO buy 5 M #N/A N/A Not Provided 20.06.2011
HSBC SARAH MAK neutral 3 M 40 Not Provided 15.04.2011
Holdings By:
Jiangxi Copper Co Ltd ee
Q.M.S Advisors | tel: +41 (0)78 922 08 77 | e-mail: [email protected] |
Page 136
09.09.2013
Air China Limited provides passenger, cargo, and airline-related services in
China. The Company is primarily based in Beijing and a major hub for domestic
and international air transportation. Air China's airline-related services
include aircraft maintenance, repair, overhaul service, ground services, and
in-flight catering services.
Latest Fiscal Year: 12/2012
LTM as of: 06/yy
52-Week High (21.01.2013) 6.19
52-Week Low (29.07.2013) 3.74
Daily Volume
4.2
52-Week High % Change -32.15% Dividend Yield 1.41
52-Week Low % Change 12.30% Beta 1.14
% 52 Week Price Range High/Low 13.06% Equity Float 1'600.95
Shares Out 30.06.2013 8'522.1 Short Int -
54'843.75 1 Yr Total Return -14.23%
Total Debt 101'899.03 YTD Return -28.95%
Preferred Stock 0.0 Adjusted BETA 1.145
Minority Interest 2'619.1 Analyst Recs 16
Cash and Equivalents 12'060.41 Consensus Rating 4.125
Enterprise Value 148'958.99
Average Volume 5 Day 19'563'580
601111 CH EQUITY YTD Change - Average Volume 30 Day 18'198'650
601111 CH EQUITY YTD % CHANGE - Average Volume 3 Month 16'338'920
LTM-4Q LTM FY+1 FY+2 FQ+1 FQ+2
31.12.2008 31.12.2009 31.12.2010 31.12.2011 31.12.2012 06/yy 06/yy 12/13 Y 12/14 Y 09/13 Q3 12/13 Q4
50'536.7 48'091.6 78'209.2 93'343.4 95'319.4 97'263.7 97'325.9 106'295.1 118'448.2 38'333.0 23'966.0
1.85x 3.35x 2.81x 1.40x 1.75x 5.20x 5.77x 1.42x 1.30x - -
3'154.8 9'985.1 19'185.1 19'226.3 18'775.6 0.0 0.0 20'767.4 24'146.6 - -
29.68x 16.14x 11.44x 6.78x 8.87x 0.00x 0.00x 7.17x 6.17x - -
(9'255.8) 4'854.2 12'005.0 7'082.4 4'636.7 4'456.3 5'005.1 5'231.0 5'557.7 3'304.0 (793.0)
- 13.03x 7.18x 8.00x 13.79x 10.26x 10.99x 9.59x 9.03x - -
EBITDA 18'775.60 Long-Term Rating Date -
EBIT 8'304.00 Long-Term Rating -
Operating Margin 8.71% Long-Term Outlook -
Pretax Margin 6.90% Short-Term Rating Date -
Return on Assets 2.57% Short-Term Rating -
Return on Common Equity 9.82%
Return on Capital 4.82% EBITDA/Interest Exp. 6.15
Asset Turnover 0.51% (EBITDA-Capex)/Interest Exp. 1.02
Net Debt/EBITDA 5.10
Gross Margin - Total Debt/EBITDA 5.92
EBITDA Margin 18.6%
EBIT Margin 7.4% Total Debt/Equity 205.2%
Net Income Margin 4.9% Total Debt/Capital 66.1%
Asset Turnover 0.51
Current Ratio 0.38 Net Fixed Asset Turnover 0.66
Quick Ratio 0.25 Accounts receivable turnover-days 13.83
Debt to Assets 54.32% Inventory Days -
Tot Debt to Common Equity 205.20% Accounts Payable Turnover Day -
Accounts Receivable Turnover 26.39 Cash Conversion Cycle -
Inventory Turnover -
Fiscal Year Ended
Air China LtdPrice/Volume
Valuation Analysis
55'231'255.00
Current Price (9/dd/yy) Market Data
Net Income
P/E
Market Capitalization
Average Daily Trading Volume
Relative Stock Price Performance
Total Revenue
TEV/Revenue
EBITDA
TEV/EBITDA
Profitability S&P Issuer Ratings
Credit Ratios
Margin Analysis
Reference
Structure
,
-
.
0
1
2
3
4
o!-. l!-. k!-. a!-. g!-0 c!-0 j!-0 Q!-0 j!-0 g!-0 g!-0 Q!-0 o!-0', F
-,', F
.,', F
0,', F
1,', F
2,', F
3,', F
0.0
20'000.0
40'000.0
60'000.0
80'000.0
100'000.0
120'000.0
2001 2002 2003 2004 2005 2006 2007 2008 2009 2010 2011 2012,',,
,'.,
,'1,
,'3,
,'5,
-',,
-'.,
FReTn/CTrThoT/PolhirTlAlcST/ !Rna /eis FReTn/CTrThoT/PolhirTlAlcST/ !Rna /eis
Q.M.S Advisors | tel: +41 (0)78 922 08 77 | e-mail: [email protected] |
Page 137
09.09.2013
Holder Name Portfolio Name Source Amt Held % Out Latest Chg File Dt Inst Type
NCA HOLDING COMPANY n/a EXCH 5'426'536'093 63.68 - 30.01.2013 Government
NCA HOLDING COMPANY n/a EXCH 1'332'482'920 15.64 - 30.01.2013 Government
CHINA NATIONAL AVIAT n/a EXCH 86'300'000 1.01 - 30.01.2013 Government
SINOTRANS AIR TRANSP n/a EXCH 75'800'000 0.89 - 30.01.2013 Government
NEW CHINA LIFE INSUR n/a EXCH 68'378'218 0.8 - 30.01.2013 Insurance Company
GUODIAN CAPITAL HOLD n/a Co File 48'000'000 0.56 - 30.06.2011 Other
GUOHUA LIFE INSUR n/a EXCH 43'576'065 0.51 - 30.01.2013 Insurance Company
CHINA INTERNATIONAL Multiple Portfolios MF-AGG 34'507'884 0.4 32'816'668 31.12.2012 Investment Advisor
BLACKROCK ASSET MGMT Multiple Portfolios MF-AGG 33'138'172 0.39 - 30.08.2013 Investment Advisor
HARVEST FUND MANAGEM Multiple Portfolios MF-AGG 27'423'915 0.32 (37'211'753) 31.12.2012 Investment Advisor
BOSHI FUND MANAGEMEN Multiple Portfolios MF-AGG 24'557'137 0.29 18'355'365 31.12.2012 Investment Advisor
HARVEST SHSZ300 INDE n/a EXCH 17'770'240 0.21 - 30.01.2013 n/a
ORIENT FUND MANAGEME Multiple Portfolios MF-AGG 16'438'473 0.19 16'438'473 31.12.2012 Investment Advisor
CHINA INT FIRST GROW n/a EXCH 16'430'247 0.19 - 30.01.2013 n/a
HUAAN FUND MANAGEMEN Multiple Portfolios MF-AGG 13'846'017 0.16 2'179'788 31.03.2013 Investment Advisor
HUATAI-PINEBRIDGE FU Multiple Portfolios MF-AGG 13'618'996 0.16 (940'781) 31.12.2012 Investment Advisor
CSOP ASSET MANAGEMEN Multiple Portfolios MF-AGG 13'310'019 0.16 - 02.09.2013 Investment Advisor
CHINA ASSET MANAGEME Multiple Portfolios MF-AGG 9'979'460 0.12 (10'319'002) 31.12.2012 Investment Advisor
HFT INVESTMENT MANAG Multiple Portfolios MF-AGG 8'679'904 0.1 7'562'074 31.12.2012 Investment Advisor
YIMIN ASSET MANAGEME Multiple Portfolios MF-AGG 7'849'918 0.09 (4'595'244) 31.12.2012 Investment Advisor
Firm Name Analyst Recommendation Weighting Change Target Price Date Date
China Merchants Securities LUO YANYAN buy 5 M #N/A N/A Not Provided 30.08.2013
Capital Securities Corp LI XIAOLU hold 3 M 4 Not Provided 29.08.2013
GF Securities Co. Ltd. YANG ZHIQING add 4 D #N/A N/A Not Provided 29.08.2013
China International Capital Corp SHEN XIAOFENG buy 5 M #N/A N/A Not Provided 28.08.2013
SWS Research Co Ltd AMOS ZHANG neutral 3 M #N/A N/A Not Provided 28.08.2013
Goldman Sachs HINO LAM neutral/neutral 3 M 5 12 month 27.08.2013
UBS XIN CHEN neutral 3 M 4 12 month 27.08.2013
Northeast Securities Co Ltd XIANG XU add 4 M #N/A N/A Not Provided 27.08.2013
China Minzu Securities Co Ltd WANG XIAOYAN neutral 3 M #N/A N/A Not Provided 07.06.2013
Citic Securities Co., Ltd SU BAOLIANG buy 5 M 7 6 month 12.04.2013
Rising Securities Co.,LTD XUE MINGJIE outperform 5 U #N/A N/A Not Provided 29.03.2013
Founder Securities WANG TAO add 4 M #N/A N/A Not Provided 27.03.2013
Sinolink Securities Co Ltd HUANG JINXIANG add 4 M #N/A N/A Not Provided 22.01.2013
PingAn Securities SUN CHAO buy 5 M #N/A N/A Not Provided 14.01.2013
Bank of China International DU JIANPING buy 5 M 11 Not Provided 11.12.2012
HuaChuang Securities CHEN JUAN buy 5 M #N/A N/A Not Provided 02.11.2012
Masterlink Securities DAI KAI-YU hold 3 M 7 Not Provided 10.08.2012
China Securities Co., Ltd LI LEI add 4 M 9 Not Provided 25.06.2012
Industrial Securities ZENG XU neutral 3 M 7 12 month 26.04.2012
AJ Securities XIN ZHANG buy 5 M #N/A N/A Not Provided 31.08.2011
Central China Securities FANG XIAHONG add 4 N #N/A N/A Not Provided 13.06.2011
China Investment Securities XIE HONG strong buy 5 M #N/A N/A Not Provided 02.03.2011
Everbright Securities Co., Ltd CHEN XIN buy 5 M 20 Not Provided 26.02.2011
China Galaxy Securities MAO ANG speculative buy 4 M #N/A N/A Not Provided 27.05.2010
Guodu Securities Co Ltd GONG JUNJIE buy 5 M #N/A N/A Not Provided 23.04.2010
KGI Securities JERRY WENG outperform 5 M 8 12 month 30.06.2009
Holdings By:
Air China Ltd ee
Q.M.S Advisors | tel: +41 (0)78 922 08 77 | e-mail: [email protected] |
Page 138
09.09.2013
NARI Technology Development Limited Company develops, manufactures and sells
automation products for electricity distribution, converting stations,
coal-fired power plants, and industrial process. The Company also provides
services and system integration.
Latest Fiscal Year: 12/2012
LTM as of: 06/yy
52-Week High (21.05.2013) 17.46
52-Week Low (04.12.2012) 9.49
Daily Volume
16.1
52-Week High % Change -7.81% Dividend Yield -
52-Week Low % Change 69.73% Beta 0.76
% 52 Week Price Range High/Low 79.39% Equity Float 1'302.57
Shares Out 30.06.2013 2'205.8 Short Int -
35'512.63 1 Yr Total Return 33.96%
Total Debt 634.06 YTD Return 41.90%
Preferred Stock 0.0 Adjusted BETA 0.764
Minority Interest 22.5 Analyst Recs 17
Cash and Equivalents 1'910.43 Consensus Rating 4.706
Enterprise Value 34'817.41
Average Volume 5 Day 19'322'450
600406 CH EQUITY YTD Change - Average Volume 30 Day 20'461'550
600406 CH EQUITY YTD % CHANGE - Average Volume 3 Month 20'784'490
LTM-4Q LTM FY+1 FY+2 FQ+1 FQ+2
31.12.2008 31.12.2009 31.12.2010 31.12.2011 31.12.2012 06/yy 06/yy 12/13 Y 12/14 Y 09/13 Q3 12/13 Q4
1'363.7 1'762.4 3'009.2 4'608.1 5'978.1 5'314.3 6'400.2 7'771.8 9'875.4 1'666.0 3'346.0
3.39x 6.97x 12.14x 6.87x 4.02x 24.24x 16.51x 4.23x 3.22x - -
144.4 218.9 485.1 853.6 1'035.0 0.0 0.0 1'475.7 1'877.7 326.0 795.0
32.00x 56.15x 75.32x 37.06x 23.19x 0.00x 0.00x 23.59x 18.54x 19.02x 18.26x
173.1 249.7 518.7 854.8 1'056.0 908.4 1'162.7 1'396.6 1'775.9 290.0 671.0
29.99x 99.92x 141.29x 38.52x 23.93x 32.25x 26.42x 23.82x 18.68x 23.00x 21.61x
EBITDA 1'035.01 Long-Term Rating Date -
EBIT 990.50 Long-Term Rating -
Operating Margin 16.57% Long-Term Outlook -
Pretax Margin 19.72% Short-Term Rating Date -
Return on Assets 16.40% Short-Term Rating -
Return on Common Equity 32.75%
Return on Capital - EBITDA/Interest Exp. 56.97
Asset Turnover 0.90% (EBITDA-Capex)/Interest Exp. 50.57
Net Debt/EBITDA -
Gross Margin 29.6% Total Debt/EBITDA -
EBITDA Margin -
EBIT Margin 15.5% Total Debt/Equity 16.3%
Net Income Margin 17.7% Total Debt/Capital 14.0%
Asset Turnover 0.90
Current Ratio 1.84 Net Fixed Asset Turnover 16.46
Quick Ratio 1.37 Accounts receivable turnover-days 205.80
Debt to Assets 8.26% Inventory Days 107.42
Tot Debt to Common Equity 16.33% Accounts Payable Turnover Day 169.66
Accounts Receivable Turnover 1.77 Cash Conversion Cycle 153.16
Inventory Turnover 3.40
Fiscal Year Ended
NARI Technology Development Co LtdPrice/Volume
Valuation Analysis
18'223'097.00
Current Price (9/dd/yy) Market Data
Net Income
P/E
Market Capitalization
Average Daily Trading Volume
Relative Stock Price Performance
Total Revenue
TEV/Revenue
EBITDA
TEV/EBITDA
Profitability S&P Issuer Ratings
Credit Ratios
Margin Analysis
Reference
Structure
,.135
-,-.-1-3-5
o!-. l!-. k!-. a!-. g!-0 c!-0 j!-0 Q!-0 j!-0 g!-0 g!-0 Q!-0 o!-0', F-,', F.,', F0,', F1,', F2,', F3,', F4,', F5,', F6,', F
0.0
1'000.0
2'000.0
3'000.0
4'000.0
5'000.0
6'000.0
7'000.0
2001 2002 2003 2004 2005 2006 2007 2008 2009 2010 2011 2012
,',,
2,',,
-,,',,
-2,',,
.,,',,
.2,',,
0,,',,
02,',,
1,,',,
,-',-'.,-, ,-',4'.,-, ,-',-'.,-- ,-',4'.,-- ,-',-'.,-. ,-',4'.,-. ,-',-'.,-0 ,-',4'.,-0
FReTn/CTrThoT/PolhirTlAlcST/ !Rna /eis FReTn/CTrThoT/PolhirTlAlcST/ !Rna /eis
Q.M.S Advisors | tel: +41 (0)78 922 08 77 | e-mail: [email protected] |
Page 139
09.09.2013
Holder Name Portfolio Name Source Amt Held % Out Latest Chg File Dt Inst Type
NANJING NARI GROUP C n/a Co File 821'534'112 37.25 - 31.12.2012 Other
HUAAN FUND MANAGEMEN Multiple Portfolios MF-AGG 91'695'863 4.16 46'952'709 31.03.2013 Investment Advisor
CHINA UNIVERSAL ASSE Multiple Portfolios MF-AGG 89'999'940 4.08 78'718'413 02.09.2013 Investment Advisor
INVESCO GREAT WALL F Multiple Portfolios MF-AGG 73'725'372 3.34 44'442'333 30.06.2013 Investment Advisor
CHINA SOUTHERN FUND Multiple Portfolios MF-AGG 73'211'192 3.32 (14'484'180) 30.06.2013 Investment Advisor
YINHUA FUND MANAGEME Multiple Portfolios MF-AGG 69'591'326 3.15 (26'000'381) 30.06.2013 Investment Advisor
CHINA INTERNATIONAL Multiple Portfolios MF-AGG 67'639'286 3.07 31'016'324 30.06.2013 Investment Advisor
CHINA ASSET MANAGEME Multiple Portfolios MF-AGG 54'853'078 2.49 14'239'788 30.06.2013 Investment Advisor
GD POWER DEVELOPMENT n/a Co File 48'900'220 2.22 - 31.12.2012 Corporation
EVERBRIGHT PRAMERICA Multiple Portfolios MF-AGG 32'341'383 1.47 30'071'193 30.06.2013 Investment Advisor
SOCIAL SECURITY FUND n/a Co File 32'330'698 1.47 - 31.12.2012 Government
BANK OF COMMUNICATIO Multiple Portfolios MF-AGG 27'831'290 1.26 (57'629'114) 30.06.2013 Investment Advisor
CHINA LIFE INSURANCE n/a ULT-AGG 22'967'742 1.04 - 31.12.2012 Government
CHANGSHENG FUND MANA Multiple Portfolios MF-AGG 21'653'398 0.98 13'961'638 31.12.2012 Investment Advisor
HFT INVESTMENT MANAG Multiple Portfolios MF-AGG 19'433'774 0.88 (75'338'312) 31.12.2012 Investment Advisor
CHINA ASSET MANAGEME Multiple Portfolios MF-AGG 18'859'488 0.86 8'056'184 31.12.2012 Investment Advisor
GTJA ALLIANZ FUND MA Multiple Portfolios MF-AGG 14'344'966 0.65 10'970'232 30.06.2013 Investment Advisor
BAOYING FUND MANAGEM Multiple Portfolios MF-AGG 11'845'113 0.54 6'875'013 31.12.2012 Investment Advisor
GF FUND MANAGEMENT C Multiple Portfolios MF-AGG 10'575'726 0.48 (7'019'565) 31.12.2012 Investment Advisor
HARVEST FUND MANAGEM Multiple Portfolios MF-AGG 10'568'788 0.48 (42'271'730) 31.12.2012 Investment Advisor
Firm Name Analyst Recommendation Weighting Change Target Price Date Date
Chang Jiang Securities Co. Limited HAOLONG DENG buy 5 M #N/A N/A Not Provided 02.09.2013
Capital Securities Corp LAI SHENSHENG buy 5 M 20 Not Provided 30.08.2013
PingAn Securities JUN ZHANG strong buy 5 M 22 6 month 29.08.2013
EVA Dimensions TIMOTHY STANISH underweight 1 D #N/A N/A Not Provided 26.08.2013
Northeast Securities Co Ltd YANG JIALI buy 5 M #N/A N/A Not Provided 25.08.2013
GF Securities Co. Ltd. HAN LING buy 5 M 20 12 month 25.08.2013
China International Capital Corp YAFENG ZHU accumulate 4 N #N/A N/A Not Provided 23.08.2013
Qilu Securities Co Ltd LIU JIANGXIAO buy 5 M #N/A N/A Not Provided 23.08.2013
Guotai Junan XIAO LIU buy 5 M 19 12 month 22.08.2013
Everbright Securities Co., Ltd ZHOU LIQIAN buy 5 M 20 6 month 25.07.2013
SWS Research Co Ltd DANIEL ZHOU buy 5 M #N/A N/A Not Provided 19.07.2013
Founder Securities WEI ZHOU buy 5 M #N/A N/A Not Provided 19.07.2013
UBS WEIQI FU buy 5 M 18 12 month 14.06.2013
Hong Yuan Securities WANG JING buy 5 M 23 6 month 03.06.2013
Guodu Securities Co Ltd WEI JING buy 5 M #N/A N/A Not Provided 21.03.2013
HuaChuang Securities LI DAJUN strong buy 5 M #N/A N/A Not Provided 24.02.2013
Great Wall Securities GUI FANGXIAO buy 5 M 18 12 month 05.11.2012
China Securities Co., Ltd XU CHAO add 4 M 29 Not Provided 25.06.2012
Rising Securities Co.,LTD ZENG WEIQIANG outperform 5 M #N/A N/A Not Provided 18.06.2012
China Merchants Securities WANG LIUSHENG buy 5 M #N/A N/A Not Provided 09.04.2012
Central China Securities PAN HANGJUN add 4 N #N/A N/A Not Provided 25.02.2011
China Minzu Securities Co Ltd CAIXIA FU add 4 M 18 6 month 09.02.2011
China Investment Securities MA HENG buy 5 M #N/A N/A Not Provided 26.07.2010
Citic Securities Co., Ltd LIU LEI buy 5 M 12 6 month 28.06.2010
Holdings By:
NARI Technology Development Co Ltd ee
Q.M.S Advisors | tel: +41 (0)78 922 08 77 | e-mail: [email protected] |
Page 140
09.09.2013
Qingdao Haier Co., Ltd. manufactures and markets air conditioners,
refrigerators, freezers, small household electrical appliances, and other
related products.
Latest Fiscal Year: 12/2012
LTM as of: 06/yy
52-Week High (21.01.2013) 14.40
52-Week Low (25.06.2013) 10.01
Daily Volume
12.57
52-Week High % Change -12.71% Dividend Yield -
52-Week Low % Change 25.57% Beta 1.13
% 52 Week Price Range High/Low 61.28% Equity Float 1'446.72
Shares Out 30.06.2013 2'695.9 Short Int -
33'887.58 1 Yr Total Return 16.01%
Total Debt 9'818.24 YTD Return -3.30%
Preferred Stock 0.0 Adjusted BETA 1.131
Minority Interest 4'297.6 Analyst Recs 13
Cash and Equivalents 16'283.77 Consensus Rating 4.923
Enterprise Value 32'605.63
Average Volume 5 Day 11'286'130
600690 CH EQUITY YTD Change - Average Volume 30 Day 11'225'280
600690 CH EQUITY YTD % CHANGE - Average Volume 3 Month 10'869'670
LTM-4Q LTM FY+1 FY+2 FQ+1 FQ+2
31.12.2008 31.12.2009 31.12.2010 31.12.2011 31.12.2012 06/yy 06/yy 12/13 Y 12/14 Y 09/13 Q3 12/13 Q4
30'312.6 44'539.8 64'528.4 73'520.2 79'426.7 75'918.7 81'884.9 87'279.0 97'043.0 - -
0.38x 0.68x 0.55x 0.31x 0.43x 1.31x 1.47x - - - -
1'482.0 2'552.1 3'522.5 4'382.7 5'379.2 0.0 0.0 6'314.0 7'264.0 - -
7.71x 11.92x 10.11x 5.24x 6.29x 0.00x 0.00x 5.16x 4.49x - -
768.2 1'383.5 2'240.0 2'690.1 3'269.5 3'014.8 3'547.9 3'763.4 4'290.8 - -
15.66x 23.97x 33.74x 8.91x 11.00x 10.44x 8.28x 9.04x 8.02x - -
EBITDA 5'379.19 Long-Term Rating Date -
EBIT 4'716.02 Long-Term Rating -
Operating Margin 5.94% Long-Term Outlook -
Pretax Margin 6.83% Short-Term Rating Date -
Return on Assets 7.42% Short-Term Rating -
Return on Common Equity 32.23%
Return on Capital - EBITDA/Interest Exp. 46.47
Asset Turnover 1.71% (EBITDA-Capex)/Interest Exp. 35.86
Net Debt/EBITDA -
Gross Margin 24.7% Total Debt/EBITDA -
EBITDA Margin -
EBIT Margin 6.4% Total Debt/Equity 88.2%
Net Income Margin 4.1% Total Debt/Capital 38.9%
Asset Turnover 1.71
Current Ratio 1.27 Net Fixed Asset Turnover 12.82
Quick Ratio 1.00 Accounts receivable turnover-days 65.15
Debt to Assets 19.76% Inventory Days 29.94
Tot Debt to Common Equity 88.23% Accounts Payable Turnover Day 71.41
Accounts Receivable Turnover 5.60 Cash Conversion Cycle 30.71
Inventory Turnover 12.19
Profitability S&P Issuer Ratings
Credit Ratios
Margin Analysis
Reference
Structure
Net Income
P/E
Market Capitalization
Average Daily Trading Volume
Relative Stock Price Performance
Total Revenue
TEV/Revenue
EBITDA
TEV/EBITDA
Fiscal Year Ended
Qingdao Haier Co LtdPrice/Volume
Valuation Analysis
20'762'074.00
Current Price (9/dd/yy) Market Data
,
.
1
3
5
-,
-.
-1
-3
o!-. l!-. k!-. a!-. g!-0 c!-0 j!-0 Q!-0 j!-0 g!-0 g!-0 Q!-0 o!-0', F
2', F
-,', F
-2', F
.,', F
.2', F
0,', F
02', F
1,', F
0.0
10'000.0
20'000.0
30'000.0
40'000.0
50'000.0
60'000.0
70'000.0
80'000.0
90'000.0
2001 2002 2003 2004 2005 2006 2007 2008 2009 2010 2011 2012
,',,
-',,
.',,
0',,
1',,
2',,
3',,
4',,
5',,
,-',-'.,-, ,-',4'.,-, ,-',-'.,-- ,-',4'.,-- ,-',-'.,-. ,-',4'.,-. ,-',-'.,-0 ,-',4'.,-0
FReTn/CTrThoT/PolhirTlAlcST/ !Rna /eis FReTn/CTrThoT/PolhirTlAlcST/ !Rna /eis
Q.M.S Advisors | tel: +41 (0)78 922 08 77 | e-mail: [email protected] |
Page 141
09.09.2013
Holder Name Portfolio Name Source Amt Held % Out Latest Chg File Dt Inst Type
HAIER ELECTRICAL APP n/a Co File 629'342'412 23.34 - 31.12.2012 Holding Company
HAIER CO LTD n/a Co File 536'305'382 19.89 - 31.12.2012 Corporation
DACHENG FUND MANAGME Multiple Portfolios MF-AGG 96'928'028 3.6 (25'382'068) 31.12.2012 Investment Advisor
QINGDAO HAIER VENTUR n/a Co File 80'298'880 2.98 - 31.12.2012 Venture Capital
PENGHUA FUND MANAGEM Multiple Portfolios MF-AGG 63'147'487 2.34 18'347'301 30.06.2013 Investment Advisor
EVERBRIGHT PRAMERICA Multiple Portfolios MF-AGG 52'109'390 1.93 5'734'306 30.06.2013 Investment Advisor
CHINA ASSET MANAGEME Multiple Portfolios MF-AGG 43'275'082 1.61 4'069'339 30.06.2013 Investment Advisor
CHONGYANG 3 PHASE CO n/a Co File 33'925'000 1.26 - 31.12.2012 n/a
GF FUND MANAGEMENT C Multiple Portfolios MF-AGG 30'672'500 1.14 5'013'468 31.12.2012 Investment Advisor
BANK OF COMMUNICATIO Multiple Portfolios MF-AGG 28'032'695 1.04 25'872'917 31.12.2012 Investment Advisor
CITIC SECURITIES CO n/a ULT-AGG 24'583'840 0.91 - 31.12.2012 Investment Advisor
GUOTAI JUNAN SECURIT n/a Co File 23'061'369 0.86 - 31.12.2012 Investment Advisor
NEW CHINA LIFE INSUR n/a Co File 22'986'576 0.85 - 31.12.2012 Insurance Company
E FUND MANAGEMENT Multiple Portfolios MF-AGG 21'988'813 0.82 7'887'745 31.12.2012 Investment Advisor
BOSHI FUND MANAGEMEN Multiple Portfolios MF-AGG 20'595'041 0.76 13'493'824 31.12.2012 Investment Advisor
SYWG BNP PARIBAS ASS Multiple Portfolios MF-AGG 14'206'172 0.53 462'437 30.06.2013 Investment Advisor
HARVEST FUND MANAGEM Multiple Portfolios MF-AGG 12'805'608 0.48 (33'936'633) 31.12.2012 Investment Advisor
HUATAI-PINEBRIDGE FU Multiple Portfolios MF-AGG 12'751'590 0.47 3'122'478 30.06.2013 Investment Advisor
BANK OF CHINA INVEST Multiple Portfolios MF-AGG 12'539'501 0.47 (14'874'000) 31.12.2012 Investment Advisor
ABC-CA FUND MANAGEME Multiple Portfolios MF-AGG 11'999'656 0.45 10'092'776 31.12.2012 Investment Advisor
Firm Name Analyst Recommendation Weighting Change Target Price Date Date
SWS Research Co Ltd CAI WENJUAN outperform 5 M #N/A N/A Not Provided 30.08.2013
Capital Securities Corp HU JIAMING buy 5 M #N/A N/A Not Provided 28.08.2013
China International Capital Corp HE WEI buy 5 M #N/A N/A Not Provided 28.08.2013
Guotai Junan FAN YANG buy 5 U 15 12 month 28.08.2013
Fortune CLSA Securities Limited KATHARINE SONG buy 5 M 16 12 month 28.08.2013
China Investment Securities HAO XUEMEI buy 5 D #N/A N/A Not Provided 18.06.2013
Citic Securities Co., Ltd HU YALI buy 5 M #N/A N/A Not Provided 19.04.2013
Guodu Securities Co Ltd YANG ZHIGANG buy 5 M 15 12 month 22.03.2013
Northeast Securities Co Ltd WU NA add 4 M #N/A N/A Not Provided 01.02.2013
EVA Dimensions CRAIG STERLING buy 5 M #N/A N/A Not Provided 17.01.2013
Central China Securities HU ZHUQIANG buy 5 M #N/A N/A Not Provided 29.11.2012
Sinolink Securities Co Ltd WANG XIAOYING buy 5 M #N/A N/A Not Provided 01.11.2012
Great Wall Securities ZHU ZHENG buy 5 M #N/A N/A Not Provided 31.10.2012
China Merchants Securities JI MIN buy 5 M #N/A N/A Not Provided 16.07.2012
China Securities Co., Ltd LIU YI add 4 D 14 Not Provided 25.06.2012
Industrial Securities LIU LUDAN buy 5 M #N/A N/A Not Provided 26.04.2012
PingAn Securities ZHU ZHENG strong buy 5 M #N/A N/A Not Provided 20.11.2011
Hong Yuan Securities ZHANG ZEJING buy 5 M #N/A N/A Not Provided 09.10.2011
Cinda Securities Ltd ZHANG DONGFENG buy 5 M #N/A N/A Not Provided 17.06.2011
Rising Securities Co.,LTD TEAM COVERAGE outperform 5 M #N/A N/A Not Provided 15.04.2011
Bank of China International LIU HUIMING buy 5 N 17 Not Provided 31.03.2011
Holdings By:
Qingdao Haier Co Ltd ee
Q.M.S Advisors | tel: +41 (0)78 922 08 77 | e-mail: [email protected] |
Page 142
09.09.2013
Shandong Gold Mining Co., Ltd. mines, produces, and processes gold, silver, and
sulphur.
Latest Fiscal Year: 12/2012
LTM as of: 06/yy
52-Week High (21.09.2012) 42.70
52-Week Low (19.07.2013) 21.00
Daily Volume
24.43
52-Week High % Change -42.79% Dividend Yield -
52-Week Low % Change 16.33% Beta -
% 52 Week Price Range High/Low 14.24% Equity Float 691.92
Shares Out 30.06.2013 1'423.1 Short Int -
34'765.66 1 Yr Total Return -34.61%
Total Debt 5'282.40 YTD Return -35.62%
Preferred Stock 0.0 Adjusted BETA -
Minority Interest 1'115.8 Analyst Recs 14
Cash and Equivalents 897.74 Consensus Rating 3.571
Enterprise Value 40'287.44
Average Volume 5 Day 22'482'480
600547 CH EQUITY YTD Change - Average Volume 30 Day 20'413'950
600547 CH EQUITY YTD % CHANGE - Average Volume 3 Month 16'896'890
LTM-4Q LTM FY+1 FY+2 FQ+1 FQ+2
31.12.2008 31.12.2009 31.12.2010 31.12.2011 31.12.2012 06/yy 06/yy 12/13 Y 12/14 Y 09/13 Q3 12/13 Q4
19'871.4 23'358.4 31'511.0 39'409.5 50'221.8 44'934.1 52'899.6 49'787.3 49'260.3 10'668.0 5'747.0
0.91x 2.53x 2.48x 1.12x 1.19x 4.54x 3.32x 0.81x 0.82x - -
1'261.2 1'504.6 2'395.4 3'571.9 4'156.2 0.0 0.0 3'337.0 2'883.7 - 1'138.0
14.38x 39.30x 32.58x 12.35x 14.39x 0.00x 0.00x 12.07x 13.97x - -
637.0 748.7 1'223.0 1'902.4 2'171.2 2'259.1 1'732.9 1'589.7 1'956.6 375.0 221.0
27.13x 151.51x 61.29x 21.19x 24.94x 20.73x 0.00x 19.56x 14.91x - -
EBITDA 4'156.24 Long-Term Rating Date -
EBIT 3'204.55 Long-Term Rating -
Operating Margin 6.38% Long-Term Outlook -
Pretax Margin 5.80% Short-Term Rating Date -
Return on Assets 10.77% Short-Term Rating -
Return on Common Equity 22.78%
Return on Capital - EBITDA/Interest Exp. 14.64
Asset Turnover 3.29% (EBITDA-Capex)/Interest Exp. 5.36
Net Debt/EBITDA -
Gross Margin 9.9% Total Debt/EBITDA -
EBITDA Margin -
EBIT Margin 4.8% Total Debt/Equity 69.5%
Net Income Margin 4.3% Total Debt/Capital 37.7%
Asset Turnover 3.29
Current Ratio 0.60 Net Fixed Asset Turnover 6.71
Quick Ratio 0.13 Accounts receivable turnover-days 0.40
Debt to Assets 30.25% Inventory Days 5.43
Tot Debt to Common Equity 69.52% Accounts Payable Turnover Day 7.54
Accounts Receivable Turnover 904.16 Cash Conversion Cycle -1.61
Inventory Turnover 67.20
Profitability S&P Issuer Ratings
Credit Ratios
Margin Analysis
Reference
Structure
Net Income
P/E
Market Capitalization
Average Daily Trading Volume
Relative Stock Price Performance
Total Revenue
TEV/Revenue
EBITDA
TEV/EBITDA
Fiscal Year Ended
Shandong Gold Mining Co LtdPrice/Volume
Valuation Analysis
19'705'481.00
Current Price (9/dd/yy) Market Data
,2
-,-2.,.20,021,12
o!-. l!-. k!-. a!-. g!-0 c!-0 j!-0 Q!-0 j!-0 g!-0 g!-0 Q!-0 o!-0', F
-,', F
.,', F
0,', F
1,', F
2,', F
3,', F
4,', F
5,', F
0.0
10'000.0
20'000.0
30'000.0
40'000.0
50'000.0
60'000.0
2001 2002 2003 2004 2005 2006 2007 2008 2009 2010 2011 2012
,',,
-,',,
.,',,
0,',,
1,',,
2,',,
3,',,
,-',-'.,-, ,-',4'.,-, ,-',-'.,-- ,-',4'.,-- ,-',-'.,-. ,-',4'.,-. ,-',-'.,-0 ,-',4'.,-0
FReTn/CTrThoT/PolhirTlAlcST/ !Rna /eis FReTn/CTrThoT/PolhirTlAlcST/ !Rna /eis
Q.M.S Advisors | tel: +41 (0)78 922 08 77 | e-mail: [email protected] |
Page 143
09.09.2013
Holder Name Portfolio Name Source Amt Held % Out Latest Chg File Dt Inst Type
SHANDONG GOLD GROUP n/a Co File 715'097'736 50.25 - 31.12.2012 Government
CHINA ASSET MANAGEME Multiple Portfolios MF-AGG 19'115'539 1.34 3'699'047 31.12.2012 Investment Advisor
CHINA SOUTHERN FUND Multiple Portfolios MF-AGG 17'940'889 1.26 2'618'143 30.06.2013 Investment Advisor
SD GOLD GRP QINGDOU n/a Co File 16'054'672 1.13 - 31.12.2012 Government
PICC LIFE INSURANCE n/a Co File 14'799'770 1.04 - 31.12.2012 Government
HARVEST FUND MANAGEM Multiple Portfolios MF-AGG 10'022'278 0.7 (6'487'861) 31.12.2012 Investment Advisor
E FUND MANAGEMENT Multiple Portfolios MF-AGG 9'813'026 0.69 (141'500) 31.12.2012 Investment Advisor
CHINA LIFE INSURANCE n/a ULT-AGG 9'145'780 0.64 - 31.12.2012 Government
BANK OF COMMUNICATIO Multiple Portfolios MF-AGG 7'692'527 0.54 7'644'608 31.12.2012 Investment Advisor
RONGTONG FUND MANAGE Multiple Portfolios MF-AGG 5'691'374 0.4 3'701'328 31.12.2012 Investment Advisor
YINHUA FUND MANAGEME Multiple Portfolios MF-AGG 5'348'098 0.38 (2'915'743) 31.12.2012 Investment Advisor
HUATAI-PINEBRIDGE FU Multiple Portfolios MF-AGG 5'135'525 0.36 1'882'439 31.12.2012 Investment Advisor
BILL & MELINDA FOUND n/a Co File 4'400'074 0.31 - 31.12.2012 n/a
GF FUND MANAGEMENT C Multiple Portfolios MF-AGG 3'962'527 0.28 3'576'056 31.12.2012 Investment Advisor
FULLGOAL FUND MANAGE Multiple Portfolios MF-AGG 3'894'134 0.27 1'887'094 31.12.2012 Investment Advisor
CCB PRINCIPAL ASSET Multiple Portfolios MF-AGG 3'766'726 0.26 3'344'574 31.12.2012 Investment Advisor
INVESCO GREAT WALL F Multiple Portfolios MF-AGG 3'714'474 0.26 3'085'209 31.12.2012 Investment Advisor
CHINA MERCHANTS FUND Multiple Portfolios MF-AGG 3'037'735 0.21 2'652'735 31.12.2012 Investment Advisor
BAOYING FUND MANAGEM Multiple Portfolios MF-AGG 2'943'000 0.21 1'131'909 30.06.2013 Investment Advisor
HUASHANG FUND MANAGE Multiple Portfolios MF-AGG 2'702'624 0.19 2'702'624 31.12.2012 Investment Advisor
Firm Name Analyst Recommendation Weighting Change Target Price Date Date
China International Capital Corp CAI HONGYU hold 3 M #N/A N/A Not Provided 01.09.2013
Chang Jiang Securities Co. Limited JUN GE add 4 M #N/A N/A Not Provided 01.09.2013
Founder Securities LIU WEIYUAN neutral 3 M #N/A N/A Not Provided 26.08.2013
SWS Research Co Ltd PEGGY YE neutral 3 M #N/A N/A Not Provided 19.07.2013
Goldman Sachs JEFFERSON ZHANG Sell/Neutral 1 D 19 12 month 07.07.2013
Credit Suisse VINCENT CHAN underperform 1 D 21 Not Provided 03.07.2013
UBS HAOXIANG LIN neutral 3 D 33 12 month 01.07.2013
EVA Dimensions TIMOTHY STANISH underweight 1 M #N/A N/A Not Provided 06.06.2013
Hong Yuan Securities ZHAO LIMING add 4 M #N/A N/A Not Provided 30.03.2013
HuaChuang Securities GAO LI strong buy 5 M #N/A N/A Not Provided 15.12.2012
Central China Securities HE WEIJIANG add 4 N #N/A N/A Not Provided 06.11.2012
Sinolink Securities Co Ltd YANG CHENGXIAO add 4 N #N/A N/A Not Provided 31.10.2012
Citic Securities Co., Ltd SONG XIAOQING overweight 5 M #N/A N/A Not Provided 21.09.2012
PingAn Securities LIANG ZHIGANG strong buy 5 M #N/A N/A Not Provided 21.09.2012
Rising Securities Co.,LTD ZHAO YUE outperform 5 M #N/A N/A Not Provided 17.08.2012
AJ Securities ZHANG ZHIPENG buy 5 M 41 6 month 17.08.2012
China Securities Co., Ltd ZHANG FANG add 4 M 40 Not Provided 25.06.2012
China Merchants Securities WANG XIAODAN buy 5 D #N/A N/A Not Provided 22.06.2012
Everbright Securities Co., Ltd WANG QIANMING accumulate 4 M 38 6 month 06.05.2012
China Minzu Securities Co Ltd GUAN JIANXIN buy 5 M 40 6 month 14.02.2012
Cinda Securities Ltd FAN HAIBO hold 3 M #N/A N/A Not Provided 20.06.2011
Bank of China International LE YUKUN buy 5 M 64 Not Provided 04.03.2011
Holdings By:
Shandong Gold Mining Co Ltd ee
Q.M.S Advisors | tel: +41 (0)78 922 08 77 | e-mail: [email protected] |
Page 144
09.09.2013
China Avic Avionics Equipment Co., Ltd. manufactures and markets a series of
cars, vans, and related parts. The Company also provides after-sale and
consulting services.
Latest Fiscal Year: 12/2012
LTM as of: 06/yy
52-Week High (21.05.2013) 21.96
52-Week Low (30.11.2012) 9.02
Daily Volume
20.25
52-Week High % Change -7.79% Dividend Yield -
52-Week Low % Change 124.62% Beta 1.41
% 52 Week Price Range High/Low 80.83% Equity Float 343.11
Shares Out 13.08.2013 1'759.2 Short Int -
35'623.05 1 Yr Total Return 29.96%
Total Debt 1'628.46 YTD Return 66.45%
Preferred Stock 0.0 Adjusted BETA 1.408
Minority Interest 195.1 Analyst Recs 6
Cash and Equivalents 1'760.33 Consensus Rating 4.500
Enterprise Value 36'015.62
Average Volume 5 Day 7'310'147
600372 CH EQUITY YTD Change - Average Volume 30 Day 5'149'970
600372 CH EQUITY YTD % CHANGE - Average Volume 3 Month 7'238'644
LTM-4Q LTM FY+1 FY+2 FQ+1 FQ+2
31.12.2008 31.12.2009 31.12.2010 31.12.2011 31.12.2012 06/yy 06/yy 12/13 Y 12/14 Y 09/13 Q3 12/13 Q4
2'248.7 1'184.8 3'238.5 3'656.3 4'292.5 3'763.6 4'625.7 6'337.5 7'510.6 1'191.0 2'898.0
0.96x - 4.77x 5.52x 5.01x 23.99x 23.02x - - - -
(89.5) 108.6 626.0 674.8 756.9 0.0 0.0 1'083.7 1'351.7 - -
- - 24.70x 29.93x 28.42x 0.00x 0.00x 33.23x 26.65x - -
(346.2) 25.5 374.1 410.9 469.8 435.1 507.7 675.5 797.8 - -
- - 41.37x 48.48x 44.57x 54.37x 55.60x 56.41x 44.70x - -
EBITDA 756.93 Long-Term Rating Date -
EBIT 579.42 Long-Term Rating -
Operating Margin 13.50% Long-Term Outlook -
Pretax Margin 13.14% Short-Term Rating Date -
Return on Assets 6.16% Short-Term Rating -
Return on Common Equity 11.73%
Return on Capital - EBITDA/Interest Exp. 11.76
Asset Turnover 0.56% (EBITDA-Capex)/Interest Exp. 7.88
Net Debt/EBITDA -
Gross Margin 31.3% Total Debt/EBITDA -
EBITDA Margin -
EBIT Margin 14.0% Total Debt/Equity 35.0%
Net Income Margin 10.9% Total Debt/Capital 25.1%
Asset Turnover 0.56
Current Ratio 1.89 Net Fixed Asset Turnover 2.29
Quick Ratio 1.31 Accounts receivable turnover-days 230.13
Debt to Assets 18.85% Inventory Days 166.86
Tot Debt to Common Equity 34.96% Accounts Payable Turnover Day 147.82
Accounts Receivable Turnover 1.59 Cash Conversion Cycle 232.12
Inventory Turnover 2.19
Fiscal Year Ended
China Avic Electronics Co LtdPrice/Volume
Valuation Analysis
13'479'678.00
Current Price (9/dd/yy) Market Data
Net Income
P/E
Market Capitalization
Average Daily Trading Volume
Relative Stock Price Performance
Total Revenue
TEV/Revenue
EBITDA
TEV/EBITDA
Profitability S&P Issuer Ratings
Credit Ratios
Margin Analysis
Reference
Structure
,
2
-,
-2
.,
.2
o!-. l!-. k!-. a!-. g!-0 c!-0 j!-0 Q!-0 j!-0 g!-0 g!-0 Q!-0 o!-0', F
2', F
-,', F
-2', F
.,', F
.2', F
0,', F
02', F
0.0
500.0
1'000.0
1'500.0
2'000.0
2'500.0
3'000.0
3'500.0
4'000.0
4'500.0
5'000.0
2001 2002 2003 2004 2005 2006 2007 2008 2009 2010 2011 2012
,',,
-,,',,
.,,',,
0,,',,
1,,',,
2,,',,
3,,',,
,-',-'.,-, ,-',4'.,-, ,-',-'.,-- ,-',4'.,-- ,-',-'.,-. ,-',4'.,-. ,-',-'.,-0 ,-',4'.,-0
FReTn/CTrThoT/PolhirTlAlcST/ !Rna /eis FReTn/CTrThoT/PolhirTlAlcST/ !Rna /eis
Q.M.S Advisors | tel: +41 (0)78 922 08 77 | e-mail: [email protected] |
Page 145
09.09.2013
Holder Name Portfolio Name Source Amt Held % Out Latest Chg File Dt Inst Type
AVICHINA INDUSTRY & n/a Co File 760'323'599 43.22 - 31.12.2012 Government
CHINA AVIATION ENGIN n/a Co File 319'254'544 18.15 - 31.12.2012 Government
CHINA AVIATION INDUS n/a Co File 158'090'063 8.99 - 31.12.2012 Government
HANZHONG AVIA INDUST n/a Co File 123'690'611 7.03 - 31.12.2012 Corporation
XJ RONGSHENG YUJIN I n/a Co File 27'288'560 1.55 - 31.12.2012 Other
CHINA LIFE INSURANCE n/a ULT-AGG 19'952'448 1.13 - 31.12.2012 Government
BOHONG SHUJUN TIANJI n/a Co File 15'160'340 0.86 - 31.12.2012 Other
GALAXY ASSET MANAGEM n/a Co File 7'931'560 0.45 - 31.12.2012 Investment Advisor
ZHONGRONG ENHANCE NO n/a Co File 5'368'656 0.31 - 31.12.2012 n/a
SHANGHAI SECURITIES n/a EXCH 4'781'849 0.27 - 19.10.2012 Investment Advisor
XU XIAOAI n/a EXCH 4'317'561 0.25 49'728 18.09.2012 n/a
HARVEST FUND MANAGEM Multiple Portfolios MF-AGG 2'796'318 0.16 (2'686'338) 31.12.2012 Investment Advisor
HUATAI-PINEBRIDGE FU Multiple Portfolios MF-AGG 1'613'837 0.09 (11'394) 31.12.2012 Investment Advisor
EVERBRIGHT PRAMERICA Multiple Portfolios MF-AGG 1'127'003 0.06 1'127'003 31.12.2012 Investment Advisor
GOLDEN EAGLE ASSET M Multiple Portfolios MF-AGG 816'400 0.05 816'400 31.12.2012 Investment Advisor
E FUND MANAGEMENT Multiple Portfolios MF-AGG 794'691 0.05 (5'737) 31.12.2012 Investment Advisor
SOOCHOW ASSET MANAGE Multiple Portfolios MF-AGG 770'403 0.04 (16'488) 31.12.2012 Investment Advisor
CHINA ASSET MANAGEME Multiple Portfolios MF-AGG 677'801 0.04 - 02.09.2013 Investment Advisor
GUOTAI ASSET MANAGEM Multiple Portfolios MF-AGG 578'056 0.03 62'553 31.12.2012 Investment Advisor
CHINA UNIVERSAL ASSE Multiple Portfolios MF-AGG 531'394 0.03 471'851 02.09.2013 Investment Advisor
Firm Name Analyst Recommendation Weighting Change Target Price Date Date
China International Capital Corp JIN ZHANG buy 5 M #N/A N/A Not Provided 23.08.2013
GF Securities Co. Ltd. DONG YAGUANG buy 5 U #N/A N/A Not Provided 22.08.2013
Goldman Sachs RONALD KEUNG neutral/neutral 3 M 17 12 month 12.08.2013
Everbright Securities Co., Ltd LU ZHOU buy 5 M 23 12 month 03.07.2013
PingAn Securities HAITAO ZHU strong buy 5 M #N/A N/A Not Provided 25.06.2013
Sinolink Securities Co Ltd WEI MENG add 4 N 18 Not Provided 11.10.2012
Guodu Securities Co Ltd WEI JING neutral 3 N #N/A N/A Not Provided 01.12.2010
Holdings By:
China Avic Electronics Co Ltd ee
Q.M.S Advisors | tel: +41 (0)78 922 08 77 | e-mail: [email protected] |
Page 146
09.09.2013
Aluminum Corporation of China Limited, also known as Chalco, is a producer of
alumina and primary aluminum in China. The Company refines bauxite into
alumina and smelts aluminato to produce primary aluminum.
Latest Fiscal Year: 12/2010
LTM as of: 06/yy
52-Week High (14.09.2012) 5.42
52-Week Low (25.06.2013) 3.01
Daily Volume
3.46
52-Week High % Change -36.16% Dividend Yield -
52-Week Low % Change 14.95% Beta 1.14
% 52 Week Price Range High/Low 14.11% Equity Float 2'905.17
Shares Out 30.06.2013 9'580.5 Short Int -
41'864.95 1 Yr Total Return -34.10%
Total Debt 106'726.54 YTD Return -32.55%
Preferred Stock 0.0 Adjusted BETA 1.140
Minority Interest 9'963.4 Analyst Recs 9
Cash and Equivalents 9'072.58 Consensus Rating 2.889
Enterprise Value 154'785.95
Average Volume 5 Day 16'541'000
601600 CH EQUITY YTD Change - Average Volume 30 Day 16'816'100
601600 CH EQUITY YTD % CHANGE - Average Volume 3 Month 16'371'790
LTM-4Q LTM FY+1 FY+2 FQ+1 FQ+2
31.12.2008 31.12.2009 31.12.2010 31.12.2011 31.12.2012 06/yy 06/yy 12/13 Y 12/14 Y 09/13 Q3 12/13 Q4
76'728.1 70'268.0 120'994.8 145'514.9 149'478.8 151'289.2 154'078.9 140'207.4 147'590.8 35'794.0 35'433.5
1.58x 3.29x 1.56x 0.97x 1.12x 3.03x 3.58x 1.10x 1.05x - -
7'607.8 3'024.7 9'697.0 9'088.5 1'722.7 0.0 0.0 5'803.3 10'099.7 - -
15.90x 76.49x 19.48x 15.55x 97.54x 0.00x 0.00x 26.67x 15.33x - -
19.5 (4'642.9) 778.0 238.0 (8'233.8) (3'427.9) (5'604.3) (3'239.3) (1'372.3) (843.0) (678.0)
2566.61x - 100.18x 137.08x - 0.00x 0.00x - - - -
EBITDA 1'722.70 Long-Term Rating Date 12.09.2012
EBIT -4'662.46 Long-Term Rating -
Operating Margin -3.12% Long-Term Outlook NEG
Pretax Margin -6.08% Short-Term Rating Date -
Return on Assets -2.93% Short-Term Rating -
Return on Common Equity -12.24%
Return on Capital - EBITDA/Interest Exp. 0.31
Asset Turnover 0.81% (EBITDA-Capex)/Interest Exp. -1.34
Net Debt/EBITDA 52.96
Gross Margin -0.2% Total Debt/EBITDA 58.68
EBITDA Margin 1.2%
EBIT Margin -2.5% Total Debt/Equity 243.6%
Net Income Margin -5.5% Total Debt/Capital 66.5%
Asset Turnover 0.81
Current Ratio 0.58 Net Fixed Asset Turnover 1.54
Quick Ratio 0.14 Accounts receivable turnover-days 17.03
Debt to Assets 60.98% Inventory Days 61.37
Tot Debt to Common Equity 243.62% Accounts Payable Turnover Day 16.57
Accounts Receivable Turnover 21.43 Cash Conversion Cycle 57.05
Inventory Turnover 5.95
Profitability S&P Issuer Ratings
Credit Ratios
Margin Analysis
Reference
Structure
Net Income
P/E
Market Capitalization
Average Daily Trading Volume
Relative Stock Price Performance
Total Revenue
TEV/Revenue
EBITDA
TEV/EBITDA
Fiscal Year Ended
Aluminum Corp of China LtdPrice/Volume
Valuation Analysis
43'548'536.00
Current Price (9/dd/yy) Market Data
,
-
.
0
1
2
3
o!-. l!-. k!-. a!-. g!-0 c!-0 j!-0 Q!-0 j!-0 g!-0 g!-0 Q!-0 o!-0', F
-,', F
.,', F
0,', F
1,', F
2,', F
3,', F
4,', F
5,', F
0.0
20'000.0
40'000.0
60'000.0
80'000.0
100'000.0
120'000.0
140'000.0
160'000.0
2001 2002 2003 2004 2005 2006 2007 2008 2009 2010 2011 2012
,',,
2',,
-,',,
-2',,
.,',,
.2',,
0,',,
02',,
1,',,
12',,
,-',-'.,-, ,-',4'.,-, ,-',-'.,-- ,-',4'.,-- ,-',-'.,-. ,-',4'.,-. ,-',-'.,-0 ,-',4'.,-0
FReTn/CTrThoT/PolhirTlAlcST/ !Rna /eis FReTn/CTrThoT/PolhirTlAlcST/ !Rna /eis
Q.M.S Advisors | tel: +41 (0)78 922 08 77 | e-mail: [email protected] |
Page 147
09.09.2013
Holder Name Portfolio Name Source Amt Held % Out Latest Chg File Dt Inst Type
ALUMINUM CORP OF CHI n/a ULT-AGG 5'214'407'195 54.43 - 31.12.2011 Holding Company
CHINA CINDA ASSET MA n/a Co File 800'759'074 8.36 - 31.12.2011 Government
CHINA CONSTRUCTION B n/a EXCH 660'184'654 6.89 - 21.03.2012 Government
HARVEST FUND MANAGEM Multiple Portfolios MF-AGG 26'841'835 0.28 (14'772'767) 31.12.2012 Investment Advisor
HUATAI-PINEBRIDGE FU Multiple Portfolios MF-AGG 13'284'136 0.14 (2'029'601) 31.12.2012 Investment Advisor
CHINA ASSET MANAGEME Multiple Portfolios MF-AGG 10'729'035 0.11 (26'917'768) 31.12.2012 Investment Advisor
CAISSE DE DEPOT ET P Multiple Portfolios MF-AGG 9'732'441 0.1 - 31.12.2012 Investment Advisor
GTJA ALLIANZ FUND MA Multiple Portfolios MF-AGG 9'229'378 0.1 1'054'772 31.12.2012 Investment Advisor
HUAAN FUND MANAGEMEN Multiple Portfolios MF-AGG 7'234'816 0.08 (887'450) 31.12.2012 Investment Advisor
E FUND MANAGEMENT Multiple Portfolios MF-AGG 7'055'844 0.07 (12'570'202) 31.12.2012 Investment Advisor
CHINA ASSET MANAGEME Multiple Portfolios MF-AGG 5'735'256 0.06 - 02.09.2013 Investment Advisor
CHINA SOUTHERN FUND Multiple Portfolios MF-AGG 4'690'266 0.05 (125'060) 31.12.2012 Investment Advisor
TIANTONG ASSET MANAG Multiple Portfolios MF-AGG 4'195'526 0.04 (402'852) 31.12.2012 Investment Advisor
BANK OF COMMUNICATIO Multiple Portfolios MF-AGG 3'365'399 0.04 (284'317) 31.12.2012 Investment Advisor
ICBC CREDIT SUISSE A Multiple Portfolios MF-AGG 3'260'104 0.03 (261'625) 31.12.2012 Investment Advisor
GUOTAI ASSET MANAGEM Multiple Portfolios MF-AGG 3'239'937 0.03 351'049 31.12.2012 Investment Advisor
CHINA UNIVERSAL ASSE Multiple Portfolios MF-AGG 3'036'988 0.03 (171'134) 02.09.2013 Investment Advisor
DACHENG FUND MANAGME Multiple Portfolios MF-AGG 2'932'652 0.03 (180'300) 31.12.2012 Investment Advisor
RONGTONG FUND MANAGE Multiple Portfolios MF-AGG 2'273'728 0.02 321'500 31.12.2012 Investment Advisor
BOSERA FUND MANAGEME Multiple Portfolios MF-AGG 1'955'099 0.02 (192'944) 31.12.2012 Investment Advisor
Firm Name Analyst Recommendation Weighting Change Target Price Date Date
China International Capital Corp CAI HONGYU neutral 3 D #N/A N/A Not Provided 02.09.2013
JPMorgan DANIEL KANG neutral 3 M 4 3 month 01.09.2013
UBS HAOXIANG LIN neutral 3 M 3 12 month 27.08.2013
Founder Securities LIU WEIYUAN neutral 3 M #N/A N/A Not Provided 26.08.2013
Goldman Sachs JULIAN ZHU Sell/Neutral 1 D 2 12 month 24.07.2013
Masterlink Securities SARAH WANG hold 3 M 5 6 month 11.04.2013
SWS Research Co Ltd ARTHUR WANG neutral 3 M #N/A N/A Not Provided 20.02.2013
Central China Securities HE WEIJIANG add 4 N #N/A N/A Not Provided 02.11.2012
Bank of China International ROBIN TSUI hold 3 M 5 Not Provided 31.10.2012
China Investment Securities YANG GUOPING neutral 3 M #N/A N/A Not Provided 19.04.2012
Industrial Securities RENYUAN LUO neutral 3 M #N/A N/A Not Provided 19.03.2012
Citic Securities Co., Ltd SONG XIAOQING hold 3 M #N/A N/A Not Provided 09.02.2012
HSBC SARAH MAK overweight 5 M 13 Not Provided 15.04.2011
Everbright Securities Co., Ltd WANG QIANMING accumulate 4 N 13 6 month 02.08.2010
Rising Securities Co.,LTD WANG HUACHUN neutral 3 N #N/A N/A Not Provided 02.08.2010
China Minzu Securities Co Ltd TEAM COVERAGE add 4 N #N/A N/A Not Provided 29.03.2010
Holdings By:
Aluminum Corp of China Ltd ee
Q.M.S Advisors | tel: +41 (0)78 922 08 77 | e-mail: [email protected] |
Page 148
09.09.2013
China Fortune Land Development Company Limited conducts property development,
infrastructure investment and management of industrial parks, as well as sales
of building and furnishing materials.
Latest Fiscal Year: 12/2012
LTM as of: 06/yy
52-Week High (16.08.2013) 39.09
52-Week Low (18.09.2012) 16.70
Daily Volume
36.93
52-Week High % Change -5.53% Dividend Yield -
52-Week Low % Change 121.14% Beta 1.16
% 52 Week Price Range High/Low 84.23% Equity Float 220.79
Shares Out 30.06.2013 881.9 Short Int -
32'569.30 1 Yr Total Return 104.31%
Total Debt 7'846.20 YTD Return 31.72%
Preferred Stock 0.0 Adjusted BETA 1.164
Minority Interest 642.2 Analyst Recs 12
Cash and Equivalents 5'556.48 Consensus Rating 4.667
Enterprise Value 37'238.97
Average Volume 5 Day 3'534'716
600340 CH EQUITY YTD Change - Average Volume 30 Day 2'984'292
600340 CH EQUITY YTD % CHANGE - Average Volume 3 Month 3'747'947
LTM-4Q LTM FY+1 FY+2 FQ+1 FQ+2
31.12.2008 31.12.2009 31.12.2010 31.12.2011 31.12.2012 06/yy 06/yy 12/13 Y 12/14 Y 09/13 Q3 12/13 Q4
301.0 182.9 4'097.8 7'331.3 11'292.4 11'308.0 15'349.0 18'105.0 23'521.0 - -
1.82x 10.70x 0.30x 1.32x 2.46x 4.43x 6.81x - - - -
(14.7) 14.5 640.5 1'771.7 2'543.6 0.0 0.0 3'384.0 4'614.0 - -
- 134.60x 1.92x 5.48x 10.94x 0.00x 0.00x 11.00x 8.07x - -
(38.8) 7.5 417.2 1'358.0 1'783.6 2'618.8 2'292.5 2'396.6 3'137.8 - -
- 278.20x 3.04x 6.95x 13.98x 6.09x 12.55x 13.68x 10.60x - -
EBITDA 2'543.59 Long-Term Rating Date -
EBIT 2'497.74 Long-Term Rating -
Operating Margin 22.12% Long-Term Outlook -
Pretax Margin 22.31% Short-Term Rating Date -
Return on Assets 5.12% Short-Term Rating -
Return on Common Equity 47.25%
Return on Capital - EBITDA/Interest Exp. 92.46
Asset Turnover 0.34% (EBITDA-Capex)/Interest Exp. 75.99
Net Debt/EBITDA -
Gross Margin 35.5% Total Debt/EBITDA -
EBITDA Margin -
EBIT Margin 20.9% Total Debt/Equity 181.8%
Net Income Margin 15.8% Total Debt/Capital 61.3%
Asset Turnover 0.34
Current Ratio 1.31 Net Fixed Asset Turnover 15.24
Quick Ratio 0.22 Accounts receivable turnover-days 36.04
Debt to Assets 18.17% Inventory Days 1164.60
Tot Debt to Common Equity 181.77% Accounts Payable Turnover Day 34.93
Accounts Receivable Turnover 10.13 Cash Conversion Cycle 1323.45
Inventory Turnover 0.31
Profitability S&P Issuer Ratings
Credit Ratios
Margin Analysis
Reference
Structure
Net Income
P/E
Market Capitalization
Average Daily Trading Volume
Relative Stock Price Performance
Total Revenue
TEV/Revenue
EBITDA
TEV/EBITDA
Fiscal Year Ended
China Fortune Land Development Co LtdPrice/Volume
Valuation Analysis
5'445'015.00
Current Price (9/dd/yy) Market Data
,
2
-,
-2
.,
.2
0,
02
1,
o!-. l!-. k!-. a!-. g!-0 c!-0 j!-0 Q!-0 j!-0 g!-0 g!-0 Q!-0 o!-0', F
.', F
1', F
3', F
5', F
-,', F
-.', F
-1', F
-3', F
0.0
2'000.0
4'000.0
6'000.0
8'000.0
10'000.0
12'000.0
2001 2002 2003 2004 2005 2006 2007 2008 2009 2010 2011 2012
,',,
-,,',,
.,,',,
0,,',,
1,,',,
2,,',,
3,,',,
,-',-'.,-, ,-',4'.,-, ,-',-'.,-- ,-',4'.,-- ,-',-'.,-. ,-',4'.,-. ,-',-'.,-0 ,-',4'.,-0
FReTn/CTrThoT/PolhirTlAlcST/ !Rna /eis FReTn/CTrThoT/PolhirTlAlcST/ !Rna /eis
Q.M.S Advisors | tel: +41 (0)78 922 08 77 | e-mail: [email protected] |
Page 149
09.09.2013
Holder Name Portfolio Name Source Amt Held % Out Latest Chg File Dt Inst Type
CHINA FORTUNE LAND D n/a Co File 607'457'706 68.88 - 31.12.2012 Corporation
E FUND MANAGEMENT Multiple Portfolios MF-AGG 38'462'762 4.36 18'407'045 31.12.2012 Investment Advisor
HUASHANG FUND MANAGE Multiple Portfolios MF-AGG 26'895'902 3.05 (2'637'198) 30.06.2013 Investment Advisor
CHINA MINSHENG BANKI n/a Co File 24'724'512 2.8 - 31.12.2012 Bank
ZHEJIANG CHUNHUI GRO n/a Co File 17'439'046 1.98 - 31.12.2012 Corporation
ZHEJIANG SHANGFENG I n/a Co File 10'504'413 1.19 - 31.12.2012 Corporation
PING AN LIFE INSURAN n/a Co File 9'324'821 1.06 - 31.12.2012 Insurance Company
CHINA CONSTRUCTION B n/a Co File 9'297'012 1.05 - 31.12.2012 Government
INDUSTRIAL & COMM BA n/a Co File 8'700'000 0.99 - 31.12.2012 Government
BANK OF CHINA LTD n/a Co File 7'730'000 0.88 - 31.12.2012 Government
DINGJI CAPITAL MGMT n/a Co File 6'840'000 0.78 - 31.12.2012 Investment Advisor
AEGON INDUSTRIAL FUN Multiple Portfolios MF-AGG 4'319'235 0.49 3'497'943 31.12.2012 Investment Advisor
HARVEST FUND MANAGEM Multiple Portfolios MF-AGG 4'101'774 0.47 1'308'183 31.12.2012 Investment Advisor
JIASHI FUND MANAGEME Multiple Portfolios MF-AGG 3'290'689 0.37 1'486'080 28.06.2013 Investment Advisor
HFT INVESTMENT MANAG Multiple Portfolios MF-AGG 2'669'641 0.3 (1'175'418) 31.12.2012 Investment Advisor
ZHONG HAI FUND MANAG Multiple Portfolios MF-AGG 2'160'457 0.24 (4'330'876) 31.12.2012 Investment Advisor
CCB PRINCIPAL ASSET Multiple Portfolios MF-AGG 1'986'996 0.23 1'986'996 31.12.2012 Investment Advisor
CHINA SOUTHERN FUND Multiple Portfolios MF-AGG 1'674'153 0.19 (1'207'679) 31.12.2012 Investment Advisor
HUATAI-PINEBRIDGE FU Multiple Portfolios MF-AGG 1'582'602 0.18 16'500 31.12.2012 Investment Advisor
CHINA UNIVERSAL ASSE Multiple Portfolios MF-AGG 1'350'213 0.15 1'245'854 02.09.2013 Investment Advisor
Firm Name Analyst Recommendation Weighting Change Target Price Date Date
PingAn Securities YATING ZHOU buy 5 M 35 6 month 02.09.2013
China Investment Securities LI SHAOMING buy 5 M #N/A N/A Not Provided 02.09.2013
Guotai Junan LI PINKE buy 5 N 43 12 month 27.08.2013
Chang Jiang Securities Co. Limited LIU JUN buy 5 N #N/A N/A Not Provided 27.08.2013
Everbright Securities Co., Ltd ZIPEI TANG accumulate 4 M 30 12 month 18.08.2013
Hong Yuan Securities HONG JUNHUA buy 5 M 40 6 month 25.07.2013
SWS Research Co Ltd SIYI HAN buy 5 M #N/A N/A Not Provided 19.07.2013
Guodu Securities Co Ltd ZHANG WEI buy 5 M #N/A N/A Not Provided 24.06.2013
EVA Dimensions DOUG WALTERS hold 3 M #N/A N/A Not Provided 06.06.2013
Bank of China International TIAN SHIXIN buy 5 M 26 12 month 29.01.2013
Central China Securities WU JIANXIONG add 4 M #N/A N/A Not Provided 17.12.2012
Hua Tai Securities Co., Ltd ZHOU YATING buy 5 N #N/A N/A Not Provided 29.10.2012
HuaChuang Securities GAO LI buy 5 N 24 6 month 15.08.2012
Holdings By:
China Fortune Land Development Co Ltd ee
Q.M.S Advisors | tel: +41 (0)78 922 08 77 | e-mail: [email protected] |
Page 150
09.09.2013
Inner Mongolian Baotou Steel Union Co., Ltd. smelts and processes ferrous metal
products. The Company's products include plates, seamless metal tubes, heavy
tubes, square steel, wire rods, steel pipes, steel scraps, and other related
products.
Latest Fiscal Year: 12/2012
LTM as of: 06/yy
52-Week High (30.10.2012) 6.02
52-Week Low (25.06.2013) 3.67
Daily Volume
3.98
52-Week High % Change -33.89% Dividend Yield -
52-Week Low % Change 8.45% Beta 1.02
% 52 Week Price Range High/Low 11.06% Equity Float 2'950.50
Shares Out 30.06.2013 8'002.6 Short Int -
31'850.31 1 Yr Total Return -23.85%
Total Debt 30'139.69 YTD Return -26.11%
Preferred Stock 0.0 Adjusted BETA 1.023
Minority Interest 189.9 Analyst Recs 3
Cash and Equivalents 5'242.59 Consensus Rating 3.333
Enterprise Value 57'206.38
Average Volume 5 Day 44'373'670
600010 CH EQUITY YTD Change - Average Volume 30 Day 38'919'040
600010 CH EQUITY YTD % CHANGE - Average Volume 3 Month 44'196'600
LTM-4Q LTM FY+1 FY+2 FQ+1 FQ+2
31.12.2008 31.12.2009 31.12.2010 31.12.2011 31.12.2012 06/yy 06/yy 12/13 Y 12/14 Y 09/13 Q3 12/13 Q4
43'953.9 33'778.5 39'926.7 42'631.3 36'769.2 40'041.9 37'315.0 39'543.0 37'198.0 - -
0.62x 1.19x 0.91x 1.01x 1.63x 5.04x 6.21x - - - -
3'842.4 954.3 3'940.4 4'084.4 4'553.6 0.0 0.0 - - - -
7.10x 42.04x 9.24x 10.53x 13.13x 0.00x 0.00x - - - -
920.3 (1'631.2) 298.6 496.3 256.1 388.4 301.1 390.5 450.0 - -
18.14x - 75.80x 51.50x 135.00x 103.61x 99.30x 79.60x 66.33x - -
EBITDA 4'553.65 Long-Term Rating Date -
EBIT 1'322.58 Long-Term Rating -
Operating Margin 3.60% Long-Term Outlook -
Pretax Margin 0.92% Short-Term Rating Date -
Return on Assets 0.44% Short-Term Rating -
Return on Common Equity 1.89%
Return on Capital - EBITDA/Interest Exp. 3.31
Asset Turnover 0.54% (EBITDA-Capex)/Interest Exp. -3.92
Net Debt/EBITDA -
Gross Margin 6.8% Total Debt/EBITDA -
EBITDA Margin -
EBIT Margin 3.4% Total Debt/Equity 232.6%
Net Income Margin 0.7% Total Debt/Capital 69.6%
Asset Turnover 0.54
Current Ratio 0.77 Net Fixed Asset Turnover 1.05
Quick Ratio 0.33 Accounts receivable turnover-days 67.04
Debt to Assets 47.27% Inventory Days 174.97
Tot Debt to Common Equity 232.63% Accounts Payable Turnover Day 163.56
Accounts Receivable Turnover 5.44 Cash Conversion Cycle 102.96
Inventory Turnover 2.09
Fiscal Year Ended
Inner Mongolian Baotou Steel Union Co LtdPrice/Volume
Valuation Analysis
47'167'374.00
Current Price (9/dd/yy) Market Data
Net Income
P/E
Market Capitalization
Average Daily Trading Volume
Relative Stock Price Performance
Total Revenue
TEV/Revenue
EBITDA
TEV/EBITDA
Profitability S&P Issuer Ratings
Credit Ratios
Margin Analysis
Reference
Structure
,
-
.
0
1
2
3
4
o!-. l!-. k!-. a!-. g!-0 c!-0 j!-0 Q!-0 j!-0 g!-0 g!-0 Q!-0 o!-0', F
2,', F
-,,', F
-2,', F
.,,', F
.2,', F
0,,', F
0.0
5'000.0
10'000.0
15'000.0
20'000.0
25'000.0
30'000.0
35'000.0
40'000.0
45'000.0
50'000.0
2001 2002 2003 2004 2005 2006 2007 2008 2009 2010 2011 2012
,',,
.,',,
1,',,
3,',,
5,',,
-,,',,
-.,',,
-1,',,
-3,',,
-5,',,
,-',-'.,-, ,-',4'.,-, ,-',-'.,-- ,-',4'.,-- ,-',-'.,-. ,-',4'.,-. ,-',-'.,-0 ,-',4'.,-0
FReTn/CTrThoT/PolhirTlAlcST/ !Rna /eis FReTn/CTrThoT/PolhirTlAlcST/ !Rna /eis
Q.M.S Advisors | tel: +41 (0)78 922 08 77 | e-mail: [email protected] |
Page 151
09.09.2013
Holder Name Portfolio Name Source Amt Held % Out Latest Chg File Dt Inst Type
BAOTOU IRON AND STEE n/a EXCH 4'062'591'261 50.77 - 30.01.2013 Corporation
BAOTOU IRON&STEE TRU n/a EXCH 239'471'321 2.99 - 30.01.2013 n/a
GUOHUA LIFE INSURANC n/a EXCH 179'394'736 2.24 - 30.01.2013 Insurance Company
CHINA GREAT WALL ASS n/a EXCH 168'045'027 2.1 - 30.01.2013 Government
ICBC CREDIT SUISSE A n/a EXCH 167'833'568 2.1 - 30.01.2013 Investment Advisor
CAITONG FUND MANAGEM n/a EXCH 155'523'314 1.94 - 30.01.2013 Investment Advisor
CITIC SECURITIES CO n/a ULT-AGG 43'841'213 0.55 - 31.12.2012 Investment Advisor
CHANGSHENG FUND MANA Multiple Portfolios MF-AGG 38'417'841 0.48 (12'288'633) 31.12.2012 Investment Advisor
HARVEST FUND MANAGEM Multiple Portfolios MF-AGG 34'423'027 0.43 499'480 31.12.2012 Investment Advisor
CHINA INTERNATIONAL Multiple Portfolios MF-AGG 26'199'923 0.33 (3'407'056) 31.12.2012 Investment Advisor
CHINA CONSTRUCTION B n/a Co File 26'199'923 0.33 - 31.12.2012 Government
CHINA ASSET MANAGEME Multiple Portfolios MF-AGG 24'726'704 0.31 (18'913'219) 31.12.2012 Investment Advisor
HUATAI SECURITIES CO n/a Co File 21'862'976 0.27 - 31.12.2012 Investment Advisor
INDUSTRIAL & COMM BA n/a Co File 20'679'482 0.26 - 31.12.2012 Government
GF SECURITIES CO LTD n/a Co File 20'608'597 0.26 - 31.12.2012 Corporation
BANK OF CHINA LTD n/a Co File 20'365'118 0.25 - 31.12.2012 Government
YINHUA FUND MANAGEME Multiple Portfolios MF-AGG 19'043'239 0.24 (31'406'955) 31.12.2012 Investment Advisor
HAITONG SECURITIES C n/a Co File 16'053'821 0.2 - 31.12.2012 Investment Advisor
HUATAI-PINEBRIDGE FU Multiple Portfolios MF-AGG 14'796'643 0.18 2'999'944 31.12.2012 Investment Advisor
E FUND MANAGEMENT Multiple Portfolios MF-AGG 13'735'774 0.17 10'050'099 31.12.2012 Investment Advisor
Firm Name Analyst Recommendation Weighting Change Target Price Date Date
SWS Research Co Ltd KERRY HE neutral 3 N #N/A N/A Not Provided 22.07.2013
Capital Securities Corp LI XIAOLU neutral 3 M 7 Not Provided 18.04.2013
Qilu Securities Co Ltd DU HUI add 4 M #N/A N/A Not Provided 17.04.2013
Rising Securities Co.,LTD ZHAO YUE outperform 5 M #N/A N/A Not Provided 22.05.2012
Citic Securities Co., Ltd YUJIAO JIANG add 4 M #N/A N/A Not Provided 18.05.2012
Industrial Securities LAN JIE buy 5 M #N/A N/A Not Provided 28.02.2012
China Galaxy Securities SUN YONG buy 5 M #N/A N/A Not Provided 18.05.2010
China Securities Co., Ltd WANG ZHE add 4 U 5 Not Provided 02.12.2009
Holdings By:
Inner Mongolian Baotou Steel Union Co Ltd ee
Q.M.S Advisors | tel: +41 (0)78 922 08 77 | e-mail: [email protected] |
Page 152
09.09.2013
Everbright Securities Co., Ltd. provides securities brokerage, trading, custody,
underwriting, asset management, and investment consulting services.
Latest Fiscal Year: 12/2012
LTM as of: 06/yy
52-Week High (04.02.2013) 16.79
52-Week Low (03.09.2013) 9.05
Daily Volume
9.84
52-Week High % Change -41.39% Dividend Yield -
52-Week Low % Change 8.73% Beta 1.56
% 52 Week Price Range High/Low 1.55% Equity Float 781.43
Shares Out 30.06.2013 3'418.0 Short Int -
33'633.12 1 Yr Total Return -19.19%
Total Debt 10'905.05 YTD Return -29.73%
Preferred Stock 0.0 Adjusted BETA 1.562
Minority Interest 737.1 Analyst Recs 15
Cash and Equivalents 20'663.59 Consensus Rating 3.200
Enterprise Value 17'602.07
Average Volume 5 Day 59'757'970
601788 CH EQUITY YTD Change - Average Volume 30 Day 35'119'600
601788 CH EQUITY YTD % CHANGE - Average Volume 3 Month 30'899'720
LTM-4Q LTM FY+1 FY+2 FQ+1 FQ+2
31.12.2008 31.12.2009 31.12.2010 31.12.2011 31.12.2012 06/yy 06/yy 12/13 Y 12/14 Y 09/13 Q3 12/13 Q4
3'748.0 6'057.0 5'126.1 4'705.9 4'028.8 4'236.4 4'315.7 3'755.4 4'882.2 - -
- 6.99x 3.80x 3.24x 9.72x 23.32x 26.44x - - - -
1'818.5 4'118.6 3'064.2 2'513.3 1'882.6 0.0 0.0 - - - -
- 10.28x 6.36x 6.06x 20.81x 0.00x 0.00x - - - -
1'367.5 2'826.7 2'200.1 1'544.5 1'003.0 1'243.6 984.5 1'457.1 1'929.9 - -
- 27.74x 23.36x 22.67x 48.62x 36.20x 35.15x 25.83x 19.76x - -
EBITDA 1'882.64 Long-Term Rating Date -
EBIT - Long-Term Rating -
Operating Margin 37.11% Long-Term Outlook -
Pretax Margin 33.77% Short-Term Rating Date -
Return on Assets 1.78% Short-Term Rating -
Return on Common Equity 4.48%
Return on Capital 3.57% EBITDA/Interest Exp. -
Asset Turnover 0.08% (EBITDA-Capex)/Interest Exp. -
Net Debt/EBITDA -
Gross Margin - Total Debt/EBITDA -
EBITDA Margin -
EBIT Margin - Total Debt/Equity 49.2%
Net Income Margin 24.9% Total Debt/Capital 32.2%
Asset Turnover 0.08
Current Ratio - Net Fixed Asset Turnover 4.29
Quick Ratio - Accounts receivable turnover-days -
Debt to Assets 18.69% Inventory Days -
Tot Debt to Common Equity 49.18% Accounts Payable Turnover Day -
Accounts Receivable Turnover - Cash Conversion Cycle -
Inventory Turnover -
Fiscal Year Ended
Everbright Securities Co LtdPrice/Volume
Valuation Analysis
121'478'887.00
Current Price (9/dd/yy) Market Data
Net Income
P/E
Market Capitalization
Average Daily Trading Volume
Relative Stock Price Performance
Total Revenue
TEV/Revenue
EBITDA
TEV/EBITDA
Profitability S&P Issuer Ratings
Credit Ratios
Margin Analysis
Reference
Structure
,.135
-,-.-1-3-5
o!-. l!-. k!-. a!-. g!-0 c!-0 j!-0 Q!-0 j!-0 g!-0 g!-0 Q!-0 o!-0', F
.,', F
1,', F
3,', F
5,', F
-,,', F
-.,', F
-1,', F
-3,', F
0.0
2'000.0
4'000.0
6'000.0
8'000.0
10'000.0
12'000.0
2001 2002 2003 2004 2005 2006 2007 2008 2009 2010 2011 2012
,',,
2',,
-,',,
-2',,
.,',,
.2',,
0,',,
,-',-'.,-, ,-',4'.,-, ,-',-'.,-- ,-',4'.,-- ,-',-'.,-. ,-',4'.,-. ,-',-'.,-0 ,-',4'.,-0
FReTn/CTrThoT/PolhirTlAlcST/ !Rna /eis FReTn/CTrThoT/PolhirTlAlcST/ !Rna /eis
Q.M.S Advisors | tel: +41 (0)78 922 08 77 | e-mail: [email protected] |
Page 153
09.09.2013
Holder Name Portfolio Name Source Amt Held % Out Latest Chg File Dt Inst Type
CHINA EVERBRIGHT GRO n/a Co File 1'159'456'183 33.92 - 31.12.2012 Corporation
CHINA EVERBRIGHT LTD n/a Co File 1'139'250'000 33.33 - 31.12.2012 Holding Company
JIAYUGUAN HONGFENG I n/a Co File 128'000'000 3.74 - 31.12.2012 Corporation
XIAMEN XINSHIJI GROU n/a Co File 60'300'000 1.76 - 31.12.2012 Corporation
YIYANG GROUP CO LTD n/a Co File 40'000'000 1.17 - 31.12.2012 Corporation
DAZHONG TRANSPORTATI n/a Co File 34'000'000 0.99 - 31.12.2012 Corporation
HONGCHENG BLDG GROUP n/a Co File 23'484'847 0.69 - 31.12.2012 Corporation
CHINA ASSET MANAGEME Multiple Portfolios MF-AGG 23'481'050 0.69 (15'255'701) 31.12.2012 Investment Advisor
HUAXIA DONGS BROTHER n/a Co File 19'000'000 0.56 - 31.12.2012 Corporation
CHINA LIFE INSURANCE n/a Co File 16'862'744 0.49 - 31.12.2012 Government
PICC PROPERTY & CASU n/a Co File 16'218'593 0.47 - 31.12.2012 Government
CHINA INTERNATIONAL Multiple Portfolios MF-AGG 15'941'747 0.47 8'032'167 31.12.2012 Investment Advisor
YINHUA FUND MANAGEME Multiple Portfolios MF-AGG 15'457'257 0.45 (4'412'257) 31.12.2012 Investment Advisor
AEGON INDUSTRIAL FUN Multiple Portfolios MF-AGG 14'635'765 0.43 8'976'045 31.12.2012 Investment Advisor
CHANGSHENG FUND MANA Multiple Portfolios MF-AGG 12'110'783 0.35 (1'152'776) 31.12.2012 Investment Advisor
HARVEST FUND MANAGEM Multiple Portfolios MF-AGG 10'873'577 0.32 (7'182'900) 31.12.2012 Investment Advisor
HUATAI-PINEBRIDGE FU Multiple Portfolios MF-AGG 9'227'758 0.27 (1'335'426) 31.12.2012 Investment Advisor
ABN AMRO TEDA FUND M Multiple Portfolios MF-AGG 8'964'120 0.26 7'464'210 31.12.2012 Investment Advisor
ZHONG HAI FUND MANAG Multiple Portfolios MF-AGG 8'118'816 0.24 7'287'595 31.12.2012 Investment Advisor
LION FUND MANAGEMENT Multiple Portfolios MF-AGG 8'097'470 0.24 3'362'665 31.12.2012 Investment Advisor
Firm Name Analyst Recommendation Weighting Change Target Price Date Date
Chang Jiang Securities Co. Limited LIU JUN neutral 3 M #N/A N/A Not Provided 02.09.2013
Sinolink Securities Co Ltd JIANGANG CHEN neutral 3 D #N/A N/A Not Provided 26.08.2013
Tebon Securities Co Ltd LEI ZHANG neutral 3 M #N/A N/A Not Provided 26.08.2013
GF Securities Co. Ltd. CONG LI hold 3 N #N/A N/A Not Provided 23.08.2013
China International Capital Corp JIE HUANG hold 3 M #N/A N/A Not Provided 23.08.2013
Guotai Junan ZHAO XIANGHUAI neutral 3 D 10 12 month 23.08.2013
Everbright Securities Co., Ltd ZIPEI TANG accumulate 4 M 12 12 month 06.08.2013
SWS Research Co Ltd SUSIE WANG neutral 3 D #N/A N/A Not Provided 17.07.2013
Goldman Sachs NING MA Sell/Neutral 1 M 10 12 month 24.06.2013
EVA Dimensions DOUG WALTERS sell 1 M #N/A N/A Not Provided 06.06.2013
Northeast Securities Co Ltd XINAN ZHAO add 4 M #N/A N/A Not Provided 22.04.2013
PingAn Securities WU JIE buy 5 M #N/A N/A Not Provided 15.04.2013
Citic Securities Co., Ltd PAN HONGWEN overweight 5 U 17 6 month 15.03.2013
Bank of China International JINHUA YIN hold 3 N 15 12 month 29.01.2013
Hong Yuan Securities HUANG LIJUN add 4 M #N/A N/A Not Provided 30.11.2012
Guodu Securities Co Ltd DENG TING buy 5 M #N/A N/A Not Provided 03.08.2012
Capital Securities Corp TEAM COVERAGE buy 5 M #N/A N/A Not Provided 01.08.2012
China Minzu Securities Co Ltd SONG JIAN add 4 U #N/A N/A Not Provided 01.08.2012
China Merchants Securities HONG JINPING strong buy 5 M 15 6 month 12.07.2012
Industrial Securities ZHANG YING buy 5 U #N/A N/A Not Provided 22.03.2012
Founder Securities WEI ZHOU add 4 N #N/A N/A Not Provided 29.02.2012
Central China Securities XIE PEIJIE add 4 U #N/A N/A Not Provided 25.04.2011
China Investment Securities CHEN JIANTAO buy 5 M #N/A N/A Not Provided 21.07.2010
Holdings By:
Everbright Securities Co Ltd ee
Q.M.S Advisors | tel: +41 (0)78 922 08 77 | e-mail: [email protected] |
Page 154
09.09.2013
Yanzhou Coal Mining Company Limited operates underground mining and coal
preparation and operation businesses. Its products are sold in domestic and
international markets. The Company also provides railway transportation
services.
Latest Fiscal Year: 12/2011
LTM as of: 06/yy
52-Week High (05.02.2013) 20.18
52-Week Low (09.07.2013) 8.76
Daily Volume
10.5
52-Week High % Change -47.97% Dividend Yield 3.43
52-Week Low % Change 19.86% Beta 1.39
% 52 Week Price Range High/Low 13.40% Equity Float 359.98
Shares Out 06.09.2013 2'960.0 Short Int -
42'317.75 1 Yr Total Return -41.05%
Total Debt 44'901.53 YTD Return -40.47%
Preferred Stock 0.0 Adjusted BETA 1.393
Minority Interest 3'264.8 Analyst Recs 17
Cash and Equivalents 15'904.32 Consensus Rating 3.235
Enterprise Value 81'677.38
Average Volume 5 Day 7'232'182
600188 CH EQUITY YTD Change - Average Volume 30 Day 11'670'180
600188 CH EQUITY YTD % CHANGE - Average Volume 3 Month 10'825'140
LTM-4Q LTM FY+1 FY+2 FQ+1 FQ+2
31.12.2008 31.12.2009 31.12.2010 31.12.2011 31.12.2012 06/yy 06/yy 12/13 Y 12/14 Y 09/13 Q3 12/13 Q4
25'956.7 20'677.1 33'944.3 49'170.7 58'146.2 57'044.8 56'090.1 53'018.6 57'198.4 13'778.0 14'405.0
0.97x 5.26x 3.33x 2.28x 1.83x 5.76x 5.59x 1.49x 1.33x - -
10'119.3 7'221.7 10'248.0 15'539.0 9'713.9 0.0 0.0 7'164.8 8'858.4 - -
2.50x 15.06x 11.02x 7.22x 10.96x 0.00x 0.00x 11.40x 9.22x - -
6'324.0 4'117.3 9'281.4 8'530.2 6'219.0 8'374.1 (1'787.3) (714.3) 1'810.8 - -
3.90x 17.99x 10.65x 7.75x 8.18x 5.76x 0.00x - 23.23x - -
EBITDA 9'713.88 Long-Term Rating Date 24.07.2013
EBIT 5'698.52 Long-Term Rating BBB- *-
Operating Margin 9.80% Long-Term Outlook -
Pretax Margin 10.91% Short-Term Rating Date -
Return on Assets -0.93% Short-Term Rating -
Return on Common Equity -2.64%
Return on Capital - EBITDA/Interest Exp. 6.29
Asset Turnover 0.46% (EBITDA-Capex)/Interest Exp. 2.26
Net Debt/EBITDA 4.61
Gross Margin 22.0% Total Debt/EBITDA 5.96
EBITDA Margin 13.7%
EBIT Margin 5.7% Total Debt/Equity 98.0%
Net Income Margin 10.7% Total Debt/Capital 47.8%
Asset Turnover 0.46
Current Ratio 1.06 Net Fixed Asset Turnover 1.42
Quick Ratio 0.82 Accounts receivable turnover-days 26.58
Debt to Assets 36.59% Inventory Days 14.51
Tot Debt to Common Equity 97.98% Accounts Payable Turnover Day 19.19
Accounts Receivable Turnover 13.73 Cash Conversion Cycle 40.55
Inventory Turnover 25.15
Profitability S&P Issuer Ratings
Credit Ratios
Margin Analysis
Reference
Structure
Net Income
P/E
Market Capitalization
Average Daily Trading Volume
Relative Stock Price Performance
Total Revenue
TEV/Revenue
EBITDA
TEV/EBITDA
Fiscal Year Ended
Yanzhou Coal Mining Co LtdPrice/Volume
Valuation Analysis
8'023'780.00
Current Price (9/dd/yy) Market Data
,
2
-,
-2
.,
.2
o!-. l!-. k!-. a!-. g!-0 c!-0 j!-0 Q!-0 j!-0 g!-0 g!-0 Q!-0 o!-0', F2', F-,', F-2', F.,', F.2', F0,', F02', F1,', F12', F
0.0
10'000.0
20'000.0
30'000.0
40'000.0
50'000.0
60'000.0
70'000.0
2001 2002 2003 2004 2005 2006 2007 2008 2009 2010 2011 2012
,',,
2',,
-,',,
-2',,
.,',,
.2',,
0,',,
02',,
,-',-'.,-, ,-',4'.,-, ,-',-'.,-- ,-',4'.,-- ,-',-'.,-. ,-',4'.,-. ,-',-'.,-0 ,-',4'.,-0
FReTn/CTrThoT/PolhirTlAlcST/ !Rna /eis FReTn/CTrThoT/PolhirTlAlcST/ !Rna /eis
Q.M.S Advisors | tel: +41 (0)78 922 08 77 | e-mail: [email protected] |
Page 155
09.09.2013
Holder Name Portfolio Name Source Amt Held % Out Latest Chg File Dt Inst Type
YANKUANG GROUP CO LT n/a Co File 2'600'000'000 87.84 - 31.12.2012 Government
CHINA ASSET MANAGEME Multiple Portfolios MF-AGG 6'711'232 0.23 (1'806'156) 31.12.2012 Investment Advisor
YINHUA FUND MANAGEME Multiple Portfolios MF-AGG 5'644'868 0.19 (6'980'629) 31.12.2012 Investment Advisor
HARVEST FUND MANAGEM Multiple Portfolios MF-AGG 5'002'060 0.17 (3'310'877) 31.12.2012 Investment Advisor
CAISSE DE DEPOT ET P Multiple Portfolios MF-AGG 4'710'160 0.16 - 31.12.2012 Investment Advisor
HUATAI-PINEBRIDGE FU Multiple Portfolios MF-AGG 2'727'895 0.09 - 31.12.2012 Investment Advisor
GTJA ALLIANZ FUND MA Multiple Portfolios MF-AGG 1'900'713 0.06 211'549 31.12.2012 Investment Advisor
HUAAN FUND MANAGEMEN Multiple Portfolios MF-AGG 1'473'009 0.05 (305'542) 31.12.2012 Investment Advisor
SOOCHOW ASSET MANAGE Multiple Portfolios MF-AGG 1'467'276 0.05 (4'607'371) 31.12.2012 Investment Advisor
CHINA ASSET MANAGEME Multiple Portfolios MF-AGG 1'181'626 0.04 - 02.09.2013 Investment Advisor
E FUND MANAGEMENT Multiple Portfolios MF-AGG 897'727 0.03 (3'175'827) 31.12.2012 Investment Advisor
CHINA UNIVERSAL ASSE Multiple Portfolios MF-AGG 893'884 0.03 (47'846) 02.09.2013 Investment Advisor
TIANTONG ASSET MANAG Multiple Portfolios MF-AGG 879'597 0.03 (249'562) 31.12.2012 Investment Advisor
BANK OF COMMUNICATIO Multiple Portfolios MF-AGG 689'448 0.02 (55'046) 31.12.2012 Investment Advisor
GUOTAI ASSET MANAGEM Multiple Portfolios MF-AGG 677'551 0.02 74'216 31.12.2012 Investment Advisor
DACHENG FUND MANAGME Multiple Portfolios MF-AGG 667'178 0.02 (55'800) 31.12.2012 Investment Advisor
FORTUNE SGAM FUND MA Multiple Portfolios MF-AGG 611'911 0.02 (86'114) 31.12.2012 Investment Advisor
FULLGOAL FUND MANAGE Multiple Portfolios MF-AGG 484'637 0.02 (4'077'690) 31.12.2012 Investment Advisor
ICBC CREDIT SUISSE A Multiple Portfolios MF-AGG 403'070 0.01 (39'500) 31.12.2012 Investment Advisor
BOSERA FUND MANAGEME Multiple Portfolios MF-AGG 403'017 0.01 - 31.12.2012 Investment Advisor
Firm Name Analyst Recommendation Weighting Change Target Price Date Date
GF Securities Co. Ltd. AN PENG add 4 M 12 12 month 03.09.2013
Bank of China International LAWRENCE LAU hold 3 M 5 Not Provided 21.08.2013
Central China Securities ZHILEI WANG add 4 M #N/A N/A Not Provided 21.08.2013
JPMorgan DANIEL KANG underweight 1 M 8 3 month 20.08.2013
China International Capital Corp CAI HONGYU reduce 2 D #N/A N/A Not Provided 20.08.2013
Qilu Securities Co Ltd ZHAOLIANG LIU add 4 U #N/A N/A Not Provided 19.08.2013
UBS MICK MI sell 1 M 6 12 month 23.07.2013
Capital Securities Corp TEAM COVERAGE neutral 3 M #N/A N/A Not Provided 18.07.2013
Goldman Sachs JULIAN ZHU Sell/Neutral 1 M 8 12 month 08.07.2013
Masterlink Securities LI XIN hold 3 M 16 Not Provided 21.05.2013
SWS Research Co Ltd LIU XIAONING outperform 5 M #N/A N/A Not Provided 26.04.2013
Hong Yuan Securities WANG JINGLE add 4 M #N/A N/A Not Provided 16.04.2013
Guodu Securities Co Ltd WANG SHUBAO buy 5 M #N/A N/A Not Provided 09.04.2013
Guotai Junan YIN XILONG add 4 M 20 12 month 29.03.2013
China Minzu Securities Co Ltd LI JING add 4 M 20 6 month 29.03.2013
Founder Securities SUN CAN add 4 M 44 12 month 05.02.2013
Rising Securities Co.,LTD XU HAIYANG neutral 3 M #N/A N/A Not Provided 20.11.2012
HuaChuang Securities HAN ZHENGUO buy 5 D #N/A N/A Not Provided 03.09.2012
Hua Tai Securities Co., Ltd TANG ZONGCHEN add 4 N #N/A N/A Not Provided 28.08.2012
AJ Securities WANG SIWEI neutral 3 D #N/A N/A Not Provided 28.06.2012
Citic Securities Co., Ltd LUO ZETING buy 5 M 35 6 month 27.06.2012
PingAn Securities SHUN ZHANG strong buy 5 M 40 6 month 10.04.2012
Great Wall Securities LIU FEI buy 5 M #N/A N/A Not Provided 28.03.2012
HSBC SARAH MAK neutral 3 M 28 Not Provided 26.03.2012
Industrial Securities LIU JIANGANG strong buy 5 M #N/A N/A Not Provided 26.03.2012
Tebon Securities Co Ltd LI XIANGFENG outperform 5 M #N/A N/A Not Provided 13.02.2012
Northeast Securities Co Ltd WANG SHI buy 5 M #N/A N/A Not Provided 01.02.2012
China Merchants Securities LU PING strong buy 5 M 38 6 month 23.08.2011
China Investment Securities XIAO HANPING neutral 3 D #N/A N/A Not Provided 04.08.2010
China Galaxy Securities ZHAO KE neutral 3 N 11 Not Provided 19.03.2009
Holdings By:
Yanzhou Coal Mining Co Ltd ee
Q.M.S Advisors | tel: +41 (0)78 922 08 77 | e-mail: [email protected] |
Page 156
09.09.2013
Zhongjin Gold Co., Ltd. acquires, explores and develops properties for gold
production. The Company's products also include silver, electrolytic copper and
sulphuric acid.
Latest Fiscal Year: 12/2012
LTM as of: 06/yy
52-Week High (21.09.2012) 18.50
52-Week Low (25.06.2013) 8.85
Daily Volume
10.68
52-Week High % Change -42.27% Dividend Yield -
52-Week Low % Change 20.68% Beta 1.19
% 52 Week Price Range High/Low 17.41% Equity Float 1'349.04
Shares Out 30.06.2013 2'943.2 Short Int -
31'433.68 1 Yr Total Return -29.62%
Total Debt 3'824.26 YTD Return -34.70%
Preferred Stock 0.0 Adjusted BETA 1.191
Minority Interest 1'992.9 Analyst Recs 17
Cash and Equivalents 2'228.59 Consensus Rating 3.824
Enterprise Value 36'740.37
Average Volume 5 Day 31'216'180
600489 CH EQUITY YTD Change - Average Volume 30 Day 26'862'630
600489 CH EQUITY YTD % CHANGE - Average Volume 3 Month 21'938'320
LTM-4Q LTM FY+1 FY+2 FQ+1 FQ+2
31.12.2008 31.12.2009 31.12.2010 31.12.2011 31.12.2012 06/yy 06/yy 12/13 Y 12/14 Y 09/13 Q3 12/13 Q4
15'191.5 18'681.2 21'831.0 33'142.3 35'980.5 36'630.5 35'056.9 35'411.7 35'757.4 8'473.5 12'179.0
0.98x 2.69x 2.83x 1.12x 1.46x 4.75x 5.38x 1.02x 1.02x - -
1'440.2 1'622.3 2'929.0 4'124.8 3'967.0 0.0 0.0 3'210.8 3'120.3 - -
10.37x 30.98x 21.11x 9.03x 13.24x 0.00x 0.00x 11.44x 11.77x - -
585.3 521.4 1'203.1 1'847.3 1'557.4 1'821.0 1'312.6 1'179.2 1'160.2 366.0 342.0
22.57x 88.30x 47.72x 27.36x 31.38x 22.97x 20.88x 26.24x 22.77x 22.58x 21.49x
EBITDA 3'967.03 Long-Term Rating Date -
EBIT 3'036.86 Long-Term Rating -
Operating Margin 8.44% Long-Term Outlook -
Pretax Margin 8.01% Short-Term Rating Date -
Return on Assets 5.98% Short-Term Rating -
Return on Common Equity 13.50%
Return on Capital - EBITDA/Interest Exp. 13.79
Asset Turnover 1.60% (EBITDA-Capex)/Interest Exp. 8.19
Net Debt/EBITDA -
Gross Margin 12.9% Total Debt/EBITDA -
EBITDA Margin -
EBIT Margin 7.5% Total Debt/Equity 38.0%
Net Income Margin 4.3% Total Debt/Capital 24.1%
Asset Turnover 1.60
Current Ratio 1.21 Net Fixed Asset Turnover 4.11
Quick Ratio 0.41 Accounts receivable turnover-days 5.60
Debt to Assets 17.79% Inventory Days 41.47
Tot Debt to Common Equity 38.05% Accounts Payable Turnover Day 17.08
Accounts Receivable Turnover 65.17 Cash Conversion Cycle 27.52
Inventory Turnover 8.80
Profitability S&P Issuer Ratings
Credit Ratios
Margin Analysis
Reference
Structure
Net Income
P/E
Market Capitalization
Average Daily Trading Volume
Relative Stock Price Performance
Total Revenue
TEV/Revenue
EBITDA
TEV/EBITDA
Fiscal Year Ended
Zhongjin Gold Co LtdPrice/Volume
Valuation Analysis
33'742'489.00
Current Price (9/dd/yy) Market Data
,.135
-,-.-1-3-5.,
o!-. l!-. k!-. a!-. g!-0 c!-0 j!-0 Q!-0 j!-0 g!-0 g!-0 Q!-0 o!-0', F-,', F.,', F0,', F1,', F2,', F3,', F4,', F5,', F6,', F-,,', F
0.0
5'000.0
10'000.0
15'000.0
20'000.0
25'000.0
30'000.0
35'000.0
40'000.0
2001 2002 2003 2004 2005 2006 2007 2008 2009 2010 2011 2012
,',,
-,',,
.,',,
0,',,
1,',,
2,',,
3,',,
4,',,
,-',-'.,-, ,-',4'.,-, ,-',-'.,-- ,-',4'.,-- ,-',-'.,-. ,-',4'.,-. ,-',-'.,-0 ,-',4'.,-0
FReTn/CTrThoT/PolhirTlAlcST/ !Rna /eis FReTn/CTrThoT/PolhirTlAlcST/ !Rna /eis
Q.M.S Advisors | tel: +41 (0)78 922 08 77 | e-mail: [email protected] |
Page 157
09.09.2013
Holder Name Portfolio Name Source Amt Held % Out Latest Chg File Dt Inst Type
CHINA GOLD GROUP CO n/a Co File 1'471'888'685 50.01 - 31.12.2012 Government
PICC PROPERTY & CASU n/a Co File 34'263'528 1.16 - 31.12.2012 Government
CCB INTERNATIONAL AS n/a Co File 30'000'000 1.02 - 31.12.2012 Investment Advisor
CH LIFE ASSETS MGMT n/a EXCH 30'000'000 1.02 - 12.08.2011 Insurance Company
CHINA LIFE INSURANCE n/a ULT-AGG 26'702'248 0.91 - 31.12.2012 Government
CITIC SECURITIES CO n/a ULT-AGG 24'161'696 0.82 - 31.12.2012 Investment Advisor
NB QINGCHUN INVEST C n/a Co File 23'401'080 0.8 - 31.12.2012 Investment Advisor
CHINA SOUTHERN FUND Multiple Portfolios MF-AGG 22'658'712 0.77 (2'594'382) 30.06.2013 Investment Advisor
GUOTAI ASSETS MGMT C n/a EXCH 22'500'000 0.76 - 12.08.2011 n/a
PICC ASSETS MGMT CO n/a EXCH 22'500'000 0.76 - 12.08.2011 Government
PICC LIFE INSURANCE n/a Co File 20'197'500 0.69 - 31.12.2012 Government
CHINA SOUTH LONG YUA n/a EXCH 19'222'968 0.65 - 12.08.2011 n/a
SH TONGHUI INDUST CO n/a Co File 17'300'762 0.59 - 31.12.2012 Corporation
CHINA ASSET MANAGEME Multiple Portfolios MF-AGG 14'224'788 0.48 (11'350'883) 31.12.2012 Investment Advisor
YINHUA FUND MANAGEME Multiple Portfolios MF-AGG 13'980'739 0.48 (3'749'946) 31.12.2012 Investment Advisor
HARVEST FUND MANAGEM Multiple Portfolios MF-AGG 11'990'458 0.41 (10'589'981) 31.12.2012 Investment Advisor
GF FUND MANAGEMENT C Multiple Portfolios MF-AGG 9'211'761 0.31 7'362'288 31.12.2012 Investment Advisor
HUATAI-PINEBRIDGE FU Multiple Portfolios MF-AGG 8'961'024 0.3 2'199'979 31.12.2012 Investment Advisor
GUOTAI ASSET MANAGEM Multiple Portfolios MF-AGG 7'600'038 0.26 (9'856'260) 31.12.2012 Investment Advisor
BAOYING FUND MANAGEM Multiple Portfolios MF-AGG 6'623'682 0.23 3'004'925 30.06.2013 Investment Advisor
Firm Name Analyst Recommendation Weighting Change Target Price Date Date
GF Securities Co. Ltd. GUOXIAN JU buy 5 M #N/A N/A Not Provided 28.08.2013
Credit Suisse VINCENT CHAN neutral 3 M 8 Not Provided 26.08.2013
Founder Securities LIU WEIYUAN add 4 M #N/A N/A Not Provided 26.08.2013
UBS HAOXIANG LIN buy 5 M 12 12 month 23.08.2013
China International Capital Corp CAI HONGYU hold 3 M #N/A N/A Not Provided 23.08.2013
Fortune CLSA Securities Limited JIE LI underperform 1 M 10 12 month 23.08.2013
Chang Jiang Securities Co. Limited JUN GE add 4 M #N/A N/A Not Provided 22.08.2013
SWS Research Co Ltd PEGGY YE neutral 3 M #N/A N/A Not Provided 19.07.2013
Goldman Sachs JEFFERSON ZHANG neutral/neutral 3 M 8 12 month 07.07.2013
Hong Yuan Securities MIN DAN add 4 M #N/A N/A Not Provided 02.05.2013
Northeast Securities Co Ltd CHEN BINGHUI neutral 3 D #N/A N/A Not Provided 02.05.2013
Guotai Junan YONGLIANG SANG add 4 M 13 12 month 26.04.2013
Sinolink Securities Co Ltd YANG CHENGXIAO add 4 M #N/A N/A Not Provided 21.01.2013
HuaChuang Securities GAO LI strong buy 5 U #N/A N/A Not Provided 14.12.2012
Central China Securities HE WEIJIANG add 4 N #N/A N/A Not Provided 06.11.2012
Tebon Securities Co Ltd CAI PEIPEI buy 5 M #N/A N/A Not Provided 20.10.2012
Citic Securities Co., Ltd SONG XIAOQING overweight 5 M #N/A N/A Not Provided 21.09.2012
AJ Securities ZHANG ZHIPENG buy 5 D 21 6 month 29.08.2012
China Securities Co., Ltd ZHANG FANG add 4 M 19 Not Provided 25.06.2012
China Merchants Securities WANG XIAODAN buy 5 D #N/A N/A Not Provided 22.06.2012
Rising Securities Co.,LTD ZHAO YUE outperform 5 M #N/A N/A Not Provided 18.06.2012
Everbright Securities Co., Ltd WANG QIANMING accumulate 4 M 17 6 month 06.05.2012
China Investment Securities YANG GUOPING buy 5 M #N/A N/A Not Provided 19.04.2012
China Minzu Securities Co Ltd GUAN JIANXIN buy 5 M 19 6 month 14.02.2012
Cinda Securities Ltd FAN HAIBO hold 3 M #N/A N/A Not Provided 20.06.2011
Masterlink Securities SARAH WANG buy 5 M 21 6 month 13.05.2011
Holdings By:
Zhongjin Gold Co Ltd ee
Q.M.S Advisors | tel: +41 (0)78 922 08 77 | e-mail: [email protected] |
Page 158
09.09.2013
Shanxi Lu'an Environmental Energy Development Co., Ltd. mines, processes, and
markets low sulfur high quality coal. The company also researches and develops
coal and environment protection related technologies.
Latest Fiscal Year: 12/2012
LTM as of: 06/yy
52-Week High (05.02.2013) 25.51
52-Week Low (09.07.2013) 10.75
Daily Volume
13.42
52-Week High % Change -47.39% Dividend Yield -
52-Week Low % Change 24.84% Beta 1.68
% 52 Week Price Range High/Low 15.58% Equity Float 749.48
Shares Out 30.06.2013 2'301.1 Short Int -
30'880.55 1 Yr Total Return -22.34%
Total Debt 9'182.53 YTD Return -36.92%
Preferred Stock 0.0 Adjusted BETA 1.679
Minority Interest 549.4 Analyst Recs 21
Cash and Equivalents 6'672.79 Consensus Rating 4.381
Enterprise Value 35'285.14
Average Volume 5 Day 13'978'200
601699 CH EQUITY YTD Change - Average Volume 30 Day 24'216'920
601699 CH EQUITY YTD % CHANGE - Average Volume 3 Month 20'666'800
LTM-4Q LTM FY+1 FY+2 FQ+1 FQ+2
31.12.2008 31.12.2009 31.12.2010 31.12.2011 31.12.2012 06/yy 06/yy 12/13 Y 12/14 Y 09/13 Q3 12/13 Q4
16'539.3 18'081.3 21'211.5 22'111.4 19'798.2 21'302.0 19'113.0 20'207.5 23'400.9 5'312.0 5'899.0
0.87x 3.31x 3.24x 2.20x 2.70x 10.42x 9.11x 1.74x 1.47x - -
4'304.7 4'450.4 6'455.7 7'423.9 6'438.5 0.0 0.0 6'097.6 6'941.6 - -
3.34x 13.46x 10.64x 6.55x 8.30x 0.00x 0.00x 5.79x 5.08x - -
2'100.9 2'109.0 3'436.7 3'835.9 2'566.5 3'685.2 1'682.9 2'138.5 2'342.2 643.0 827.0
6.83x 28.25x 19.97x 12.67x 19.54x 12.97x 16.42x 13.71x 12.50x 10.09x 9.72x
EBITDA 6'438.45 Long-Term Rating Date -
EBIT 3'417.55 Long-Term Rating -
Operating Margin 17.26% Long-Term Outlook -
Pretax Margin 15.18% Short-Term Rating Date -
Return on Assets 4.33% Short-Term Rating -
Return on Common Equity 10.07%
Return on Capital - EBITDA/Interest Exp. 10.46
Asset Turnover 0.49% (EBITDA-Capex)/Interest Exp. 2.72
Net Debt/EBITDA -
Gross Margin 40.2% Total Debt/EBITDA -
EBITDA Margin -
EBIT Margin 12.2% Total Debt/Equity 57.3%
Net Income Margin 13.0% Total Debt/Capital 35.7%
Asset Turnover 0.49
Current Ratio 0.96 Net Fixed Asset Turnover 1.59
Quick Ratio 0.89 Accounts receivable turnover-days 152.86
Debt to Assets 23.18% Inventory Days 30.28
Tot Debt to Common Equity 57.32% Accounts Payable Turnover Day 156.83
Accounts Receivable Turnover 2.39 Cash Conversion Cycle -21.96
Inventory Turnover 12.06
Fiscal Year Ended
Shanxi Lu'an Environmental Energy Development Co LtdPrice/Volume
Valuation Analysis
22'972'835.00
Current Price (9/dd/yy) Market Data
Net Income
P/E
Market Capitalization
Average Daily Trading Volume
Relative Stock Price Performance
Total Revenue
TEV/Revenue
EBITDA
TEV/EBITDA
Profitability S&P Issuer Ratings
Credit Ratios
Margin Analysis
Reference
Structure
,
2
-,
-2
.,
.2
0,
o!-. l!-. k!-. a!-. g!-0 c!-0 j!-0 Q!-0 j!-0 g!-0 g!-0 Q!-0 o!-0', F
-,', F
.,', F
0,', F
1,', F
2,', F
3,', F
4,', F
0.0
5'000.0
10'000.0
15'000.0
20'000.0
25'000.0
2001 2002 2003 2004 2005 2006 2007 2008 2009 2010 2011 2012
,',,
2',,
-,',,
-2',,
.,',,
.2',,
,-',-'.,-, ,-',4'.,-, ,-',-'.,-- ,-',4'.,-- ,-',-'.,-. ,-',4'.,-. ,-',-'.,-0 ,-',4'.,-0
FReTn/CTrThoT/PolhirTlAlcST/ !Rna /eis FReTn/CTrThoT/PolhirTlAlcST/ !Rna /eis
Q.M.S Advisors | tel: +41 (0)78 922 08 77 | e-mail: [email protected] |
Page 159
09.09.2013
Holder Name Portfolio Name Source Amt Held % Out Latest Chg File Dt Inst Type
LU'AN MINING INDUSTR n/a Co File 1'441'993'947 62.67 - 31.12.2012 Government
E FUND MANAGEMENT Multiple Portfolios MF-AGG 61'737'349 2.68 (2'706'537) 31.12.2012 Investment Advisor
SOCIAL SECURITY FUND n/a Co File 50'980'194 2.22 - 31.12.2012 Government
DACHENG FUND MANAGME Multiple Portfolios MF-AGG 23'898'933 1.04 (10'970'513) 31.12.2012 Investment Advisor
SHANXI LU'AN ENGINEE n/a Co File 23'400'000 1.02 - 31.12.2012 Other
RIZHAO PORT GROUP CO n/a Co File 21'480'000 0.93 - 31.12.2012 Government
YINHUA FUND MANAGEME Multiple Portfolios MF-AGG 20'686'882 0.9 5'624'748 31.12.2012 Investment Advisor
BANK OF COMMUNICATIO Multiple Portfolios MF-AGG 14'286'270 0.62 10'159'040 31.12.2012 Investment Advisor
SHANXI TIANJI COAL C n/a Co File 13'730'000 0.6 - 31.12.2012 Government
FULLGOAL FUND MANAGE Multiple Portfolios MF-AGG 13'148'233 0.57 6'176'037 31.12.2012 Investment Advisor
CHINA ASSET MANAGEME Multiple Portfolios MF-AGG 9'821'745 0.43 (2'025'871) 31.12.2012 Investment Advisor
INVESCO GREAT WALL F Multiple Portfolios MF-AGG 8'798'977 0.38 499'866 31.12.2012 Investment Advisor
HARVEST FUND MANAGEM Multiple Portfolios MF-AGG 8'315'979 0.36 (5'847'056) 31.12.2012 Investment Advisor
HUAAN FUND MANAGEMEN Multiple Portfolios MF-AGG 8'281'460 0.36 5'058'492 31.12.2012 Investment Advisor
HUATAI-PINEBRIDGE FU Multiple Portfolios MF-AGG 6'815'638 0.3 1'021'076 31.12.2012 Investment Advisor
JIASHI FUND MANAGEME Multiple Portfolios MF-AGG 6'329'391 0.28 5'241'406 31.12.2012 Investment Advisor
SOOCHOW ASSET MANAGE Multiple Portfolios MF-AGG 6'199'941 0.27 (800'059) 30.06.2013 Investment Advisor
CHINA MERCHANTS FUND Multiple Portfolios MF-AGG 5'030'466 0.22 4'032'233 31.12.2012 Investment Advisor
SYWG BNP PARIBAS ASS Multiple Portfolios MF-AGG 4'889'881 0.21 1'652'677 31.12.2012 Investment Advisor
CHANG XIN ASSET MANA Multiple Portfolios MF-AGG 4'849'348 0.21 619'853 31.12.2012 Investment Advisor
Firm Name Analyst Recommendation Weighting Change Target Price Date Date
GF Securities Co. Ltd. AN PENG buy 5 M 15 12 month 03.09.2013
China International Capital Corp LIAO MINGBING hold 3 U #N/A N/A Not Provided 29.08.2013
Chang Jiang Securities Co. Limited JUN GE buy 5 N #N/A N/A Not Provided 29.08.2013
Fortune CLSA Securities Limited JIE LI underperform 1 M 14 12 month 29.08.2013
Everbright Securities Co., Ltd CHEN HAOWU buy 5 M 24 12 month 13.08.2013
China Minzu Securities Co Ltd LI JING buy 5 U #N/A N/A Not Provided 12.08.2013
SWS Research Co Ltd RYAN XIANG buy 5 M #N/A N/A Not Provided 18.07.2013
China Investment Securities ZHANG LEI strong buy 5 M #N/A N/A Not Provided 14.07.2013
Goldman Sachs YONG HAN Buy/Neutral 5 M 15 12 month 08.07.2013
Qilu Securities Co Ltd ZHAOLIANG LIU add 4 D #N/A N/A Not Provided 01.07.2013
Northeast Securities Co Ltd WANG SHI buy 5 M #N/A N/A Not Provided 30.06.2013
EVA Dimensions DOUG WALTERS sell 1 M #N/A N/A Not Provided 06.06.2013
UBS JANET SUN buy 5 N 20 12 month 26.04.2013
Founder Securities SUN CAN add 4 M 30 12 month 23.04.2013
Hong Yuan Securities WANG JINGLE add 4 D 24 6 month 16.04.2013
Guodu Securities Co Ltd WANG SHUBAO strong buy 5 M #N/A N/A Not Provided 09.04.2013
HuaChuang Securities HAN ZHENGUO strong buy 5 M #N/A N/A Not Provided 03.03.2013
Citic Securities Co., Ltd ZU GUOPENG buy 5 M 35 6 month 18.02.2013
Bank of China International LAWRENCE LAU buy 5 M 20 12 month 29.01.2013
Rising Securities Co.,LTD XUE MINGJIE outperform 5 N #N/A N/A Not Provided 18.12.2012
China Merchants Securities LU PING strong buy 5 M 34 Not Provided 12.07.2012
PingAn Securities WANG CHENG buy 5 M 35 6 month 29.06.2012
AJ Securities WANG SIWEI neutral 3 D #N/A N/A Not Provided 28.06.2012
Great Wall Securities LIU FEI strong buy 5 M #N/A N/A Not Provided 28.03.2012
Industrial Securities LIU JIANGANG strong buy 5 M 38 12 month 06.03.2012
Central China Securities PAN HANGJUN buy 5 N #N/A N/A Not Provided 01.09.2011
China Securities Co., Ltd LI JUNSONG add 4 N 32 Not Provided 08.12.2010
China Galaxy Securities ZHAO KE buy 5 M #N/A N/A Not Provided 13.07.2010
Holdings By:
Shanxi Lu'an Environmental Energy Development Co Ltd ee
Q.M.S Advisors | tel: +41 (0)78 922 08 77 | e-mail: [email protected] |
Page 160
09.09.2013
Jiangsu Phoenix Publishing & Media Corporation Limited publishes, distributes
books, publications and audio-visual products, and sells cultural goods. The
Company's main products include textbooks, teaching aids, and general books.
Latest Fiscal Year: 12/2012
LTM as of: 06/yy
52-Week High (06.09.2013) 13.38
52-Week Low (04.12.2012) 5.75
Daily Volume
12.87
52-Week High % Change -3.81% Dividend Yield 0.78
52-Week Low % Change 123.83% Beta -
% 52 Week Price Range High/Low 95.81% Equity Float 659.00
Shares Out 30.06.2013 2'544.9 Short Int -
32'752.86 1 Yr Total Return 41.81%
Total Debt 0.00 YTD Return 91.84%
Preferred Stock 0.0 Adjusted BETA -
Minority Interest 410.7 Analyst Recs 13
Cash and Equivalents 5'869.02 Consensus Rating 4.615
Enterprise Value 27'009.89
Average Volume 5 Day 78'697'270
601928 CH EQUITY YTD Change - Average Volume 30 Day 66'636'780
601928 CH EQUITY YTD % CHANGE - Average Volume 3 Month 54'167'790
LTM-4Q LTM FY+1 FY+2 FQ+1 FQ+2
31.12.2008 31.12.2009 31.12.2010 31.12.2011 31.12.2012 06/yy 06/yy 12/13 Y 12/14 Y 09/13 Q3 12/13 Q4
4'549.5 4'999.6 5'369.9 5'984.9 6'660.8 3'336.2 6'958.7 7'655.5 8'856.1 - -
- - - 2.41x 1.77x 9.05x 5.73x - - - -
643.5 768.1 787.8 652.0 599.9 0.0 0.0 1'033.3 1'205.3 - -
- - - 22.12x 19.66x 0.00x 0.00x 26.14x 22.41x - -
452.9 642.4 662.1 739.2 927.2 482.0 968.1 1'063.9 1'229.8 - -
- - - 23.22x 18.83x 0.00x 22.57x 30.86x 26.70x - -
EBITDA 599.86 Long-Term Rating Date -
EBIT 462.84 Long-Term Rating -
Operating Margin 6.95% Long-Term Outlook -
Pretax Margin 14.05% Short-Term Rating Date -
Return on Assets 7.23% Short-Term Rating -
Return on Common Equity 10.43%
Return on Capital 10.11% EBITDA/Interest Exp. -
Asset Turnover 0.52% (EBITDA-Capex)/Interest Exp. -
Net Debt/EBITDA -9.78
Gross Margin 35.8% Total Debt/EBITDA 0.00
EBITDA Margin 9.0%
EBIT Margin 6.9% Total Debt/Equity 0.0%
Net Income Margin 13.9% Total Debt/Capital 0.0%
Asset Turnover 0.52
Current Ratio 3.31 Net Fixed Asset Turnover 2.25
Quick Ratio 2.09 Accounts receivable turnover-days 13.50
Debt to Assets 0.00% Inventory Days 133.81
Tot Debt to Common Equity 0.00% Accounts Payable Turnover Day 134.36
Accounts Receivable Turnover 27.10 Cash Conversion Cycle 12.95
Inventory Turnover 2.74
Fiscal Year Ended
Jiangsu Phoenix Publishing & Media Corp LtdPrice/Volume
Valuation Analysis
65'581'076.00
Current Price (9/dd/yy) Market Data
Net Income
P/E
Market Capitalization
Average Daily Trading Volume
Relative Stock Price Performance
Total Revenue
TEV/Revenue
EBITDA
TEV/EBITDA
Profitability S&P Issuer Ratings
Credit Ratios
Margin Analysis
Reference
Structure
,
.
1
3
5
-,
-.
-1
o!-. l!-. k!-. a!-. g!-0 c!-0 j!-0 Q!-0 j!-0 g!-0 g!-0 Q!-0 o!-0', F
.,', F
1,', F
3,', F
5,', F
-,,', F
-.,', F
-1,', F
-3,', F
0.0
1'000.0
2'000.0
3'000.0
4'000.0
5'000.0
6'000.0
7'000.0
2001 2002 2003 2004 2005 2006 2007 2008 2009 2010 2011 2012
,',,
-,',,
.,',,
0,',,
1,',,
2,',,
3,',,
4,',,
5,',,
,-',-'.,-, ,-',4'.,-, ,-',-'.,-- ,-',4'.,-- ,-',-'.,-. ,-',4'.,-. ,-',-'.,-0 ,-',4'.,-0
FReTn/CTrThoT/PolhirTlAlcST/ !Rna /eis FReTn/CTrThoT/PolhirTlAlcST/ !Rna /eis
Q.M.S Advisors | tel: +41 (0)78 922 08 77 | e-mail: [email protected] |
Page 161
09.09.2013
Holder Name Portfolio Name Source Amt Held % Out Latest Chg File Dt Inst Type
PHOENIX PUBLISHING & n/a Co File 1'835'000'000 72.1 - 31.12.2012 Other
TJ HONGYI INVEST IND n/a EXCH 125'000'000 4.91 (25'000'000) 23.05.2013 Other
SOCIAL SECURITY FUND n/a Co File 50'900'000 2 - 31.12.2012 Government
ICBC CS ENHAN RETURN n/a EXCH 16'954'108 0.67 - 29.11.2011 n/a
CHINA LIFE INSURANCE n/a ULT-AGG 16'050'559 0.63 - 31.12.2012 Government
HARVEST FUND MANAGEM Multiple Portfolios MF-AGG 11'103'656 0.44 (15'076'340) 31.12.2012 Investment Advisor
ICBC CS CREDIT BOND n/a EXCH 8'477'054 0.33 - 29.11.2011 n/a
BOC STABLE GROWTH BO n/a EXCH 7'978'403 0.31 - 29.11.2011 n/a
ICBC CS DOUBLE PROFI n/a EXCH 7'978'403 0.31 - 29.11.2011 n/a
TAIKANG LIFE INSURAN n/a Co File 7'608'792 0.3 - 31.12.2012 Insurance Company
ORIENT SECURITIES CO n/a Co File 7'102'311 0.28 - 31.12.2012 Government
CHONGQING INTL TRUST n/a Co File 6'173'891 0.24 - 31.12.2012 Corporation
FIRST-TRUST FUND MAN Multiple Portfolios MF-AGG 6'000'000 0.24 (12'329'849) 31.12.2012 Investment Advisor
PENGHUA FUND MANAGEM Multiple Portfolios MF-AGG 5'410'005 0.21 4'222'775 30.06.2013 Investment Advisor
ZHONG HAI FUND MANAG Multiple Portfolios MF-AGG 3'868'800 0.15 3'708'800 31.12.2012 Investment Advisor
HUATAI-PINEBRIDGE FU Multiple Portfolios MF-AGG 3'510'373 0.14 (4'656'044) 31.12.2012 Investment Advisor
HUAAN FUND MANAGEMEN Multiple Portfolios MF-AGG 1'927'186 0.08 (272'800) 31.12.2012 Investment Advisor
E FUND MANAGEMENT Multiple Portfolios MF-AGG 1'876'036 0.07 393'700 31.12.2012 Investment Advisor
ICBC CREDIT SUISSE A Multiple Portfolios MF-AGG 1'520'912 0.06 (12'238'088) 31.12.2012 Investment Advisor
CHINA ASSET MANAGEME Multiple Portfolios MF-AGG 1'487'226 0.06 - 02.09.2013 Investment Advisor
Firm Name Analyst Recommendation Weighting Change Target Price Date Date
Chang Jiang Securities Co. Limited ZHIJIAN CHEN buy 5 M #N/A N/A Not Provided 02.09.2013
Guotai Junan GAO HUI buy 5 M 14 12 month 28.08.2013
Tebon Securities Co Ltd LI XIANGFENG outperform 5 M #N/A N/A Not Provided 26.08.2013
China Investment Securities LENG XINGXING strong buy 5 M 14 12 month 25.08.2013
Founder Securities WANG YU buy 5 M #N/A N/A Not Provided 22.08.2013
Goldman Sachs LIAO XUFA neutral/neutral 3 M 7 12 month 31.07.2013
Hong Yuan Securities ZHANG ZEJING buy 5 M #N/A N/A Not Provided 18.07.2013
Everbright Securities Co., Ltd ZHANG LIANGWEI buy 5 M #N/A N/A Not Provided 01.05.2013
Qilu Securities Co Ltd XU BIN add 4 M #N/A N/A Not Provided 10.03.2013
China International Capital Corp WU HUIMIN buy 5 M #N/A N/A Not Provided 21.01.2013
Capital Securities Corp TEAM COVERAGE neutral 3 N #N/A N/A Not Provided 29.10.2012
Sinolink Securities Co Ltd ZHENG WANG buy 5 M #N/A N/A Not Provided 29.10.2012
HuaChuang Securities GU JIA buy 5 M #N/A N/A Not Provided 29.10.2012
Rising Securities Co.,LTD ZHAO YUE outperform 5 N #N/A N/A Not Provided 07.09.2012
AJ Securities LE MINYANG neutral 3 N #N/A N/A Not Provided 05.12.2011
Holdings By:
Jiangsu Phoenix Publishing & Media Corp Ltd ee
Q.M.S Advisors | tel: +41 (0)78 922 08 77 | e-mail: [email protected] |
Page 162
09.09.2013
Offshore Oil Engineering Co., Ltd. provides offshore oil engineering services,
including designing, construction, installation, and repair and maintenance
services. The Company's main businesses include oil/gas exploration
engineering, subsea pipeline laying, oil/gas field equipment testing and
maintenance, as well as pressure container and steel structure manufacturing.
Latest Fiscal Year: 12/2012
LTM as of: 06/yy
52-Week High (29.05.2013) 8.46
52-Week Low (03.12.2012) 4.93
Daily Volume
7.47
52-Week High % Change -11.70% Dividend Yield -
52-Week Low % Change 51.52% Beta 1.00
% 52 Week Price Range High/Low 69.12% Equity Float 1'630.13
Shares Out 30.06.2013 3'889.4 Short Int -
29'054.12 1 Yr Total Return 28.42%
Total Debt 3'224.79 YTD Return 27.77%
Preferred Stock 0.0 Adjusted BETA 1.004
Minority Interest 67.9 Analyst Recs 12
Cash and Equivalents 1'034.77 Consensus Rating 4.167
Enterprise Value 30'790.09
Average Volume 5 Day 25'620'360
600583 CH EQUITY YTD Change - Average Volume 30 Day 30'596'080
600583 CH EQUITY YTD % CHANGE - Average Volume 3 Month 33'662'480
LTM-4Q LTM FY+1 FY+2 FQ+1 FQ+2
31.12.2008 31.12.2009 31.12.2010 31.12.2011 31.12.2012 06/yy 06/yy 12/13 Y 12/14 Y 09/13 Q3 12/13 Q4
9'423.2 13'743.8 6'924.2 7'154.3 12'044.3 8'852.3 15'167.8 16'127.1 18'773.3 4'796.0 4'361.5
3.58x 2.92x 5.08x 3.35x 2.08x 11.32x 6.86x 1.94x 1.63x - -
1'871.0 1'826.5 1'085.6 1'239.1 1'946.8 0.0 0.0 2'840.4 3'538.0 571.0 1'417.0
18.03x 22.00x 32.41x 19.35x 12.89x 0.00x 0.00x 10.84x 8.70x - -
1'191.2 983.0 84.3 181.0 848.1 665.9 1'443.2 1'463.0 1'851.8 398.5 349.0
24.17x 38.00x 405.00x 110.00x 26.68x 36.85x 17.28x 20.24x 15.89x - -
EBITDA 1'946.78 Long-Term Rating Date -
EBIT 1'040.47 Long-Term Rating -
Operating Margin 8.64% Long-Term Outlook -
Pretax Margin 8.71% Short-Term Rating Date -
Return on Assets 7.09% Short-Term Rating -
Return on Common Equity 14.04%
Return on Capital - EBITDA/Interest Exp. 12.24
Asset Turnover 0.74% (EBITDA-Capex)/Interest Exp. 3.68
Net Debt/EBITDA -
Gross Margin 14.8% Total Debt/EBITDA -
EBITDA Margin -
EBIT Margin 10.7% Total Debt/Equity 31.5%
Net Income Margin 7.0% Total Debt/Capital 23.8%
Asset Turnover 0.74
Current Ratio 0.93 Net Fixed Asset Turnover 1.19
Quick Ratio 0.59 Accounts receivable turnover-days 49.98
Debt to Assets 15.83% Inventory Days 44.23
Tot Debt to Common Equity 31.49% Accounts Payable Turnover Day 93.83
Accounts Receivable Turnover 7.30 Cash Conversion Cycle 7.54
Inventory Turnover 8.25
Profitability S&P Issuer Ratings
Credit Ratios
Margin Analysis
Reference
Structure
Net Income
P/E
Market Capitalization
Average Daily Trading Volume
Relative Stock Price Performance
Total Revenue
TEV/Revenue
EBITDA
TEV/EBITDA
Fiscal Year Ended
Offshore Oil Engineering Co LtdPrice/Volume
Valuation Analysis
42'891'412.00
Current Price (9/dd/yy) Market Data
,-.0123456
o!-. l!-. k!-. a!-. g!-0 c!-0 j!-0 Q!-0 j!-0 g!-0 g!-0 Q!-0 o!-0', F
.,', F
1,', F
3,', F
5,', F
-,,', F
-.,', F
-1,', F
0.0
2'000.0
4'000.0
6'000.0
8'000.0
10'000.0
12'000.0
14'000.0
16'000.0
2001 2002 2003 2004 2005 2006 2007 2008 2009 2010 2011 2012
,',,
-,',,
.,',,
0,',,
1,',,
2,',,
3,',,
4,',,
5,',,
6,',,
,-',-'.,-, ,-',4'.,-, ,-',-'.,-- ,-',4'.,-- ,-',-'.,-. ,-',4'.,-. ,-',-'.,-0 ,-',4'.,-0
FReTn/CTrThoT/PolhirTlAlcST/ !Rna /eis FReTn/CTrThoT/PolhirTlAlcST/ !Rna /eis
Q.M.S Advisors | tel: +41 (0)78 922 08 77 | e-mail: [email protected] |
Page 163
09.09.2013
Holder Name Portfolio Name Source Amt Held % Out Latest Chg File Dt Inst Type
CHINA NATIONAL OFFSH n/a Co File 1'897'772'854 48.79 - 31.12.2012 Government
CH NATL OFFSHORE OIL n/a Co File 294'215'908 7.56 - 31.12.2012 Government
SOCIAL SECURITY FUND n/a Co File 66'722'866 1.72 - 31.12.2012 Government
CHINA SOUTHERN FUND Multiple Portfolios MF-AGG 42'206'646 1.09 (11'069'802) 30.06.2013 Investment Advisor
HUAAN FUND MANAGEMEN Multiple Portfolios MF-AGG 33'184'309 0.85 8'535'725 31.12.2012 Investment Advisor
CHINA MERCHANTS FUND Multiple Portfolios MF-AGG 26'091'759 0.67 5'564'807 31.12.2012 Investment Advisor
HSBC-JINTRUST FUND M Multiple Portfolios MF-AGG 21'012'622 0.54 (217'469) 30.06.2013 Investment Advisor
CHANGSHENG FUND MANA Multiple Portfolios MF-AGG 15'935'217 0.41 15'861'794 31.12.2012 Investment Advisor
CHINA ASSET MANAGEME Multiple Portfolios MF-AGG 15'477'271 0.4 (1'674'401) 31.12.2012 Investment Advisor
HARVEST FUND MANAGEM Multiple Portfolios MF-AGG 15'458'154 0.4 (10'217'009) 31.12.2012 Investment Advisor
CHINA NATURE ASSET M Multiple Portfolios MF-AGG 15'083'300 0.39 14'326'056 30.06.2013 Investment Advisor
YINHUA FUND MANAGEME Multiple Portfolios MF-AGG 14'376'148 0.37 1'247'988 31.12.2012 Investment Advisor
E FUND MANAGEMENT Multiple Portfolios MF-AGG 12'580'533 0.32 41'144 31.12.2012 Investment Advisor
HUATAI-PINEBRIDGE FU Multiple Portfolios MF-AGG 9'180'286 0.24 (18'233) 31.12.2012 Investment Advisor
RONGTONG FUND MANAGE Multiple Portfolios MF-AGG 8'462'321 0.22 4'296'300 31.12.2012 Investment Advisor
GOLDEN EAGLE ASSET M Multiple Portfolios MF-AGG 7'700'000 0.2 (499'990) 31.12.2012 Investment Advisor
EVERBRIGHT PRAMERICA Multiple Portfolios MF-AGG 7'245'613 0.19 6'349'913 31.12.2012 Investment Advisor
BAOYING FUND MANAGEM Multiple Portfolios MF-AGG 6'641'066 0.17 6'641'066 31.12.2012 Investment Advisor
LION FUND MANAGEMENT Multiple Portfolios MF-AGG 5'871'980 0.15 (5'319'942) 31.12.2012 Investment Advisor
CCB PRINCIPAL ASSET Multiple Portfolios MF-AGG 4'392'451 0.11 3'238'609 31.12.2012 Investment Advisor
Firm Name Analyst Recommendation Weighting Change Target Price Date Date
Northeast Securities Co Ltd JIANGTAO WU buy 5 M #N/A N/A Not Provided 02.09.2013
GF Securities Co. Ltd. DONG YAGUANG buy 5 M 11 12 month 02.09.2013
Founder Securities LIQUAN HUANG buy 5 M #N/A N/A Not Provided 30.08.2013
China Investment Securities LI FAN buy 5 M 9 12 month 30.08.2013
PingAn Securities DU ZHIQIANG buy 5 M #N/A N/A Not Provided 29.08.2013
Masterlink Securities LI XIN buy 5 M 9 Not Provided 08.08.2013
SWS Research Co Ltd KAISHENG LIN outperform 5 M #N/A N/A Not Provided 19.07.2013
Goldman Sachs ARTHUR YAN Sell/Neutral 1 M 6 12 month 13.06.2013
EVA Dimensions DOUG WALTERS sell 1 M #N/A N/A Not Provided 06.06.2013
UBS NINA YAN neutral 3 M 9 12 month 05.06.2013
China Minzu Securities Co Ltd QI QIUSHI buy 5 M 8 6 month 01.04.2013
Citic Securities Co., Ltd HUANG LILI overweight 5 M #N/A N/A Not Provided 25.12.2012
Great Wall Securities YAN FUYIN buy 5 M #N/A N/A Not Provided 30.12.2011
Central China Securities LU YONGGUANG add 4 N #N/A N/A Not Provided 26.11.2010
China Merchants Securities LIU RONG buy 5 M #N/A N/A Not Provided 05.11.2010
Bank of China International LAWRENCE LAU sell 1 D 6 Not Provided 28.10.2010
China Securities Co., Ltd TIAN DONGHONG neutral 3 D 10 Not Provided 02.12.2009
KGI Securities ZHANG GUO outperform 5 U 13 12 month 24.08.2009
Capital Securities Corp JASEPER TSANG hold 3 N #N/A N/A Not Provided 19.08.2009
Industrial Securities ZHENG FANGBIAO buy 5 M #N/A N/A Not Provided 20.07.2009
China Galaxy Securities LI GUOHONG neutral 3 N #N/A N/A Not Provided 15.04.2009
Holdings By:
Offshore Oil Engineering Co Ltd ee
Q.M.S Advisors | tel: +41 (0)78 922 08 77 | e-mail: [email protected] |
Page 164
09.09.2013
Shanghai International Airport Co., Ltd. operates Pudong Airport and Hongquiao
airport in Shanghai. The Company provides a full range of services including
air traffic control, terminal management, cargo handling, advertising, space
rental, and other related services.
Latest Fiscal Year: 12/2012
LTM as of: 06/yy
52-Week High (02.09.2013) 17.22
52-Week Low (28.11.2012) 10.76
Daily Volume
15.97
52-Week High % Change -7.26% Dividend Yield -
52-Week Low % Change 48.42% Beta 0.80
% 52 Week Price Range High/Low 84.21% Equity Float 900.74
Shares Out 30.06.2013 1'927.0 Short Int -
30'773.53 1 Yr Total Return 34.87%
Total Debt 2'488.93 YTD Return 31.94%
Preferred Stock 0.0 Adjusted BETA 0.803
Minority Interest 267.5 Analyst Recs 18
Cash and Equivalents 4'795.70 Consensus Rating 4.500
Enterprise Value 28'092.98
Average Volume 5 Day 44'497'010
600009 CH EQUITY YTD Change - Average Volume 30 Day 21'196'320
600009 CH EQUITY YTD % CHANGE - Average Volume 3 Month 13'018'100
LTM-4Q LTM FY+1 FY+2 FQ+1 FQ+2
31.12.2008 31.12.2009 31.12.2010 31.12.2011 31.12.2012 06/yy 06/yy 12/13 Y 12/14 Y 09/13 Q3 12/13 Q4
3'217.1 3'204.0 4'020.2 4'429.1 4'615.6 4'563.4 4'808.7 5'353.7 5'998.2 1'465.0 1'613.0
7.78x 11.36x 6.24x 5.15x 4.76x 20.40x 18.34x 5.12x 4.31x - -
1'738.2 1'602.3 2'136.6 2'390.2 2'417.1 0.0 0.0 2'842.0 3'169.3 - -
14.41x 22.72x 11.75x 9.53x 9.09x 0.00x 0.00x 9.88x 8.86x - -
859.7 706.3 1'310.7 1'499.6 1'581.1 1'531.5 1'719.1 1'919.2 2'167.7 656.0 522.0
25.04x 47.08x 18.22x 15.69x 15.20x 16.12x 13.34x 15.94x 13.92x - -
EBITDA 2'417.08 Long-Term Rating Date -
EBIT 1'501.35 Long-Term Rating -
Operating Margin 32.53% Long-Term Outlook -
Pretax Margin 45.62% Short-Term Rating Date -
Return on Assets 8.60% Short-Term Rating -
Return on Common Equity 11.12%
Return on Capital - EBITDA/Interest Exp. 18.26
Asset Turnover 0.24% (EBITDA-Capex)/Interest Exp. 17.44
Net Debt/EBITDA -
Gross Margin 36.5% Total Debt/EBITDA -
EBITDA Margin -
EBIT Margin 35.6% Total Debt/Equity 15.8%
Net Income Margin 34.3% Total Debt/Capital 13.4%
Asset Turnover 0.24
Current Ratio 6.63 Net Fixed Asset Turnover 0.40
Quick Ratio 6.51 Accounts receivable turnover-days 83.41
Debt to Assets 12.82% Inventory Days 2.33
Tot Debt to Common Equity 15.77% Accounts Payable Turnover Day 13.80
Accounts Receivable Turnover 4.38 Cash Conversion Cycle 65.38
Inventory Turnover 156.69
Fiscal Year Ended
Shanghai International Airport Co LtdPrice/Volume
Valuation Analysis
55'037'437.00
Current Price (9/dd/yy) Market Data
Net Income
P/E
Market Capitalization
Average Daily Trading Volume
Relative Stock Price Performance
Total Revenue
TEV/Revenue
EBITDA
TEV/EBITDA
Profitability S&P Issuer Ratings
Credit Ratios
Margin Analysis
Reference
Structure
,.135
-,-.-1-3-5
o!-. l!-. k!-. a!-. g!-0 c!-0 j!-0 Q!-0 j!-0 g!-0 g!-0 Q!-0 o!-0', F-,', F.,', F0,', F1,', F2,', F3,', F4,', F5,', F6,', F
0.0
500.0
1'000.0
1'500.0
2'000.0
2'500.0
3'000.0
3'500.0
4'000.0
4'500.0
5'000.0
2001 2002 2003 2004 2005 2006 2007 2008 2009 2010 2011 2012
,',,
2',,
-,',,
-2',,
.,',,
.2',,
0,',,
,-',-'.,-, ,-',4'.,-, ,-',-'.,-- ,-',4'.,-- ,-',-'.,-. ,-',4'.,-. ,-',-'.,-0 ,-',4'.,-0
FReTn/CTrThoT/PolhirTlAlcST/ !Rna /eis FReTn/CTrThoT/PolhirTlAlcST/ !Rna /eis
Q.M.S Advisors | tel: +41 (0)78 922 08 77 | e-mail: [email protected] |
Page 165
09.09.2013
Holder Name Portfolio Name Source Amt Held % Out Latest Chg File Dt Inst Type
SHANGHAI AIRPORT GRO n/a Co File 1'026'177'895 53.25 - 31.12.2012 Government
BOSHI FUND MANAGEMEN Multiple Portfolios MF-AGG 29'005'685 1.51 21'442'029 31.12.2012 Investment Advisor
UBS n/a ULT-AGG 19'796'901 1.03 - 31.12.2012 Unclassified
EVERBRIGHT PRAMERICA Multiple Portfolios MF-AGG 18'426'889 0.96 (465'172) 30.06.2013 Investment Advisor
CHINA LIFE INSURANCE n/a ULT-AGG 17'050'022 0.88 - 31.12.2012 Government
HUAAN FUND MANAGEMEN Multiple Portfolios MF-AGG 16'667'063 0.86 (6'688'849) 31.12.2012 Investment Advisor
YINHUA FUND MANAGEME Multiple Portfolios MF-AGG 16'497'213 0.86 (2'000'976) 31.12.2012 Investment Advisor
CHONGYANG 3 PHASE CO n/a Co File 14'247'621 0.74 - 31.12.2012 n/a
GOVERNMENT OF SINGAP n/a ULT-AGG 13'607'166 0.71 - 31.12.2012 Government
CHINA INTERNATIONAL Multiple Portfolios MF-AGG 11'722'946 0.61 2'486'857 31.12.2012 Investment Advisor
JP MORGAN n/a ULT-AGG 11'353'891 0.59 4'749'784 30.04.2013 Investment Advisor
CHINA SOUTHERN FUND Multiple Portfolios MF-AGG 10'671'403 0.55 (228'035) 30.06.2013 Investment Advisor
ORIENT FUND MANAGEME Multiple Portfolios MF-AGG 8'310'000 0.43 1'195'000 30.06.2013 Investment Advisor
HARVEST FUND MANAGEM Multiple Portfolios MF-AGG 7'657'901 0.4 (10'525'807) 31.12.2012 Investment Advisor
ICBC CREDIT SUISSE A Multiple Portfolios MF-AGG 7'657'167 0.4 (2'796'400) 31.12.2012 Investment Advisor
GF FUND MANAGEMENT C Multiple Portfolios MF-AGG 7'231'452 0.38 8'049 31.12.2012 Investment Advisor
MORGAN STANLEY n/a ULT-AGG 6'703'274 0.35 6'703'274 30.06.2013 Investment Advisor
INVESCO GREAT WALL F Multiple Portfolios MF-AGG 6'391'640 0.33 (1'500'000) 31.12.2012 Investment Advisor
HSBC-JINTRUST FUND M Multiple Portfolios MF-AGG 6'294'876 0.33 (162'666) 31.12.2012 Investment Advisor
HUATAI-PINEBRIDGE FU Multiple Portfolios MF-AGG 5'531'676 0.29 991'043 31.12.2012 Investment Advisor
Firm Name Analyst Recommendation Weighting Change Target Price Date Date
UBS XIN CHEN buy 5 M 18 12 month 30.08.2013
Capital Securities Corp LI XIAOLU buy 5 M 17 Not Provided 30.08.2013
Northeast Securities Co Ltd XIANG XU add 4 M #N/A N/A Not Provided 30.08.2013
GF Securities Co. Ltd. YANG ZHIQING add 4 M #N/A N/A Not Provided 30.08.2013
HSBC DAN DAN YU neutral 3 D 17 Not Provided 29.08.2013
China International Capital Corp SHEN XIAOFENG buy 5 M #N/A N/A Not Provided 29.08.2013
Chang Jiang Securities Co. Limited HAN YICHAO buy 5 N #N/A N/A Not Provided 29.08.2013
Morgan Stanley EDWARD XU Overwt/Cautious 5 M 14 12 month 28.08.2013
Goldman Sachs HINO LAM Buy/Neutral 5 M 17 12 month 28.08.2013
China Merchants Securities LUO YANYAN strong buy 5 M #N/A N/A Not Provided 24.07.2013
SWS Research Co Ltd AMOS ZHANG outperform 5 M #N/A N/A Not Provided 18.07.2013
China Minzu Securities Co Ltd WANG XIAOYAN add 4 M 15 6 month 07.06.2013
EVA Dimensions TIMOTHY STANISH underweight 1 M #N/A N/A Not Provided 06.06.2013
Citic Securities Co., Ltd SU BAOLIANG buy 5 M 18 6 month 12.04.2013
PingAn Securities SUN CHAO buy 5 M 15 6 month 08.03.2013
Sinolink Securities Co Ltd HUANG JINXIANG buy 5 M #N/A N/A Not Provided 29.10.2012
China Securities Co., Ltd LI LEI add 4 M 14 Not Provided 25.06.2012
Industrial Securities ZENG XU strong buy 5 M 14 12 month 24.04.2012
China Investment Securities XIE HONG buy 5 M #N/A N/A Not Provided 02.03.2011
Bank of China International DU JIANPING buy 5 M 15 Not Provided 01.11.2010
Everbright Securities Co., Ltd CHEN XIN accumulate 4 N #N/A N/A Not Provided 15.07.2010
China Galaxy Securities MAO ANG buy 5 M 11 Not Provided 02.07.2010
AJ Securities LE MINYANG neutral 3 D #N/A N/A Not Provided 02.04.2010
Holdings By:
Shanghai International Airport Co Ltd ee
Q.M.S Advisors | tel: +41 (0)78 922 08 77 | e-mail: [email protected] |
Page 166
09.09.2013
China Molybdenum Company Limited is a mineral mining and exploration company.
The Company explores for molybdenum in the People's Republic of China.
Latest Fiscal Year: 12/2011
LTM as of: 06/yy
52-Week High (13.03.2013) 11.14
52-Week Low (25.06.2013) 6.27
Daily Volume
7.86
52-Week High % Change -29.44% Dividend Yield 1.53
52-Week Low % Change 25.36% Beta -
% 52 Week Price Range High/Low 30.18% Equity Float 195.76
Shares Out 31.07.2013 3'765.0 Short Int -
32'790.85 1 Yr Total Return -
Total Debt 2'348.21 YTD Return -3.99%
Preferred Stock 0.0 Adjusted BETA -
Minority Interest 829.9 Analyst Recs 4
Cash and Equivalents 2'720.96 Consensus Rating 3.750
Enterprise Value 33'682.38
Average Volume 5 Day 9'589'167
603993 CH EQUITY YTD Change - Average Volume 30 Day 8'881'231
603993 CH EQUITY YTD % CHANGE - Average Volume 3 Month 8'493'618
LTM-4Q LTM FY+1 FY+2 FQ+1 FQ+2
31.12.2008 31.12.2009 31.12.2010 31.12.2011 31.12.2012 06/yy 06/yy 12/13 Y 12/14 Y 09/13 Q3 12/13 Q4
5'563.3 2'957.1 4'307.7 6'001.7 5'442.0 2'892.2 5'114.5 5'971.0 7'048.8 - -
2.26x 8.28x 6.49x 2.27x 6.51x 4.52x 6.64x - - - -
2'693.9 - - 1'912.8 1'357.3 0.0 0.0 1'514.0 2'005.0 - -
4.66x - - 7.12x 26.09x 0.00x 0.00x 22.25x 16.80x - -
1'640.9 495.1 1'020.7 1'122.8 1'050.3 720.7 934.5 994.0 1'236.8 - -
9.12x 54.95x 28.87x 11.71x 13.02x 0.00x 10.75x 39.90x 32.21x - -
EBITDA 1'357.32 Long-Term Rating Date -
EBIT 946.27 Long-Term Rating -
Operating Margin 17.39% Long-Term Outlook -
Pretax Margin 20.16% Short-Term Rating Date -
Return on Assets 6.74% Short-Term Rating -
Return on Common Equity 9.45%
Return on Capital 7.65% EBITDA/Interest Exp. 14.61
Asset Turnover 0.35% (EBITDA-Capex)/Interest Exp. 10.02
Net Debt/EBITDA -0.27
Gross Margin 26.0% Total Debt/EBITDA 1.73
EBITDA Margin 24.9%
EBIT Margin 17.4% Total Debt/Equity 20.3%
Net Income Margin 19.3% Total Debt/Capital 16.0%
Asset Turnover 0.35
Current Ratio 5.83 Net Fixed Asset Turnover 1.11
Quick Ratio 3.51 Accounts receivable turnover-days 119.30
Debt to Assets 14.91% Inventory Days 132.97
Tot Debt to Common Equity 20.35% Accounts Payable Turnover Day 35.04
Accounts Receivable Turnover 3.07 Cash Conversion Cycle 217.23
Inventory Turnover 2.75
Profitability S&P Issuer Ratings
Credit Ratios
Margin Analysis
Reference
Structure
Net Income
P/E
Market Capitalization
Average Daily Trading Volume
Relative Stock Price Performance
Total Revenue
TEV/Revenue
EBITDA
TEV/EBITDA
Fiscal Year Ended
China Molybdenum Co LtdPrice/Volume
Valuation Analysis
10'457'178.00
Current Price (9/dd/yy) Market Data
,
.
1
3
5
-,
-.
l!-. k!-. a!-. g!-0 c!-0 j!-0 Q!-0 j!-0 g!-0 g!-0 Q!-0', F.,', F1,', F3,', F5,', F-,,', F-.,', F-1,', F-3,', F-5,', F.,,', F
0.0
1'000.0
2'000.0
3'000.0
4'000.0
5'000.0
6'000.0
7'000.0
2001 2002 2003 2004 2005 2006 2007 2008 2009 2010 2011 2012
,',,
2',,
-,',,
-2',,
.,',,
.2',,
0,',,
02',,
1,',,
12',,
,-',-'.,-, ,-',4'.,-, ,-',-'.,-- ,-',4'.,-- ,-',-'.,-. ,-',4'.,-. ,-',-'.,-0 ,-',4'.,-0
FReTn/CTrThoT/PolhirTlAlcST/ !Rna /eis FReTn/CTrThoT/PolhirTlAlcST/ !Rna /eis
Q.M.S Advisors | tel: +41 (0)78 922 08 77 | e-mail: [email protected] |
Page 167
09.09.2013
Holder Name Portfolio Name Source Amt Held % Out Latest Chg File Dt Inst Type
CHINA MOLYBDENUM CO n/a EXCH 1'776'593'475 47.19 - 08.10.2012 Corporation
HONGSHANG INDUSTRY H n/a EXCH 1'726'706'322 45.86 - 11.12.2012 Other
SH YUELING INVEST MG n/a EXCH 22'014'728 0.58 - 08.10.2012 Investment Advisor
SOCIAL SEC FUND III n/a EXCH 20'000'000 0.53 - 08.10.2012 n/a
SH JINGQUAN INVEST M n/a EXCH 10'000'000 0.27 - 08.10.2012 Investment Advisor
SH LIUHE CAPITAL CO n/a EXCH 9'700'000 0.26 - 08.10.2012 Private Equity
SOUTHERN CHINA GOOD n/a EXCH 2'121'486 0.06 - 08.10.2012 n/a
FULLGOAL TIANYI VALU n/a EXCH 2'121'415 0.06 - 08.10.2012 n/a
SOCIAL SEC FUND 604 n/a EXCH 2'121'415 0.06 - 08.10.2012 n/a
HAITONG SECURITIES C n/a EXCH 2'121'415 0.06 - 08.10.2012 Investment Advisor
SOOCHOW SECURITIES C n/a EXCH 2'121'415 0.06 - 08.10.2012 Government
CHINA HUADIAN FIN n/a EXCH 2'121'415 0.06 - 08.10.2012 Government
KUNLUN TRUST CO LTD n/a EXCH 2'121'415 0.06 - 08.10.2012 Other
TIANAN INSURANCE EQT n/a EXCH 2'121'415 0.06 - 08.10.2012 Insurance Company
CHINA ASSET MANAGEME Multiple Portfolios MF-AGG 404'214 0.01 - 02.09.2013 Investment Advisor
BLACKROCK ASSET MGMT Multiple Portfolios MF-AGG 44'623 0 - 30.08.2013 Investment Advisor
CHINA UNIVERSAL ASSE Multiple Portfolios MF-AGG 32'000 0 (4'600) 02.09.2013 Investment Advisor
NIKKO ASSET MANAGEME n/a ULT-AGG 10'900 0 10'900 16.08.2013 Unclassified
Firm Name Analyst Recommendation Weighting Change Target Price Date Date
Central China Securities KUN ZHANG monitored #N/A N/A D #N/A N/A Not Provided 02.09.2013
GF Securities Co. Ltd. GUOXIAN JU add 4 N #N/A N/A Not Provided 23.08.2013
China International Capital Corp CAI HONGYU hold 3 M #N/A N/A Not Provided 23.08.2013
Everbright Securities Co., Ltd WANG QIANMING neutral 3 N 10 6 month 15.03.2013
Qilu Securities Co Ltd YAN LEI buy 5 M #N/A N/A Not Provided 29.01.2013
Holdings By:
China Molybdenum Co Ltd ee
Q.M.S Advisors | tel: +41 (0)78 922 08 77 | e-mail: [email protected] |
Page 168
09.09.2013
Ningbo Port Company Limited primarily provides container, iron ore, crude oil
and other cargo handling and related services. The Company also provides
integrated logistics and other businesses.
Latest Fiscal Year: 12/2012
LTM as of: 06/yy
52-Week High (05.02.2013) 2.68
52-Week Low (25.06.2013) 1.98
Daily Volume
2.39
52-Week High % Change -10.82% Dividend Yield -
52-Week Low % Change 20.71% Beta 0.80
% 52 Week Price Range High/Low 47.14% Equity Float 2'005.65
Shares Out 30.06.2013 12'800.0 Short Int -
30'592.00 1 Yr Total Return -1.85%
Total Debt 5'615.48 YTD Return -3.38%
Preferred Stock 0.0 Adjusted BETA 0.796
Minority Interest 948.0 Analyst Recs 5
Cash and Equivalents 2'129.89 Consensus Rating 4.200
Enterprise Value 37'037.25
Average Volume 5 Day 73'717'140
601018 CH EQUITY YTD Change - Average Volume 30 Day 39'846'680
601018 CH EQUITY YTD % CHANGE - Average Volume 3 Month 24'848'850
LTM-4Q LTM FY+1 FY+2 FQ+1 FQ+2
31.12.2008 31.12.2009 31.12.2010 31.12.2011 31.12.2012 06/yy 06/yy 12/13 Y 12/14 Y 09/13 Q3 12/13 Q4
4'421.3 4'705.4 5'811.5 6'749.4 7'537.6 7'236.0 9'491.9 9'921.0 11'609.0 - -
- - 6.55x 4.90x 4.95x 19.39x 11.60x - - - -
2'024.5 2'221.0 2'546.0 3'011.1 3'377.5 0.0 0.0 - - - -
- - 14.95x 10.98x 11.05x 0.00x 0.00x - - - -
1'763.9 1'818.6 2'199.1 2'468.2 2'676.6 2'762.2 2'620.9 - - - -
- - 16.42x 12.58x 12.24x 11.86x 10.06x 10.53x 9.19x - -
EBITDA 3'377.45 Long-Term Rating Date -
EBIT 2'444.45 Long-Term Rating -
Operating Margin 32.43% Long-Term Outlook -
Pretax Margin 45.82% Short-Term Rating Date -
Return on Assets 6.76% Short-Term Rating -
Return on Common Equity 9.36%
Return on Capital - EBITDA/Interest Exp. 10.04
Asset Turnover 0.23% (EBITDA-Capex)/Interest Exp. 4.34
Net Debt/EBITDA -
Gross Margin 44.8% Total Debt/EBITDA -
EBITDA Margin -
EBIT Margin 30.1% Total Debt/Equity 20.7%
Net Income Margin 35.5% Total Debt/Capital 16.7%
Asset Turnover 0.23
Current Ratio 1.38 Net Fixed Asset Turnover 0.43
Quick Ratio 1.10 Accounts receivable turnover-days 75.84
Debt to Assets 15.56% Inventory Days 9.12
Tot Debt to Common Equity 20.72% Accounts Payable Turnover Day 28.05
Accounts Receivable Turnover 4.81 Cash Conversion Cycle 41.95
Inventory Turnover 40.01
Profitability S&P Issuer Ratings
Credit Ratios
Margin Analysis
Reference
Structure
Net Income
P/E
Market Capitalization
Average Daily Trading Volume
Relative Stock Price Performance
Total Revenue
TEV/Revenue
EBITDA
TEV/EBITDA
Fiscal Year Ended
Ningbo Port Co LtdPrice/Volume
Valuation Analysis
81'008'456.00
Current Price (9/dd/yy) Market Data
,
-
-
.
.
0
0
o!-. l!-. k!-. a!-. g!-0 c!-0 j!-0 Q!-0 j!-0 g!-0 g!-0 Q!-0 o!-0', F
2,', F
-,,', F
-2,', F
.,,', F
.2,', F
0,,', F
02,', F
0.0
1'000.0
2'000.0
3'000.0
4'000.0
5'000.0
6'000.0
7'000.0
8'000.0
2001 2002 2003 2004 2005 2006 2007 2008 2009 2010 2011 2012
,',,
2',,
-,',,
-2',,
.,',,
.2',,
0,',,
02',,
1,',,
12',,
,-',-'.,-, ,-',4'.,-, ,-',-'.,-- ,-',4'.,-- ,-',-'.,-. ,-',4'.,-. ,-',-'.,-0 ,-',4'.,-0
FReTn/CTrThoT/PolhirTlAlcST/ !Rna /eis FReTn/CTrThoT/PolhirTlAlcST/ !Rna /eis
Q.M.S Advisors | tel: +41 (0)78 922 08 77 | e-mail: [email protected] |
Page 169
09.09.2013
Holder Name Portfolio Name Source Amt Held % Out Latest Chg File Dt Inst Type
NINGBO PORT CO n/a EXCH 9'547'562'818 74.59 17'837'660 08.04.2013 Government
NB CM INTL CONTAINER n/a Co File 583'200'000 4.56 - 31.12.2012 Corporation
CITIC PORT INVEST n/a Co File 190'594'503 1.49 - 31.12.2012 Other
SOCIAL SECURITY FUND n/a Co File 190'274'842 1.49 - 31.12.2012 Government
NB COMMU INVEST HLDS n/a Co File 105'885'835 0.83 - 31.12.2012 Government
NB NINGSHING GRP n/a Co File 105'885'835 0.83 - 31.12.2012 Government
NB DEVELOP & INVEST n/a Co File 31'765'751 0.25 - 31.12.2012 Corporation
NB URBAN CONSTR INVE n/a Co File 31'765'751 0.25 - 31.12.2012 Government
HARVEST FUND MANAGEM Multiple Portfolios MF-AGG 30'522'239 0.24 (20'174'446) 31.12.2012 Investment Advisor
HUATAI-PINEBRIDGE FU Multiple Portfolios MF-AGG 22'736'818 0.18 4'965'398 31.12.2012 Investment Advisor
HUAFU FUND MANAGEMEN Multiple Portfolios MF-AGG 11'334'494 0.09 11'205'550 31.12.2012 Investment Advisor
HUARUN SHENGUO TRUST n/a Co File 7'413'000 0.06 - 31.12.2012 n/a
CHINA ASSET MANAGEME Multiple Portfolios MF-AGG 7'406'905 0.06 - 02.09.2013 Investment Advisor
E FUND MANAGEMENT Multiple Portfolios MF-AGG 5'822'900 0.05 1'009'600 31.12.2012 Investment Advisor
GUOTAI ASSET MANAGEM Multiple Portfolios MF-AGG 4'307'332 0.03 1'685'388 31.12.2012 Investment Advisor
CHINA UNIVERSAL ASSE Multiple Portfolios MF-AGG 4'054'950 0.03 (177'320) 02.09.2013 Investment Advisor
DACHENG FUND MANAGME Multiple Portfolios MF-AGG 3'917'276 0.03 1'177'100 31.12.2012 Investment Advisor
GTJA ALLIANZ FUND MA Multiple Portfolios MF-AGG 3'739'409 0.03 1'276'459 31.12.2012 Investment Advisor
BANK OF CHINA INVEST Multiple Portfolios MF-AGG 3'694'900 0.03 1'844'200 31.12.2012 Investment Advisor
CHINA ASSET MANAGEME Multiple Portfolios MF-AGG 3'427'156 0.03 (6'484'100) 31.12.2012 Investment Advisor
Firm Name Analyst Recommendation Weighting Change Target Price Date Date
Sinolink Securities Co Ltd JIANG MING add 4 M #N/A N/A Not Provided 25.04.2013
Qilu Securities Co Ltd ZHOU LI add 4 M 3 12 month 29.03.2013
Bank of China International DU JIANPING buy 5 M 4 Not Provided 16.01.2013
Northeast Securities Co Ltd XIANG XU add 4 M #N/A N/A Not Provided 21.12.2012
Everbright Securities Co., Ltd DING XIANDA accumulate 4 M 3 12 month 20.11.2012
Industrial Securities YUNTAO JI buy 5 M #N/A N/A Not Provided 20.04.2012
Citic Securities Co., Ltd ZHANG HONGBO buy 5 N #N/A N/A Not Provided 03.05.2011
Holdings By:
Ningbo Port Co Ltd ee
Q.M.S Advisors | tel: +41 (0)78 922 08 77 | e-mail: [email protected] |
Page 170
09.09.2013
Gemdale Corporation develops residential buildings and operates in property
rental and management. The Company also invests in commercial trading
businesses.
Latest Fiscal Year: 12/2012
LTM as of: 06/yy
52-Week High (05.02.2013) 8.25
52-Week Low (24.09.2012) 4.62
Daily Volume
6.59
52-Week High % Change -20.12% Dividend Yield -
52-Week Low % Change 42.64% Beta 1.43
% 52 Week Price Range High/Low 48.48% Equity Float 3'954.19
Shares Out 30.06.2013 4'471.5 Short Int -
29'467.24 1 Yr Total Return 25.82%
Total Debt 30'746.38 YTD Return -5.01%
Preferred Stock 0.0 Adjusted BETA 1.433
Minority Interest 7'479.9 Analyst Recs 18
Cash and Equivalents 20'616.23 Consensus Rating 4.778
Enterprise Value 56'642.69
Average Volume 5 Day 68'577'700
600383 CH EQUITY YTD Change - Average Volume 30 Day 58'527'640
600383 CH EQUITY YTD % CHANGE - Average Volume 3 Month 57'687'510
LTM-4Q LTM FY+1 FY+2 FQ+1 FQ+2
31.12.2008 31.12.2009 31.12.2010 31.12.2011 31.12.2012 06/yy 06/yy 12/13 Y 12/14 Y 09/13 Q3 12/13 Q4
8'571.0 10'922.8 17'576.6 21'500.2 29'861.8 22'691.6 32'184.6 35'555.0 43'097.0 7'120.5 21'749.5
2.39x 4.03x 2.37x 1.79x 1.64x 7.46x 6.26x 1.30x 0.51x - -
1'811.0 2'690.7 4'179.6 5'067.4 5'483.7 0.0 0.0 6'152.4 7'965.8 1'138.0 3'754.0
11.29x 16.37x 9.96x 7.60x 8.94x 0.00x 0.00x 9.21x 7.11x 7.99x 7.46x
840.9 1'776.2 2'694.0 3'017.2 3'385.2 3'041.4 3'186.6 3'512.3 4'466.2 685.0 2'252.0
13.02x 17.79x 10.30x 7.39x 9.24x 9.55x 9.70x 8.24x 6.64x 6.56x 6.19x
EBITDA 5'483.67 Long-Term Rating Date 16.07.2012
EBIT 5'407.26 Long-Term Rating BB+
Operating Margin 18.11% Long-Term Outlook STABLE
Pretax Margin 19.72% Short-Term Rating Date -
Return on Assets 3.02% Short-Term Rating -
Return on Common Equity 14.32%
Return on Capital - EBITDA/Interest Exp. 2.63
Asset Turnover 0.30% (EBITDA-Capex)/Interest Exp. 2.55
Net Debt/EBITDA -
Gross Margin 23.7% Total Debt/EBITDA -
EBITDA Margin -
EBIT Margin 16.8% Total Debt/Equity 130.7%
Net Income Margin 11.3% Total Debt/Capital 49.8%
Asset Turnover 0.30
Current Ratio 1.97 Net Fixed Asset Turnover 133.17
Quick Ratio 0.41 Accounts receivable turnover-days 0.05
Debt to Assets 29.99% Inventory Days 1031.13
Tot Debt to Common Equity 130.74% Accounts Payable Turnover Day 64.52
Accounts Receivable Turnover 7883.32 Cash Conversion Cycle 984.31
Inventory Turnover 0.35
Fiscal Year Ended
Gemdale CorpPrice/Volume
Valuation Analysis
97'620'661.00
Current Price (9/dd/yy) Market Data
Net Income
P/E
Market Capitalization
Average Daily Trading Volume
Relative Stock Price Performance
Total Revenue
TEV/Revenue
EBITDA
TEV/EBITDA
Profitability S&P Issuer Ratings
Credit Ratios
Margin Analysis
Reference
Structure
,-.0123456
o!-. l!-. k!-. a!-. g!-0 c!-0 j!-0 Q!-0 j!-0 g!-0 g!-0 Q!-0 o!-0', F
2,', F
-,,', F
-2,', F
.,,', F
.2,', F
0.0
5'000.0
10'000.0
15'000.0
20'000.0
25'000.0
30'000.0
35'000.0
2001 2002 2003 2004 2005 2006 2007 2008 2009 2010 2011 2012
,',,
.,',,
1,',,
3,',,
5,',,
-,,',,
-.,',,
-1,',,
,-',-'.,-, ,-',4'.,-, ,-',-'.,-- ,-',4'.,-- ,-',-'.,-. ,-',4'.,-. ,-',-'.,-0 ,-',4'.,-0
FReTn/CTrThoT/PolhirTlAlcST/ !Rna /eis FReTn/CTrThoT/PolhirTlAlcST/ !Rna /eis
Q.M.S Advisors | tel: +41 (0)78 922 08 77 | e-mail: [email protected] |
Page 171
09.09.2013
Holder Name Portfolio Name Source Amt Held % Out Latest Chg File Dt Inst Type
SHENZHEN FUTIAN INV n/a Co File 351'060'854 7.85 - 31.12.2012 Investment Advisor
ANBANG INSURANCE CO n/a Co File 205'939'847 4.61 - 31.12.2012 Insurance Company
BOSHI FUND MANAGEMEN Multiple Portfolios MF-AGG 183'680'247 4.11 125'538'183 30.06.2013 Investment Advisor
DACHENG FUND MANAGME Multiple Portfolios MF-AGG 170'634'346 3.82 75'508'444 31.12.2012 Investment Advisor
SHENZHEN FUTIAN CONS n/a Co File 165'703'417 3.71 - 31.12.2012 Corporation
GF FUND MANAGEMENT C Multiple Portfolios MF-AGG 142'084'518 3.18 39'686'936 31.12.2012 Investment Advisor
ICBC CREDIT SUISSE A Multiple Portfolios MF-AGG 96'770'732 2.16 15'748'014 31.12.2012 Investment Advisor
EVERBRIGHT PRAMERICA Multiple Portfolios MF-AGG 94'272'641 2.11 (12'332'537) 30.06.2013 Investment Advisor
GREAT WALL FUND MANA Multiple Portfolios MF-AGG 90'678'281 2.03 1'060'752 30.06.2013 Investment Advisor
CHANGSHA PILOT INVS n/a Co File 90'000'000 2.01 - 31.12.2012 Corporation
BANK OF COMMUNICATIO Multiple Portfolios MF-AGG 74'978'026 1.68 36'777'431 30.06.2013 Investment Advisor
CHINA LIFE INSURANCE n/a ULT-AGG 64'595'162 1.44 - 31.12.2012 Government
YINHUA FUND MANAGEME Multiple Portfolios MF-AGG 61'775'326 1.38 (36'314'921) 31.12.2012 Investment Advisor
TJ WANGGEN EQY INVES n/a Co File 59'692'483 1.33 - 31.12.2012 Other
PENGHUA FUND MANAGEM Multiple Portfolios MF-AGG 56'978'280 1.27 (41'910'098) 30.06.2013 Investment Advisor
CCB PRINCIPAL ASSET Multiple Portfolios MF-AGG 55'870'052 1.25 3'261'864 30.06.2013 Investment Advisor
HUAAN FUND MANAGEMEN Multiple Portfolios MF-AGG 55'737'147 1.25 16'251'704 30.06.2013 Investment Advisor
CHINA ASSET MANAGEME Multiple Portfolios MF-AGG 45'774'673 1.02 (74'738'928) 31.12.2012 Investment Advisor
FULLGOAL FUND MANAGE Multiple Portfolios MF-AGG 37'537'418 0.84 (48'476'048) 31.12.2012 Investment Advisor
HARVEST FUND MANAGEM Multiple Portfolios MF-AGG 36'645'236 0.82 (72'071'167) 31.12.2012 Investment Advisor
Firm Name Analyst Recommendation Weighting Change Target Price Date Date
GF Securities Co. Ltd. ZOU GE buy 5 M #N/A N/A Not Provided 02.09.2013
PingAn Securities YATING ZHOU buy 5 M #N/A N/A Not Provided 02.09.2013
Central China Securities WU JIANXIONG buy 5 M #N/A N/A Not Provided 30.08.2013
Northeast Securities Co Ltd GAO JIAN buy 5 M #N/A N/A Not Provided 25.08.2013
Guotai Junan LI PINKE buy 5 M 9 12 month 22.08.2013
Goldman Sachs VICKY LI Buy/Neutral 5 M 8 12 month 19.08.2013
Jefferies CHRISTIE JU hold 3 M 7 12 month 19.08.2013
Capital Securities Corp ZHU JIXIANG buy 5 M 10 Not Provided 19.08.2013
China International Capital Corp ANSON JINGBIAN NING buy 5 M #N/A N/A Not Provided 19.08.2013
Credit Suisse JINSONG DU restricted #N/A N/A M #N/A N/A Not Provided 18.08.2013
Everbright Securities Co., Ltd ZIPEI TANG accumulate 4 M #N/A N/A Not Provided 18.08.2013
Chang Jiang Securities Co. Limited LIU JUN buy 5 M #N/A N/A Not Provided 18.08.2013
UBS MICHAEL LI buy 5 N 9 12 month 25.07.2013
SWS Research Co Ltd SIYI HAN outperform 5 M #N/A N/A Not Provided 19.07.2013
Guodu Securities Co Ltd ZHANG WEI buy 5 M #N/A N/A Not Provided 24.06.2013
Fortune CLSA Securities Limited YANG YAN outperform 5 M 8 12 month 07.06.2013
Citic Securities Co., Ltd CONG CHEN buy 5 M 8 6 month 14.05.2013
Sinolink Securities Co Ltd CAO XUTE add 4 M #N/A N/A Not Provided 12.04.2013
Bank of China International TIAN SHIXIN buy 5 M #N/A N/A Not Provided 28.01.2013
AJ Securities ZUO HONGYING buy 5 M #N/A N/A Not Provided 03.09.2012
China Securities Co., Ltd SU XUEJING buy 5 N 17 Not Provided 25.06.2012
China Merchants Securities ZUGUO JIA buy 5 M 8 6 month 12.06.2012
Industrial Securities YU MIAO buy 5 M #N/A N/A Not Provided 25.04.2012
China Minzu Securities Co Ltd CUI JUAN add 4 M 10 6 month 02.12.2011
Tebon Securities Co Ltd TEAM COVERAGE outperform 5 N #N/A N/A Not Provided 18.07.2011
Founder Securities WEI ZHOU add 4 M #N/A N/A Not Provided 12.12.2010
China Galaxy Securities DING WEN speculative buy 4 M #N/A N/A Not Provided 10.07.2010
KGI Securities CHEN JUDITH outperform 5 U 9 12 month 14.09.2009
Holdings By:
Gemdale Corp ee
Q.M.S Advisors | tel: +41 (0)78 922 08 77 | e-mail: [email protected] |
Page 172
09.09.2013
Tsingtao Brewery Company Limited produces and distributes beer products. The
Company markets its products throughout China and around the world under the
Tsingtao Beer brand name.
Latest Fiscal Year: 12/2011
LTM as of: 06/yy
52-Week High (16.08.2013) 44.98
52-Week Low (28.11.2012) 28.63
Daily Volume
42.16
52-Week High % Change -6.27% Dividend Yield -
52-Week Low % Change 47.26% Beta 0.66
% 52 Week Price Range High/Low 78.84% Equity Float 256.47
Shares Out 30.06.2013 695.9 Short Int -
60'440.13 1 Yr Total Return 24.80%
Total Debt 2'094.09 YTD Return 28.76%
Preferred Stock 0.0 Adjusted BETA 0.662
Minority Interest 315.5 Analyst Recs 15
Cash and Equivalents 7'118.25 Consensus Rating 4.133
Enterprise Value 52'207.55
Average Volume 5 Day 2'218'968
600600 CH EQUITY YTD Change - Average Volume 30 Day 2'210'547
600600 CH EQUITY YTD % CHANGE - Average Volume 3 Month 2'141'118
LTM-4Q LTM FY+1 FY+2 FQ+1 FQ+2
31.12.2008 31.12.2009 31.12.2010 31.12.2011 31.12.2012 06/yy 06/yy 12/13 Y 12/14 Y 09/13 Q3 12/13 Q4
15'781.4 16'478.8 18'234.7 21'133.6 23'580.5 22'255.7 25'102.5 29'303.8 33'488.3 9'342.0 4'598.5
1.41x 2.87x 2.24x 2.00x 1.80x 7.61x 7.33x 1.93x 1.72x - -
1'887.7 2'418.9 2'775.0 2'807.2 2'795.3 0.0 0.0 3'338.0 3'825.5 1'336.0 232.0
11.75x 19.57x 14.72x 15.05x 15.17x 0.00x 0.00x 15.64x 13.65x 14.39x 13.65x
699.6 1'250.0 1'520.5 1'737.9 1'758.9 1'755.4 2'146.3 2'108.3 2'348.3 805.0 44.3
26.64x 39.86x 30.67x 27.12x 28.27x 27.77x 27.65x 26.97x 23.54x 28.26x 25.44x
EBITDA 2'795.28 Long-Term Rating Date -
EBIT 1'951.44 Long-Term Rating -
Operating Margin 8.28% Long-Term Outlook -
Pretax Margin 10.53% Short-Term Rating Date -
Return on Assets 8.25% Short-Term Rating -
Return on Common Equity 17.02%
Return on Capital 15.70% EBITDA/Interest Exp. 26.85
Asset Turnover 0.97% (EBITDA-Capex)/Interest Exp. 4.01
Net Debt/EBITDA -2.78
Gross Margin 34.5% Total Debt/EBITDA 0.68
EBITDA Margin 11.7%
EBIT Margin 8.1% Total Debt/Equity 16.8%
Net Income Margin 7.5% Total Debt/Capital 14.1%
Asset Turnover 0.97
Current Ratio 1.38 Net Fixed Asset Turnover 2.52
Quick Ratio 0.99 Accounts receivable turnover-days 3.44
Debt to Assets 8.85% Inventory Days 46.53
Tot Debt to Common Equity 16.80% Accounts Payable Turnover Day 66.43
Accounts Receivable Turnover 106.16 Cash Conversion Cycle 18.40
Inventory Turnover 7.84
Profitability S&P Issuer Ratings
Credit Ratios
Margin Analysis
Reference
Structure
Net Income
P/E
Market Capitalization
Average Daily Trading Volume
Relative Stock Price Performance
Total Revenue
TEV/Revenue
EBITDA
TEV/EBITDA
Fiscal Year Ended
Tsingtao Brewery Co LtdPrice/Volume
Valuation Analysis
1'639'132.00
Current Price (9/dd/yy) Market Data
,2
-,-2.,.20,021,122,
o!-. l!-. k!-. a!-. g!-0 c!-0 j!-0 Q!-0 j!-0 g!-0 g!-0 Q!-0 o!-0', F-', F.', F0', F1', F2', F3', F4', F5', F6', F-,', F
0.0
5'000.0
10'000.0
15'000.0
20'000.0
25'000.0
2001 2002 2003 2004 2005 2006 2007 2008 2009 2010 2011 2012
,',,
2',,
-,',,
-2',,
.,',,
.2',,
0,',,
02',,
,-',-'.,-, ,-',4'.,-, ,-',-'.,-- ,-',4'.,-- ,-',-'.,-. ,-',4'.,-. ,-',-'.,-0 ,-',4'.,-0
FReTn/CTrThoT/PolhirTlAlcST/ !Rna /eis FReTn/CTrThoT/PolhirTlAlcST/ !Rna /eis
Q.M.S Advisors | tel: +41 (0)78 922 08 77 | e-mail: [email protected] |
Page 173
09.09.2013
Holder Name Portfolio Name Source Amt Held % Out Latest Chg File Dt Inst Type
TSINGTAO BREWERY CO n/a Co File 411'400'050 59.12 - 31.12.2012 Government
E FUND MANAGEMENT Multiple Portfolios MF-AGG 22'928'150 3.29 (5'583'498) 31.12.2012 Investment Advisor
CHINA CONSTRUCTION I n/a Co File 17'574'505 2.53 - 31.12.2012 Government
TAIKANG LIFE INSURAN n/a Co File 15'899'945 2.28 - 31.12.2012 Insurance Company
CHINA MERCHANTS SECU n/a Co File 15'119'578 2.17 - 31.12.2012 Corporation
SOCIAL SECURITY FUND n/a Co File 9'649'914 1.39 - 31.12.2012 Government
AEGON INDUSTRIAL FUN Multiple Portfolios MF-AGG 8'475'321 1.22 960'164 31.12.2012 Investment Advisor
GUOTAI JUNAN SECURIT n/a Co File 8'368'496 1.2 - 31.12.2012 Investment Advisor
CHINA MERCHANTS FUND Multiple Portfolios MF-AGG 4'380'605 0.63 (1'569'527) 31.12.2012 Investment Advisor
MORGAN STANLEY n/a ULT-AGG 4'053'242 0.58 (1'369'300) 30.06.2013 Investment Advisor
HARVEST FUND MANAGEM Multiple Portfolios MF-AGG 2'758'413 0.4 (1'836'051) 31.12.2012 Investment Advisor
HUATAI-PINEBRIDGE FU Multiple Portfolios MF-AGG 2'521'999 0.36 377'562 31.12.2012 Investment Advisor
JP MORGAN n/a ULT-AGG 2'291'647 0.33 1'641'810 31.03.2013 Investment Advisor
NEW CHINA FUND MANAG Multiple Portfolios MF-AGG 1'797'371 0.26 (345'940) 31.12.2012 Investment Advisor
TIANTONG ASSET MANAG Multiple Portfolios MF-AGG 1'620'580 0.23 122'351 30.06.2013 Investment Advisor
FORTUNE SGAM FUND MA Multiple Portfolios MF-AGG 1'488'186 0.21 (163'518) 31.12.2012 Investment Advisor
HUAAN FUND MANAGEMEN Multiple Portfolios MF-AGG 1'416'628 0.2 29'669 31.12.2012 Investment Advisor
RONGTONG FUND MANAGE Multiple Portfolios MF-AGG 1'110'000 0.16 610'018 31.12.2012 Investment Advisor
LORD ABBETT CHINA Multiple Portfolios MF-AGG 845'337 0.12 845'337 31.12.2012 Investment Advisor
CHINA ASSET MANAGEME Multiple Portfolios MF-AGG 692'650 0.1 - 02.09.2013 Investment Advisor
Firm Name Analyst Recommendation Weighting Change Target Price Date Date
Guotai Junan HU CHUNXIA buy 5 M 50 12 month 02.09.2013
PingAn Securities WEN XIAN buy 5 M #N/A N/A Not Provided 02.09.2013
SWS Research Co Ltd MICHAEL TONG outperform 5 M #N/A N/A Not Provided 01.09.2013
JPMorgan KURUMLU EBRU SENER underweight 1 M 38 9 month 30.08.2013
Capital Securities Corp LIU HUI hold 3 M 40 Not Provided 30.08.2013
Sinolink Securities Co Ltd CHEN GANG buy 5 U #N/A N/A Not Provided 30.08.2013
Chang Jiang Securities Co. Limited ZHIJIAN CHEN buy 5 M #N/A N/A Not Provided 30.08.2013
Morgan Stanley LILLIAN LOU Equalwt/In-Line 3 M 36 12 month 04.08.2013
Jefferies JESSIE GUO hold 3 M 37 12 month 11.07.2013
UBS ERICA POON WERKUN buy 5 U 43 12 month 08.05.2013
Goldman Sachs LISA DENG Buy/Neutral 5 M 44 12 month 23.04.2013
Masterlink Securities LIU WEI buy 5 U 45 6 month 02.04.2013
Rising Securities Co.,LTD ZHAO YUE outperform 5 M 38 12 month 01.04.2013
Everbright Securities Co., Ltd LI JIE accumulate 4 M 34 12 month 06.01.2013
Bank of China International JENNY CHAN hold 3 M 35 Not Provided 31.10.2012
Guodu Securities Co Ltd LU SHAN SHAN buy 5 M #N/A N/A Not Provided 16.08.2012
China Merchants Securities ZHU WEIHUA buy 5 M 40 6 month 05.07.2012
China Securities Co., Ltd FUSHENG HUANG add 4 M 40 Not Provided 25.06.2012
Citic Securities Co., Ltd HUANG WEI overweight 5 M 42 6 month 21.06.2012
Central China Securities LIU RAN buy 5 U #N/A N/A Not Provided 19.06.2012
Northeast Securities Co Ltd ZHU CHENGLIANG add 4 N #N/A N/A Not Provided 06.12.2011
China Investment Securities KE HAIDONG buy 5 M #N/A N/A Not Provided 07.01.2011
Industrial Securities CHEN YU buy 5 M #N/A N/A Not Provided 21.10.2010
China Galaxy Securities DONG JUNFENG buy 5 M 45 12 month 29.06.2010
Hong Yuan Securities SU JINGRAN add 4 N #N/A N/A Not Provided 23.06.2010
UBS CHEN LEI neutral 3 M 39 Not Provided 26.11.2009
KGI Securities SABRINA LEE neutral 3 M 25 12 month 13.05.2009
Holdings By:
Tsingtao Brewery Co Ltd ee
Q.M.S Advisors | tel: +41 (0)78 922 08 77 | e-mail: [email protected] |
Page 174
09.09.2013
Beijing Tongrentang Co., Ltd. develops, manufactures, and markets Chinese
traditional medicines and medicinal wines. The Company also operates
pharmaceutical retail businesses and provides consulting services.
Latest Fiscal Year: 12/2012
LTM as of: 06/yy
52-Week High (16.05.2013) 25.30
52-Week Low (28.11.2012) 16.18
Daily Volume
21.85
52-Week High % Change -13.64% Dividend Yield -
52-Week Low % Change 35.04% Beta 0.84
% 52 Week Price Range High/Low 66.56% Equity Float 546.63
Shares Out 30.06.2013 1'302.1 Short Int -
28'450.91 1 Yr Total Return 26.74%
Total Debt 1'264.92 YTD Return 23.89%
Preferred Stock 0.0 Adjusted BETA 0.843
Minority Interest 1'625.5 Analyst Recs 9
Cash and Equivalents 3'640.06 Consensus Rating 3.889
Enterprise Value 27'366.40
Average Volume 5 Day 6'370'674
600085 CH EQUITY YTD Change - Average Volume 30 Day 8'658'459
600085 CH EQUITY YTD % CHANGE - Average Volume 3 Month 8'593'821
LTM-4Q LTM FY+1 FY+2 FQ+1 FQ+2
31.12.2008 31.12.2009 31.12.2010 31.12.2011 31.12.2012 06/yy 06/yy 12/13 Y 12/14 Y 09/13 Q3 12/13 Q4
2'904.9 3'247.3 4'889.7 6'049.5 7'428.9 7'796.8 8'269.5 9'215.1 11'205.1 - -
2.14x 3.20x 3.52x 2.93x 3.02x 9.47x 12.10x - - - -
514.1 555.9 722.5 939.5 1'212.6 0.0 0.0 1'474.0 1'827.5 - -
12.11x 18.69x 23.80x 18.90x 18.52x 0.00x 0.00x 18.57x 14.97x - -
258.9 288.0 340.4 438.1 570.1 486.5 635.3 731.0 922.0 - -
24.77x 38.03x 52.44x 41.76x 40.68x 46.73x 44.83x 39.09x 31.08x - -
EBITDA 1'212.60 Long-Term Rating Date -
EBIT 1'083.48 Long-Term Rating -
Operating Margin 14.58% Long-Term Outlook -
Pretax Margin 14.49% Short-Term Rating Date -
Return on Assets 6.56% Short-Term Rating -
Return on Common Equity 16.43%
Return on Capital - EBITDA/Interest Exp. 65.67
Asset Turnover 0.85% (EBITDA-Capex)/Interest Exp. 50.03
Net Debt/EBITDA -
Gross Margin 42.8% Total Debt/EBITDA -
EBITDA Margin -
EBIT Margin 15.0% Total Debt/Equity 31.8%
Net Income Margin 7.7% Total Debt/Capital 18.4%
Asset Turnover 0.85
Current Ratio 2.79 Net Fixed Asset Turnover 5.63
Quick Ratio 1.43 Accounts receivable turnover-days 30.77
Debt to Assets 13.08% Inventory Days 269.76
Tot Debt to Common Equity 31.79% Accounts Payable Turnover Day 119.92
Accounts Receivable Turnover 11.86 Cash Conversion Cycle 206.94
Inventory Turnover 1.35
Fiscal Year Ended
Beijing Tongrentang Co LtdPrice/Volume
Valuation Analysis
12'344'258.00
Current Price (9/dd/yy) Market Data
Net Income
P/E
Market Capitalization
Average Daily Trading Volume
Relative Stock Price Performance
Total Revenue
TEV/Revenue
EBITDA
TEV/EBITDA
Profitability S&P Issuer Ratings
Credit Ratios
Margin Analysis
Reference
Structure
,
2
-,
-2
.,
.2
0,
o!-. l!-. k!-. a!-. g!-0 c!-0 j!-0 Q!-0 j!-0 g!-0 g!-0 Q!-0 o!-0', F
2', F
-,', F
-2', F
.,', F
.2', F
0.0
1'000.0
2'000.0
3'000.0
4'000.0
5'000.0
6'000.0
7'000.0
8'000.0
2001 2002 2003 2004 2005 2006 2007 2008 2009 2010 2011 2012
,',,
2',,
-,',,
-2',,
.,',,
.2',,
0,',,
02',,
1,',,
12',,
2,',,
,-',-'.,-, ,-',4'.,-, ,-',-'.,-- ,-',4'.,-- ,-',-'.,-. ,-',4'.,-. ,-',-'.,-0 ,-',4'.,-0
FReTn/CTrThoT/PolhirTlAlcST/ !Rna /eis FReTn/CTrThoT/PolhirTlAlcST/ !Rna /eis
Q.M.S Advisors | tel: +41 (0)78 922 08 77 | e-mail: [email protected] |
Page 175
09.09.2013
Holder Name Portfolio Name Source Amt Held % Out Latest Chg File Dt Inst Type
CHINA BEIJING TONGRE n/a Co File 719'308'540 55.24 - 31.12.2012 Government
E FUND MANAGEMENT Multiple Portfolios MF-AGG 42'047'465 3.23 (8'699'064) 31.12.2012 Investment Advisor
SOCIAL SECURITY FUND n/a Co File 35'899'698 2.76 - 31.12.2012 Government
CHANGSHENG FUND MANA Multiple Portfolios MF-AGG 20'023'562 1.54 (5'001'323) 31.12.2012 Investment Advisor
CHINA UNIVERSAL ASSE Multiple Portfolios MF-AGG 13'423'450 1.03 7'203'094 02.09.2013 Investment Advisor
YINHUA FUND MANAGEME Multiple Portfolios MF-AGG 12'883'096 0.99 9'243'735 30.06.2013 Investment Advisor
HUASHANG FUND MANAGE Multiple Portfolios MF-AGG 12'401'011 0.95 9'990'486 31.12.2012 Investment Advisor
HARVEST FUND MANAGEM Multiple Portfolios MF-AGG 10'320'633 0.79 (274'468) 28.06.2013 Investment Advisor
PICC LIFE INSURANCE n/a Co File 10'000'000 0.77 - 31.12.2012 Government
GF FUND MANAGEMENT C Multiple Portfolios MF-AGG 8'360'145 0.64 (2'494'404) 31.12.2012 Investment Advisor
CHINA MERCHANTS FUND Multiple Portfolios MF-AGG 8'031'908 0.62 946'422 30.06.2013 Investment Advisor
GUOTAI JUNAN SECURIT n/a Co File 5'478'301 0.42 - 31.12.2012 Investment Advisor
HUATAI-PINEBRIDGE FU Multiple Portfolios MF-AGG 5'170'884 0.4 2'153'846 31.12.2012 Investment Advisor
CCB PRINCIPAL ASSET Multiple Portfolios MF-AGG 4'186'696 0.32 1'100'127 30.06.2013 Investment Advisor
RONGTONG FUND MANAGE Multiple Portfolios MF-AGG 3'634'643 0.28 1'634'739 31.12.2012 Investment Advisor
CHINA SOUTHERN FUND Multiple Portfolios MF-AGG 3'359'144 0.26 (3'455'391) 31.12.2012 Investment Advisor
UBS SDIC FUND MANAGE Multiple Portfolios MF-AGG 3'156'473 0.24 2'890'675 31.12.2012 Investment Advisor
HUAAN FUND MANAGEMEN Multiple Portfolios MF-AGG 1'947'600 0.15 (2'765'052) 31.12.2012 Investment Advisor
GOLDEN EAGLE ASSET M Multiple Portfolios MF-AGG 1'750'438 0.13 680'802 31.12.2012 Investment Advisor
LION FUND MANAGEMENT Multiple Portfolios MF-AGG 1'688'603 0.13 872'626 31.12.2012 Investment Advisor
Firm Name Analyst Recommendation Weighting Change Target Price Date Date
Guotai Junan LI QIUSHI buy 5 M 26 Not Provided 02.09.2013
Chang Jiang Securities Co. Limited Liu Shuchang buy 5 M #N/A N/A Not Provided 02.09.2013
SWS Research Co Ltd SELINA LUO outperform 5 M #N/A N/A Not Provided 30.08.2013
Capital Securities Corp TEAM COVERAGE hold 3 M #N/A N/A Not Provided 27.08.2013
Sinolink Securities Co Ltd LI JINGLEI add 4 M #N/A N/A Not Provided 27.08.2013
Fortune CLSA Securities Limited ZEN ZHOU underperform 1 M 24 12 month 27.08.2013
Morgan Stanley BIN LI Equalwt/Attractive 3 M 22 12 month 29.07.2013
Hong Yuan Securities WEI WENQING add 4 M #N/A N/A Not Provided 06.07.2013
HuaChuang Securities LIAO WANGUO buy 5 M 19 6 month 30.11.2012
Citic Securities Co., Ltd LI CHAO add 4 M #N/A N/A Not Provided 03.05.2012
China Merchants Securities LI SHANSHAN buy 5 M #N/A N/A Not Provided 28.04.2012
Industrial Securities WANG XI buy 5 M #N/A N/A Not Provided 04.04.2012
PingAn Securities LING JUN buy 5 M #N/A N/A Not Provided 06.02.2012
China Investment Securities ZHOU RUI neutral 3 M #N/A N/A Not Provided 02.12.2011
Guodu Securities Co Ltd PAN LEI buy 5 M #N/A N/A Not Provided 16.06.2011
Great Wall Securities YANG YUE strong buy 5 N #N/A N/A Not Provided 23.05.2011
Central China Securities WANG BO add 4 M #N/A N/A Not Provided 25.05.2009
Holdings By:
Beijing Tongrentang Co Ltd ee
Q.M.S Advisors | tel: +41 (0)78 922 08 77 | e-mail: [email protected] |
Page 176
09.09.2013
Sanan Optoelectronics Co., Ltd. operates in the business of researching,
producing and selling of LED epitaxial wafers and wafers.
Latest Fiscal Year: 12/2012
LTM as of: 06/yy
52-Week High (23.07.2013) 23.14
52-Week Low (16.04.2013) 10.93
Daily Volume
19.37
52-Week High % Change -16.29% Dividend Yield -
52-Week Low % Change 77.22% Beta 1.01
% 52 Week Price Range High/Low 73.05% Equity Float 634.45
Shares Out 09.07.2013 1'444.0 Short Int -
27'970.55 1 Yr Total Return 21.33%
Total Debt 3'497.84 YTD Return 43.05%
Preferred Stock 0.0 Adjusted BETA 1.007
Minority Interest 251.3 Analyst Recs 11
Cash and Equivalents 1'500.88 Consensus Rating 4.818
Enterprise Value 30'229.98
Average Volume 5 Day 11'023'500
600703 CH EQUITY YTD Change - Average Volume 30 Day 12'120'090
600703 CH EQUITY YTD % CHANGE - Average Volume 3 Month 15'661'090
LTM-4Q LTM FY+1 FY+2 FQ+1 FQ+2
31.12.2008 31.12.2009 31.12.2010 31.12.2011 31.12.2012 06/yy 06/yy 12/13 Y 12/14 Y 09/13 Q3 12/13 Q4
211.7 465.5 857.4 1'742.5 3'355.5 2'392.9 3'659.0 4'958.0 6'944.5 1'375.0 1'314.0
12.00x 30.35x 33.41x 9.44x 6.56x 30.95x 26.98x - - - -
103.6 230.7 420.3 776.6 1'009.6 0.0 0.0 1'315.5 1'791.5 - -
24.53x 61.22x 68.15x 21.18x 21.79x 0.00x 0.00x 22.98x 16.87x - -
52.1 180.2 419.3 936.2 810.0 943.3 806.8 1'100.4 1'313.7 305.0 202.0
34.11x 74.30x 63.69x 16.82x 24.43x 20.64x 35.14x 25.62x 21.03x - -
EBITDA 1'009.60 Long-Term Rating Date -
EBIT 598.16 Long-Term Rating -
Operating Margin 17.83% Long-Term Outlook -
Pretax Margin 30.24% Short-Term Rating Date -
Return on Assets 7.04% Short-Term Rating -
Return on Common Equity 13.54%
Return on Capital - EBITDA/Interest Exp. 4.92
Asset Turnover 0.32% (EBITDA-Capex)/Interest Exp. -1.93
Net Debt/EBITDA -
Gross Margin 25.9% Total Debt/EBITDA -
EBITDA Margin -
EBIT Margin 20.3% Total Debt/Equity 57.9%
Net Income Margin 24.1% Total Debt/Capital 35.7%
Asset Turnover 0.32
Current Ratio 3.43 Net Fixed Asset Turnover 0.59
Quick Ratio 2.12 Accounts receivable turnover-days 139.83
Debt to Assets 30.04% Inventory Days 148.37
Tot Debt to Common Equity 57.89% Accounts Payable Turnover Day 60.00
Accounts Receivable Turnover 2.61 Cash Conversion Cycle 185.54
Inventory Turnover 2.46
Profitability S&P Issuer Ratings
Credit Ratios
Margin Analysis
Reference
Structure
Net Income
P/E
Market Capitalization
Average Daily Trading Volume
Relative Stock Price Performance
Total Revenue
TEV/Revenue
EBITDA
TEV/EBITDA
Fiscal Year Ended
Sanan Optoelectronics Co LtdPrice/Volume
Valuation Analysis
16'394'310.00
Current Price (9/dd/yy) Market Data
,
2
-,
-2
.,
.2
o!-. l!-. k!-. a!-. g!-0 c!-0 j!-0 Q!-0 j!-0 g!-0 g!-0 Q!-0 o!-0', F
-,', F
.,', F
0,', F
1,', F
2,', F
3,', F
0.0
500.0
1'000.0
1'500.0
2'000.0
2'500.0
3'000.0
3'500.0
4'000.0
2001 2002 2003 2004 2005 2006 2007 2008 2009 2010 2011 2012
,',,
.,',,
1,',,
3,',,
5,',,
-,,',,
-.,',,
,-',-'.,-, ,-',4'.,-, ,-',-'.,-- ,-',4'.,-- ,-',-'.,-. ,-',4'.,-. ,-',-'.,-0 ,-',4'.,-0
FReTn/CTrThoT/PolhirTlAlcST/ !Rna /eis FReTn/CTrThoT/PolhirTlAlcST/ !Rna /eis
Q.M.S Advisors | tel: +41 (0)78 922 08 77 | e-mail: [email protected] |
Page 177
09.09.2013
Holder Name Portfolio Name Source Amt Held % Out Latest Chg File Dt Inst Type
XIAMEN SANAN ELECTRO n/a Co File 505'759'725 35.02 - 31.12.2012 Corporation
FUJIAN SANAN GROUP C n/a Co File 245'448'074 17 - 31.12.2012 Corporation
ZHENGRONG WANG n/a Co File 56'477'400 3.91 - 31.12.2012 n/a
JIANGXI INTERNATIONA n/a Co File 45'351'770 3.14 - 31.12.2012 Corporation
HAITONG SECURITIES C n/a Co File 44'000'000 3.05 - 31.12.2012 Investment Advisor
YINHUA FUND MANAGEME Multiple Portfolios MF-AGG 40'403'688 2.8 (29'281'822) 30.06.2013 Investment Advisor
HUABAO TRUST INVESTM n/a Co File 38'120'564 2.64 - 31.12.2012 Investment Advisor
DACHENG FUND MANAGME Multiple Portfolios MF-AGG 28'338'215 1.96 21'300'060 31.12.2012 Investment Advisor
CHINA SOUTHERN FUND Multiple Portfolios MF-AGG 17'080'521 1.18 12'308'163 30.06.2013 Investment Advisor
HFT INVESTMENT MANAG Multiple Portfolios MF-AGG 14'588'715 1.01 (1'003'578) 31.12.2012 Investment Advisor
FORTUNE SGAM FUND MA Multiple Portfolios MF-AGG 12'743'398 0.88 7'662'499 31.12.2012 Investment Advisor
PINGAN TRUST CO LTD n/a Co File 12'542'826 0.87 - 31.12.2012 Other
ABC-CA FUND MANAGEME Multiple Portfolios MF-AGG 10'926'584 0.76 9'156'903 30.06.2013 Investment Advisor
HARVEST FUND MANAGEM Multiple Portfolios MF-AGG 7'554'047 0.52 (2'078'728) 31.12.2012 Investment Advisor
PENGHUA FUND MANAGEM Multiple Portfolios MF-AGG 6'645'202 0.46 6'450'787 30.06.2013 Investment Advisor
GF FUND MANAGEMENT C Multiple Portfolios MF-AGG 4'637'462 0.32 4'323'709 31.12.2012 Investment Advisor
SYWG BNP PARIBAS ASS Multiple Portfolios MF-AGG 4'000'516 0.28 3'758'116 31.12.2012 Investment Advisor
FULLGOAL FUND MANAGE Multiple Portfolios MF-AGG 3'704'291 0.26 (2'451'373) 31.12.2012 Investment Advisor
CCB PRINCIPAL ASSET Multiple Portfolios MF-AGG 3'500'259 0.24 3'071'944 31.12.2012 Investment Advisor
HUATAI-PINEBRIDGE FU Multiple Portfolios MF-AGG 3'326'664 0.23 (6'466) 31.12.2012 Investment Advisor
Firm Name Analyst Recommendation Weighting Change Target Price Date Date
Chang Jiang Securities Co. Limited XIAOQIANG GAO buy 5 M #N/A N/A Not Provided 26.08.2013
PingAn Securities LU SHAN not rated #N/A N/A M #N/A N/A Not Provided 19.08.2013
Everbright Securities Co., Ltd JIAN KUAI buy 5 M 24 6 month 18.08.2013
Capital Securities Corp ZHU JIXIANG buy 5 M 24 Not Provided 06.08.2013
Sinolink Securities Co Ltd ZHANG SHUAI buy 5 M 26 12 month 06.08.2013
Fortune CLSA Securities Limited FENG LINGTIAN buy 5 M 27 12 month 06.08.2013
Guotai Junan XIONG JUN buy 5 M #N/A N/A Not Provided 22.07.2013
SWS Research Co Ltd TONY YU outperform 5 M #N/A N/A Not Provided 17.07.2013
Masterlink Securities LV HAN buy 5 M 22 Not Provided 28.05.2013
Founder Securities SHENG JINSONG buy 5 M #N/A N/A Not Provided 29.03.2013
Rising Securities Co.,LTD SONG LEI outperform 5 M #N/A N/A Not Provided 18.12.2012
Goldman Sachs AMY SONG neutral/neutral 3 N 13 12 month 17.12.2012
Central China Securities FANG XIAHONG add 4 M #N/A N/A Not Provided 20.08.2012
AJ Securities ZHU ZHIYONG buy 5 M 17 6 month 10.08.2012
Hong Yuan Securities LI KUNYANG buy 5 M #N/A N/A Not Provided 10.01.2012
Northeast Securities Co Ltd WU NA add 4 M #N/A N/A Not Provided 03.11.2011
Industrial Securities LIU LIANG buy 5 M #N/A N/A Not Provided 23.10.2011
China Investment Securities WANG HAIJUN buy 5 D #N/A N/A Not Provided 03.02.2010
KGI Securities HONDA WEI outperform 5 M 8 12 month 24.09.2009
Holdings By:
Sanan Optoelectronics Co Ltd ee
Q.M.S Advisors | tel: +41 (0)78 922 08 77 | e-mail: [email protected] |
Page 178
09.09.2013
Metallurgical Corporation of China Ltd., through its subsidiaries, operates in
EPC projects (engineering, procurement and construction) mainly for
metallurgical facilities, natural resources exploration, equipment fabrication,
and property development.
Latest Fiscal Year: 12/2011
LTM as of: 06/yy
52-Week High (04.01.2013) 2.36
52-Week Low (25.06.2013) 1.52
Daily Volume
1.78
52-Week High % Change -24.58% Dividend Yield 0.00
52-Week Low % Change 17.11% Beta 0.90
% 52 Week Price Range High/Low 25.00% Equity Float 3'586.63
Shares Out 30.06.2013 16'239.0 Short Int -
32'395.20 1 Yr Total Return -15.24%
Total Debt 131'502.00 YTD Return -21.24%
Preferred Stock 0.0 Adjusted BETA 0.896
Minority Interest 11'653.0 Analyst Recs 2
Cash and Equivalents 33'086.00 Consensus Rating 3.000
Enterprise Value 136'633.21
Average Volume 5 Day 36'494'150
601618 CH EQUITY YTD Change - Average Volume 30 Day 38'602'430
601618 CH EQUITY YTD % CHANGE - Average Volume 3 Month 39'592'200
LTM-4Q LTM FY+1 FY+2 FQ+1 FQ+2
31.12.2008 31.12.2009 31.12.2010 31.12.2011 31.12.2012 06/yy 06/yy 12/13 Y 12/14 Y 09/13 Q3 12/13 Q4
149'987.0 165'495.0 206'397.0 222'113.0 216'242.0 224'659.9 199'406.0 244'236.0 237'566.5 - -
- 0.82x 0.72x 0.68x 0.69x 2.26x 2.49x - - - -
7'607.4 9'817.0 12'598.0 12'775.0 10'390.0 0.0 0.0 - - - -
- 13.82x 11.85x 11.86x 14.46x 0.00x 0.00x - - - -
3'068.1 4'425.0 5'321.0 4'243.0 (6'952.0) 2'092.3 (5'285.0) 2'959.5 3'310.5 - -
- 13.47x 10.39x 4.24x 9.79x 12.16x 0.00x 11.48x 10.17x - -
EBITDA 10'390.00 Long-Term Rating Date -
EBIT 7'522.00 Long-Term Rating -
Operating Margin 3.48% Long-Term Outlook -
Pretax Margin 0.86% Short-Term Rating Date -
Return on Assets -2.11% Short-Term Rating -
Return on Common Equity -15.56%
Return on Capital -6.98% EBITDA/Interest Exp. 1.19
Asset Turnover 0.66% (EBITDA-Capex)/Interest Exp. 0.62
Net Debt/EBITDA 9.47
Gross Margin 7.4% Total Debt/EBITDA 12.66
EBITDA Margin 4.8%
EBIT Margin 3.5% Total Debt/Equity 319.6%
Net Income Margin -3.2% Total Debt/Capital 71.4%
Asset Turnover 0.66
Current Ratio 1.14 Net Fixed Asset Turnover 4.37
Quick Ratio 0.44 Accounts receivable turnover-days 93.59
Debt to Assets 40.31% Inventory Days 197.86
Tot Debt to Common Equity 319.58% Accounts Payable Turnover Day 116.41
Accounts Receivable Turnover 3.91 Cash Conversion Cycle 175.05
Inventory Turnover 1.85
Profitability S&P Issuer Ratings
Credit Ratios
Margin Analysis
Reference
Structure
Net Income
P/E
Market Capitalization
Average Daily Trading Volume
Relative Stock Price Performance
Total Revenue
TEV/Revenue
EBITDA
TEV/EBITDA
Fiscal Year Ended
Metallurgical Corp of China LtdPrice/Volume
Valuation Analysis
70'363'442.00
Current Price (9/dd/yy) Market Data
,
-
-
.
.
0
o!-. l!-. k!-. a!-. g!-0 c!-0 j!-0 Q!-0 j!-0 g!-0 g!-0 Q!-0 o!-0', F.,', F1,', F3,', F5,', F-,,', F-.,', F-1,', F-3,', F-5,', F
0.0
50'000.0
100'000.0
150'000.0
200'000.0
250'000.0
2001 2002 2003 2004 2005 2006 2007 2008 2009 2010 2011 2012
,',,
.',,
1',,
3',,
5',,
-,',,
-.',,
-1',,
-3',,
-5',,
.,',,
,-',-'.,-, ,-',4'.,-, ,-',-'.,-- ,-',4'.,-- ,-',-'.,-. ,-',4'.,-. ,-',-'.,-0 ,-',4'.,-0
FReTn/CTrThoT/PolhirTlAlcST/ !Rna /eis FReTn/CTrThoT/PolhirTlAlcST/ !Rna /eis
Q.M.S Advisors | tel: +41 (0)78 922 08 77 | e-mail: [email protected] |
Page 179
09.09.2013
Holder Name Portfolio Name Source Amt Held % Out Latest Chg File Dt Inst Type
CHINA METALLURGICAL n/a Co File 12'265'108'500 75.53 - 31.12.2012 Government
SOCIAL SECURITY FUND n/a Co File 264'253'476 1.63 - 31.12.2012 Government
PICC PROPERTY & CASU n/a Co File 132'346'374 0.81 - 31.12.2012 Government
BAOSTEEL GROUP CORP n/a Co File 121'891'500 0.75 - 31.12.2012 Government
HARVEST FUND MANAGEM Multiple Portfolios MF-AGG 48'622'588 0.3 (21'212'226) 31.12.2012 Investment Advisor
PICC HEALTH INSURANC n/a Co File 41'691'484 0.26 - 31.12.2012 Insurance Company
HUATAI-PINEBRIDGE FU Multiple Portfolios MF-AGG 22'100'406 0.14 (41'000) 31.12.2012 Investment Advisor
HUAAN FUND MANAGEMEN Multiple Portfolios MF-AGG 16'411'537 0.1 (992'471) 31.12.2012 Investment Advisor
E FUND MANAGEMENT Multiple Portfolios MF-AGG 12'410'987 0.08 1'570'316 31.12.2012 Investment Advisor
CHINA ASSET MANAGEME Multiple Portfolios MF-AGG 9'702'630 0.06 - 02.09.2013 Investment Advisor
TIANTONG ASSET MANAG Multiple Portfolios MF-AGG 7'337'080 0.05 (329'127) 31.12.2012 Investment Advisor
BANK OF COMMUNICATIO Multiple Portfolios MF-AGG 5'725'908 0.04 (473'622) 31.12.2012 Investment Advisor
ICBC CREDIT SUISSE A Multiple Portfolios MF-AGG 5'510'900 0.03 (454'000) 31.12.2012 Investment Advisor
GUOTAI ASSET MANAGEM Multiple Portfolios MF-AGG 5'473'255 0.03 587'020 31.12.2012 Investment Advisor
CHINA UNIVERSAL ASSE Multiple Portfolios MF-AGG 5'143'560 0.03 (292'612) 02.09.2013 Investment Advisor
DACHENG FUND MANAGME Multiple Portfolios MF-AGG 4'972'016 0.03 (243'600) 31.12.2012 Investment Advisor
GTJA ALLIANZ FUND MA Multiple Portfolios MF-AGG 4'744'085 0.03 57'164 31.12.2012 Investment Advisor
CHINA SOUTHERN FUND Multiple Portfolios MF-AGG 3'686'339 0.02 76'100 31.12.2012 Investment Advisor
CHINA ASSET MANAGEME Multiple Portfolios MF-AGG 3'430'600 0.02 (39'993'617) 31.12.2012 Investment Advisor
E FUND MANAGEMENT Multiple Portfolios MF-AGG 2'821'987 0.02 - 02.09.2013 Investment Advisor
Firm Name Analyst Recommendation Weighting Change Target Price Date Date
China International Capital Corp YUE DING hold 3 M #N/A N/A Not Provided 02.09.2013
SWS Research Co Ltd ERNEST ZHANG neutral 3 M #N/A N/A Not Provided 03.04.2013
Citic Securities Co., Ltd YANG TAO buy 5 M #N/A N/A Not Provided 29.05.2012
Hong Yuan Securities ZHAO LIMING buy 5 M 3 6 month 30.03.2012
China Investment Securities LI FAN buy 5 M #N/A N/A Not Provided 03.08.2011
Masterlink Securities TEAM COVERAGE buy 5 N 5 Not Provided 11.05.2011
Industrial Securities WANG SHUANG buy 5 N #N/A N/A Not Provided 17.12.2010
China Securities Co., Ltd TIAN DONGHONG not rated #N/A N/A M 7 Not Provided 02.12.2009
Holdings By:
Metallurgical Corp of China Ltd ee
Q.M.S Advisors | tel: +41 (0)78 922 08 77 | e-mail: [email protected] |
Page 180
09.09.2013
Sinohydro. Group Limited conducts project contracting, power investment and
operations, equipment manufacturing and leasing, as well as property
development.
Latest Fiscal Year: 12/2012
LTM as of: 06/yy
52-Week High (05.02.2013) 4.24
52-Week Low (09.07.2013) 2.55
Daily Volume
3
52-Week High % Change -29.25% Dividend Yield 4.27
52-Week Low % Change 17.65% Beta 1.21
% 52 Week Price Range High/Low 19.53% Equity Float 9'189.92
Shares Out 30.06.2013 9'600.0 Short Int -
28'800.00 1 Yr Total Return -6.99%
Total Debt 70'562.34 YTD Return -17.70%
Preferred Stock 0.0 Adjusted BETA 1.212
Minority Interest 3'930.8 Analyst Recs 6
Cash and Equivalents 27'086.32 Consensus Rating 4.833
Enterprise Value 90'235.48
Average Volume 5 Day 60'362'660
601669 CH EQUITY YTD Change - Average Volume 30 Day 51'836'180
601669 CH EQUITY YTD % CHANGE - Average Volume 3 Month 56'269'610
LTM-4Q LTM FY+1 FY+2 FQ+1 FQ+2
31.12.2008 31.12.2009 31.12.2010 31.12.2011 31.12.2012 06/yy 06/yy 12/13 Y 12/14 Y 09/13 Q3 12/13 Q4
59'137.9 73'380.8 99'054.2 110'647.2 124'051.5 80'381.7 134'706.5 151'835.0 180'244.5 - -
- - - 0.63x 0.68x 2.01x 2.45x - - - -
- 7'466.7 9'163.8 11'435.5 12'302.5 0.0 0.0 15'502.0 18'995.0 - -
- - - 6.10x 6.83x 0.00x 0.00x 5.82x 4.75x - -
1'265.7 2'289.7 2'911.1 3'619.1 4'094.2 2'768.8 4'310.2 4'968.0 5'885.0 - -
- - - 8.31x 8.96x 0.00x 6.42x 6.02x 5.15x - -
EBITDA 12'302.54 Long-Term Rating Date -
EBIT 7'863.18 Long-Term Rating -
Operating Margin 6.34% Long-Term Outlook -
Pretax Margin 4.45% Short-Term Rating Date -
Return on Assets 2.38% Short-Term Rating -
Return on Common Equity 14.07%
Return on Capital 7.01% EBITDA/Interest Exp. 3.23
Asset Turnover 0.72% (EBITDA-Capex)/Interest Exp. -0.77
Net Debt/EBITDA 3.53
Gross Margin 11.5% Total Debt/EBITDA 5.74
EBITDA Margin 9.9%
EBIT Margin 6.3% Total Debt/Equity 228.1%
Net Income Margin 3.3% Total Debt/Capital 66.9%
Asset Turnover 0.72
Current Ratio 1.17 Net Fixed Asset Turnover 2.45
Quick Ratio 0.54 Accounts receivable turnover-days 53.40
Debt to Assets 38.87% Inventory Days 116.22
Tot Debt to Common Equity 228.14% Accounts Payable Turnover Day 82.89
Accounts Receivable Turnover 6.85 Cash Conversion Cycle 86.73
Inventory Turnover 3.15
Profitability S&P Issuer Ratings
Credit Ratios
Margin Analysis
Reference
Structure
Net Income
P/E
Market Capitalization
Average Daily Trading Volume
Relative Stock Price Performance
Total Revenue
TEV/Revenue
EBITDA
TEV/EBITDA
Fiscal Year Ended
SINOHYDRO Group LtdPrice/Volume
Valuation Analysis
132'205'235.00
Current Price (9/dd/yy) Market Data
,--..00112
o!-. l!-. k!-. a!-. g!-0 c!-0 j!-0 Q!-0 j!-0 g!-0 g!-0 Q!-0 o!-0', F
2,', F
-,,', F
-2,', F
.,,', F
.2,', F
0.0
20'000.0
40'000.0
60'000.0
80'000.0
100'000.0
120'000.0
140'000.0
2001 2002 2003 2004 2005 2006 2007 2008 2009 2010 2011 2012
,',,
2,,',,
-',,,',,
-'2,,',,
.',,,',,
.'2,,',,
0',,,',,
,-',-'.,-, ,-',4'.,-, ,-',-'.,-- ,-',4'.,-- ,-',-'.,-. ,-',4'.,-. ,-',-'.,-0 ,-',4'.,-0
FReTn/CTrThoT/PolhirTlAlcST/ !Rna /eis FReTn/CTrThoT/PolhirTlAlcST/ !Rna /eis
Q.M.S Advisors | tel: +41 (0)78 922 08 77 | e-mail: [email protected] |
Page 181
09.09.2013
Holder Name Portfolio Name Source Amt Held % Out Latest Chg File Dt Inst Type
SOCIAL SECURITY FUND n/a Co File 347'080'559 3.62 - 31.12.2012 Government
GUOTAI JUNAN SECURIT n/a Co File 153'688'800 1.6 - 31.12.2012 Investment Advisor
CHINA ASSET MANAGEME Multiple Portfolios MF-AGG 131'731'653 1.37 274'805 31.12.2012 Investment Advisor
YINHUA FUND MANAGEME Multiple Portfolios MF-AGG 126'384'534 1.32 2'235'544 31.12.2012 Investment Advisor
HUAAN FUND MANAGEMEN Multiple Portfolios MF-AGG 71'932'375 0.75 57'319'603 31.12.2012 Investment Advisor
SINOHYDRO CONSTRUCT n/a Co File 63'000'000 0.66 - 31.12.2012 Corporation
FOUNDER SECURITIES C n/a Co File 57'300'620 0.6 - 31.12.2012 Unclassified
GF FUND MANAGEMENT C Multiple Portfolios MF-AGG 50'002'367 0.52 4'479'194 31.12.2012 Investment Advisor
CHINA AMC ADVANTAGE n/a EXCH 45'838'267 0.48 - 17.10.2011 n/a
HFT INVESTMENT MANAG Multiple Portfolios MF-AGG 45'183'791 0.47 17'855'729 31.12.2012 Investment Advisor
PEOPLE'S INSURANCE C n/a Co File 44'381'304 0.46 - 31.12.2012 Government
HONGYANG FUND n/a EXCH 40'108'483 0.42 - 17.10.2011 n/a
CHINA LIFE INSURANCE n/a ULT-AGG 37'337'713 0.39 - 31.12.2012 Government
CHANG XIN ASSET MANA Multiple Portfolios MF-AGG 34'941'506 0.36 3'330'440 31.12.2012 Investment Advisor
HARVEST FUND MANAGEM Multiple Portfolios MF-AGG 33'682'839 0.35 (77'497'523) 31.12.2012 Investment Advisor
ICBC CREDIT SUISSE A Multiple Portfolios MF-AGG 31'762'294 0.33 1'528'118 31.12.2012 Investment Advisor
CHINA UNIVERSAL ASSE Multiple Portfolios MF-AGG 28'488'014 0.3 (103'250'129) 02.09.2013 Investment Advisor
CHANGSHENG FUND MANA Multiple Portfolios MF-AGG 28'290'306 0.29 27'364'092 31.12.2012 Investment Advisor
CHINA SOUTHERN FUND Multiple Portfolios MF-AGG 23'420'404 0.24 8'872'126 31.12.2012 Investment Advisor
GALAXY ASSET MANAGEM Multiple Portfolios MF-AGG 22'848'690 0.24 9'848'690 31.12.2012 Investment Advisor
Firm Name Analyst Recommendation Weighting Change Target Price Date Date
Chang Jiang Securities Co. Limited SHI HENGHUI buy 5 M #N/A N/A Not Provided 22.07.2013
PingAn Securities GRACE LI buy 5 M 4 Not Provided 24.05.2013
Guotai Junan ZHANG KUN buy 5 M 5 12 month 23.05.2013
Sinolink Securities Co Ltd HE GUOWEN add 4 M #N/A N/A Not Provided 23.04.2013
Citic Securities Co., Ltd YANG TAO buy 5 M #N/A N/A Not Provided 14.01.2013
Bank of China International LI PAN buy 5 N 4 12 month 20.12.2012
China Merchants Securities MENG QUN strong buy 5 M 6 6 month 11.06.2012
Hong Yuan Securities ZHOU RONGZI buy 5 M #N/A N/A Not Provided 24.04.2012
Great Wall Securities RAN FEI buy 5 N #N/A N/A Not Provided 30.03.2012
HuaChuang Securities ZHANG CHI strong buy 5 N #N/A N/A Not Provided 28.11.2011
Holdings By:
SINOHYDRO Group Ltd ee
Q.M.S Advisors | tel: +41 (0)78 922 08 77 | e-mail: [email protected] |
Page 182
09.09.2013
Chongqing Water Group Co., Ltd. is a holding company. The Company, through
holding subsidiaries, joint ventures and associated companies, produces and
sells tap water, collects and treats urban wastewater, and constructs water
supply and drainage facilities.
Latest Fiscal Year: 12/2012
LTM as of: 06/yy
52-Week High (06.03.2013) 7.55
52-Week Low (04.12.2012) 4.69
Daily Volume
5.86
52-Week High % Change -22.38% Dividend Yield -
52-Week Low % Change 24.95% Beta 1.16
% 52 Week Price Range High/Low 35.66% Equity Float 488.09
Shares Out 30.06.2013 4'800.0 Short Int -
28'128.00 1 Yr Total Return 8.27%
Total Debt 3'542.80 YTD Return 14.79%
Preferred Stock 0.0 Adjusted BETA 1.158
Minority Interest 8.2 Analyst Recs 2
Cash and Equivalents 3'555.18 Consensus Rating 4.000
Enterprise Value 28'936.36
Average Volume 5 Day 10'549'770
601158 CH EQUITY YTD Change - Average Volume 30 Day 13'247'440
601158 CH EQUITY YTD % CHANGE - Average Volume 3 Month 10'591'570
LTM-4Q LTM FY+1 FY+2 FQ+1 FQ+2
31.12.2008 31.12.2009 31.12.2010 31.12.2011 31.12.2012 06/yy 06/yy 12/13 Y 12/14 Y 09/13 Q3 12/13 Q4
2'357.6 2'713.6 3'254.9 3'738.3 3'931.4 3'983.5 3'911.9 4'154.0 4'428.3 - -
- - 12.19x 8.05x 6.48x 30.00x 27.49x - - - -
1'415.4 1'503.5 1'722.8 1'771.5 1'846.6 0.0 0.0 1'984.0 2'056.0 - -
- - 23.04x 17.00x 13.80x 0.00x 0.00x 14.58x 14.07x - -
736.2 1'014.1 1'293.7 1'609.0 1'888.6 1'665.1 1'965.8 1'951.0 2'052.3 - -
- - 29.54x 17.68x 13.62x 16.60x 12.56x 14.40x 13.72x - -
EBITDA 1'846.63 Long-Term Rating Date -
EBIT 1'305.78 Long-Term Rating -
Operating Margin 33.21% Long-Term Outlook -
Pretax Margin 47.56% Short-Term Rating Date -
Return on Assets 10.93% Short-Term Rating -
Return on Common Equity 16.76%
Return on Capital - EBITDA/Interest Exp. 13.94
Asset Turnover 0.22% (EBITDA-Capex)/Interest Exp. 10.25
Net Debt/EBITDA -
Gross Margin 47.0% Total Debt/EBITDA -
EBITDA Margin -
EBIT Margin 33.9% Total Debt/Equity 28.6%
Net Income Margin 48.0% Total Debt/Capital 22.2%
Asset Turnover 0.22
Current Ratio 2.81 Net Fixed Asset Turnover 0.46
Quick Ratio 2.43 Accounts receivable turnover-days 64.01
Debt to Assets 19.75% Inventory Days 22.89
Tot Debt to Common Equity 28.60% Accounts Payable Turnover Day 141.37
Accounts Receivable Turnover 5.70 Cash Conversion Cycle -70.97
Inventory Turnover 15.94
Fiscal Year Ended
Chongqing Water Group Co LtdPrice/Volume
Valuation Analysis
15'128'358.00
Current Price (9/dd/yy) Market Data
Net Income
P/E
Market Capitalization
Average Daily Trading Volume
Relative Stock Price Performance
Total Revenue
TEV/Revenue
EBITDA
TEV/EBITDA
Profitability S&P Issuer Ratings
Credit Ratios
Margin Analysis
Reference
Structure
,
-
.
0
1
2
3
4
5
o!-. l!-. k!-. a!-. g!-0 c!-0 j!-0 Q!-0 j!-0 g!-0 g!-0 Q!-0 o!-0', F-,', F.,', F0,', F1,', F2,', F3,', F4,', F5,', F6,', F
0.0
500.0
1'000.0
1'500.0
2'000.0
2'500.0
3'000.0
3'500.0
4'000.0
4'500.0
2000 2001 2002 2003 2004 2005 2006 2007 2008 2009 2010 2011 2012
,',,
2',,
-,',,
-2',,
.,',,
.2',,
0,',,
02',,
1,',,
12',,
,-',-'.,-, ,-',4'.,-, ,-',-'.,-- ,-',4'.,-- ,-',-'.,-. ,-',4'.,-. ,-',-'.,-0 ,-',4'.,-0
FReTn/CTrThoT/PolhirTlAlcST/ !Rna /eis FReTn/CTrThoT/PolhirTlAlcST/ !Rna /eis
Q.M.S Advisors | tel: +41 (0)78 922 08 77 | e-mail: [email protected] |
Page 183
09.09.2013
Holder Name Portfolio Name Source Amt Held % Out Latest Chg File Dt Inst Type
CHONGQING WATER ASSE n/a Co File 3'605'000'000 75.1 - 31.12.2012 Government
CQ SUYU INDUSTRY DEV n/a Co File 645'000'000 13.44 - 31.12.2012 Other
SOCIAL SECURITY FUND n/a Co File 50'000'000 1.04 - 31.12.2012 Government
CHINA LIFE INSURANCE n/a ULT-AGG 10'266'057 0.21 - 31.12.2012 Government
CHANGSHENG FUND MANA Multiple Portfolios MF-AGG 8'639'808 0.18 (11'634'574) 31.12.2012 Investment Advisor
HARVEST FUND MANAGEM Multiple Portfolios MF-AGG 7'630'326 0.16 (5'043'512) 31.12.2012 Investment Advisor
LI XUEJIAO n/a Co File 7'383'907 0.15 - 31.12.2012 n/a
WU QIFEI n/a Co File 4'521'952 0.09 - 31.12.2012 n/a
HUATAI-PINEBRIDGE FU Multiple Portfolios MF-AGG 4'423'630 0.09 (8'893) 31.12.2012 Investment Advisor
CHINA ASSET MANAGEME Multiple Portfolios MF-AGG 3'728'157 0.08 (3'043'600) 31.12.2012 Investment Advisor
HUAAN FUND MANAGEMEN Multiple Portfolios MF-AGG 2'555'867 0.05 (332'625) 31.12.2012 Investment Advisor
E FUND MANAGEMENT Multiple Portfolios MF-AGG 2'358'990 0.05 222'790 31.12.2012 Investment Advisor
CHINA ASSET MANAGEME Multiple Portfolios MF-AGG 1'859'791 0.04 - 02.09.2013 Investment Advisor
NORGES BANK Multiple Portfolios MF-AGG 1'468'721 0.03 - 31.12.2012 Government
CHINA UNIVERSAL ASSE Multiple Portfolios MF-AGG 1'444'888 0.03 (75'861) 02.09.2013 Investment Advisor
TIANTONG ASSET MANAG Multiple Portfolios MF-AGG 1'410'057 0.03 (339'793) 31.12.2012 Investment Advisor
DACHENG FUND MANAGME Multiple Portfolios MF-AGG 1'081'574 0.02 53'500 31.12.2012 Investment Advisor
GUOTAI ASSET MANAGEM Multiple Portfolios MF-AGG 1'079'195 0.02 116'918 31.12.2012 Investment Advisor
GTJA ALLIANZ FUND MA Multiple Portfolios MF-AGG 934'868 0.02 11'249 31.12.2012 Investment Advisor
ICBC CREDIT SUISSE A Multiple Portfolios MF-AGG 653'200 0.01 (60'200) 31.12.2012 Investment Advisor
Firm Name Analyst Recommendation Weighting Change Target Price Date Date
China Minzu Securities Co Ltd LI JING add 4 M #N/A N/A Not Provided 09.08.2013
Chang Jiang Securities Co. Limited YING DENG add 4 M #N/A N/A Not Provided 07.08.2013
SWS Research Co Ltd GU FENG outperform 5 M #N/A N/A Not Provided 15.02.2012
Capital Securities Corp TEAM COVERAGE neutral 3 N #N/A N/A Not Provided 31.03.2011
Guodu Securities Co Ltd GONG JUNJIE buy 5 N #N/A N/A Not Provided 24.01.2011
HuaChuang Securities GAO LI buy 5 N #N/A N/A Not Provided 03.12.2010
Rising Securities Co.,LTD TEAM COVERAGE outperform 5 M 9 12 month 30.11.2010
Holdings By:
Chongqing Water Group Co Ltd ee
Q.M.S Advisors | tel: +41 (0)78 922 08 77 | e-mail: [email protected] |
Page 184
09.09.2013
Jinduicheng Molybdenum Co.,Ltd. is involved in molybdenum mining, dressing,
smelting, processing, research and trade in Asia.
Latest Fiscal Year: 12/2012
LTM as of: 06/yy
52-Week High (17.01.2013) 13.87
52-Week Low (25.06.2013) 7.38
Daily Volume
8.59
52-Week High % Change -38.07% Dividend Yield -
52-Week Low % Change 16.40% Beta 1.36
% 52 Week Price Range High/Low 16.18% Equity Float 688.91
Shares Out 30.06.2013 3'226.6 Short Int -
27'716.53 1 Yr Total Return -27.06%
Total Debt 427.71 YTD Return -25.57%
Preferred Stock 0.0 Adjusted BETA 1.360
Minority Interest 255.2 Analyst Recs 6
Cash and Equivalents 6'088.96 Consensus Rating 3.500
Enterprise Value 23'166.51
Average Volume 5 Day 9'031'594
601958 CH EQUITY YTD Change - Average Volume 30 Day 8'496'565
601958 CH EQUITY YTD % CHANGE - Average Volume 3 Month 7'876'863
LTM-4Q LTM FY+1 FY+2 FQ+1 FQ+2
31.12.2008 31.12.2009 31.12.2010 31.12.2011 31.12.2012 06/yy 06/yy 12/13 Y 12/14 Y 09/13 Q3 12/13 Q4
5'364.2 4'508.0 6'949.5 7'226.7 8'491.1 7'792.9 8'601.7 8'926.3 9'456.5 - -
3.27x 12.00x 10.28x 4.29x 3.81x 18.57x 13.64x 2.60x 2.37x - -
3'347.5 697.9 1'132.1 1'053.5 716.1 0.0 0.0 853.0 1'318.0 - -
5.24x 77.52x 63.13x 29.41x 45.22x 0.00x 0.00x 27.16x 17.58x - -
2'733.5 549.5 835.6 736.1 521.9 683.7 336.7 356.0 567.0 - -
11.07x 112.12x 93.23x 49.48x 73.19x 61.45x 76.31x 57.27x 40.90x - -
EBITDA 716.06 Long-Term Rating Date -
EBIT 412.01 Long-Term Rating -
Operating Margin 4.85% Long-Term Outlook -
Pretax Margin 7.45% Short-Term Rating Date -
Return on Assets 2.28% Short-Term Rating -
Return on Common Equity 2.56%
Return on Capital - EBITDA/Interest Exp. 133.90
Asset Turnover 0.58% (EBITDA-Capex)/Interest Exp. 23.49
Net Debt/EBITDA -
Gross Margin 10.1% Total Debt/EBITDA -
EBITDA Margin -
EBIT Margin 2.5% Total Debt/Equity 3.2%
Net Income Margin 6.1% Total Debt/Capital 3.0%
Asset Turnover 0.58
Current Ratio 21.34 Net Fixed Asset Turnover 1.82
Quick Ratio 17.53 Accounts receivable turnover-days 46.74
Debt to Assets 2.89% Inventory Days 56.64
Tot Debt to Common Equity 3.19% Accounts Payable Turnover Day 15.66
Accounts Receivable Turnover 7.81 Cash Conversion Cycle 93.77
Inventory Turnover 6.44
Fiscal Year Ended
Jinduicheng Molybdenum Co LtdPrice/Volume
Valuation Analysis
13'504'418.00
Current Price (9/dd/yy) Market Data
Net Income
P/E
Market Capitalization
Average Daily Trading Volume
Relative Stock Price Performance
Total Revenue
TEV/Revenue
EBITDA
TEV/EBITDA
Profitability S&P Issuer Ratings
Credit Ratios
Margin Analysis
Reference
Structure
,
.
1
3
5
-,
-.
-1
o!-. l!-. k!-. a!-. g!-0 c!-0 j!-0 Q!-0 j!-0 g!-0 g!-0 Q!-0 o!-0', F
-,', F
.,', F
0,', F
1,', F
2,', F
3,', F
4,', F
5,', F
0.0
1'000.0
2'000.0
3'000.0
4'000.0
5'000.0
6'000.0
7'000.0
8'000.0
9'000.0
2001 2002 2003 2004 2005 2006 2007 2008 2009 2010 2011 2012
,',,
.,',,
1,',,
3,',,
5,',,
-,,',,
-.,',,
-1,',,
-3,',,
-5,',,
.,,',,
,-',-'.,-, ,-',4'.,-, ,-',-'.,-- ,-',4'.,-- ,-',-'.,-. ,-',4'.,-. ,-',-'.,-0 ,-',4'.,-0
FReTn/CTrThoT/PolhirTlAlcST/ !Rna /eis FReTn/CTrThoT/PolhirTlAlcST/ !Rna /eis
Q.M.S Advisors | tel: +41 (0)78 922 08 77 | e-mail: [email protected] |
Page 185
09.09.2013
Holder Name Portfolio Name Source Amt Held % Out Latest Chg File Dt Inst Type
SX NON-FERROUS METAL n/a Co File 2'390'743'200 74.09 - 31.12.2012 Government
TAIYUAN IRON & STEEL n/a Co File 68'493'200 2.12 - 31.12.2012 Government
SOCIAL SECURITY FUND n/a Co File 64'560'000 2 - 31.12.2012 Government
ORIENT GROUP INC n/a Co File 13'900'000 0.43 - 31.12.2012 Holding Company
GUOTAI JUNAN SECURIT n/a Co File 11'029'000 0.34 - 31.12.2012 Investment Advisor
HARVEST FUND MANAGEM Multiple Portfolios MF-AGG 7'693'729 0.24 (5'085'348) 31.12.2012 Investment Advisor
HUATAI-PINEBRIDGE FU Multiple Portfolios MF-AGG 7'669'609 0.24 1'565'684 31.12.2012 Investment Advisor
CQ YUXINTONG SINGLE n/a Co File 6'557'900 0.2 - 31.12.2012 n/a
GREAT WALL SECURITIE n/a Co File 5'466'600 0.17 - 31.12.2012 Investment Advisor
CHINA LIFE INSURANCE n/a ULT-AGG 4'568'300 0.14 - 31.12.2012 Government
HUAAN FUND MANAGEMEN Multiple Portfolios MF-AGG 3'193'649 0.1 (203'230) 31.12.2012 Investment Advisor
GTJA ALLIANZ FUND MA Multiple Portfolios MF-AGG 3'108'817 0.1 347'009 31.12.2012 Investment Advisor
CHINA ASSET MANAGEME Multiple Portfolios MF-AGG 2'872'603 0.09 (9'272'461) 31.12.2012 Investment Advisor
E FUND MANAGEMENT Multiple Portfolios MF-AGG 2'376'395 0.07 (4'895'916) 31.12.2012 Investment Advisor
CHINA ASSET MANAGEME Multiple Portfolios MF-AGG 1'914'616 0.06 - 02.09.2013 Investment Advisor
TIANTONG ASSET MANAG Multiple Portfolios MF-AGG 1'433'604 0.04 (114'032) 31.12.2012 Investment Advisor
INVESCO GREAT WALL F Multiple Portfolios MF-AGG 1'155'112 0.04 (1'047'651) 31.12.2012 Investment Advisor
BANK OF COMMUNICATIO Multiple Portfolios MF-AGG 1'131'959 0.04 (90'423) 31.12.2012 Investment Advisor
GUOTAI ASSET MANAGEM Multiple Portfolios MF-AGG 1'091'379 0.03 117'998 31.12.2012 Investment Advisor
DACHENG FUND MANAGME Multiple Portfolios MF-AGG 1'090'924 0.03 (91'200) 31.12.2012 Investment Advisor
Firm Name Analyst Recommendation Weighting Change Target Price Date Date
Founder Securities LIU WEIYUAN add 4 M #N/A N/A Not Provided 26.08.2013
Credit Suisse VINCENT CHAN neutral 3 M 8 Not Provided 19.08.2013
SWS Research Co Ltd ARTHUR WANG buy 5 M #N/A N/A Not Provided 16.07.2013
China International Capital Corp CAI HONGYU hold 3 D #N/A N/A Not Provided 10.07.2013
Everbright Securities Co., Ltd WANG QIANMING neutral 3 D 11 6 month 19.03.2013
Citic Securities Co., Ltd SONG XIAOQING hold 3 M #N/A N/A Not Provided 21.09.2012
Central China Securities HE WEIJIANG add 4 M #N/A N/A Not Provided 17.08.2012
Hong Yuan Securities MIN DAN add 4 M #N/A N/A Not Provided 07.08.2012
China Securities Co., Ltd ZHANG FANG add 4 M 18 Not Provided 25.06.2012
China Merchants Securities WANG XIAODAN buy 5 M #N/A N/A Not Provided 22.06.2012
China Investment Securities YANG GUOPING buy 5 M #N/A N/A Not Provided 19.04.2012
Great Wall Securities LIU FEI neutral 3 N #N/A N/A Not Provided 30.03.2012
China Minzu Securities Co Ltd GUAN JIANXIN add 4 D 20 6 month 12.08.2011
Bank of China International LE YUKUN buy 5 M 30 Not Provided 30.03.2011
AJ Securities ZHANG ZHIPENG buy 5 M #N/A N/A Not Provided 28.09.2010
Rising Securities Co.,LTD WANG HUACHUN neutral 3 N #N/A N/A Not Provided 02.08.2010
Tebon Securities Co Ltd TEAM COVERAGE add 4 N #N/A N/A Not Provided 30.06.2010
PingAn Securities LIANG ZHIGANG buy 5 M #N/A N/A Not Provided 27.05.2010
Holdings By:
Jinduicheng Molybdenum Co Ltd ee
Q.M.S Advisors | tel: +41 (0)78 922 08 77 | e-mail: [email protected] |
Page 186
09.09.2013
SDIC Power Holdings Co Ltd . generates thermal electric and hydroelectric power.
The electric power generated by the Company are supplied to Gansu area.
Latest Fiscal Year: 12/2012
LTM as of: 06/yy
52-Week High (20.05.2013) 4.25
52-Week Low (17.09.2012) 2.56
Daily Volume
3.85
52-Week High % Change -9.41% Dividend Yield -
52-Week Low % Change 50.24% Beta 0.84
% 52 Week Price Range High/Low 75.11% Equity Float 3'074.92
Shares Out 05.07.2013 6'786.0 Short Int -
26'126.19 1 Yr Total Return 40.56%
Total Debt 107'303.85 YTD Return 8.35%
Preferred Stock 0.0 Adjusted BETA 0.844
Minority Interest 13'193.1 Analyst Recs 9
Cash and Equivalents 6'268.35 Consensus Rating 5.000
Enterprise Value 147'533.78
Average Volume 5 Day 45'624'890
600886 CH EQUITY YTD Change - Average Volume 30 Day 49'386'400
600886 CH EQUITY YTD % CHANGE - Average Volume 3 Month 51'283'620
LTM-4Q LTM FY+1 FY+2 FQ+1 FQ+2
31.12.2008 31.12.2009 31.12.2010 31.12.2011 31.12.2012 06/yy 06/yy 12/13 Y 12/14 Y 09/13 Q3 12/13 Q4
10'871.1 11'811.1 17'350.5 23'412.4 23'671.6 25'231.8 24'886.4 27'590.0 33'077.0 - -
6.25x 7.71x 5.69x 4.87x 5.68x 18.05x 21.85x 5.07x 4.20x - -
5'466.5 5'317.4 6'005.7 6'488.4 8'643.3 0.0 0.0 12'200.0 16'347.0 - -
12.42x 17.13x 16.43x 17.58x 15.56x 0.00x 0.00x 12.09x 9.03x - -
658.5 531.4 504.4 332.3 1'053.9 275.7 2'185.2 2'061.5 2'629.0 680.0 253.0
27.66x 36.95x 28.36x 36.32x 19.23x 48.04x 9.11x 12.42x 8.59x - -
EBITDA 8'643.26 Long-Term Rating Date -
EBIT 5'150.83 Long-Term Rating -
Operating Margin 21.76% Long-Term Outlook -
Pretax Margin 9.79% Short-Term Rating Date -
Return on Assets 1.55% Short-Term Rating -
Return on Common Equity 16.18%
Return on Capital - EBITDA/Interest Exp. 1.48
Asset Turnover 0.18% (EBITDA-Capex)/Interest Exp. -1.88
Net Debt/EBITDA -
Gross Margin 24.7% Total Debt/EBITDA -
EBITDA Margin -
EBIT Margin 30.5% Total Debt/Equity 873.3%
Net Income Margin 4.5% Total Debt/Capital 80.8%
Asset Turnover 0.18
Current Ratio 0.41 Net Fixed Asset Turnover 0.20
Quick Ratio 0.29 Accounts receivable turnover-days 45.58
Debt to Assets 73.55% Inventory Days 23.66
Tot Debt to Common Equity 873.31% Accounts Payable Turnover Day 43.07
Accounts Receivable Turnover 8.01 Cash Conversion Cycle 33.38
Inventory Turnover 15.43
Profitability S&P Issuer Ratings
Credit Ratios
Margin Analysis
Reference
Structure
Net Income
P/E
Market Capitalization
Average Daily Trading Volume
Relative Stock Price Performance
Total Revenue
TEV/Revenue
EBITDA
TEV/EBITDA
Fiscal Year Ended
SDIC Power Holdings Co LtdPrice/Volume
Valuation Analysis
62'133'569.00
Current Price (9/dd/yy) Market Data
,--..00112
o!-. l!-. k!-. a!-. g!-0 c!-0 j!-0 Q!-0 j!-0 g!-0 g!-0 Q!-0 o!-0', F.,', F1,', F3,', F5,', F-,,', F-.,', F-1,', F-3,', F-5,', F
0.0
5'000.0
10'000.0
15'000.0
20'000.0
25'000.0
2001 2002 2003 2004 2005 2006 2007 2008 2009 2010 2011 2012
,',,
2',,
-,',,
-2',,
.,',,
.2',,
,-',-'.,-, ,-',4'.,-, ,-',-'.,-- ,-',4'.,-- ,-',-'.,-. ,-',4'.,-. ,-',-'.,-0 ,-',4'.,-0
FReTn/CTrThoT/PolhirTlAlcST/ !Rna /eis FReTn/CTrThoT/PolhirTlAlcST/ !Rna /eis
Q.M.S Advisors | tel: +41 (0)78 922 08 77 | e-mail: [email protected] |
Page 187
09.09.2013
Holder Name Portfolio Name Source Amt Held % Out Latest Chg File Dt Inst Type
STATE DEVELOPMENT & n/a Co File 3'478'459'944 51.26 - 31.12.2012 Government
BOSHI FUND MANAGEMEN Multiple Portfolios MF-AGG 242'271'616 3.57 39'291'533 30.06.2013 Investment Advisor
SOCIAL SECURITY FUND n/a Co File 232'549'604 3.43 - 31.12.2012 Government
CHINA ASSET MANAGEME Multiple Portfolios MF-AGG 181'593'885 2.68 24'398'789 30.06.2013 Investment Advisor
BOSERA FUND MANAGEME Multiple Portfolios MF-AGG 61'593'446 0.91 (2'231'115) 31.12.2012 Investment Advisor
CITIC SECURITIES CO n/a ULT-AGG 46'644'433 0.69 - 31.03.2012 Investment Advisor
AEGON INDUSTRIAL FUN Multiple Portfolios MF-AGG 45'573'686 0.67 20'527'560 31.12.2012 Investment Advisor
CHINA LIFE INSURANCE n/a Co File 34'064'315 0.5 - 31.12.2012 Government
CCB PRINCIPAL ASSET Multiple Portfolios MF-AGG 29'962'380 0.44 5'523'902 31.12.2012 Investment Advisor
E FUND MANAGEMENT Multiple Portfolios MF-AGG 26'116'432 0.38 2'092'477 31.12.2012 Investment Advisor
RONGTONG FUND MANAGE Multiple Portfolios MF-AGG 18'761'641 0.28 15'204'704 31.12.2012 Investment Advisor
HARVEST FUND MANAGEM Multiple Portfolios MF-AGG 17'880'480 0.26 51'840 31.12.2012 Investment Advisor
CHINA ASSET MANAGEME Multiple Portfolios MF-AGG 15'630'031 0.23 9'374'851 31.12.2012 Investment Advisor
GOLDEN EAGLE ASSET M Multiple Portfolios MF-AGG 11'895'758 0.18 11'435'598 31.12.2012 Investment Advisor
INVESCO GREAT WALL F Multiple Portfolios MF-AGG 10'988'956 0.16 7'658'324 31.12.2012 Investment Advisor
HUATAI-PINEBRIDGE FU Multiple Portfolios MF-AGG 9'976'790 0.15 (20'904) 31.12.2012 Investment Advisor
TIANHONG ASSET MANAG Multiple Portfolios MF-AGG 9'663'722 0.14 9'663'722 31.12.2012 Investment Advisor
FULLGOAL FUND MANAGE Multiple Portfolios MF-AGG 7'647'581 0.11 (2'335'373) 31.12.2012 Investment Advisor
CHINA ASSET MANAGEME Multiple Portfolios MF-AGG 6'596'583 0.1 - 02.09.2013 Investment Advisor
GF FUND MANAGEMENT C Multiple Portfolios MF-AGG 4'799'920 0.07 (5'279'728) 31.12.2012 Investment Advisor
Firm Name Analyst Recommendation Weighting Change Target Price Date Date
China International Capital Corp JUNHUA CHEN buy 5 N #N/A N/A Not Provided 23.08.2013
Everbright Securities Co., Ltd JUNPENG CHEN buy 5 M 5 12 month 18.08.2013
UBS WEI YU restricted #N/A N/A M #N/A N/A Not Provided 25.07.2013
Chang Jiang Securities Co. Limited JUN GE buy 5 N #N/A N/A Not Provided 21.05.2013
Rising Securities Co.,LTD DAI LIPING outperform 5 M #N/A N/A Not Provided 23.04.2013
SWS Research Co Ltd EVAN LIANG outperform 5 M #N/A N/A Not Provided 28.01.2013
Guotai Junan WANG WEI buy 5 N 4 12 month 24.01.2013
Citic Securities Co., Ltd WU FEI buy 5 M #N/A N/A Not Provided 15.01.2013
Guodu Securities Co Ltd WANG SHUBAO strong buy 5 N #N/A N/A Not Provided 26.12.2012
Hong Yuan Securities LU RUMIN buy 5 M #N/A N/A Not Provided 28.11.2012
China Merchants Securities PENG QUANGANG strong buy 5 M #N/A N/A Not Provided 19.07.2012
PingAn Securities FAN WANG buy 5 M #N/A N/A Not Provided 18.11.2010
China Galaxy Securities ZOU XUYUAN speculative buy 4 M #N/A N/A Not Provided 30.11.2009
Central China Securities PAN HANGJUN monitored #N/A N/A N #N/A N/A Not Provided 16.09.2009
Bank of China International YU NIAN buy 5 U 4 Not Provided 21.08.2009
KGI Securities CHEN JUDITH neutral 3 D 4 12 month 12.06.2009
Holdings By:
SDIC Power Holdings Co Ltd ee
Q.M.S Advisors | tel: +41 (0)78 922 08 77 | e-mail: [email protected] |
Page 188
09.09.2013
TBEA Co., Ltd. manufactures and markets electrical transformers, wires and
cables, and other accessory equipment. Through its subsidiaries, the Company
also develops and manages real estate.
Latest Fiscal Year: 12/2012
LTM as of: 06/yy
52-Week High (05.09.2013) 10.27
52-Week Low (26.09.2012) 5.51
Daily Volume
9.8
52-Week High % Change -4.58% Dividend Yield -
52-Week Low % Change 77.86% Beta 1.22
% 52 Week Price Range High/Low 89.08% Equity Float 2'087.94
Shares Out 30.06.2013 2'635.6 Short Int -
25'828.49 1 Yr Total Return 56.01%
Total Debt 15'470.81 YTD Return 53.84%
Preferred Stock 0.0 Adjusted BETA 1.223
Minority Interest 1'235.6 Analyst Recs 11
Cash and Equivalents 10'836.71 Consensus Rating 4.000
Enterprise Value 37'745.12
Average Volume 5 Day #########
600089 CH EQUITY YTD Change - Average Volume 30 Day 55'507'080
600089 CH EQUITY YTD % CHANGE - Average Volume 3 Month 50'502'580
LTM-4Q LTM FY+1 FY+2 FQ+1 FQ+2
31.12.2008 31.12.2009 31.12.2010 31.12.2011 31.12.2012 06/yy 06/yy 12/13 Y 12/14 Y 09/13 Q3 12/13 Q4
12'462.7 14'686.8 17'685.1 18'096.6 20'224.9 19'713.4 21'901.7 24'099.4 28'786.3 - -
2.30x 2.94x 1.96x 1.17x 1.13x 5.12x 5.01x 0.85x 0.64x - -
1'411.7 2'063.0 2'141.1 1'645.1 1'551.7 0.0 0.0 2'120.0 2'590.0 - -
20.28x 20.96x 16.16x 12.84x 14.76x 0.00x 0.00x 17.80x 14.57x - -
962.6 1'528.7 1'611.3 1'229.2 980.6 1'086.9 1'108.5 1'271.8 1'639.3 - -
28.27x 27.98x 21.70x 16.47x 17.36x 16.41x 19.14x 18.42x 15.48x - -
EBITDA 1'551.69 Long-Term Rating Date -
EBIT 967.71 Long-Term Rating -
Operating Margin 4.78% Long-Term Outlook -
Pretax Margin 5.22% Short-Term Rating Date -
Return on Assets 2.82% Short-Term Rating -
Return on Common Equity 8.19%
Return on Capital - EBITDA/Interest Exp. 2.67
Asset Turnover 0.56% (EBITDA-Capex)/Interest Exp. -6.41
Net Debt/EBITDA -
Gross Margin 16.2% Total Debt/EBITDA -
EBITDA Margin -
EBIT Margin 5.4% Total Debt/Equity 113.3%
Net Income Margin 4.8% Total Debt/Capital 50.9%
Asset Turnover 0.56
Current Ratio 1.33 Net Fixed Asset Turnover 1.36
Quick Ratio 0.89 Accounts receivable turnover-days 94.39
Debt to Assets 36.80% Inventory Days 85.25
Tot Debt to Common Equity 113.25% Accounts Payable Turnover Day 97.12
Accounts Receivable Turnover 3.87 Cash Conversion Cycle 57.44
Inventory Turnover 4.28
Fiscal Year Ended
TBEA Co LtdPrice/Volume
Valuation Analysis
68'045'246.00
Current Price (9/dd/yy) Market Data
Net Income
P/E
Market Capitalization
Average Daily Trading Volume
Relative Stock Price Performance
Total Revenue
TEV/Revenue
EBITDA
TEV/EBITDA
Profitability S&P Issuer Ratings
Credit Ratios
Margin Analysis
Reference
Structure
,
.
1
3
5
-,
-.
o!-. l!-. k!-. a!-. g!-0 c!-0 j!-0 Q!-0 j!-0 g!-0 g!-0 Q!-0 o!-0', F.,', F1,', F3,', F5,', F-,,', F-.,', F-1,', F-3,', F-5,', F
0.0
5'000.0
10'000.0
15'000.0
20'000.0
25'000.0
2001 2002 2003 2004 2005 2006 2007 2008 2009 2010 2011 2012
,',,
.,',,
1,',,
3,',,
5,',,
-,,',,
-.,',,
,-',-'.,-, ,-',4'.,-, ,-',-'.,-- ,-',4'.,-- ,-',-'.,-. ,-',4'.,-. ,-',-'.,-0 ,-',4'.,-0
FReTn/CTrThoT/PolhirTlAlcST/ !Rna /eis FReTn/CTrThoT/PolhirTlAlcST/ !Rna /eis
Q.M.S Advisors | tel: +41 (0)78 922 08 77 | e-mail: [email protected] |
Page 189
09.09.2013
Holder Name Portfolio Name Source Amt Held % Out Latest Chg File Dt Inst Type
TEBIAN ELECTRIC APPA n/a Co File 309'368'350 11.74 - 31.12.2012 Corporation
XINJIANG HONGLIAN VE n/a Co File 180'176'786 6.84 - 31.12.2012 Corporation
XINJIANG INVS & DEV n/a Co File 57'479'600 2.18 - 31.12.2012 Corporation
EVERBRIGHT SECURITIE n/a Co File 25'410'893 0.96 - 31.12.2012 Unclassified
HARVEST FUND MANAGEM Multiple Portfolios MF-AGG 20'949'345 0.79 (14'346'605) 31.12.2012 Investment Advisor
E FUND MANAGEMENT Multiple Portfolios MF-AGG 20'477'331 0.78 (20'632'967) 31.12.2012 Investment Advisor
NEW CHINA LIFE INSUR n/a Co File 16'200'000 0.61 - 31.12.2012 Insurance Company
HUATAI SECURITIES CO n/a Co File 14'284'710 0.54 - 31.12.2012 Investment Advisor
HUATAI-PINEBRIDGE FU Multiple Portfolios MF-AGG 12'184'860 0.46 (24'564) 31.12.2012 Investment Advisor
HAITONG SECURITIES C n/a Co File 12'161'463 0.46 - 31.12.2012 Investment Advisor
GUOTAI ASSET MANAGEM Multiple Portfolios MF-AGG 10'401'624 0.39 (214'848) 30.06.2013 Investment Advisor
HUAAN FUND MANAGEMEN Multiple Portfolios MF-AGG 8'502'664 0.32 (532'692) 31.12.2012 Investment Advisor
CHINA ASSET MANAGEME Multiple Portfolios MF-AGG 5'093'388 0.19 - 02.09.2013 Investment Advisor
FULLGOAL FUND MANAGE Multiple Portfolios MF-AGG 4'532'321 0.17 - 31.12.2012 Investment Advisor
MORGAN STANLEY n/a ULT-AGG 4'019'869 0.15 - 30.06.2013 Investment Advisor
TIANTONG ASSET MANAG Multiple Portfolios MF-AGG 3'940'203 0.15 (210'024) 31.12.2012 Investment Advisor
BOSHI FUND MANAGEMEN Multiple Portfolios MF-AGG 3'720'736 0.14 (5'259'194) 31.12.2012 Investment Advisor
BANK OF COMMUNICATIO Multiple Portfolios MF-AGG 3'087'634 0.12 (265'854) 31.12.2012 Investment Advisor
DACHENG FUND MANAGME Multiple Portfolios MF-AGG 2'689'109 0.1 (133'200) 31.12.2012 Investment Advisor
CHINA ASSET MANAGEME Multiple Portfolios MF-AGG 2'595'162 0.1 (20'412'813) 31.12.2012 Investment Advisor
Firm Name Analyst Recommendation Weighting Change Target Price Date Date
Guotai Junan XIAO LIU buy 5 M 12 12 month 02.09.2013
Sinolink Securities Co Ltd ZHANG SHUAI add 4 M #N/A N/A Not Provided 28.08.2013
Chang Jiang Securities Co. Limited HAOLONG DENG buy 5 M #N/A N/A Not Provided 15.08.2013
Founder Securities WEI ZHOU add 4 M #N/A N/A Not Provided 07.08.2013
Northeast Securities Co Ltd YANG JIALI add 4 M #N/A N/A Not Provided 31.07.2013
Capital Securities Corp LAI SHENSHENG hold 3 M #N/A N/A Not Provided 30.07.2013
China International Capital Corp RAN SHI buy 5 M #N/A N/A Not Provided 30.07.2013
Hong Yuan Securities WANG JING buy 5 M #N/A N/A Not Provided 21.07.2013
Everbright Securities Co., Ltd ZHOU LIQIAN buy 5 M #N/A N/A Not Provided 30.06.2013
EVA Dimensions TIMOTHY STANISH sell 1 M #N/A N/A Not Provided 06.06.2013
Credit Suisse VINCENT CHAN neutral 3 U 7 Not Provided 02.04.2013
China Securities Co., Ltd XU CHAO buy 5 M 19 Not Provided 25.06.2012
Central China Securities PAN HANGJUN add 4 M #N/A N/A Not Provided 28.03.2012
PingAn Securities DOU ZEYUN buy 5 M #N/A N/A Not Provided 01.04.2011
HuaChuang Securities GAO LI buy 5 M 18 6 month 06.01.2011
China Investment Securities XIONG LIN buy 5 M #N/A N/A Not Provided 06.04.2010
Citic Securities Co., Ltd LIU LEI buy 5 M 25 6 month 25.02.2010
Holdings By:
TBEA Co Ltd ee
Q.M.S Advisors | tel: +41 (0)78 922 08 77 | e-mail: [email protected] |
Page 190
09.09.2013
Industrial Securities Co., Ltd. is a securities company. The Company's
business covers securities brokerage, investment consulting, securities
trading, financial advisory, securities underwriting and sponsorship,
proprietary trading, asset management, investment funds marketing as well
intermediary services for futures companies.
Latest Fiscal Year: 12/2012
LTM as of: 06/yy
52-Week High (04.02.2013) 14.15
52-Week Low (25.06.2013) 8.45
Daily Volume
10.11
52-Week High % Change -28.55% Dividend Yield -
52-Week Low % Change 19.64% Beta 1.67
% 52 Week Price Range High/Low 21.58% Equity Float 1'163.44
Shares Out 30.06.2013 2'600.0 Short Int -
26'286.00 1 Yr Total Return 9.19%
Total Debt 3'361.20 YTD Return -16.78%
Preferred Stock 0.0 Adjusted BETA 1.672
Minority Interest 362.1 Analyst Recs 11
Cash and Equivalents 8'780.42 Consensus Rating 4.273
Enterprise Value 20'895.88
Average Volume 5 Day 13'034'870
601377 CH EQUITY YTD Change - Average Volume 30 Day 16'705'010
601377 CH EQUITY YTD % CHANGE - Average Volume 3 Month 17'649'050
LTM-4Q LTM FY+1 FY+2 FQ+1 FQ+2
31.12.2008 31.12.2009 31.12.2010 31.12.2011 31.12.2012 06/yy 06/yy 12/13 Y 12/14 Y 09/13 Q3 12/13 Q4
1'397.8 3'152.9 2'828.6 2'449.6 2'691.8 2'470.0 2'915.4 3'391.0 3'868.8 - -
- - 8.10x 5.91x 8.16x 27.85x 27.02x - - - -
608.7 1'784.5 1'361.6 915.7 936.8 0.0 0.0 - - - -
- - 16.83x 15.82x 23.44x 0.00x 0.00x - - - -
266.6 1'155.3 787.2 435.3 476.4 400.0 538.7 717.6 894.8 - -
- - 41.54x 46.50x 55.82x 56.83x 38.62x 34.74x 28.32x - -
EBITDA 936.81 Long-Term Rating Date -
EBIT - Long-Term Rating -
Operating Margin 27.52% Long-Term Outlook -
Pretax Margin 27.77% Short-Term Rating Date -
Return on Assets 2.09% Short-Term Rating -
Return on Common Equity 5.06%
Return on Capital 4.39% EBITDA/Interest Exp. -
Asset Turnover 0.11% (EBITDA-Capex)/Interest Exp. -
Net Debt/EBITDA -5.30
Gross Margin - Total Debt/EBITDA 4.32
EBITDA Margin 37.3%
EBIT Margin - Total Debt/Equity 38.6%
Net Income Margin 17.7% Total Debt/Capital 27.0%
Asset Turnover 0.11
Current Ratio - Net Fixed Asset Turnover 3.88
Quick Ratio - Accounts receivable turnover-days -
Debt to Assets 14.80% Inventory Days -
Tot Debt to Common Equity 38.59% Accounts Payable Turnover Day -
Accounts Receivable Turnover - Cash Conversion Cycle -
Inventory Turnover -
Profitability S&P Issuer Ratings
Credit Ratios
Margin Analysis
Reference
Structure
Net Income
P/E
Market Capitalization
Average Daily Trading Volume
Relative Stock Price Performance
Total Revenue
TEV/Revenue
EBITDA
TEV/EBITDA
Fiscal Year Ended
Industrial Securities Co LtdPrice/Volume
Valuation Analysis
43'770'963.00
Current Price (9/dd/yy) Market Data
,
.
1
3
5
-,
-.
-1
-3
o!-. l!-. k!-. a!-. g!-0 c!-0 j!-0 Q!-0 j!-0 g!-0 g!-0 Q!-0 o!-0', F
-,', F
.,', F
0,', F
1,', F
2,', F
3,', F
4,', F
0.0
1'000.0
2'000.0
3'000.0
4'000.0
5'000.0
6'000.0
2001 2002 2003 2004 2005 2006 2007 2008 2009 2010 2011 2012
,',,
-,',,
.,',,
0,',,
1,',,
2,',,
3,',,
4,',,
5,',,
6,',,
-,,',,
,-',-'.,-, ,-',4'.,-, ,-',-'.,-- ,-',4'.,-- ,-',-'.,-. ,-',4'.,-. ,-',-'.,-0 ,-',4'.,-0
FReTn/CTrThoT/PolhirTlAlcST/ !Rna /eis FReTn/CTrThoT/PolhirTlAlcST/ !Rna /eis
Q.M.S Advisors | tel: +41 (0)78 922 08 77 | e-mail: [email protected] |
Page 191
09.09.2013
Holder Name Portfolio Name Source Amt Held % Out Latest Chg File Dt Inst Type
FUJIAN PROVINCE FINA n/a EXCH 521'957'590 20.08 - 08.05.2013 Government
FUJIAN INVEST DEVELO n/a EXCH 227'441'223 8.75 40'000'000 08.05.2013 Government
SH SHENXIN GROUP CO n/a EXCH 101'400'000 3.9 - 08.05.2013 Corporation
SH XINGYE INVEST DEV n/a Co File 78'000'000 3 - 31.12.2012 Other
XM YUNDANG NEW DISTR n/a Co File 76'402'672 2.94 - 31.12.2012 Government
XM SPECIAL ECON ZONE n/a EXCH 76'402'672 2.94 - 08.05.2013 Government
HUAYU AUTOMOTIVE SYS n/a EXCH 62'400'000 2.4 - 08.05.2013 Holding Company
CHENGGONG HLDS GRP n/a EXCH 57'600'630 2.22 - 08.05.2013 Corporation
SHANGHAI TANGJIU GRO n/a EXCH 54'500'573 2.1 - 08.05.2013 Government
XIAMEN XIANGYU GROUP n/a EXCH 50'000'000 1.92 - 08.05.2013 Government
SH JIAODA ONLLY CO n/a EXCH 49'800'000 1.92 - 08.05.2013 Corporation
FUJIAN FIN GUARANTEE n/a EXCH 49'661'737 1.91 - 08.05.2013 Government
GF FUND MANAGEMENT C Multiple Portfolios MF-AGG 31'483'619 1.21 8'815'980 31.12.2012 Investment Advisor
FUZHOU HONGYUAN INV n/a Co File 30'991'000 1.19 - 31.12.2012 Other
HARVEST FUND MANAGEM Multiple Portfolios MF-AGG 15'570'592 0.6 (4'759'673) 31.12.2012 Investment Advisor
ZHONG HAI FUND MANAG Multiple Portfolios MF-AGG 7'601'012 0.29 7'574'052 31.12.2012 Investment Advisor
MANULIFE TEDA FUND M Multiple Portfolios MF-AGG 7'535'277 0.29 7'535'277 31.12.2012 Investment Advisor
HUATAI-PINEBRIDGE FU Multiple Portfolios MF-AGG 7'121'610 0.27 (13'192) 31.12.2012 Investment Advisor
DACHENG FUND MANAGME Multiple Portfolios MF-AGG 4'801'703 0.18 (13'826'619) 31.12.2012 Investment Advisor
ABC-CA FUND MANAGEME Multiple Portfolios MF-AGG 4'104'254 0.16 3'482'706 31.12.2012 Investment Advisor
Firm Name Analyst Recommendation Weighting Change Target Price Date Date
Chang Jiang Securities Co. Limited LIU JUN neutral 3 M #N/A N/A Not Provided 02.09.2013
Tebon Securities Co Ltd LEI ZHANG outperform 5 M 12 6 month 19.08.2013
GF Securities Co. Ltd. CONG LI buy 5 M #N/A N/A Not Provided 08.08.2013
Sinolink Securities Co Ltd JIANGANG CHEN add 4 M #N/A N/A Not Provided 08.08.2013
Guotai Junan ZHAO XIANGHUAI buy 5 M 13 12 month 08.08.2013
Everbright Securities Co., Ltd ZIPEI TANG accumulate 4 M 10 12 month 06.08.2013
PingAn Securities WU JIE buy 5 M 10 6 month 11.03.2013
China International Capital Corp JIE HUANG neutral 3 D #N/A N/A Not Provided 08.03.2013
Central China Securities XIE PEIJIE add 4 M #N/A N/A Not Provided 06.12.2012
Hong Yuan Securities HUANG LIJUN add 4 M #N/A N/A Not Provided 30.11.2012
Citic Securities Co., Ltd PAN HONGWEN overweight 5 M 11 6 month 30.11.2012
China Minzu Securities Co Ltd SONG JIAN add 4 U #N/A N/A Not Provided 21.08.2012
Northeast Securities Co Ltd XINAN ZHAO add 4 M #N/A N/A Not Provided 23.04.2012
Holdings By:
Industrial Securities Co Ltd ee
Q.M.S Advisors | tel: +41 (0)78 922 08 77 | e-mail: [email protected] |
Page 192
09.09.2013
Shanghai Lujiazui Finance & Trade Zone Development Co., Ltd. operates in land
development, property management, and infrastructure facilities construction
within the Lujiazui Finance and Trade Zone. The Company also undertakes
building and renovation projects.
Latest Fiscal Year: 12/2012
LTM as of: 06/yy
52-Week High (02.09.2013) 21.25
52-Week Low (04.12.2012) 9.36
Daily Volume
18.99
52-Week High % Change -10.64% Dividend Yield -
52-Week Low % Change 102.88% Beta 1.22
% 52 Week Price Range High/Low 87.72% Equity Float 228.19
Shares Out 30.06.2013 1'358.1 Short Int -
30'718.45 1 Yr Total Return 72.51%
Total Debt 6'074.72 YTD Return 61.78%
Preferred Stock 0.0 Adjusted BETA 1.218
Minority Interest 1'608.0 Analyst Recs 3
Cash and Equivalents 1'329.67 Consensus Rating 3.000
Enterprise Value 39'037.98
Average Volume 5 Day 46'803'010
600663 CH EQUITY YTD Change - Average Volume 30 Day 15'512'860
600663 CH EQUITY YTD % CHANGE - Average Volume 3 Month 8'185'948
LTM-4Q LTM FY+1 FY+2 FQ+1 FQ+2
31.12.2008 31.12.2009 31.12.2010 31.12.2011 31.12.2012 06/yy 06/yy 12/13 Y 12/14 Y 09/13 Q3 12/13 Q4
1'630.0 3'416.6 2'544.8 2'961.6 2'864.7 1'699.1 3'086.9 3'886.0 4'643.0 - -
12.08x 12.82x 13.67x 9.15x 9.25x 64.44x 34.62x - - - -
984.9 2'577.1 1'643.4 1'642.4 1'607.2 0.0 0.0 - - - -
20.00x 17.00x 21.17x 16.50x 16.49x 0.00x 0.00x - - - -
880.5 1'176.4 1'191.7 984.9 1'011.0 505.1 1'089.9 1'242.5 1'496.5 - -
28.17x 40.13x 26.33x 21.48x 21.98x 45.37x 18.04x 30.48x 25.73x - -
EBITDA 1'607.16 Long-Term Rating Date -
EBIT 1'405.33 Long-Term Rating -
Operating Margin 49.06% Long-Term Outlook -
Pretax Margin 49.89% Short-Term Rating Date -
Return on Assets 3.39% Short-Term Rating -
Return on Common Equity 9.63%
Return on Capital - EBITDA/Interest Exp. 3.76
Asset Turnover 0.10% (EBITDA-Capex)/Interest Exp. 3.24
Net Debt/EBITDA -
Gross Margin 57.5% Total Debt/EBITDA -
EBITDA Margin -
EBIT Margin 50.3% Total Debt/Equity 52.4%
Net Income Margin 35.3% Total Debt/Capital 31.5%
Asset Turnover 0.10
Current Ratio 1.13 Net Fixed Asset Turnover 5.97
Quick Ratio 0.09 Accounts receivable turnover-days 4.45
Debt to Assets 19.73% Inventory Days 4243.33
Tot Debt to Common Equity 52.44% Accounts Payable Turnover Day 29.59
Accounts Receivable Turnover 82.00 Cash Conversion Cycle 4158.21
Inventory Turnover 0.09
Fiscal Year Ended
Shanghai Lujiazui Finance & Trade Zone Development Co LtdPrice/Volume
Valuation Analysis
39'756'230.00
Current Price (9/dd/yy) Market Data
Net Income
P/E
Market Capitalization
Average Daily Trading Volume
Relative Stock Price Performance
Total Revenue
TEV/Revenue
EBITDA
TEV/EBITDA
Profitability S&P Issuer Ratings
Credit Ratios
Margin Analysis
Reference
Structure
,
2
-,
-2
.,
.2
o!-. l!-. k!-. a!-. g!-0 c!-0 j!-0 Q!-0 j!-0 g!-0 g!-0 Q!-0 o!-0', F
-,', F
.,', F
0,', F
1,', F
2,', F
3,', F
4,', F
0.0
500.0
1'000.0
1'500.0
2'000.0
2'500.0
3'000.0
3'500.0
4'000.0
2001 2002 2003 2004 2005 2006 2007 2008 2009 2010 2011 2012
,',,
.,',,
1,',,
3,',,
5,',,
-,,',,
-.,',,
-1,',,
-3,',,
-5,',,
,-',-'.,-, ,-',4'.,-, ,-',-'.,-- ,-',4'.,-- ,-',-'.,-. ,-',4'.,-. ,-',-'.,-0 ,-',4'.,-0
FReTn/CTrThoT/PolhirTlAlcST/ !Rna /eis FReTn/CTrThoT/PolhirTlAlcST/ !Rna /eis
Q.M.S Advisors | tel: +41 (0)78 922 08 77 | e-mail: [email protected] |
Page 193
09.09.2013
Holder Name Portfolio Name Source Amt Held % Out Latest Chg File Dt Inst Type
SHANGHAI LUJIAZUI GR n/a Co File 1'076'556'437 79.27 - 31.12.2012 Government
SHANGHAI INTERNATION n/a Co File 53'234'998 3.92 - 31.12.2012 Investment Advisor
HUAAN FUND MANAGEMEN Multiple Portfolios MF-AGG 1'267'636 0.09 (105'484) 31.12.2012 Investment Advisor
TIANTONG ASSET MANAG Multiple Portfolios MF-AGG 601'489 0.04 (40'130) 31.12.2012 Investment Advisor
E FUND MANAGEMENT Multiple Portfolios MF-AGG 383'368 0.03 61'092 31.12.2012 Investment Advisor
CHINA UNIVERSAL ASSE Multiple Portfolios MF-AGG 367'820 0.03 (13'344) 31.12.2012 Investment Advisor
INVESCO GREAT WALL F Multiple Portfolios MF-AGG 197'031 0.01 - 31.12.2012 Investment Advisor
FULLGOAL FUND MANAGE Multiple Portfolios MF-AGG 90'700 0.01 3'200 31.12.2012 Investment Advisor
HARVEST GLOBAL INVES Multiple Portfolios MF-AGG 71'115 0.01 - 02.09.2013 Investment Advisor
CAISSE DE DEPOT ET P Multiple Portfolios MF-AGG 45'785 0 - 31.12.2012 Investment Advisor
CHINA SOUTHERN FUND Multiple Portfolios MF-AGG 43'277 0 1'327 31.12.2012 Investment Advisor
WEI ZHU n/a Co File 27'337 0 - 31.12.2012 n/a
JINZHAO LI n/a Co File 20'000 0 - 31.12.2012 n/a
HUATAI-PINEBRIDGE FU Multiple Portfolios MF-AGG 15'508 0 (3'792) 31.12.2012 Investment Advisor
XIAOMING YANG n/a Co File 14'050 0 - 31.12.2012 n/a
JIANWEN TAO n/a Co File 10'000 0 - 31.12.2012 n/a
ERJIN XU n/a Co File 10'000 0 - 31.12.2012 n/a
ZHOU XIANG n/a EXCH 8'500 0 (2'800) 02.09.2013 n/a
WEIMIN ZHOU n/a Co File 8'000 0 - 31.12.2012 n/a
CAO QIONG n/a EXCH 3'800 0 (1'200) 02.09.2013 n/a
Firm Name Analyst Recommendation Weighting Change Target Price Date Date
Capital Securities Corp ZHU JIXIANG hold 3 M #N/A N/A Not Provided 26.07.2013
China International Capital Corp ANSON JINGBIAN NING hold 3 M #N/A N/A Not Provided 26.07.2013
SWS Research Co Ltd SIYI HAN neutral 3 M #N/A N/A Not Provided 19.07.2013
Central China Securities WU JIANXIONG add 4 M #N/A N/A Not Provided 09.08.2012
Founder Securities WEI ZHOU add 4 M #N/A N/A Not Provided 14.10.2009
Industrial Securities WANG JIA buy 5 N #N/A N/A Not Provided 25.08.2009
China Galaxy Securities WEI PAN speculative buy 4 N #N/A N/A Not Provided 13.03.2009
Holdings By:
Shanghai Lujiazui Finance & Trade Zone Development Co Ltd ee
Q.M.S Advisors | tel: +41 (0)78 922 08 77 | e-mail: [email protected] |
Page 194
09.09.2013
Zhe Jiang Daily Media Group Co., Ltd is a media company. The Company's
interests include communication and culture industries, investment,
development, management and consulting services, information integration,
radio, television and other multimedia content production and management, new
media technology development and investment.
Latest Fiscal Year: 12/2012
LTM as of: 06/yy
52-Week High (04.09.2013) 43.28
52-Week Low (04.12.2012) 9.89
Daily Volume
41.42
52-Week High % Change -4.30% Dividend Yield -
52-Week Low % Change 318.81% Beta 0.91
% 52 Week Price Range High/Low 93.65% Equity Float 125.31
Shares Out 30.06.2013 594.1 Short Int -
24'609.44 1 Yr Total Return 169.18%
Total Debt 390.00 YTD Return 211.05%
Preferred Stock 0.0 Adjusted BETA 0.912
Minority Interest 552.4 Analyst Recs 12
Cash and Equivalents 406.68 Consensus Rating 4.333
Enterprise Value 24'654.49
Average Volume 5 Day 8'890'742
600633 CH EQUITY YTD Change - Average Volume 30 Day 8'185'331
600633 CH EQUITY YTD % CHANGE - Average Volume 3 Month 11'757'330
LTM-4Q LTM FY+1 FY+2 FQ+1 FQ+2
31.12.2008 31.12.2009 31.12.2010 31.12.2011 31.12.2012 06/yy 06/yy 12/13 Y 12/14 Y 09/13 Q3 12/13 Q4
449.3 371.9 1'152.8 1'266.0 1'363.2 1'267.9 1'649.4 2'188.6 2'518.2 532.0 532.0
1.69x 3.18x - 4.73x 4.65x 20.37x 20.51x - - - -
(20.3) (8.4) 291.2 306.3 337.6 0.0 0.0 662.0 861.0 - -
- - - 19.57x 18.77x 0.00x 0.00x 37.24x 28.63x - -
(35.6) (19.3) 209.2 220.7 221.3 210.8 286.1 491.0 656.6 - -
- - - 21.52x 25.96x 28.10x 36.15x 54.14x 46.33x - -
EBITDA 337.55 Long-Term Rating Date -
EBIT 273.03 Long-Term Rating -
Operating Margin 20.03% Long-Term Outlook -
Pretax Margin 20.77% Short-Term Rating Date -
Return on Assets 6.54% Short-Term Rating -
Return on Common Equity 13.48%
Return on Capital - EBITDA/Interest Exp. 16.43
Asset Turnover 0.38% (EBITDA-Capex)/Interest Exp. 11.83
Net Debt/EBITDA -
Gross Margin 43.2% Total Debt/EBITDA -
EBITDA Margin -
EBIT Margin 22.2% Total Debt/Equity 37.9%
Net Income Margin 16.2% Total Debt/Capital 19.8%
Asset Turnover 0.38
Current Ratio 1.27 Net Fixed Asset Turnover 2.72
Quick Ratio 0.58 Accounts receivable turnover-days 70.57
Debt to Assets 14.83% Inventory Days 18.18
Tot Debt to Common Equity 37.91% Accounts Payable Turnover Day 77.12
Accounts Receivable Turnover 5.17 Cash Conversion Cycle -24.62
Inventory Turnover 20.08
Profitability S&P Issuer Ratings
Credit Ratios
Margin Analysis
Reference
Structure
Net Income
P/E
Market Capitalization
Average Daily Trading Volume
Relative Stock Price Performance
Total Revenue
TEV/Revenue
EBITDA
TEV/EBITDA
Fiscal Year Ended
Zhe Jiang Daily Media Group Co LtdPrice/Volume
Valuation Analysis
7'224'919.00
Current Price (9/dd/yy) Market Data
,2
-,-2.,.20,021,12
o!-. l!-. k!-. a!-. g!-0 c!-0 j!-0 Q!-0 j!-0 g!-0 g!-0 Q!-0 o!-0', F
2', F
-,', F
-2', F
.,', F
.2', F
0,', F
0.0
200.0
400.0
600.0
800.0
1'000.0
1'200.0
1'400.0
1'600.0
2001 2002 2003 2004 2005 2006 2007 2008 2009 2010 2011 2012
,',,
-,',,
.,',,
0,',,
1,',,
2,',,
3,',,
4,',,
5,',,
,-',-'.,-, ,-',4'.,-, ,-',-'.,-- ,-',4'.,-- ,-',-'.,-. ,-',4'.,-. ,-',-'.,-0 ,-',4'.,-0
FReTn/CTrThoT/PolhirTlAlcST/ !Rna /eis FReTn/CTrThoT/PolhirTlAlcST/ !Rna /eis
Q.M.S Advisors | tel: +41 (0)78 922 08 77 | e-mail: [email protected] |
Page 195
09.09.2013
Holder Name Portfolio Name Source Amt Held % Out Latest Chg File Dt Inst Type
ZHEJIANG DAILY MEDIA n/a EXCH 295'668'528 49.76 13'587'495 22.04.2013 Government
XINZHOU GROUP CO LTD n/a EXCH 41'943'851 7.06 - 22.04.2013 Corporation
CHINA UNIVERSAL ASSE n/a EXCH 28'669'064 4.83 - 22.04.2013 Investment Advisor
GUOGUANG GLOBAL MEDI n/a EXCH 17'985'611 3.03 - 22.04.2013 n/a
TAIKANG LIFE INSURAN n/a EXCH 15'265'635 2.57 - 22.04.2013 Insurance Company
XIANGCAI SECURITIES n/a EXCH 14'388'489 2.42 - 22.04.2013 Investment Advisor
SHANGHAI WHITE CAT G n/a EXCH 13'683'281 2.3 - 22.04.2013 Other
RONGTONG PRE BLUE CH n/a EXCH 11'612'734 1.95 - 22.04.2013 n/a
RONGTONG FUND MANAGE RONGTONG PRE BLUE CH MF-PART 11'612'734 1.95 11'612'734 30.06.2013 Investment Advisor
XIAN INVESTMENT HOLD n/a EXCH 10'791'366 1.82 - 22.04.2013 Holding Company
SHANGHAI QIXI INVEST n/a EXCH 9'122'302 1.54 - 22.04.2013 Investment Advisor
ICBC CREDIT SUISSE A Multiple Portfolios MF-AGG 7'341'066 1.24 2'808'239 31.12.2012 Investment Advisor
SHANGHAI LIGHT INDUS n/a Co File 3'930'000 0.66 - 31.12.2012 Government
ZJ NEW GANXIAN MEDIA n/a Co File 3'580'516 0.6 - 31.12.2012 Government
SHANGHAI MECHANICAL n/a Co File 2'191'200 0.37 - 31.12.2012 Corporation
ABC-CA FUND MANAGEME Multiple Portfolios MF-AGG 1'277'853 0.22 824'467 31.12.2012 Investment Advisor
AXA SPDB INVESTMENT Multiple Portfolios MF-AGG 946'401 0.16 946'401 31.12.2012 Investment Advisor
MANULIFE TEDA FUND M Multiple Portfolios MF-AGG 503'400 0.08 503'400 31.12.2012 Investment Advisor
CITIC PRUDENTIAL FUN Multiple Portfolios MF-AGG 460'150 0.08 460'150 31.12.2012 Investment Advisor
CHINA SOUTHERN FUND Multiple Portfolios MF-AGG 427'436 0.07 29'600 31.12.2012 Investment Advisor
Firm Name Analyst Recommendation Weighting Change Target Price Date Date
Chang Jiang Securities Co. Limited ZHIJIAN CHEN add 4 M #N/A N/A Not Provided 02.09.2013
Northeast Securities Co Ltd GENG YUN add 4 M #N/A N/A Not Provided 29.08.2013
Everbright Securities Co., Ltd ZHANG LIANGWEI buy 5 M 45 6 month 29.08.2013
Guotai Junan GAO HUI buy 5 M 30 12 month 28.08.2013
China Investment Securities LENG XINGXING neutral 3 M #N/A N/A Not Provided 25.08.2013
Qilu Securities Co Ltd LIU JIANGXIAO add 4 M #N/A N/A Not Provided 15.08.2013
Goldman Sachs LIAO XUFA neutral/neutral 3 N 21 12 month 09.08.2013
Guodu Securities Co Ltd ZHAO XIANDONG buy 5 M #N/A N/A Not Provided 22.07.2013
Hong Yuan Securities ZHANG ZEJING add 4 N #N/A N/A Not Provided 08.07.2013
Citic Securities Co., Ltd PI SHUN overweight 5 N #N/A N/A Not Provided 06.02.2013
HuaChuang Securities GAO LI buy 5 M #N/A N/A Not Provided 19.12.2012
Rising Securities Co.,LTD ZHAO YUE outperform 5 M #N/A N/A Not Provided 25.09.2012
Holdings By:
Zhe Jiang Daily Media Group Co Ltd ee
Q.M.S Advisors | tel: +41 (0)78 922 08 77 | e-mail: [email protected] |
Page 196
09.09.2013
China CSSC Holdings Ltd. offers shipbuilding, ship components, ship repairing
and diesel engines manufacturing. The Company distributes its products within
the domestic market and to overseas markets.
Latest Fiscal Year: 12/2012
LTM as of: 06/yy
52-Week High (16.01.2013) 25.95
52-Week Low (30.07.2013) 14.98
Daily Volume
18.99
52-Week High % Change -26.82% Dividend Yield -
52-Week Low % Change 26.77% Beta 1.17
% 52 Week Price Range High/Low 30.99% Equity Float 375.41
Shares Out 30.06.2013 1'378.1 Short Int -
26'170.45 1 Yr Total Return -3.60%
Total Debt 15'058.42 YTD Return -18.24%
Preferred Stock 0.0 Adjusted BETA 1.168
Minority Interest 2'167.9 Analyst Recs 3
Cash and Equivalents 18'702.68 Consensus Rating 3.667
Enterprise Value 23'572.63
Average Volume 5 Day 9'681'410
600150 CH EQUITY YTD Change - Average Volume 30 Day 8'794'872
600150 CH EQUITY YTD % CHANGE - Average Volume 3 Month 7'591'039
LTM-4Q LTM FY+1 FY+2 FQ+1 FQ+2
31.12.2008 31.12.2009 31.12.2010 31.12.2011 31.12.2012 06/yy 06/yy 12/13 Y 12/14 Y 09/13 Q3 12/13 Q4
27'596.4 25'175.4 29'784.8 28'657.3 24'235.2 27'353.9 18'890.8 - - - -
0.63x 1.75x 1.06x 0.64x 1.26x 3.41x 5.36x - - - -
4'389.0 2'822.3 3'539.8 3'504.5 721.6 0.0 0.0 - - - -
3.96x 15.63x 8.94x 5.24x 42.34x 0.00x 0.00x - - - -
4'159.6 2'500.6 2'608.5 2'252.4 26.9 1'445.9 (393.0) - - - -
6.09x 20.65x 17.20x 12.22x 1162.00x 21.90x 0.00x 158.25x 118.69x - -
EBITDA 721.56 Long-Term Rating Date -
EBIT -295.47 Long-Term Rating -
Operating Margin -1.22% Long-Term Outlook -
Pretax Margin 0.97% Short-Term Rating Date -
Return on Assets -0.93% Short-Term Rating -
Return on Common Equity -2.22%
Return on Capital - EBITDA/Interest Exp. 1.08
Asset Turnover 0.45% (EBITDA-Capex)/Interest Exp. -0.19
Net Debt/EBITDA -
Gross Margin 5.0% Total Debt/EBITDA -
EBITDA Margin -
EBIT Margin -2.3% Total Debt/Equity 86.0%
Net Income Margin 0.1% Total Debt/Capital 43.3%
Asset Turnover 0.45
Current Ratio 1.80 Net Fixed Asset Turnover 1.41
Quick Ratio 1.38 Accounts receivable turnover-days 26.05
Debt to Assets 33.19% Inventory Days 52.41
Tot Debt to Common Equity 85.96% Accounts Payable Turnover Day 70.30
Accounts Receivable Turnover 14.01 Cash Conversion Cycle 7.94
Inventory Turnover 6.96
Fiscal Year Ended
China CSSC Holdings LtdPrice/Volume
Valuation Analysis
25'530'711.00
Current Price (9/dd/yy) Market Data
Net Income
P/E
Market Capitalization
Average Daily Trading Volume
Relative Stock Price Performance
Total Revenue
TEV/Revenue
EBITDA
TEV/EBITDA
Profitability S&P Issuer Ratings
Credit Ratios
Margin Analysis
Reference
Structure
,
2
-,
-2
.,
.2
0,
o!-. l!-. k!-. a!-. g!-0 c!-0 j!-0 Q!-0 j!-0 g!-0 g!-0 Q!-0 o!-0', F
-,', F
.,', F
0,', F
1,', F
2,', F
3,', F
0.0
5'000.0
10'000.0
15'000.0
20'000.0
25'000.0
30'000.0
35'000.0
2001 2002 2003 2004 2005 2006 2007 2008 2009 2010 2011 2012
,',,
2',,
-,',,
-2',,
.,',,
.2',,
0,',,
02',,
1,',,
12',,
,-',-'.,-, ,-',4'.,-, ,-',-'.,-- ,-',4'.,-- ,-',-'.,-. ,-',4'.,-. ,-',-'.,-0 ,-',4'.,-0
FReTn/CTrThoT/PolhirTlAlcST/ !Rna /eis FReTn/CTrThoT/PolhirTlAlcST/ !Rna /eis
Q.M.S Advisors | tel: +41 (0)78 922 08 77 | e-mail: [email protected] |
Page 197
09.09.2013
Holder Name Portfolio Name Source Amt Held % Out Latest Chg File Dt Inst Type
CHINA STATE SHIPBUIL n/a Co File 841'523'925 61.06 - 31.12.2012 Government
SHANGHAI ELECTRIC CO n/a Co File 67'885'282 4.93 - 31.12.2012 Government
BAOSTEEL GROUP CORP n/a Co File 50'360'697 3.65 - 31.12.2012 Government
CITIC GROUP n/a ULT-AGG 20'800'000 1.51 - 31.12.2012 Government
INDUSTRIAL & COMM BA n/a Co File 17'765'364 1.29 - 31.12.2012 Government
CITIC SECURITIES CO n/a ULT-AGG 17'033'662 1.24 - 31.12.2012 Investment Advisor
CHINA SOUTHERN FUND Multiple Portfolios MF-AGG 14'171'159 1.03 (919'132) 30.06.2013 Investment Advisor
HARVEST FUND MANAGEM Multiple Portfolios MF-AGG 4'380'961 0.32 (3'012'974) 31.12.2012 Investment Advisor
BANK OF CHINA LTD n/a Co File 4'368'219 0.32 - 31.12.2012 Government
HUATAI-PINEBRIDGE FU Multiple Portfolios MF-AGG 2'526'786 0.18 (5'780) 31.12.2012 Investment Advisor
GF SECURITIES CO LTD n/a Co File 2'431'120 0.18 - 31.12.2012 Corporation
HUAAN FUND MANAGEMEN Multiple Portfolios MF-AGG 1'716'862 0.12 (149'807) 31.12.2012 Investment Advisor
LION FUND MANAGEMENT Multiple Portfolios MF-AGG 1'441'816 0.1 1'246'110 31.12.2012 Investment Advisor
E FUND MANAGEMENT Multiple Portfolios MF-AGG 1'354'592 0.1 127'941 31.12.2012 Investment Advisor
CHINA ASSET MANAGEME Multiple Portfolios MF-AGG 1'063'260 0.08 - 02.09.2013 Investment Advisor
TIANTONG ASSET MANAG Multiple Portfolios MF-AGG 819'526 0.06 (49'168) 31.12.2012 Investment Advisor
GUOTAI ASSET MANAGEM Multiple Portfolios MF-AGG 621'618 0.05 68'439 31.12.2012 Investment Advisor
ICBC CREDIT SUISSE A Multiple Portfolios MF-AGG 620'397 0.05 (56'691) 31.12.2012 Investment Advisor
DACHENG FUND MANAGME Multiple Portfolios MF-AGG 562'403 0.04 (27'800) 31.12.2012 Investment Advisor
GTJA ALLIANZ FUND MA Multiple Portfolios MF-AGG 536'801 0.04 6'419 31.12.2012 Investment Advisor
Firm Name Analyst Recommendation Weighting Change Target Price Date Date
Northeast Securities Co Ltd JIANGTAO WU add 4 M #N/A N/A Not Provided 01.04.2013
Capital Securities Corp TEAM COVERAGE neutral 3 M #N/A N/A Not Provided 27.03.2013
Everbright Securities Co., Ltd LU ZHOU accumulate 4 M 25 12 month 03.02.2013
China Securities Co., Ltd GAO XIAOCHUN add 4 M 45 Not Provided 25.06.2012
Industrial Securities WU HUA neutral 3 M #N/A N/A Not Provided 20.12.2011
SWS Research Co Ltd MILLER LI neutral 3 M #N/A N/A Not Provided 08.09.2011
China Minzu Securities Co Ltd CAIXIA FU add 4 N 38 6 month 03.05.2011
Bank of China International XU MINLE buy 5 M 41 Not Provided 01.11.2010
China Galaxy Securities JU HOULIN buy 5 M 31 Not Provided 01.06.2010
Citic Securities Co., Ltd ZHANG TING buy 5 M #N/A N/A Not Provided 30.04.2010
PingAn Securities GUOJI YE neutral 3 M #N/A N/A Not Provided 31.03.2010
China Merchants Securities LIU RONG neutral 3 N #N/A N/A Not Provided 31.03.2010
Hanwha Securities Co., Ltd BAN YOUNG-WOOK not rated #N/A N/A M #N/A N/A Not Provided 05.02.2009
Holdings By:
China CSSC Holdings Ltd ee
Q.M.S Advisors | tel: +41 (0)78 922 08 77 | e-mail: [email protected] |
Page 198
09.09.2013
Bank of Nanjing Co., Ltd. operates in commercial banking businesses. The Bank
provides deposit, loan, settlement, discount, financial bond issuance,
government bond underwriting and trading, letter of credit, bank guarantee, and
other related financial services.
Latest Fiscal Year: 12/2012
LTM as of: 06/yy
52-Week High (04.02.2013) 11.00
52-Week Low (26.09.2012) 7.29
Daily Volume
8.69
52-Week High % Change -21.00% Dividend Yield -
52-Week Low % Change 19.20% Beta 0.98
% 52 Week Price Range High/Low 24.26% Equity Float 2'489.94
Shares Out 30.06.2013 2'968.9 Short Int -
25'800.03 1 Yr Total Return 14.52%
Total Debt 100'312.71 YTD Return -0.79%
Preferred Stock 0.0 Adjusted BETA 0.979
Minority Interest 192.4 Analyst Recs 14
Cash and Equivalents 123'088.76 Consensus Rating 3.929
Enterprise Value -
Average Volume 5 Day 15'423'320
601009 CH EQUITY YTD Change - Average Volume 30 Day 12'994'500
601009 CH EQUITY YTD % CHANGE - Average Volume 3 Month 12'575'240
LTM-4Q LTM FY+1 FY+2 FQ+1 FQ+2
31.12.2008 31.12.2009 31.12.2010 31.12.2011 31.12.2012 06/yy 06/yy 12/13 Y 12/14 Y 09/13 Q3 12/13 Q4
5'180.3 5'435.7 8'340.3 13'992.2 18'203.3 16'942.3 19'310.2 10'377.0 12'168.0 2'420.0 2'420.0
- - - - - 0.00x 0.00x - - - -
- - - - - 0.0 0.0 - - - -
- - - - - 0.00x 0.00x - - - -
1'456.1 1'543.7 2'310.9 3'211.5 4'012.6 3'806.2 4'232.2 4'583.3 5'303.4 1'020.0 1'020.0
10.62x 23.04x 11.04x 8.59x 6.81x 6.65x 5.93x 5.69x 4.92x 5.43x 5.23x
EBITDA - Long-Term Rating Date 09.08.2011
EBIT - Long-Term Rating BBB-
Operating Margin 54.17% Long-Term Outlook STABLE
Pretax Margin 54.39% Short-Term Rating Date 09.08.2011
Return on Assets 1.14% Short-Term Rating A-3
Return on Common Equity 17.28%
Return on Capital 3.14% EBITDA/Interest Exp. -
Asset Turnover 0.05% (EBITDA-Capex)/Interest Exp. -
Net Debt/EBITDA -
Gross Margin - Total Debt/EBITDA -
EBITDA Margin -
EBIT Margin - Total Debt/Equity 407.5%
Net Income Margin 43.8% Total Debt/Capital 80.2%
Asset Turnover 0.05
Current Ratio - Net Fixed Asset Turnover 9.58
Quick Ratio - Accounts receivable turnover-days -
Debt to Assets 29.18% Inventory Days -
Tot Debt to Common Equity 407.47% Accounts Payable Turnover Day -
Accounts Receivable Turnover - Cash Conversion Cycle -
Inventory Turnover -
Fiscal Year Ended
Bank Of Nanjing Co LtdPrice/Volume
Valuation Analysis
67'580'809.00
Current Price (9/dd/yy) Market Data
Net Income
P/E
Market Capitalization
Average Daily Trading Volume
Relative Stock Price Performance
Total Revenue
TEV/Revenue
EBITDA
TEV/EBITDA
Profitability S&P Issuer Ratings
Credit Ratios
Margin Analysis
Reference
Structure
,
.
1
3
5
-,
-.
o!-. l!-. k!-. a!-. g!-0 c!-0 j!-0 Q!-0 j!-0 g!-0 g!-0 Q!-0 o!-0', F-,', F.,', F0,', F1,', F2,', F3,', F4,', F5,', F6,', F-,,', F
0.0
2'000.0
4'000.0
6'000.0
8'000.0
10'000.0
12'000.0
14'000.0
16'000.0
18'000.0
20'000.0
2001 2002 2003 2004 2005 2006 2007 2008 2009 2010 2011 2012
,',,
2',,
-,',,
-2',,
.,',,
.2',,
,-',-'.,-, ,-',4'.,-, ,-',-'.,-- ,-',4'.,-- ,-',-'.,-. ,-',4'.,-. ,-',-'.,-0 ,-',4'.,-0
FReTn/CTrThoT/PolhirTlAlcST/ !Rna /eis FReTn/CTrThoT/PolhirTlAlcST/ !Rna /eis
Q.M.S Advisors | tel: +41 (0)78 922 08 77 | e-mail: [email protected] |
Page 199
09.09.2013
Holder Name Portfolio Name Source Amt Held % Out Latest Chg File Dt Inst Type
BNP PARIBAS INV PART n/a ULT-AGG 437'620'740 14.74 53'656'647 31.03.2013 Investment Advisor
NANJING ZIJING INVES n/a Co File 365'996'746 12.33 - 31.12.2012 Holding Company
NANJING XINGANG HIGH n/a Co File 333'450'000 11.23 - 31.12.2012 Holding Company
NANJING STATE-OWNED n/a Co File 42'634'346 1.44 - 31.12.2012 Other
SINOPEC FINANCE CO L n/a Co File 34'708'274 1.17 - 31.12.2012 Investment Advisor
NANJING JINLING PHAR n/a Co File 33'800'000 1.14 - 31.12.2012 Government
JIANGSU GUOXIN INVES n/a Co File 32'365'967 1.09 - 31.12.2012 Corporation
NANJING TEXTILE INDU n/a Co File 32'256'571 1.09 - 31.12.2012 Corporation
CHINA PACIFIC LIFE I n/a Co File 25'328'501 0.85 - 31.12.2012 Insurance Company
HARVEST FUND MANAGEM Multiple Portfolios MF-AGG 16'902'776 0.57 (11'268'650) 31.12.2012 Investment Advisor
ICBC CREDIT SUISSE A Multiple Portfolios MF-AGG 12'981'049 0.44 7'507'061 31.12.2012 Investment Advisor
E FUND MANAGEMENT Multiple Portfolios MF-AGG 12'491'794 0.42 (24'232'960) 31.12.2012 Investment Advisor
HUATAI-PINEBRIDGE FU Multiple Portfolios MF-AGG 12'481'644 0.42 2'756'725 31.12.2012 Investment Advisor
HFT INVESTMENT MANAG Multiple Portfolios MF-AGG 11'286'219 0.38 11'279'219 31.12.2012 Investment Advisor
CHINA MERCHANTS FUND Multiple Portfolios MF-AGG 9'500'000 0.32 9'500'000 31.12.2012 Investment Advisor
CHINA ASSET MANAGEME Multiple Portfolios MF-AGG 9'489'296 0.32 (8'213'005) 31.12.2012 Investment Advisor
CITIC PRUDENTIAL FUN Multiple Portfolios MF-AGG 9'201'411 0.31 4'599'987 31.12.2012 Investment Advisor
GUOTAI ASSET MANAGEM Multiple Portfolios MF-AGG 8'614'748 0.29 (9'442'260) 31.12.2012 Investment Advisor
CHINA SOUTHERN FUND Multiple Portfolios MF-AGG 7'325'290 0.25 5'688'706 30.06.2013 Investment Advisor
JP MORGAN n/a ULT-AGG 7'099'675 0.24 7'099'675 31.03.2013 Investment Advisor
Firm Name Analyst Recommendation Weighting Change Target Price Date Date
PingAn Securities GRACE LI buy 5 M #N/A N/A Not Provided 03.09.2013
Northeast Securities Co Ltd YAYUN TANG add 4 M #N/A N/A Not Provided 30.08.2013
China International Capital Corp JIE HUANG accumulate 4 M #N/A N/A Not Provided 30.08.2013
Guotai Junan GUANHUA QIU add 4 U 10 Not Provided 20.08.2013
Chang Jiang Securities Co. Limited LIU JUN buy 5 M #N/A N/A Not Provided 18.08.2013
Qilu Securities Co Ltd JIAOYI CHENG add 4 M #N/A N/A Not Provided 11.08.2013
UBS JANET SUN neutral 3 M 8 12 month 07.08.2013
SWS Research Co Ltd JUN NI buy 5 M #N/A N/A Not Provided 19.07.2013
GF Securities Co. Ltd. Mu Hua add 4 N #N/A N/A Not Provided 19.06.2013
Goldman Sachs NING MA Sell/Neutral 1 M 8 12 month 12.06.2013
Everbright Securities Co., Ltd SHEN WEI buy 5 M 11 12 month 02.06.2013
Hong Yuan Securities ZHANG JIXIU add 4 M 8 6 month 11.05.2013
Deutsche Bank TRACY YU not rated #N/A N/A M #N/A N/A Not Provided 12.04.2013
Capital Securities Corp XIE JIYONG buy 5 M 15 Not Provided 19.02.2013
Sinolink Securities Co Ltd JIANGANG CHEN neutral 3 N #N/A N/A Not Provided 29.10.2012
China Merchants Securities LUO YI buy 5 M #N/A N/A Not Provided 23.07.2012
Citic Securities Co., Ltd ZHU YAN overweight 5 M 11 6 month 29.06.2012
China Securities Co., Ltd #N/A N/A add 4 M 11 Not Provided 25.06.2012
Tebon Securities Co Ltd ZHANG FAN buy 5 M #N/A N/A Not Provided 07.06.2012
Bank of China International JINHUA YIN buy 5 U 11 Not Provided 24.02.2012
Rising Securities Co.,LTD XIE AIHONG neutral 3 D #N/A N/A Not Provided 20.12.2011
China Investment Securities ZHANG ZHONGYANG buy 5 M #N/A N/A Not Provided 02.12.2011
China Minzu Securities Co Ltd ZHANG JING buy 5 M 14 6 month 01.12.2011
Industrial Securities YIDONG ZHANG strong buy 5 U #N/A N/A Not Provided 29.11.2011
BOCOM International Holdings LI SHANSHAN long-term buy 5 M #N/A N/A Not Provided 07.11.2011
Central China Securities CHEN XI add 4 N #N/A N/A Not Provided 31.10.2011
Great Wall Securities CHENG BINBIN neutral 3 N #N/A N/A Not Provided 23.05.2011
Founder Securities WEI ZHOU add 4 M #N/A N/A Not Provided 20.03.2011
Guodu Securities Co Ltd DENG TING buy 5 M #N/A N/A Not Provided 15.03.2011
HuaChuang Securities GAO LI buy 5 M #N/A N/A Not Provided 06.04.2010
Holdings By:
Bank Of Nanjing Co Ltd ee
Q.M.S Advisors | tel: +41 (0)78 922 08 77 | e-mail: [email protected] |
Page 200
09.09.2013
AVIC Investment Holdings Co., Ltd. provides railroad passenger and freight
transportation services. Through its subsidiaries, the Company also operates
in commercial trading, manufactures wood products and pharmaceuticals, as well
as provides technical and brokerage services.
Latest Fiscal Year: 12/2012
LTM as of: 06/yy
52-Week High (30.05.2013) 19.97
52-Week Low (26.09.2012) 8.99
Daily Volume
18.26
52-Week High % Change -8.56% Dividend Yield -
52-Week Low % Change 103.11% Beta -
% 52 Week Price Range High/Low 69.31% Equity Float 645.63
Shares Out 02.09.2013 1'522.5 Short Int -
27'800.31 1 Yr Total Return 55.99%
Total Debt 48'623.11 YTD Return 34.98%
Preferred Stock 0.0 Adjusted BETA -
Minority Interest 4'859.1 Analyst Recs 5
Cash and Equivalents 23'643.41 Consensus Rating 4.600
Enterprise Value 63'028.09
Average Volume 5 Day 21'478'140
600705 CH EQUITY YTD Change - Average Volume 30 Day 12'633'220
600705 CH EQUITY YTD % CHANGE - Average Volume 3 Month 14'638'410
LTM-4Q LTM FY+1 FY+2 FQ+1 FQ+2
31.12.2008 31.12.2009 31.12.2010 31.12.2011 31.12.2012 06/yy 06/yy 12/13 Y 12/14 Y 09/13 Q3 12/13 Q4
0.0 0.0 - 3'314.8 4'267.6 4'910.1 4'551.4 4'427.5 5'428.5 - -
- - - - 11.87x 0.00x 32.63x - - - -
(1.2) (6.9) (4.1) 1'551.6 1'876.3 0.0 0.0 - - - -
- - - - 26.99x 0.00x 0.00x - - - -
0.1 0.1 878.3 638.3 722.2 887.4 451.8 1'023.0 1'324.3 - -
- - - - 26.27x 0.00x 44.62x 26.93x 20.92x - -
EBITDA 1'876.33 Long-Term Rating Date -
EBIT 1'820.80 Long-Term Rating -
Operating Margin 42.67% Long-Term Outlook -
Pretax Margin 49.69% Short-Term Rating Date -
Return on Assets 1.43% Short-Term Rating -
Return on Common Equity 14.97%
Return on Capital - EBITDA/Interest Exp. 16.05
Asset Turnover 0.08% (EBITDA-Capex)/Interest Exp. 12.33
Net Debt/EBITDA -
Gross Margin 82.5% Total Debt/EBITDA -
EBITDA Margin -
EBIT Margin 44.0% Total Debt/Equity 916.6%
Net Income Margin 16.9% Total Debt/Capital 82.7%
Asset Turnover 0.08
Current Ratio 0.96 Net Fixed Asset Turnover 19.83
Quick Ratio 0.52 Accounts receivable turnover-days 4.52
Debt to Assets 74.67% Inventory Days 5.93
Tot Debt to Common Equity 916.56% Accounts Payable Turnover Day 100.86
Accounts Receivable Turnover 80.82 Cash Conversion Cycle -105.24
Inventory Turnover 61.58
Fiscal Year Ended
Avic Investment Holdings Co LtdPrice/Volume
Valuation Analysis
58'948'260.00
Current Price (9/dd/yy) Market Data
Net Income
P/E
Market Capitalization
Average Daily Trading Volume
Relative Stock Price Performance
Total Revenue
TEV/Revenue
EBITDA
TEV/EBITDA
Profitability S&P Issuer Ratings
Credit Ratios
Margin Analysis
Reference
Structure
,
2
-,
-2
.,
.2
o!-. l!-. k!-. a!-. g!-0 c!-0 j!-0 Q!-0 j!-0 g!-0 g!-0 Q!-0 o!-0', F-,', F.,', F0,', F1,', F2,', F3,', F4,', F5,', F6,', F
0.0
500.0
1'000.0
1'500.0
2'000.0
2'500.0
3'000.0
3'500.0
4'000.0
4'500.0
2001 2002 2003 2004 2005 2006 2007 2008 2009 2010 2011 2012
,',,
-,',,
.,',,
0,',,
1,',,
2,',,
3,',,
4,',,
,-',-'.,-, ,-',4'.,-, ,-',-'.,-- ,-',4'.,-- ,-',-'.,-. ,-',4'.,-. ,-',-'.,-0 ,-',4'.,-0
FReTn/CTrThoT/PolhirTlAlcST/ !Rna /eis FReTn/CTrThoT/PolhirTlAlcST/ !Rna /eis
Q.M.S Advisors | tel: +41 (0)78 922 08 77 | e-mail: [email protected] |
Page 201
09.09.2013
Holder Name Portfolio Name Source Amt Held % Out Latest Chg File Dt Inst Type
AVIATION INDUSTRY CO n/a ULT-AGG 777'828'113 51.09 - 31.12.2012 Corporation
HARBIN RAILROAD BURE n/a Co File 31'078'586 2.04 - 31.12.2012 Government
HEILONGJIANG HONGTON n/a Co File 18'174'611 1.19 - 31.12.2012 Corporation
HAITONG SECURITIES C n/a Co File 9'310'356 0.61 - 31.12.2012 Investment Advisor
HEILONGJIANG FINANCI n/a Co File 6'767'548 0.44 - 31.12.2012 Bank
DAQING PETROLEUM MGM n/a Co File 6'506'510 0.43 - 31.12.2012 Government
HARBIN NORTH ASSETS n/a Co File 6'481'260 0.43 - 31.12.2012 Government
YANG ZHIWEN n/a Co File 5'413'692 0.36 - 31.12.2012 n/a
YANG HUIMIN n/a Co File 5'165'709 0.34 - 31.12.2012 n/a
SHANGHAI MEIJIN TECH n/a Co File 5'015'315 0.33 - 31.12.2012 Other
AEGON INDUSTRIAL FUN Multiple Portfolios MF-AGG 3'399'940 0.22 3'399'940 31.12.2012 Investment Advisor
GUANGFA SECURITIES C n/a Co File 2'999'929 0.2 - 31.12.2012 Investment Advisor
LIU TAO n/a Co File 2'996'547 0.2 - 31.12.2012 n/a
YU LINGSHU n/a Co File 2'723'436 0.18 - 31.12.2012 n/a
SHENG YUHONG n/a Co File 2'441'773 0.16 - 31.12.2012 n/a
CHEN FURONG n/a Co File 2'149'872 0.14 - 31.12.2012 n/a
YANG PENGCHENG n/a Co File 2'080'000 0.14 - 31.12.2012 n/a
LION FUND MANAGEMENT LION THEME SELECTION MF-PART 1'931'700 0.13 1'931'700 30.06.2013 Investment Advisor
FULLGOAL FUND MANAGE Multiple Portfolios MF-AGG 1'904'257 0.13 1'904'257 31.12.2012 Investment Advisor
GAO PENGFEI n/a Co File 1'600'000 0.11 - 31.12.2012 n/a
Firm Name Analyst Recommendation Weighting Change Target Price Date Date
GF Securities Co. Ltd. CONG LI buy 5 M 21 12 month 28.08.2013
China Minzu Securities Co Ltd SONG JIAN add 4 D #N/A N/A Not Provided 28.08.2013
Northeast Securities Co Ltd XINAN ZHAO add 4 M #N/A N/A Not Provided 22.08.2013
SWS Research Co Ltd SUSIE WANG outperform 5 M #N/A N/A Not Provided 17.07.2013
Everbright Securities Co., Ltd LU ZHOU buy 5 N #N/A N/A Not Provided 17.02.2013
Holdings By:
Avic Investment Holdings Co Ltd ee
Q.M.S Advisors | tel: +41 (0)78 922 08 77 | e-mail: [email protected] |
Page 202
09.09.2013
Wuhan Iron & Steel Co., Ltd. manufactures and markets cold rolled steel
plates and silicon steel sheets. The Company also invests in metallurgical
technology development and provides related technical services.
Latest Fiscal Year: 12/2012
LTM as of: 06/yy
52-Week High (15.01.2013) 3.10
52-Week Low (25.06.2013) 2.15
Daily Volume
2.43
52-Week High % Change -21.61% Dividend Yield -
52-Week Low % Change 13.02% Beta 0.84
% 52 Week Price Range High/Low 26.32% Equity Float 3'014.79
Shares Out 30.06.2013 10'093.8 Short Int -
24'527.89 1 Yr Total Return -3.17%
Total Debt 40'270.09 YTD Return -11.91%
Preferred Stock 0.0 Adjusted BETA 0.839
Minority Interest 1'143.4 Analyst Recs 6
Cash and Equivalents 1'613.67 Consensus Rating 4.000
Enterprise Value 66'140.60
Average Volume 5 Day 31'786'260
600005 CH EQUITY YTD Change - Average Volume 30 Day 16'672'150
600005 CH EQUITY YTD % CHANGE - Average Volume 3 Month 17'031'190
LTM-4Q LTM FY+1 FY+2 FQ+1 FQ+2
31.12.2008 31.12.2009 31.12.2010 31.12.2011 31.12.2012 06/yy 06/yy 12/13 Y 12/14 Y 09/13 Q3 12/13 Q4
72'952.8 53'556.5 86'686.1 100'824.0 91'292.7 95'355.8 90'366.8 96'013.8 98'636.0 - -
0.86x 1.70x 0.77x 0.68x 0.74x 2.88x 2.93x - - - -
10'680.0 6'317.6 8'784.8 8'311.7 6'458.6 0.0 0.0 8'884.0 10'613.0 - -
5.85x 14.42x 7.63x 8.30x 10.49x 0.00x 0.00x 7.44x 6.23x - -
5'185.0 1'515.4 1'891.6 1'083.6 210.0 (7.2) 535.7 777.5 1'207.3 - -
7.22x 42.90x 17.74x 26.51x 131.90x 0.00x 41.98x 38.57x 23.14x - -
EBITDA 6'458.61 Long-Term Rating Date -
EBIT 1'202.55 Long-Term Rating -
Operating Margin 1.32% Long-Term Outlook -
Pretax Margin 0.12% Short-Term Rating Date -
Return on Assets 0.54% Short-Term Rating -
Return on Common Equity 1.50%
Return on Capital - EBITDA/Interest Exp. 3.39
Asset Turnover 0.91% (EBITDA-Capex)/Interest Exp. 1.08
Net Debt/EBITDA -
Gross Margin 5.1% Total Debt/EBITDA -
EBITDA Margin -
EBIT Margin 1.6% Total Debt/Equity 113.1%
Net Income Margin 0.2% Total Debt/Capital 52.3%
Asset Turnover 0.91
Current Ratio 0.49 Net Fixed Asset Turnover 1.35
Quick Ratio 0.23 Accounts receivable turnover-days 35.18
Debt to Assets 40.79% Inventory Days 63.76
Tot Debt to Common Equity 113.08% Accounts Payable Turnover Day 75.57
Accounts Receivable Turnover 10.38 Cash Conversion Cycle 33.37
Inventory Turnover 5.72
Profitability S&P Issuer Ratings
Credit Ratios
Margin Analysis
Reference
Structure
Net Income
P/E
Market Capitalization
Average Daily Trading Volume
Relative Stock Price Performance
Total Revenue
TEV/Revenue
EBITDA
TEV/EBITDA
Fiscal Year Ended
Wuhan Iron & Steel Co LtdPrice/Volume
Valuation Analysis
27'946'872.00
Current Price (9/dd/yy) Market Data
,
-
-
.
.
0
0
1
o!-. l!-. k!-. a!-. g!-0 c!-0 j!-0 Q!-0 j!-0 g!-0 g!-0 Q!-0 o!-0', F
-,', F
.,', F
0,', F
1,', F
2,', F
3,', F
4,', F
5,', F
0.0
20'000.0
40'000.0
60'000.0
80'000.0
100'000.0
120'000.0
2001 2002 2003 2004 2005 2006 2007 2008 2009 2010 2011 2012
,',,
-,,',,
.,,',,
0,,',,
1,,',,
2,,',,
3,,',,
4,,',,
,-',-'.,-, ,-',4'.,-, ,-',-'.,-- ,-',4'.,-- ,-',-'.,-. ,-',4'.,-. ,-',-'.,-0 ,-',4'.,-0
FReTn/CTrThoT/PolhirTlAlcST/ !Rna /eis FReTn/CTrThoT/PolhirTlAlcST/ !Rna /eis
Q.M.S Advisors | tel: +41 (0)78 922 08 77 | e-mail: [email protected] |
Page 203
09.09.2013
Holder Name Portfolio Name Source Amt Held % Out Latest Chg File Dt Inst Type
WUHAN IRON & STEEL G n/a EXCH 6'795'503'954 67.32 - 10.07.2013 Government
SHENZHEN JIFU VENTUR n/a Co File 209'901'791 2.08 - 31.12.2012 Venture Capital
YANG TAO n/a Co File 51'470'795 0.51 - 31.12.2012 n/a
PICC HEALTH INSURANC n/a Co File 43'291'563 0.43 - 31.12.2012 Insurance Company
HARVEST FUND MANAGEM Multiple Portfolios MF-AGG 41'035'470 0.41 (20'698'861) 31.12.2012 Investment Advisor
HUATAI-PINEBRIDGE FU Multiple Portfolios MF-AGG 23'159'594 0.23 (2'471'318) 31.12.2012 Investment Advisor
ZHANG WENMIN n/a Co File 22'102'100 0.22 - 31.12.2012 n/a
CHINA ASSET MANAGEME Multiple Portfolios MF-AGG 15'200'083 0.15 (11'232'500) 31.12.2012 Investment Advisor
DATON SECURITIES CO n/a Co File 14'390'277 0.14 - 31.12.2012 Corporation
E FUND MANAGEMENT Multiple Portfolios MF-AGG 8'122'479 0.08 (862'082) 31.12.2012 Investment Advisor
CHINA ASSET MANAGEME Multiple Portfolios MF-AGG 7'817'717 0.08 - 02.09.2013 Investment Advisor
GUOTAI ASSET MANAGEM Multiple Portfolios MF-AGG 4'661'555 0.05 600'552 31.12.2012 Investment Advisor
DACHENG FUND MANAGME Multiple Portfolios MF-AGG 4'551'951 0.05 (377'900) 31.12.2012 Investment Advisor
GTJA ALLIANZ FUND MA Multiple Portfolios MF-AGG 3'931'738 0.04 47'333 31.12.2012 Investment Advisor
CHINA UNIVERSAL ASSE Multiple Portfolios MF-AGG 3'349'087 0.03 (162'228) 02.09.2013 Investment Advisor
BANK OF CHINA INVEST Multiple Portfolios MF-AGG 2'820'916 0.03 111'897 31.12.2012 Investment Advisor
ICBC CREDIT SUISSE A Multiple Portfolios MF-AGG 2'745'588 0.03 (2'200'239) 31.12.2012 Investment Advisor
CHINA SOUTHERN FUND Multiple Portfolios MF-AGG 2'559'892 0.03 (1'661'220) 31.12.2012 Investment Advisor
BOSHI FUND MANAGEMEN Multiple Portfolios MF-AGG 2'460'331 0.02 (5'657'315) 31.12.2012 Investment Advisor
E FUND MANAGEMENT Multiple Portfolios MF-AGG 2'338'724 0.02 - 02.09.2013 Investment Advisor
Firm Name Analyst Recommendation Weighting Change Target Price Date Date
Chang Jiang Securities Co. Limited LIU YUANRUI add 4 M #N/A N/A Not Provided 02.09.2013
Capital Securities Corp LI XIAOLU neutral 3 M 5 Not Provided 27.08.2013
Masterlink Securities SARAH WANG buy 5 M 3 Not Provided 20.08.2013
SWS Research Co Ltd KERRY HE outperform 5 U #N/A N/A Not Provided 22.07.2013
Qilu Securities Co Ltd DU HUI add 4 M #N/A N/A Not Provided 02.05.2013
China International Capital Corp LUO WEI neutral 3 M #N/A N/A Not Provided 05.03.2013
Hong Yuan Securities ZHAO LIMING buy 5 N #N/A N/A Not Provided 28.08.2012
Industrial Securities LAN JIE buy 5 M #N/A N/A Not Provided 24.04.2012
Tebon Securities Co Ltd TEAM COVERAGE outperform 5 M #N/A N/A Not Provided 18.02.2012
China Investment Securities CHU XUELIANG buy 5 M #N/A N/A Not Provided 11.01.2012
China Merchants Securities ZHANG SHIBAO buy 5 M 10 Not Provided 26.01.2011
China Securities Co., Ltd WANG ZHE add 4 M 5 Not Provided 08.12.2010
China Galaxy Securities SUN YONG speculative buy 4 M #N/A N/A Not Provided 18.05.2010
GuoSen Securities Co Ltd WANG ZHAOHUA neutral 3 N #N/A N/A Not Provided 01.03.2010
Bank of China International LE YUKUN buy 5 M 10 Not Provided 27.08.2009
Holdings By:
Wuhan Iron & Steel Co Ltd ee
Q.M.S Advisors | tel: +41 (0)78 922 08 77 | e-mail: [email protected] |
Page 204
09.09.2013
Hainan Airlines Co., Ltd. provides passenger and freight air transportation.
The Company also provides charter flight services.
Latest Fiscal Year: 12/2012
LTM as of: 06/yy
52-Week High (03.06.2013) 2.63
52-Week Low (26.09.2012) 1.83
Daily Volume
2.06
52-Week High % Change -21.52% Dividend Yield -
52-Week Low % Change 12.88% Beta 0.98
% 52 Week Price Range High/Low 23.12% Equity Float 4'506.12
Shares Out 13.08.2013 11'812.7 Short Int -
25'211.65 1 Yr Total Return 4.61%
Total Debt 58'236.41 YTD Return -0.58%
Preferred Stock 0.0 Adjusted BETA 0.977
Minority Interest 111.7 Analyst Recs 5
Cash and Equivalents 22'312.40 Consensus Rating 3.800
Enterprise Value 64'142.35
Average Volume 5 Day 88'337'180
600221 CH EQUITY YTD Change - Average Volume 30 Day 60'043'060
600221 CH EQUITY YTD % CHANGE - Average Volume 3 Month 42'275'210
LTM-4Q LTM FY+1 FY+2 FQ+1 FQ+2
31.12.2008 31.12.2009 31.12.2010 31.12.2011 31.12.2012 06/yy 06/yy 12/13 Y 12/14 Y 09/13 Q3 12/13 Q4
13'167.4 15'052.7 21'078.6 25'470.4 27'992.4 27'691.7 28'585.3 32'836.0 37'012.5 - -
2.76x 3.63x 3.38x 2.22x 2.21x 8.24x 9.48x - - - -
1'159.9 2'554.3 6'510.5 6'373.4 6'425.2 0.0 0.0 - - - -
31.30x 21.38x 10.95x 8.87x 9.61x 0.00x 0.00x - - - -
(1'414.4) 334.7 3'013.9 2'631.3 1'927.8 2'460.8 2'073.9 2'053.0 2'164.0 - -
- 50.14x 10.24x 6.48x 9.88x 7.45x 11.77x 14.21x 10.67x - -
EBITDA 6'425.22 Long-Term Rating Date -
EBIT 3'989.03 Long-Term Rating -
Operating Margin 14.25% Long-Term Outlook -
Pretax Margin 9.48% Short-Term Rating Date -
Return on Assets 2.30% Short-Term Rating -
Return on Common Equity 10.81%
Return on Capital - EBITDA/Interest Exp. 1.76
Asset Turnover 0.32% (EBITDA-Capex)/Interest Exp. -0.50
Net Debt/EBITDA -
Gross Margin 23.0% Total Debt/EBITDA -
EBITDA Margin -
EBIT Margin 12.7% Total Debt/Equity 244.7%
Net Income Margin 6.9% Total Debt/Capital 70.9%
Asset Turnover 0.32
Current Ratio 0.73 Net Fixed Asset Turnover 0.64
Quick Ratio 0.65 Accounts receivable turnover-days 5.93
Debt to Assets 62.81% Inventory Days 1.56
Tot Debt to Common Equity 244.72% Accounts Payable Turnover Day 72.01
Accounts Receivable Turnover 61.55 Cash Conversion Cycle -44.46
Inventory Turnover 233.34
Profitability S&P Issuer Ratings
Credit Ratios
Margin Analysis
Reference
Structure
Net Income
P/E
Market Capitalization
Average Daily Trading Volume
Relative Stock Price Performance
Total Revenue
TEV/Revenue
EBITDA
TEV/EBITDA
Fiscal Year Ended
Hainan Airlines Co LtdPrice/Volume
Valuation Analysis
157'487'749.00
Current Price (9/dd/yy) Market Data
,
-
-
.
.
0
0
o!-. l!-. k!-. a!-. g!-0 c!-0 j!-0 Q!-0 j!-0 g!-0 g!-0 Q!-0 o!-0', F
2,', F
-,,', F
-2,', F
.,,', F
.2,', F
0.0
5'000.0
10'000.0
15'000.0
20'000.0
25'000.0
30'000.0
2001 2002 2003 2004 2005 2006 2007 2008 2009 2010 2011 2012
,',,
2',,
-,',,
-2',,
.,',,
.2',,
0,',,
02',,
,-',-'.,-, ,-',4'.,-, ,-',-'.,-- ,-',4'.,-- ,-',-'.,-. ,-',4'.,-. ,-',-'.,-0 ,-',4'.,-0
FReTn/CTrThoT/PolhirTlAlcST/ !Rna /eis FReTn/CTrThoT/PolhirTlAlcST/ !Rna /eis
Q.M.S Advisors | tel: +41 (0)78 922 08 77 | e-mail: [email protected] |
Page 205
09.09.2013
Holder Name Portfolio Name Source Amt Held % Out Latest Chg File Dt Inst Type
GRAND CHINA AIR CO L n/a Co File 3'432'789'486 29.06 - 31.12.2012 Corporation
HAIKOU MEILAN INTL A n/a Co File 862'848'902 7.3 - 31.12.2012 Corporation
HNA GROUP CO LTD n/a Co File 595'238'094 5.04 - 31.12.2012 Corporation
HAINAN DEV HOLDINGS n/a Co File 595'238'094 5.04 - 31.12.2012 Other
ZHONGHAI TRUST CO LT n/a EXCH 589'700'000 4.99 - 13.08.2012 Investment Advisor
CHANGJIANG LEASING C n/a Co File 517'671'098 4.38 - 31.12.2012 Corporation
ZHONGTIE TRUST CO n/a Co File 493'000'000 4.17 - 31.12.2012 Other
SINOSAFE GEN INSUR C n/a Co File 397'199'862 3.36 - 31.12.2012 Insurance Company
HAITONG SECURITIES C n/a Co File 396'437'878 3.36 - 31.12.2012 Investment Advisor
SHAANXI INTL TRUST C n/a EXCH 393'100'000 3.33 - 13.08.2012 Corporation
RONGTONG FUND MANAGE Multiple Portfolios MF-AGG 187'000'000 1.58 49'000'000 30.06.2013 Investment Advisor
EVERBRIGHT PRAMERICA Multiple Portfolios MF-AGG 174'262'838 1.48 (50'432) 30.06.2013 Investment Advisor
INVESCO GREAT WALL F Multiple Portfolios MF-AGG 158'569'771 1.34 135'945'713 31.03.2013 Investment Advisor
CHINA ASSET MANAGEME Multiple Portfolios MF-AGG 32'280'292 0.27 2'636'128 31.12.2012 Investment Advisor
HARVEST FUND MANAGEM Multiple Portfolios MF-AGG 21'578'274 0.18 (15'004'498) 31.12.2012 Investment Advisor
BOSHI FUND MANAGEMEN Multiple Portfolios MF-AGG 16'183'524 0.14 11'331'196 31.12.2012 Investment Advisor
XI'AN RONGXIN AGRI T n/a Co File 15'835'400 0.13 - 31.12.2012 Other
CHINA INTERNATIONAL Multiple Portfolios MF-AGG 13'999'844 0.12 13'999'844 31.12.2012 Investment Advisor
HUATAI-PINEBRIDGE FU Multiple Portfolios MF-AGG 10'890'632 0.09 (24'590) 31.12.2012 Investment Advisor
BOSERA FUND MANAGEME Multiple Portfolios MF-AGG 10'851'730 0.09 9'911'696 31.12.2012 Investment Advisor
Firm Name Analyst Recommendation Weighting Change Target Price Date Date
Capital Securities Corp LI XIAOLU hold 3 M 2 Not Provided 30.08.2013
EVA Dimensions TIMOTHY STANISH sell 1 N #N/A N/A Not Provided 07.08.2013
GF Securities Co. Ltd. YANG ZHIQING buy 5 M #N/A N/A Not Provided 04.07.2013
PingAn Securities SUN CHAO buy 5 M #N/A N/A Not Provided 18.12.2012
HuaChuang Securities CHEN JUAN buy 5 M #N/A N/A Not Provided 05.11.2012
Citic Securities Co., Ltd ZHANG HONGBO buy 5 U 3 6 month 08.06.2012
Industrial Securities ZENG XU neutral 3 M 2 12 month 04.04.2012
Hong Yuan Securities PANG LINLIN buy 5 N 5 6 month 30.08.2011
China Investment Securities XIE HONG buy 5 M #N/A N/A Not Provided 02.03.2011
Everbright Securities Co., Ltd CHEN XIN buy 5 M 8 6 month 26.02.2011
Bank of China International DU JIANPING buy 5 U 5 Not Provided 01.11.2010
China Galaxy Securities MAO ANG speculative buy 4 U #N/A N/A Not Provided 16.04.2010
AJ Securities LE MINYANG buy 5 D #N/A N/A Not Provided 02.04.2010
Holdings By:
Hainan Airlines Co Ltd ee
Q.M.S Advisors | tel: +41 (0)78 922 08 77 | e-mail: [email protected] |
Page 206
09.09.2013
Huayu Automotive Systems Company Limited manufactures and sells auto parts. The
Company's main products include interior and exterior auto parts, functional
assembly autoparts and thermo processed auto parts etc.
Latest Fiscal Year: 12/2012
LTM as of: 06/yy
52-Week High (31.12.2012) 11.20
52-Week Low (09.07.2013) 7.20
Daily Volume
9.25
52-Week High % Change -17.41% Dividend Yield -
52-Week Low % Change 28.47% Beta 1.01
% 52 Week Price Range High/Low 48.75% Equity Float 1'015.75
Shares Out 30.06.2013 2'583.2 Short Int -
23'894.60 1 Yr Total Return 13.94%
Total Debt 2'512.70 YTD Return -13.07%
Preferred Stock 0.0 Adjusted BETA 1.008
Minority Interest 7'336.0 Analyst Recs 13
Cash and Equivalents 12'928.02 Consensus Rating 4.615
Enterprise Value 19'798.27
Average Volume 5 Day 12'376'700
600741 CH EQUITY YTD Change - Average Volume 30 Day 19'465'930
600741 CH EQUITY YTD % CHANGE - Average Volume 3 Month 16'034'340
LTM-4Q LTM FY+1 FY+2 FQ+1 FQ+2
31.12.2008 31.12.2009 31.12.2010 31.12.2011 31.12.2012 06/yy 06/yy 12/13 Y 12/14 Y 09/13 Q3 12/13 Q4
6'930.4 24'641.3 44'778.3 52'176.5 57'733.0 54'430.0 62'665.4 64'331.0 71'529.8 15'929.0 16'579.0
0.71x 1.14x 0.52x 0.40x 0.45x 1.63x 1.34x - - - -
635.8 2'245.9 4'367.1 4'962.0 5'340.6 0.0 0.0 6'505.5 7'097.0 - -
7.78x 12.47x 5.36x 4.18x 4.83x 0.00x 0.00x 3.04x 2.79x - -
1'003.0 1'530.9 2'553.7 2'990.4 3'103.7 3'053.4 3'202.7 3'330.0 3'891.8 - -
3.56x 16.78x 10.31x 8.00x 9.31x 7.59x 6.29x 7.01x 6.28x - -
EBITDA 5'340.56 Long-Term Rating Date -
EBIT 4'181.91 Long-Term Rating -
Operating Margin 7.24% Long-Term Outlook -
Pretax Margin 10.78% Short-Term Rating Date -
Return on Assets 6.52% Short-Term Rating -
Return on Common Equity 17.17%
Return on Capital - EBITDA/Interest Exp. 91.63
Asset Turnover 1.27% (EBITDA-Capex)/Interest Exp. 48.94
Net Debt/EBITDA -
Gross Margin 16.1% Total Debt/EBITDA -
EBITDA Margin -
EBIT Margin 6.8% Total Debt/Equity 13.0%
Net Income Margin 5.4% Total Debt/Capital 8.6%
Asset Turnover 1.27
Current Ratio 1.52 Net Fixed Asset Turnover 8.48
Quick Ratio 1.22 Accounts receivable turnover-days 70.67
Debt to Assets 5.21% Inventory Days 23.62
Tot Debt to Common Equity 13.04% Accounts Payable Turnover Day 91.01
Accounts Receivable Turnover 5.16 Cash Conversion Cycle 4.72
Inventory Turnover 15.45
Fiscal Year Ended
Huayu Automotive Systems Co LtdPrice/Volume
Valuation Analysis
20'050'746.00
Current Price (9/dd/yy) Market Data
Net Income
P/E
Market Capitalization
Average Daily Trading Volume
Relative Stock Price Performance
Total Revenue
TEV/Revenue
EBITDA
TEV/EBITDA
Profitability S&P Issuer Ratings
Credit Ratios
Margin Analysis
Reference
Structure
,
.
1
3
5
-,
-.
o!-. l!-. k!-. a!-. g!-0 c!-0 j!-0 Q!-0 j!-0 g!-0 g!-0 Q!-0 o!-0', F
.,', F
1,', F
3,', F
5,', F
-,,', F
-.,', F
0.0
10'000.0
20'000.0
30'000.0
40'000.0
50'000.0
60'000.0
70'000.0
2001 2002 2003 2004 2005 2006 2007 2008 2009 2010 2011 2012
,',,
-',,
.',,
0',,
1',,
2',,
3',,
4',,
5',,
,-',-'.,-, ,-',4'.,-, ,-',-'.,-- ,-',4'.,-- ,-',-'.,-. ,-',4'.,-. ,-',-'.,-0 ,-',4'.,-0
FReTn/CTrThoT/PolhirTlAlcST/ !Rna /eis FReTn/CTrThoT/PolhirTlAlcST/ !Rna /eis
Q.M.S Advisors | tel: +41 (0)78 922 08 77 | e-mail: [email protected] |
Page 207
09.09.2013
Holder Name Portfolio Name Source Amt Held % Out Latest Chg File Dt Inst Type
SHANGHAI AUTO INDUST n/a Co File 1'552'448'271 60.1 - 31.12.2012 Government
HUAAN FUND MANAGEMEN Multiple Portfolios MF-AGG 89'921'463 3.48 (18'593'828) 30.06.2013 Investment Advisor
CHINA SOUTHERN FUND Multiple Portfolios MF-AGG 61'736'499 2.39 32'206'727 30.06.2013 Investment Advisor
BOSHI FUND MANAGEMEN Multiple Portfolios MF-AGG 33'754'876 1.31 (2'105'916) 31.12.2012 Investment Advisor
INVESCO GREAT WALL F Multiple Portfolios MF-AGG 32'630'240 1.26 (32'794'443) 28.03.2013 Investment Advisor
LION FUND MANAGEMENT Multiple Portfolios MF-AGG 30'515'528 1.18 29'267'410 31.12.2012 Investment Advisor
FULLGOAL FUND MANAGE Multiple Portfolios MF-AGG 15'484'895 0.6 3'967'932 31.12.2012 Investment Advisor
SOCIAL SECURITY FUND n/a Co File 15'000'000 0.58 - 31.12.2012 Government
ABC-CA FUND MANAGEME Multiple Portfolios MF-AGG 14'583'245 0.56 6'475'180 31.12.2012 Investment Advisor
EVERBRIGHT PRAMERICA Multiple Portfolios MF-AGG 14'368'752 0.56 13'861'924 31.12.2012 Investment Advisor
HFT INVESTMENT MANAG Multiple Portfolios MF-AGG 13'346'940 0.52 (1'387'767) 31.12.2012 Investment Advisor
GALAXY ASSET MANAGEM Multiple Portfolios MF-AGG 13'051'064 0.51 4'727'902 31.12.2012 Investment Advisor
GF FUND MANAGEMENT C Multiple Portfolios MF-AGG 12'343'678 0.48 11'782'353 31.12.2012 Investment Advisor
CHINA ASSET MANAGEME Multiple Portfolios MF-AGG 12'342'378 0.48 6'845'640 31.12.2012 Investment Advisor
HARVEST FUND MANAGEM Multiple Portfolios MF-AGG 10'947'095 0.42 (9'686'296) 31.12.2012 Investment Advisor
FIRST STATE CINDA FU Multiple Portfolios MF-AGG 9'390'803 0.36 8'547'817 31.12.2012 Government
BANK OF CHINA INVEST Multiple Portfolios MF-AGG 8'379'846 0.32 7'679'546 31.12.2012 Investment Advisor
CCB PRINCIPAL ASSET Multiple Portfolios MF-AGG 8'318'565 0.32 3'341'393 31.12.2012 Investment Advisor
YINHUA FUND MANAGEME Multiple Portfolios MF-AGG 7'561'415 0.29 7'497'554 31.12.2012 Investment Advisor
AEGON INDUSTRIAL FUN Multiple Portfolios MF-AGG 7'369'201 0.29 5'837'619 31.12.2012 Investment Advisor
Firm Name Analyst Recommendation Weighting Change Target Price Date Date
PingAn Securities DE AN WANG buy 5 M 13 6 month 29.08.2013
Sinolink Securities Co Ltd WU WENZHAO buy 5 M 13 Not Provided 19.08.2013
Everbright Securities Co., Ltd WEI FENG buy 5 M 12 12 month 17.08.2013
Capital Securities Corp HAN WEIQI strong buy 5 M 14 Not Provided 16.08.2013
Goldman Sachs YIPENG YANG not rated #N/A N/A M #N/A N/A Not Provided 14.08.2013
Northeast Securities Co Ltd LIU LIXI buy 5 M #N/A N/A Not Provided 12.07.2013
Guodu Securities Co Ltd XIAO SHIJUN buy 5 M #N/A N/A Not Provided 30.06.2013
China Minzu Securities Co Ltd CAO HE add 4 M 9 6 month 28.06.2013
EVA Dimensions CRAIG STERLING underweight 1 U #N/A N/A Not Provided 10.06.2013
Rising Securities Co.,LTD WANG LIANG outperform 5 M #N/A N/A Not Provided 22.04.2013
China International Capital Corp ZHENG DONG buy 5 M #N/A N/A Not Provided 26.03.2013
Citic Securities Co., Ltd LI CHUNBO buy 5 M 15 6 month 13.03.2013
Bank of China International WANG YUSHENG buy 5 M #N/A N/A Not Provided 14.01.2013
SWS Research Co Ltd CHANG LU outperform 5 M #N/A N/A Not Provided 29.10.2012
China Securities Co., Ltd CHEN ZHENG buy 5 M 14 Not Provided 25.06.2012
China Merchants Securities WANG LIUSHENG buy 5 M #N/A N/A Not Provided 15.06.2012
Central China Securities XU MINFENG add 4 M #N/A N/A Not Provided 19.03.2012
Great Wall Securities RAN FEI buy 5 M #N/A N/A Not Provided 30.12.2011
AJ Securities ZHANG ZHIPENG buy 5 M #N/A N/A Not Provided 22.12.2011
Hong Yuan Securities ZU GUANGPING add 4 M #N/A N/A Not Provided 28.11.2011
Industrial Securities LI GANGLING buy 5 M #N/A N/A Not Provided 25.08.2011
China Galaxy Securities LI DAN buy 5 M 9 Not Provided 08.01.2010
Holdings By:
Huayu Automotive Systems Co Ltd ee
Q.M.S Advisors | tel: +41 (0)78 922 08 77 | e-mail: [email protected] |
Page 208
09.09.2013
Zhengzhou Yutong Bus Co., Ltd. manufactures and markets medium and large size
buses.
Latest Fiscal Year: 12/2012
LTM as of: 06/yy
52-Week High (02.07.2013) 20.20
52-Week Low (16.11.2012) 11.06
Daily Volume
19.11
52-Week High % Change -5.40% Dividend Yield -
52-Week Low % Change 72.85% Beta 0.81
% 52 Week Price Range High/Low 86.88% Equity Float 836.88
Shares Out 18.07.2013 1'273.7 Short Int -
24'340.60 1 Yr Total Return 44.20%
Total Debt 1'013.23 YTD Return 39.34%
Preferred Stock 0.0 Adjusted BETA 0.810
Minority Interest 4.7 Analyst Recs 19
Cash and Equivalents 3'054.54 Consensus Rating 4.737
Enterprise Value 22'223.12
Average Volume 5 Day 10'616'600
600066 CH EQUITY YTD Change - Average Volume 30 Day 8'419'805
600066 CH EQUITY YTD % CHANGE - Average Volume 3 Month 8'568'868
LTM-4Q LTM FY+1 FY+2 FQ+1 FQ+2
31.12.2008 31.12.2009 31.12.2010 31.12.2011 31.12.2012 06/yy 06/yy 12/13 Y 12/14 Y 09/13 Q3 12/13 Q4
8'305.7 8'742.8 13'573.1 16'849.5 19'646.7 18'824.6 21'011.6 22'837.5 26'207.7 - -
0.49x 1.23x 0.87x 0.71x 0.80x 2.47x 3.21x 0.95x 0.76x - -
602.7 804.4 1'236.2 1'556.8 1'831.7 0.0 0.0 2'395.0 2'750.3 - -
6.70x 13.32x 9.60x 7.69x 8.59x 0.00x 0.00x 9.28x 8.08x - -
531.0 563.5 868.7 1'181.4 1'549.7 1'372.5 1'592.1 1'757.5 2'046.3 439.0 639.0
8.82x 18.51x 12.59x 10.42x 10.91x 9.43x 14.38x 13.81x 11.73x - -
EBITDA 1'831.73 Long-Term Rating Date -
EBIT 1'539.83 Long-Term Rating -
Operating Margin 7.84% Long-Term Outlook -
Pretax Margin 8.98% Short-Term Rating Date -
Return on Assets 11.55% Short-Term Rating -
Return on Common Equity 23.45%
Return on Capital - EBITDA/Interest Exp. 57.99
Asset Turnover 1.52% (EBITDA-Capex)/Interest Exp. -2.03
Net Debt/EBITDA -
Gross Margin 19.3% Total Debt/EBITDA -
EBITDA Margin -
EBIT Margin 7.1% Total Debt/Equity 13.9%
Net Income Margin 7.9% Total Debt/Capital 12.2%
Asset Turnover 1.52
Current Ratio 1.56 Net Fixed Asset Turnover 6.56
Quick Ratio 1.09 Accounts receivable turnover-days 67.13
Debt to Assets 7.10% Inventory Days 15.89
Tot Debt to Common Equity 13.85% Accounts Payable Turnover Day 72.98
Accounts Receivable Turnover 5.44 Cash Conversion Cycle 20.90
Inventory Turnover 22.98
Profitability S&P Issuer Ratings
Credit Ratios
Margin Analysis
Reference
Structure
Net Income
P/E
Market Capitalization
Average Daily Trading Volume
Relative Stock Price Performance
Total Revenue
TEV/Revenue
EBITDA
TEV/EBITDA
Fiscal Year Ended
Zhengzhou Yutong Bus Co LtdPrice/Volume
Valuation Analysis
14'274'885.00
Current Price (9/dd/yy) Market Data
,
2
-,
-2
.,
.2
o!-. l!-. k!-. a!-. g!-0 c!-0 j!-0 Q!-0 j!-0 g!-0 g!-0 Q!-0 o!-0', F
2', F
-,', F
-2', F
.,', F
.2', F
0,', F
02', F
0.0
5'000.0
10'000.0
15'000.0
20'000.0
25'000.0
2001 2002 2003 2004 2005 2006 2007 2008 2009 2010 2011 2012
,',,
.,',,
1,',,
3,',,
5,',,
-,,',,
-.,',,
-1,',,
-3,',,
,-',-'.,-, ,-',4'.,-, ,-',-'.,-- ,-',4'.,-- ,-',-'.,-. ,-',4'.,-. ,-',-'.,-0 ,-',4'.,-0
FReTn/CTrThoT/PolhirTlAlcST/ !Rna /eis FReTn/CTrThoT/PolhirTlAlcST/ !Rna /eis
Q.M.S Advisors | tel: +41 (0)78 922 08 77 | e-mail: [email protected] |
Page 209
09.09.2013
Holder Name Portfolio Name Source Amt Held % Out Latest Chg File Dt Inst Type
ZHENGZHOU YUTONG GRO n/a Co File 400'191'543 31.42 - 31.12.2012 Corporation
E FUND MANAGEMENT Multiple Portfolios MF-AGG 76'274'723 5.99 14'237'564 31.12.2012 Investment Advisor
BOSHI FUND MANAGEMEN Multiple Portfolios MF-AGG 40'093'294 3.15 (6'945'539) 30.06.2013 Investment Advisor
DACHENG FUND MANAGME Multiple Portfolios MF-AGG 38'496'917 3.02 5'667'460 31.12.2012 Investment Advisor
CHINA HIGHWAY VEHICL n/a Co File 29'590'128 2.32 - 31.12.2012 Corporation
ICBC CREDIT SUISSE A Multiple Portfolios MF-AGG 24'354'425 1.91 6'973'474 30.06.2013 Investment Advisor
YINHUA FUND MANAGEME Multiple Portfolios MF-AGG 22'916'128 1.8 (5'489'659) 31.12.2012 Investment Advisor
BANK OF CHINA INVEST Multiple Portfolios MF-AGG 20'868'800 1.64 9'189'465 30.06.2013 Investment Advisor
GUOTAI ASSET MANAGEM Multiple Portfolios MF-AGG 19'758'340 1.55 9'101'499 31.12.2012 Investment Advisor
GF FUND MANAGEMENT C Multiple Portfolios MF-AGG 19'396'137 1.52 6'584'066 31.12.2012 Investment Advisor
CHINA LIFE INSURANCE n/a ULT-AGG 15'315'004 1.2 - 31.12.2012 Government
UBS SDIC FUND MANAGE Multiple Portfolios MF-AGG 12'597'890 0.99 10'194'197 30.06.2013 Investment Advisor
CHINA MERCHANTS FUND Multiple Portfolios MF-AGG 12'377'106 0.97 658'472 30.06.2013 Investment Advisor
CHINA ASSET MANAGEME Multiple Portfolios MF-AGG 10'248'225 0.8 (997'307) 31.12.2012 Investment Advisor
FORTUNE SGAM FUND MA Multiple Portfolios MF-AGG 9'841'430 0.77 9'723'147 31.12.2012 Investment Advisor
HARVEST FUND MANAGEM Multiple Portfolios MF-AGG 8'812'163 0.69 (5'010'115) 31.12.2012 Investment Advisor
HUATAI-PINEBRIDGE FU Multiple Portfolios MF-AGG 8'264'000 0.65 2'607'177 31.12.2012 Investment Advisor
ORIENT FUND MANAGEME Multiple Portfolios MF-AGG 8'261'196 0.65 (11'259'885) 30.06.2013 Investment Advisor
INVESCO GREAT WALL F Multiple Portfolios MF-AGG 8'024'157 0.63 3'357'023 30.06.2013 Investment Advisor
NORGES BANK Multiple Portfolios MF-AGG 7'714'504 0.61 - 31.12.2012 Government
Firm Name Analyst Recommendation Weighting Change Target Price Date Date
Capital Securities Corp HAN WEIQI buy 5 M 21 Not Provided 03.09.2013
PingAn Securities YU BING strong buy 5 M 22 6 month 03.09.2013
Northeast Securities Co Ltd LIU LIXI buy 5 M #N/A N/A Not Provided 27.08.2013
SWS Research Co Ltd CHANG LU outperform 5 M #N/A N/A Not Provided 27.08.2013
Sinolink Securities Co Ltd WU WENZHAO buy 5 M #N/A N/A Not Provided 20.08.2013
China Investment Securities ZHANG LEI strong buy 5 M 20 12 month 19.08.2013
Everbright Securities Co., Ltd WEI FENG buy 5 M 21 12 month 17.08.2013
Guodu Securities Co Ltd XIAO SHIJUN buy 5 M #N/A N/A Not Provided 05.08.2013
Chang Jiang Securities Co. Limited LIU YUANRUI buy 5 N #N/A N/A Not Provided 11.07.2013
China Minzu Securities Co Ltd CAO HE add 4 M 23 6 month 28.06.2013
UBS TIANLONG ZOU buy 5 U 21 12 month 19.06.2013
Hong Yuan Securities HE YADONG buy 5 M 22 6 month 18.06.2013
China International Capital Corp ZHENG DONG buy 5 M #N/A N/A Not Provided 18.06.2013
EVA Dimensions TIMOTHY STANISH underweight 1 M #N/A N/A Not Provided 06.06.2013
Citic Securities Co., Ltd LI CHUNBO buy 5 M 17 6 month 26.04.2013
Guotai Junan BAI XIAOLAN buy 5 M 17 12 month 26.03.2013
HuaChuang Securities WANG YANXUE strong buy 5 M #N/A N/A Not Provided 03.02.2013
Bank of China International ERIC HU buy 5 M 17 12 month 22.01.2013
Great Wall Securities RAN FEI buy 5 M 16 6 month 03.11.2012
China Merchants Securities WANG LIUSHENG strong buy 5 M #N/A N/A Not Provided 20.07.2012
Industrial Securities LI GANGLING strong buy 5 M #N/A N/A Not Provided 14.04.2012
AJ Securities ZHANG ZHIPENG strong buy 5 M 12 6 month 08.02.2012
Central China Securities XU MINFENG add 4 M #N/A N/A Not Provided 17.12.2010
China Securities Co., Ltd CHEN ZHENG buy 5 U 14 Not Provided 08.12.2010
Holdings By:
Zhengzhou Yutong Bus Co Ltd ee
Q.M.S Advisors | tel: +41 (0)78 922 08 77 | e-mail: [email protected] |
Page 210
09.09.2013
China COSCO Holdings Company Ltd. offers marine freight transportation
services. The Company offers container shipping, dry bulk shipping, logistics
services, freight forwarding, and terminal and container leasing services
internationally. China COSCO operates container ships and terminals, and
manufactures shipping containers.
Latest Fiscal Year: 12/2011
LTM as of: 06/yy
52-Week High (07.01.2013) 4.66
52-Week Low (30.07.2013) 2.68
Daily Volume
3.45
52-Week High % Change -25.97% Dividend Yield 0.00
52-Week Low % Change 28.73% Beta 1.11
% 52 Week Price Range High/Low 30.81% Equity Float 1'915.66
Shares Out 30.06.2013 7'635.7 Short Int -
34'490.57 1 Yr Total Return -17.27%
Total Debt 94'631.46 YTD Return -21.77%
Preferred Stock 0.0 Adjusted BETA 1.106
Minority Interest 16'560.6 Analyst Recs 10
Cash and Equivalents 46'336.79 Consensus Rating 2.900
Enterprise Value 98'344.39
Average Volume 5 Day 20'985'140
601919 CH EQUITY YTD Change - Average Volume 30 Day 13'868'200
601919 CH EQUITY YTD % CHANGE - Average Volume 3 Month 11'786'940
LTM-4Q LTM FY+1 FY+2 FQ+1 FQ+2
31.12.2008 31.12.2009 31.12.2010 31.12.2011 31.12.2012 06/yy 06/yy 12/13 Y 12/14 Y 03/13 Q1 06/13 Q2
131'838.9 55'211.7 96'487.6 84'639.2 88'329.1 68'869.3 67'342.2 72'391.0 79'576.1 15'824.0 18'772.0
0.56x 2.80x 1.24x 1.07x 1.20x 4.63x 5.69x 1.44x 1.32x - -
21'072.8 (3'783.8) 9'955.8 (8'724.7) (3'886.4) 0.0 0.0 1'381.8 6'292.0 - -
3.53x - 11.97x - - 0.00x 0.00x 71.17x 15.63x - -
11'606.1 (7'539.8) 6'785.5 (10'495.3) (9'559.2) (12'609.8) (5'677.6) (682.3) (1'043.0) (1'804.0) 289.0
4.18x - 10.52x - - 0.00x 0.00x - - - -
EBITDA -3'886.40 Long-Term Rating Date -
EBIT -7'713.79 Long-Term Rating -
Operating Margin -8.73% Long-Term Outlook -
Pretax Margin -8.37% Short-Term Rating Date -
Return on Assets -3.49% Short-Term Rating -
Return on Common Equity -21.25%
Return on Capital - EBITDA/Interest Exp. -1.55
Asset Turnover 0.47% (EBITDA-Capex)/Interest Exp. -6.10
Net Debt/EBITDA -
Gross Margin -2.5% Total Debt/EBITDA -37.22
EBITDA Margin -3.6%
EBIT Margin -8.8% Total Debt/Equity 376.5%
Net Income Margin -10.8% Total Debt/Capital 69.4%
Asset Turnover 0.47
Current Ratio 1.56 Net Fixed Asset Turnover 0.94
Quick Ratio 1.37 Accounts receivable turnover-days 35.33
Debt to Assets 57.28% Inventory Days 16.43
Tot Debt to Common Equity 376.46% Accounts Payable Turnover Day 50.63
Accounts Receivable Turnover 10.33 Cash Conversion Cycle 12.63
Inventory Turnover 22.21
Fiscal Year Ended
China COSCO Holdings Co LtdPrice/Volume
Valuation Analysis
26'866'626.00
Current Price (9/dd/yy) Market Data
Net Income
P/E
Market Capitalization
Average Daily Trading Volume
Relative Stock Price Performance
Total Revenue
TEV/Revenue
EBITDA
TEV/EBITDA
Profitability S&P Issuer Ratings
Credit Ratios
Margin Analysis
Reference
Structure
,--..001122
o!-. l!-. k!-. a!-. g!-0 c!-0 j!-0 Q!-0 j!-0 g!-0 g!-0 Q!-0 o!-0', F
-,', F
.,', F
0,', F
1,', F
2,', F
3,', F
4,', F
5,', F
0.0
20'000.0
40'000.0
60'000.0
80'000.0
100'000.0
120'000.0
140'000.0
2001 2002 2003 2004 2005 2006 2007 2008 2009 2010 2011 2012,',,
,'.,
,'1,
,'3,
,'5,
-',,
-'.,
FReTn/CTrThoT/PolhirTlAlcST/ !Rna /eis FReTn/CTrThoT/PolhirTlAlcST/ !Rna /eis
Q.M.S Advisors | tel: +41 (0)78 922 08 77 | e-mail: [email protected] |
Page 211
09.09.2013
Holder Name Portfolio Name Source Amt Held % Out Latest Chg File Dt Inst Type
CHINA OCEAN SHIPPING n/a Co File 5'313'082'844 69.58 - 31.12.2010 Government
SOCIAL SECURITY FUND n/a Co File 178'386'745 2.34 - 31.12.2010 Government
CHINA SOUTHERN FUND Multiple Portfolios MF-AGG 99'169'055 1.3 13'008'086 31.12.2012 Investment Advisor
CHINA NATIONAL NUCLE n/a Co File 72'000'000 0.94 - 31.12.2010 Government
SINOCHEM CORP n/a Co File 40'000'000 0.52 - 31.12.2010 Government
CHINA AEROSPACE SCIE n/a ULT-AGG 40'000'000 0.52 - 31.12.2009 Government
CHINA MINMETALS CORP n/a ULT-AGG 31'000'000 0.41 - 31.12.2010 Government
CHINA ENERGY CONSERV n/a Co File 23'500'000 0.31 - 31.12.2010 Corporation
AEROSPACE SCI & TECH n/a Co File 22'044'941 0.29 - 31.12.2010 Government
BEIJING CAPITAL INVE n/a Co File 20'000'000 0.26 - 31.12.2010 Investment Advisor
CAISSE DE DEPOT ET P Multiple Portfolios MF-AGG 6'504'895 0.09 - 31.12.2012 Investment Advisor
TIANTONG ASSET MANAG Multiple Portfolios MF-AGG 3'291'479 0.04 (1'378'782) 31.12.2012 Investment Advisor
CHINA ASSET MANAGEME Multiple Portfolios MF-AGG 3'201'807 0.04 (2'064'351) 31.12.2012 Investment Advisor
HARVEST FUND MANAGEM Multiple Portfolios MF-AGG 2'881'824 0.04 (11'629'599) 31.12.2012 Investment Advisor
GUOTAI ASSET MANAGEM Multiple Portfolios MF-AGG 2'578'987 0.03 280'800 31.12.2012 Investment Advisor
LION FUND MANAGEMENT Multiple Portfolios MF-AGG 2'397'029 0.03 (148'432) 31.12.2012 Investment Advisor
CHINA UNIVERSAL ASSE Multiple Portfolios MF-AGG 2'068'038 0.03 (68'790) 31.12.2012 Investment Advisor
GF FUND MANAGEMENT C Multiple Portfolios MF-AGG 1'263'636 0.02 19'205 31.12.2012 Investment Advisor
PENGHUA FUND MANAGEM Multiple Portfolios MF-AGG 412'464 0.01 (357'368) 31.12.2012 Investment Advisor
AEGON INDUSTRIAL FUN Multiple Portfolios MF-AGG 390'000 0.01 (82'155) 31.12.2012 Investment Advisor
Firm Name Analyst Recommendation Weighting Change Target Price Date Date
Chang Jiang Securities Co. Limited HAN YICHAO neutral 3 M #N/A N/A Not Provided 01.09.2013
Capital Securities Corp TEAM COVERAGE neutral 3 M #N/A N/A Not Provided 30.08.2013
China International Capital Corp NIE DIZHONG accumulate 4 U #N/A N/A Not Provided 30.08.2013
SWS Research Co Ltd AMOS ZHANG outperform 5 M #N/A N/A Not Provided 30.08.2013
Jefferies JOHNSON LEUNG underperform 1 M 3 12 month 08.07.2013
UBS JEAN RAO sell 1 M 3 12 month 19.04.2013
Goldman Sachs RONALD KEUNG Sell/Neutral 1 M 3 12 month 01.04.2013
Sinolink Securities Co Ltd HUANG JINXIANG neutral 3 M #N/A N/A Not Provided 29.03.2013
Masterlink Securities SARAH WANG hold 3 M 5 Not Provided 23.01.2013
Rising Securities Co.,LTD XUE MINGJIE outperform 5 M #N/A N/A Not Provided 21.11.2012
China Securities Co., Ltd LI LEI add 4 M 6 Not Provided 25.06.2012
China Merchants Securities TAO CHANG buy 5 M #N/A N/A Not Provided 10.06.2012
Industrial Securities YUNTAO JI neutral 3 M #N/A N/A Not Provided 26.04.2012
Bank of China International DU JIANPING hold 3 M 5 Not Provided 30.03.2012
PingAn Securities CHU HAI strong buy 5 M #N/A N/A Not Provided 11.03.2012
Citic Securities Co., Ltd ZHANG HONGBO hold 3 M #N/A N/A Not Provided 27.02.2012
HuaChuang Securities GAO LI neutral 3 D #N/A N/A Not Provided 27.06.2011
China Investment Securities SUN MIN strong buy 5 U #N/A N/A Not Provided 07.04.2011
China Galaxy Securities MAO ANG speculative buy 4 U #N/A N/A Not Provided 26.11.2009
Northeast Securities Co Ltd XIANG XU neutral 3 M #N/A N/A Not Provided 30.10.2009
Holdings By:
China COSCO Holdings Co Ltd ee
Q.M.S Advisors | tel: +41 (0)78 922 08 77 | e-mail: [email protected] |
Page 212
09.09.2013
Henan Dayou Energy Co., Ltd. designs and develops computer software. The main
products are customized and integrated software for the communication industry.
The Company also sells networking equipment.
Latest Fiscal Year: 12/2012
LTM as of: 06/yy
52-Week High (22.01.2013) 12.86
52-Week Low (30.07.2013) 7.25
Daily Volume
9.75
52-Week High % Change -24.15% Dividend Yield -
52-Week Low % Change 34.48% Beta 1.36
% 52 Week Price Range High/Low 38.89% Equity Float 508.58
Shares Out 30.06.2013 2'390.8 Short Int -
23'310.42 1 Yr Total Return -5.56%
Total Debt 1'843.40 YTD Return -3.50%
Preferred Stock 0.0 Adjusted BETA 1.365
Minority Interest 303.6 Analyst Recs 10
Cash and Equivalents 4'735.90 Consensus Rating 4.400
Enterprise Value 21'525.05
Average Volume 5 Day 4'100'291
600403 CH EQUITY YTD Change - Average Volume 30 Day 9'674'145
600403 CH EQUITY YTD % CHANGE - Average Volume 3 Month 7'833'910
LTM-4Q LTM FY+1 FY+2 FQ+1 FQ+2
31.12.2008 31.12.2009 31.12.2010 31.12.2011 31.12.2012 06/yy 06/yy 12/13 Y 12/14 Y 09/13 Q3 12/13 Q4
294.6 311.2 8'576.0 12'024.3 12'560.4 13'233.8 13'213.1 14'198.2 15'113.2 - -
1.36x 4.45x 0.60x 1.68x 1.75x 6.23x 6.13x - - - -
48.3 58.1 2'856.1 3'954.2 2'922.5 0.0 0.0 - - - -
8.27x 23.81x 1.80x 5.10x 7.54x 0.00x 0.00x - - - -
13.0 21.9 1'180.9 2'539.5 1'788.6 2'749.2 1'905.9 1'882.3 2'003.8 - -
48.13x 75.49x 3.66x 8.01x 10.29x 6.24x 9.43x 12.16x 11.57x - -
EBITDA 2'922.50 Long-Term Rating Date -
EBIT 2'395.43 Long-Term Rating -
Operating Margin 19.07% Long-Term Outlook -
Pretax Margin 19.13% Short-Term Rating Date -
Return on Assets 14.24% Short-Term Rating -
Return on Common Equity 24.26%
Return on Capital - EBITDA/Interest Exp. 26.94
Asset Turnover 0.99% (EBITDA-Capex)/Interest Exp. 14.73
Net Debt/EBITDA -
Gross Margin 31.5% Total Debt/EBITDA -
EBITDA Margin -
EBIT Margin 18.1% Total Debt/Equity 18.4%
Net Income Margin 14.2% Total Debt/Capital 15.2%
Asset Turnover 0.99
Current Ratio 1.55 Net Fixed Asset Turnover 2.13
Quick Ratio 1.40 Accounts receivable turnover-days 61.29
Debt to Assets 11.14% Inventory Days 18.05
Tot Debt to Common Equity 18.42% Accounts Payable Turnover Day 54.47
Accounts Receivable Turnover 5.96 Cash Conversion Cycle 4.09
Inventory Turnover 20.22
Profitability S&P Issuer Ratings
Credit Ratios
Margin Analysis
Reference
Structure
Net Income
P/E
Market Capitalization
Average Daily Trading Volume
Relative Stock Price Performance
Total Revenue
TEV/Revenue
EBITDA
TEV/EBITDA
Fiscal Year Ended
Henan Dayou Energy Co LtdPrice/Volume
Valuation Analysis
6'415'174.00
Current Price (9/dd/yy) Market Data
,
.
1
3
5
-,
-.
-1
o!-. l!-. k!-. a!-. g!-0 c!-0 j!-0 Q!-0 j!-0 g!-0 g!-0 Q!-0 o!-0', F
2', F
-,', F
-2', F
.,', F
.2', F
0,', F
0.0
2'000.0
4'000.0
6'000.0
8'000.0
10'000.0
12'000.0
14'000.0
2001 2002 2003 2004 2005 2006 2007 2008 2009 2010 2011 2012
,',,
-,',,
.,',,
0,',,
1,',,
2,',,
3,',,
4,',,
5,',,
6,',,
,-',-'.,-, ,-',4'.,-, ,-',-'.,-- ,-',4'.,-- ,-',-'.,-. ,-',4'.,-. ,-',-'.,-0 ,-',4'.,-0
FReTn/CTrThoT/PolhirTlAlcST/ !Rna /eis FReTn/CTrThoT/PolhirTlAlcST/ !Rna /eis
Q.M.S Advisors | tel: +41 (0)78 922 08 77 | e-mail: [email protected] |
Page 213
09.09.2013
Holder Name Portfolio Name Source Amt Held % Out Latest Chg File Dt Inst Type
YIMA COAL GROUP CO L n/a Co File 1'412'383'126 59.08 - 31.12.2012 Corporation
CHINA ASSETS MANAGEM n/a Co File 115'160'000 4.82 - 31.12.2012 Corporation
CQ XINFEI ASSET MGMT n/a Co File 114'000'000 4.77 - 31.12.2012 Other
CHINA CINDA ASSET MA n/a Co File 95'969'288 4.01 - 31.12.2012 Government
CHINA UNIVERSAL ASSE n/a Co File 95'960'000 4.01 - 31.12.2012 Investment Advisor
YINGDA FUND CO n/a Co File 95'960'000 4.01 - 31.12.2012 Other
SZ PINGAN VEN CAP n/a Co File 95'800'000 4.01 - 31.12.2012 n/a
HUIXIANG TIANYUAN IN n/a Co File 70'663'188 2.96 - 31.12.2012 Other
SH FUXIN COMMUNIC TE n/a Co File 51'851'172 2.17 - 31.12.2012 Corporation
HUAAN FUND CO n/a Co File 40'000'000 1.67 - 31.12.2012 Other
NANJING BEIHAO TECHN n/a EXCH 24'140'000 1.01 - 14.09.2012 Investment Advisor
ZHONGGUANG CABLE NET n/a EXCH 12'627'784 0.53 - 14.09.2012 Government
SOOCHOW ASSET MANAGE SOOCHOW HANGYE LUNDO MF-PART 10'209'260 0.43 10'209'260 30.06.2013 Investment Advisor
ICBC CS STABLE GROWT n/a EXCH 9'870'272 0.41 - 14.09.2012 n/a
CHINA UNIVERSAL BALA n/a EXCH 8'142'650 0.34 - 14.09.2012 n/a
ICBC CS DIVIDEND FD n/a EXCH 7'560'000 0.32 - 14.09.2012 n/a
CHINA UNIVERSAL SOCI n/a EXCH 6'101'770 0.26 - 14.09.2012 n/a
ICBC CREDIT SUISSE A Multiple Portfolios MF-AGG 5'066'600 0.21 (10'826'824) 31.12.2012 Investment Advisor
YUNSHAN MA n/a EXCH 4'800'000 0.2 - 14.09.2012 n/a
FULLGOAL FUND MANAGE Multiple Portfolios MF-AGG 3'699'504 0.15 3'559'498 31.12.2012 Investment Advisor
Firm Name Analyst Recommendation Weighting Change Target Price Date Date
GF Securities Co. Ltd. AN PENG buy 5 N #N/A N/A Not Provided 03.09.2013
Everbright Securities Co., Ltd CHEN HAOWU buy 5 M 13 12 month 17.08.2013
Northeast Securities Co Ltd WANG SHI add 4 M #N/A N/A Not Provided 12.08.2013
EVA Dimensions DOUG WALTERS hold 3 D #N/A N/A Not Provided 12.08.2013
Chang Jiang Securities Co. Limited JUN GE add 4 N #N/A N/A Not Provided 08.08.2013
China Investment Securities ZHANG LEI strong buy 5 M #N/A N/A Not Provided 14.07.2013
Qilu Securities Co Ltd ZHAOLIANG LIU hold 3 D #N/A N/A Not Provided 01.07.2013
Hong Yuan Securities WANG JINGLE buy 5 M 13 6 month 16.04.2013
Guodu Securities Co Ltd WANG SHUBAO buy 5 M #N/A N/A Not Provided 09.04.2013
Great Wall Securities LIU FEI strong buy 5 M 18 6 month 30.10.2012
HuaChuang Securities HAN ZHENGUO buy 5 D #N/A N/A Not Provided 03.09.2012
AJ Securities WANG SIWEI neutral 3 D #N/A N/A Not Provided 28.06.2012
PingAn Securities SHUN ZHANG strong buy 5 M 16 Not Provided 10.04.2012
China Merchants Securities LU PING strong buy 5 M 18 Not Provided 21.02.2012
Industrial Securities LIU JIANGANG buy 5 D #N/A N/A Not Provided 10.02.2012
Holdings By:
Henan Dayou Energy Co Ltd ee
Q.M.S Advisors | tel: +41 (0)78 922 08 77 | e-mail: [email protected] |
Page 214
09.09.2013
Southwest Securities Co., Ltd. operates in the brokerage, investment banking,
asset management and the consulting services business.
Latest Fiscal Year: 12/2012
LTM as of: 06/yy
52-Week High (05.02.2013) 10.60
52-Week Low (30.11.2012) 7.02
Daily Volume
10.15
52-Week High % Change -4.25% Dividend Yield -
52-Week Low % Change 44.59% Beta 1.51
% 52 Week Price Range High/Low 74.30% Equity Float 415.54
Shares Out 17.07.2013 2'322.6 Short Int -
23'573.93 1 Yr Total Return 12.49%
Total Debt 1'569.81 YTD Return 14.88%
Preferred Stock 0.0 Adjusted BETA 1.512
Minority Interest - Analyst Recs 6
Cash and Equivalents 5'616.37 Consensus Rating 4.167
Enterprise Value 23'335.26
Average Volume 5 Day 18'218'040
600369 CH EQUITY YTD Change - Average Volume 30 Day 16'402'540
600369 CH EQUITY YTD % CHANGE - Average Volume 3 Month 14'627'640
LTM-4Q LTM FY+1 FY+2 FQ+1 FQ+2
31.12.2008 31.12.2009 31.12.2010 31.12.2011 31.12.2012 06/yy 06/yy 12/13 Y 12/14 Y 09/13 Q3 12/13 Q4
- 2'210.5 2'155.5 1'264.8 1'604.0 1'279.5 1'756.2 1'695.7 2'008.7 - -
- 11.75x 8.18x 11.96x 10.41x 54.28x 39.32x - - - -
- 1'406.2 1'240.4 416.4 623.0 0.0 214.7 - - - -
- 18.48x 14.22x 36.31x 26.80x 0.00x 0.00x - - - -
- 1'007.2 805.3 262.7 342.4 210.0 364.4 556.7 695.7 - -
- 35.17x 29.82x 78.45x 59.53x 127.36x 46.80x 43.94x 35.74x - -
EBITDA 622.95 Long-Term Rating Date -
EBIT - Long-Term Rating -
Operating Margin 32.41% Long-Term Outlook -
Pretax Margin 24.01% Short-Term Rating Date -
Return on Assets 1.93% Short-Term Rating -
Return on Common Equity 3.50%
Return on Capital 2.76% EBITDA/Interest Exp. -
Asset Turnover 0.09% (EBITDA-Capex)/Interest Exp. -
Net Debt/EBITDA -
Gross Margin - Total Debt/EBITDA -
EBITDA Margin -
EBIT Margin - Total Debt/Equity 15.1%
Net Income Margin 21.3% Total Debt/Capital 13.1%
Asset Turnover 0.09
Current Ratio - Net Fixed Asset Turnover 4.00
Quick Ratio - Accounts receivable turnover-days -
Debt to Assets 9.10% Inventory Days -
Tot Debt to Common Equity 15.09% Accounts Payable Turnover Day -
Accounts Receivable Turnover - Cash Conversion Cycle -
Inventory Turnover -
Fiscal Year Ended
Southwest Securities Co LtdPrice/Volume
Valuation Analysis
36'641'250.00
Current Price (9/dd/yy) Market Data
Net Income
P/E
Market Capitalization
Average Daily Trading Volume
Relative Stock Price Performance
Total Revenue
TEV/Revenue
EBITDA
TEV/EBITDA
Profitability S&P Issuer Ratings
Credit Ratios
Margin Analysis
Reference
Structure
,
.
1
3
5
-,
-.
o!-. l!-. k!-. a!-. g!-0 c!-0 j!-0 Q!-0 j!-0 g!-0 g!-0 Q!-0 o!-0', F
-,', F
.,', F
0,', F
1,', F
2,', F
3,', F
0.0
500.0
1'000.0
1'500.0
2'000.0
2'500.0
1999 2000 2001 2002 2003 2004 2005 2006 2007 2008 2009 2010 2011 2012
,',,
-,,',,
.,,',,
0,,',,
1,,',,
2,,',,
3,,',,
4,,',,
5,,',,
,-',-'.,-, ,-',4'.,-, ,-',-'.,-- ,-',4'.,-- ,-',-'.,-. ,-',4'.,-. ,-',-'.,-0 ,-',4'.,-0
FReTn/CTrThoT/PolhirTlAlcST/ !Rna /eis FReTn/CTrThoT/PolhirTlAlcST/ !Rna /eis
Q.M.S Advisors | tel: +41 (0)78 922 08 77 | e-mail: [email protected] |
Page 215
09.09.2013
Holder Name Portfolio Name Source Amt Held % Out Latest Chg File Dt Inst Type
CHONGQING YUFU ASSET n/a Co File 939'536'796 40.45 - 31.12.2011 Investment Advisor
CHINA CONSTRUCTION I n/a EXCH 164'213'506 7.07 - 22.05.2012 Government
CHONGQING GUOXIN INV n/a Co File 161'084'587 6.94 - 31.12.2011 Corporation
CHONGQING CITY CONST n/a Co File 114'685'600 4.94 - 31.12.2011 Private Equity
CQ JIANGBEIZUI CBD D n/a Co File 100'000'000 4.31 - 31.12.2011 Government
CQ GUOCHUANG INVEST n/a Co File 88'000'000 3.79 - 31.12.2011 Government
CQ WATER CONSER INVE n/a Co File 59'350'000 2.56 - 31.12.2011 Government
CQ EXPRESSWAY GRP n/a Co File 50'000'000 2.15 - 31.12.2011 Government
CHONGQING WATERWORKS n/a Co File 49'683'351 2.14 - 31.12.2011 Government
HAINAN ZHUJIANG HLDG n/a Co File 33'250'000 1.43 - 31.12.2011 Corporation
CHANGZHOU DAYA INVS n/a EXCH 28'399'999 1.22 - 20.08.2010 Other
CHONGQING FULING ASS n/a EXCH 26'972'900 1.16 - 20.08.2010 Government
CHONGQING BREWERY GR n/a EXCH 26'308'695 1.13 - 20.08.2010 Government
CHONGQING CHANGJIANG n/a EXCH 24'537'245 1.06 - 20.08.2010 Corporation
YUNNAN METALLURGICAL n/a EXCH 22'294'000 0.96 - 20.08.2010 Corporation
YUNNAN METROPOLITAN n/a EXCH 18'700'000 0.81 - 30.08.2010 Government
WENZHOU XINCHEN INVS n/a EXCH 14'027'472 0.6 - 13.02.2009 Investment Advisor
GF FUND MANAGEMENT C Multiple Portfolios MF-AGG 12'729'573 0.55 (600'687) 31.12.2012 Investment Advisor
HARVEST FUND MANAGEM Multiple Portfolios MF-AGG 9'230'223 0.4 (6'100'952) 31.12.2012 Investment Advisor
HUATAI-PINEBRIDGE FU Multiple Portfolios MF-AGG 5'356'720 0.23 (11'836) 31.12.2012 Investment Advisor
Firm Name Analyst Recommendation Weighting Change Target Price Date Date
Chang Jiang Securities Co. Limited LIU JUN buy 5 M #N/A N/A Not Provided 02.09.2013
Sinolink Securities Co Ltd WANG KUN add 4 M #N/A N/A Not Provided 27.08.2013
China International Capital Corp JIE HUANG hold 3 U #N/A N/A Not Provided 27.08.2013
Guotai Junan ZHAO XIANGHUAI buy 5 U 11 12 month 27.08.2013
Everbright Securities Co., Ltd ZIPEI TANG accumulate 4 M 10 12 month 06.08.2013
China Minzu Securities Co Ltd SONG JIAN add 4 M 13 6 month 23.07.2013
Northeast Securities Co Ltd XINAN ZHAO add 4 M #N/A N/A Not Provided 30.06.2012
Industrial Securities ZHANG YING buy 5 M #N/A N/A Not Provided 20.03.2012
Hong Yuan Securities HUANG LIJUN add 4 M #N/A N/A Not Provided 05.12.2011
Central China Securities XIE PEIJIE add 4 M #N/A N/A Not Provided 12.10.2011
PingAn Securities LIU YINGHUA neutral 3 N #N/A N/A Not Provided 31.08.2010
Guodu Securities Co Ltd DENG TING neutral 3 M 18 6 month 16.07.2010
China Investment Securities CHEN JIANTAO neutral 3 M #N/A N/A Not Provided 30.04.2010
Holdings By:
Southwest Securities Co Ltd ee
Q.M.S Advisors | tel: +41 (0)78 922 08 77 | e-mail: [email protected] |
Page 216
09.09.2013
Sichuan Chuantou Energy Co., Ltd. invests in electric power projects through its
subsidiaries, the Company also develops and manufactures cable, railroad control
systems and other automation equipment.
Latest Fiscal Year: 12/2012
LTM as of: 06/yy
52-Week High (16.08.2013) 12.65
52-Week Low (24.09.2012) 6.41
Daily Volume
11.55
52-Week High % Change -8.70% Dividend Yield -
52-Week Low % Change 80.19% Beta 1.03
% 52 Week Price Range High/Low 80.61% Equity Float 824.45
Shares Out 30.06.2013 1'972.7 Short Int -
22'784.54 1 Yr Total Return 67.62%
Total Debt 6'506.78 YTD Return 38.95%
Preferred Stock 0.0 Adjusted BETA 1.029
Minority Interest 329.6 Analyst Recs 8
Cash and Equivalents 458.92 Consensus Rating 4.875
Enterprise Value 28'789.99
Average Volume 5 Day 8'392'789
600674 CH EQUITY YTD Change - Average Volume 30 Day 9'288'995
600674 CH EQUITY YTD % CHANGE - Average Volume 3 Month 10'216'610
LTM-4Q LTM FY+1 FY+2 FQ+1 FQ+2
31.12.2008 31.12.2009 31.12.2010 31.12.2011 31.12.2012 06/yy 06/yy 12/13 Y 12/14 Y 09/13 Q3 12/13 Q4
516.1 897.1 1'085.3 1'139.0 1'124.9 1'134.9 6'866.4 1'186.3 1'219.0 - -
25.60x 21.56x 16.40x 14.83x 20.33x 62.86x 9.80x - - - -
204.4 509.7 669.9 679.9 668.6 0.0 0.0 - - - -
64.65x 37.95x 26.57x 24.84x 34.21x 0.00x 0.00x - - - -
358.7 171.7 340.5 349.8 410.4 303.0 591.1 1'114.7 1'881.3 - -
26.02x 61.39x 40.38x 29.87x 39.36x 39.30x 29.71x 20.44x 11.79x - -
EBITDA 668.56 Long-Term Rating Date -
EBIT 414.80 Long-Term Rating -
Operating Margin 36.88% Long-Term Outlook -
Pretax Margin 43.14% Short-Term Rating Date -
Return on Assets 6.00% Short-Term Rating -
Return on Common Equity 10.98%
Return on Capital - EBITDA/Interest Exp. 2.14
Asset Turnover 0.07% (EBITDA-Capex)/Interest Exp. 1.93
Net Debt/EBITDA -
Gross Margin 47.1% Total Debt/EBITDA -
EBITDA Margin -
EBIT Margin 39.8% Total Debt/Equity 76.6%
Net Income Margin 36.5% Total Debt/Capital 42.4%
Asset Turnover 0.07
Current Ratio 0.62 Net Fixed Asset Turnover 0.27
Quick Ratio 0.56 Accounts receivable turnover-days 109.09
Debt to Assets 41.44% Inventory Days 35.04
Tot Debt to Common Equity 76.55% Accounts Payable Turnover Day 72.42
Accounts Receivable Turnover 3.35 Cash Conversion Cycle 57.13
Inventory Turnover 10.42
Profitability S&P Issuer Ratings
Credit Ratios
Margin Analysis
Reference
Structure
Net Income
P/E
Market Capitalization
Average Daily Trading Volume
Relative Stock Price Performance
Total Revenue
TEV/Revenue
EBITDA
TEV/EBITDA
Fiscal Year Ended
Sichuan Chuantou Energy Co LtdPrice/Volume
Valuation Analysis
9'738'536.00
Current Price (9/dd/yy) Market Data
,
.
1
3
5
-,
-.
-1
o!-. l!-. k!-. a!-. g!-0 c!-0 j!-0 Q!-0 j!-0 g!-0 g!-0 Q!-0 o!-0', F2', F-,', F-2', F.,', F.2', F0,', F02', F1,', F12', F2,', F
0.0
200.0
400.0
600.0
800.0
1'000.0
1'200.0
2001 2002 2003 2004 2005 2006 2007 2008 2009 2010 2011 2012
,',,
2',,
-,',,
-2',,
.,',,
.2',,
0,',,
02',,
1,',,
,-',-'.,-, ,-',4'.,-, ,-',-'.,-- ,-',4'.,-- ,-',-'.,-. ,-',4'.,-. ,-',-'.,-0 ,-',4'.,-0
FReTn/CTrThoT/PolhirTlAlcST/ !Rna /eis FReTn/CTrThoT/PolhirTlAlcST/ !Rna /eis
Q.M.S Advisors | tel: +41 (0)78 922 08 77 | e-mail: [email protected] |
Page 217
09.09.2013
Holder Name Portfolio Name Source Amt Held % Out Latest Chg File Dt Inst Type
SICHUAN PROV INVEST n/a Co File 1'087'397'021 55.12 - 31.12.2012 Government
HAITONG SECURITIES C n/a Co File 55'500'000 2.81 - 31.12.2012 Investment Advisor
BOSHI FUND MANAGEMEN Multiple Portfolios MF-AGG 35'759'328 1.81 12'479'784 30.06.2013 Investment Advisor
LA COMPAGNIE FINANCI n/a Co File 30'000'000 1.52 - 31.12.2012 Holding Company
INVESCO GREAT WALL F Multiple Portfolios MF-AGG 22'302'756 1.13 22'021'015 31.12.2012 Investment Advisor
BJ YUANTONG XINHAI T n/a Co File 20'625'361 1.05 - 31.12.2012 Corporation
BEIJING DADI YUANTON n/a Co File 20'385'527 1.03 - 31.12.2012 Corporation
EMEI FERROALLOY COMP n/a Co File 19'830'519 1.01 - 31.12.2012 Government
CHINA POST & CAPITAL Multiple Portfolios MF-AGG 18'800'000 0.95 (13'799'376) 31.12.2012 Investment Advisor
GREAT WALL SECURITIE n/a Co File 15'108'301 0.77 - 31.12.2012 Investment Advisor
BOSERA FUND MANAGEME Multiple Portfolios MF-AGG 13'648'919 0.69 13'648'919 31.12.2012 Investment Advisor
HARVEST FUND MANAGEM Multiple Portfolios MF-AGG 10'839'492 0.55 (2'181'817) 31.12.2012 Investment Advisor
E FUND MANAGEMENT Multiple Portfolios MF-AGG 8'400'283 0.43 6'205'507 31.12.2012 Investment Advisor
EVERBRIGHT PRAMERICA Multiple Portfolios MF-AGG 5'779'478 0.29 129'504 31.12.2012 Investment Advisor
HUATAI-PINEBRIDGE FU Multiple Portfolios MF-AGG 4'540'307 0.23 (9'282) 31.12.2012 Investment Advisor
CHINA ASSET MANAGEME Multiple Portfolios MF-AGG 4'484'136 0.23 (1'680'744) 31.12.2012 Investment Advisor
HUAAN FUND MANAGEMEN Multiple Portfolios MF-AGG 3'301'400 0.17 (201'155) 31.12.2012 Investment Advisor
CCB PRINCIPAL ASSET Multiple Portfolios MF-AGG 2'127'481 0.11 1'542'276 31.12.2012 Investment Advisor
CHINA ASSET MANAGEME Multiple Portfolios MF-AGG 1'907'062 0.1 - 02.09.2013 Investment Advisor
CHINA UNIVERSAL ASSE Multiple Portfolios MF-AGG 1'831'931 0.09 (456'111) 02.09.2013 Investment Advisor
Firm Name Analyst Recommendation Weighting Change Target Price Date Date
China International Capital Corp JUNHUA CHEN accumulate 4 M #N/A N/A Not Provided 28.08.2013
Everbright Securities Co., Ltd JUNPENG CHEN buy 5 M 12 12 month 18.08.2013
SWS Research Co Ltd EVAN LIANG outperform 5 M #N/A N/A Not Provided 18.07.2013
Rising Securities Co.,LTD DAI LIPING outperform 5 M #N/A N/A Not Provided 23.04.2013
UBS WEI YU restricted #N/A N/A M #N/A N/A Not Provided 03.04.2013
Hong Yuan Securities LU RUMIN buy 5 M 12 6 month 15.01.2013
Citic Securities Co., Ltd WU FEI buy 5 M #N/A N/A Not Provided 15.01.2013
Guodu Securities Co Ltd WANG SHUBAO strong buy 5 M #N/A N/A Not Provided 26.12.2012
Great Wall Securities GUI FANGXIAO strong buy 5 M #N/A N/A Not Provided 26.10.2012
China Merchants Securities PENG QUANGANG buy 5 M #N/A N/A Not Provided 29.03.2012
China Minzu Securities Co Ltd CAIXIA FU add 4 N #N/A N/A Not Provided 05.11.2010
Holdings By:
Sichuan Chuantou Energy Co Ltd ee
Q.M.S Advisors | tel: +41 (0)78 922 08 77 | e-mail: [email protected] |
Page 218
09.09.2013
China Eastern Airlines Corporation Limited provides passenger and cargo airline
services.
Latest Fiscal Year: 12/2012
LTM as of: 06/yy
52-Week High (05.02.2013) 3.79
52-Week Low (29.07.2013) 2.31
Daily Volume
3.04
52-Week High % Change -19.79% Dividend Yield -
52-Week Low % Change 31.60% Beta 1.10
% 52 Week Price Range High/Low 35.14% Equity Float 1'097.83
Shares Out 30.06.2013 8'481.1 Short Int -
34'056.72 1 Yr Total Return -7.60%
Total Debt 67'594.10 YTD Return -13.39%
Preferred Stock 0.0 Adjusted BETA 1.099
Minority Interest 1'627.6 Analyst Recs 13
Cash and Equivalents 2'511.70 Consensus Rating 3.692
Enterprise Value 99'689.70
Average Volume 5 Day 45'482'680
600115 CH EQUITY YTD Change - Average Volume 30 Day 35'312'490
600115 CH EQUITY YTD % CHANGE - Average Volume 3 Month 22'566'800
LTM-4Q LTM FY+1 FY+2 FQ+1 FQ+2
31.12.2008 31.12.2009 31.12.2010 31.12.2011 31.12.2012 06/yy 06/yy 12/13 Y 12/14 Y 09/13 Q3 12/13 Q4
41'072.6 38'989.7 73'803.7 82'403.1 85'253.3 84'229.0 86'110.2 92'410.0 103'305.0 27'036.5 23'063.5
1.70x 2.30x 1.62x 1.18x 1.20x 3.49x 3.68x 1.16x 1.11x - -
(3'252.7) 3'263.0 12'026.8 11'677.8 11'398.1 0.0 0.0 12'221.5 14'995.5 - -
- 27.45x 9.96x 8.30x 9.01x 0.00x 0.00x 8.16x 6.65x - -
(15'268.5) 168.8 4'958.0 4'575.7 2'953.6 3'430.1 3'198.3 2'752.4 3'235.2 3'051.0 (1'065.5)
- 93.81x 7.59x 5.46x 9.56x 6.62x 6.75x 9.97x 8.49x 10.27x 29.23x
EBITDA 11'398.12 Long-Term Rating Date -
EBIT 3'841.21 Long-Term Rating -
Operating Margin 4.51% Long-Term Outlook -
Pretax Margin 3.53% Short-Term Rating Date -
Return on Assets 2.31% Short-Term Rating -
Return on Common Equity 11.83%
Return on Capital 4.60% EBITDA/Interest Exp. 5.71
Asset Turnover 0.69% (EBITDA-Capex)/Interest Exp. 2.63
Net Debt/EBITDA 6.83
Gross Margin - Total Debt/EBITDA 7.48
EBITDA Margin 10.9%
EBIT Margin 1.4% Total Debt/Equity 294.8%
Net Income Margin 3.5% Total Debt/Capital 73.4%
Asset Turnover 0.69
Current Ratio 0.26 Net Fixed Asset Turnover 0.95
Quick Ratio 0.11 Accounts receivable turnover-days 14.47
Debt to Assets 54.59% Inventory Days -
Tot Debt to Common Equity 294.84% Accounts Payable Turnover Day -
Accounts Receivable Turnover 25.22 Cash Conversion Cycle -
Inventory Turnover -
Profitability S&P Issuer Ratings
Credit Ratios
Margin Analysis
Reference
Structure
Net Income
P/E
Market Capitalization
Average Daily Trading Volume
Relative Stock Price Performance
Total Revenue
TEV/Revenue
EBITDA
TEV/EBITDA
Fiscal Year Ended
China Eastern Airlines Corp LtdPrice/Volume
Valuation Analysis
118'541'578.00
Current Price (9/dd/yy) Market Data
,
-
-
.
.
0
0
1
1
o!-. l!-. k!-. a!-. g!-0 c!-0 j!-0 Q!-0 j!-0 g!-0 g!-0 Q!-0 o!-0', F.,', F1,', F3,', F5,', F-,,', F-.,', F-1,', F-3,', F-5,', F
0.0
10'000.0
20'000.0
30'000.0
40'000.0
50'000.0
60'000.0
70'000.0
80'000.0
90'000.0
2001 2002 2003 2004 2005 2006 2007 2008 2009 2010 2011 2012
,',,
,'2,
-',,
-'2,
.',,
.'2,
0',,
0'2,
1',,
1'2,
,-',-'.,-, ,-',4'.,-, ,-',-'.,-- ,-',4'.,-- ,-',-'.,-. ,-',4'.,-. ,-',-'.,-0 ,-',4'.,-0
FReTn/CTrThoT/PolhirTlAlcST/ !Rna /eis FReTn/CTrThoT/PolhirTlAlcST/ !Rna /eis
Q.M.S Advisors | tel: +41 (0)78 922 08 77 | e-mail: [email protected] |
Page 219
09.09.2013
Holder Name Portfolio Name Source Amt Held % Out Latest Chg File Dt Inst Type
CHINA EASTERN AIR HO n/a EXCH 5'530'240'000 65.21 698'865'000 17.04.2013 Government
CES FINANCE HOLDING n/a EXCH 457'317'073 5.39 - 16.04.2013 Government
SHANGHAI LIANHE INVE n/a EXCH 427'085'429 5.04 - 16.04.2013 Government
CHINA NATIONAL AVIAT n/a EXCH 421'052'632 4.96 - 16.04.2013 Government
JINJIANG INTL GROUP n/a EXCH 343'288'860 4.05 - 16.04.2013 Government
AEROSPACE SCI & TECH n/a EXCH 99'088'580 1.17 - 16.04.2013 Government
SINOTRANS AIR TRANSP n/a EXCH 83'157'894 0.98 - 16.04.2013 Government
CHINA INTERNATIONAL Multiple Portfolios MF-AGG 47'579'437 0.56 45'597'009 31.12.2012 Investment Advisor
HUAAN FUND MANAGEMEN Multiple Portfolios MF-AGG 37'518'049 0.44 25'909'786 31.12.2012 Investment Advisor
HARVEST FUND MANAGEM n/a Co File 36'480'832 0.43 - 16.04.2013 Investment Advisor
ORIENT FUND MANAGEME Multiple Portfolios MF-AGG 29'289'934 0.35 28'449'834 31.12.2012 Investment Advisor
BANK OF CHINA LTD n/a EXCH 21'997'755 0.26 - 16.04.2013 Government
BOSHI FUND MANAGEMEN Multiple Portfolios MF-AGG 14'838'394 0.17 4'740'435 31.12.2012 Investment Advisor
HUATAI-PINEBRIDGE FU Multiple Portfolios MF-AGG 10'809'494 0.13 (24'223) 31.12.2012 Investment Advisor
EVERBRIGHT PRAMERICA Multiple Portfolios MF-AGG 8'271'000 0.1 470'797 31.12.2012 Investment Advisor
CHINA ASSET MANAGEME Multiple Portfolios MF-AGG 5'915'450 0.07 (9'235'600) 31.12.2012 Investment Advisor
E FUND MANAGEMENT Multiple Portfolios MF-AGG 5'737'004 0.07 457'600 31.12.2012 Investment Advisor
GTJA ALLIANZ FUND MA Multiple Portfolios MF-AGG 5'273'522 0.06 3'027'372 31.12.2012 Investment Advisor
CHINA ASSET MANAGEME Multiple Portfolios MF-AGG 4'928'171 0.06 - 02.09.2013 Investment Advisor
MINSHENG ROYAL FUND Multiple Portfolios MF-AGG 4'497'921 0.05 4'497'921 31.12.2012 Investment Advisor
Firm Name Analyst Recommendation Weighting Change Target Price Date Date
UBS XIN CHEN sell 1 D 2 12 month 02.09.2013
GF Securities Co. Ltd. YANG ZHIQING add 4 D #N/A N/A Not Provided 02.09.2013
Goldman Sachs HINO LAM neutral/neutral 3 M 3 12 month 01.09.2013
China International Capital Corp SHEN XIAOFENG buy 5 M #N/A N/A Not Provided 01.09.2013
SWS Research Co Ltd AMOS ZHANG neutral 3 M #N/A N/A Not Provided 01.09.2013
Chang Jiang Securities Co. Limited HAN YICHAO add 4 M #N/A N/A Not Provided 01.09.2013
China Minzu Securities Co Ltd WANG XIAOYAN neutral 3 M #N/A N/A Not Provided 07.06.2013
Masterlink Securities DAI KAI-YU hold 3 M 3 6 month 28.05.2013
Citic Securities Co., Ltd SU BAOLIANG overweight 5 M #N/A N/A Not Provided 12.04.2013
Capital Securities Corp TEAM COVERAGE hold 3 M #N/A N/A Not Provided 27.03.2013
PingAn Securities SUN CHAO buy 5 M 10 6 month 14.01.2013
HuaChuang Securities CHEN JUAN buy 5 U #N/A N/A Not Provided 05.11.2012
Sinolink Securities Co Ltd HUANG JINXIANG add 4 M #N/A N/A Not Provided 31.10.2012
Great Wall Securities BIAO HUANG neutral 3 D #N/A N/A Not Provided 31.08.2012
China Merchants Securities LUO YANYAN neutral 3 M #N/A N/A Not Provided 17.07.2012
China Securities Co., Ltd LI LEI add 4 M 5 Not Provided 25.06.2012
Bank of China International DU JIANPING buy 5 M 5 Not Provided 02.05.2012
Industrial Securities ZENG XU neutral 3 M 4 12 month 04.04.2012
Rising Securities Co.,LTD SONG HUAISONG neutral 3 N 5 12 month 24.11.2011
China Investment Securities XIE HONG buy 5 D #N/A N/A Not Provided 07.04.2011
Everbright Securities Co., Ltd CHEN XIN buy 5 M 12 Not Provided 26.02.2011
AJ Securities XIN ZHANG buy 5 N 9 Not Provided 06.01.2011
China Galaxy Securities MAO ANG speculative buy 4 M #N/A N/A Not Provided 20.04.2010
Northeast Securities Co Ltd XIANG XU neutral 3 N #N/A N/A Not Provided 13.07.2009
Guodu Securities Co Ltd GONG JUNJIE neutral 3 N #N/A N/A Not Provided 13.07.2009
Holdings By:
China Eastern Airlines Corp Ltd ee
Q.M.S Advisors | tel: +41 (0)78 922 08 77 | e-mail: [email protected] |
Page 220
09.09.2013
Yangquan Coal Industry Group Co Ltd. produces, processes, and sells coal. The
Company also generates electricity and heat. Yangquan Coal sells its products
domestically and exports to other countries.
Latest Fiscal Year: 12/2012
LTM as of: 06/yy
52-Week High (05.02.2013) 17.30
52-Week Low (09.07.2013) 8.06
Daily Volume
9.44
52-Week High % Change -45.43% Dividend Yield -
52-Week Low % Change 17.12% Beta 1.39
% 52 Week Price Range High/Low 12.45% Equity Float 995.22
Shares Out 30.06.2013 2'405.0 Short Int -
22'703.20 1 Yr Total Return -33.33%
Total Debt 3'317.74 YTD Return -32.91%
Preferred Stock 0.0 Adjusted BETA 1.388
Minority Interest 1'590.4 Analyst Recs 16
Cash and Equivalents 5'683.99 Consensus Rating 4.000
Enterprise Value 23'301.37
Average Volume 5 Day 11'225'000
600348 CH EQUITY YTD Change - Average Volume 30 Day 18'508'950
600348 CH EQUITY YTD % CHANGE - Average Volume 3 Month 16'213'880
LTM-4Q LTM FY+1 FY+2 FQ+1 FQ+2
31.12.2008 31.12.2009 31.12.2010 31.12.2011 31.12.2012 06/yy 06/yy 12/13 Y 12/14 Y 09/13 Q3 12/13 Q4
16'827.3 19'723.9 27'458.4 50'174.7 70'986.6 58'445.6 78'118.6 76'170.7 80'078.0 - -
0.50x 2.42x 2.49x 0.67x 0.48x 2.73x 1.54x - - - -
2'775.9 3'556.2 5'073.3 5'590.7 5'275.4 0.0 0.0 4'077.5 3'977.0 - -
3.00x 13.43x 13.47x 5.98x 6.48x 0.00x 0.00x 5.71x 5.86x - -
1'454.5 1'856.3 2'412.5 2'810.6 2'287.6 2'539.0 1'601.0 1'519.3 1'619.7 - -
6.44x 25.06x 28.68x 12.97x 15.29x 14.48x 13.41x 13.72x 12.49x - -
EBITDA 5'275.44 Long-Term Rating Date -
EBIT 3'230.66 Long-Term Rating -
Operating Margin 4.55% Long-Term Outlook -
Pretax Margin 4.44% Short-Term Rating Date -
Return on Assets 5.17% Short-Term Rating -
Return on Common Equity 12.02%
Return on Capital - EBITDA/Interest Exp. 18.24
Asset Turnover 2.52% (EBITDA-Capex)/Interest Exp. 8.98
Net Debt/EBITDA -
Gross Margin 7.9% Total Debt/EBITDA -
EBITDA Margin -
EBIT Margin 3.0% Total Debt/Equity 25.5%
Net Income Margin 3.2% Total Debt/Capital 18.5%
Asset Turnover 2.52
Current Ratio 1.18 Net Fixed Asset Turnover 11.31
Quick Ratio 0.92 Accounts receivable turnover-days 31.72
Debt to Assets 10.53% Inventory Days 6.37
Tot Debt to Common Equity 25.54% Accounts Payable Turnover Day 25.31
Accounts Receivable Turnover 11.51 Cash Conversion Cycle 11.42
Inventory Turnover 57.31
Profitability S&P Issuer Ratings
Credit Ratios
Margin Analysis
Reference
Structure
Net Income
P/E
Market Capitalization
Average Daily Trading Volume
Relative Stock Price Performance
Total Revenue
TEV/Revenue
EBITDA
TEV/EBITDA
Fiscal Year Ended
Yang Quan Coal Industry Group Co LtdPrice/Volume
Valuation Analysis
19'925'189.00
Current Price (9/dd/yy) Market Data
,.135
-,-.-1-3-5
o!-. l!-. k!-. a!-. g!-0 c!-0 j!-0 Q!-0 j!-0 g!-0 g!-0 Q!-0 o!-0', F
-,', F
.,', F
0,', F
1,', F
2,', F
3,', F
4,', F
5,', F
0.0
10'000.0
20'000.0
30'000.0
40'000.0
50'000.0
60'000.0
70'000.0
80'000.0
2001 2002 2003 2004 2005 2006 2007 2008 2009 2010 2011 2012
,',,
2',,
-,',,
-2',,
.,',,
.2',,
0,',,
,-',-'.,-, ,-',4'.,-, ,-',-'.,-- ,-',4'.,-- ,-',-'.,-. ,-',4'.,-. ,-',-'.,-0 ,-',4'.,-0
FReTn/CTrThoT/PolhirTlAlcST/ !Rna /eis FReTn/CTrThoT/PolhirTlAlcST/ !Rna /eis
Q.M.S Advisors | tel: +41 (0)78 922 08 77 | e-mail: [email protected] |
Page 221
09.09.2013
Holder Name Portfolio Name Source Amt Held % Out Latest Chg File Dt Inst Type
YANGQUAN COAL INDUST n/a Co File 1'403'038'240 58.34 - 31.12.2012 Government
CHINA ASSET MANAGEME Multiple Portfolios MF-AGG 19'875'893 0.83 (1'357'384) 31.12.2012 Investment Advisor
E FUND MANAGEMENT Multiple Portfolios MF-AGG 15'623'405 0.65 (14'881'124) 31.12.2012 Investment Advisor
SOOCHOW ASSET MANAGE Multiple Portfolios MF-AGG 14'669'938 0.61 1'169'938 30.06.2013 Investment Advisor
HARVEST FUND MANAGEM Multiple Portfolios MF-AGG 10'657'763 0.44 (7'723'349) 31.12.2012 Investment Advisor
HUAAN FUND MANAGEMEN Multiple Portfolios MF-AGG 8'875'199 0.37 4'613'777 31.12.2012 Investment Advisor
CHINA LIFE INSURANCE n/a ULT-AGG 7'927'245 0.33 - 31.12.2012 Government
YINHUA FUND MANAGEME Multiple Portfolios MF-AGG 7'235'000 0.3 (10'017'744) 31.12.2012 Investment Advisor
YANGQUAN COAL IND GR n/a Co File 6'740'440 0.28 - 31.12.2012 Corporation
HUATAI-PINEBRIDGE FU Multiple Portfolios MF-AGG 5'494'422 0.23 - 31.12.2012 Investment Advisor
CHANGSHENG FUND MANA Multiple Portfolios MF-AGG 4'738'666 0.2 (2'297'202) 31.12.2012 Investment Advisor
BOSERA FUND MANAGEME Multiple Portfolios MF-AGG 4'731'251 0.2 (303'436) 31.12.2012 Investment Advisor
GTJA ALLIANZ FUND MA Multiple Portfolios MF-AGG 2'721'145 0.11 1'531'020 30.06.2013 Investment Advisor
BANK OF CHINA INVEST Multiple Portfolios MF-AGG 2'654'389 0.11 1'905'919 31.12.2012 Investment Advisor
TIANTONG ASSET MANAG Multiple Portfolios MF-AGG 2'650'795 0.11 250'579 31.12.2012 Investment Advisor
BAOYING FUND MANAGEM Multiple Portfolios MF-AGG 2'420'000 0.1 (146'065) 31.12.2012 Investment Advisor
CHINA ASSET MANAGEME Multiple Portfolios MF-AGG 2'387'433 0.1 - 02.09.2013 Investment Advisor
BOSHI FUND MANAGEMEN Multiple Portfolios MF-AGG 1'918'285 0.08 (3'253'642) 31.12.2012 Investment Advisor
BANK OF COMMUNICATIO Multiple Portfolios MF-AGG 1'911'665 0.08 887'099 31.12.2012 Investment Advisor
GUOTAI ASSET MANAGEM Multiple Portfolios MF-AGG 1'367'972 0.06 149'375 31.12.2012 Investment Advisor
Firm Name Analyst Recommendation Weighting Change Target Price Date Date
GF Securities Co. Ltd. AN PENG add 4 M #N/A N/A Not Provided 03.09.2013
EVA Dimensions DOUG WALTERS sell 1 D #N/A N/A Not Provided 20.08.2013
Everbright Securities Co., Ltd CHEN HAOWU buy 5 M 12 12 month 17.08.2013
Chang Jiang Securities Co. Limited JUN GE add 4 M #N/A N/A Not Provided 16.08.2013
SWS Research Co Ltd LIU XIAONING outperform 5 D #N/A N/A Not Provided 22.07.2013
China Investment Securities ZHANG LEI buy 5 M #N/A N/A Not Provided 14.07.2013
Goldman Sachs YONG HAN neutral/neutral 3 M 9 12 month 08.07.2013
Qilu Securities Co Ltd ZHAOLIANG LIU add 4 M #N/A N/A Not Provided 01.07.2013
Masterlink Securities LI XIN hold 3 M 13 Not Provided 21.05.2013
Citic Securities Co., Ltd ZU GUOPENG buy 5 M 25 6 month 06.05.2013
Hong Yuan Securities WANG JINGLE buy 5 U 23 6 month 16.04.2013
Guodu Securities Co Ltd WANG SHUBAO buy 5 M #N/A N/A Not Provided 09.04.2013
China Minzu Securities Co Ltd LI JING add 4 M 17 6 month 29.03.2013
Founder Securities SUN CAN add 4 M #N/A N/A Not Provided 05.02.2013
Bank of China International LAWRENCE LAU hold 3 M 14 12 month 29.01.2013
Central China Securities ZHILEI WANG add 4 M #N/A N/A Not Provided 25.10.2012
HuaChuang Securities HAN ZHENGUO buy 5 M #N/A N/A Not Provided 03.09.2012
China Merchants Securities LU PING strong buy 5 U #N/A N/A Not Provided 12.07.2012
PingAn Securities WANG CHENG buy 5 M 20 6 month 29.06.2012
AJ Securities WANG SIWEI neutral 3 D 22 6 month 28.06.2012
Great Wall Securities LIU FEI buy 5 M #N/A N/A Not Provided 28.03.2012
Tebon Securities Co Ltd LI XIANGFENG buy 5 M #N/A N/A Not Provided 13.02.2012
Northeast Securities Co Ltd WANG SHI buy 5 M #N/A N/A Not Provided 12.12.2011
Industrial Securities LIU JIANGANG strong buy 5 M 38 12 month 18.08.2011
China Securities Co., Ltd LI JUNSONG buy 5 N 29 Not Provided 08.12.2010
China Galaxy Securities ZHAO KE buy 5 M #N/A N/A Not Provided 13.07.2010
Holdings By:
Yang Quan Coal Industry Group Co Ltd ee
Q.M.S Advisors | tel: +41 (0)78 922 08 77 | e-mail: [email protected] |
Page 222
09.09.2013
Zhejiang Chint Electrics Co., Ltd. manufactures low voltage electric appliances.
The Company's products include high, Medium and low voltage electrical
apparatus, power transmission and distribution equipment, and measuring meters
and instruments.
Latest Fiscal Year: 12/2012
LTM as of: 06/yy
52-Week High (24.05.2013) 22.99
52-Week Low (20.09.2012) 14.32
Daily Volume
21.56
52-Week High % Change -6.22% Dividend Yield -
52-Week Low % Change 50.56% Beta 0.85
% 52 Week Price Range High/Low 84.89% Equity Float 235.69
Shares Out 30.06.2013 1'005.0 Short Int -
21'667.80 1 Yr Total Return 46.04%
Total Debt 1'702.61 YTD Return 20.79%
Preferred Stock 0.0 Adjusted BETA 0.846
Minority Interest 500.0 Analyst Recs 11
Cash and Equivalents 3'967.15 Consensus Rating 4.545
Enterprise Value 21'555.13
Average Volume 5 Day 709'209
601877 CH EQUITY YTD Change - Average Volume 30 Day 1'172'644
601877 CH EQUITY YTD % CHANGE - Average Volume 3 Month 1'273'401
LTM-4Q LTM FY+1 FY+2 FQ+1 FQ+2
31.12.2008 31.12.2009 31.12.2010 31.12.2011 31.12.2012 06/yy 06/yy 12/13 Y 12/14 Y 09/13 Q3 12/13 Q4
4'415.4 4'770.1 6'304.6 9'672.4 10'632.3 10'298.2 11'689.1 12'367.9 14'789.9 - -
- - 3.23x 1.11x 1.57x 4.71x 6.18x - - - -
- 770.7 889.1 1'263.6 1'806.1 0.0 0.0 2'258.0 2'703.0 - -
- - 22.88x 8.51x 9.25x 0.00x 0.00x 9.55x 7.97x - -
388.5 522.3 638.5 894.3 1'261.6 991.4 1'436.1 1'398.1 1'735.9 - -
- - 37.42x 14.72x 14.58x 15.42x 13.90x 15.46x 12.73x - -
EBITDA 1'806.10 Long-Term Rating Date -
EBIT 1'643.20 Long-Term Rating -
Operating Margin 15.45% Long-Term Outlook -
Pretax Margin 15.71% Short-Term Rating Date -
Return on Assets 15.47% Short-Term Rating -
Return on Common Equity 31.62%
Return on Capital - EBITDA/Interest Exp. 15.78
Asset Turnover 1.26% (EBITDA-Capex)/Interest Exp. 7.81
Net Debt/EBITDA -
Gross Margin 29.4% Total Debt/EBITDA -
EBITDA Margin -
EBIT Margin 16.4% Total Debt/Equity 37.5%
Net Income Margin 11.9% Total Debt/Capital 25.3%
Asset Turnover 1.26
Current Ratio 2.29 Net Fixed Asset Turnover 9.17
Quick Ratio 1.96 Accounts receivable turnover-days 85.24
Debt to Assets 17.20% Inventory Days 34.11
Tot Debt to Common Equity 37.50% Accounts Payable Turnover Day 77.37
Accounts Receivable Turnover 4.28 Cash Conversion Cycle 47.79
Inventory Turnover 10.70
Fiscal Year Ended
Zhejiang Chint Electrics Co LtdPrice/Volume
Valuation Analysis
1'350'470.00
Current Price (9/dd/yy) Market Data
Net Income
P/E
Market Capitalization
Average Daily Trading Volume
Relative Stock Price Performance
Total Revenue
TEV/Revenue
EBITDA
TEV/EBITDA
Profitability S&P Issuer Ratings
Credit Ratios
Margin Analysis
Reference
Structure
,
2
-,
-2
.,
.2
o!-. l!-. k!-. a!-. g!-0 c!-0 j!-0 Q!-0 j!-0 g!-0 g!-0 Q!-0 o!-0', F-', F.', F0', F1', F2', F3', F4', F5', F6', F
0.0
2'000.0
4'000.0
6'000.0
8'000.0
10'000.0
12'000.0
2001 2002 2003 2004 2005 2006 2007 2008 2009 2010 2011 2012
,',,
-,',,
.,',,
0,',,
1,',,
2,',,
3,',,
4,',,
5,',,
6,',,
-,,',,
,-',-'.,-, ,-',4'.,-, ,-',-'.,-- ,-',4'.,-- ,-',-'.,-. ,-',4'.,-. ,-',-'.,-0 ,-',4'.,-0
FReTn/CTrThoT/PolhirTlAlcST/ !Rna /eis FReTn/CTrThoT/PolhirTlAlcST/ !Rna /eis
Q.M.S Advisors | tel: +41 (0)78 922 08 77 | e-mail: [email protected] |
Page 223
09.09.2013
Holder Name Portfolio Name Source Amt Held % Out Latest Chg File Dt Inst Type
CHINT GROUP CORP n/a EXCH 657'000'000 65.37 (480'001) 09.05.2013 Corporation
CUNHUI NAN n/a Co File 57'319'436 5.7 - 31.12.2012 n/a
EVERBRIGHT PRAMERICA Multiple Portfolios MF-AGG 30'760'095 3.06 1'270'466 30.06.2013 Investment Advisor
GUOTAI ASSET MANAGEM Multiple Portfolios MF-AGG 23'421'173 2.33 13'743'107 31.12.2012 Investment Advisor
CUNFEI NAN n/a Co File 17'235'223 1.71 - 31.12.2012 n/a
XINMIN ZHU n/a Co File 16'735'233 1.67 - 31.12.2012 n/a
E FUND MANAGEMENT Multiple Portfolios MF-AGG 11'000'000 1.09 1'156'628 31.12.2012 Investment Advisor
LIMING LIN n/a Co File 8'677'800 0.86 - 31.12.2012 n/a
BINGCHI WU n/a Co File 8'343'489 0.83 - 31.12.2012 n/a
CHINA ASSET MANAGEME Multiple Portfolios MF-AGG 3'335'606 0.33 (2'629'947) 31.12.2012 Investment Advisor
YIQIANG GAO n/a Co File 2'813'000 0.28 - 31.12.2012 n/a
FULLGOAL FUND MANAGE Multiple Portfolios MF-AGG 2'587'682 0.26 (347'700) 31.12.2012 Investment Advisor
GF FUND MANAGEMENT C Multiple Portfolios MF-AGG 2'554'047 0.25 2'554'047 31.12.2012 Investment Advisor
INVESCO GREAT WALL F Multiple Portfolios MF-AGG 2'524'682 0.25 1'022'593 31.12.2012 Investment Advisor
MANULIFE TEDA FUND M Multiple Portfolios MF-AGG 2'476'407 0.25 2'476'407 31.12.2012 Investment Advisor
BOSHI FUND MANAGEMEN Multiple Portfolios MF-AGG 1'294'026 0.13 (305'911) 31.12.2012 Investment Advisor
CCB PRINCIPAL ASSET Multiple Portfolios MF-AGG 1'208'537 0.12 1'208'537 31.12.2012 Investment Advisor
CHANGSHENG FUND MANA Multiple Portfolios MF-AGG 1'161'961 0.12 1'161'961 31.12.2012 Investment Advisor
OPEN DOOR INVESTMENT Multiple Portfolios MF-AGG 1'094'314 0.11 - 31.07.2013 Investment Advisor
GUOLIANG CHEN n/a Co File 1'070'250 0.11 - 31.12.2012 n/a
Firm Name Analyst Recommendation Weighting Change Target Price Date Date
Northeast Securities Co Ltd YANG JIALI buy 5 M #N/A N/A Not Provided 02.09.2013
GF Securities Co. Ltd. HAN LING buy 5 M 28 12 month 26.08.2013
Founder Securities WEI ZHOU add 4 M #N/A N/A Not Provided 26.08.2013
EVA Dimensions ANDREW S ZAMFOTIS hold 3 D #N/A N/A Not Provided 25.04.2013
Qilu Securities Co Ltd LIU JIANGXIAO add 4 M #N/A N/A Not Provided 01.04.2013
Sinolink Securities Co Ltd ZHANG SHUAI add 4 M #N/A N/A Not Provided 26.03.2013
Rising Securities Co.,LTD HUANG HE strong buy 5 M #N/A N/A Not Provided 26.03.2013
HuaChuang Securities LI DAJUN strong buy 5 M #N/A N/A Not Provided 24.02.2013
PingAn Securities ZHANG HAI strong buy 5 M #N/A N/A Not Provided 18.12.2012
Everbright Securities Co., Ltd ZHOU LIQIAN buy 5 U 19 Not Provided 07.11.2012
Great Wall Securities GUI FANGXIAO buy 5 N #N/A N/A Not Provided 25.10.2012
Central China Securities PAN HANGJUN add 4 M #N/A N/A Not Provided 20.08.2012
Hong Yuan Securities ZHAO XI buy 5 M #N/A N/A Not Provided 18.08.2012
China Merchants Securities PENG QUANGANG strong buy 5 M 21 6 month 18.07.2012
Holdings By:
Zhejiang Chint Electrics Co Ltd ee
Q.M.S Advisors | tel: +41 (0)78 922 08 77 | e-mail: [email protected] |
Page 224
09.09.2013
China Hainan Rubber Industry Group Co.,Ltd. Produces, cultivates, process and
sales natural rubber. The Company's sector also includes E-commerce services,
software development, agricultural cultivation, fertilizer sales, land leases,
land development, livestock, and aquaculture industries.
Latest Fiscal Year: 12/2012
LTM as of: 06/yy
52-Week High (09.09.2013) 7.13
52-Week Low (25.06.2013) 3.89
Daily Volume
7.13
52-Week High % Change 0.00% Dividend Yield 0.70
52-Week Low % Change 83.29% Beta 1.47
% 52 Week Price Range High/Low 84.36% Equity Float 865.56
Shares Out 30.06.2013 3'931.2 Short Int -
28'029.25 1 Yr Total Return 20.22%
Total Debt 840.01 YTD Return 26.78%
Preferred Stock 0.0 Adjusted BETA 1.474
Minority Interest 121.2 Analyst Recs 2
Cash and Equivalents 1'387.57 Consensus Rating 5.000
Enterprise Value 27'248.32
Average Volume 5 Day #########
601118 CH EQUITY YTD Change - Average Volume 30 Day 50'905'560
601118 CH EQUITY YTD % CHANGE - Average Volume 3 Month 31'678'860
LTM-4Q LTM FY+1 FY+2 FQ+1 FQ+2
31.12.2008 31.12.2009 31.12.2010 31.12.2011 31.12.2012 06/yy 06/yy 12/13 Y 12/14 Y 09/13 Q3 12/13 Q4
3'636.0 3'741.2 6'321.8 10'523.1 11'667.9 10'154.7 13'120.2 11'783.0 15'053.0 - -
- - - 2.37x 1.88x 10.41x 6.19x - - - -
610.1 - 939.6 1'082.2 498.3 0.0 0.0 - - - -
- - - 23.02x 43.96x 0.00x 0.00x - - - -
337.3 285.7 572.8 761.0 296.8 482.0 294.2 228.0 354.0 - -
- - - 35.05x 75.73x 56.06x 55.27x 62.00x 43.21x - -
EBITDA 498.26 Long-Term Rating Date -
EBIT 274.28 Long-Term Rating -
Operating Margin 2.35% Long-Term Outlook -
Pretax Margin 2.70% Short-Term Rating Date -
Return on Assets 2.67% Short-Term Rating -
Return on Common Equity 3.27%
Return on Capital 3.45% EBITDA/Interest Exp. 10.08
Asset Turnover 1.05% (EBITDA-Capex)/Interest Exp. -0.13
Net Debt/EBITDA -1.10
Gross Margin 7.7% Total Debt/EBITDA 1.69
EBITDA Margin 4.3%
EBIT Margin 2.4% Total Debt/Equity 9.3%
Net Income Margin 2.5% Total Debt/Capital 8.4%
Asset Turnover 1.05
Current Ratio 3.10 Net Fixed Asset Turnover 7.29
Quick Ratio 1.49 Accounts receivable turnover-days 21.09
Debt to Assets 7.55% Inventory Days 66.18
Tot Debt to Common Equity 9.26% Accounts Payable Turnover Day 9.13
Accounts Receivable Turnover 17.35 Cash Conversion Cycle 78.14
Inventory Turnover 5.53
Fiscal Year Ended
China Hainan Rubber Industry Group Co LtdPrice/Volume
Valuation Analysis
241'898'965.00
Current Price (9/dd/yy) Market Data
Net Income
P/E
Market Capitalization
Average Daily Trading Volume
Relative Stock Price Performance
Total Revenue
TEV/Revenue
EBITDA
TEV/EBITDA
Profitability S&P Issuer Ratings
Credit Ratios
Margin Analysis
Reference
Structure
,
-
.
0
1
2
3
4
o!-. l!-. k!-. a!-. g!-0 c!-0 j!-0 Q!-0 j!-0 g!-0 g!-0 Q!-0 o!-0', F
.,', F
1,', F
3,', F
5,', F
-,,', F
-.,', F
-1,', F
0.0
2'000.0
4'000.0
6'000.0
8'000.0
10'000.0
12'000.0
14'000.0
2001 2002 2003 2004 2005 2006 2007 2008 2009 2010 2011 2012
,',,
2',,
-,',,
-2',,
.,',,
.2',,
0,',,
02',,
1,',,
12',,
,-',-'.,-, ,-',4'.,-, ,-',-'.,-- ,-',4'.,-- ,-',-'.,-. ,-',4'.,-. ,-',-'.,-0 ,-',4'.,-0
FReTn/CTrThoT/PolhirTlAlcST/ !Rna /eis FReTn/CTrThoT/PolhirTlAlcST/ !Rna /eis
Q.M.S Advisors | tel: +41 (0)78 922 08 77 | e-mail: [email protected] |
Page 225
09.09.2013
Holder Name Portfolio Name Source Amt Held % Out Latest Chg File Dt Inst Type
HAINAN NONGKEN GROUP n/a Co File 2'869'012'024 72.98 - 31.12.2012 Unclassified
SOCIAL SECURITY FUND n/a Co File 77'159'576 1.96 - 31.12.2012 Government
HEHE HOLDINGS CO LTD n/a Co File 28'773'500 0.73 - 31.12.2012 Holding Company
CHINA LIFE INSURANCE n/a ULT-AGG 27'835'483 0.71 - 31.12.2012 Government
HAIKOU AGRI INDUS LU n/a Co File 20'000'000 0.51 - 31.12.2012 Corporation
HAINAN DEV HOLDINGS n/a Co File 19'476'210 0.5 - 31.12.2012 Other
XIAMEN XIANGYU GROUP n/a Co File 13'613'417 0.35 - 31.12.2012 Government
GUANGDONG NONGKEN GR n/a Co File 9'738'105 0.25 - 31.12.2012 Corporation
HARVEST FUND MANAGEM Multiple Portfolios MF-AGG 9'373'886 0.24 (6'195'909) 31.12.2012 Investment Advisor
CHINA ASSET MANAGEME Multiple Portfolios MF-AGG 7'595'273 0.19 (5'618'629) 31.12.2012 Investment Advisor
HUATAI-PINEBRIDGE FU Multiple Portfolios MF-AGG 5'436'766 0.14 43'700 31.12.2012 Investment Advisor
CHINA INTERNATIONAL Multiple Portfolios MF-AGG 2'968'900 0.08 2'688'000 31.12.2012 Investment Advisor
E FUND MANAGEMENT Multiple Portfolios MF-AGG 2'895'243 0.07 (3'559'751) 31.12.2012 Investment Advisor
BANK OF CHINA INVEST Multiple Portfolios MF-AGG 2'811'785 0.07 2'120'100 31.12.2012 Investment Advisor
HUAAN FUND MANAGEMEN Multiple Portfolios MF-AGG 2'707'233 0.07 513'969 31.12.2012 Investment Advisor
CHINA ASSET MANAGEME Multiple Portfolios MF-AGG 2'286'366 0.06 - 02.09.2013 Investment Advisor
CHINA MERCHANTS FUND Multiple Portfolios MF-AGG 2'202'954 0.06 (194'848) 31.12.2012 Investment Advisor
TIANTONG ASSET MANAG Multiple Portfolios MF-AGG 1'711'680 0.04 416'464 31.12.2012 Investment Advisor
DACHENG FUND MANAGME Multiple Portfolios MF-AGG 1'282'574 0.03 361'500 31.12.2012 Investment Advisor
CHINA UNIVERSAL ASSE Multiple Portfolios MF-AGG 1'247'987 0.03 (56'443) 02.09.2013 Investment Advisor
Firm Name Analyst Recommendation Weighting Change Target Price Date Date
Citic Securities Co., Ltd CHANGQING MAO overweight 5 U 7 6 month 03.05.2013
SWS Research Co Ltd GONG YANHAI outperform 5 M #N/A N/A Not Provided 23.04.2013
Holdings By:
China Hainan Rubber Industry Group Co Ltd ee
Q.M.S Advisors | tel: +41 (0)78 922 08 77 | e-mail: [email protected] |
Page 226
09.09.2013
Bright Dairy & Food Co., Ltd. processes and sells milk and other dairy products.
The Company's products include liquid milk, milk powder, yogurt, cheese, and
juice. Shanghai Bright operates the Shanghai Kedi Convenience Store.
Latest Fiscal Year: 12/2012
LTM as of: 06/yy
52-Week High (06.09.2013) 20.70
52-Week Low (24.09.2012) 8.10
Daily Volume
19.96
52-Week High % Change -3.57% Dividend Yield -
52-Week Low % Change 146.42% Beta 0.98
% 52 Week Price Range High/Low 94.05% Equity Float 532.52
Shares Out 03.09.2013 1'224.6 Short Int -
24'442.97 1 Yr Total Return 117.86%
Total Debt 1'632.23 YTD Return 105.67%
Preferred Stock 0.0 Adjusted BETA 0.977
Minority Interest 410.8 Analyst Recs 12
Cash and Equivalents 2'339.38 Consensus Rating 4.500
Enterprise Value 24'568.85
Average Volume 5 Day 26'298'450
600597 CH EQUITY YTD Change - Average Volume 30 Day 9'791'225
600597 CH EQUITY YTD % CHANGE - Average Volume 3 Month 8'382'131
LTM-4Q LTM FY+1 FY+2 FQ+1 FQ+2
31.12.2008 31.12.2009 31.12.2010 31.12.2011 31.12.2012 06/yy 06/yy 12/13 Y 12/14 Y 09/13 Q3 12/13 Q4
7'337.4 7'916.4 9'529.1 11'724.9 13'702.3 12'625.5 14'685.1 16'201.9 18'843.4 - -
0.58x 1.19x 1.14x 0.90x 0.86x 3.28x 3.80x - - - -
(214.3) 407.6 474.2 546.3 795.9 0.0 0.0 - - - -
- 23.06x 22.81x 19.27x 14.76x 0.00x 0.00x - - - -
(286.0) 122.5 194.4 237.8 311.3 261.2 362.6 455.9 646.9 - -
- 79.42x 54.00x 38.91x 35.11x 37.41x 43.98x 52.25x 36.36x - -
EBITDA 795.85 Long-Term Rating Date -
EBIT 472.62 Long-Term Rating -
Operating Margin 3.45% Long-Term Outlook -
Pretax Margin 3.06% Short-Term Rating Date -
Return on Assets 4.15% Short-Term Rating -
Return on Common Equity 11.51%
Return on Capital - EBITDA/Interest Exp. 9.89
Asset Turnover 1.68% (EBITDA-Capex)/Interest Exp. -3.67
Net Debt/EBITDA -
Gross Margin 34.8% Total Debt/EBITDA -
EBITDA Margin -
EBIT Margin 3.9% Total Debt/Equity 40.7%
Net Income Margin 2.3% Total Debt/Capital 26.9%
Asset Turnover 1.68
Current Ratio 1.25 Net Fixed Asset Turnover 4.21
Quick Ratio 0.92 Accounts receivable turnover-days 35.50
Debt to Assets 17.48% Inventory Days 43.57
Tot Debt to Common Equity 40.67% Accounts Payable Turnover Day 52.95
Accounts Receivable Turnover 10.28 Cash Conversion Cycle 24.44
Inventory Turnover 8.38
Profitability S&P Issuer Ratings
Credit Ratios
Margin Analysis
Reference
Structure
Net Income
P/E
Market Capitalization
Average Daily Trading Volume
Relative Stock Price Performance
Total Revenue
TEV/Revenue
EBITDA
TEV/EBITDA
Fiscal Year Ended
Bright Dairy & Food Co LtdPrice/Volume
Valuation Analysis
15'070'964.00
Current Price (9/dd/yy) Market Data
,
2
-,
-2
.,
.2
o!-. l!-. k!-. a!-. g!-0 c!-0 j!-0 Q!-0 j!-0 g!-0 g!-0 Q!-0 o!-0', F2', F-,', F-2', F.,', F.2', F0,', F02', F1,', F12', F2,', F
0.0
2'000.0
4'000.0
6'000.0
8'000.0
10'000.0
12'000.0
14'000.0
16'000.0
2001 2002 2003 2004 2005 2006 2007 2008 2009 2010 2011 2012
,',,
2',,
-,',,
-2',,
.,',,
.2',,
0,',,
02',,
1,',,
12',,
2,',,
,-',-'.,-, ,-',4'.,-, ,-',-'.,-- ,-',4'.,-- ,-',-'.,-. ,-',4'.,-. ,-',-'.,-0 ,-',4'.,-0
FReTn/CTrThoT/PolhirTlAlcST/ !Rna /eis FReTn/CTrThoT/PolhirTlAlcST/ !Rna /eis
Q.M.S Advisors | tel: +41 (0)78 922 08 77 | e-mail: [email protected] |
Page 227
09.09.2013
Holder Name Portfolio Name Source Amt Held % Out Latest Chg File Dt Inst Type
SHANGHAI MILK GROUP n/a Co File 367'498'967 30.01 - 31.12.2012 Corporation
BRIGHT FOOD GROUP CO n/a Co File 314'404'338 25.67 - 31.12.2012 Other
SHANGHAI LIUHE YUXIU n/a Co File 57'300'000 4.68 - 31.12.2012 Private Equity
GUOTAI ASSET MANAGEM Multiple Portfolios MF-AGG 26'079'455 2.13 10'319'879 30.06.2013 Investment Advisor
SOCIAL SECURITY FUND n/a Co File 26'061'624 2.13 - 31.12.2012 Government
HUASHANG FUND MANAGE Multiple Portfolios MF-AGG 23'622'857 1.93 23'593'357 30.06.2013 Investment Advisor
E FUND MANAGEMENT Multiple Portfolios MF-AGG 22'478'235 1.84 (6'525'310) 31.12.2012 Investment Advisor
CHINA INTERNATIONAL Multiple Portfolios MF-AGG 21'352'189 1.74 12'768'707 30.06.2013 Investment Advisor
SH JINGLIN JINGTONG n/a Co File 20'500'000 1.67 - 31.12.2012 Private Equity
GUANGDONG WENS INVES n/a Co File 18'500'000 1.51 - 31.12.2012 Private Equity
HUATAI-PINEBRIDGE FU Multiple Portfolios MF-AGG 18'489'472 1.51 1'278'543 31.12.2012 Investment Advisor
SYWG BNP PARIBAS ASS Multiple Portfolios MF-AGG 18'100'000 1.48 - 30.06.2013 Investment Advisor
EVERBRIGHT GOLD SHAN n/a Co File 18'100'000 1.48 - 31.12.2012 Investment Advisor
YINHUA FUND MANAGEME Multiple Portfolios MF-AGG 8'400'000 0.69 8'400'000 31.12.2012 Investment Advisor
CHINA LIFE INSURANCE n/a ULT-AGG 8'335'190 0.68 - 31.12.2012 Government
CHINA MERCHANTS FUND Multiple Portfolios MF-AGG 8'169'373 0.67 2'598'208 31.12.2012 Investment Advisor
FRANKLIN TEMPLETON S Multiple Portfolios MF-AGG 7'708'476 0.63 3'583'403 31.12.2012 Investment Advisor
CHINA ASSET MANAGEME CHINA AMC RENAISSANC MF-PART 7'540'029 0.62 7'540'029 30.06.2013 Investment Advisor
TAIKANG LIFE INSURAN n/a Co File 7'204'116 0.59 - 31.12.2012 Insurance Company
FORTUNE SGAM FUND MA Multiple Portfolios MF-AGG 4'760'004 0.39 2'160'004 31.12.2012 Investment Advisor
Firm Name Analyst Recommendation Weighting Change Target Price Date Date
China International Capital Corp ZHIYAO JIN accumulate 4 M 19 Not Provided 02.09.2013
Guotai Junan HU CHUNXIA buy 5 M 21 12 month 02.09.2013
SWS Research Co Ltd MICHAEL TONG buy 5 M #N/A N/A Not Provided 01.09.2013
Capital Securities Corp LIU HUI hold 3 M 20 Not Provided 30.08.2013
Chang Jiang Securities Co. Limited ZHIJIAN CHEN buy 5 M #N/A N/A Not Provided 29.08.2013
Sinolink Securities Co Ltd TEAM COVERAGE buy 5 N 21 12 month 20.08.2013
Everbright Securities Co., Ltd TINGZHI XING accumulate 4 M 15 12 month 12.08.2013
Qilu Securities Co Ltd XIE GANG add 4 M #N/A N/A Not Provided 04.07.2013
Northeast Securities Co Ltd ZHU CHENGLIANG add 4 M #N/A N/A Not Provided 28.06.2013
PingAn Securities WEN XIAN buy 5 M #N/A N/A Not Provided 27.03.2013
Citic Securities Co., Ltd HUANG WEI overweight 5 M #N/A N/A Not Provided 06.02.2013
Bank of China International SU CHENG buy 5 M #N/A N/A Not Provided 24.01.2013
China Merchants Securities LONG JUN neutral 3 M #N/A N/A Not Provided 05.07.2012
HuaChuang Securities GAO LI buy 5 M #N/A N/A Not Provided 26.03.2012
China Investment Securities JIANG XIN buy 5 N #N/A N/A Not Provided 07.01.2011
China Minzu Securities Co Ltd LIU XIAOFENG add 4 N #N/A N/A Not Provided 23.03.2010
Central China Securities LIU RAN monitored #N/A N/A N #N/A N/A Not Provided 21.09.2009
Holdings By:
Bright Dairy & Food Co Ltd ee
Q.M.S Advisors | tel: +41 (0)78 922 08 77 | e-mail: [email protected] |