41
FUNDAMENTAL ASSESSMENT GUIDE
FUNDAMENTAL ASSESSMENT GUIDE

Fundamentals in ECD : Mathematics Literacy Trainer’s Manual
2

Fundamentals Assessment Guide: Contents
3
Section One 41. The purpose of the Assessment Guide 4
2. Logistics of assessment 4
Section Two 61. Summative assessment 6
2. Formative assessment 6
3. Compiling a portfolio 7
4. Assessing a journal 8
5. Preparing for an exam 9
Section Three 101. Example of evaluating activities in a
unit for formative assessment 10
CONTENTS

1. The Purpose of the Assessment Guide
The purpose of this Assessment Guide is to provide guidelines on:• how to conduct formative assessment during the teaching and learning process;• how to assist learners in compiling portfolios; and• how to prepare learners for a summative exam.
Assessment for creditIn order for learners to get credits for this fundamentals course in MathematicalLiteracy (NQF Level 1) learners need to be assessed for credits against thespecified outcomes. This means that once they have been assessed as competentlearners can use the credits towards a qualification.
Even if your organization is accredited to train the fundamentals, and even if youas a trainer are a registered assessor, you are not able to assess fundamentals forcredits. At the time of publication (April 2006) three agencies can assessfundamentals for credit. These are:
1. Independent Examinations Board (IEB) – (011) 483 97002. UNISA ABET Unit – (012) 429 36573. The Adult Education Assessment Body (UNISA) – (012) 429 3657
This means that as a trainer you cannot conduct assessment for credits. You, andyour organization and your learners, have to choose which assessment agencyyou want to work with. Different assessment agencies have differentrequirements and assessment processes for assessing fundamentals. It is best thatyou contact these agencies at the beginning of your course, find out therequirements and make the decision about which agency you want to use. Onceyou have made that decision you will need to register your learners with theagency of your choice. Don’t leave the decision to the last minute because thereare things that you will need to negotiate and work through over a period of time.
Formative assessmentBut you know that assessment is not only about getting the credits at the end.Good assessment is integral to the teaching and learning process. This means thatassessment needs to be ongoing so that you, the trainer, can monitor progress,give feedback and assist the learners to achieve their goals. That is why theassessment that you conduct with the learners on this course will be formativeassessment, and preparation for the summative assessment. The AssessmentGuide will guide you and the learners through formative assessment, throughpreparing a portfolio and through preparing for a summative exam.
2. Logistics of assessmentAccording to the IEB ‘… it is now national policy for any certificate at NQF Level1 to be made up of two parts:• An externally assessed national examination;• Work which is internally assessed according to (specified) requirements …
This is known as Site Based Assessment, or SBA.”1
Fundamentals in ECD : Mathematics Literacy Trainer’s Manual
4
Fundamentals Assessment GuideSECTION ONE
1 Independent Examinations Board, Communications in English, User Guide, NQF Level 1 / ABET Level 4, page 6, 2ndEdition, December 2003.

Section One: Fundamentals Assessment Guide
5
Different agencies have different requirements for assessment. But it is likely thatyour learners will have to do both of the above components.
Registering learners with an assessment agencyTo do both of the above components learners will have to be registered with anassessment agency. This is one of your roles as a trainer.
The first component, ‘an externally assessed national examination’, will have tobe conducted by an external assessment agency such as IEB or UNISA. The ‘workwhich is internally assessed’ is work specified by the assessment agency, butwhich you as the trainer are required to assess. Both of these count towards thefinal assessment for credit.
The criteria for the internal assessment (or SBA) are specified by your assessmentagency. But we are assuming that the assignments, and some of the activities, thathave been set in this course can form part of that SBA.
That is why this Assessment Guide helps you to facilitate the compilation ofportfolios. The activities and the assignments that learners do in the process ofteaching and learning will go into their portfolios towards the SBA.
So, although as the trainer you do not assess for credits, you still have a bigresponsibility in the assessment process.
Responsibilities of the trainer:1. Contact the Assessment Agencies and find out their assessment requirements.2. Decide which Assessment Agency you are going to use.3. Obtain all the necessary documents and criteria from the Assessment Agency
you have chosen.4. Make sure you understand the procedures for assessment required by the
Assessment Agency.5. Register your learners with the assessment of your choice.6. Make sure your learners are all at the right level for assessment at NQF Level
1. This means that learners must already have credits for ABET 3, or theyshould do a placement test for Mathematical Literacy with an assessmentagency. A placement test will check what level of learning learners shouldenter into. A placement test is not an assessment for credits. If a placement testplaces a learner at entry level NQF Level 1 then they can do this course. If not,then they should rather do a course at the appropriate level for them.
7. Make arrangements or yourself to attend any assessment preparation sessionsthat the Assessment Agency may offer.
8. Familiarize yourself with the outcomes against which learners will beassessed.
9. Plan time for formative assessment and SBA. Note that this time forms part ofthe notional hours for the course.
1. Summative AssessmentMost of us have experienced summative assessment as a test or an exam at theend of a school year, or at the end of a short course. That is because summativemeans a comprehensive assessment of a collection of work. So an exam will testyou on all the knowledge and skills that you have acquired over a period of time.Another way of looking at it is that summative assessment will be an assessmentagainst a collection of Learning Outcomes identified in the Unit Standards.
Trainer’s role in summative assessment• Make sure learners are registered with an Assessment Agency. Do this early on
in the course.• Make sure learners are given copies of the relevant Unit Standards at the
beginning of the course• Make sure learners know and understand all the requirements for the Site-
Based Assessment (if necessary) and external assessment• Assist learners to prepare their portfolios for submission to the Assessment
Agency if necessary.
2. Formative AssessmentYou are probably aware that the current thinking on assessment places as muchfocus on what happens during the teaching and learning process, and theprogress of the learners in that process, as on summative assessment. This isbecause we acknowledge that there is little point in assessing someone onsomething that they cannot do. So as teachers and trainers we have to monitor theprogress of learners in the teaching and learning process to evaluate whether theyare managing every step along the way. This is known as formative assessmentbecause it is assessment that takes place while learners are developing theirunderstanding of new ideas and new skills. For this reason formative assessmentis an integral part of teaching and learning.
The activities in this course are opportunities for learners to think and do andreflect. They are in a logical order, so that at the end of a set of activities there isan activity which can be used as a way of checking whether new ideas and skillshave been acquired, in other words, as formative assessment.
If learners manage these activities then they are obviously progressing well, andcan continue with the learning process. If they do not manage the activities thenthey need some form of assistance to help them identify mistakes and learn fromthose mistakes.
Trainer’s role in formative assessment• Read this Assessment Guide and the Trainer’s Guide carefully.• Make sure learners are given copies of the relevant Unit Standards at the
beginning of the course.
Fundamentals in ECD : Mathematics Literacy Trainer’s Manual
6
Fundamentals Assessment GuideSECTION TWO

Section Two: Fundamentals Assessment Guide
7
• Plan enough time for learners to do the activities, read, discuss and thinkabout what they have done.
• Evaluate the activities that are suggested as portfolio work. Section Three ofthis Assessment Guide will give an example of how to do this effectively.
• Give learners feedback on the activities so that they can identify theirmistakes.
• Give learners opportunities to re-do and re-think about the activities; or designnew activities that will help the learners to learn from their mistakes.
• Observe the learners while they are working and discussing. This allows youto see if any learners are having difficulties and what the difficulties are. In thisway you can help learners to identify and correct mistakes before they dowork for their portfolios.
• Keep records of learners’ progress through the course. This can be done bylearners themselves, using the self-assessment checklists in the Manual. It isalso important for you to keep progress records as you evaluate the portfolioactivities and assignments. Section Three of this Assessment Guide will giveyou an example of how to do this effectively.
3. Compiling a portfolioThe Assessment Agency that you choose may require learners to submit aportfolio of work to be evaluated as part of the summative assessment. Thisportfolio may be in addition to a Site-Based Assessment and an external exam, orit may be instead of those. You will have to find out the requirements of theAgency that you choose, and help learners to follow those requirements. Webelieve that even if your Assessment Agency does not require a portfolio it can bea useful exercise for learners to do anyway. This is because it is a usefulopportunity for learners to evaluate their work, and have their work evaluated bythe trainer, and reflect on their own progress.
Remember that most learners will need guidance on how to compile a portfolio.We believe that is part of your training responsibility.
What is a portfolio?A portfolio is a collection of work done over time that learners put into a file or afolder. If they give this portfolio to an Assessment Agency the agency willevaluate the work and, if the work is satisfactory, the portfolio will help to provethat learners are competent in NQF1 Mathematical Literacy.
What do your learners put into a portfolio?In this course your learner’s portfolio will contain:
• Activities that we have indicated as portfolio work.• All learner assignments• A learner’s journal
Of course, it should all be the learners’ own work, not someone else’s. But it canbe work that has been done in pairs or as a group. Each learner in the pair orgroup will put a copy into their own portfolio.

Learners should not be hesitant about putting work that has been corrected, orwork that is a rough draft, into their portfolio. This is a way of showing theassessor that there is progress. Also, learners may feel that they can improve apiece of work that they have put into their portfolio. They can re-do the activity,and date it, and put the new version into the portfolio as well. They can choose toremove the first version or leave it in. The work that goes into the portfolio shouldinclude comments and feedback from you, the trainer.
Not all the activities are suitable for a portfolio. Many of the activities are meantto help the learners to learn. Usually the portfolio those that we have indicatedwith a ‘portfolio work’ icon, though there may be some others that you think aregood to evaluate, give feedback on and encourage learners to put into theirportfolios.
Trainer’s role in the portfolio• Make sure that learners know which activities and assignments to put into
their portfolios.• Evaluate the portfolio work and give written and verbal feedback to the
learners.• Give learners an opportunity to correct any mistakes and make any
improvements based on your feedback.• Make sure the work is dated and signed before learners put it into their
portfolio.• Record your evaluation of the work. Make copies of these records and give
them to learners to put into their portfolios.• Check that there is sufficient evidence in the portfolio for an assessor to
make a fair judgement.
If the portfolio is a requirement of the Assessment Agency then they will want tosee evidence that all the outcomes in the relevant unit standards have beencovered, otherwise it will be returned for learners to complete. That is why thelast point above is crucial.
It is a good idea to make a copy of the portfolios before they are submitted, in casethey get lost or damaged.
4. Assessing a journalYou have seen that throughout this course we encourage learners to use a journalto reflect on their learning. This journal is not a personal diary, so it is not private.It is a place where learners can write down questions, worries, thoughts, feelings,tips and reminders about things they have learnt and ideas for working withchildren (application). The journal questions in the manual are focused to helplearners to be clear in their thinking.
So, this journal is a useful thing for you, the trainer, and an assessor, to monitorthe progress of learners and their learning. That is why you need to give yourself
Fundamentals in ECD : Mathematics Literacy Trainer’s Manual
8
Section Two: Fundamentals Assessment Guide
9
time to look through learners’ journals and comment and give feedback to thelearners on them.
The journal will help you and the learners to discover areas where they are notclear in their understanding, or where their understanding of a concept isinaccurate. But a journal will also be a record of things like feelings, for whichthere is no right and wrong. This means that when you look through learners’journals you are not really ‘marking’ them for assessment, but you are joining ina conversation that the learners have begun with themselves. So you need tocontinue the conversation, verbally or through written feedback in the journal, ina respectful way.
There is an example of a journal and journal feedback in Section Three.
When learners submit their journals in their portfolios they will submit themincluding all the comments and feedback that you have written in the journalstoo. Remind learners to make copies of their journals before they submit theirportfolios.
5. Preparing for an examRemember that it is likely that the Assessment Agency you choose will require thelearners to write an exam as part of their summative assessment. This is usuallya three-hour exam, written under strict exam conditions.
Some people may have never written such a long exam. Other people may havewritten an exam like that many years ago. So it is possible that learners will beanxious about writing an exam. It will be of great benefit to spend some timepreparing for the exam. You can do this in the following ways;
• Get old exam papers and go through them with learners. Be careful,though not to give them papers that are testing them on work that theycannot yet do. This will only demoralize them and scare them even more.It might be a good idea to wait until you are nearly at the end of the coursebefore you do this. You can get past exam papers from the IEB.
• You can also use these exam papers to do a ‘mock’ or pretend exam. Set upthe room as if it were an exam room, set aside enough time and ask thelearner to do the exam. This will give them a sense of what it feels like tophysically be in an exam situation.
• Give the learners exam tips like:� Read the questions carefully before you write.� Think before you write.� If you cannot answer a question try the next one. Don’t waste time on
something you know you cannot do. Come back to it later.� Read again what you have written if there is time.� Be confident!

1. Example of evaluating activities in a unit for formativeassessmentIn this section we will take you through an example of how to do formativeassessment of one unit in the Mathematical Literacy Guide. We will use Module2: Data, Unit Five: Bar Graphs as the example. In the example you will see howthe activities work towards the outcomes for that unit, how to record yourassessment, how to assess a journal, and how to give feedback on yourassessment.
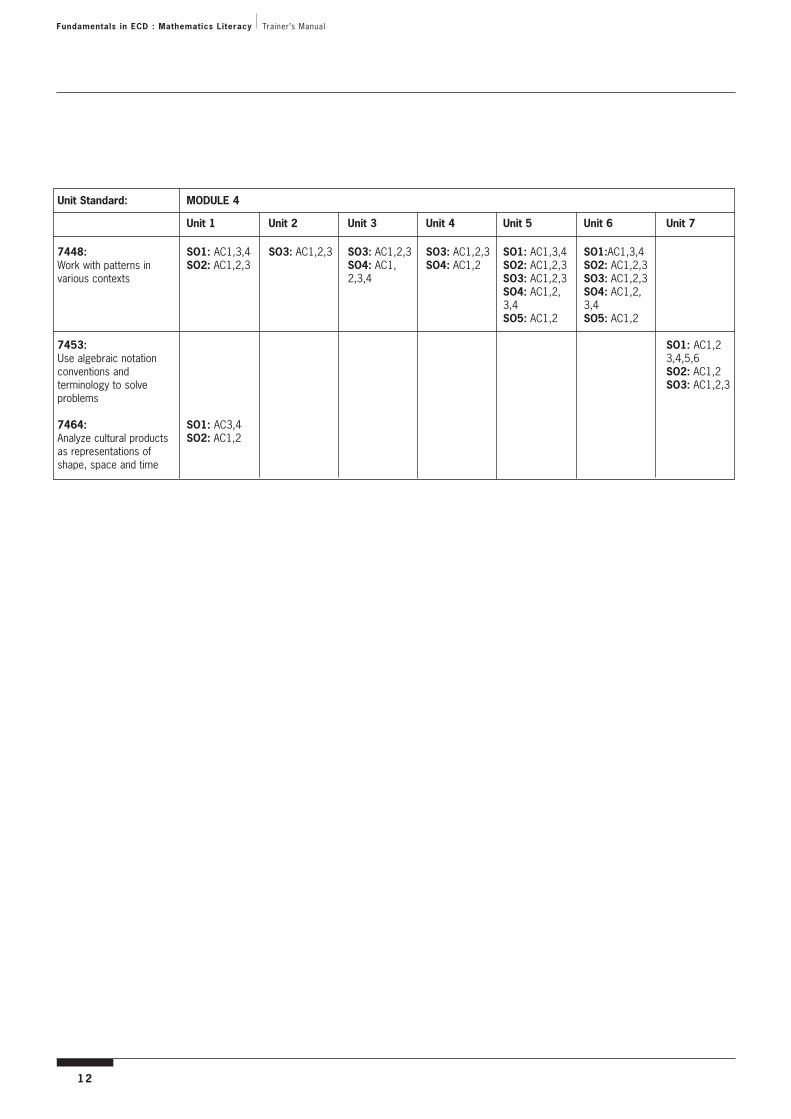
Assessment GridThe Assessment Grids on the next page show you how all the Specific Outcomesfrom all the Unit Standards are covered throughout the course.
To begin with, look at the Assessment Grid and identify the Unit Standards,Specific Outcomes and Assessment Criteria for Module 2 Unit 5. SO stands forSpecific Outcome and AC stands for Assessment Criteria.
Read the relevant Unit Standards and outcomes, either in your Trainer’s Manual,or in the formative assessment records at the end of this Assessment Guide. Makesure that you understand them well.
Fundamentals in ECD : Mathematics Literacy Trainer’s Manual
10
Fundamentals Assessment GuideSECTION THREE
ECD Fundamentals: Mathematical Literacy Unit Standard Grid
Unit Standard: MODULE 1
Unit 1 Unit 2 Unit 3 Unit 4 Unit 5 Unit 6 Unit 7 Unit 8 Unit 9 Unit 10
7449: SO3: SO1: SO1: SO2Critically analyze AC2 AC1, 2 AC1 AC1, 3how mathematics SO2: SO4: SO3:is used in social AC1, 2 AC3 AC1political and SO4: SO4:economic relations AC2, 3 AC1, 3
Additional Unit SO1: SO4: SO4: SO8: SO7: SO3: SO7: SO7: Standard AC1,2,3 AC1 AC1 AC1,2,3 AC2,3 AC3 AC1,3 AC1,37447: SO2: SO5: SO6: SO7: Work with numbers AC1,2,3, AC1,2,3 AC1,2 ,3 AC3in a variety of 4,5 SO6: contexts SO3: AC1,2 ,3
AC1,2,3SO4: AC1,2

Section Three: Fundamentals Assessment Guide
11
Unit Standard: MODULE 2
Unit 1 Unit 2 Unit 3 Unit 4 Unit 5 Unit 6 Unit 7 Unit 8 Unit 9
7449: SO3: SO2: SO2: SO4: SO1:Critically analyze AC3 AC1 AC3 AC2 AC1how mathematics SO3: SO3: SO2:is used in social AC3 AC3 AC2political and SO4: SO4: SO4:economic relations AC1,3 AC1 AC2
7451: SO1: SO2: SO1: SO2: AC2 SO2: AC2 SO2: SO2: SO1: AC4 SO4:Collect, analyze use AC1,2,3 AC2 AC5 SO3: AC1 SO3: AC2 AC2,3 SO2: AC2 AC5and communicate SO3: SO2: SO4: AC1, AC1,2 SO3: AC1 SO3: AC1,2 SO3: SO5:numerical data AC1 AC2,3 5,7 SO4: SO4: SO4: AC1,2 AC1,2,3
SO4: AC1,2,7 AC1,2,5,7 AC1,5,7 SO4: 4,5AC1, 7 AC1,2,3,
4,6,7
Unit Standard: MODULE 3
Unit 1 Unit 2 Unit 3 Unit 4 Unit 5 Unit 6 Unit 7 Unit 8 Unit 9 Unit 10 Unit 11 Unit 12
7450: SO2: SO2: SO1: SO1: SO1: SO1: SO1:Work with AC1,2 AC1,2 AC11,2,3 AC1,2,3 AC1,2,3 AC1,2,3 AC1,2,3measurement in a SO3: SO3: SO2: SO2: SO2: SO2: SO2:variety of contexts AC1,2,3 AC1,2,3 AC1,2,3 AC1,2,3 AC1,2,3 AC1,2,3 AC1,2,3
SO3: SO3: SO3: SO3: SO3:AC2 AC2 AC2 AC2 AC2
7461: SO1:Use maps to AC1,2,3access and 4,5,6,7communicate SO2:information AC1,2,3concerning routes, 4,5location and direction contexts
7463: SO2: SO1:Describe and AC3 AC1,2represent objects SO2:and the AC1,2environment in terms of shape, space, time and motion (2 credits)
7464: SO1: SO1: SO1: SO1: SO1:Analyze cultural AC2 AC1,2 AC1,2,4 AC2 AC3products as SO2: SO2: SO2:representations AC1,2 AC1 AC3of shape, space SO3:and time AC1,2,3
Fundamentals in ECD : Mathematics Literacy Trainer’s Manual
12
Unit Standard: MODULE 4
Unit 1 Unit 2 Unit 3 Unit 4 Unit 5 Unit 6 Unit 7
7448: SO1: AC1,3,4 SO3: AC1,2,3 SO3: AC1,2,3 SO3: AC1,2,3 SO1: AC1,3,4 SO1:AC1,3,4Work with patterns in SO2: AC1,2,3 SO4: AC1, SO4: AC1,2 SO2: AC1,2,3 SO2: AC1,2,3various contexts 2,3,4 SO3: AC1,2,3 SO3: AC1,2,3
SO4: AC1,2, SO4: AC1,2,3,4 3,4SO5: AC1,2 SO5: AC1,2
7453: SO1: AC1,2Use algebraic notation 3,4,5,6conventions and SO2: AC1,2terminology to solve SO3: AC1,2,3problems
7464: SO1: AC3,4Analyze cultural products SO2: AC1,2as representations of shape, space and time

MODULE TWOUnit Five: Bar Graphs
In this Unit you will address the following:
Unit Standard 7449:SO2Critically analyse the use of mathematical language and relationships in the economyS03Critically analyse how mathematics is used on social relations.
Unit Standard 7452: Collect, analyse and communicate numerical dataSO2Classify and analyse numerical data SO3Summarise and display organized numerical dataSO4Extract, interpret and critically evaluate informaiton from various forms of display
These are the outcomes that you will formatively assess in this unit. Youwill use one copy of the set of Formative Assessment Records per learnerto record your assessment. There is a blank set of these at the back of thisAssessment Guide. These records include the Assessment Criteria. TheAssessment Criteria will help you to decide what to look for when youassess. Remember to write the learners’ names on each of the records.
1. Bar graphs
Activity 1: Bar Graphs
This is a formative assessment activity that you can use to gaugewhat your learners already know and can do in relation to bar graphs.If this content is new to learners you will use it as a teaching activity.
Section Three: Fundamentals Assessment Guide
13

Fundamentals in ECD : Mathematics Literacy Trainer’s Manual
14
Look at how Sarah Setati, an imaginary learner, explained her answerto Question 6, when she reviewed which kind of graph, a bar graph ora pictograph, was better to use to display this particular set of data.
”I think the bar graph is better to use, because firstly it isquicker to draw, you don’t have to draw different pictures(which are hard to do).By using a simple scale, where oneblock stands for 10 learners, it makes it easier to count howmany learners used each of the different kinds of transport,without needing to draw pictures. In fact both were good, Isuppose, but the bar graph shows the information more easilyand clearly.
You can see that Sarah understands the difference between the twographs and has given a good explanation of how and why the bargraph is better to use.
Her trainer recorded the following in Sarah’s formative assessmentrecord:
Taxi
Train
Bus
Car
By Foot
Bicycle10
Scale= 10 learners1
20 30 40 50 60 70 80
Forms of transport used by learners to get to school

Section Three: Fundamentals Assessment Guide
15
Unit Standard 7451: Needs Achieved AchievedCollect, analyze, use and communicate numerical data Improvement WellSPECIFIC OUTCOMES AND ASSESSMENT CRITERIA1. Identify situations for investigation and data collection and collect numerical data.
• Situations for data collection are identified in terms of the purpose for data collection.• Appropriate methods are selected to collect data.• A variety of appropriate data collection methods are used to collect data from primary and
secondary sources. (Surveys, books, interviews, observations, tally sheets and questionnaires.)• The potential misuse of data achieved through the data collection method is described.• Reasons for and limitations of using sampling are described.
2. Classify and analyze numerical data. (Grouped and ungrouped data.)• Data is organized for meaningful analysis. (Classification, ordering, listing.)• Analytical tools are used correctly and appropriately to analyze the data. 31/3/2006
(Median, mean, modes, frequency, range.• The differences between and uses of mean, median and mode are described.
3. Summarize and display organized numerical data. (Graphs: pie, frequency polygon, histogram, simple bar graph, stem and leaf. Tables, basic tree diagrams.)• The form of display is appropriate to the data and context, and is justified in terms of its
appropriateness. • The scale is selected and used for a reasonable presentation of the data, and the scale is
justified in terms of its reasonableness. • Different forms of display are identified and evaluated in terms of their purposes.
4. Extract, interpret and critically evaluate information from various forms of display.(Graphs: pie, frequency polygon, histogram, simple bar graph, stem and leaf. Tables, basic tree diagrams.)• The information extracted from the display is consistent with the display. 31/3/2006• The information is interpreted to form informed opinions. 31/3/2006• Displays that distort information are identified and the manner in which they distort
information is described. • The effect of distortions in displays is described in terms of the impact on meaning in
social, socio-historical, political and economic contexts. • Projections or predictions are made in a manner that is consistent with the display.• The information is analyzed to determine and report on the validity of data collection methods, 31/3/2006
forms of display and projections that are made.• Communication of findings is clear, consistent with the display and makes 31/3/2006
use of accepted terminology. 5. Demonstrate understanding of the concept of chance and calculate simple probabilities.
(Limited to systematic counting strategies.)• Situations are identified in which chance arises. • Simple probabilities are determined. • Statements of chance are correctly interpreted. • The number of combinations and the probability of a particular event are determined.
Learner’s name: Sarah Setati

Activity 2: Drawing bar graphs
This is a formative assessment activity
Draw your graph on a separate paper so that you can put it in your portfolio.Don’t forget to include your questions too.
Work aloneThe parents at Bantwana Bami ECD Centre raised R3 000 to donate to the locallibrary to buy books for young children. The library staff wanted to buy booksthat most young children like to take out of the library. So they surveyed 200children and recorded the results in this table
Follow the steps above for drawing a vertical or horizontal bar graph. Draw eitherkind of graph to display this information. Make up some questions you can askabout the graph.
You can use the activity to assess if your learners understand the format ofa bar graph and can follow instructions to draw their own graphsaccurately and correctly. You can also check whether they are able to askpurposeful questions about the data.
For example, these are the questions that Sarah wrote about the graph.These showed her trainer that she had a good understanding of the kinds ofquestions that could be extracted from the data and the sorts of conclusionsthat could be made.
Books about insects 41
Fairy stories 17
Books about people 71
Books about animals 49
Counting books 22
Fundamentals in ECD : Mathematics Literacy Trainer’s Manual
16

Section Three: Fundamentals Assessment Guide
17
Questions 1. Which kind of book was most popular among the respondents whoanswered the survey?2. Which kind of books were the least popular among the children?3. How many more children preferred books about animals thancounting books? 4. How can you tell how many children were involved in the survey?5. Does the data reflect your own understanding of what kinds ofbooks the children you work with like to read? Explain.6. Discuss: How can the librarian use the information when sheorders books for her library?
The trainer gave Sarah the following verbal feedback:
Your questions are good and show that you understand the datathat was presented well and are able to pose questions thatencourage one to review the data, do calculations and think aboutthe findings. Well done Sarah!
In her records the trainer then entered a record of achievement against therelevant assessment criteria.

Fundamentals in ECD : Mathematics Literacy Trainer’s Manual
18
Unit Standard 7451: Needs Achieved AchievedCollect, analyze, use and communicate numerical data Improvement WellSPECIFIC OUTCOMES AND ASSESSMENT CRITERIA1. Identify situations for investigation and data collection and collect numerical data.
• Situations for data collection are identified in terms of the purpose for data collection.• Appropriate methods are selected to collect data.• A variety of appropriate data collection methods are used to collect data from primary and
secondary sources. (Surveys, books, interviews, observations, tally sheets and questionnaires.)• The potential misuse of data achieved through the data collection method is described.• Reasons for and limitations of using sampling are described.
2. Classify and analyze numerical data. (Grouped and ungrouped data.)• Data is organized for meaningful analysis. (Classification, ordering, listing.) 04/4/2006• Analytical tools are used correctly and appropriately to analyze the data. 31/3/2006
(Median, mean, modes, frequency, range.• The differences between and uses of mean, median and mode are described.
3. Summarize and display organized numerical data. (Graphs: pie, frequency polygon, histogram, simple bar graph, stem and leaf. Tables, basic tree diagrams.)• The form of display is appropriate to the data and context, and is justified in terms of its 04/4/2006
appropriateness. • The scale is selected and used for a reasonable presentation of the data, and the scale is 04/4/2006
justified in terms of its reasonableness. • Different forms of display are identified and evaluated in terms of their purposes.
4. Extract, interpret and critically evaluate information from various forms of display.(Graphs: pie, frequency polygon, histogram, simple bar graph, stem and leaf. Tables, basic tree diagrams.)• The information extracted from the display is consistent with the display. 31/3/2006
04/4/2006• The information is interpreted to form informed opinions. 31/3/2006
04/4/2006• Displays that distort information are identified and the manner in which they distort
information is described. • The effect of distortions in displays is described in terms of the impact on meaning in
social, socio-historical, political and economic contexts. • Projections or predictions are made in a manner that is consistent with the display.• The information is analyzed to determine and report on the validity of data collection methods, 31/3/2006
forms of display and projections that are made.• Communication of findings is clear, consistent with the display and makes 31/3/2006
use of accepted terminology. 04/4/20065. Demonstrate understanding of the concept of chance and calculate simple probabilities.
(Limited to systematic counting strategies.)• Situations are identified in which chance arises. • Simple probabilities are determined. • Statements of chance are correctly interpreted. • The number of combinations and the probability of a particular event are determined.
Learner’s name: Sarah Setati

Section Three: Fundamentals Assessment Guide
19
Activity 3: Double bar graphs
This is a teaching activity. It introduces a new concept that will require thetrainer to give support and offer mediation.
Activity 4: More double bar graphs
This activity is a continuation of the previous activity and is also to be usedas a teaching activity. As a trainer, you will be required to assist learnersin understanding how to interpret information presented in a double bargraph format – something we have assumed will be new to most learnersat this level. The questions also raise concepts covered by the other unitstandard that this unit covers, namely Unit Standard 7449: Criticallyanalyse how mathematics is used on social, political and economicrelations. It is the next activity, rather than this one, that will give you thechance to assess these formatively.
Activity 5: Drawing Double Bar Graphs
Work aloneWhat you need:• Squared paper• Pencil• Ruler
Draw your graph and answer the questions on a separate paper so that you can put itin your portfolio.
1. The following table shows the number of houses built in six developing areas from1992 to 2002.
2. Draw a double bar graph to illustrate this. Remember to give your graph a title, towork out your scale before you begin and to leave equal spaces between each set ofbars. One set of bars will represent the figures for 1992 and the other set willrepresent those for 2002.
Year Area
1992 479 680 500 195 48 232
2002 650 430 380 1 530 875 1965
Sunrise Newtown Goede Emfuleni Ikhusi FelotshegoPark Keur

3. Answer these questions about the information you have shown: a. Which area had the smallest number of houses built in 1992?b. Which area had the most houses built in 2002?c. Which area had fewer houses built in 2002 than in 1992?d. All the houses in this survey were built by government. Looking at these figures,
in which area do you think delivery was best in 2002? Give reasons.e. What is the difference between the number of houses built in Newtown in 2002
and those built in Felotshego in 2002?f. Would you say that conditions generally improved in the ten years between the
two sets of data? Write a short explanation to justify your argument. g. Write down some more things you found out from comparing the figures over the
10 year period.
This activity is a formative assessment activity where learners comparetwo sets of related data presented in a table and then represent them in adouble bar graph. Their ability to do this will depend on what they haveunderstood from working through the two previous activities, underguidance from the trainer. You can use the formative assessment record torecord how well learners have achieved the related assessment criteria.
Also give learners written or verbal feedback. This can relate both to theway they manage to draw the graphs and how they are able to answer thequestions that follow.
So for example in response to the way Sarah drew her double bar graph,this is what her trainer wrote next to her drawing:
I can see you have understood the format and purpose of usingdouble bar graphs well, Sarah. Here are some points to think aboutin future that will help you to improve your presentation: • Remember to label both your axes - you only labelled one of them • Your scale works, but it would have been easier to think of a
scale that takes up less space on your page. For example insteadof using 1:100, you can reduce the size of the graph by half if youuse a scale of 1:200.
• When you shade your bars make them two distinct shades orcolours. Your shades are almost the same, so it is sometimesdifficult to know which year you are referring to, without goingback to the table to check the figures.
Otherwise you are making good progress. Keep it up!
Fundamentals in ECD : Mathematics Literacy Trainer’s Manual
20

Section Three: Fundamentals Assessment Guide
21
Sarah then answered the questions that followed. The trainer was satisfiedwith her responses except in the case of questions f) and g).This is whatSarah wrote:
f) In some case the conditions improved, but in some casesthey did not.
In response the trainer responded in this way:
You are right Sarah, but you need to justify and back up youranswers in more detail. Remember the question said: ”Write a shortexplanation to justify your argument.” You did not do this. Youneed to follow up by saying, for example in the case of Emfuleni,Ikhusi and Felotshego the conditions improved dramatically; from195 to 1530, from 48 to 175 and from 232 to 1965, respectively. In thecase of Sunrise Park there was some improvement, but not as muchas the other three places. In the case of Newtown, there wasactually a decrease in the number of houses that were provided andthe figures dropped from 680 in 1992 to 430 in 2002.
This is what Sarah wrote in response to g) I found that in some cases things were better and in other casesthings were worse.
And her trainer wrote:Once again Sarah, you are correct in what you wrote. However, thequestion asks you to expand by giving examples to support yourposition. You might mention that government or other agencies givepositive reports on the work they are doing, using data to supportthis. But they often leave out examples where things have notimproved, but have instead declined.
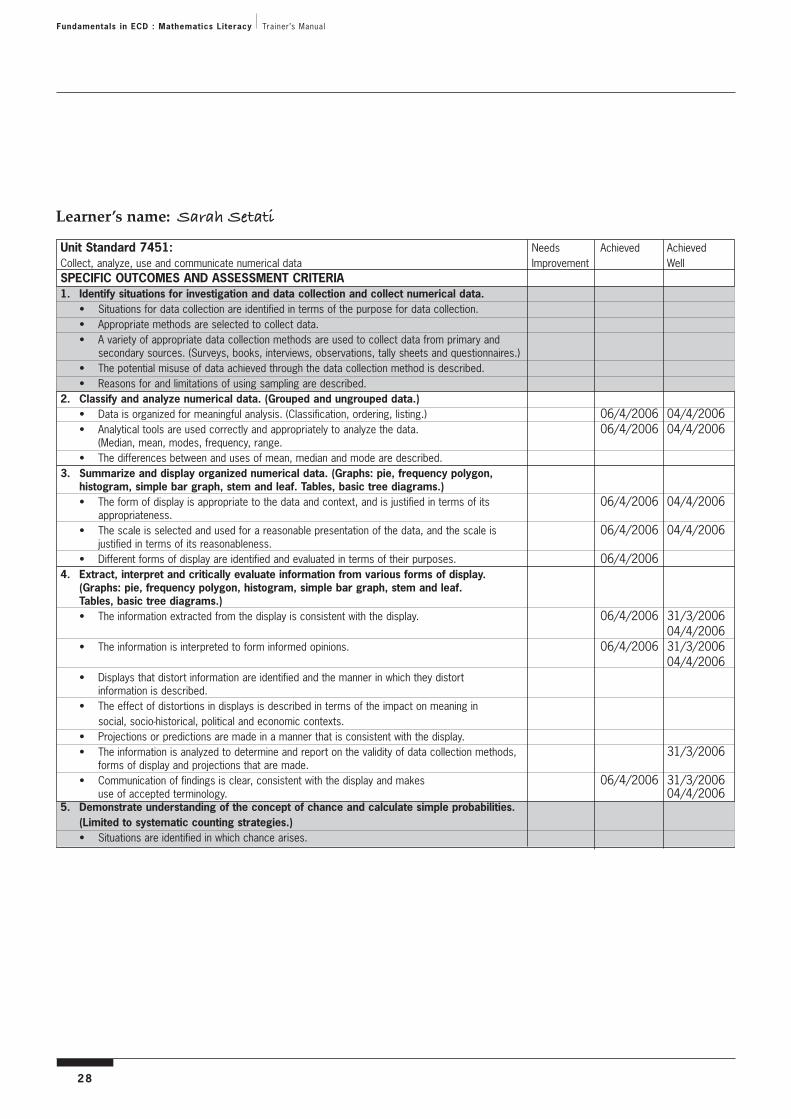
The trainer then used Sarah’s formative assessment records to record herskills and knowledge of the assessment criteria for this activity. Notice thather trainer recorded for both Unit standards this time. In relation to UnitStandard 7449, she decided that Sarah still needed to improve. In relationto Unit Standard 7451, she decided that she had shown achievement in thisactivity, but there were still points that could be improved such as herchoice of scale, and her labeling of the axes. So the trainer gave her a scoreof achieved, rather than achieved well.

Fundamentals in ECD : Mathematics Literacy Trainer’s Manual
22
Unit Standard 7451: Needs Achieved AchievedCollect, analyze, use and communicate numerical data Improvement WellSPECIFIC OUTCOMES AND ASSESSMENT CRITERIA1. Identify situations for investigation and data collection and collect numerical data.
• Situations for data collection are identified in terms of the purpose for data collection.• Appropriate methods are selected to collect data.• A variety of appropriate data collection methods are used to collect data from primary and
secondary sources. (Surveys, books, interviews, observations, tally sheets and questionnaires.)• The potential misuse of data achieved through the data collection method is described.• Reasons for and limitations of using sampling are described.
2. Classify and analyze numerical data. (Grouped and ungrouped data.)• Data is organized for meaningful analysis. (Classification, ordering, listing.) 06/4/2006 04/4/2006• Analytical tools are used correctly and appropriately to analyze the data. 06/4/2006 04/4/2006
(Median, mean, modes, frequency, range.• The differences between and uses of mean, median and mode are described.
3. Summarize and display organized numerical data. (Graphs: pie, frequency polygon, histogram, simple bar graph, stem and leaf. Tables, basic tree diagrams.)• The form of display is appropriate to the data and context, and is justified in terms of its 06/4/2006 04/4/2006
appropriateness. • The scale is selected and used for a reasonable presentation of the data, and the scale is 06/4/2006 04/4/2006
justified in terms of its reasonableness. • Different forms of display are identified and evaluated in terms of their purposes. 06/4/2006
4. Extract, interpret and critically evaluate information from various forms of display.(Graphs: pie, frequency polygon, histogram, simple bar graph, stem and leaf. Tables, basic tree diagrams.)• The information extracted from the display is consistent with the display. 06/4/2006 31/3/2006
04/4/2006• The information is interpreted to form informed opinions. 06/4/2006 31/3/2006
04/4/2006• Displays that distort information are identified and the manner in which they distort
information is described. • The effect of distortions in displays is described in terms of the impact on meaning in
social, socio-historical, political and economic contexts. • Projections or predictions are made in a manner that is consistent with the display.• The information is analyzed to determine and report on the validity of data collection methods, 31/3/2006
forms of display and projections that are made.• Communication of findings is clear, consistent with the display and makes 06/4/2006 31/3/2006
use of accepted terminology. 04/4/20065. Demonstrate understanding of the concept of chance and calculate simple probabilities.
(Limited to systematic counting strategies.)• Situations are identified in which chance arises.
Learner’s name: Sarah Setati

Section Three: Fundamentals Assessment Guide
23
Unit Standard 7449: Needs Achieved AchievedCritically analyze how mathematics is used in social, political and economic relations Improvement WellSPECIFIC OUTCOMES AND ASSESSMENT CRITERIA1. Critically analyze the use of mathematical language and relationships in the workplace.
(Wage negotiations, salary increases, and productivity as a ratio.)• The ways in which mathematics is used in the workplace are described. (Percentage,
graphs, differences, ratio and proportion.)• Ways in which mathematical relationships and language can be used to represent particular
perspectives are described. (Different forms of comparisons such as differences versus ratio. Manipulation of graphs through choice of graph, scale of axes and nature of axes. Use of different averages: mean, median, mode. More than one perspective is to be described.)
2. Critically analyze the use of mathematical language and relationships in the economy. (Budgeting, banks: interest rates, mortgage, service charges; fuel prices; pensions; inflation; value of the rand and exchange rates.)• The ways in which mathematics is used is described. (%, graphs, differences, ratio 6/4/2006 9/4/2006
and proportion.)• Ways in which mathematical relationships and language can be used to represent particular 6/4/2006 9/4/2006
perspectives are described. (Different forms of comparisons such as differences versus ratio.Manipulation of graphs through choice of graph, scale of axes and nature of axes. Use of different averages: mean, median, and mode. More than one perspective to be described.)
• The impact of economic changes on the individual is described. 6/4/2006 9/4/20063. Critically analyze the use of mathematics in social relations. (Social differentiation:
gender, social mobility, race; historical and possible future contexts, e.g. employment equity; apartheid policies.)• Ways in which mathematics can be used as a filter for social differentiation are described.
(Social differentiation includes examples such as entrance qualifications; number of women doing mathematics.)
• The significance attached to number by different societies is described. (Spiritual; superstitious; aesthetic; political.)
• The use of mathematics in the media is described. (Adverts, reports, sports.)4. Critically analyze use of mathematics & mathematical language & relationships in
political relations (Income distribution; census; elections; voting; opinion polls.)• The ways in which mathematics is used is described. (Percentage, graphs, differences, ratio
and proportion.)• Ways in which mathematical relationships and language can be used to represent particular
perspectives are described. (Different forms of comparisons such as differences versus ratio. Manipulation of graphs through choice of graph, scale of axes and nature of axes. Use of different averages: mean, median, and mode. More than one perspective to be described.)
• The impact of the use of mathematics in these contexts on individuals and social groups is described.
Learner’s name: Sarah Setati

Activity 6: Grouping data
This is a teaching activity introducing learners to a new concept ofgrouping data to display it more efficiently. It will require mediation andsupport by the trainer.
Activity 7: More about grouping data
Work alone
Do this activity on a separate paper so that you can put it in your portfolio. Don’t forgetto include your questions too.
1. Forty-five people between the ages of 18-30 were asked how many people theyknew who were ill or who had passed away of an HIV-Aids related illness. This wastheir response:
a. Find the range of numbers given i.e what was the lowest and highest number ofpeople that the respondents knew who were either ill or had passed away from HIVand Aids related illnesses.
b. Find the best way to group the data using intervals that cater for the full range offigures given. You also need to think about how much space you will need whendrawing a bar graph to show the information.
c. Draw a tally table showing the different numbers recorded. d. Draw a horizontal bar chart to illustrate the informatione. Make up questions that you could ask about the graph.f. Remember to label your axes and to give your graph a name.
0 12 52 0 6 12 32 10 8 24 12
24 32 30 7 20 49 26 8 0 4 19
23 10 28 6 10 0 18 34 8 12 24
31 18 0 64 19 22
Fundamentals in ECD : Mathematics Literacy Trainer’s Manual
24

Section Three: Fundamentals Assessment Guide
25
This is can be used as a formative assessment activity, and as a portfoliotask, depending on the achievements of the learners. You can use it to findout learners’ understanding of the concept of grouping data and to see ifthey can draw a horizontal bar graph (as shown in Activity 1). You willalso assess the kinds of questions that they ask based on the data.
Betty found the task difficult. One of her difficulties was that she grouped5 intervals in a group, ie 0-4; 5-9 etc. This made too many small groups. Itmeant that she had lots of different groups and found it difficult to fit allher groups into the available space. In Betty’s case, she will work onimproving this skill before she puts her work into her portfolio.
Sarah on the other hand completed the task well, and will be able to put herwork, and a copy of her formative assessment records, into her portfolio.
First she looked through the data and decided to make her groups bigger,from 0-9, because there was a very wide range of responses. She saw fromthis that if she made smaller intervals, it would be difficult to draw thegraph on the page. She organized her data in the following way:
0-9 10-19 20-29 30-39 40-49 50-59 60-69
12 11 7 4 1 0 1

Fundamentals in ECD : Mathematics Literacy Trainer’s Manual
26
Number of responses 60 – 69 50 – 59 40 – 49 30 – 39 20 – 29 10 – 19 0 – 9
1
2
3
4
5
6
7
8
9
10
11
12
Num
ber
of p
eopl
e na
med
by
each
gro
up
No. of people between ages of 18-30 who know of people who are ill or whohave died of HIV-Aids related illnesses.

Section Three: Fundamentals Assessment Guide
27
To help Betty with her problem, the trainer referred her to Sarah’s work andasked Sarah to explain to Betty how to find a better way to group the datain a more manageable way.
The trainer marked Sarah’s work and wrote the following comments in her book:Sarah, I see that you really understood this section very well.You first thought about the range of data you had to workwith. This helped you to group the data in the best possibleway. You organized your findings in a table and frequencychart very neatly and clearly. This made it easy for you totransfer this data into a bar graph. Your drawing of the bargraph was accurate. I can see you have really taken what youhave learnt from all the previous activities in the unit to helpyou do new tasks. Well done.
In response to Question 1e, Sarah wrote the following questions about her graph:
1. How many people were involved in the Survey altogether?
2. In which group were the most responses?
3. In which group were the fewest responses?
4. Is it true to say from the results of this survey that most people know of at
least 30 or more people who hare ill or who have died or Aids related illnesses?
5. If your answer to 4 was not an accurate statement, what would be a more
accurate statement to make?
6. What is the average number of people that this group of respondents
knew, that were ill or who had died from HIV-Aids related illnesses?
Write a short explanation to show how you calculated this.
7. Write down three important findings about HIV and Aids in our
community that you have learnt from working with this informaiton.
In response her trainer commented as follows: These are excellent questions Sarah. I can see you have reallylearnt how to ask meaningful questions about the data youworked with. You have taken the advice than I gave you abouthow to think more critically about the information you aregiven so that you can ask questions that are more searching.Well done, excellent progress.
The trainer then recorded Sarah’s performance on her formativeassessment record:
Fundamentals in ECD : Mathematics Literacy Trainer’s Manual
28
Unit Standard 7451: Needs Achieved AchievedCollect, analyze, use and communicate numerical data Improvement WellSPECIFIC OUTCOMES AND ASSESSMENT CRITERIA1. Identify situations for investigation and data collection and collect numerical data.
• Situations for data collection are identified in terms of the purpose for data collection.• Appropriate methods are selected to collect data.• A variety of appropriate data collection methods are used to collect data from primary and
secondary sources. (Surveys, books, interviews, observations, tally sheets and questionnaires.)• The potential misuse of data achieved through the data collection method is described.• Reasons for and limitations of using sampling are described.
2. Classify and analyze numerical data. (Grouped and ungrouped data.)• Data is organized for meaningful analysis. (Classification, ordering, listing.) 06/4/2006 04/4/2006• Analytical tools are used correctly and appropriately to analyze the data. 06/4/2006 04/4/2006
(Median, mean, modes, frequency, range.• The differences between and uses of mean, median and mode are described.
3. Summarize and display organized numerical data. (Graphs: pie, frequency polygon, histogram, simple bar graph, stem and leaf. Tables, basic tree diagrams.)• The form of display is appropriate to the data and context, and is justified in terms of its 06/4/2006 04/4/2006
appropriateness. • The scale is selected and used for a reasonable presentation of the data, and the scale is 06/4/2006 04/4/2006
justified in terms of its reasonableness. • Different forms of display are identified and evaluated in terms of their purposes. 06/4/2006
4. Extract, interpret and critically evaluate information from various forms of display.(Graphs: pie, frequency polygon, histogram, simple bar graph, stem and leaf. Tables, basic tree diagrams.)• The information extracted from the display is consistent with the display. 06/4/2006 31/3/2006
04/4/2006• The information is interpreted to form informed opinions. 06/4/2006 31/3/2006
04/4/2006• Displays that distort information are identified and the manner in which they distort
information is described. • The effect of distortions in displays is described in terms of the impact on meaning in
social, socio-historical, political and economic contexts. • Projections or predictions are made in a manner that is consistent with the display.• The information is analyzed to determine and report on the validity of data collection methods, 31/3/2006
forms of display and projections that are made.• Communication of findings is clear, consistent with the display and makes 06/4/2006 31/3/2006
use of accepted terminology. 04/4/20065. Demonstrate understanding of the concept of chance and calculate simple probabilities.
(Limited to systematic counting strategies.)• Situations are identified in which chance arises.
Learner’s name: Sarah Setati

Section Three: Fundamentals Assessment Guide
29
Unit Standard 7449: Needs Achieved AchievedCritically analyze how mathematics is used in social, political and economic relations Improvement WellSPECIFIC OUTCOMES AND ASSESSMENT CRITERIA1. Critically analyze the use of mathematical language and relationships in the workplace.
(Wage negotiations, salary increases, and productivity as a ratio.)• The ways in which mathematics is used in the workplace are described. (Percentage,
graphs, differences, ratio and proportion.)• Ways in which mathematical relationships and language can be used to represent particular
perspectives are described. (Different forms of comparisons such as differences versus ratio. Manipulation of graphs through choice of graph, scale of axes and nature of axes. Use of different averages: mean, median, mode. More than one perspective is to be described.)
2. Critically analyze the use of mathematical language and relationships in the economy. (Budgeting, banks: interest rates, mortgage, service charges; fuel prices; pensions; inflation; value of the rand and exchange rates.)• The ways in which mathematics is used is described. (%, graphs, differences, ratio 6/4/2006 9/4/2006
and proportion.)• Ways in which mathematical relationships and language can be used to represent particular 6/4/2006 9/4/2006
perspectives are described. (Different forms of comparisons such as differences versus ratio.Manipulation of graphs through choice of graph, scale of axes and nature of axes. Use of different averages: mean, median, and mode. More than one perspective to be described.)
• The impact of economic changes on the individual is described. 6/4/2006 9/4/20063. Critically analyze the use of mathematics in social relations. (Social differentiation:
gender, social mobility, race; historical and possible future contexts, e.g. employment equity; apartheid policies.)• Ways in which mathematics can be used as a filter for social differentiation are described.
(Social differentiation includes examples such as entrance qualifications; number of women doing mathematics.)
• The significance attached to number by different societies is described. (Spiritual; superstitious; aesthetic; political.)
• The use of mathematics in the media is described. (Adverts, reports, sports.)4. Critically analyze use of mathematics & mathematical language & relationships in
political relations (Income distribution; census; elections; voting; opinion polls.)• The ways in which mathematics is used is described. (Percentage, graphs, differences, ratio
and proportion.)• Ways in which mathematical relationships and language can be used to represent particular
perspectives are described. (Different forms of comparisons such as differences versus ratio. Manipulation of graphs through choice of graph, scale of axes and nature of axes. Use of different averages: mean, median, and mode. More than one perspective to be described.)
• The impact of the use of mathematics in these contexts on individuals and social groups is described.
Learner’s name: Sarah Setati

Journal ReflectionSpend time thinking about what you have learned. Write down all your thoughts, ideasand questions about your learning in your journal. Use these questions to guide you:
a. What did you learn about pictures and emotive words in advertising?b. Write down one or two questions that you still have about emotive words.c. How will you use what you learned in your everyday life and work?d. Will you change your way of working with children because of what you have
learned about emotive words and pictures? What will you change?
You will not necessarily have time to look at every single journal entry thatlearners make. But whenever possible, ask to read learners’ journals andgive them feedback about what they have written. Remember you are notreading the journals to assess your learners’ mathematical ability butrather to reflect on the process learners are going through and theirthoughts about their experiences of learning mathematics. You can usetheir reflections to help you identify areas where learners may need extraassistance.
This is an entry that Sarah made in her journal:
I feel I have developed a better understanding of different kindsof bar graphs from working through this unit. I also learned howto look for important things and ask good questions about thedifferent graphs. At first I was not sure about this, but with helpfrom my trainer I learned more as I went along. I think I cannow read graphs like these that one often sees in the newspapersand understand them better. I can also use some of these waysto capture data about my ECD Centre. Maybe I can evenintroduce my young learners to ways of building bar graphsusing concrete objects. I really found this unit interesting andchallenging. I also liked it when the trainer asked me to helpanother learner, Betty. This gave me confidence that I was on theright track. The trainer was so patient with me and gave me goodfeedback.
Fundamentals in ECD : Mathematics Literacy Trainer’s Manual
30
Section Three: Fundamentals Assessment Guide
31
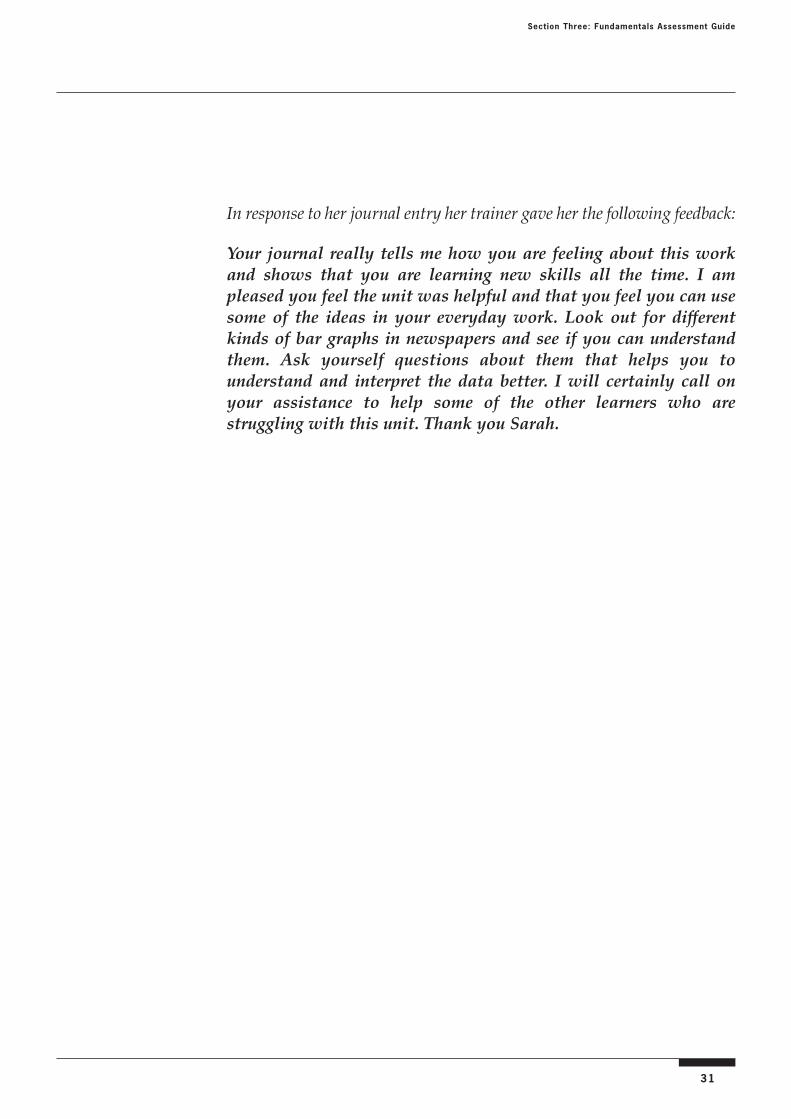
In response to her journal entry her trainer gave her the following feedback:
Your journal really tells me how you are feeling about this workand shows that you are learning new skills all the time. I ampleased you feel the unit was helpful and that you feel you can usesome of the ideas in your everyday work. Look out for differentkinds of bar graphs in newspapers and see if you can understandthem. Ask yourself questions about them that helps you tounderstand and interpret the data better. I will certainly call onyour assistance to help some of the other learners who arestruggling with this unit. Thank you Sarah.

Fundamentals in ECD : Mathematics Literacy Trainer’s Manual
32
Fundamentals Mathematical Literacy:Formative Assessment Records
Unit Standard 7451: Needs Achieved AchievedCollect, analyze, use and communicate numerical data Improvement WellSPECIFIC OUTCOMES AND ASSESSMENT CRITERIA1. Identify situations for investigation and data collection and collect numerical data.
• Situations for data collection are identified in terms of the purpose for data collection.• Appropriate methods are selected to collect data.• A variety of appropriate data collection methods are used to collect data from primary and
secondary sources. (Surveys, books, interviews, observations, tally sheets and questionnaires.)• The potential misuse of data achieved through the data collection method is described.• Reasons for and limitations of using sampling are described.
2. Classify and analyze numerical data. (Grouped and ungrouped data.)• Data is organized for meaningful analysis. (Classification, ordering, listing.)• Analytical tools are used correctly and appropriately to analyze the data.
(Median, mean, modes, frequency, range.• The differences between and uses of mean, median and mode are described.
3. Summarize and display organized numerical data. (Graphs: pie, frequency polygon, histogram, simple bar graph, stem and leaf. Tables, basic tree diagrams.)• The form of display is appropriate to the data and context, and is justified in terms of its
appropriateness. • The scale is selected and used for a reasonable presentation of the data, and the scale is
justified in terms of its reasonableness. • Different forms of display are identified and evaluated in terms of their purposes.
4. Extract, interpret and critically evaluate information from various forms of display.(Graphs: pie, frequency polygon, histogram, simple bar graph, stem and leaf. Tables, basic tree diagrams.)• The information extracted from the display is consistent with the display. • The information is interpreted to form informed opinions. • Displays that distort information are identified and the manner in which they distort
information is described. • The effect of distortions in displays is described in terms of the impact on meaning in
social, socio-historical, political and economic contexts. • Projections or predictions are made in a manner that is consistent with the display.• The information is analyzed to determine and report on the validity of data collection methods,
forms of display and projections that are made.• Communication of findings is clear, consistent with the display and makes
use of accepted terminology. 5. Demonstrate understanding of the concept of chance and calculate simple probabilities.
(Limited to systematic counting strategies.)• Situations are identified in which chance arises. • Simple probabilities are determined. • Statements of chance are correctly interpreted. • The number of combinations and the probability of a particular event are determined. • Probabilities are used to address simple real or simulated problems.
Learner’s name:

Fundamentals Mathematical Literacy: Formative Assessment Records
33
Unit Standard 7449: Needs Achieved AchievedCritically analyze how mathematics is used in social, political and economic relations Improvement WellSPECIFIC OUTCOMES AND ASSESSMENT CRITERIA1. Critically analyze the use of mathematical language and relationships in the workplace.
(Wage negotiations, salary increases, and productivity as a ratio.)• The ways in which mathematics is used in the workplace are described. (Percentage,
graphs, differences, ratio and proportion.)• Ways in which mathematical relationships and language can be used to represent particular
perspectives are described. (Different forms of comparisons such as differences versus ratio. Manipulation of graphs through choice of graph, scale of axes and nature of axes. Use of different averages: mean, median, mode. More than one perspective is to be described.)
2. Critically analyze the use of mathematical language and relationships in the economy. (Budgeting, banks: interest rates, mortgage, service charges; fuel prices; pensions; inflation; value of the rand and exchange rates.)• The ways in which mathematics is used is described. (%, graphs, differences, ratio
and proportion.)• Ways in which mathematical relationships and language can be used to represent particular
perspectives are described. (Different forms of comparisons such as differences versus ratio.Manipulation of graphs through choice of graph, scale of axes and nature of axes. Use of different averages: mean, median, and mode. More than one perspective to be described.)
• The impact of economic changes on the individual is described. 3. Critically analyze the use of mathematics in social relations. (Social differentiation:
gender, social mobility, race; historical and possible future contexts, e.g. employment equity; apartheid policies.)• Ways in which mathematics can be used as a filter for social differentiation are described.
(Social differentiation includes examples such as entrance qualifications; number of women doing mathematics.)
• The significance attached to number by different societies is described. (Spiritual; superstitious; aesthetic; political.)
• The use of mathematics in the media is described. (Adverts, reports, sports.)4. Critically analyze use of mathematics & mathematical language & relationships in
political relations (Income distribution; census; elections; voting; opinion polls.)• The ways in which mathematics is used is described. (Percentage, graphs, differences, ratio
and proportion.)• Ways in which mathematical relationships and language can be used to represent particular
perspectives are described. (Different forms of comparisons such as differences versus ratio. Manipulation of graphs through choice of graph, scale of axes and nature of axes. Use of different averages: mean, median, and mode. More than one perspective to be described.)
• The impact of the use of mathematics in these contexts on individuals and social groups is described.
Learner’s name:

Fundamentals in ECD : Mathematics Literacy Trainer’s Manual
34
Unit Standard 7463: Needs Achieved AchievedDescribe and represent objects and the environment in terms of shape, space, time and motion Improvement WellSPECIFIC OUTCOMES AND ASSESSMENT CRITERIA1. Describe and represent the position and change in position of an object in space.
(Words, rough sketches and abstract representation on a Cartesian plane.)• The positions of objects are described in relation to each other using graphs and sketches
and written or verbal descriptions. • The positions of objects are represented correctly on a Cartesian plane. • The change of position of objects in terms of the relationship between space and time is described. • Tessellations are identified.
2. Illustrate changes in size & shape of appearance of objects as result of changes in orientation. • The perception of the changes in an object is described from different observational
points. (3-dimensional objects and 2-dimensional representations of 3-dimensional objects.)• 3-dimensional objects are represented in 2 dimensions in such a way that the size and
shape of the object are correctly represented. • The relationships between surface area and volume are described.
Learner’s name:

Fundamentals Mathematical Literacy: Formative Assessment Records
35
Unit Standard 7453: Needs Achieved AchievedUse algebraic notation, conventions and terminology to solve problems Improvement WellSPECIFIC OUTCOMES AND ASSESSMENT CRITERIA1. Form and use algebraic equations and inequalities to represent and solve problems.
(Simple linear equations and inequalities.)• The problem is represented completely through equations or inequalities, which are
consistent with the problem. • The concepts of equations and inequalities are explained. • Situations requiring the use of equations as opposed to inequalities, and vice versa,
are identified. • Algebraic rotation, conventions and terminology are used correctly. • The solution is correct in terms of the problem context. • The solution is verified through substitution or other verification processes.
2. Manipulate algebraic expressions to find equivalent forms. (Common factors, products and grouping using associative, distributive and commutative properties.)• The manipulated form is equivalent to the original form. (The original expression is manipulated
to achieve at least two different forms.)3. Select and use algebraic formulae to solve problems. (Substitution into any formula,
solve for one variable, supplied formulae from any context.)• The correct formula is selected in terms of the problem context.• The formula is applied correctly to obtain a valid solution. • Units are used correctly. • The correct formula is selected in terms of the problem context.• The formula is applied correctly to obtain a valid solution.
Learner’s name:

Fundamentals in ECD : Mathematics Literacy Trainer’s Manual
36
Unit Standard 7461: Needs Achieved AchievedUse maps to access and communicate information concerning routes, location and direction Improvement WellSPECIFIC OUTCOMES AND ASSESSMENT CRITERIA1. Read, interpret and use maps, to depict and make sense of real locations,
distances and position (Street maps: local and national maps.)• Objects are identified on a map.• The positions of objects on a map are given using reference points on a grid. • A variety of routes between two points on a map are identified and described. • Appropriate routes are identified and selected to meet the requirements of a variety of
circumstances. • Real distances between points on a map are determined correctly in accordance with the scale. • Landmarks are used to give direction in real life, and these landmarks are identified and
located on a map. • Directions are given correctly using maps and in real life. (Bearing and the four
compass points.)2. Draw maps according to scale. (Non-contoured maps.)
• Maps are drawn such that the relative positions of places and objects match the real situation.• A suitable scale is chosen, indicated and applied correctly. • Symbols used conform to conventional uses or are defined through a key or legend. • The map is clear and neat and contains all critical information as required by the situation. • Maps are converted from one scale to another.
Learner’s name:

Fundamentals Mathematical Literacy: Formative Assessment Records
37
Unit Standard 7450: Needs Achieved AchievedWork with measurement in a variety of contexts Improvement WellSPECIFIC OUTCOMES AND ASSESSMENT CRITERIA1. Apply relationships between common quantities in various contexts. (Mass and
weight, distance and displacement, speed and velocity, volume and density, volume and surface area, area and perimeter, distance and time, volume and capacity.)• Terms are used in the proper context.• Comparisons between quantities are made and differences and relationships described. • Formulae and units are described in context to show the relationships and differences.
2. Use measuring instruments to measure and calculate quantities in various contexts. (Quantities include all of: length, distance, mass, time, temperature, volumes of regular prisms, perimeter, area, weight, surface area, density, displacement and angles. Measuring instruments include all of: rulers, tape measures, scale, clocks, thermometers, capacity measuring instruments, and protractors.)• Measuring instruments are used correctly. • Readings are recorded and reported within the margin of error as limited by the instrument
and as is appropriate within the context. • Measuring instruments are chosen to comply with the accuracy requirements of the context.
3. Solve measurement problems in various contexts. (Practical and non-practical processes, trigonometric right-angled heights and distances.)• Solutions are correct within margins of error allowed within the context. • Units are used correctly. • Methods and solutions are justified.
Learner’s name:

Fundamentals in ECD : Mathematics Literacy Trainer’s Manual
38
Unit Standard 7448: Needs Achieved AchievedWork with patterns in various contexts Improvement WellSPECIFIC OUTCOMES AND ASSESSMENT CRITERIA1. Recognize, identify and describe patterns in various contexts. (Numeric, geometric,
patterns from a variety of contexts.)• Patterns are recognized in terms of the relationship between the elements of the pattern. • Patterns are correctly identified in terms of the relationship between the elements of the pattern. • Patterns are correctly described in terms of the relationship between the elements of the
pattern and remain consistent through the pattern. • The language of comparison is appropriate and describes the relationship between the
elements of the pattern. 2. Complete, extend and generate patterns in a variety of contexts. (Numeric,
geometric, patterns from a variety of contexts.)• Completed patterns are internally consistent with respect to the relationship between
elements of the pattern. • The extension is consistent with respect to the relationship between elements of the pattern. • Generated patterns are internally consistent.
3. Devise processes for a general rule. (Processes include: systematic counting, sequencing numbers, tables, drawings, pictures, classification, organized lists, mathematical and models such as graphs.)• Appropriate processes are devised according to the context. • Processes have potential to lead to a general rule. • A general rule is devised such that it is consistent with the relationship of the
elements of the patterns. 4. Represent patterns using different generalized mathematical forms. (Graphs,
formulae, expressions and other rules for expressing patterns.)• Appropriate mathematical forms are used to represent patterns. • The representation is consistent with relationships within the pattern and represents
the pattern completely. • Conversions are made between various forms of representations. • Relationships between various possible forms of representations are described.
5. Use general rules to generate patterns. (Processes include: systematic counting, sequencing numbers, tables, drawings, pictures, classification, organized lists, mathematical models such as graphs.)• Patterns generated are consistent with the general rule. • Patterns are generated to the extent that they enable the rule to be devised from the pattern.
Learner’s name:

Fundamentals Mathematical Literacy: Formative Assessment Records
39
Unit Standard 7447: Needs Achieved AchievedWorking with numbers in various contexts Improvement WellSPECIFIC OUTCOMES AND ASSESSMENT CRITERIA1. Express and interpret a range of contexts using mathematical symbols and find
applications for numerical models. (Everyday problems, numerical contexts. Numerical models include equations, expressions and terms.)• Mathematical sentences reflect the situation completely and accurately. (Everyday problems,
numerical contexts. Numerical models include equations, expressions and terms.)• The form of expression is appropriate to the context. • Application for given numerical models are developed such that the meaning of symbols and
relationships between them are clarified. 2. Solve a range of everyday problems using estimation and calculations.
(Rounding off and truncating, with or without calculator, combination, separation, comparison, equalisation, sharing and grouping.)• Problem solving strategies are based on a correct interpretation of the problem situation. • Estimates can be justified within context. • Calculations are performed accurately. • Calculations follow some form of logical reasoning process, which is presented clearly. • Solutions are correct in terms of the context.
3. Verify and justify solutions within different contexts. (Solutions derived by learners and by others.)• The reasoning process is explained clearly. • Solutions are justified in terms of the context. (Appropriate and inappropriate solutions.)• Solutions are shown to be consistent with estimations and vice versa.
4. Perform operations on simple and complex numerical expressions. (Four basic operations in all combinations. Expressions involving exponents that can be calculated without a calculator. Operations to be performed with and without a calculator.)• Operations are performed according to the conventions governing the order of operations. • Solutions are correct.
5. Describe and compare counting systems from different cultures. (Own, African culture other than own, one other.)• Numbers are translated from one base system to another. (Base 2, 5, 10, and 16.)• Descriptions show understanding of how counting systems developed and their significance. • Descriptions show examples of how the systems might have been used, and the limitations
of the system. 6. Critically analyze the development of the base ten number system. (Place value,
role of 0 in our number system, patterned nature of whole numbers, history and contestations.)• The development and significance of zero is explained. • Understanding of the place value of numbers is demonstrated. (Expansion of numbers in
different ways, the value of a numerical symbol in a number.)• The patterned nature of whole numbers and its historical development are described. • The contestations around, and use and popularisation of the decimal number system are
described. (Uses in economics and politics.)7. Analyze the relationship between rational and whole numbers.
• Demonstrations describe the increasing density of the system. • The properties of whole numbers and rational numbers are given.
8. Analyze the relationship between rational numbers and integers. • Demonstrations describe the increasing density of the system. • Demonstrations show that whole numbers are a subset of rational numbers. • The properties of whole numbers and rational numbers are given.
Learner’s name:
Fundamentals in ECD : Mathematics Literacy Trainer’s Manual
40
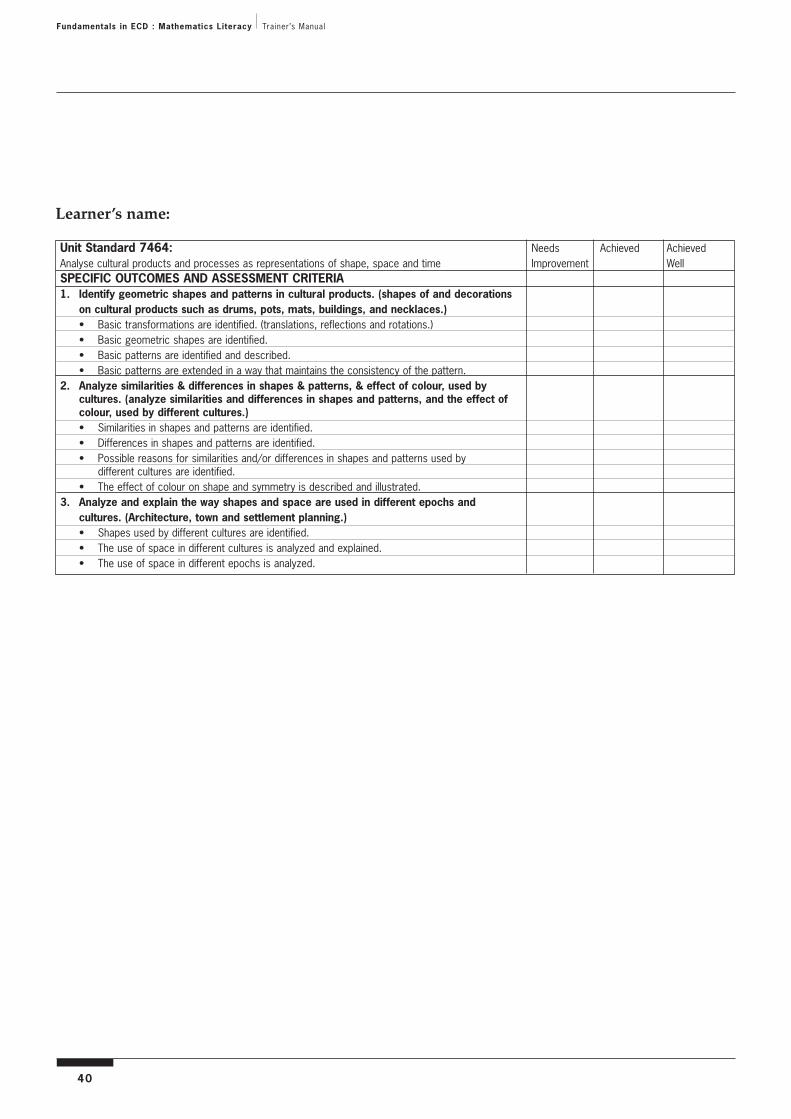
Unit Standard 7464: Needs Achieved AchievedAnalyse cultural products and processes as representations of shape, space and time Improvement WellSPECIFIC OUTCOMES AND ASSESSMENT CRITERIA1. Identify geometric shapes and patterns in cultural products. (shapes of and decorations
on cultural products such as drums, pots, mats, buildings, and necklaces.)• Basic transformations are identified. (translations, reflections and rotations.)• Basic geometric shapes are identified. • Basic patterns are identified and described. • Basic patterns are extended in a way that maintains the consistency of the pattern.
2. Analyze similarities & differences in shapes & patterns, & effect of colour, used by cultures. (analyze similarities and differences in shapes and patterns, and the effect of colour, used by different cultures.) • Similarities in shapes and patterns are identified.• Differences in shapes and patterns are identified. • Possible reasons for similarities and/or differences in shapes and patterns used by
different cultures are identified. • The effect of colour on shape and symmetry is described and illustrated.
3. Analyze and explain the way shapes and space are used in different epochs and cultures. (Architecture, town and settlement planning.)• Shapes used by different cultures are identified. • The use of space in different cultures is analyzed and explained. • The use of space in different epochs is analyzed.
Learner’s name:

Fundamentals Mathematical Literacy: Formative Assessment Records
41


