Fundamental factors and stock returns: evidence from Asian stock markets Dazhi Zheng* West Chester University Thomas C. Chiang Drexel University This version: January 15, 2016 Abstract This paper examines the relation between fundamental factors and stock returns of 9 Asian markets (Japan, China, South Korea, Hong Kong, Taiwan, Singapore, Indonesia, Malaysia, and Thailand). Following Fama and French (1993, 2015), we form the market risk premium, size, B/M, profitability, investment, momentum, P/E, and dividend yields factors for each market. The empirical results suggest that the eight-factor model that includes all above fundamentals can better explain the variations of stock returns than the original Fama-French three-factor model. By replacing local fundamental factors with international factors, we find that the model with local factors outperforms the models with international factors. In addition, the evidence reveals that the eight-factor model can better explain stock returns when market is under stress. When we test the relation between the fundamental factors and industry portfolio stock returns, the results suggest that portfolio returns of different industries are associated with different sets of fundamental factors. JEL Classification: G12, G15, G01 Keywords: Fama-French three-factor model, Fama-French five-factor model, stock fundamentals Asset pricing model, International stock markets, ___________________________________________________________ *corresponding author; Tel.: +1 610 430 4635; fax: +1 610 436 2592
Transcript
Fundamental factors and stock returns: evidence from Asian stock markets
Dazhi Zheng*
West Chester University
Thomas C. Chiang
Drexel University
This version: January 15, 2016
Abstract
This paper examines the relation between fundamental factors and stock returns of 9 Asian
markets (Japan, China, South Korea, Hong Kong, Taiwan, Singapore, Indonesia, Malaysia, and
Thailand). Following Fama and French (1993, 2015), we form the market risk premium, size,
B/M, profitability, investment, momentum, P/E, and dividend yields factors for each market. The
empirical results suggest that the eight-factor model that includes all above fundamentals can
better explain the variations of stock returns than the original Fama-French three-factor model.
By replacing local fundamental factors with international factors, we find that the model with
local factors outperforms the models with international factors. In addition, the evidence reveals
that the eight-factor model can better explain stock returns when market is under stress. When
we test the relation between the fundamental factors and industry portfolio stock returns, the
results suggest that portfolio returns of different industries are associated with different sets of
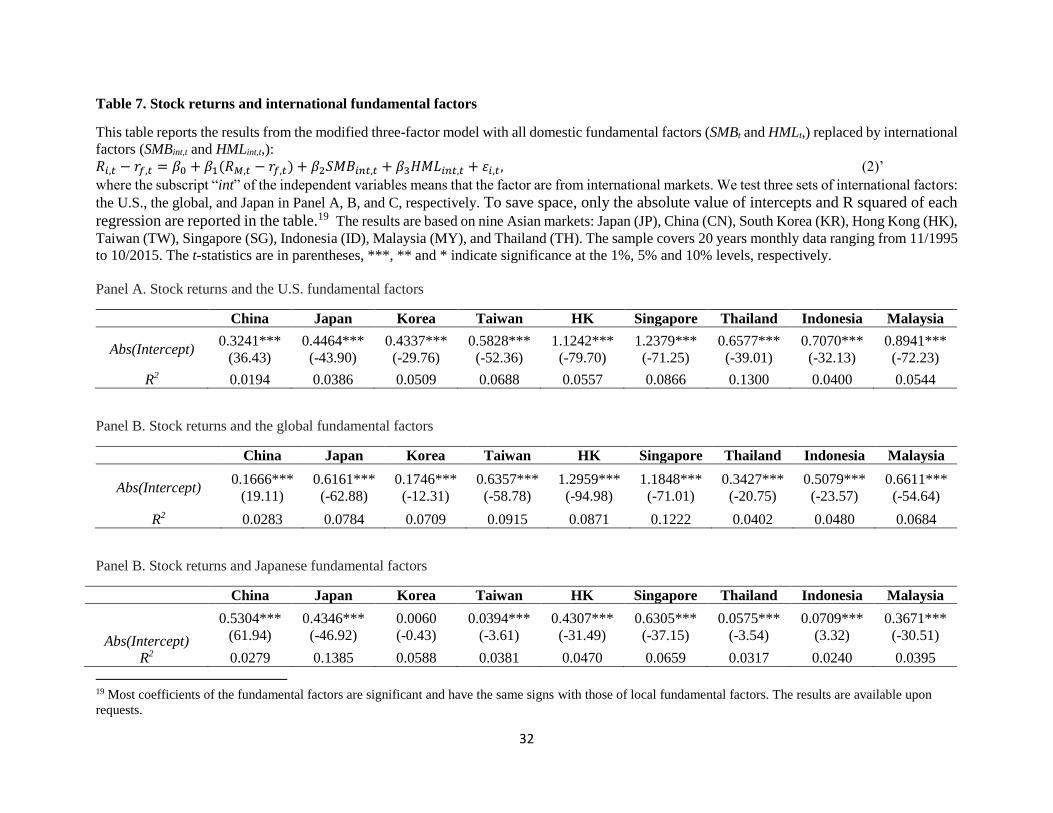
where the subscript “int” of the independent variables means that the factor is from international
markets. We test three sets of international factors: the U.S. fundamental factors, the global
fundamental factors, and Japanese fundamental factors. The results are shown in Table 7.
[Table 7]
Panel A of Table 7 contains the results with U.S. size and B/M as independent variables, Panel
B contains the results with global fundamental variables, and Panel C contains the results with
Japanese fundamental variables. To save space, only the absolute value of intercepts and R squared
of each regression are reported in the table.9 The results are consistent with the findings from Fama
and French (2012) that the models with international fundamental factors underperform the models
with local fundamental factors in explaining stock returns in Asian markets, as the R squared in
all equations in Table 7 are much smaller to those in corresponding markets in Table 3, while the
intercepts are generally larger in Table 7 than those in corresponding markets of Table 3. However,
there are also some interesting points: almost all markets’ R squared (except for Thailand) in Panel
B are larger than those in Panel A and Panel C, indicating that global fundamental factors have
stronger power in explaining stock returns in Asian stock markets than the fundamentals from the
U.S. and Japan. When we compare the R squared in Panel A and Panel C, the results suggest that
Japanese fundamentals have stronger power (larger R squared) in explaining stock returns in larger
stock markets (China, Japan, and Korea), while the U.S. fundamentals have stronger power ((larger
R squared)) in explaining stock returns in smaller stock markets (Taiwan, Hong Kong, Singapore,
Indonesia, and Malaysia). Our findings are in line with those from Rouwenhorst (1999) and
Harvey (1995).
9 Most coefficients of the fundamental factors are significant and have the same signs with those of local
fundamental factors. The results are available upon requests.
16
4.6. Eight-factor model under different market conditions
The existing literature documents that that risk factors are elevated during recessions (Lundblad,
2007 and Connolly et al., 2005) in explaining stock returns. Investors also tend to avoid risky
assets and behave differently under extreme market conditions. 10 Thus, it is of interest to
investigate whether under extreme market conditions, such as financial crises, the parametric
estimates of the relationship between fundamental factors and stock returns could alter.
We define three crisis periods in our sample’s time range: the first is the Asian financial crisis,
ranging from July 1997 to August 1998; the second is the dot com bubble crashes, ranging from
March 2000 to March 2001; and the third is the recent global financial crisis, ranging from July
2007 to June 2009. We then divide the whole sample into two group, the crisis and the non-crisis,
and re-run the complete model 4 for each data group.
[Table 8]
The results are reported in Table 8 Panel A. To save space, only the absolute value of intercepts
and R squared of each regression are reported in the table.11 There are sharp differences of the
estimated intercepts and R squared between the regressions of crisis and non-crisis data groups.
First, the estimated R squared of the regressions of the crisis data group are much larger than those
of the non-crisis data group for all nine Asian markets. Second, the absolute value of the intercepts
of the regressions for the crisis data group are also much larger than those for the non-crisis data
group for 8 out of 9 Asian markets (except for Thailand). The findings suggest that the eight-factor
model can better explain the variations of stock returns in all Asian markets under crisis periods.
10 For example, according to Chiang and Zheng (2010), investors are more likely to herd during periods of
financial crisis. 11 Most coefficients of the fundamental factors are significant and have the same signs with those of from Table 6.
The results are available upon requests.
17
However, the larger absolute value of intercepts also indicates that there are more pricing factors
affect stock returns in those Asian markets under crisis periods, which may point out a future
research direction.
To further investigate the relation between the fundamental factors and stock returns in Asian
stock markets under different market conditions. We divide the whole sample into two groups
according to the domestic market returns. Specifically, when the local market return is positive we
define it as the up market and when it is negative we define it as the down market. We then re-run
the complete model 4 for each data group.
The results are reported in Table 8 Panel B, and are consistent with our findings from the crisis
vs. non-crisis comparison that the estimated R squared of the regressions of the down market data
group are larger than those of the up market data group for all nine Asian markets. However,
there’s no obvious pattern when we compare the intercepts of these two groups.
In summary. Our proposed eight-factor model can better explain the variations of stock returns
in all Asian markets when local market is under stress (under crisis periods or down market) than
when the market is not under stress (non-crisis periods or up market). However, when the market
is under stress, more pricing factors may need to be included in the asset pricing model.
4.7. Fundamentals and industry portfolios
Fama and French three-factor and five factor models have been applied to explain portfolio
returns such as microcap stock portfolios, megacap stock portfolios, value stock portfolios, and
growth stock portfolios (Fama and French (1993, 2012, 2015)). However, much fewer attempts
18
have been made to examine industry portfolio returns.12 To examine the relation between the
industry portfolio returns and the fundamental factors, we form ten industry stock portfolios for
each market according to the industry classification of Thomson Reuters Datastream.13 We then
combine the same industry portfolio of all the nine Asian stock markets together to form ten
industry portfolio data groups. We finally analyze the ten industry portfolio data groups with our
complete model 4.
The estimated results are reported in Table 9. The regressions’ R squared ranges from 0.22
(Telecom industry) to 0.33 (utility industry), indicating that the eight-factor model we proposed
can explain the return of industry portfolios very well. Especially for Oil & Gas industry and Utility
industry, both intercepts are not rejected from zero. However, on the other hand, the coefficients
of some fundamental factors are not significant anymore. Specifically, SMBt for Consumer
Services industry, HMLt for Oil & Gas industry, RMWt for Oil & Gas and Consumer Services, and
Utility industries, WMLt, for Oil & Gas industry, OMUt for Health Care, Financial, and Technology
industries, and IMNt for Oil & Gas industry and Consumer Services industry. The coefficients of
investment factor CMAt are only significant for Basic materials, Industrials, and Consumer Goods
industries.
The evidence suggests that even in general fundamental factors can explain the variation of
industry portfolio returns, portfolio returns of different industries are associated with different sets
of fundamental factors. Especially the investment factor has no explanatory power for 7 out of 10
12 A few studies such as Fama and French (1997), Hou,and Robinson (2006), and Hu (2007), among others, apply
the three-factor model to explain industry portfolio returns. However, their works are mostly focus on the U.S.
markets. 13 The 10 industry sectors are Oil and Gas, Basic Materials, Industrials, Consumer Goods, Consumer Services,
Health Care, Telecommunications, Utilities, Financials, and Technology by level-2 industry classification from
Datastream.
19
industry portfolios and only size and P/E factors have significant impact on Oil & Gas industry
returns. The reason on the differences among industries requires further investigations.
[Table 9]
5. Conclusion
Fama and French (1992, 1993) propose a three-factor asset pricing model and argue that besides
the market risk premium, size and book-to-market ratio are also important pricing factors in
explaining stock returns. Since then, the three-factor models have been widely adopted in empirical
asset pricing studies. In Fama and French (2015), the authors extend the original model to a five-
factor model that include the additional profitability and investment factors and argue that the five-
factor model can better explain the variation of stock returns than the original three-factor model.
Inspired by their works, this study tends to examine the relation between the fundamental factors
and stock returns in nine Asian markets: Japan, China, South Korea, Hong Kong, Taiwan,
Singapore, Indonesia, Malaysia, and Thailand. Furthermore, follow the findings of Lakonishok, et
al. (1994), Chan et al. (1991), Jegadeesh and Titman (1993), and Carhart (1997), among others,
we incorporate the momentum, P/E, and dividend yield factors in the five-factor model framework
and test which factor(s) are better in explaining stock returns for the nine Asian markets. In
addition, this study also tests the relation between the fundamental factors and stock returns under
different market conditions and the relation between the fundamental factors and industry portfolio
returns.
The empirical results from the three-factor model suggest that the size and B/M factor are
significant in explaining stock returns in Asian markets, and the signs of the factors’ coefficients
are consistent with the findings from Fama and French (1993) in the U.S. stock market. The
empirical results from the five-factor model suggest that the profitability and investment factors
20
also have significant impact on stock returns for Asian markets, and by including these two factors,
the effect of the B/M factor on stock returns is weakened, which is consistent with Fama and
French (2015) as well. However, the signs of the coefficients of profitability and investment factors
are mixed, indicating that the profitability premium and the investment premium don’t generally
exist in Asian stock markets.
When we replace the B/M factor with our proposed momentum, P/E, and dividend yield factors
for the three-factor model, the results show that these three fundamental factors also have
significant impact on stock returns in Asian markets, so they should not be excluded from the asset
pricing model. Therefore, we build a complete eight-factor model to explain the variations of stock
returns in Asian stock markets. The eight factors include the market risk premium, size, B/M,
profitability, investment, momentum, P/E, and dividend yield factors. The estimation results from
the complete model show that it is better than the models with only a subset of fundamental
variables in explaining the variations of stock returns in Asian stock markets, especially for larger
markets.
To test whether local information or international information have stronger impact on stock
returns in Asian markets, we replace the local size and B/M factors in the original three-factor
model with international factors. Three sets of international factors are used: the U.S. fundamental
factors, the global fundamental factors, and Japanese fundamental factors. The results reveal that
local factors model outperforms all three models with international factors. Among the three sets
of international factors, the global factors have the strongest power in explaining Asian markets
stock returns. The U.S. factors are better in explaining small size Asian markets stock returns,
while the Japanese factors are better in explaining large size Asian markets stock returns.
21
The tests of our proposed eight-factor model under different market conditions suggest that the
model can better explain the variations of stock returns in all Asian markets when local market is
under stress (under crisis periods or down market) than when the market is not under stress (non-
crisis periods or up market). However, when the market is under stress, more pricing factors may
need to be included in the asset pricing model.
When we test the relation between the fundamental factors and industry portfolio stock returns,
the evidence suggests that even in general fundamental factors can explain the variation of industry
portfolio returns for Asian stock markets, portfolio returns of different industries are associated
with different sets of fundamental factors. Especially the investment factor has no explanatory
power for 7 out of 10 industry portfolios and only size and P/E factors have significant impact on
Oil & Gas industry returns.
22
References
Banz, R. W. (1981). The relationship between return and market value of common
stocks. Journal of financial economics, 9(1), 3-18.
Carhart, M. M. (1997). On persistence in mutual fund performance. The Journal of
finance, 52(1), 57-82.
Chan, L. K., Hamao, Y., & Lakonishok, J. (1991). Fundamentals and stock returns in Japan. The
Journal of Finance, 46(5), 1739-1764.
Chiang, T. C., Zheng, D., 2010. An empirical analysis of herd behavior in global stock markets.
Journal of Banking and Finance 34, 1911-1921.
Chui, A. C., & Wei, K. J. (1998). Book-to-market, firm size, and the turn-of-the-year effect:
Evidence from Pacific-Basin emerging markets. Pacific-Basin finance journal, 6(3), 275-293.
Connor, G., & Sehgal, S. (2001). Tests of the Fama and French model in India.
Connolly, R. A., Stivers, C. T., Sun, L., 2005. Stock market uncertainty and the stock-bond
return relation. Journal of Financial and Quantitative Analysis 40, 161-194.
Connolly, R.A., Wang, F.A., 2003, International equity market comovements: Economic
fundamentals or contagion? Pacific-Basin Finance Journal 11, 23-43.
Fama, E. F., & French, K. R. (1992). The cross‐section of expected stock returns. the Journal of
Finance, 47(2), 427-465.
Fama, E. F., & French, K. R. (1993). Common risk factors in the returns on stocks and
bonds. Journal of financial economics, 33(1), 3-56.
Fama, E. F., & French, K. R. (1997). Industry costs of equity. Journal of financial
economics, 43(2), 153-193.
Fama, E. F., & French, K. R. (2012). Size, value, and momentum in international stock
returns. Journal of financial economics, 105(3), 457-472.
Goriaev, A. (2004). Risk factors in the Russian stock market. Emerging Market Review, 2(1), 67-
89.
Griffin, J. M., 2002. Are the Fama and French factors global or country specific? Review
of Financial Studies 15, 783-803.
Hameed, A., & Kusnadi, Y. (2002). Momentum strategies: Evidence from Pacific Basin stock
markets. Journal of financial research, 25(3), 383-397.
Harvey, C. R. (1995). Predictable risk and returns in emerging markets.Review of Financial
studies, 8(3), 773-816.
Hou, K., & Robinson, D. T. (2006). Industry concentration and average stock returns. The
Journal of Finance, 61(4), 1927-1956.
23
Hu, O. (2007). Applicability of the Fama-French three-factor model in forecasting portfolio
returns. Journal of financial research, 30(1), 111-127.
Iqbal, J., & Brooks, R. (2007). Alternative beta risk estimators and asset pricing tests in
emerging markets: The case of Pakistan. Journal of Multinational Financial Management, 17(1),
75-93.
Jegadeesh, N., & Titman, S. (1993). Returns to buying winners and selling losers: Implications
for stock market efficiency. The Journal of finance,48(1), 65-91.
Lakonishok, J., Shleifer, A., & Vishny, R. W. (1994). Contrarian investment, extrapolation, and
risk. The journal of finance, 49(5), 1541-1578.
Lundblad, C., 2007. The risk return tradeoff in the long run: 1836-2003. Journal of Financial
Economics 85, 123-150.
Novy-Marx, R. (2013). The other side of value: The gross profitability premium. Journal of
Financial Economics, 108(1), 1-28.
Rouwenhorst, K. G. (1999). Local return factors and turnover in emerging stock markets. The
Journal of Finance, 54(4), 1439-1464.
Titman, S., Wei, K. C., & Xie, F. (2004). Capital investments and stock returns. Journal of
financial and Quantitative Analysis, 39(04), 677-700.
24
Table 1. Construction of size, B/M, profitability, investment, P/E, and D/Y factors
This table illustrate how stocks are sorted to form portfolios. for each market the size factor SMBt is the average return on the two small stock
portfolios minus the average return on the two large stock portfolios (2 X 2 sorts three-factor model), the average return on the six small stock
portfolios minus the average return on the six large stock portfolios (2 X 2 sorts five-factor model) and the average return on the twelve small stock
portfolios minus the average return on the twelve large stock portfolios (2 X 2 sorts eight-factor model). The value factors HML t (same for RMWt,
CMAt, WMLt, OMUt, and IMNt variables) are calculated as the average return on the two high B/M portfolios minus the average return on the two
low B/M portfolios (2 X 2 sorts) or the average return on the three high B/M portfolios minus the average return on the three low B/M portfolios (2
X 3 sorts).14 The factors are SMBt (small minus big), HML t (high minus low B/M), RMWt (robust minus weak OP), and CMAt (conservative minus
aggressive Inv), OMUt, (overvalued minus undervalued), and IMNt (income minus non-income).
Sort Breakpoints Factors and their components
2X2 sorts on Size
and B/M,
Size: 50% median SMB=(SH+SL)/2-(BH+BL)/2
B/M: 50% median HML=(SH+BH)/2-(SL+BL)/2=[(SH-SL)+(BH-BL)]/2
2X2 sorts on Size
and B/M, or Size
and OP, or Size
and Inv
Size: 50% median SMB=(SH+SL+SR+SW+SC+SA)/6-(BH+BL+BR+BW+BC+BA)/6
B/M: 50% median HML=(SH+BH)/2-(SL+BL)/2=[(SH-SL)+(BH-BL)]/2
OP: 50% median RMW=(SR+BR)/2-(SW+BW)/2=[(SR-SW)+(BR-BW)]/2
Inv: 50% median CMA=(SC+BC)/2-(SA+BA)/2=[(SC-SA)+(BC-BA)]/2
2X2 sorts on Size
and B/M, or Size
and OP, Size and
Inv, Size and
MOM, Size and
P/E, or Size and
DY
Size: 50% median SMB=(SH+SL+SR+SW+SC+SA)/6-(BH+BL+BR+BW+BC+BA)/6
B/M: 50% median HML=(SH+BH)/2-(SL+BL)/2=[(SH-SL)+(BH-BL)]/2
OP: 50% median RMW=(SR+BR)/2-(SW+BW)/2=[(SR-SW)+(BR-BW)]/2
Inv: 50% median CMA=(SC+BC)/2-(SA+BA)/2=[(SC-SA)+(BC-BA)]/2
MOM: 50% median WML=(SW+BW)/2-(SL+BL)/2=[(SW-SL)+(BW-BL)]/2
P/E: 50% median OMU=(SO+BO)/2-(SU+BU)/2=[(SO-SU)+(BO-BU)]/2 DY: 50% median IMN=(SI+BI)/2-(SN+BN)/2=[(SI-SN)+(BI-BN)]/2
14 The empirical analysis of this paper are all based on 2 X 2 sorts portfolios, the results are similar with those based on 2 X 3 sorts portfolios and available upon
This table presents the mean and standard deviation values of the eight independent variables used in our models for nine Asian markets: Japan
(JP), China (CN), South Korea (KR), Hong Kong (HK), Taiwan (TW), Singapore (SG), Indonesia (ID), Malaysia (MY), and Thailand (TH).
Values are calculated from twenty years monthly data ranging from 11/1995 to 10/2015. All stock and stock index returns are calculated as 𝑅𝑡 =100 × (log(𝑃𝑡) − log (𝑃𝑡−1)), where 𝑃𝑡 denotes either the individual stock price or the stock market index.
Mkt_returnt SMBt HMLt RMWt CMAt WMLt OMUt IMNt
China
MEAN 0.6083 0.7345 0.3714 0.3341 -0.0499 -0.2025 -0.2459 0.1081
where 𝑅𝑖,𝑡 is the monthly return for stock i in month t and 𝑟𝑓,𝑡 is the risk free rate.15 On the right hand side of the model, 𝑅𝑀,𝑡 is the return of the
equal-weight (EW) market portfolio. SMBt and HMLt, represent the return difference between the small size stock portfolio and the large size stock
portfolio, and between the high book-to-market (B/M) equity stock portfolio and the low B/M stock portfolio. The results are based on nine Asian
markets: Japan (JP), China (CN), South Korea (KR), Hong Kong (HK), Taiwan (TW), Singapore (SG), Indonesia (ID), Malaysia (MY), and
Thailand (TH). The sample covers 20 years monthly data ranging from 11/1995 to 10/2015. The t-statistics are in parentheses, ***, ** and *
indicate significance at the 1%, 5% and 10% levels, respectively.
China Japan Korea Taiwan HK Singapore Thailand Indonesia Malaysia
where 𝑅𝑖,𝑡 is the monthly return for stock i in month t and 𝑟𝑓,𝑡 is the risk free rate.16 On the right hand side of the model, 𝑅𝑀,𝑡 is the return of the
equal-weight (EW) market portfolio. SMBt and HMLt, represent the return difference between the small size stock portfolio and the large size stock
portfolio, and between the high book-to-market (B/M) equity stock portfolio and the low B/M stock portfolio. RMWt and CMAt represent the
profitability and investment factors, and they are defined as the return difference between the robust profitability stock portfolio and the weak
profitability stock portfolio, and between the conservative (low investment) stock portfolio and the aggressive (high investment) stock portfolio,
respectively. Profitability is measured as EBIT divided by sales, and investment is the change in total assets from year t-2 to t-1. The results are
based on nine Asian markets: Japan (JP), China (CN), South Korea (KR), Hong Kong (HK), Taiwan (TW), Singapore (SG), Indonesia (ID), Malaysia
(MY), and Thailand (TH). The sample covers 20 years monthly data ranging from 11/1995 to 10/2015. The t-statistics are in parentheses, ***, **
and * indicate significance at the 1%, 5% and 10% levels, respectively.
China Japan Korea Taiwan HK Singapore Thailand Indonesia Malaysia
where 𝑅𝑖,𝑡 is the monthly return for stock i in month t and 𝑟𝑓,𝑡 is the risk free rate.17 On the right hand side of the model, 𝑅𝑀,𝑡 is the return of the
equal-weight (EW) market portfolio. SMBt and HMLt, represent the return difference between the small size stock portfolio and the large size stock
portfolio, and between the high book-to-market (B/M) equity stock portfolio and the low B/M stock portfolio. WMLt, OMUt, and IMNt represent the
return difference between the winner stock portfolio and the loser stock portfolio, between the overvalued stock portfolio (high P/E) minus the
undervalued stock portfolio (low P/E), and between the income stock portfolio (high dividend yield) minus the non-income stock portfolio (low
dividend yield), respectively. The results are based on nine Asian markets: Japan (JP), China (CN), South Korea (KR), Hong Kong (HK), Taiwan
(TW), Singapore (SG), Indonesia (ID), Malaysia (MY), and Thailand (TH). The sample covers 20 years monthly data ranging from 11/1995 to
10/2015. The t-statistics are in parentheses, ***, ** and * indicate significance at the 1%, 5% and 10% levels, respectively.
China Japan Korea Taiwan HK Singapore Thailand Indonesia Malaysia
where 𝑅𝑖,𝑡 is the monthly return for stock i in month t and 𝑟𝑓,𝑡 is the risk free rate.18 On the right hand side of the model, 𝑅𝑀,𝑡 is the return of the
equal-weight (EW) market portfolio. SMBt and HMLt, represent the return difference between the small size stock portfolio and the large size stock
portfolio, and between the high book-to-market (B/M) equity stock portfolio and the low B/M stock portfolio. RMWt and CMAt represent the
profitability and investment factors, and they are defined as the return difference between the robust profitability stock portfolio and the weak
profitability stock portfolio, and between the conservative (low investment) stock portfolio and the aggressive (high investment) stock portfolio,
respectively. WMLt, OMUt, and IMNt represent the return difference between the winner stock portfolio and the loser stock portfolio, between the
overvalued stock portfolio (high P/E) minus the undervalued stock portfolio (low P/E), and between the income stock portfolio (high dividend yield)
minus the non-income stock portfolio (low dividend yield), respectively. The results are based on nine Asian markets: Japan (JP), China (CN), South
Korea (KR), Hong Kong (HK), Taiwan (TW), Singapore (SG), Indonesia (ID), Malaysia (MY), and Thailand (TH). The sample covers 20 years
monthly data ranging from 11/1995 to 10/2015. The t-statistics are in parentheses, ***, ** and * indicate significance at the 1%, 5% and 10% levels,
respectively.
China Japan Korea Taiwan HK Singapore Thailand Indonesia Malaysia
Intercept -0.1081***
(-14.18)
-0.0600***
(-5.82)
-0.1122***
(-7.63)
-0.1279***
(-12.86)
-0.0636***
(-4.68)
-0.3688***
(-19.49)
-0.2748***
(-15.98)
-0.2422***
(-11.12)
-0.3690***
(-28.11)
Mkt_returnt 0.9927***
(1216.25)
0.8069***
(373.52)
1.0498***
(607.76)
1.1315***
(600.60)
0.9894***
(415.19)
0.8983***
(319.34)
0.9587***
(256.55)
0.9740***
(273.41)
1.0220***
(553.66)
SMBt 0.1432***
(37.11)
0.0918***
(17.97)
0.1524***
(34.39)
0.0724***
(14.65)
0.0042
(0.91)
0.1242***
(18.86)
0.0879***
(13.99)
0.0949***
(13.05)
0.2806***
(59.53)
HMLt 0.0100**
(2.02)
-0.0312***
(-4.86)
0.1940***
(31.06)
-0.0457***
(-12.17)
0.0537***
(8.59)
0.1339***
(15.01)
0.0758***
(10.44)
0.1231***
(16.32)
0.2393***
(34.95)
RMWt -0.0473***
(-8.70)
0.1422***
(21.88)
-0.0570***
(-7.80)
-0.0817***
(-13.79)
0.0004
(0.05)
0.1969***
(21.20)
0.0484***
(6.43)
-0.1743***
(-24.99)
-0.0773***
(-11.65)
CMAt 0.0516***
(7.80)
-0.3741***
(-51.95)
0.0318***
(6.46)
0.1635***
(23.00)
0.1010***
(13.12)
-0.0982***
(-10.50)
0.0056
(0.73)
-0.0619***
(-10.05)
0.1054***
(11.98)
WMLt 0.0156***
(3.95)
-0.0284***
(-5.90)
0.1035***
(22.36)
-0.1782***
(-44.87)
0.0271***
(5.89)
-0.0994***
(-17.04)
-0.0378***
(-8.25)
0.0022
(0.34)
0.0947***
(20.40)
18 We use one month U.S. T-bill rate as the risk free rate.
where the subscript “int” of the independent variables means that the factor are from international markets. We test three sets of international factors:
the U.S., the global, and Japan in Panel A, B, and C, respectively. To save space, only the absolute value of intercepts and R squared of each
regression are reported in the table.19 The results are based on nine Asian markets: Japan (JP), China (CN), South Korea (KR), Hong Kong (HK),
Taiwan (TW), Singapore (SG), Indonesia (ID), Malaysia (MY), and Thailand (TH). The sample covers 20 years monthly data ranging from 11/1995
to 10/2015. The t-statistics are in parentheses, ***, ** and * indicate significance at the 1%, 5% and 10% levels, respectively.
Panel A. Stock returns and the U.S. fundamental factors
China Japan Korea Taiwan HK Singapore Thailand Indonesia Malaysia
19 Most coefficients of the fundamental factors are significant and have the same signs with those of local fundamental factors. The results are available upon
requests.
33
Table 8. Stock returns and fundamental factors under different market conditions
This table reports the results from the following complete eight-factor model under different market condition:
20 Most coefficients of the fundamental factors are significant and have the same signs with those of local fundamental factors. The results are available upon
requests.
34
Panel B. Down vs. up markets
China Japan Korea Taiwan HK Singapore Thailand Indonesia Malaysia
21 We use one month U.S. T-bill rate as the risk free rate. 22 The 10 industry sectors are Oil and Gas, Basic Materials, Industrials, Consumer Goods, Consumer Services, Health Care, Telecommunications, Utilities,
Financials, and Technology by level-2 industry classification from Datastream. 23 Japan (JP), China (CN), South Korea (KR), Hong Kong (HK), Taiwan (TW), Singapore (SG), Indonesia (ID), Malaysia (MY), and Thailand (TH).