46
Fundamentals of Energy Markets Dr. Dionysios Polemis Department of Maritime Studies University of Piraeus

Fundamentals of Energy Markets
Dr. Dionysios PolemisDepartment of Maritime Studies University of Piraeus

Fundamentals of Energy Markets
Seminar I
Text book: Commodity Trade & Finance, Michael n. tamvakis, informa
Sources: Key World statistics 2015, International energy agency.
Article: Oil & fuel markets are not the same, Adam czyzewski ,
https://adamczyzewski.blogactiv.eu/2015/07/28/oil-and-fuel-markets-are-not-the-same/

Today’s agenda
Introduction: Energy Commodities
Measurement Units of Energy Commodities
Oil Market
LNG Market
Coal Market
Q+A

Introduction
• The aim of this lecture is to familiarize participants with energy commodities by elaborating on the economics of demand for and supply of, exhaustible energy resources.
• The role of cross-substitutability of alternative energy resources will also be examined

Measurement
• There are several standard units to measure energy
• BTUs, Therms, Calories and Joules
• When transport logistics come in the picture, volume & weight measurement units are such more relevant than calorific units.• In most sources of energy statistics, energy resources are quoted in
metric tonnes.• However, a tonne of oil doesn’t produce the same energy as a tonne
of coal or a tonne of gas.• It is therefore customary to quote energy resources in “equivalent”
units.• “tonnes of oil equivalent’ (toe)• Previously it was “tonnes of coal equivalent” (tce)
• When measuring natural gas, it is more common to use cubic meters or cubic feet, however toe is still used.


Demand for energy
• The need for energy commodities is relatively recent.
• The widespread use of hydrocarbons in all aspects of economic activity, energy commodities are closely linked with a nation’s development and transition from agriculture based to industrialized one. • A very good example of this is China, which has
transformed itself into the worlds’ powerhouse.

Source: Key World Statistics 2015

Source: Key World Statistics 2015

Figure 1• Notice the fundamental change in the relationship between World GDP
and Energy Consumption after 1980.
• The price of oil plotted reveals the effect of major price shocks on energy consumption.
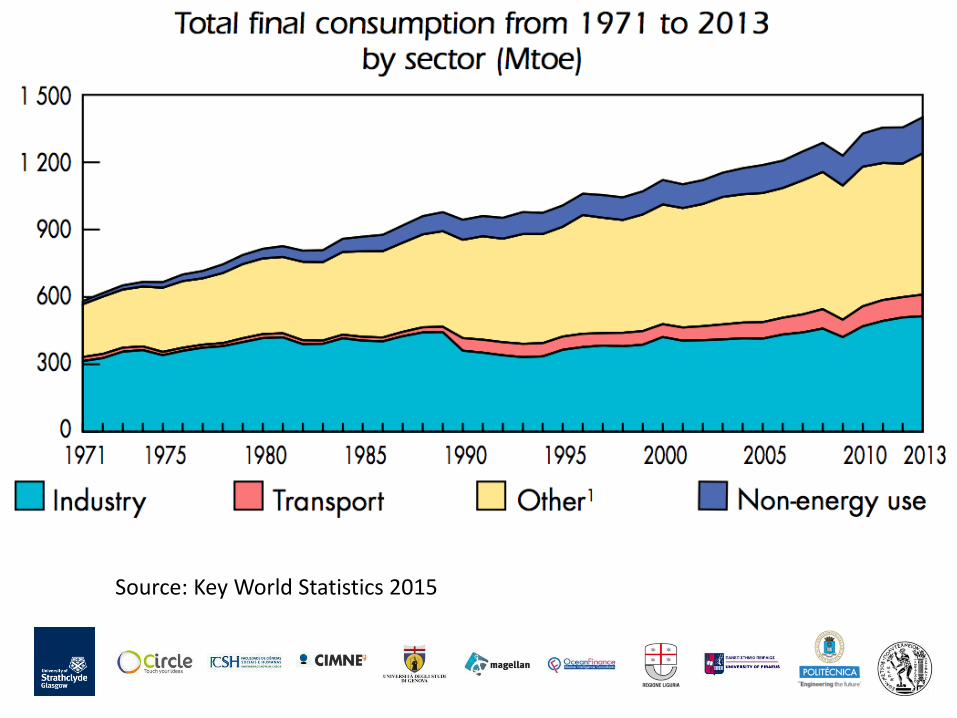
• Primary energy consumption is usually classified into four (4) categories:• Industrial• Transport• Other (residential & agriculture)• Residual (all non-energy uses)

Source: Key World Statistics 2015
Supply of energy• Energy commodities fall in the category of exhaustible resources.
• The economic theory behind for the exploitation of non-renewable natural resources was Hotelling (1929).
• “ Each additional unit of a natural resource will be extracted, as long as, the economic cost of extraction (marginal + User) is lower or equal to the price paid for the resource plus the marginal utility of present consumption” Tamvakis (2007)

Long – run average total cost curve

Source: Key World Statistics 2015
Source: Key World Statistics 2015

Source: Key World Statistics 2015

Source: Key World Statistics 2015
Source: Key World Statistics 2015

Source: Key World Statistics 2015
Capital outlay of an oil project• For any given project, there are three main stages:
1. Exploration• Geographical surveys implemented, indicate areas that there is high probability to the
existence of oil reserves (this search may take years)• Several exploratory wells /shafts probably will be drilled to assess the quality and quantity
of the reserve.• This stage can be very costly
2. Development • Stands for the extensive drilling
• Costs here are also high in order to improve or extent output
3. Production • The latter costs are mainly operating, which tent to increase as reserves are been
depleted and more intense labor is required to extract them.• Energy projects are capital intensive and enhance a substantial amount of risk, therefore
the have high rate of discount.• The discount rate not only considers the so-called ‘time value of money’, but also the risk or
uncertainty of future cash flows, thus greater the uncertainty, the higher the discount rate.
Oil Pricing• After the collapse of OPEC prices in the mid-1980s, there was a move
towards market related pricing.• The introduction of Crude oil• Netback pricing
• The price of Crude oil is based upon the price of processed oil and oil products
• Oil derivative market• The need for transparent pricing and reporting
• In our days there are several reporting agencies, e.g Platt’s.• Prices are quoted instantly for Brent and other crudes• Agencies report Hi/Low prices & differences between the highest offer to
buy (known as bid) and the lowest offer to sell (known as ask)• Some Crudes are prices as differentials from few ‘benchmark’ crudes (e.g,
Brent & WTI)• The daily settlement price is calculated by considering the most liquid
forward month and the quotations for other forward months and dated deals.

Oil & Fuel markets are not the same• According to Adam Czyzywski (28/07/2015)
• Fuels (such as naphtha, diesel oil, and heavy fuel oil) are commodities and, in common with crude oil, their prices are quoted (or determined) on global commodity markets.
•
• Although fuels are derived from crude oil, they form separate markets, because they are completely different commodities used for very different things
•
• Fuel markets are also unlike one another, with gasoline markets behaving differently than diesel oil markets, because the two commodities have different applications.
• Thus, due to certain supply and demand factors characteristic of these two very distinct commodities, the prices oil and fuels often move in opposite directions.
• Diesel oil is the primary fuel for heavy transport, where its competitor and closest alternative is LNG, rather than gasoline.
• Gasoline, on the other hand, is used for light transport and as a fuel in petrochemical production, where its main rival is natural gas.
•
• https://adamczyzewski.blogactiv.eu

Oil & Fuel markets are not the same
• Refiners buy crude oil at market prices, crack it into fuel products, which they sell at prices also dictated by the market. • The differential between the price of benchmark crude (Brent in our case)
and petroleum products extracted from it (e.g. gasoline or diesel oil) is called crack spread.
• A refinery could not ask a price for its fuel products above the market price, because no one would buy them. It could not sell them cheaper, either, because that would be unacceptable to shareholders.
• Links between oil and fuel products do exist, of course, and the global refining industry’s cost curve is their conceptual illustration• The cost curve determines the crack spread which depends on the refining
technology used. For a given oil price level, this margin determines the floor price of fuels below which the least efficient refineries on the market begin to run at a loss.
• https://adamczyzewski.blogactiv.eu

Natural Gas• Natural gas is considered to be the newest of hydrocarbons and the future
energy source for at least the medium term.
• During the last two decades there was an impressive growth due to the discovery of several reserves, field production and development.
• There is also a high demand for gas consumption• Holds the second place behind coal as a source of primary energy• Gas formation is similar to that of oil• At greater depths there are higher probabilities of finding fields which contain almost pure
methane.
• There are “conventional” and “non-conventional” gas reserves
Natural Gas
• Natural gas can be measured in different ways:• The most common measure for trading purposes are the
measurement units cubic feet or cubic meter (cf/cm)• Gas reserves are quoted in trillions cubic feet or meters
(tcf/tcm)• Finally, for consumption purposes is measured in therms or
BTU’s, in order to reflect the amount of energy consumed.
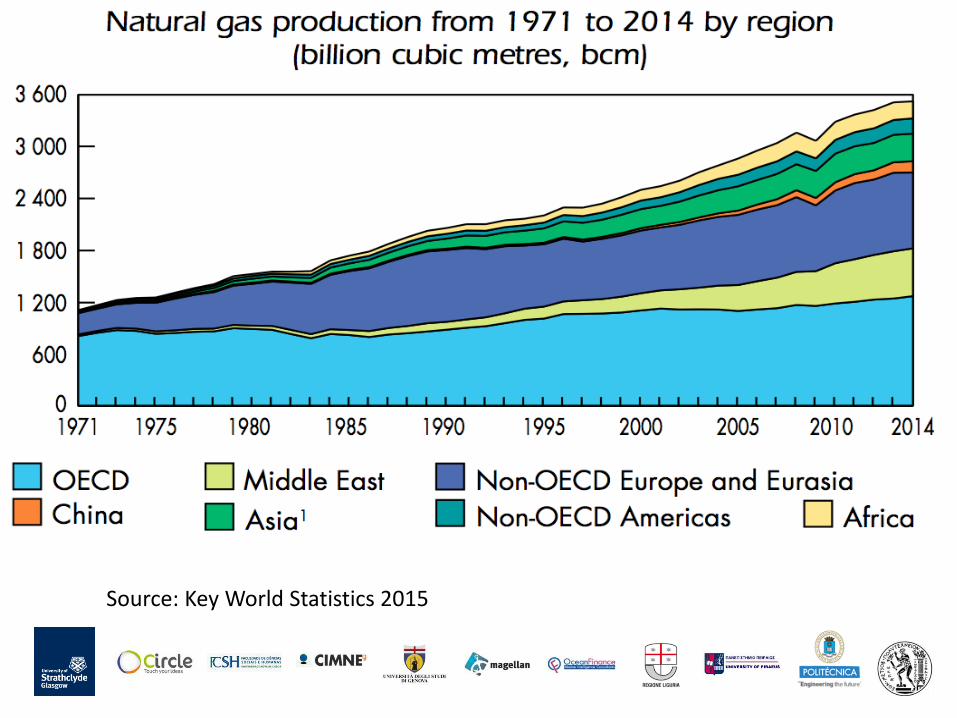
Source: Key World Statistics 2015
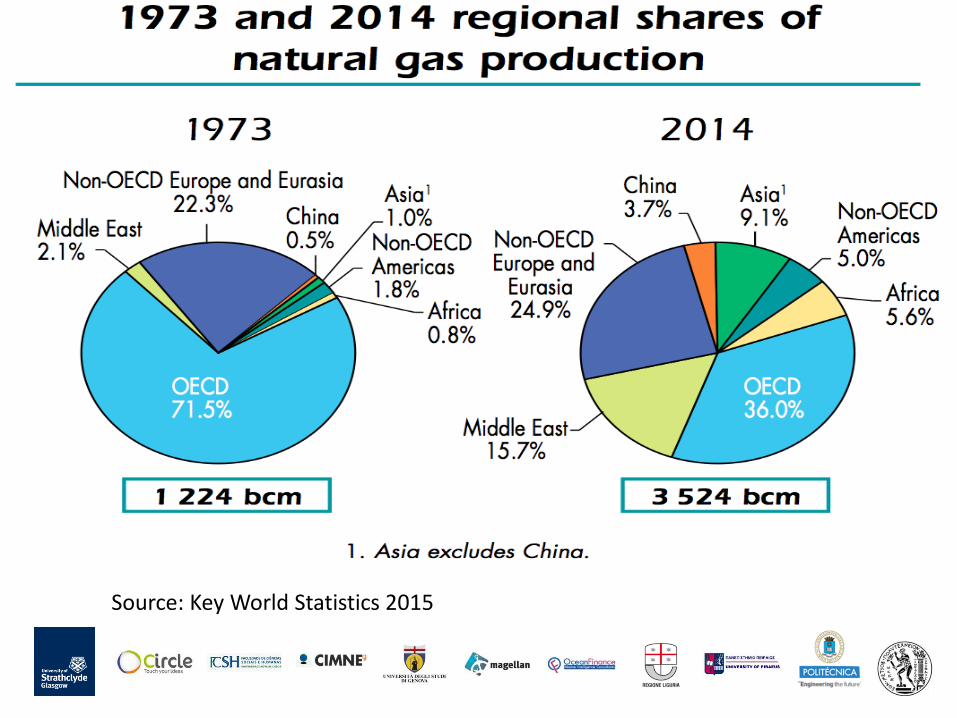
Source: Key World Statistics 2015

Sou
rce:
Key
Wo
rld
Sta
tist
ics
20
15
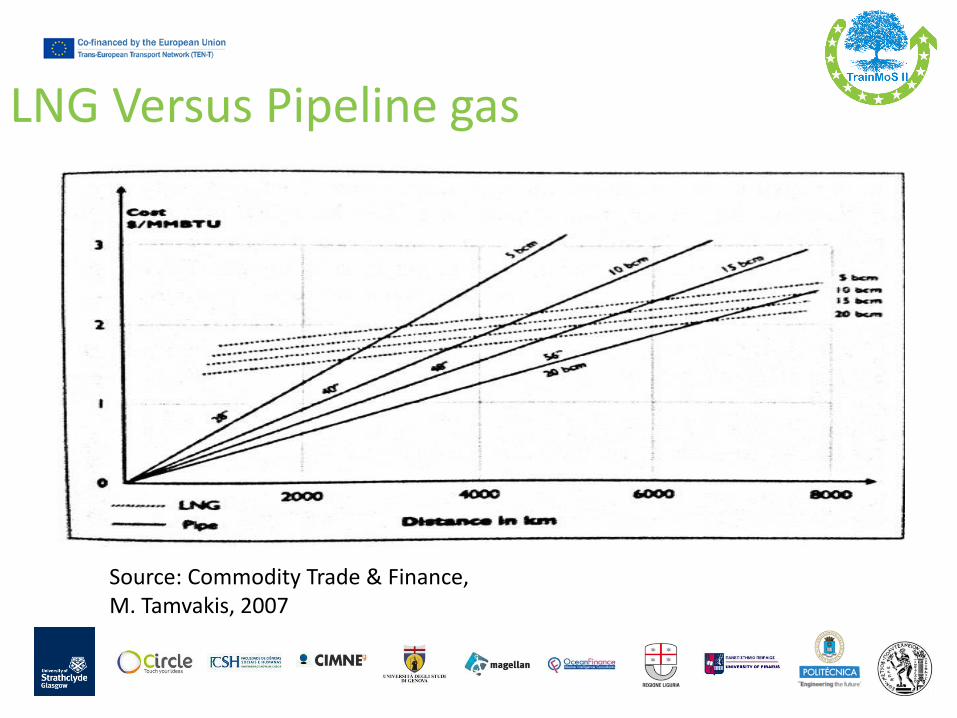
LNG Versus Pipeline gas
Source: Commodity Trade & Finance, M. Tamvakis, 2007

Sou
rce:
Key
Wo
rld
Sta
tist
ics
20
15
Source: Key World Statistics 2015

Source: Key World Statistics 2015
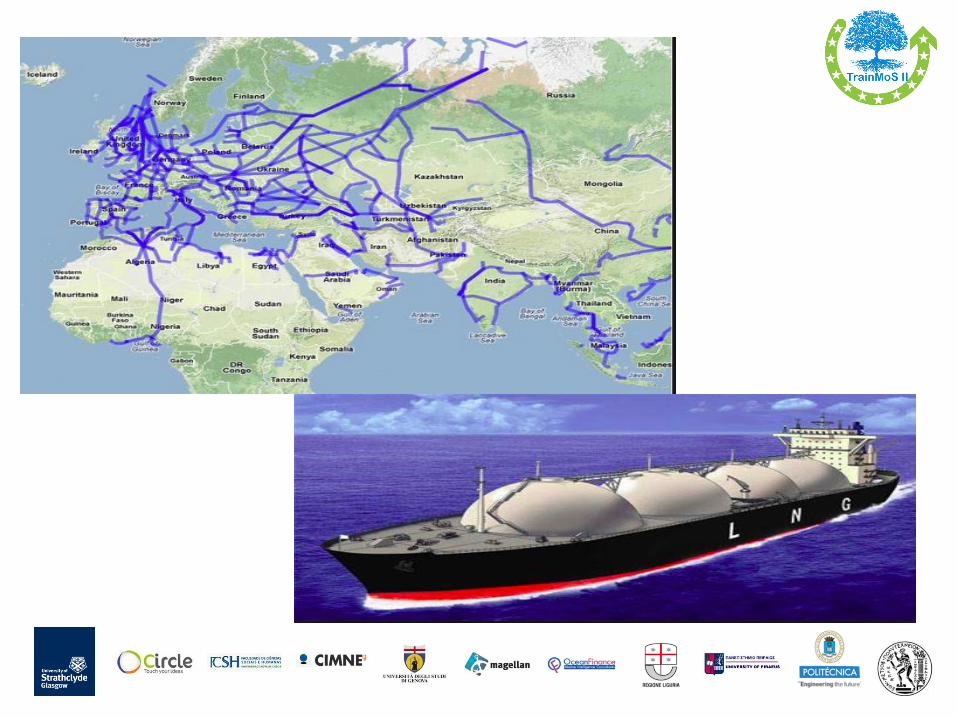
Pricing of Natural Gas• Natural gas is not as extensively traded as oil and coal
• Almost ¾ of the world production are consumed domestically • 73% is exported through pipelines and the remaining 27% with LNG vessels• Due to the transportation element such projects are capital intensive and face
high risk.• For LNG vessels are usually under LTCs as part of a LTCs contract between the
seller and the buyer of the commodity.• The buyer is faced with the price risk and the seller with the volume risk.

Pricing of Natural Gas• LNGs’ price their gas on a combination of different refined products
• E.g Gas oil, WTI, Brent and Low & high sulphur oil
• Natural gas is also traded in the financial markets such as NYMEX and ICE.
• NYMEX• Contracts are for 10,000 million BTU• The price tick is set at USD10 per contract and the maximum daily
fluctuation of USD 30,000 per contract, for every calendar month during the current year up to the next 5 years.
• Delivery is at Henry Hub Louisiana and has to ne completed in the delivery month.
• ICE• Physical delivery • Contracts are for 10-12 months, 11 -12 quarters and 6 seasons

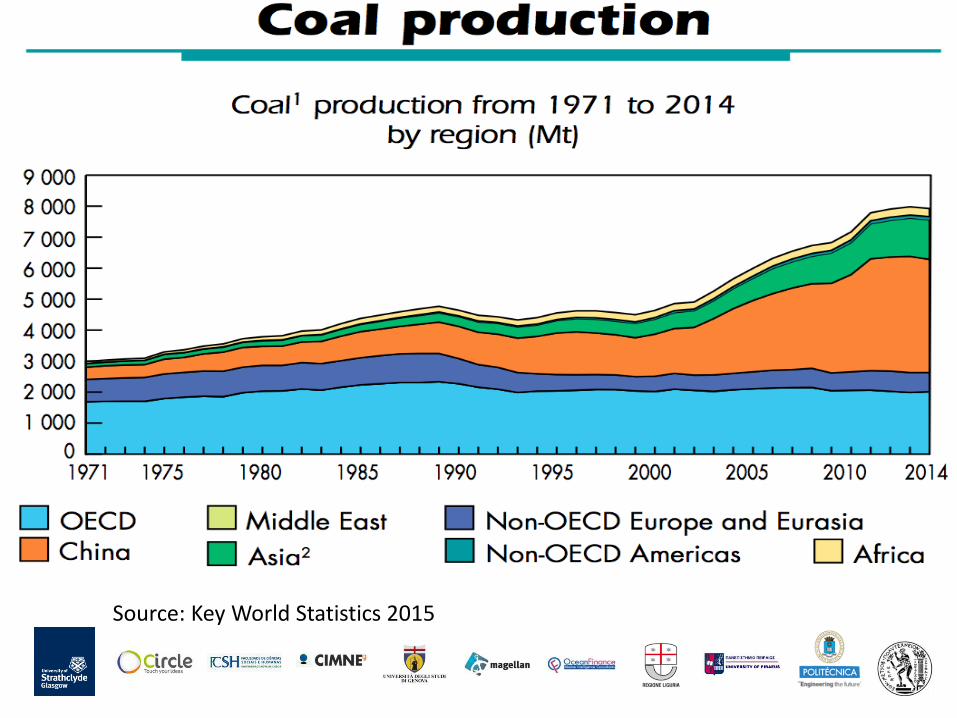
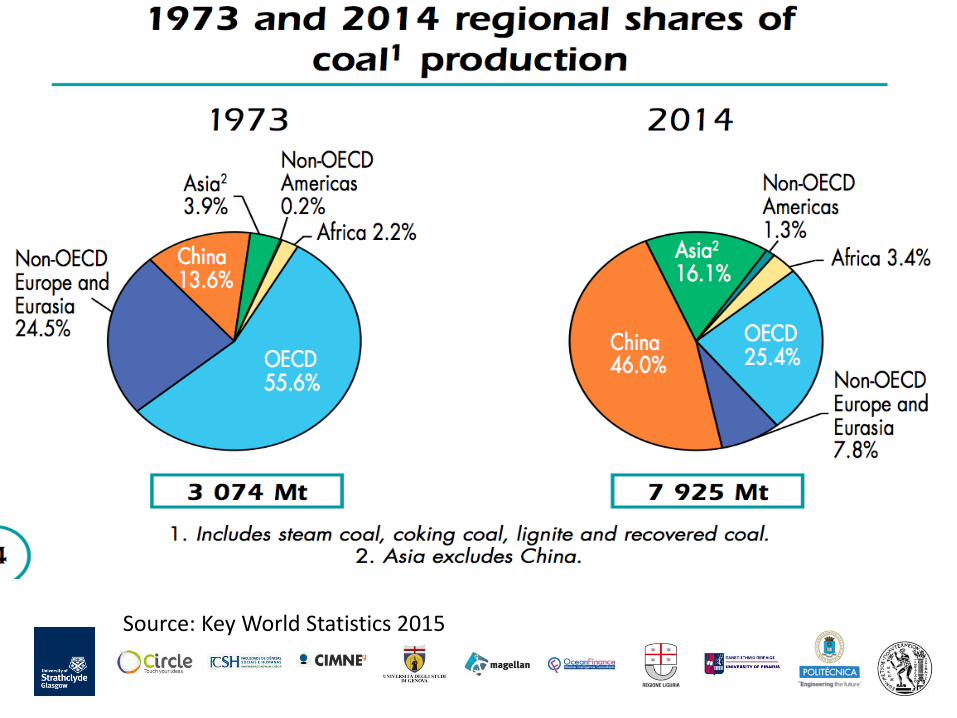
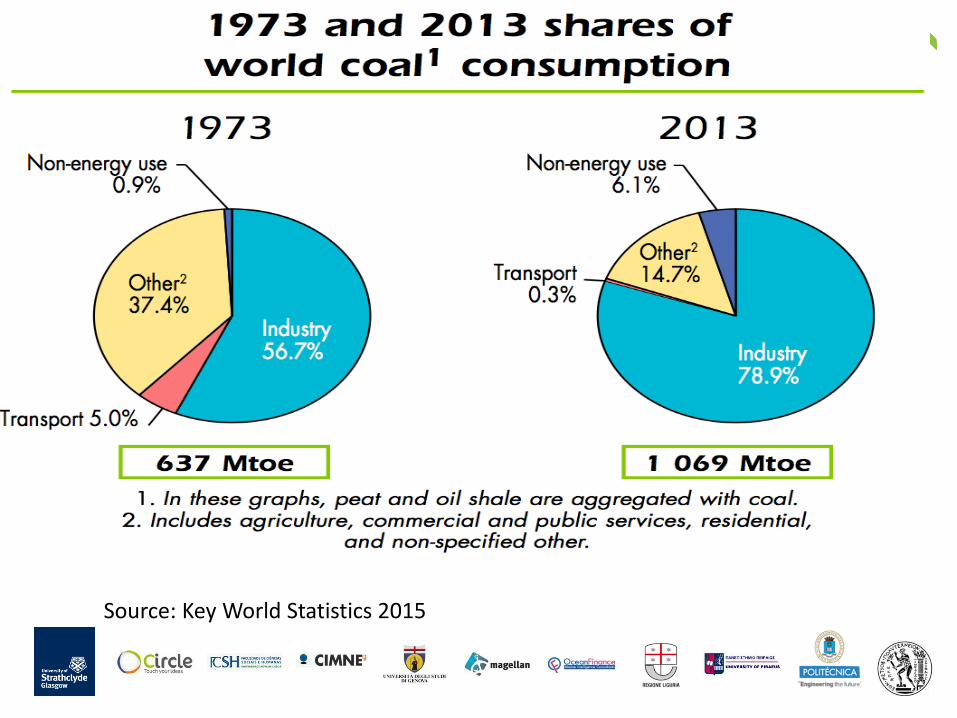
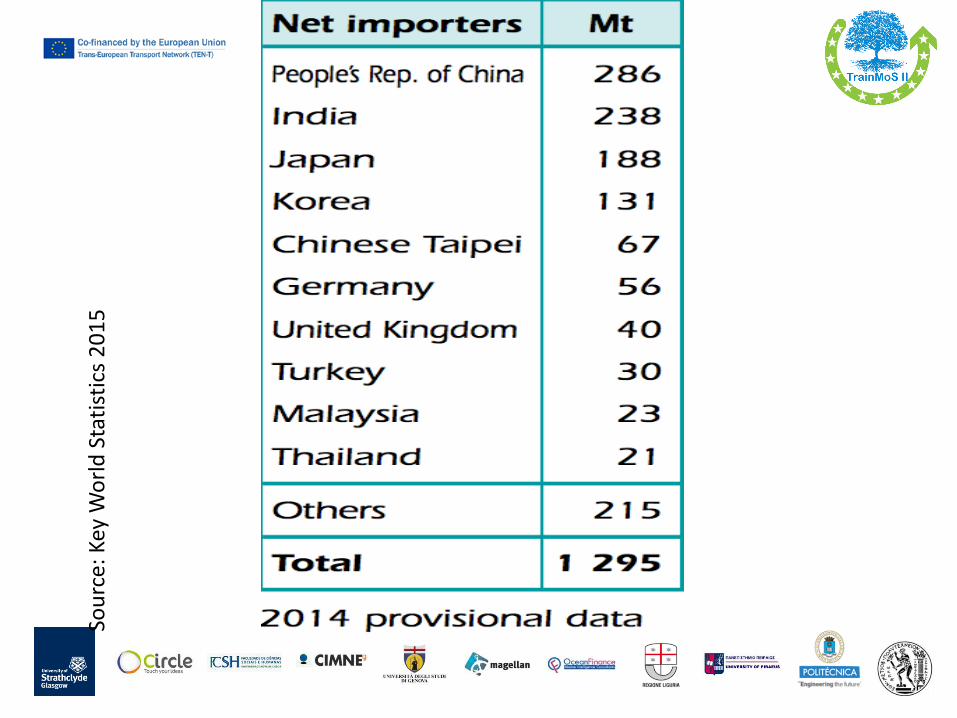
COAL• Coal has dual role, thus has two distinct markets
• Energy• Steel production
• Coal is classified in several categories according to its carbon content.
• “Hard coal” is used for generating power
• ‘Coke’ is used in the steelmaking process
• ‘Coal tar’ in very important in the production of drugs, food flavorings, perfumes, paints etc
Source: Key World Statistics 2015
Source: Key World Statistics 2015

Sou
rce:
Key
Wo
rld
Sta
tist
ics
20
15

Source: Key World Statistics 2015
Source: Key World Statistics 2015
Sou
rce:
Key
Wo
rld
Sta
tist
ics
20
15
Marketing & Trade• There are several of coal
• Australia: BHP Billiton, Xstrata, Rio Tinto and Anglo American
• South Africa: Ingwe (owned By BHP Billiton), Anglocoal (owned by Anglo American), XCSA (owned by Xstrata)
• US: Peabody Coal Co, Rio Tinto Energy America Inc, Arch Coal Inc, CONSOL Energy Inc, Foundation Coal Corp, A.T Massey Coal Co Inc, North American Coal Corp, Westmoreland Coal Corp, TXU Corp, Alliance Coal LLC
•
Marketing & Trade• Buyer of coal under LCs negotiate with coal mines or traders on four main
aspects:
• Physical characteristics of coal• Quality is measured by a number of characteristics (e.g calorific value measured in
Kcal/kg)
• Supplier’s reliability• Infrastructure, political stability, financial position, cost control, commitment to quality,
market experience
• Contract specification• Clauses for every eventuality, simple form to avoid arbitration which is time consuming
and expensive.• The contract can be used as a loan collateral by both parties
• Pricing• Usually set every year according to operational expenses and a profit margin. • This method is known as “cost-plus”

End of Session
Thank you for your attention!
Q&A


