35
APRIL 23-27, 2018 3 er seminario de abastecimiento en minería. Expomin 2018 Future of Procurement: Trends & Innovation

APRIL 23-27, 2018
3er seminario de abastecimiento en minería. Expomin 2018
Future of Procurement: Trends & Innovation
1 Copyri
ght
© 2
018 b
y T
he B
ost
on C
onsu
ltin
g G
roup,
Inc.
All r
ights
rese
rved.
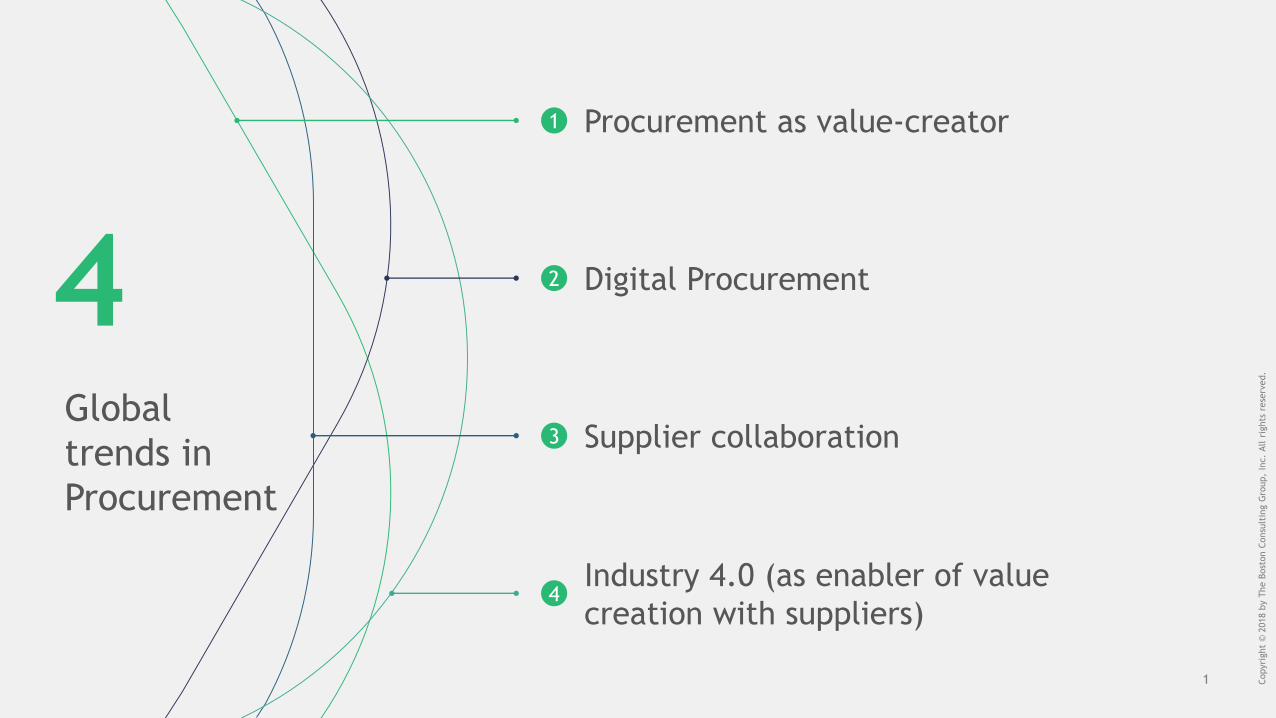
Global
trends in
Procurement
4
Industry 4.0 (as enabler of value
creation with suppliers)4
Supplier collaboration3
Procurement as value-creator1
Digital Procurement2

Copyri
ght
© 2
018 b
y T
he B
ost
on C
onsu
ltin
g G
roup,
Inc.
All r
ights
rese
rved.
2
1
Procurement is moving from back-office to front-office as a significant value creator

Copyri
ght
© 2
018 b
y T
he B
ost
on C
onsu
ltin
g G
roup,
Inc.
All r
ights
rese
rved.
3
Actionable and quick-
to-deliver results
Tangible value achievable
in 6 to 12 months
Significant and direct
financial impact
Large portion of cost base across
different industries
Healthcare 20-30%
Telecom 30-40%
Average 40%-50% of Revenues
30-40%Services
50-60%
Commoditized industrials
Energy & Utilities 40-50%
50-60%
Non-commoditized industrials
60-70%
Consumer Goods
Source: Industry research, BCG
Procurement holds the potential to create significant value
Procurement is often the largest cost driver
for organizations

4 Copyri
ght
© 2
018 b
y T
he B
ost
on C
onsu
ltin
g G
roup,
Inc.
All r
ights
rese
rved.
CPOs increasingly feature in the C-Suite
100
75
50
25
0
~80%
2000’s
~60%
Current
% of CPOs reporting to the CEO or n-1 Leading Examples
Source: Industry research, BCG

5 Copyri
ght
© 2
018 b
y T
he B
ost
on C
onsu
ltin
g G
roup,
Inc.
All r
ights
rese
rved.
Procurement
will continue to
become more
strategic
6 Copyri
ght
© 2
018 b
y T
he B
ost
on C
onsu
ltin
g G
roup,
Inc.
All r
ights
rese
rved.
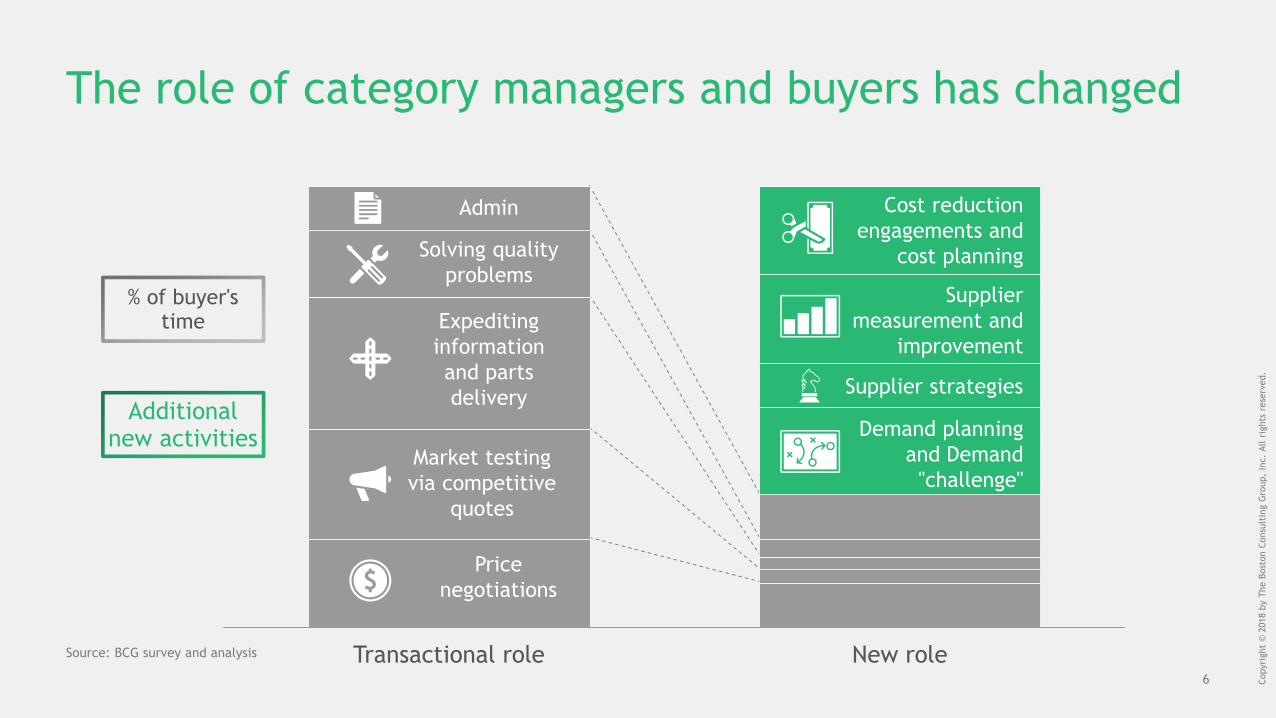
New roleTransactional role
The role of category managers and buyers has changed
Source: BCG survey and analysis
% of buyer's time
Additional new activities
Admin
Solving quality
problems
Expediting
information
and parts
delivery
Market testing
via competitive
quotes
Price
negotiations
Cost reduction
engagements and
cost planning
Supplier
measurement and
improvement
Supplier strategies
Demand planning
and Demand
"challenge"
7 Copyri
ght
© 2
018 b
y T
he B
ost
on C
onsu
ltin
g G
roup,
Inc.
All r
ights
rese
rved.
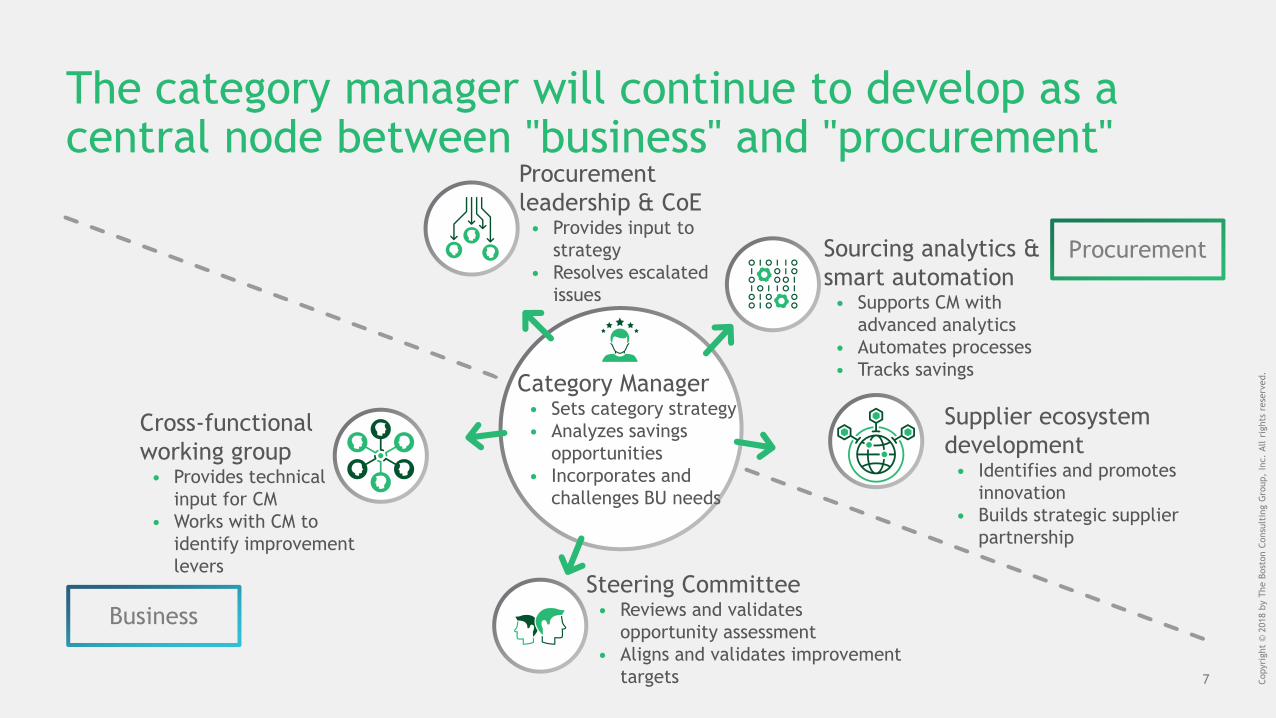
The category manager will continue to develop as a central node between "business" and "procurement"
Category manager
Sourcing analytics &
smart automation• Supports CM with
advanced analytics
• Automates processes
• Tracks savings
Procurement
Business
Category Manager• Sets category strategy
• Analyzes savings
opportunities
• Incorporates and
challenges BU needs
Supplier ecosystem
development• Identifies and promotes
innovation
• Builds strategic supplier
partnership
Procurement
leadership & CoE• Provides input to
strategy
• Resolves escalated
issues
Cross-functional
working group• Provides technical
input for CM
• Works with CM to
identify improvement
leversSteering Committee
• Reviews and validates
opportunity assessment
• Aligns and validates improvement
targets

Copyri
ght
© 2
018 b
y T
he B
ost
on C
onsu
ltin
g G
roup,
Inc.
All r
ights
rese
rved.
8
Digital levers are helping procurement organizations make faster and better decisions
2
9 Copyri
ght
© 2
018 b
y T
he B
ost
on C
onsu
ltin
g G
roup,
Inc.
All r
ights
rese
rved.
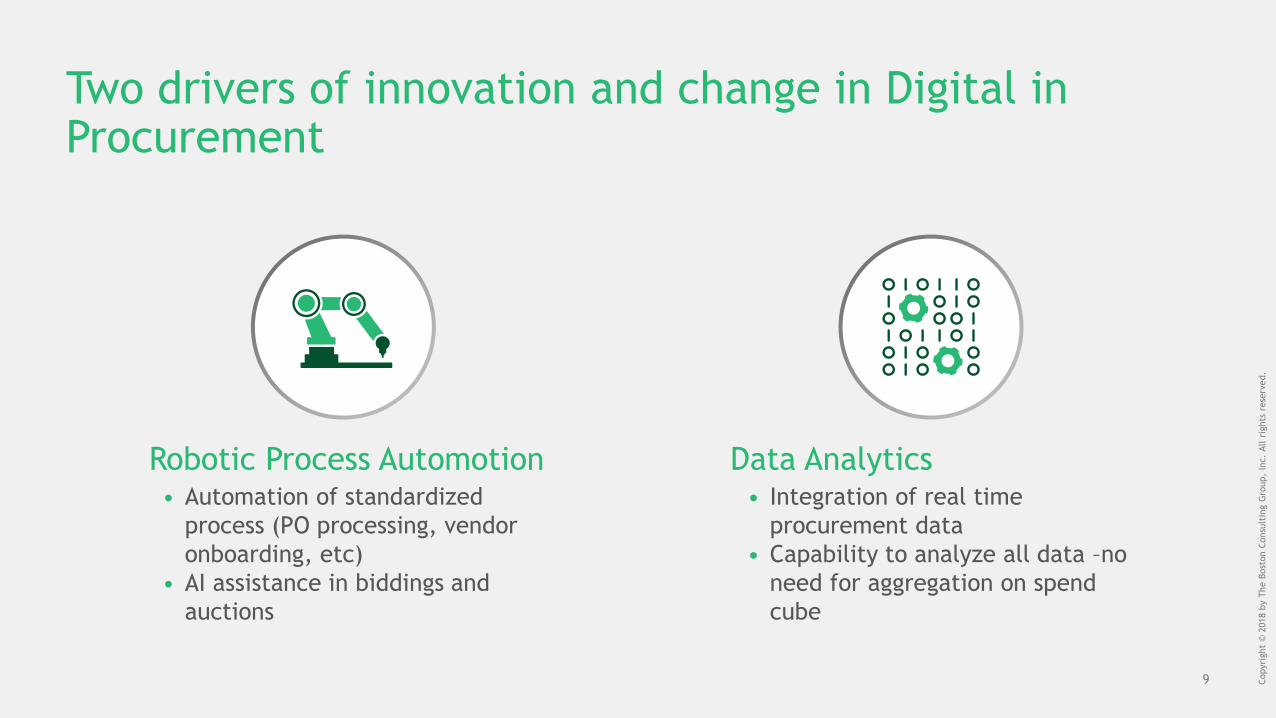
Two drivers of innovation and change in Digital in Procurement
Robotic Process Automotion Data Analytics• Automation of standardized
process (PO processing, vendor
onboarding, etc)
• AI assistance in biddings and
auctions
• Integration of real time
procurement data
• Capability to analyze all data –no
need for aggregation on spend
cube

10 Copyri
ght
© 2
018 b
y T
he B
ost
on C
onsu
ltin
g G
roup,
Inc.
All r
ights
rese
rved.
Starting point: Robotic Process Automation replaces rules-based human actions with software emulation
No consistent automation, as legacy
IT systems are often not easily
adaptable
Traditional & typical processes
Robot replicates (strictly rules-based)
human action at desktop level
Faster, 24/7 & Higher Aim Level
Many routine processes currently require human
involvement
'Robotic' Process Automation removes routine human
involvement

11 Copyri
ght
© 2
018 b
y T
he B
ost
on C
onsu
ltin
g G
roup,
Inc.
All r
ights
rese
rved.
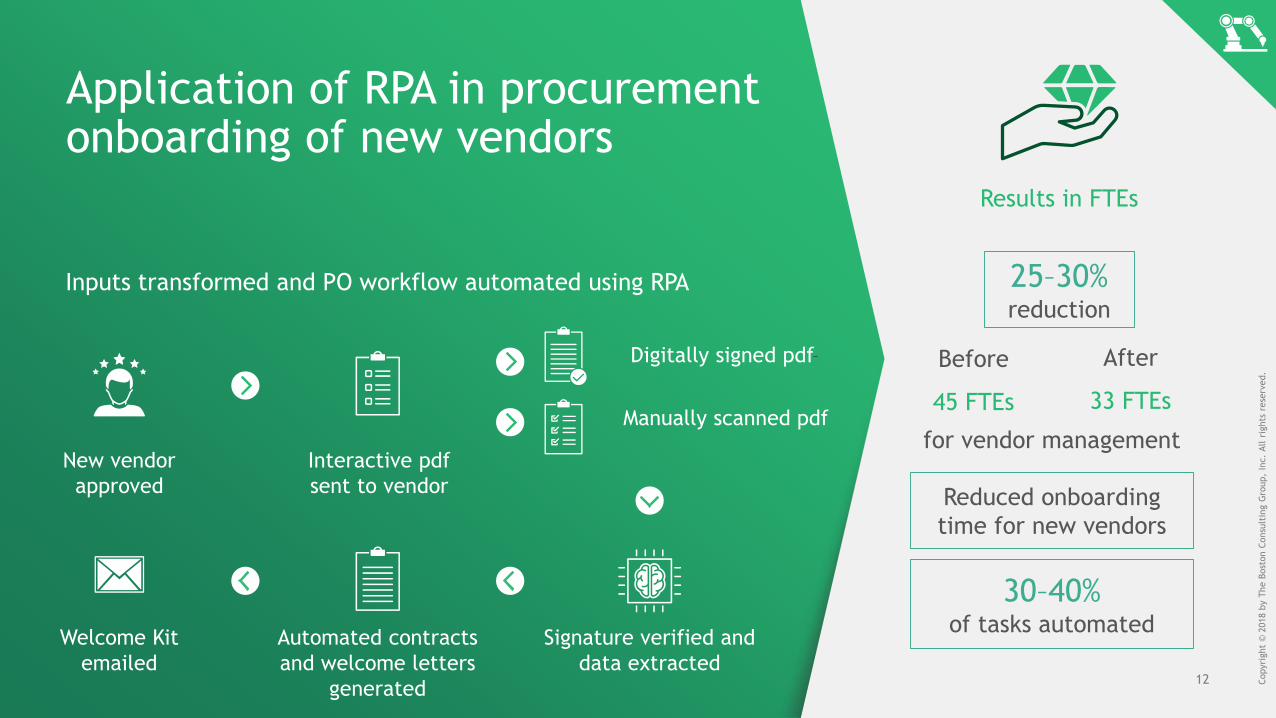
Inputs transformed and PO workflow automated using RPA
Application of RPA in procurement purchase order process automation
Consolidated
through RPA robot
Vendor selected, purchase request
raised by agent
Purchase request
validated by RPA
Approved PO
forwarded to
vendor
Reports
generated by RPA
Input received
from vendors
Results in overall in FTEs
30–35% reduction
80–90% of workflow automated
1 Robot equivalent
to
3–4 FTEs
Before
150 FTEs
After
100 FTEs
for order collection
12 Copyri
ght
© 2
018 b
y T
he B
ost
on C
onsu
ltin
g G
roup,
Inc.
All r
ights
rese
rved.
Inputs transformed and PO workflow automated using RPA
Application of RPA in procurement onboarding of new vendors
Interactive pdf
sent to vendor
Digitally signed pdf
Signature verified and
data extracted
Automated contracts
and welcome letters
generated
Welcome Kit
emailed
New vendor
approved
Results in FTEs
25–30% reduction
30–40% of tasks automated
Before
45 FTEs
After
33 FTEs
for vendor management
Reduced onboarding
time for new vendors
Manually scanned pdf

14 Copyri
ght
© 2
018 b
y T
he B
ost
on C
onsu
ltin
g G
roup,
Inc.
All r
ights
rese
rved.
RPA Video
15
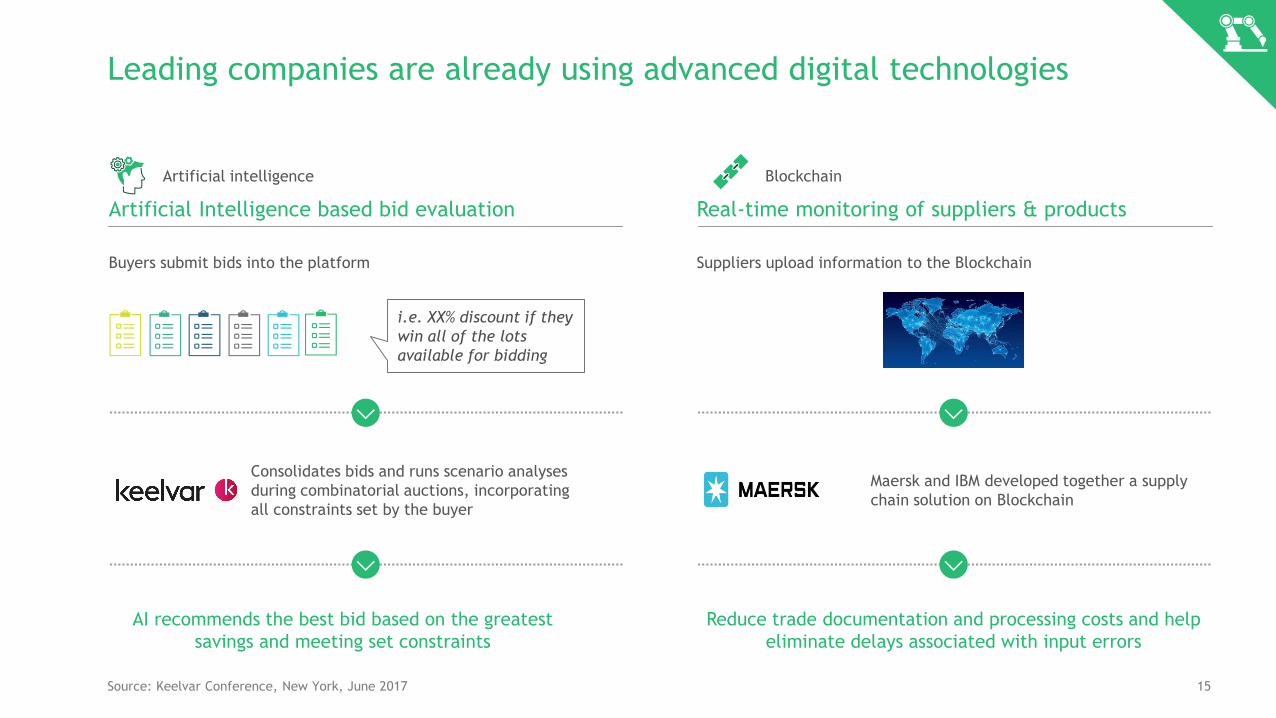
Leading companies are already using advanced digital technologies
Artificial Intelligence based bid evaluation
Consolidates bids and runs scenario analyses
during combinatorial auctions, incorporating
all constraints set by the buyer
AI recommends the best bid based on the greatest
savings and meeting set constraints
Buyers submit bids into the platform
i.e. XX% discount if they
win all of the lots
available for bidding
Artificial intelligence
Real-time monitoring of suppliers & products
Maersk and IBM developed together a supply
chain solution on Blockchain
Reduce trade documentation and processing costs and help
eliminate delays associated with input errors
Suppliers upload information to the Blockchain
Blockchain
Source: Keelvar Conference, New York, June 2017

16 Copyri
ght
© 2
018 b
y T
he B
ost
on C
onsu
ltin
g G
roup,
Inc.
All r
ights
rese
rved.
Big Data addresses a structural challenge, presentacross most industries and functions
Source: BCG analysis
Value
Model change
Variety
Volume
Velocity
The growth of data
is a structural trend
Big data is an opportunity
to capture insights and value

17 Copyri
ght
© 2
018 b
y T
he B
ost
on C
onsu
ltin
g G
roup,
Inc.
All r
ights
rese
rved.
Big data: From Spend cube to 100% purchase order view
Aggregated view at cube level
Yearly cycle
80/20 approach - Data focused on 'big
tickets'
Difficult and resource-intense information
reconciliation
Detailed view at purchase order level
"Real-time" information
Full visibility including long tail
Seamless data integration and automated
data manipulation
To 100% purchase order viewFrom Spend Cube
Definition of strategy at high granularity level Instant visualization of complex data sets to
focus on insight creation
18 Copyri
ght
© 2
018 b
y T
he B
ost
on C
onsu
ltin
g G
roup,
Inc.
All r
ights
rese
rved.
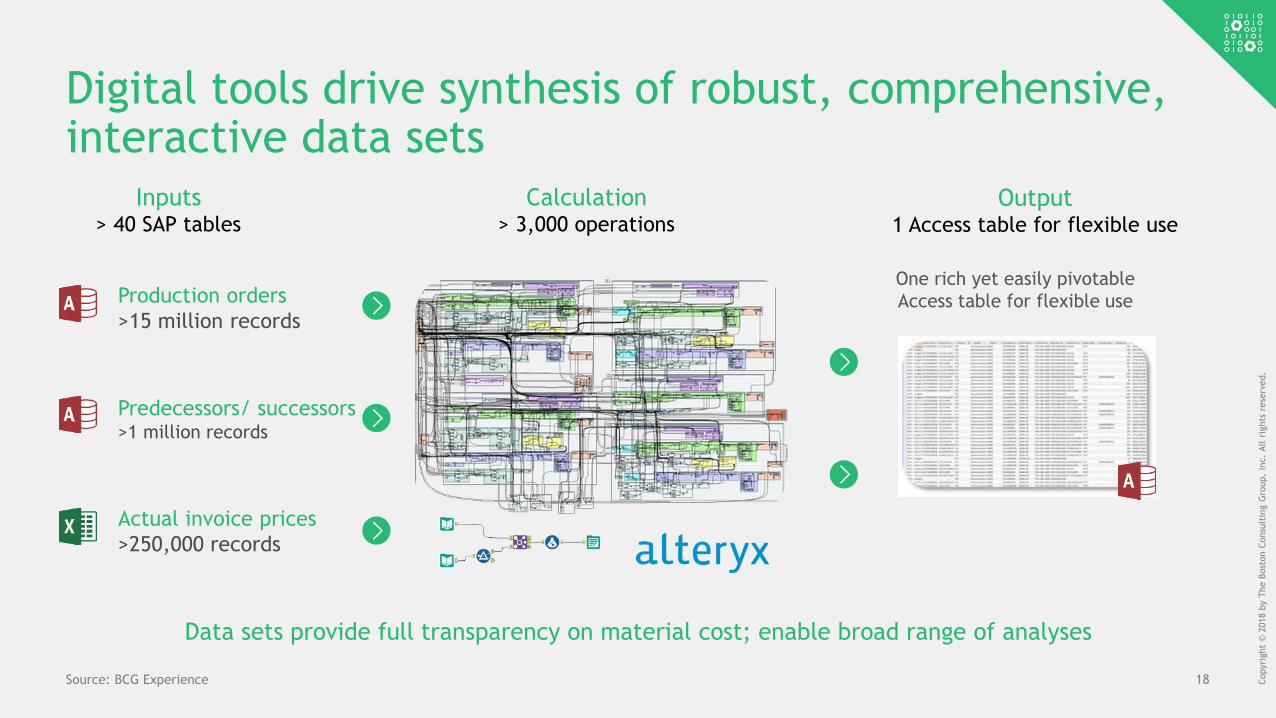
One rich yet easily pivotable
Access table for flexible use
Digital tools drive synthesis of robust, comprehensive,interactive data sets
Data sets provide full transparency on material cost; enable broad range of analyses
Production orders
>15 million records
Predecessors/ successors>1 million records
Actual invoice prices
>250,000 records
Inputs> 40 SAP tables
Calculation> 3,000 operations
Output1 Access table for flexible use
Source: BCG Experience

19 Copyri
ght
© 2
018 b
y T
he B
ost
on C
onsu
ltin
g G
roup,
Inc.
All r
ights
rese
rved.
Classical procurement analysis can now be applied to complete spend with real-time updates
Change in unit
price (3-year
CAGR %)
Limited savings
potential
High savings
potential
Reality: For
many parts
prices do not
decrease with
volume
Change in volume (3-year CAGR%)>€1Bn analyzed
PVO
Fixed–cost
degression
Price–elasticity analysis
Fixed-cost
degression
Source: BCG experience

Copyri
ght
© 2
018 b
y T
he B
ost
on C
onsu
ltin
g G
roup,
Inc.
All r
ights
rese
rved.
20
3
Supplier Collaboration is expanding the boundaries of value creation
21 Copyri
ght
© 2
018 b
y T
he B
ost
on C
onsu
ltin
g G
roup,
Inc.
All r
ights
rese
rved.
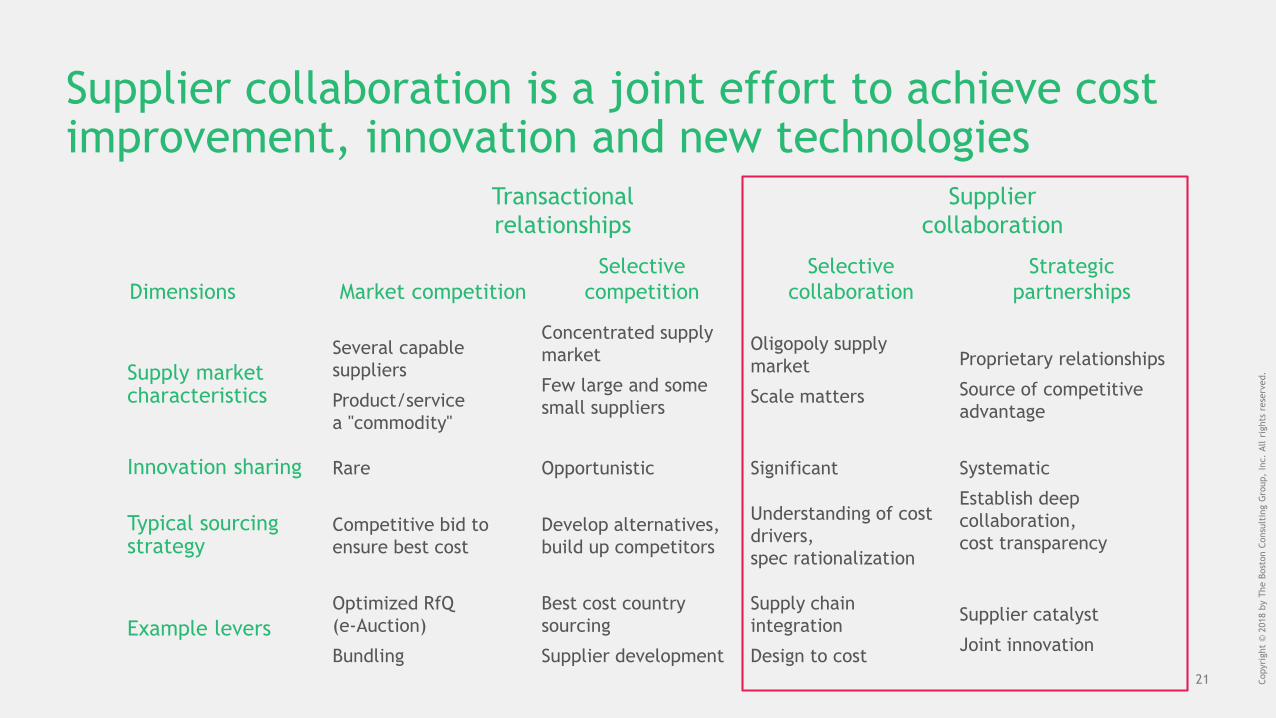
Supplier collaboration is a joint effort to achieve cost improvement, innovation and new technologies
Transactional
relationships
Supplier
collaboration
Dimensions Market competition
Selective
competition
Selective
collaboration
Strategic
partnerships
Supply market characteristics
Several capable
suppliers
Product/service
a "commodity"
Concentrated supply
market
Few large and some
small suppliers
Oligopoly supply
market
Scale matters
Proprietary relationships
Source of competitive
advantage
Innovation sharing Rare Opportunistic Significant Systematic
Typical sourcing strategy
Competitive bid to
ensure best cost
Develop alternatives,
build up competitors
Understanding of cost
drivers,
spec rationalization
Establish deep
collaboration,
cost transparency
Example levers
Optimized RfQ
(e-Auction)
Bundling
Best cost country
sourcing
Supplier development
Supply chain
integration
Design to cost
Supplier catalyst
Joint innovation

22 Copyri
ght
© 2
018 b
y T
he B
ost
on C
onsu
ltin
g G
roup,
Inc.
All r
ights
rese
rved.
Collaboration helps to create value for both buyers and suppliers
Buyer's
benefits
Access to
capacity for
incremental
volume
Access to
technology
Speed of
transfer and
product
launch
Improved
quality and
service levels
Optimized
indirect and
transaction
costs
Supplier's
benefitsAccess to
buyer quality
approach
Access to
technical
resources
Reduced cost
of doing
business
Association
with buyer in
selling to
others
Greater
visibility to
business
(current and
potential)
Creating value from broadening the joint perspective
Cost
optimization
and
transparency
Access to
new business
opportunity
Narrow focus

23 Copyri
ght
© 2
018 b
y T
he B
ost
on C
onsu
ltin
g G
roup,
Inc.
All r
ights
rese
rved.
Supplier collaboration targets not only driving cost but also value benefits
Question: What are the top goals of your supplier collaboration program?Source: BCG-PLN supplier collaboration survey
Objectives of supplier collaboration
77%
33%
46%
34%
19%
18%
18%
55%
Innovation
Cost savings
Risk mitigation
Resource supply security
Efficiency
Quality
Customer service/delivery
Others
Cost
Value
Others

24 Copyri
ght
© 2
018 b
y T
he B
ost
on C
onsu
ltin
g G
roup,
Inc.
All r
ights
rese
rved.
HighLow
Optimized
transactions
Consolidate
Rationalize
Development of alt-
ernative suppliers
OutsourcingLow
High
Category share of purchasing volume
Importance of the category
for company competitiveness
Restricted
relationships
"Standard Partner
Program"
E.g., vendor scorecards
Close
relationships
Process (ECR1,
CRP2)
Innovation
Partnership
Routine transactions,
selected cooperation
Process standardization
Factors• Innovation potential
• Importance for end customer
• Importance for product line
• Profit drivers
• Revenue drivers
• Cost leaders
• Products as image boosters
• "Single source"
Not all suppliers should be engaged with Supplier Collaboration…
25 Copyri
ght
© 2
018 b
y T
he B
ost
on C
onsu
ltin
g G
roup,
Inc.
All r
ights
rese
rved.
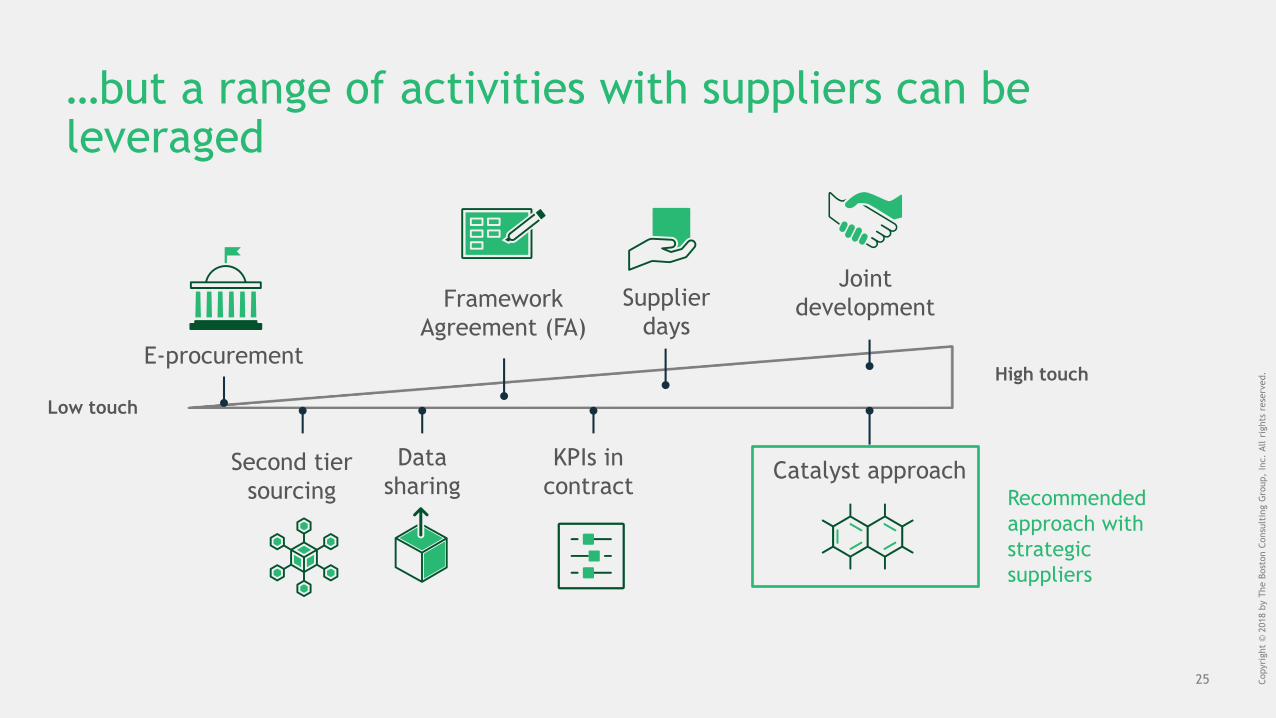
…but a range of activities with suppliers can be leveraged
E-procurement
Framework
Agreement (FA)
Supplier
days
Second tier
sourcing
Data
sharing
KPIs in
contractCatalyst approach
Low touch
High touch
Recommended
approach with
strategic
suppliers
Joint
development
27 Copyri
ght
© 2
018 b
y T
he B
ost
on C
onsu
ltin
g G
roup,
Inc.
All r
ights
rese
rved.
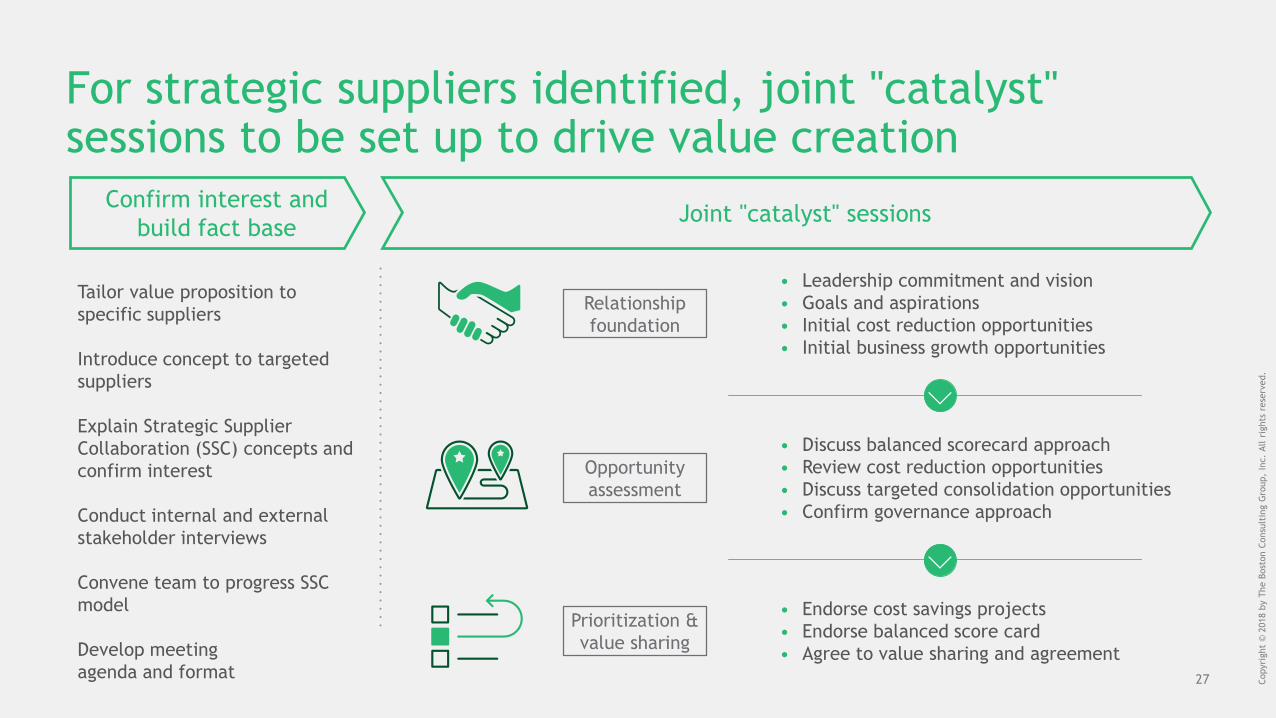
For strategic suppliers identified, joint "catalyst" sessions to be set up to drive value creation
Confirm interest and
build fact base
Tailor value proposition to
specific suppliers
Introduce concept to targeted
suppliers
Explain Strategic Supplier
Collaboration (SSC) concepts and
confirm interest
Conduct internal and external
stakeholder interviews
Convene team to progress SSC
model
Develop meeting
agenda and format
Joint "catalyst" sessions
Relationship
foundation
• Leadership commitment and vision
• Goals and aspirations
• Initial cost reduction opportunities
• Initial business growth opportunities
Opportunity
assessment
• Discuss balanced scorecard approach
• Review cost reduction opportunities
• Discuss targeted consolidation opportunities
• Confirm governance approach
Prioritization &
value sharing
• Endorse cost savings projects
• Endorse balanced score card
• Agree to value sharing and agreement
29 Copyri
ght
© 2
018 b
y T
he B
ost
on C
onsu
ltin
g G
roup,
Inc.
All r
ights
rese
rved.
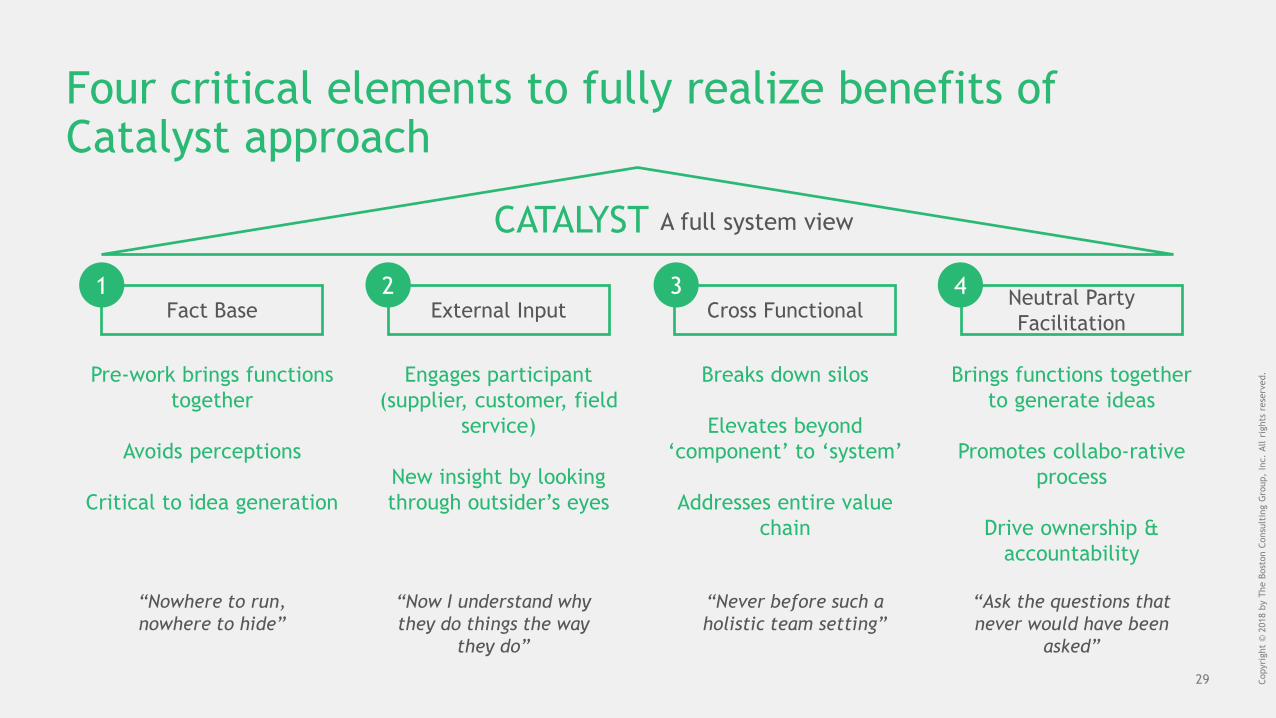
Cross FunctionalNeutral Party
FacilitationFact Base External Input
Four critical elements to fully realize benefits of Catalyst approach
CATALYST
Pre-work brings functions
together
Avoids perceptions
Critical to idea generation
“Nowhere to run,
nowhere to hide”
Breaks down silos
Elevates beyond
‘component’ to ‘system’
Addresses entire value
chain
“Never before such a
holistic team setting”
Engages participant
(supplier, customer, field
service)
New insight by looking
through outsider’s eyes
“Now I understand why
they do things the way
they do”
Brings functions together
to generate ideas
Promotes collabo-rative
process
Drive ownership &
accountability
“Ask the questions that
never would have been
asked”
1 2 3 4
A full system view

Copyri
ght
© 2
018 b
y T
he B
ost
on C
onsu
ltin
g G
roup,
Inc.
All r
ights
rese
rved.
30
4
Industry 4.0 and new technologies are enabling new sources of value creation with suppliers and contractors

31 Copyri
ght
© 2
018 b
y T
he B
ost
on C
onsu
ltin
g G
roup,
Inc.
All r
ights
rese
rved.
The economic drivers for digital transformation are clear
Enough IP addressesCost of
processing power
over the past ten years
50x
Ubiquitous cloud
infrastructure
cost per MB
over the past ten years
20xCost of sensors
$1.30avg. cost .60over the past ten years
Cost of bandwidth
over the past ten years
40x
IPv6 3.4 x 1038
IP addresses=

32 Copyri
ght
© 2
018 b
y T
he B
ost
on C
onsu
ltin
g G
roup,
Inc.
All r
ights
rese
rved.
Digital with big impact in supplier – customer relationship dynamics, enabling value creation
Increased productivity and service
profitability
Procurement costs reduction
Higher service level
Improved Service
Delivery
Process digitization
New digital enablers
New revenue streams
Procurement costs reduction
Closer engagement between customer
and service provider
New Services and
Business Models
Asset performance
improvement
New business models
Condition monitoring
& predictive
maintenance

34 Copyri
ght
© 2
018 b
y T
he B
ost
on C
onsu
ltin
g G
roup,
Inc.
All r
ights
rese
rved.
Example: Würth Group & Automatic replenishmentof goods
Automatic replenishment of goods enabled
by optical ordering system iBinWürth Group
• Full integration and closer relationship with
customers (lock-in of customers)
• Continuous and less volatile sales
Customer:
• Improved inventory management and
production planning
• Less rack and floor space required in
production facilities
Monitoring OrderingQuick
delivery
Solution description Benefits and challenges
36 Copyri
ght
© 2
018 b
y T
he B
ost
on C
onsu
ltin
g G
roup,
Inc.
All r
ights
rese
rved.
Example: Rolls Royce reduces expensive scrap by additive manufacturing
Production of small
components made of
high-cost
Production of low-volume, high-complexity
parts more cost efficient via additive
manufacturing
Significantly less scrap through additive
manufacturing
Experts estimate that >20% of all additive
manufacturing outputs are final parts today,
growing to 50% by 2020
Aerospace industry uses additive manufacturing/3D
printing to produce tools and final components to
thereby reduce expensive scrap
Production of parts with low volume &
high complexity of assembly via additive
manufacturing
Solution description Benefits and challenges
Traditional manufacturing:
Assembly of 15 different parts
Additive manufacturing: Creation
of the entire moving part as one
38 Copyri
ght
© 2
018 b
y T
he B
ost
on C
onsu
ltin
g G
roup,
Inc.
All r
ights
rese
rved.
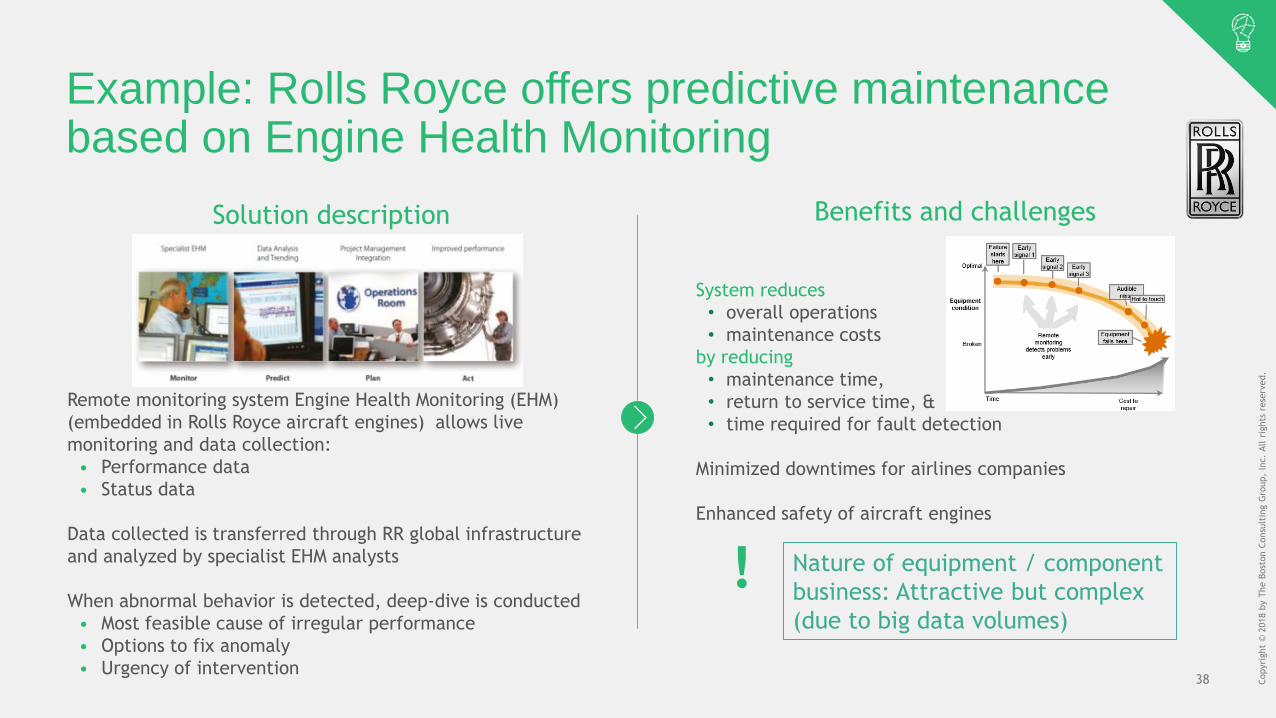
Example: Rolls Royce offers predictive maintenance based on Engine Health Monitoring
Remote monitoring system Engine Health Monitoring (EHM)
(embedded in Rolls Royce aircraft engines) allows live
monitoring and data collection:
• Performance data
• Status data
Data collected is transferred through RR global infrastructure
and analyzed by specialist EHM analysts
When abnormal behavior is detected, deep-dive is conducted
• Most feasible cause of irregular performance
• Options to fix anomaly
• Urgency of intervention
System reduces
• overall operations
• maintenance costs
by reducing
• maintenance time,
• return to service time, &
• time required for fault detection
Minimized downtimes for airlines companies
Enhanced safety of aircraft engines
Solution description Benefits and challenges
Nature of equipment / component
business: Attractive but complex
(due to big data volumes)
40 Copyri
ght
© 2
018 b
y T
he B
ost
on C
onsu
ltin
g G
roup,
Inc.
All r
ights
rese
rved.
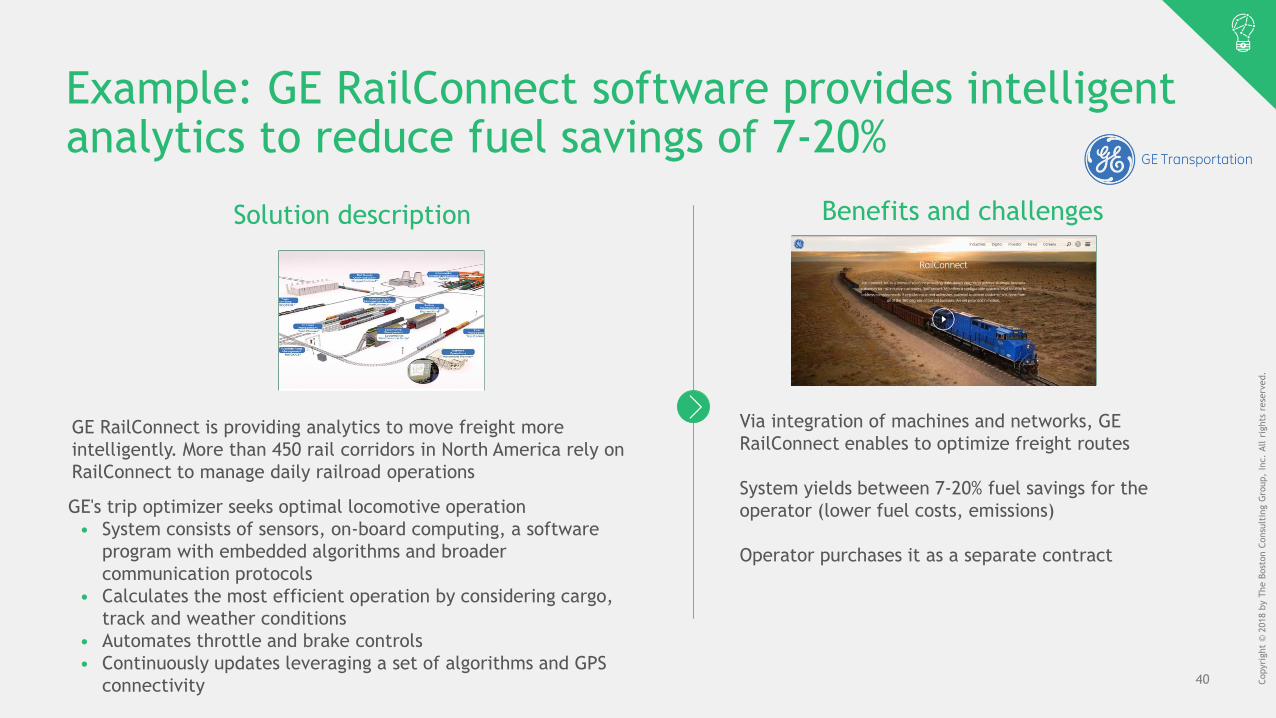
Example: GE RailConnect software provides intelligent analytics to reduce fuel savings of 7-20%
GE's trip optimizer seeks optimal locomotive operation
• System consists of sensors, on-board computing, a software
program with embedded algorithms and broader
communication protocols
• Calculates the most efficient operation by considering cargo,
track and weather conditions
• Automates throttle and brake controls
• Continuously updates leveraging a set of algorithms and GPS
connectivity
Solution description
GE RailConnect is providing analytics to move freight more
intelligently. More than 450 rail corridors in North America rely on
RailConnect to manage daily railroad operations
Benefits and challenges
Via integration of machines and networks, GE
RailConnect enables to optimize freight routes
System yields between 7-20% fuel savings for the
operator (lower fuel costs, emissions)
Operator purchases it as a separate contract

bcg.com


