46
1 FY 2007 results and comments INVESTOR & ANALYST UPDATE 29 February 2008

1
FY 2007 results and commentsINVESTOR & ANALYST UPDATE
29 February 2008

2
DISCLAIMER
The views expressed here contain information derived from publicly available sources that have not been independently verified. No representation or warranty is made as to the accuracy, completeness or reliability of the information. Any forward looking information in this presentation has been prepared on the basis of a number of assumptions which may prove to be incorrect. This presentation should not be relied upon as a recommendation or forecast by Banpu plc. Nothing in this release should be construed as either an offer to sell or a solicitation of an offer to buy or sell shares in any jurisdiction.

3
1. Introduction
2. Focus: mine planning process
3. Operational review
4. Commercial review
5. Financial review

4
1. Introduction
Chanin VongkusolkitChief Executive Officer

5
Banpu in 2007: big picture
1
Indonesia• 18mt coal sale
• Bontang port expansion
• Impact of force majeureand rains on output
China• Daning (3mt) and Hebi (1.4mt)
expansions in line expectation
• BPIC expansion under way
2
Thailand• LP2/CMMC: winding down
• BLCP: achieved targets
• HongSa: • EPC signed (CMEC/Harbin)
• Tariff MOU (Bt2.05/kWh 25yrs)
• Shareholder structure agreed (Ratch 40%, Lao 20%)
3
Luannan
Zhengding
Zouping
Hebi
Daning
Gaohe
HongSaLP2/ CMMC
Ratch
BLCP
Bharinto
Trubaindo
Jorong
Indominco
Kitadin
1
2
3
Stock exchange:
Ticker:
Date:
Shares offered:
Type:
Offering % (post):
Offer price:
Banpu % (post):
Lead underwriter:
Indo. Stock Exch.
ITMG
18th Dec 2007
225,985,000
Primary 100%
20%
Rp 14,000 /sh.
73.72%
UBS
*Indo Tambangraya Megah Tbk.
ITM listing*
OperationProject
OperationProject
POWER
COAL

6
Banpu in 2007: the figures
Coal sales
19.3 MT
Down 2.4 MT 11% Y-Y
Coal
28,577
427
3,903
2,405
Power
3,865
4,077
5,073
4,248
Revenue
Equity income
EBIT
Net income
Total
32,442
4,504
8,976
6,654
Y-Y
-3%
462%
49%
84%
Unit: Bt. million

7
Global economic and coal market context: year ahead
5.5 5.64.7
S. America
3.02.0 2.0
N. America
5.3 5.3 5.3Middle East
7.9 7.97.2
Asia Pacific (including Japan)
‘06 ‘07 ’08E
‘06 ‘07 ’08E
‘06 ‘07 ‘08E
‘06 ‘07 ‘08E
Source: IMF Data Mapper, McCloskey 2007 estimate
Key: GDP % growth
Thermal coal exports (Mt)
5223
Thermal coal imports (Mt)
65 Mt
COLUMBIA
USA & AMERICAS
67 Mt
187 Mt
79 Mt
RUSSIA & E. EUROPE
35
INDIA
203 Mt
INDONESIA
111 Mt
AUSTRALIA
3045
CHINA
S.AFRICA
EUROPE & MEDITERANEAN
2.2 2.0 1.7
Japan
‘06 ‘07 ‘08E64
S.KOREA
JAPAN
116 Mt
58
TAIWAN
3.7 3.63.0
Europe
‘06 ‘07 ’08E
37SE ASIA

8
Indonesia: year ahead
East Kalimantan
Bunyut PortSamarinda
Balikpapan
Palangkaraya
Banjarmasin
Jorong Port
Central Kalimantan
South Kalimantan
Bontang port
Kitadin
Indominco
Trubaindo
Bharinto
Jorong
ITM OPERATIONS & PROJECTS
OperationProject
OperationProject
POWER
COAL
CFP project
Production: target 19.5mt coal
Debottleneck: address contractor and equipment capacity constraints
Reserves: expansion: feasibility studies, adjustment of SRs, exploration
Costs: continue rationalisation schemes: Bontang CFP, washing plants, barge fleet management, flexible loading schedule to reduce demurrage charges
Acquisitions: Continue to evaluate new investment and acquisition opportunities

9
China: year ahead
LUANNAN100MWHebei
ZHENGDING48MWShandong
DANING (12%)4mtpaShanxi
GAOHE (10%)6mtpa (COD 2011)Shanxi
BANPU CHINA OPERATIONS & PROJECTS
OperationProject
OperationProject
POWER
COAL
*Production potential will be determined by de-gas tests mid-year; coal is semi-anthracite; 157mt reserves
Ownership 100% unless indicated otherwise
HEBI (40%)1.5mtpaHenan
ZOUPING (70%)100MWShandong
Daning: (56% AACI) completion of 15km rail spur to connect to provincial railway; 4mt target for 2008
Gaohe: (45% AACI) new 5-6mtpa* mine project selling to Chinese utilities and steel mills; first output 2010 – full output by 2013; ordering equipment; degas tests mid-year; licensing
AACI: Banpu position under review
Hebi: 1.5mt target 2008; further output expansion potential under study
Power: tariff adjustment vs coal cost increases likely to impact performance

10
Thailand: year ahead
Hong Sa (40%) Laos 1,800MW lignite-fired
CMMC Payao
open-pit LP-2 Lampangopen-pit
Ratch (15%) 3,995MW gas-fired
BLCP (50%) 1,434MW coal-fired
BANPU THAILAND OPERATIONS & PROJECTS
Ownership 100% unless indicated otherwise
OperationProject
OperationProject
POWER
COAL
Banpu Power: develop and strengthen O&M expertise
BLCP: 1.4GW operation (on-stream 2006/7); aim for smooth second year of operation
Hong Sa: 1.8GW project ($2.8bn) COD by 2013; target PPA by mid-08; financial closure by end-08
LP-2, CMMC: last output in 2008 (0.5mt); closure cost planning

11
Banpu corporate and financial: year ahead
ITM management: emphasis on developing best practice corporate governance, management systems and IR following listing.
HR: continued emphasis on integration, training (leadership, Technical Knowledge Portal and Innovation Promotion) and instilling Banpu Spiritfor growing multinational workforce
Renewable energy: make first investments (in line 2% asset policy)
Dividend policy: change to 50% payout of consolidated profit (subject to cash flows)
Thailand
Indonesia
China
24%14%
62%
Total staff: 3,266
BANPU GROUP EMPLOYEES BY GEOGRAPHIC LOCATION
Main staff nationalities: Indonesian, Chinese, Thai, Australian, British, Indian, Philippines

1212
2. Focus: mine planning process
Neil TurveyHead of Technical Development & Services

13
Mine planning process overview
Coal mines are complex operations and require detailed planning.Establishing a mine - and an ultimate production profile - is subject to a number of constraints including technical, financial, logistical, regulatory as well as commercial - and can take many years
Overall mine operations are guided by ‘Mine Master Plans’, which aim to maximize long term value from a coal deposit and are subject to key assumptions and constraints
Mine Master Plans need to be updated when key assumptions and constraints change. Any changes to mine planning are given careful consideration
Annual, quarterly, monthly and weekly mine operation planning islinked to the Mine Master Plan - and deliver the short term production and cost performance

14
Mine-to-port illustrations: Indominco and Trubaindo
Source: Company information
0 10 2515 205 km
PT. BHARINTO
40Km
SOUTH BLOCK
NORTH BLOCK
HAUL ROAD
Mahakam River
KedangpahuRiver
Raw coal stockpile
HAUL ROAD
Product coal conveyor/stacking/stockpile
BUNYUT PORT
BARGE 300KM TO TRANSHIPMENT
WEST BLOCKEAST BLOCK
Santan river
Port stock yard
Bontang City
ASHPHALT HAUL ROAD
4Km 2.5Km
35Km
ROM stockpile
SEA CONVEYOR
Mine stockyard
CONVEYOR
Panamax90,000DWT
0 106 82 km4
Indominco
0 10 2515 205 km
Operation
Stockpile
Ship Port
Hauling
Barge Port
Crusher
40Km
Product coal conveyor/stacking/
stockpile
Trubaindo
15
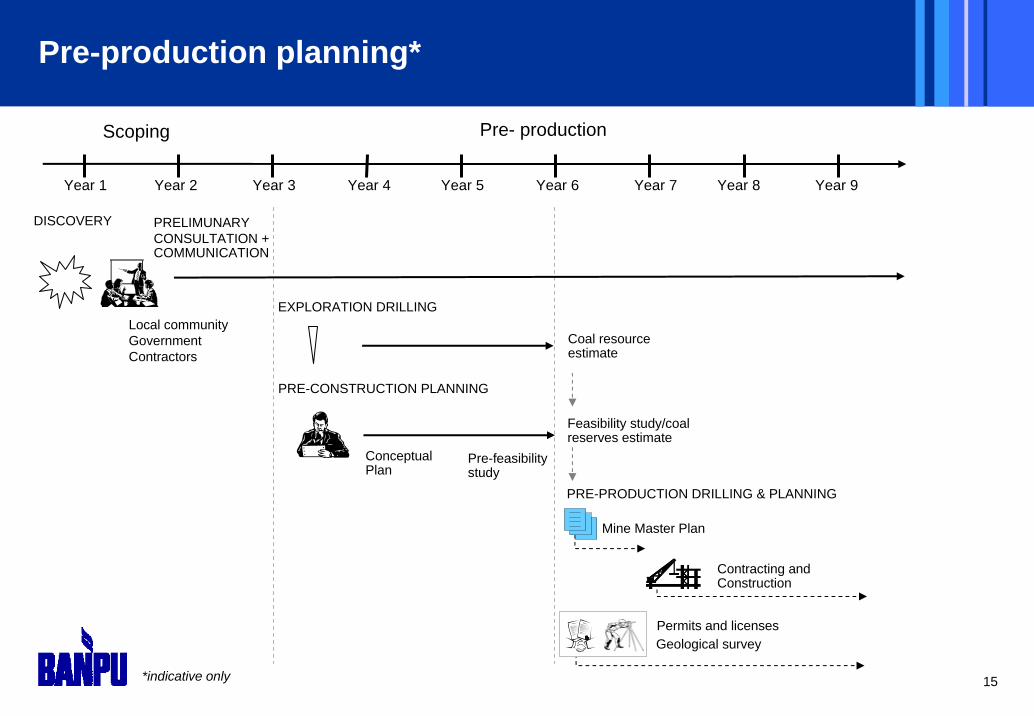
Pre-production planning*
*indicative only
DISCOVERY
Year 1 Year 2 Year 3 Year 4 Year 5 Year 6 Year 7 Year 8 Year 9
Pre- production
PRELIMUNARY CONSULTATION + COMMUNICATION
Local communityGovernmentContractors
Scoping
EXPLORATION DRILLING
PRE-CONSTRUCTION PLANNING
Feasibility study/coal reserves estimate
Conceptual Plan
Pre-feasibility study
PRE-PRODUCTION DRILLING & PLANNING
Coal resource estimate
Mine Master Plan
Contracting and Construction
Permits and licensesGeological survey

16
Production planning
Year 1 Year 2
MINE MASTER PLAN
PREPARE YEAR 1 ANNUAL MINE PLAN
Production
PREPARE YEAR 2 ANNUAL MINE PLAN
Quarterly Plan
Monthly & weekly plans
Year 1 annual budget
Year 2 annual budget
MINE MASTER PLAN UPDATE*
PREPARE YEAR 3 ANNUAL MINE PLAN
Year 3 annual budget
Quarterly Plan
Monthly & weekly plans
Pre- production
* if necessary
YEAR 2 PRODUCTION DRILLING
YEAR 3 PRODUCTION DRILLING
YEAR 1 PRODUCTION DRILLING

17
Production planning: Mine Master Plan update
Mine Master Plans provide a long term schedule of planned mine activities, with estimates of likely production, costs and revenues. They are updated only when key assumptions and constraints change significantly.
•Tax rates•WACC•Mine equity•Coal price forecasts
• What is the maximized NPV vs. strip ratio?
•Cash cost estimates•CAPEX estimates•Key infrastructure•Production vsReserves•Balance between contractor capacity and mine capacity
UPDATE COAL MODEL
•Coal reserves at different strip ratios
• Permits •Engineering •Geology•Infrastructure (roads, power?)•Asset synergies (coal blending, BoCT)•Integration of development projects
•Coal prices •Fuel prices•FOREX•Risk scenarios
PIT OPTIMISATION
‘BASE CASE’ MINE DESIGN
LONG TERM PRODUCTION SCHEDULE
SENSITIVITY ANALYSIS
•Development strategy•Mining sequence•Annual mining targets
Late January April/May
Master Plan production schedule
* Each step assumes that approvals are signed off. Each step may be subject to a number of revisions

18
Production planning: Annual Mine Plan preparation
FINANCIAL MINING STRATEGY
UPDATED RESERVE ESTIMATES
ANNUAL PRODUCTION SCHEDULE
DETAILED PRODUCTION SCHEDULE
PERMITTING & MINE DESIGN
July
The Annual Mine Plan forms the basis of annual operations. Using updated information, it marks the transition between the Mine Master Plan and its implementation. It is the basis of the annual mine budget for the following year.
•Infrastructure capacity•Detailed pit & dump designs•Geological limits on annual production rate (e.g. seam length, width and depth determine constraints on mining) •Environmental and legal
•Consistency with Mine Master Plan•Preliminary pit & dump layouts developed
• Impact of detailed pit designs on reserve estimates
• Consistency with the Mine Master Plan mining targets•Commercial and sales commitments
•Mining equipment availability (especially at short notice)•Rapidly expanding contractor industry in Indonesia –size and reliability issues
•Fuel price•‘Base case’ S/R •Coal price forecast•Cash costs•FOREX •Contractor prices
October
Annual Plan and budget (Year +1)
* Each step assumes that approvals are signed off. Each step may be subject to a number of revisions
•Quarterly plans•Monthly plans•Weekly plans

19
3. Operational review
Rawi CorsiriChief Operating Officer

20
Estimated 2008 production c.20m tonnes (excld. China)
Indominco-Bontang11.5 mt
Jorong3 mt
Thailand0.5 mt
Daning4.0 mt
(Banpu 12.5%)
Trubaindo5.0 mt
100% basis
Hebi1.5 mt(Banpu 40%)
Kitadin

21
Indonesian and Thai coal production review and outlook
Indominco-BontangCV 6250 - 6500 kcal/kg
2.6
SR 10.5:1
1Q07
12.4:1
0.2
2Q07
0.6
1Q07
SR 4.7
Kitadin-EmbalutCV 5800 kcal/kg
JorongCV 5300 kcal/kg
LP-2 / CMMCCV 4000 - 5000 kcal/kg
4.4
2Q07
TrubaindoCV 6550 – 7200 kcal/kg
10.5:1
0.5
3Q07
0.8
1Q07 2Q07
SR 5.4
1Q07 2Q07
SR 4.2 4.3
2.7
3Q07
0.7
1Q08F
0.1
4Q07
0.9
1Q08F
11.3:1
4.3
4.4
3.2
0.8
0.7Stable output; Stripping
ratio unchanged
Thai mines are in closure stage due to reserves
depletion
5.4
Increased stripping ratio to capture favorable
market price
Replaced mining contractor in October 2007; Increased
stripping ratio
3Q07
4.3
0.7
3Q07
0.2
4.4
8.0
Evaluating alternatives to utilize
existing assets
1Q08F
2.6
1.0
0.6
4Q07
3.1
4Q07
8.5
1.0
4Q07
0.7
1Q08F

22
DaningShanxi Province, PRC
CV 6800 – 7300 kcal/kg(Banpu 12.5%)
HZTM(Hebi Zhong Tai Mining)
Henan Province, PRCCV 5300 – 6800 kcal/kg
(Banpu 40%)
China coal operations
Coal price(RMB/t)
Production(Mt)
2006
372
1.28
4Q07
Coal price(RMB/t)
Production(Mt)
281
2.03
446
0.38
426
1.26
2007
423
1.44
381
3.09
1Q08F
458
0.36
432
0.51
Completed minor capacity increased to 1.5Mtpa;
Further expansion to 2Mtpa is under consideration
Production in 1Q08 will be briefly interrupted by
relocation of longwall

23
Total revenue
Availability Payment (AP)
Energy Payment (EP)
Dispatch (%)
Operating cost
EBIT
EBITDA
Power Thailand : BLCP
4Q/2007
3,853
1,856
1,789
70%
2,267
979
1,513
Q-Q
-29%
-43%
-13%
1%
-65%
-53%
Units: Bt. million
Equity income 2007
Bt 4,076 m*
* Based on Banpu’s 50% interest; including FX gain Bt591million
3Q/2007
5,517
3,284
2,056
87%
2,240
2,760
3,238
2007
20,307
11,716
7,906
87%
8,938
9,340
11,243

24
Power China : BPIC
* Unaudited figures
** Including transportation
*** Including Expansion
Sales* (USD m)
EBITDA (USD m)
Utilization (Hours)
Power tariff (RMB/kwh)
Coal price**(RMB/t)
100% basis
LuannanHebei Province, PRCPower 100MW; Steam 128tph(Banpu 100% )
ZhengdingHebei Province, PRCPower 48MW;Steam 180tph(100%)
Second phase (hot water) completed; expansion for
other lines have commenced
2007
#1 Major overhaul completed; #1 unit DCS
retrofit completed
3Q07
4Q07
ZoupingShandong Province, PRCPower 100MW***;Steam 490tph(70%)
Third phase (25MW) : turbine # 4 was in
commercial operation
2007
2007
38.1 14.0 6,961 0.42 437
25.8 8.2 9,227 0.34 383
46.3 10.4 8,953 0.32 484
9.8 4.2 1,813 0.42 421
10.0 1.7 1,712 0.42 489
3Q07 5.9 2.0 2,286 0.34 373
4Q07 7.6 2.2 2,343 0.34 414
3Q07 12.2 3.3 2,442 0.32 4694Q07 14.9 2.7 2,551 0.32 522

25
4. Commercial review
Philip GasteenHead of Marketing and Logistics

26
102030405060708090
100110120130
1Q02
2Q02
3Q02
4Q02
1Q03
2Q03
3Q03
4Q03
1Q04
2Q04
3Q04
4Q04
1Q05
2Q05
3Q05
4Q05
1Q06
2Q06
3Q06
4Q06
1Q07
2Q07
3Q07
4Q07
1Q08
e
BJI
Weighted avg
Indominco
ASP 4q07 : $44.18 / tonne
ASP 2007 :$41.06 / tonne
US$/Tonne BJI* February 28, 2008
$127.90
Chinese winter cuts exportS. Africa electricity cutdisrupts mining operation
Australia flooding cuts export
Average Selling Prices (ASP)
Note: *Barlow Jonker Index (BJI) based on CV 6,700 kcal/kg GAD from Australia to JapanSource: Barlow Jonker

27
Strong market likely to stay strong
China
S.Africa
Australia
Demand easing in March from winter peaksStockpiling vs. small mine safetyTighter 2008 demand than forecast at end 2007. Exports drop while imports maintain
Coking coal supply constraints due to floods (forecast $300+/t)Diversion of thermal coal to metallurgical markets
Growing domestic power demandNew (expensive) production may not be sufficient to meet export orders, due investment risk
Pressure on thermal prices other things being equal
Overall impact?
1Q0810 Mt thermal coal ‘lost’from export markets
FY200825 - 30 Mt thermal coal ‘lost’ from export markets –could be 20 Mt from China / Vietnam
Approx 5 Mt in diversions annually from thermal to metallurgical markets in 2008 / 2009

28
70%
11%
19%
Contracted & Priced
Contracted & Unpriced
Uncontracted
• Very strong global import demand through 2008
• Thai coal fully sold
• Indonesian low CV grades largely placed
• Gradually committing remaining high CV grades
• EU contracts linked to API # 4
Indicative 2008 coal sales
Approx. 20 MT

29
Coal sales by geographic destination
INDIA
0.5 Mt
ITALY
OTHERS*
1.2Mt
1.0 Mt
1.2 Mt
THAILAND
CHINA
2.5 Mt
3.3 MtPHILIPPINES
1.4 Mt
1.1 MtINDONESIA
JAPAN
4.6 Mt
TAIWAN
2.9 Mt
0.8 MtS.KOREA
*Includes Vietnam, Pakistan and other small, non-regular purchasers
Mid-to-High CVLow-to-Mid CV
Total coal sales volume: 19.3Mt in 2007 (5.02Mt in 4Q07)

30
5. Financial review
Somruedee SomphongChief Financial Officer

3131
32,29433,242
25,046
2005 2006 2007
Sales revenues: coal and power
Note : Revenues from other businesses (e.g. industrial minerals) are not included
Consolidation of BPIC started in March 2006 (Bt2,808m revenue for the year)
Units: Bt. million
• 11% decrease in sale volume
• 17% increase in selling price
• 9% appreciation of Thai Baht
-3% Y on Y
Coal Bt28,429m
Power Bt3,865m+38% Y on Y
-7% Y on Y
0100200300400500600700800900
1000
2006 2007
Revenues in USD +6.59% Y on Y

32
14,013
2,426
2,429
3,016
3,162
16,638
1,667
2,123
3,035
6,971
18,758
6,126
2,616
175
717
38Trade
Thai mines
Kitadin-Embalut
Jorong
Trubaindo
Indominco
Bt. million GPM Sales revenue
Thai mines
Jorong
Trubaindo
Kitadin-Embalut
Indominco
39%39%
46%
36%
33%40%
10%37%48%
38%
43%
31%
2007
20062005
Avg. gross margin for coal in 2007 at 37%
41%42%
32%
Trade

3333
12,916
9,5288,874
2005 2006 2007
EBITDA
Units: Bt. million
Coal Bt7,398m
Power Bt5,518m+211% Y on Y
-5% Y on Y
+36%
Y on Y

3434
6,654
3,610
2,851
2,708
2005 2006 2007
Net Profit
Units: Bt. million
Coal Bt2,243m
Non-Recurring
+238% Y on Y
-3% Y on Y
+84%
Y on Y
5,559
Power Bt4,411m

35
2007-08 CAPEX plans: $363million
Units: USD million
22 45
120 Power Indonesia
Coal ChinaCoal Indonesia
45
230
Committed Feasibility ConceptualStatusCoal projects
Power projects
Bontang Port 66
BontangPower Plant 22
Bharinto 45 Indonesia 50China 120
China 60
The capital expenditure figures shown above are indicative only and do not include estimates for maintenance or sustaining capital expenditure. The figures shown in the ‘Conceptual’ column should be treated with extra caution and are likely to change as new projects are conceived, some are cancelled and as pre-feasibility analyses generate modified estimates of capital expenditure requirements.
Power China88
50
60
66

36
0.14
0.66
0.34
0.22
2004 2005 2006 2007
91
Balance sheet
Debt structureNet D/E (Times)
Net gearing (%)
As end of December 2007
18%25%
40%
Floating 49% Fixed 51%
12%

37
Dividend payment
3.753.25
7.55.5
42.6
4.754.25
5
2002 2003 2004 2005 2006 2007
Dividend per share (Bt)
(Special)
(1H07)
(2H07)
(1H06)

38
Question & Answer

39
APPENDICES

40
Operating profit
Units: Bt. million
Sales revenues – Power (BPIC) 3,865Cost of sales (20,964)Gross profit* 11,478 -8%
GPM 35%
2007 YoY %
32,442 -3%Sales revenues – Coal
Total sales revenues*
28,429 -7%
Gross profit - Coal 10,467 -10%Gross profit – Power (BPIC) 956
38%
18%
2006
2,808(20,838)12,541
38%
33,37830,434
11,681812
Note: * Including other business
GPM – Power (BPIC)GPM - Coal
25%37%
29%38%

41
Operating profit
Units: Bt. million
Gross profit 11,478 12,541 -8%GPM 35% 38%SG&A (3,952) (4,607)Royalty (3,247) (3,238)
Dividend income – Coal & Power 457 465 Other income 247 299
EBIT 8,976 6,036 49%
EBITDA 12,916 9,528 36%
2007 2006 YoY %
EBIT - Coal 3,903 4,744 -18%EBIT - Power 5,073 1,291
Income from associates 4,504 801
293%
EBITDA - Coal 7,398 7,979 -7%EBITDA - Power 5,518 1,549 256%
Other expenses - Operations (511) (225)
42
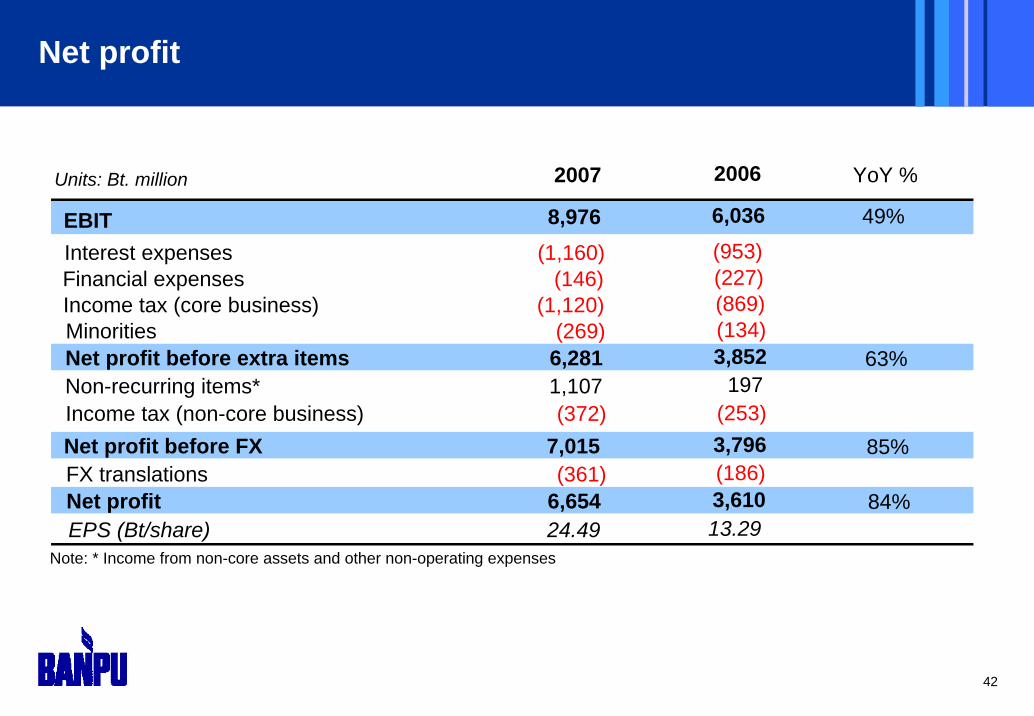
Units: Bt. million
EBITInterest expenses (1,160)Financial expenses (146)Income tax (core business) (1,120)Minorities (269)Net profit before extra items 6,281Non-recurring items* 1,107Income tax (non-core business) (372)Net profit before FX 7,015 85%FX translations (361)Net profit 6,654 84%EPS (Bt/share) 24.49
Note: * Income from non-core assets and other non-operating expenses
YoY %2007
Net profit
63%
(953)(227)(869)(134)3,852
197(253) 3,796(186)3,61013.29
8,976 6,036 49%
2006

43
Operating profit
Units: Bt. million
Sales revenues – Power (BPIC) 1,164Cost of sales (6,198)Gross profit* 2,987 -6% -22%
GPM 33%
4Q07 QoQ % YoY %
9,185 6% -10%Sales revenues – Coal
Total sales revenues*
7,981 4% -13%
Gross profit - Coal 2,783 -4% -22%Gross profit – Power (BPIC) 193
23% 25%
-32% -30%
931(6,324)3,838
38%
4Q06
10,1629,210
3,554275
948(5,462)3,178
37%
3Q07
8,6417,654
2,884284
Note: * Including other business
GPM – Power (BPIC)GPM - Coal
17%35%
29%39%
30%38%

44
Operating profit
Units: Bt. million
Gross profit 2,987 3,838 -6% -22%GPM 33% 38%SG&A (1,029) (1,343)Royalty (884) (1,008)
Dividend income – Coal & Power - -Other income 92 83
EBIT 1,532 2,171 -40% -29%
EBITDA 1,876 3,042 -54% -38%
4Q07 4Q06 QoQ % YoY %
EBIT - Coal 1,133 1,481 13% -24%EBIT - Power 399 690
Income from associates 614 754
-74% -42%
EBITDA - Coal 1,284 2,276 -47% -44%EBITDA - Power 592 767 -64% -23%
3,17837%
(1,116)(882)
21734
2,554
4,060
1,0041,550
1,238
2,4211,639
Other expenses - Operations (251) (414)(120)
3Q07

45
Units: Bt. million
EBITInterest expenses (282)Financial expenses (34)Income tax (core business) (173)Minorities (154)Net profit before extra items 890Non-recurring items* 1,362Income tax (non-core business) (135)Net profit before FX 2,117 85%FX translations (134)Net profit 1,983 69%EPS (Bt/share) 7.30
Note: * Income from non-core assets and other non-operating expenses
YoY %4Q07
Net profit
-39%
(266)(57)
(345)(34)
1,469(325)
-1,144
311,1754.32
19%
15%
-51%
1,532 2,171 -40% -29%
(304)(34)
(51)1,830
(55)-
1,774(55)
1,7196.32
2,554
(335)
4Q06 QoQ %3Q07

46
Banpu’s Resources & Reserves statement (100% basis)
As at 31 December 2007 As at 31 December 2006
Measured Resources
Indicated Resources
Total Resources
Proved Reserves
Probable Reserves
Total Reserves
Total Resources
Total Reserves
Mine operation
Jorong 73.72 105.6 18.8 124.4 12.6 - 12.6 45.1 15.9
Indominco 73.72 526.3 82.7 609.0 21.9 71.9 93.8 289.7 86.0
Kitadin-Embalut 73.71 103.0 51.0 154.0 - 17.1 17.1 150.6 17.3
Kitadin-TandungMaYang
73.71 12.4 0.5 12.9 - 9.7 9.7 - -
Trubaindo 73.72 161.8 134.7 296.5 27.9 30.0 57.9 300.8 61.6
Lampang 100.00 1.6 - 1.6 0.3 - 0.3 2.5 1.1
Payao 100.00 0.8 - 0.8 0.4 - 0.4 1.2 1.1
Daning No. 1 12.49 61.8 35.0 96.8 69.7 - 69.7 102.5 72.0
Hebi Zhongtai 40.00 66.7 - 66.7 31.7 - 31.7 70.3 33.1
Project
Bharinto 72.98 183.5 114.5 298.0 36.5 9.8 46.3 218.4 28.5
Barasentosa* 94.99 - - - - - - 38.8 32.8
Total 1,223.3 437.2 1,660.6 201.0 138.4 339.5 1,220.0 349.4
Mine operation and project
Interest
(%)
Note : * Divest in May 07
Resources and Reserves are classified in accordance with JORC Code


