A note on the data: The 2015 Annual Benefits Report is based on data from the VBA corporate database. The availability of gender and age data is limited, as some records are listed as “unknown.” Those records are accounted for in the totals for each table, but not in the category columns. Please see footnotes for additional information. All Veterans counted in this section are receiving compensation benefit payments as of Sept. 30, 2015. The category of 0% indicates payment due to special monthly compensation or two or more permanent 0% service- connected disabilities which clearly interfere with normal employability. Veterans with a 0% combined degree of disability not receiving payment are not counted in this section. Please see the section: “A Note on How the FY 2015 Compensation Data is Presented” on page 2 for important information on the color coding of the data tables. Dependency and Indemnity Compensation data are found beginning on page 48. Compensation Service-Connected Disability or Death Benefits The Compensation program provides tax-free monthly benefits to Veterans in recognition of the effects of disabilities caused by diseases, events, or injuries incurred or aggravated during active military service. The program also provides monthly payments to surviving spouses, dependent children, and dependent parents in recognition of the economic loss caused by the death of individuals during their military service or as a result of service-connected disability after their discharge. To be eligible for disability compensation, the Veteran must have served under conditions other than dishonorable, and the disability must not be the result of the Veteran’s own misconduct. VA pays disability compensation monthly, and the amount varies according to the degree of disability and the number of dependents. The degree of disability is graduated from 0% to 100%, in increments of 10%. VA calculates the total service-connected disability by combining evaluations for individual disabilities rather than adding them. VA pays additional special monthly compensation when severe disabilities confine Veterans to their immediate premises, require the aid and assistance of others, or include anatomical loss or loss of use of extremities or creative organs. Photo credit: U.S. Air Force 56 Regional offices 12,918 employees 4.6 million compensation & service-connected death benefit recipients
Transcript
A note on the data:
The 2015 Annual Benefits Report is based on data from the VBA corporate database.
The availability of gender and age data is limited, as some records are listed as “unknown.” Those records are accounted for in the totals for each table, but not in the category columns. Please see footnotes for additional information.
All Veterans counted in this section are receiving compensation benefit payments as of Sept. 30, 2015. The category of 0% indicates payment due to special monthly compensation or two or more permanent 0% service-connected disabilities which clearly interfere with normal employability. Veterans with a 0% combined degree of disability not receiving payment are not counted in this section.
Please see the section: “A Note on How the FY 2015 Compensation Data is Presented” on page 2 for important information on the color coding of the data tables.
Dependency and Indemnity Compensation data are found beginning on page 48.
Compensation Service-Connected Disability or Death Benefits
The Compensation program provides tax-free monthly benefits to Veterans in recognition of the effects of disabilities caused by diseases, events, or injuries incurred or aggravated during active military service. The program also provides monthly payments to surviving spouses, dependent children, and dependent parents in recognition of the economic loss caused by the death of individuals during their military service or as a result of service-connected disability after their discharge.
To be eligible for disability compensation, the Veteran must have served under conditions other than dishonorable, and the disability must not be the result of the Veteran’s own misconduct. VA pays disability compensation monthly, and the amount varies according to the degree of disability and the number of dependents. The degree of disability is graduated from 0% to 100%, in increments of 10%. VA calculates the total service-connected disability by combining evaluations for individual disabilities rather than adding them. VA pays additional special monthly compensation when severe disabilities confine Veterans to their immediate premises, require the aid and assistance of others, or include anatomical loss or loss of use of extremities or creative organs.
Photo credit: U.S. Air Force
56 Regional offices 12,918 employees 4.6 million compensation & service-connected death benefit recipients
U.S. Departmentof Veterans Affairs
Administration
Compensation - Page 2
of 52
Table of Contents Compensation ---------------------------------------------------------------------------------------------------------------------------1
Service-Connected Disability or Death Benefits --------------------------------------------------------------------------------------------------------------- 1 A Note on How the FY 2015 Compensation Data is Presented -------------------------------------------------------------------------------------- 3 Global War on Terror (GWOT) Information Integrated Into Period of Service Sections ------------------------------------------------- 3 Quick Reference: Recipients, Payments and Disabilities ------------------------------------------------------------------------------------------------ 4 Quick Reference: Recipients and Disabilities by Period of Service -------------------------------------------------------------------------------- 6 GWOT Quick Reference: Veterans With Global War on Terror Status ----------------------------------------------------------------------------- 7 Veterans by Fiscal Year and Combined Degree of Disability ------------------------------------------------------------------------------------------- 8 Veterans by Combined Degree of Disability and Gender ------------------------------------------------------------------------------------------------ 10 Estimated Total Amounts Paid Annually by Combined Degree of Disability and Gender ---------------------------------------------- 12 Estimated Average Individual Amounts Paid Annually by Combined Degree of Disability and Gender ----------------------- 14 Veterans and Estimated Annual Payments by Age ---------------------------------------------------------------------------------------------------------- 16 Charts: Veterans and Estimated Annual Payments by Age --------------------------------------------------------------------------------------------- 17 Veterans and Estimated Annual Payments by Period of Service ------------------------------------------------------------------------------------ 18 Charts: Veterans and Estimated Annual Payments by Period of Service ----------------------------------------------------------------------- 19 GWOT Veterans and Estimated Annual Payments by Gender ----------------------------------------------------------------------------------------- 20 GWOT Veterans and Estimated Annual Payments by Combined Disability Degree ------------------------------------------------------- 21 GWOT Veterans by Combined Degree of Disability and Gender ------------------------------------------------------------------------------------- 22 GWOT Estimated Total Amounts Paid Annually by Combined Degree of Disability and Gender ---------------------------------- 23 GWOT Estimated Average Individual Amounts Paid Annually by Combined Degree of Disability and Gender ------------ 24 Regarding Service-Connected Disability Data ------------------------------------------------------------------------------------------------------------------ 25 Number of SC Disabilities by Body System and Fiscal Year -------------------------------------------------------------------------------------------- 26 Number of SC Disabilities by Rating Evaluation Percent and Gender ---------------------------------------------------------------------------- 28 Number of SC Disabilities by Body System and Gender -------------------------------------------------------------------------------------------------- 29 Most Prevalent SC Disabilities by Gender ------------------------------------------------------------------------------------------------------------------------ 30 Number of SC Disabilities and Prevalence by Body System ------------------------------------------------------------------------------------------- 32 Number of SC Disabilities and Prevalence by Body System and Rating Evaluation Percent ---------------------------------------- 33 The Three Most Prevalent SC Disabilities by Body System --------------------------------------------------------------------------------------------- 35 Most Prevalent SC Disabilities – by Disability Type --------------------------------------------------------------------------------------------------------- 38 Most Prevalent SC Disabilities by Period of Service -------------------------------------------------------------------------------------------------------- 39 GWOT Most Prevalent SC Disabilities by Gender ------------------------------------------------------------------------------------------------------------- 42 GWOT SC Disabilities by Body System and Gender --------------------------------------------------------------------------------------------------------- 44 GWOT Three Most Prevalent SC Disabilities by Body System ----------------------------------------------------------------------------------------- 45
Dependency and Indemnity Compensation (DIC) ------------------------------------------------------------------48
New DIC recipients during FY 2011 to FY 2015 by relationship ------------------------------------------------------------------------------------ 48 All DIC recipients by relationship --------------------------------------------------------------------------------------------------------------------------------------- 48 New surviving spouse DIC recipients -------------------------------------------------------------------------------------------------------------------------------- 48 All surviving spouse DIC recipients by age ----------------------------------------------------------------------------------------------------------------------- 49 New surviving child DIC recipients by age ------------------------------------------------------------------------------------------------------------------------ 49 All surviving child DIC recipients by age --------------------------------------------------------------------------------------------------------------------------- 49
VBA Regional Office Addresses ----------------------------------------------------------------------------------------------------------------------------------------- 50 District Office Addresses---------------------------------------------------------------------------------------------------------------------------------------------------- 52 Centralized Mail Address --------------------------------------------------------------------------------------------------------------------------------------------------- 52 Contact Information ----------------------------------------------------------------------------------------------------------------------------------------------------------- 52
U.S. Department of Veterans Affairs
Veterans BenefitsAdministration
Com
pens
atio
n - P
age
3 o
f 52
A Note on How the FY 2015 Compensation Data is Presented
New to the rolls On the rolls
Individuals who began receiving benefits during fiscal year 2015 (October 1, 2014 to September 30, 2015) are considered “New to the rolls,” and the tables are outlined in blue.
All individuals receiving benefits on September 30, 2015 are considered “On the rolls” and the tables are outlined in green. These tables include “New to the rolls” recipients.
Please note the difference between counts of Veterans and counts of disabilities. A Veteran may be receiving benefits based on one or more disabilities, which is why numbers of disabilities are much higher than numbers of Veterans. Counts of disabilities are indicated by the section title and table header and begin on page 25.
Global War on Terror (GWOT) Information Integrated Into Period of Service Sections
The Global War on Terror (GWOT) data have been added to the main data tables and are a subset of the Gulf War era (GW) period of service. Since September 11, 2001, the Department of Defense has been deployed overseas in support of GWOT, including Operation Iraqi Freedom/Operation Enduring Freedom/Operation New Dawn (OIF/OEF/OND).
VBA’s computer systems do not contain data that would allow us to attribute Veterans’ disabilities to a specific period of service or deployment. Therefore, GWOT is a subset that includes Veterans who filed a disability compensation claim at some point either prior to or following their GWOT deployment. VBA is not able to identify which of these Veterans filed a claim for disabilities incurred during their actual overseas GWOT deployment.
GWOT data have not been removed from any other discussion of period of service and are contained within the “Gulf War Era” in all tables. For more information see pages 7, 20 through 24, and 42 through 47.
The Office of Performance Analysis and Integrity is available to answer questions regarding the data contained in this report by email at [email protected].
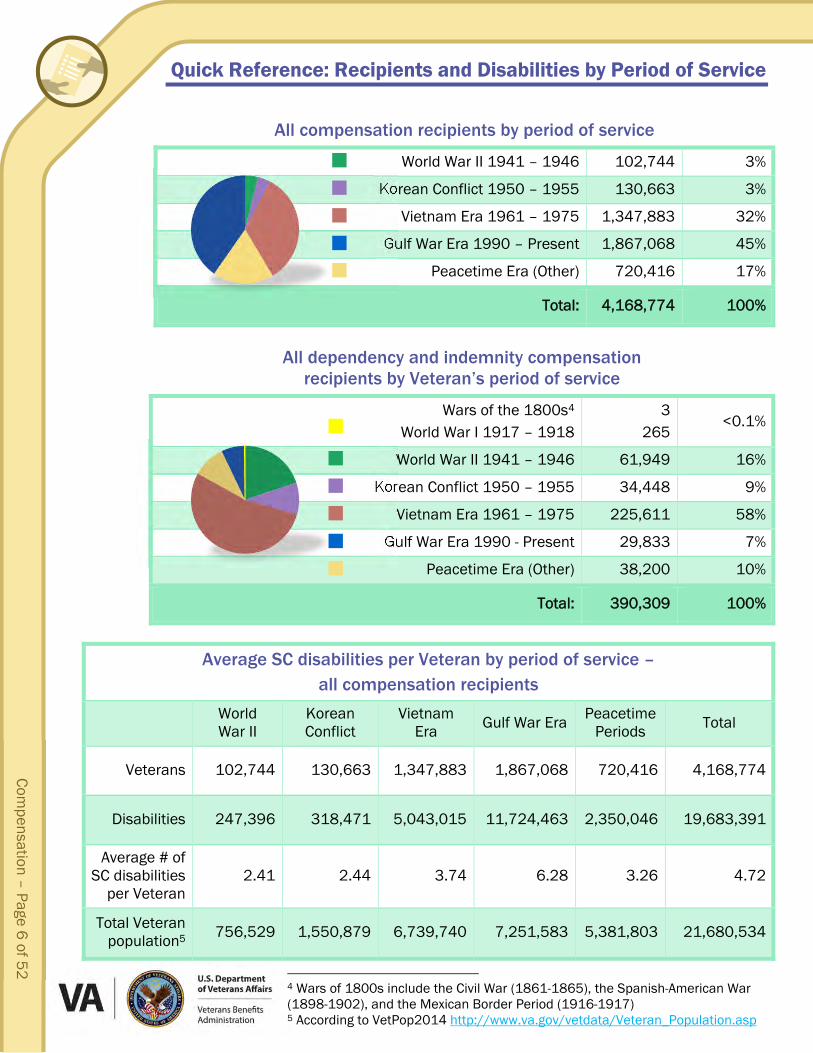
Total Veteran population5 756,529 1,550,879 6,739,740 7,251,583 5,381,803 21,680,534
4 Wars of 1800s include the Civil War (1861-1865), the Spanish-American War (1898-1902), and the Mexican Border Period (1916-1917) 5 According to VetPop2014 http://www.va.gov/vetdata/Veteran_Population.asp
GWOT Quick Reference: Veterans With Global War on Terror Status
GWOT data have not been removed from any other discussion of period of service and are contained within the “Gulf War Era” in all other tables. For more information see pages 20 through 24 and 42 through 47.
All Gulf War Era compensation recipients by GWOT status
GWOT 971,117 52%
Non-GWOT 895,951 48%
Gulf War Era Total: 1,867,068 100%
Number of SC disabilities of all Gulf War Era compensation recipients by GWOT status
GWOT 7,091,080 60%
Non-GWOT 4,633,383 40%
Gulf War Era Total: 11,724,463 100%
All Gulf War Era compensation recipients - average number of SC disabilities per Veteran by GWOT status
GWOT Non-GWOT Gulf War Era Total
7.30 5.17 6.28
0%
10%
20%
30%
40%
50%
60%
Veterans Disabilities
Per
cent
of a
ll G
ulf W
ar E
raco
mpe
nsat
ion
reci
pien
ts
GW
OT
-60
%
Non
-GW
OT
-40
%
GW
OT
-52
%
Non
-GW
OT
-48
%
Compensation –
Page 8 of 5
2
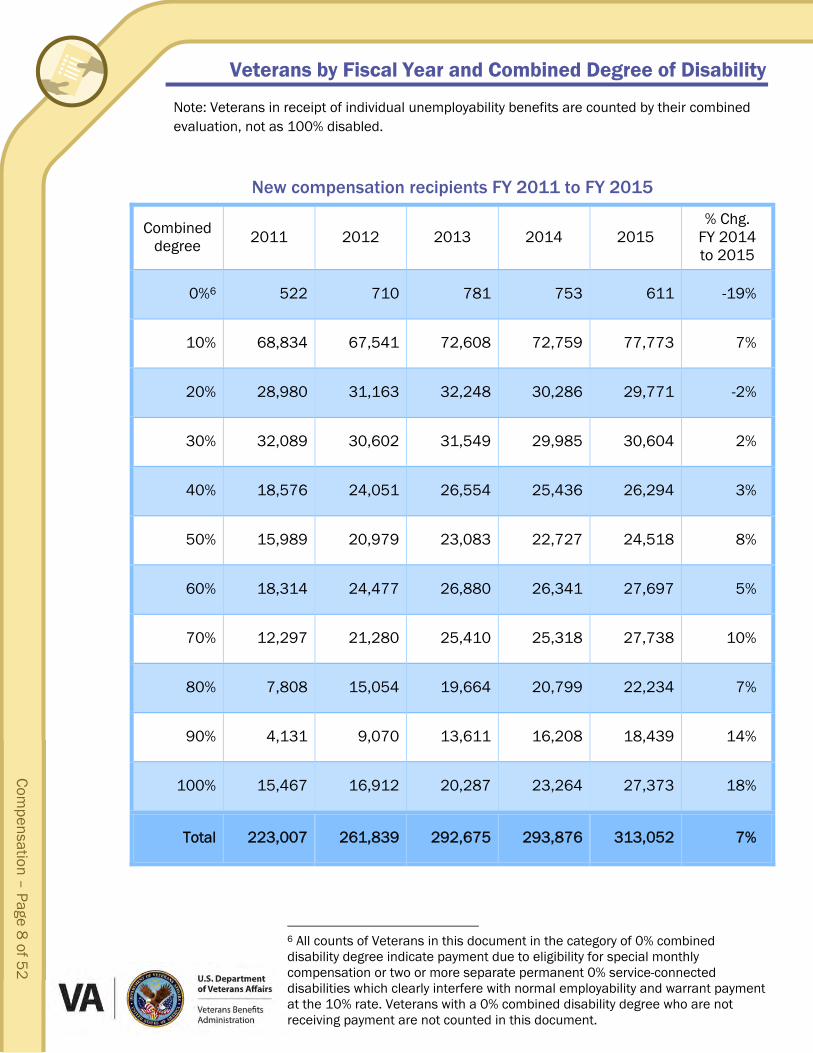
Veterans by Fiscal Year and Combined Degree of Disability
Note: Veterans in receipt of individual unemployability benefits are counted by their combined evaluation, not as 100% disabled.
New compensation recipients FY 2011 to FY 2015
Combined degree 2011 2012 2013 2014 2015
% Chg. FY 2014 to 2015
0%6 522 710 781 753 611 -19%
10% 68,834 67,541 72,608 72,759 77,773 7%
20% 28,980 31,163 32,248 30,286 29,771 -2%
30% 32,089 30,602 31,549 29,985 30,604 2%
40% 18,576 24,051 26,554 25,436 26,294 3%
50% 15,989 20,979 23,083 22,727 24,518 8%
60% 18,314 24,477 26,880 26,341 27,697 5%
70% 12,297 21,280 25,410 25,318 27,738 10%
80% 7,808 15,054 19,664 20,799 22,234 7%
90% 4,131 9,070 13,611 16,208 18,439 14%
100% 15,467 16,912 20,287 23,264 27,373 18%
Total 223,007 261,839 292,675 293,876 313,052 7%
6 All counts of Veterans in this document in the category of 0% combined disability degree indicate payment due to eligibility for special monthly compensation or two or more separate permanent 0% service-connected disabilities which clearly interfere with normal employability and warrant payment at the 10% rate. Veterans with a 0% combined disability degree who are not receiving payment are not counted in this document.
Com
pens
atio
n –
Pag
e 9
of 5
2
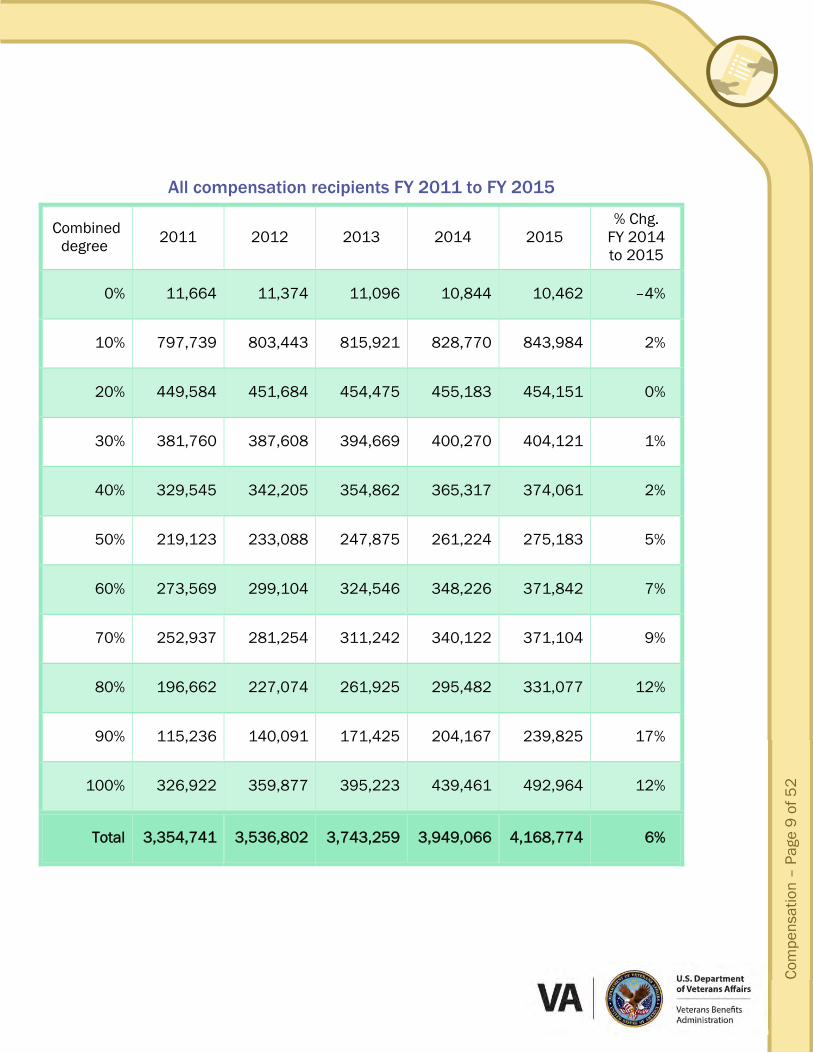
All compensation recipients FY 2011 to FY 2015
Combined degree 2011 2012 2013 2014 2015
% Chg. FY 2014 to 2015
0% 11,664 11,374 11,096 10,844 10,462 –4%
10% 797,739 803,443 815,921 828,770 843,984 2%
20% 449,584 451,684 454,475 455,183 454,151 0%
30% 381,760 387,608 394,669 400,270 404,121 1%
40% 329,545 342,205 354,862 365,317 374,061 2%
50% 219,123 233,088 247,875 261,224 275,183 5%
60% 273,569 299,104 324,546 348,226 371,842 7%
70% 252,937 281,254 311,242 340,122 371,104 9%
80% 196,662 227,074 261,925 295,482 331,077 12%
90% 115,236 140,091 171,425 204,167 239,825 17%
100% 326,922 359,877 395,223 439,461 492,964 12%
Total 3,354,741 3,536,802 3,743,259 3,949,066 4,168,774 6%
Compensation –
Page 10
of 52
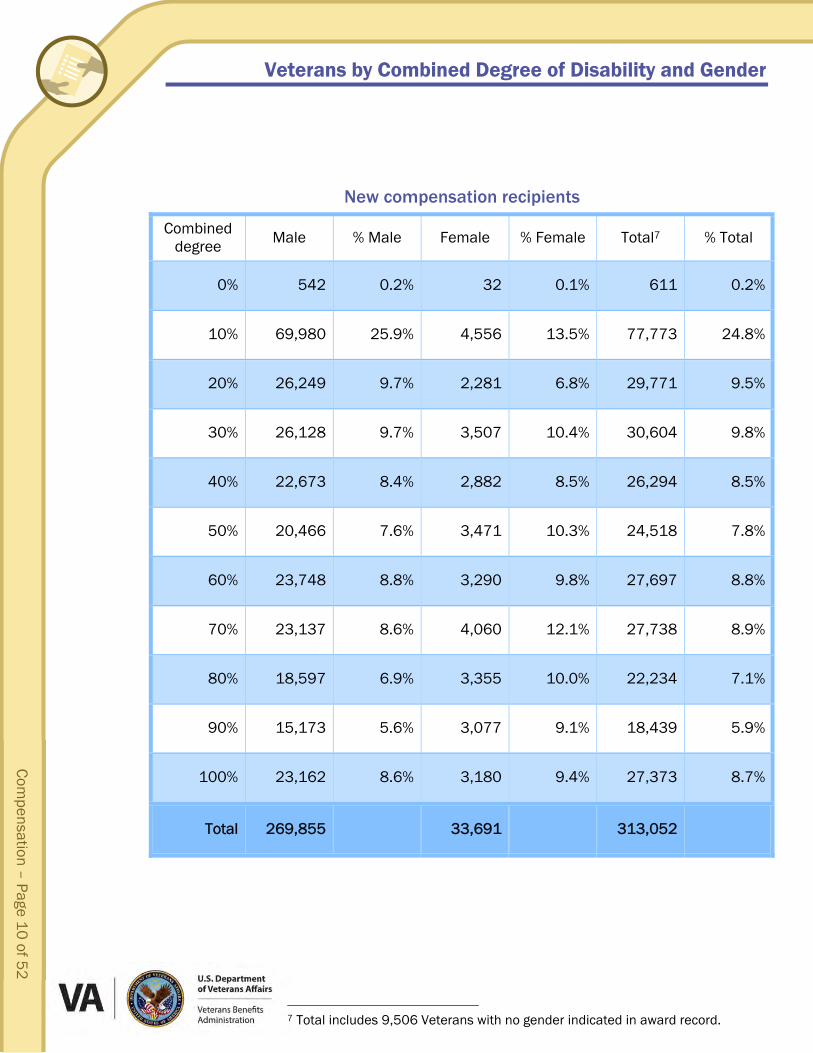
Veterans by Combined Degree of Disability and Gender
New compensation recipients
Combined degree Male % Male Female % Female Total7 % Total
0% 542 0.2% 32 0.1% 611 0.2%
10% 69,980 25.9% 4,556 13.5% 77,773 24.8%
20% 26,249 9.7% 2,281 6.8% 29,771 9.5%
30% 26,128 9.7% 3,507 10.4% 30,604 9.8%
40% 22,673 8.4% 2,882 8.5% 26,294 8.5%
50% 20,466 7.6% 3,471 10.3% 24,518 7.8%
60% 23,748 8.8% 3,290 9.8% 27,697 8.8%
70% 23,137 8.6% 4,060 12.1% 27,738 8.9%
80% 18,597 6.9% 3,355 10.0% 22,234 7.1%
90% 15,173 5.6% 3,077 9.1% 18,439 5.9%
100% 23,162 8.6% 3,180 9.4% 27,373 8.7%
Total 269,855 33,691 313,052
7 Total includes 9,506 Veterans with no gender indicated in award record.
Com
pens
atio
n –
Pag
e 1
1 o
f 52
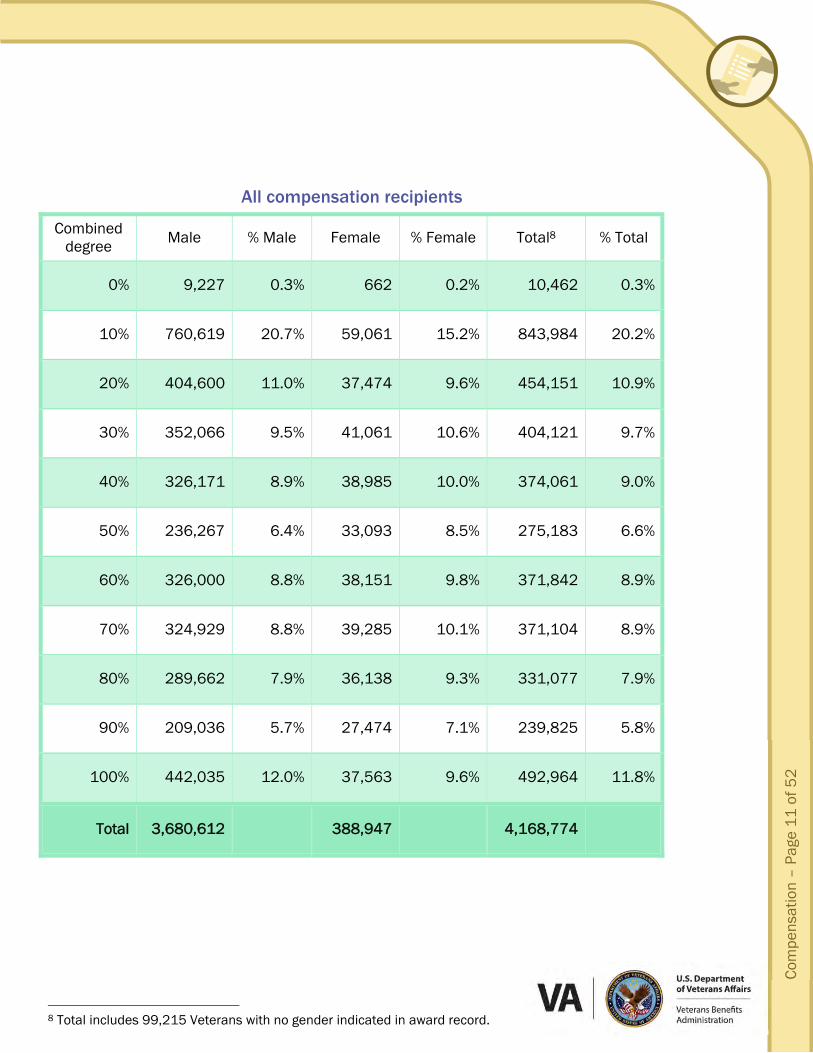
All compensation recipients
Combined degree Male % Male Female % Female Total8 % Total
0% 9,227 0.3% 662 0.2% 10,462 0.3%
10% 760,619 20.7% 59,061 15.2% 843,984 20.2%
20% 404,600 11.0% 37,474 9.6% 454,151 10.9%
30% 352,066 9.5% 41,061 10.6% 404,121 9.7%
40% 326,171 8.9% 38,985 10.0% 374,061 9.0%
50% 236,267 6.4% 33,093 8.5% 275,183 6.6%
60% 326,000 8.8% 38,151 9.8% 371,842 8.9%
70% 324,929 8.8% 39,285 10.1% 371,104 8.9%
80% 289,662 7.9% 36,138 9.3% 331,077 7.9%
90% 209,036 5.7% 27,474 7.1% 239,825 5.8%
100% 442,035 12.0% 37,563 9.6% 492,964 11.8%
Total 3,680,612 388,947 4,168,774
8 Total includes 99,215 Veterans with no gender indicated in award record.
Compensation –
Page 12
of 52
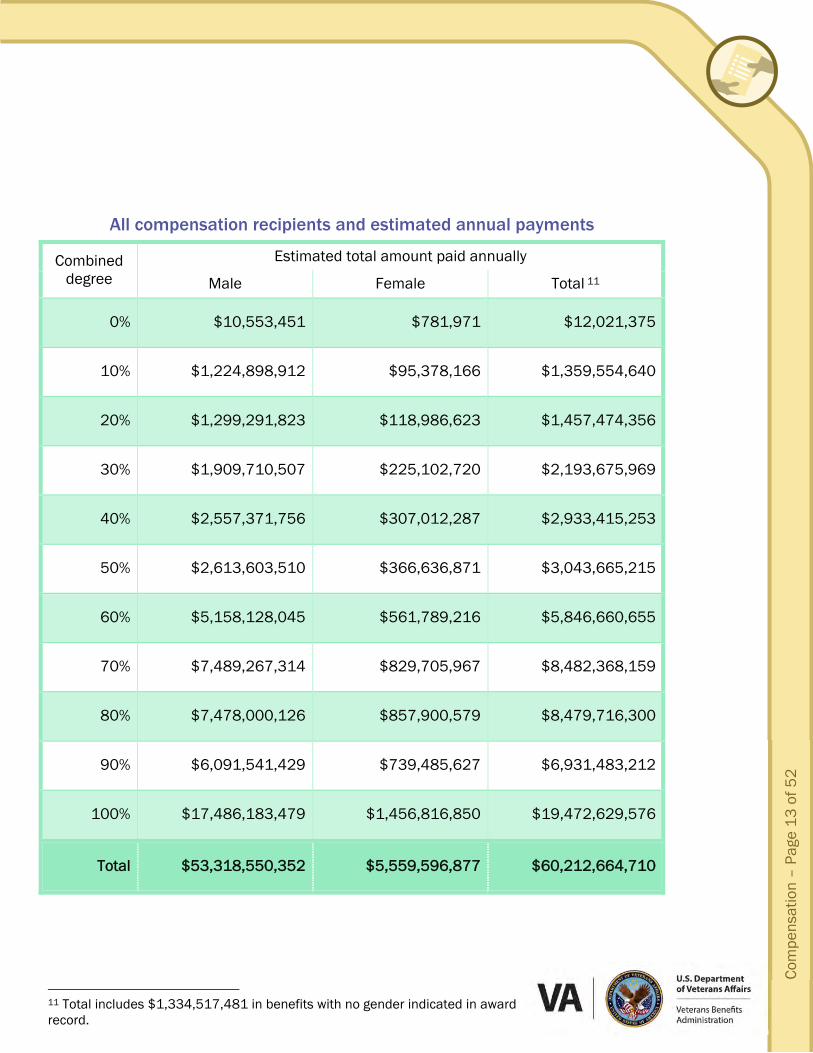
Estimated Total Amounts Paid Annually by Combined Degree of Disability and Gender
Figures regarding amounts paid in this document do not reflect actual amounts paid by VA. This document only addresses monthly benefit payment amounts and does not include retroactive payments or partial year enrollment. Please refer to the official budget internet site here http://www.va.gov/budget/ for actual amounts paid by VA.
New compensation recipients and estimated annual payments
Combined degree
Estimated total amount paid annually
Male Female Total 9
0%10 $666,155 $39,557 $751,422
10% $112,104,674 $7,286,135 $124,612,605
20% $83,991,904 $7,206,447 $95,264,597
30% $136,741,392 $18,381,893 $160,119,596
40% $172,302,040 $21,848,185 $199,704,306
50% $218,453,195 $37,028,934 $261,555,317
60% $324,837,671 $44,719,214 $378,343,340
70% $399,714,738 $69,753,769 $478,642,133
80% $380,269,022 $67,164,629 $453,024,889
90% $353,879,479 $70,063,486 $428,177,580
100% $880,405,512 $119,005,740 $1,038,147,581
Total $3,063,365,782 $462,497,989 $3,618,343,366
9 Total includes $92,479,595 in benefits with no gender indicated in award record. 10 All amounts of payment in this document in the category of 0% combined disability degree are due to special monthly compensation or two or more permanent 0% service-connected disabilities which clearly interfere with normal employability and warrant payment at the 10% rate.
Total $53,318,550,352 $5,559,596,877 $60,212,664,710
11 Total includes $1,334,517,481 in benefits with no gender indicated in award record.
Compensation –
Page 14
of 52
Estimated Average Individual Amounts Paid Annually by Combined Degree of Disability and Gender
Note: Estimated average individual amounts paid annually for the same combined degree differ slightly due to additional amounts paid for dependents and special monthly compensation.
New compensation recipients and estimated annual payments
Combined degree
Estimated average individual amount paid annually
Male Female Total
0% $1,229 $1,236 $1,230
10% $1,602 $1,599 $1,602
20% $3,200 $3,159 $3,200
30% $5,234 $5,241 $5,232
40% $7,599 $7,581 $7,595
50% $10,674 $10,668 $10,668
60% $13,679 $13,592 $13,660
70% $17,276 $17,181 $17,256
80% $20,448 $20,019 $20,375
90% $23,323 $22,770 $23,221
100% $38,011 $37,423 $37,926
Total $11,352 $13,728 $11,558
Com
pens
atio
n –
Pag
e 1
5 o
f 52
All compensation recipients and estimated annual payments
Combined degree
Estimated average individual amount paid annually
Male Female Total
0% $1,144 $1,181 $1,149
10% $1,610 $1,615 $1,611
20% $3,211 $3,175 $3,209
30% $5,424 $5,482 $5,428
40% $7,841 $7,875 $7,842
50% $11,062 $11,079 $11,061
60% $15,822 $14,725 $15,724
70% $23,049 $21,120 $22,857
80% $25,816 $23,740 $25,613
90% $29,141 $26,916 $28,902
100% $39,558 $38,783 $39,501
Total $14,486 $14,294 $14,444
Compensation –
Page 16
of 52
Veterans and Estimated Annual Payments by Age
New compensation recipients and estimated annual payments
Age Number of Veterans
Estimated total amount paid
annually
Estimated average individual amount paid
annually
Age 34 and under 97,223 $1,187,774,765 $12,217
Age 35 through 54 96,903 $1,340,331,747 $13,832
Age 55 through 74 97,785 $891,923,874 $9,121
Age 75 and over 21,135 $198,270,525 $9,381
Total12 313,052 $3,618,343,366 $11,558
All compensation recipients and estimated annual payments
Age Number of Veterans
Estimated total amount paid
annually
Estimated average individual amount paid
annually
Age 34 and under 520,503 $6,718,364,069 $12,907
Age 35 through 54 1,211,550 $16,405,984,426 $13,541
Age 55 through 74 1,929,234 $30,528,694,130 $15,824
Age 75 and over 506,713 $6,554,296,485 $12,935
Total13 4,168,774 $60,212,664,710 $14,444
12 Total includes 6 Veterans and $42,455 in total estimated annual payment amounts unidentifiable by age. 13 Total includes 774 Veterans and $5,325,600 in total estimated annual payment amounts unidentifiable by age.
Com
pens
atio
n –
Pag
e 1
7 o
f 52
Charts: Veterans and Estimated Annual Payments by Age
The chart below displays the ages of the Veterans who began receiving benefits in FY 2015 (blue line, left axis) vs. the total number of Veterans receiving benefits at the end of the fiscal year (green line, right axis).
New compensation recipients compared to all compensation recipients by age
The chart below displays the estimated average individual amount paid annually to Veterans who began receiving benefits in FY 2015 (blue bars on the left) vs. the estimated average individual amount paid annually for all Veterans receiving benefits at the end of the fiscal year (green bars on the right) broken down by age.
New compensation recipients compared to all compensation recipients by estimated average individual amounts paid annually and age
Age 34 Age 55 Age 74
0
50,000
100,000
150,000
200,000
250,000
0
5,000
10,000
15,000
20,000
25,000
18 24 30 36 42 48 54 60 66 72 78 84 90
All
Rec
ipie
nts
New
Rec
ipie
nts
Veteran Age
New compensation recipients (Left Axis)
All compensation recipients (Right Axis)
$0
$2,000
$4,000
$6,000
$8,000
$10,000
$12,000
$14,000
$16,000
$0
$2,000
$4,000
$6,000
$8,000
$10,000
$12,000
$14,000
$16,000
Age 34 and under Age 35 through 54 Age 55 through 74 Age 75 and over
Estim
ated
Ave
rage
Ann
ual A
mou
ntAl
l rec
ipie
nts
Esti
mat
ed A
vera
ge A
nnua
l Am
ount
New
reci
pien
ts
New compensation recipients All compensation recipients
$12,
217
$12,
907
$13,
832
$13,
541
$9,1
21
$15,
824
$9,3
81
$12,
935
Compensation –
Page 18
of 52
Veterans and Estimated Annual Payments by Period of Service
New compensation recipients and estimated annual payments
Period of service Number of Veterans
Estimated total amount paid annually
Estimated average individual amount paid
annually
World War II 3,414 $37,544,438 $10,997
Korean Conflict 6,868 $56,836,002 $8,275
Vietnam Era 75,272 $741,780,498 $9,855
Gulf War Era 188,321 $2,530,181,513 $13,435
Peacetime Era 39,177 $252,000,915 $6,432
Total 313,052 $3,618,343,366 $11,558
All compensation recipients and estimated annual payments
Period of service Number of Veterans
Estimated total amount paid annually
Estimated average individual amount paid
annually
World War II 102,744 $1,276,201,117 $12,421
Korean Conflict 130,663 $1,525,929,525 $11,678
Vietnam Era 1,347,883 $23,720,336,430 $17,598
Gulf War Era 1,867,068 $25,699,001,914 $13,764
Peacetime Era 720,416 $7,991,195,724 $11,092
Total 4,168,774 $60,212,664,710 $14,444
Com
pens
atio
n –
Pag
e 1
9 o
f 52
Charts: Veterans and Estimated Annual Payments by Period of Service
The chart below displays the distribution of the number of Veterans by period of service. The blue bars in the top row are new compensation recipients and the green bars on the bottom row indicate all Veterans receiving benefits at the end of the fiscal year.
New compensation recipients compared to all compensation recipients distribution by period of service
The chart below displays the estimated average individual amount paid annually to Veterans who began receiving benefits in FY 2015 (blue bars on the left) vs. the estimated average individual amount paid annually for all Veterans receiving benefits at the end of the fiscal year (green bars on the right) broken down by period of service.
New compensation recipients compared to all compensation recipients by estimated average individual amount paid annually and period of service
32.33%
24.05%
44.79%
60.16%
17.28%
12.51%
AllCompensation
Recipients
NewCompensation
Recipients
Vietnam Era Peacetime EraGulf War Era WorldWar II
KoreanConflict
1.09%
2.47%
2.19%
3.13%
$0
$2,000
$4,000
$6,000
$8,000
$10,000
$12,000
$14,000
$16,000
$18,000
World War II Korean Conflict Vietnam Era Gulf War Era Peacetime Era
New compensation recipients All compensation recipients
$10,
997
$12,
421
$8,2
75
$11,
678
$9,8
55
$17,
598
$13,
435
$13,
764
$6,4
32
$11,
092
Esti
mat
ed A
vera
ge A
nnua
l Am
ount
All
reci
pien
ts
Esti
mat
ed A
vera
ge A
nnua
l Am
ount
New
rec
ipie
nts
Compensation –
Page 20
of 52
GWOT Veterans and Estimated Annual Payments by Gender
The Global War on Terror (GWOT) data are a subset of the Gulf War era period of service and have not been removed from any other discussion of period of service.
New GWOT compensation recipients and estimated annual payments
Gender Number of Veterans
Estimated total amount paid
annually
Estimated average individual amount paid
annually
Male 112,175 $1,629,465,327 $14,526
Female 17,800 $274,965,241 $15,447
Total14 130,374 $1,910,084,754 $14,651
All GWOT compensation recipients and estimated annual payments
Gender Number of Veterans
Estimated total amount paid
annually
Estimated average individual amount paid
annually
Male 835,297 $12,677,312,842 $15,177
Female 130,921 $1,971,649,182 $15,060
Total15 971,117 $14,712,237,661 $15,150
14 Total includes 399 Veterans and $5,654,186 in payments with no gender indicated in the award record. 15 Total includes 4,899 Veterans and $63,275,637 in payments with no gender indicated in the award record.
Com
pens
atio
n –
Pag
e 2
1 o
f 52
GWOT Veterans and Estimated Annual Payments by Combined Disability Degree
New GWOT compensation recipients and estimated annual payments
Combined degree
Number of Veterans
Estimated total amount paid annually
Estimated average individual amount paid annually
0% 91 $111,135 $1,221
10% 15,100 $24,222,637 $1,604
20% 8,195 $26,010,501 $3,174
30% 11,618 $62,085,736 $5,344
40% 11,915 $91,866,575 $7,710
50% 11,661 $126,387,078 $10,838
60% 15,202 $210,385,541 $13,839
70% 15,337 $266,908,220 $17,403
80% 15,391 $315,807,941 $20,519
90% 13,650 $318,668,709 $23,346
100% 12,214 $467,630,681 $38,286
Total 130,374 $1,910,084,754 $14,651
Compensation –
Page 22
of 52
GWOT Veterans by Combined Degree of Disability and Gender
All GWOT compensation recipients
Combined degree Male % Male Female % Female Total16 % Total
0% 516 0.1% 81 0.1% 602 0.1%
10% 91,920 11.0% 13,136 10.0% 105,897 10.9%
20% 65,385 7.8% 9,680 7.4% 75,693 7.8%
30% 77,136 9.2% 12,541 9.6% 90,134 9.3%
40% 82,230 9.9% 13,762 10.5% 96,440 9.9%
50% 68,294 8.2% 11,515 8.8% 80,182 8.3%
60% 103,125 12.3% 14,877 11.3% 118,486 12.2%
70% 94,498 11.3% 14,263 10.9% 109,203 11.2%
80% 100,684 12.1% 15,679 12.0% 116,873 12.0%
90% 75,343 9.0% 12,804 9.8% 88,493 9.1%
100% 76,166 9.1% 12,583 9.6% 89,114 9.2%
Total 835,297 100% 130,921 100% 971,117 100%
16 Total includes 4,899 Veterans with no gender indicated in award record.
Com
pens
atio
n –
Pag
e 2
3 o
f 52
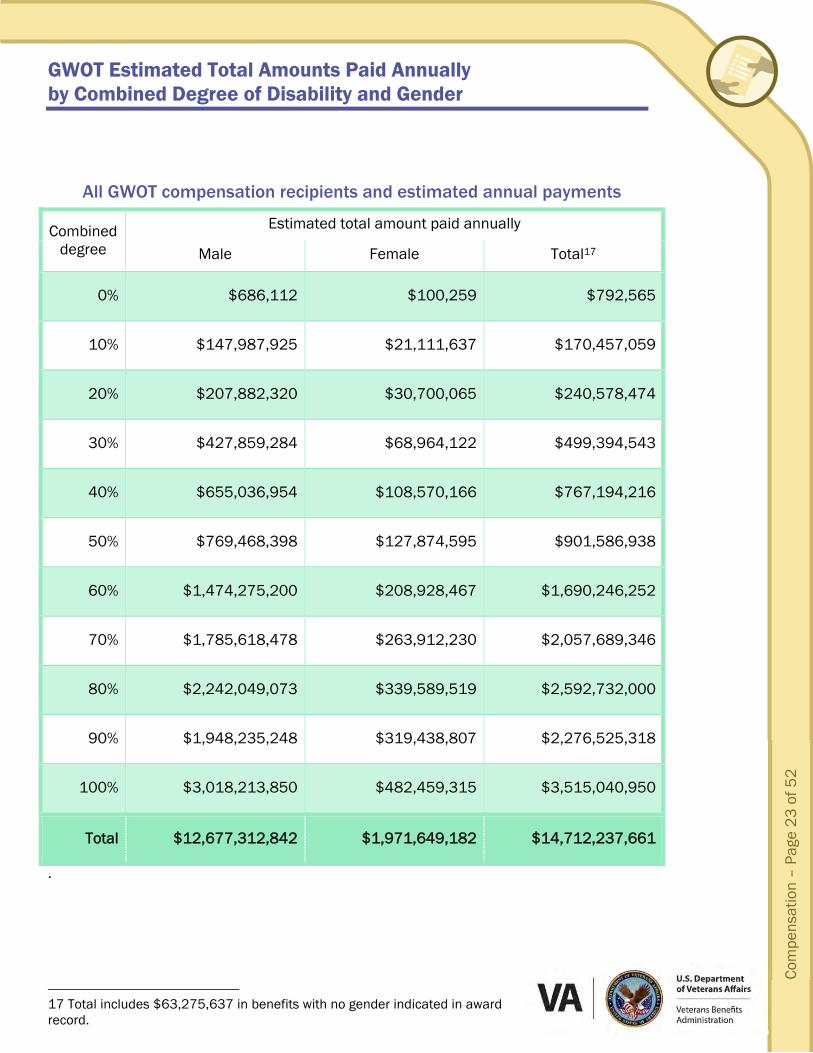
GWOT Estimated Total Amounts Paid Annually by Combined Degree of Disability and Gender
All GWOT compensation recipients and estimated annual payments
Combined degree
Estimated total amount paid annually
Male Female Total17
0% $686,112 $100,259 $792,565
10% $147,987,925 $21,111,637 $170,457,059
20% $207,882,320 $30,700,065 $240,578,474
30% $427,859,284 $68,964,122 $499,394,543
40% $655,036,954 $108,570,166 $767,194,216
50% $769,468,398 $127,874,595 $901,586,938
60% $1,474,275,200 $208,928,467 $1,690,246,252
70% $1,785,618,478 $263,912,230 $2,057,689,346
80% $2,242,049,073 $339,589,519 $2,592,732,000
90% $1,948,235,248 $319,438,807 $2,276,525,318
100% $3,018,213,850 $482,459,315 $3,515,040,950
Total $12,677,312,842 $1,971,649,182 $14,712,237,661
.
17 Total includes $63,275,637 in benefits with no gender indicated in award record.
Compensation –
Page 24
of 52
GWOT Estimated Average Individual Amounts Paid Annually by Combined Degree of Disability and Gender
All GWOT compensation recipients and estimated annual payments
Combined degree
Estimated average individual amount paid annually
Male Female Total
0% $1,330 $1,238 $1,317
10% $1,610 $1,607 $1,610
20% $3,179 $3,171 $3,178
30% $5,547 $5,499 $5,541
40% $7,966 $7,889 $7,955
50% $11,267 $11,105 $11,244
60% $14,296 $14,044 $14,265
70% $18,896 $18,503 $18,843
80% $22,268 $21,659 $22,184
90% $25,858 $24,948 $25,725
100% $39,627 $38,342 $39,444
Total $15,177 $15,060 $15,150
Com
pens
atio
n –
Pag
e 2
5 o
f 52
Regarding Service-Connected Disability Data
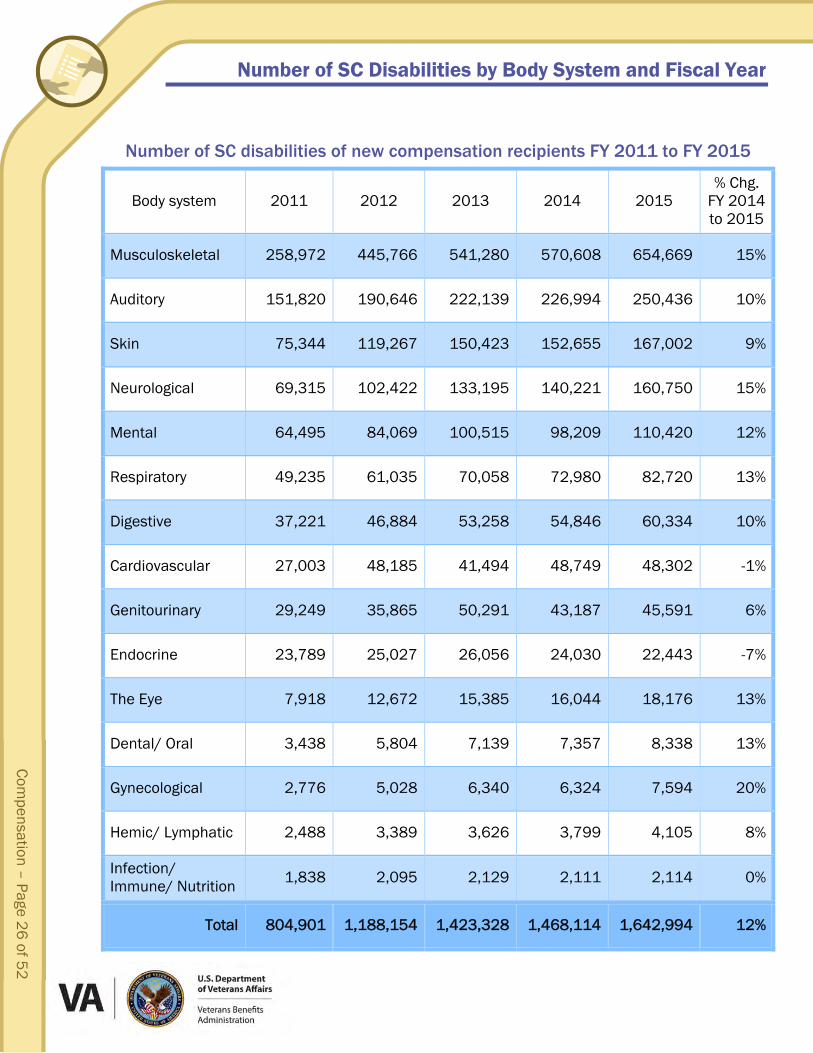
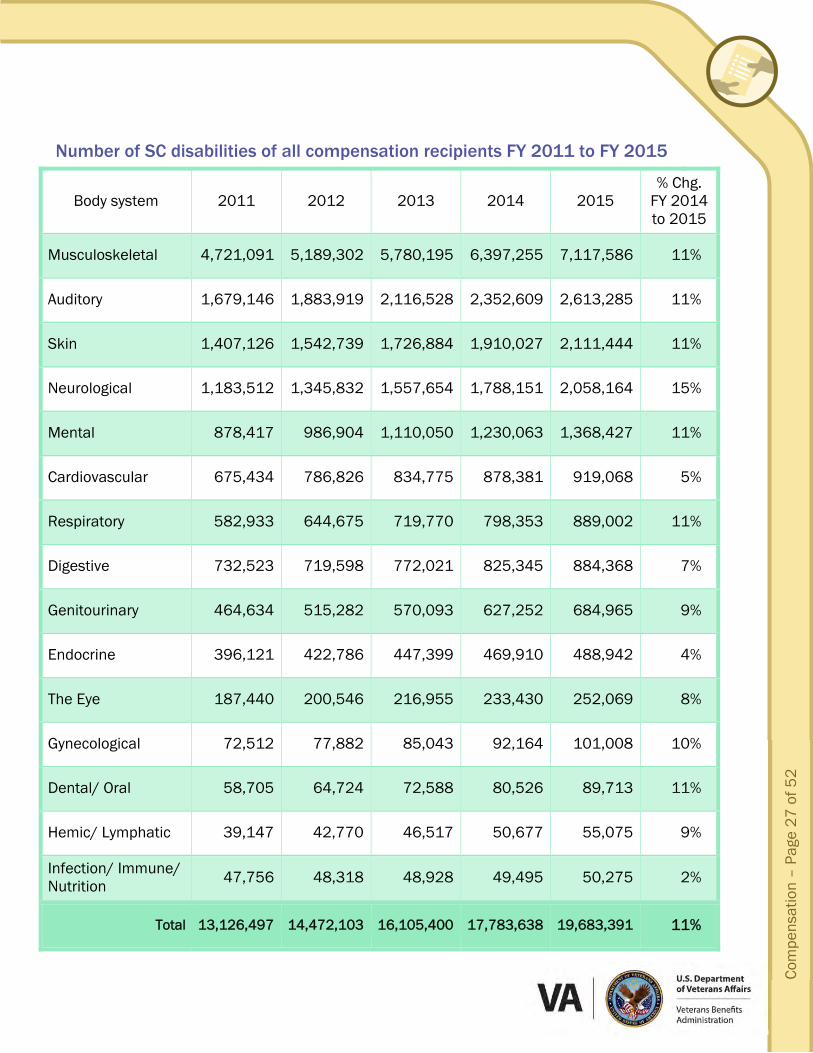
The tables on the following pages present information according to the number of service-connected disabilities – not the number of Veterans with that evaluation or disability.
Tables labeled “Number of SC disabilities of new compensation recipients” display counts of service-connected disabilities which were rated for new recipients during FY 2015. Tables labeled “Number of SC disabilities of all compensation recipients” display counts of all rated service-connected disabilities for all Veterans receiving compensation at the end of FY 2015.
The names of the body systems have been abbreviated to allow for a clearer presentation of the information. The three body systems with the greatest change are:
“Organs of special sense” abbreviated to: “The Eye”
“Infectious Diseases, Immune Disorders, and Nutritional Deficiencies” abbreviated to: “Infection/Immune/Nutrition”
“Neurological Conditions and Convulsive Disorders” abbreviated to: “Neurological”
Any use of the term “Disabilities” in the following section includes service-connected disabilities only.
Compensation –
Page 26
of 52
Number of SC Disabilities by Body System and Fiscal Year
Number of SC disabilities of new compensation recipients FY 2011 to FY 2015
Total 13,126,497 14,472,103 16,105,400 17,783,638 19,683,391 11%
Compensation –
Page 28
of 52
Number of SC Disabilities by Rating Evaluation Percent and Gender
Number of SC disabilities of all compensation recipients
Rating evaluation percent Male Female Total18
0% 5,724,887 806,716 6,626,116
10% 6,803,136 887,109 7,808,752
20% 1,645,928 139,178 1,824,016
30% 1,082,877 178,507 1,289,291
40% 370,660 37,358 417,792
50% 570,350 82,345 662,115
60% 254,580 16,314 278,104
70% 313,061 36,677 355,515
80% 18,170 844 19,720
90% 4,325 152 4,657
100% 360,849 24,311 397,307
Total19 17,148,829 2,209,511 19,683,391
18 Total includes 325,051 disabilities unidentifiable by gender. 19 Totals include 6 male disabilities unidentifiable by rating evaluation percent.
Com
pens
atio
n –
Pag
e 2
9 o
f 52
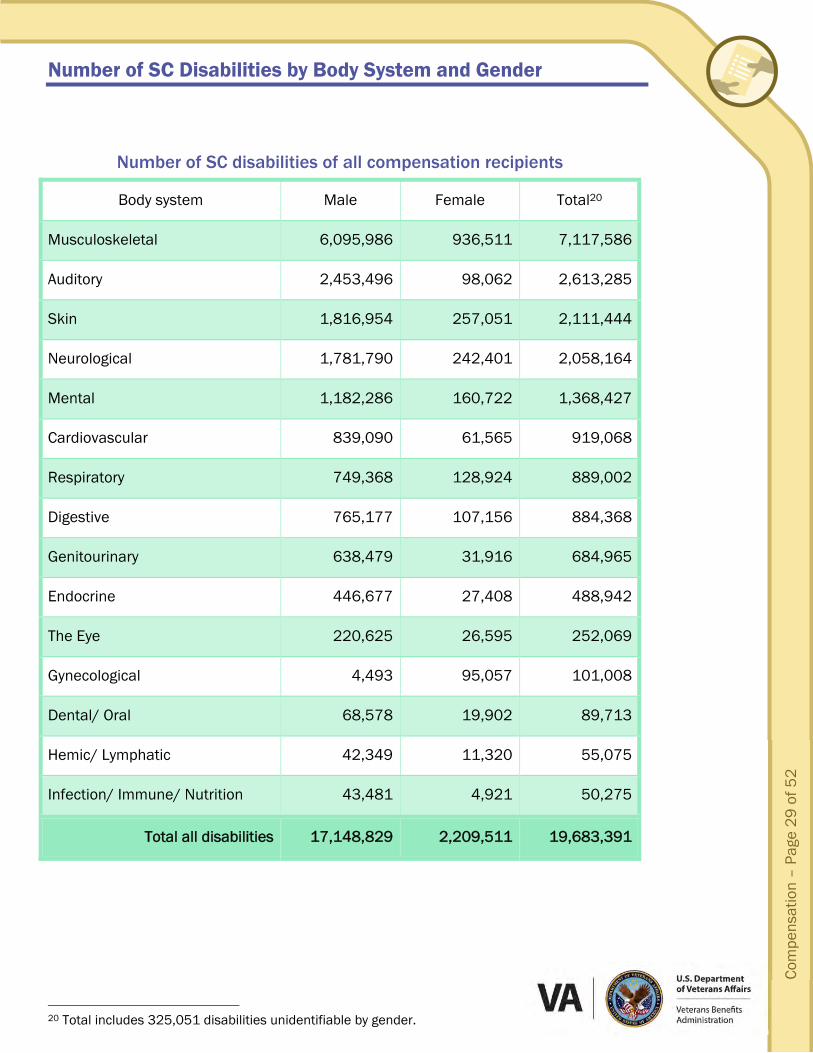
Number of SC Disabilities by Body System and Gender
Number of SC disabilities of all compensation recipients
Body system Male Female Total20
Musculoskeletal 6,095,986 936,511 7,117,586
Auditory 2,453,496 98,062 2,613,285
Skin 1,816,954 257,051 2,111,444
Neurological 1,781,790 242,401 2,058,164
Mental 1,182,286 160,722 1,368,427
Cardiovascular 839,090 61,565 919,068
Respiratory 749,368 128,924 889,002
Digestive 765,177 107,156 884,368
Genitourinary 638,479 31,916 684,965
Endocrine 446,677 27,408 488,942
The Eye 220,625 26,595 252,069
Gynecological 4,493 95,057 101,008
Dental/ Oral 68,578 19,902 89,713
Hemic/ Lymphatic 42,349 11,320 55,075
Infection/ Immune/ Nutrition 43,481 4,921 50,275
Total all disabilities 17,148,829 2,209,511 19,683,391
20 Total includes 325,051 disabilities unidentifiable by gender.
Compensation –
Page 30
of 52
Most Prevalent SC Disabilities by Gender
The table below shows the most prevalent SC disabilities and the relative percent of the total number of SC disabilities each represents. The ten disabilities listed below represent over one third of all disabilities rated to be service-connected. The other two thirds are made up of over 900 other disabilities, which each make up 2% or less of the total.
Most prevalent SC disabilities of new compensation recipients
Disability Body system Male % Female % Total %Total
Total most prevalent disabilities Total number of disabilities
6,529,142 17,148,829
38% 100%
578,226 2,209,511
26% 100%
7,237,853 19,683,391
37% 100%
22 The number of lumbosacral or cervical strain disabilities in this report includes disabilities which, in Annual Benefits Reports prior to FY 13, were counted under 5 discontinued disability names related to lumbosacral or cervical strain.
Compensation –
Page 32
of 52
Number of SC Disabilities and Prevalence by Body System
The detail table number corresponds to the tables on the following pages which show the number of SC disabilities in each body system broken down by rating evaluation percent. The percentage on the detail tables is the rating evaluation percent’s prevalence out of all disabilities in that body system.
Number of SC disabilities of all compensation recipients
Body system Detail table Total number Percent of all
disabilities Most common
degree of disability
Musculoskeletal 1 7,117,586 36.16% 10%
Auditory 1 2,613,285 13.28% 10%
Skin 1 2,111,444 10.73% 0%
Neurological 1 2,058,164 10.46% 10%
Mental 2 1,368,427 6.95% 30%
Cardiovascular 2 919,068 4.67% 10%
Respiratory 2 889,002 4.52% 0%
Digestive 2 884,368 4.49% 0%
Genitourinary 3 684,965 3.48% 0%
Endocrine 3 488,942 2.48% 20%
The Eye 3 252,069 1.28% 0%
Gynecological 3 101,008 0.51% 0%
Dental/ Oral 4 89,713 0.46% 0%
Hemic/ Lymphatic 4 55,075 0.28% 0%
Infection/ Immune/ Nutrition 4 50,275 0.25% 0%
Total all conditions 4 19,683,391 100% 10%
Com
pens
atio
n –
Pag
e 3
3 o
f 52
Number of SC Disabilities and Prevalence by Body System and Rating Evaluation Percent
Table 1 Number of SC disabilities of all compensation recipients
Total 89,713 100% 55,075 100% 50,275 100% 19,683,391 100%
Com
pens
atio
n –
Pag
e 3
5 o
f 52
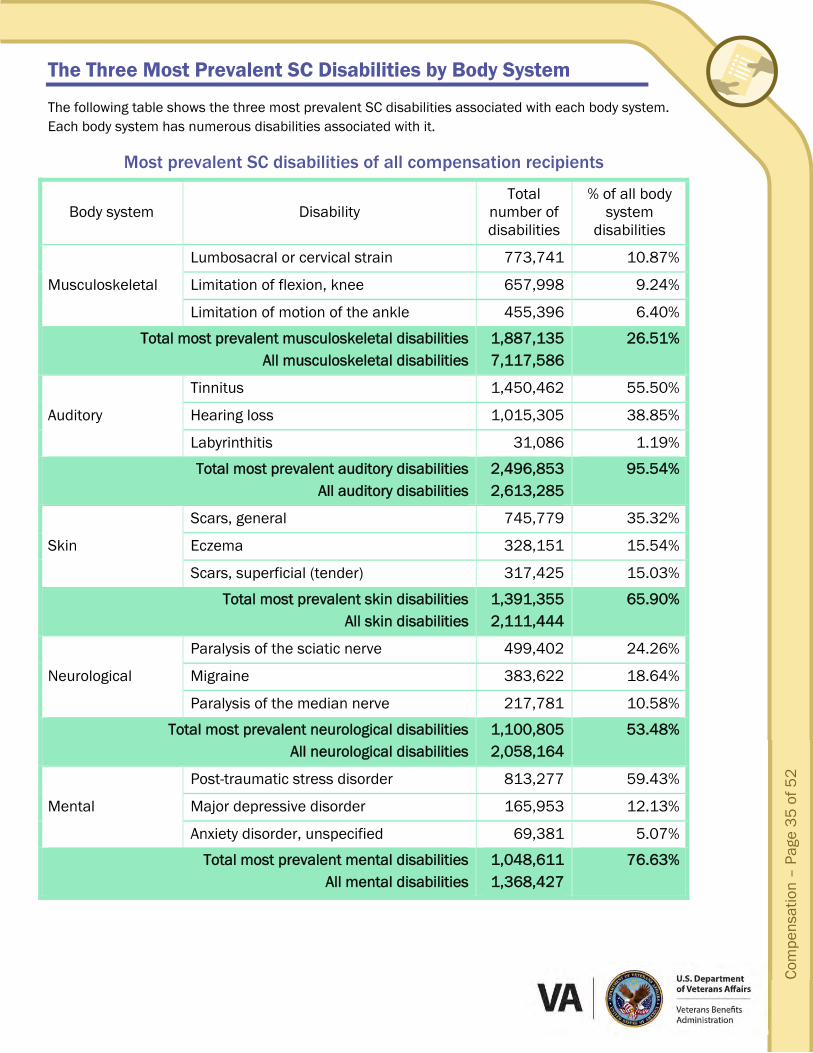
The Three Most Prevalent SC Disabilities by Body System
The following table shows the three most prevalent SC disabilities associated with each body system. Each body system has numerous disabilities associated with it.
Most prevalent SC disabilities of all compensation recipients
Body system Disability Total
number of disabilities
% of all body system
disabilities
Musculoskeletal
Lumbosacral or cervical strain 773,741 10.87%
Limitation of flexion, knee 657,998 9.24%
Limitation of motion of the ankle 455,396 6.40%
Total most prevalent musculoskeletal disabilities All musculoskeletal disabilities
1,887,135 7,117,586
26.51%
Auditory
Tinnitus 1,450,462 55.50%
Hearing loss 1,015,305 38.85%
Labyrinthitis 31,086 1.19%
Total most prevalent auditory disabilities All auditory disabilities
2,496,853 2,613,285
95.54%
Skin
Scars, general 745,779 35.32%
Eczema 328,151 15.54%
Scars, superficial (tender) 317,425 15.03%
Total most prevalent skin disabilities All skin disabilities
1,391,355 2,111,444
65.90%
Neurological
Paralysis of the sciatic nerve 499,402 24.26%
Migraine 383,622 18.64%
Paralysis of the median nerve 217,781 10.58%
Total most prevalent neurological disabilities All neurological disabilities
1,100,805 2,058,164
53.48%
Mental
Post-traumatic stress disorder 813,277 59.43%
Major depressive disorder 165,953 12.13%
Anxiety disorder, unspecified 69,381 5.07%
Total most prevalent mental disabilities All mental disabilities
1,048,611 1,368,427
76.63%
Compensation –
Page 36
of 52
The Three Most Prevalent SC Disabilities by Body System (Continued)
Most prevalent SC disabilities of all compensation recipients
Body system Disability Total number of disabilities
Total most prevalent respiratory disabilities All respiratory disabilities
512,707 889,002
57.67%
Digestive
Hiatal hernia 256,072 28.96%
Hemorrhoids 224,143 25.34%
Irritable bowel syndrome 76,030 8.60%
Total most prevalent digestive disabilities All digestive disabilities
556,245 884,368
62.90%
Genitourinary
Penile deformity (loss of erectile power) 259,528 37.89%
Malignant growths of genitourinary system 106,533 15.55%
Prostate gland injuries 56,811 8.29%
Total most prevalent genitourinary disabilities All genitourinary disabilities
422,872 684,965
61.74%
Endocrine
Diabetes mellitus 431,166 88.18%
Hypothyroidism 36,928 7.55%
Hyperthyroidism 8,045 1.65%
Total most prevalent endocrine disabilities All endocrine disabilities
476,139 488,942
97.38%
Com
pens
atio
n –
Pag
e 3
7 o
f 52
Most prevalent SC disabilities of all compensation recipients
Body system Disability Total
number of disabilities
% of all body system
disabilities
The Eye
Loss of 1 eye; vision 20/40 in other 35,226 13.97%
Impairment to field of vision 23,465 9.31%
Conjunctivitis, chronic 22,881 9.08%
Total most prevalent eye related disabilities All eye related disabilities
81,572 252,069
32.36%
Gynecological
Removal of uterus 19,568 19.37%
Removal of uterus and both ovaries 15,948 15.79%
Benign growths of gynecological system or breast 10,445 10.34%
Total most prevalent gynecological disabilities All gynecological disabilities
45,961 101,008
45.50%
Dental/ Oral
Limited motion of the jaw 65,566 73.08%
Malunion of lower jaw 8,853 9.87%
Loss of teeth 6,300 7.02%
Total most prevalent dental/oral disabilities All dental/oral disabilities
80,719 89,713
89.97%
Hemic/ Lymphatic
Anemia 18,122 32.90%
Non-Hodgkin’s lymphoma 9,265 16.82%
Splenectomy (removal of spleen) 7,081 12.86%
Total most prevalent hemic/lymphatic disabilities All hemic/lymphatic disabilities
34,468 55,075
62.58%
Infection/ Immune/ Nutrition
Malaria 27,839 55.37%
Chronic fatigue syndrome 8,821 17.55%
HIV-related illness 4,528 9.01%
Total most prevalent infection/immune/nutrition disabilities All infection/immune/nutrition disabilities
41,188 50,275
81.93%
Compensation –
Page 38
of 52
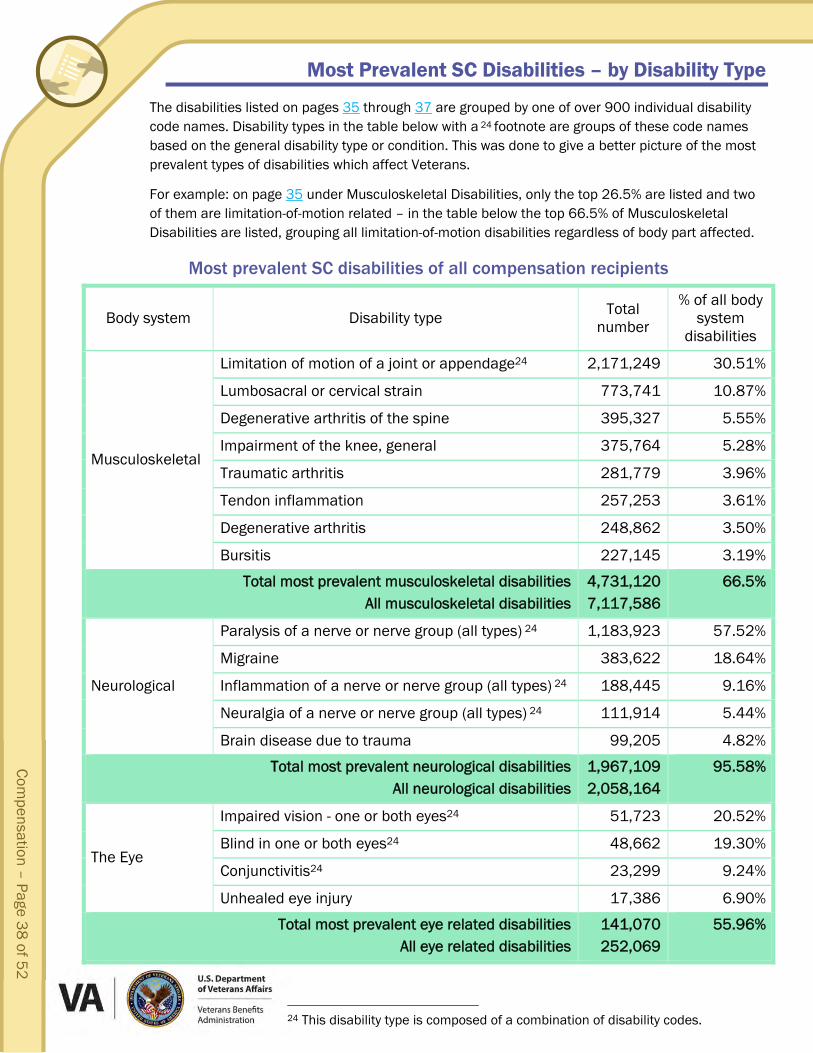
Most Prevalent SC Disabilities – by Disability Type
The disabilities listed on pages 35 through 37 are grouped by one of over 900 individual disability code names. Disability types in the table below with a 24 footnote are groups of these code names based on the general disability type or condition. This was done to give a better picture of the most prevalent types of disabilities which affect Veterans.
For example: on page 35 under Musculoskeletal Disabilities, only the top 26.5% are listed and two of them are limitation-of-motion related – in the table below the top 66.5% of Musculoskeletal Disabilities are listed, grouping all limitation-of-motion disabilities regardless of body part affected.
Most prevalent SC disabilities of all compensation recipients
Body system Disability type Total number
% of all body system
disabilities
Musculoskeletal
Limitation of motion of a joint or appendage24 2,171,249 30.51%
Lumbosacral or cervical strain 773,741 10.87%
Degenerative arthritis of the spine 395,327 5.55%
Impairment of the knee, general 375,764 5.28%
Traumatic arthritis 281,779 3.96%
Tendon inflammation 257,253 3.61%
Degenerative arthritis 248,862 3.50%
Bursitis 227,145 3.19%
Total most prevalent musculoskeletal disabilities All musculoskeletal disabilities
4,731,120 7,117,586
66.5%
Neurological
Paralysis of a nerve or nerve group (all types) 24 1,183,923 57.52%
Migraine 383,622 18.64%
Inflammation of a nerve or nerve group (all types) 24 188,445 9.16%
Neuralgia of a nerve or nerve group (all types) 24 111,914 5.44%
Brain disease due to trauma 99,205 4.82%
Total most prevalent neurological disabilities All neurological disabilities
1,967,109 2,058,164
95.58%
The Eye
Impaired vision - one or both eyes24 51,723 20.52%
Blind in one or both eyes24 48,662 19.30%
Conjunctivitis24 23,299 9.24%
Unhealed eye injury 17,386 6.90%
Total most prevalent eye related disabilities All eye related disabilities
141,070 252,069
55.96%
24 This disability type is composed of a combination of disability codes.
Com
pens
atio
n –
Pag
e 3
9 o
f 52
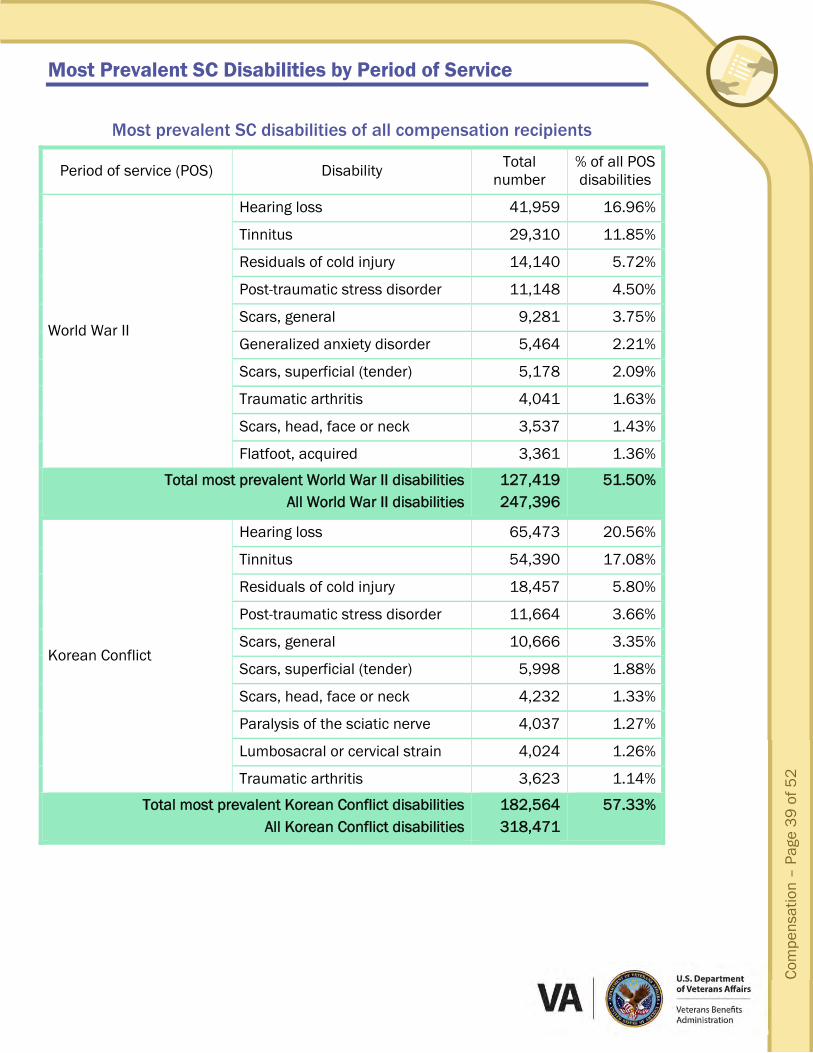
Most Prevalent SC Disabilities by Period of Service
Most prevalent SC disabilities of all compensation recipients
Period of service (POS) Disability Total number
% of all POS disabilities
World War II
Hearing loss 41,959 16.96%
Tinnitus 29,310 11.85%
Residuals of cold injury 14,140 5.72%
Post-traumatic stress disorder 11,148 4.50%
Scars, general 9,281 3.75%
Generalized anxiety disorder 5,464 2.21%
Scars, superficial (tender) 5,178 2.09%
Traumatic arthritis 4,041 1.63%
Scars, head, face or neck 3,537 1.43%
Flatfoot, acquired 3,361 1.36%
Total most prevalent World War II disabilities All World War II disabilities
127,419 247,396
51.50%
Korean Conflict
Hearing loss 65,473 20.56%
Tinnitus 54,390 17.08%
Residuals of cold injury 18,457 5.80%
Post-traumatic stress disorder 11,664 3.66%
Scars, general 10,666 3.35%
Scars, superficial (tender) 5,998 1.88%
Scars, head, face or neck 4,232 1.33%
Paralysis of the sciatic nerve 4,037 1.27%
Lumbosacral or cervical strain 4,024 1.26%
Traumatic arthritis 3,623 1.14%
Total most prevalent Korean Conflict disabilities All Korean Conflict disabilities
182,564 318,471
57.33%
Compensation –
Page 40
of 52
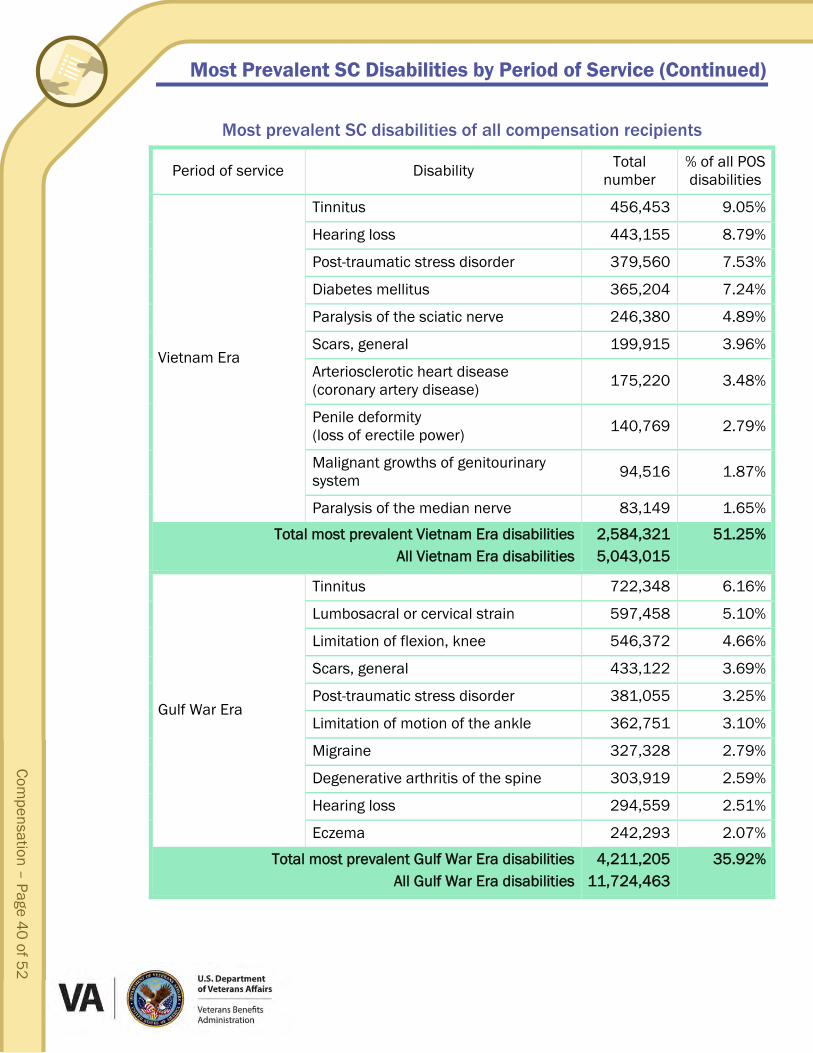
Most Prevalent SC Disabilities by Period of Service (Continued)
Most prevalent SC disabilities of all compensation recipients
VA’s computer systems do not contain data that would allow us to attribute Veterans’ disabilities to a specific period of service or deployment. Therefore, GWOT is a subset defined by Veterans who filed a disability compensation claim at some point either prior to or following their GWOT deployment. We are not able to identify which of these Veterans filed a claim for disabilities incurred during their actual overseas GWOT deployment.
Most prevalent SC disabilities of new GWOT compensation recipients
Disability Body system Male % Female % Total25 %Total
general Musculoskeletal 23,553 2.7% 3,710 2.4% 27,341 2.6%
Eczema Skin 20,912 2.4% 3,520 2.3% 24,532 2.4%
Total most prevalent disabilities Total number of disabilities
360,171 880,633
40.9% 100%
56,882 155,294
36.6% 100%
418,376 1,039,532
40.2% 100%
25 Total most prevalent GWOT disabilities include 1,323 disabilities unidentifiable by gender. Total of all GWOT disabilities include 3,605 disabilities unidentifiable by gender. 26 New to the rolls Veterans are no longer being rated under the discontinued disability types.
Com
pens
atio
n –
Pag
e 4
3 o
f 52
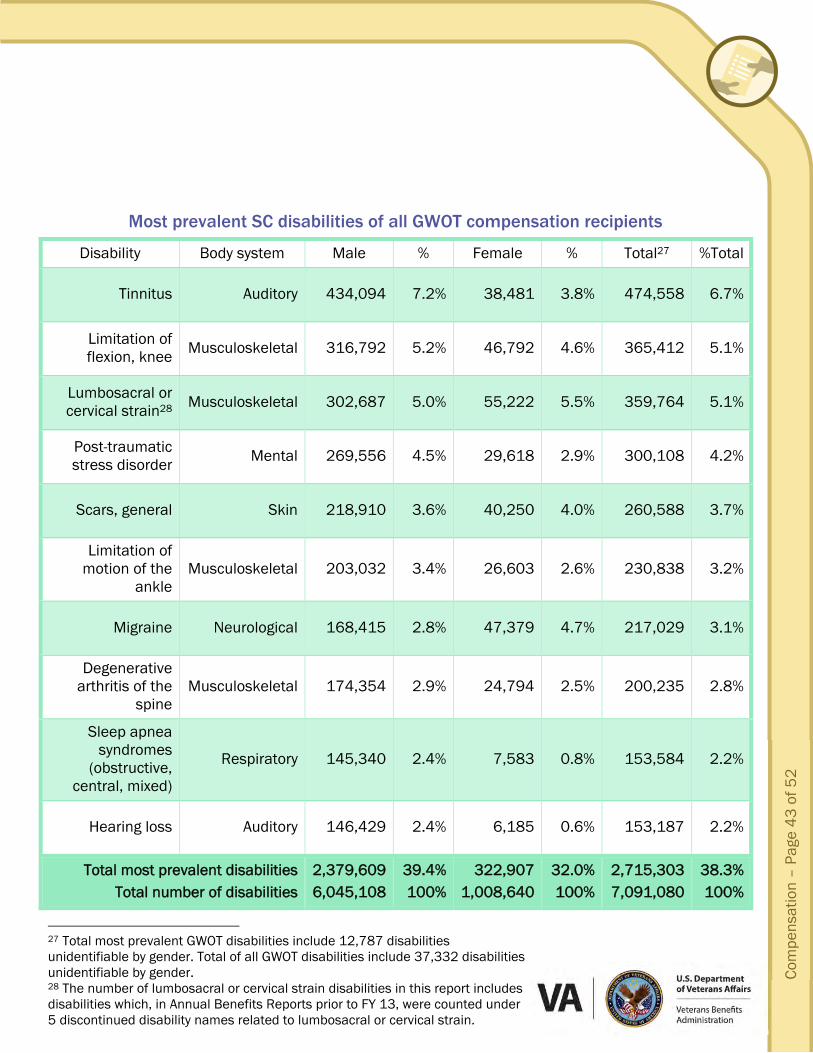
Most prevalent SC disabilities of all GWOT compensation recipients
Disability Body system Male % Female % Total27 %Total
Hearing loss Auditory 146,429 2.4% 6,185 0.6% 153,187 2.2%
Total most prevalent disabilities Total number of disabilities
2,379,609 6,045,108
39.4% 100%
322,907 1,008,640
32.0% 100%
2,715,303 7,091,080
38.3% 100%
27 Total most prevalent GWOT disabilities include 12,787 disabilities unidentifiable by gender. Total of all GWOT disabilities include 37,332 disabilities unidentifiable by gender. 28 The number of lumbosacral or cervical strain disabilities in this report includes disabilities which, in Annual Benefits Reports prior to FY 13, were counted under 5 discontinued disability names related to lumbosacral or cervical strain.
Compensation –
Page 44
of 52
GWOT SC Disabilities by Body System and Gender
Number of SC disabilities of all GWOT compensation recipients
Body system Male Female Total29
Musculoskeletal 2,699,435 437,244 3,153,869
Skin 687,803 124,749 817,291
Neurological 553,463 109,016 665,797
Auditory 608,333 49,806 660,881
Mental 419,474 71,829 493,190
Respiratory 347,549 58,309 408,131
Digestive 265,705 46,427 313,822
Cardiovascular 173,138 25,025 199,222
Genitourinary 145,269 13,669 159,732
The Eye 69,218 13,520 83,229
Endocrine 30,679 10,642 41,604
Dental/ Oral 31,171 9,332 40,786
Gynecological 1,551 31,904 33,908
Hemic/ Lymphatic 7,264 5,503 12,855
Infection/ Immune/ Nutrition 5,056 1,665 6,763
Total 6,045,108 1,008,640 7,091,080
29 Total includes 37,332 disabilities unidentifiable by gender.
Com
pens
atio
n –
Pag
e 4
5 o
f 52
GWOT Three Most Prevalent SC Disabilities by Body System
Most prevalent SC disabilities of all GWOT compensation recipients
Body system Disability Total Number
% of all body system
disabilities
Musculoskeletal
Limitation of flexion, knee 365,412 11.59%
Lumbosacral or cervical strain 359,764 11.41%
Limitation of motion of the ankle 230,838 7.32%
Total most prevalent musculoskeletal disabilities All musculoskeletal disabilities
956,014 3,153,869
30.31%
Skin
Scars, general 260,588 31.88%
Eczema 148,227 18.14%
Scars, superficial (tender) 113,072 13.83%
Total most prevalent skin disabilities All skin disabilities
521,887 817,291
63.86%
Neurological
Migraine 217,029 32.60%
Paralysis of the sciatic nerve 105,057 15.78%
Brain disease due to trauma 67,230 10.10%
Total most prevalent neurological disabilities All neurological disabilities
389,316 665,797
58.47%
Auditory
Tinnitus 474,558 71.81%
Hearing loss 153,187 23.18%
Labyrinthitis 14,356 2.17%
Total most prevalent auditory disabilities All auditory disabilities
642,101 660,881
97.16%
Mental
Post-traumatic stress disorder 300,108 60.85%
Major depressive disorder 53,567 10.86%
Anxiety disorder, unspecified 39,775 8.06%
Total most prevalent mental disabilities All mental disabilities
393,450 493,190
79.78%
Compensation –
Page 46
of 52
GWOT Three Most Prevalent SC Disabilities by Body System (Continued)
Most prevalent SC disabilities of all GWOT compensation recipients
Total most prevalent respiratory disabilities All respiratory disabilities
308,473 408,131
75.58%
Digestive
Hiatal hernia 140,053 44.63%
Hemorrhoids 68,641 21.87%
Irritable bowel syndrome 32,703 10.42%
Total most prevalent digestive disabilities All digestive disabilities
241,397 313,822
76.92%
Cardiovascular
Hypertensive vascular disease 133,542 67.03%
Varicose veins 19,627 9.85%
Residuals of cold injury 7,137 3.58%
Total most prevalent cardiovascular disabilities All cardiovascular disabilities
160,306 199,222
80.47%
Genitourinary
Penile deformity (loss of erectile power) 72,002 45.08%
Nephrolithiasis (kidney stones) 16,283 10.19%
Prostate gland injuries 13,617 8.52%
Total most prevalent genitourinary disabilities All genitourinary disabilities
101,902 159,732
63.80%
The Eye
Loss of 1 eye; vision 20/40 in other 15,051 18.08%
Conjunctivitis, chronic 11,263 13.53%
Unhealed eye injury 6,853 8.23%
Total most prevalent eye related disabilities All eye related disabilities
33,167 83,229
39.85%
Com
pens
atio
n –
Pag
e 4
7 o
f 52
Most prevalent SC disabilities of all GWOT compensation recipients
Body system Disability Total Number
% of all body system
disabilities
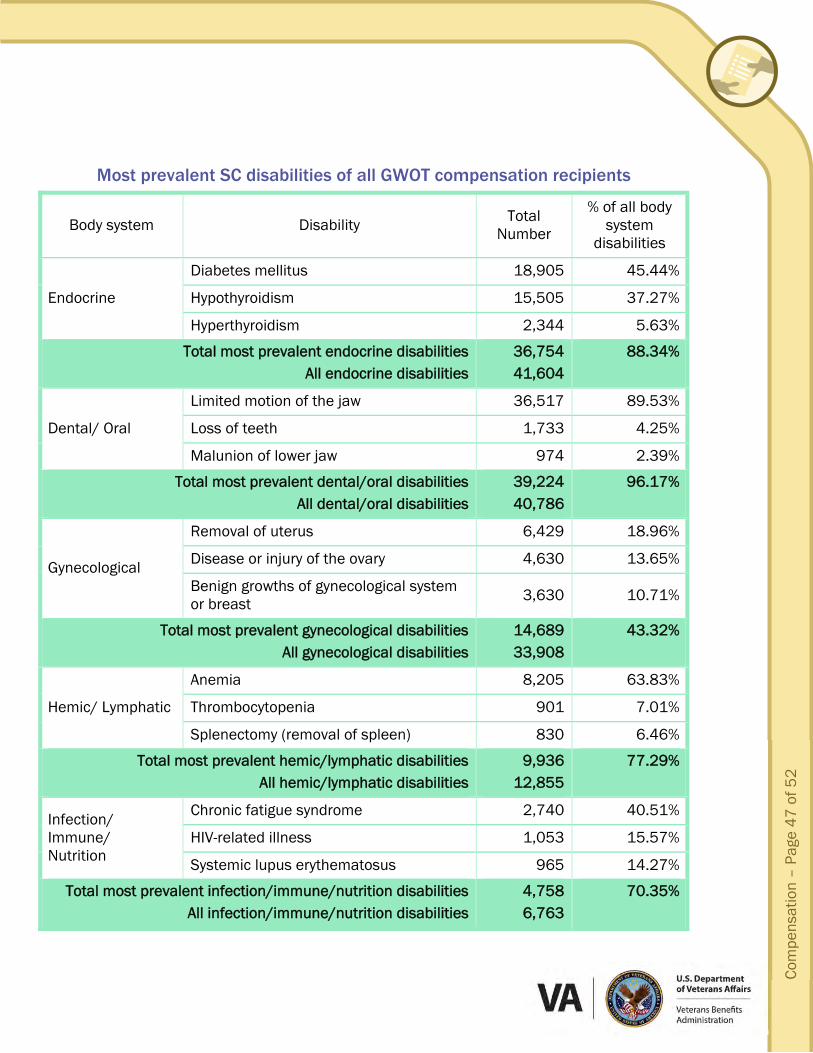
Endocrine
Diabetes mellitus 18,905 45.44%
Hypothyroidism 15,505 37.27%
Hyperthyroidism 2,344 5.63%
Total most prevalent endocrine disabilities All endocrine disabilities
36,754 41,604
88.34%
Dental/ Oral
Limited motion of the jaw 36,517 89.53%
Loss of teeth 1,733 4.25%
Malunion of lower jaw 974 2.39%
Total most prevalent dental/oral disabilities All dental/oral disabilities
39,224 40,786
96.17%
Gynecological
Removal of uterus 6,429 18.96%
Disease or injury of the ovary 4,630 13.65%
Benign growths of gynecological system or breast 3,630 10.71%
Total most prevalent gynecological disabilities All gynecological disabilities
14,689 33,908
43.32%
Hemic/ Lymphatic
Anemia 8,205 63.83%
Thrombocytopenia 901 7.01%
Splenectomy (removal of spleen) 830 6.46%
Total most prevalent hemic/lymphatic disabilities All hemic/lymphatic disabilities
9,936 12,855
77.29%
Infection/ Immune/ Nutrition
Chronic fatigue syndrome 2,740 40.51%
HIV-related illness 1,053 15.57%
Systemic lupus erythematosus 965 14.27%
Total most prevalent infection/immune/nutrition disabilities All infection/immune/nutrition disabilities
4,758 6,763
70.35%
Compensation –
Page 48
of 52
Dependency and Indemnity Compensation (DIC)
DIC is a tax-free monetary benefit generally payable to a surviving spouse, child, or parent of Servicemembers who died while on active duty, active duty for training, or inactive duty training; or to survivors of Veterans who died from their service-connected disabilities; or to certain survivors of Veterans who were totally disabled due to service-connected causes at the time of their death. Parents’ DIC is an income-based benefit for parents who were financially dependent on a Servicemember or Veteran who died from a service-related cause.
New DIC recipients during FY 2011 to FY 2015 by relationship30
Surviving children 758 1,063 1,274 1,597 1,308 -18.10%
Surviving parents 2 3,254 1,387 343 226 -34.11%
Total 28,191 29,874 29,720 29,227 28,029 -4.10%
All DIC recipients by relationship
Relationship Number of recipients Percent of total
Surviving spouses 373,129 95.60%
Surviving children 13,316 3.41%
Surviving parents 3,825 0.98%
Total32 390,309 100%
New surviving spouse DIC recipients
Age Number of surviving spouses
Estimated total amount paid annually Percent of total
35 and under 490 $10,492,625 2.39%
36 - 56 2,758 $49,059,523 11.16%
57 - 75 16,564 $267,025,770 60.73%
Over 75 6,592 $111,497,708 25.36%
Total33 26,495 $439,716,849 100%
30 VBA revised the FY 2011 – FY 2014 numbers to include additional survivors of Veterans. 31 2012 total includes 1 recipient unidentifiable by relationship. 32 Total includes 39 recipients unidentifiable by relationship. 33 Total includes 91 recipients and $1,641,223 in estimated annual payments amounts unidentifiable by age.
Com
pens
atio
n –
Pag
e 4
9 o
f 52
All surviving spouse DIC recipients by age
Age Number of surviving spouses
Estimated total amount paid
annually Percent of total
35 and under 4,478 $87,344,734 1.44%
36 - 56 29,927 $500,597,220 8.25%
57 - 75 180,593 $2,867,711,936 47.29%
Over 75 156,064 $2,576,017,398 42.48%
Total34 373,129 $6,064,670,190 100%
New surviving child DIC recipients by age
Age Number of surviving children
Estimated total amount paid annually Percent of total
Under age 18 817 $4,241,372 59.97%
Age 18 and over – in school 132 $529,124 7.48%
Age 18 and over – helpless 228 $1,769,693 25.02%
Total35 1,308 $7,073,069 100%
All surviving child DIC recipients by age
Age Number of surviving children
Estimated total amount paid annually Percent of total
Under age 18 4,564 $24,369,315 25.96%
Age 18 and over – in school 360 $1,511,438 1.61%
Age 18 and over – helpless 8,133 $66,741,793 71.10%
Total36 13,316 $93,868,536 100%
In order for the surviving child of a Veteran to receive DIC benefits after they turn 18, they must be declared to be permanently incapable of self-support (helpless) before the age of 18, or be between the ages of 18 and 23 and attending school.
34 Total includes 2,067 recipients and $32,998,902 estimated annual payments unidentifiable by age. 35 Total includes 131 recipients and $532,880 in estimated annual payments unidentifiable by age. 36 Total includes 259 recipients and $1,245,990 in estimated annual payments unidentifiable by age.
U.S. Departmentof Veterans Affairs
Administration
Compensation - Page 5
0 of 5
2
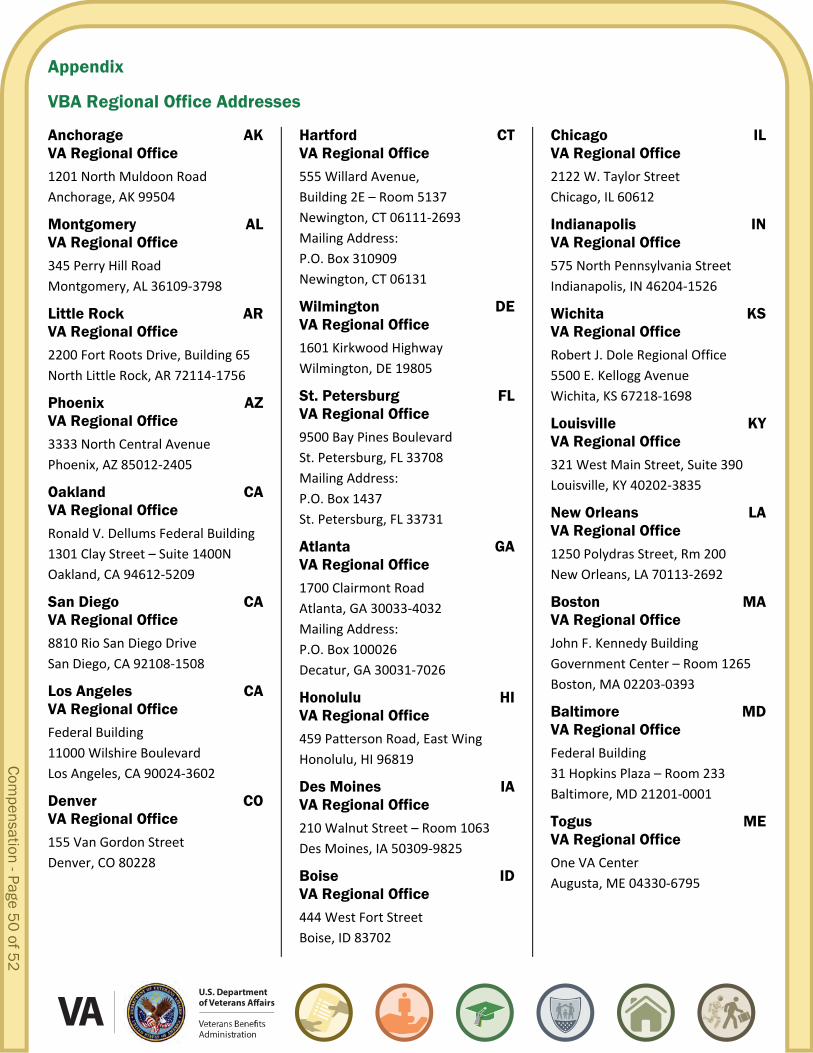
Appendix
VBA Regional Office Addresses
Anchorage AK VA Regional Office 1201 North Muldoon Road
Anchorage, AK 99504
Montgomery AL VA Regional Office 345 Perry Hill Road
Montgomery, AL 36109‐3798
Little Rock AR VA Regional Office 2200 Fort Roots Drive, Building 65
North Little Rock, AR 72114‐1756
Phoenix AZ VA Regional Office 3333 North Central Avenue
Phoenix, AZ 85012‐2405
Oakland CA VA Regional Office Ronald V. Dellums Federal Building
1301 Clay Street – Suite 1400N
Oakland, CA 94612‐5209
San Diego CA VA Regional Office 8810 Rio San Diego Drive
San Diego, CA 92108‐1508
Los Angeles CA VA Regional Office Federal Building
11000 Wilshire Boulevard
Los Angeles, CA 90024‐3602
Denver CO VA Regional Office 155 Van Gordon Street
Denver, CO 80228
Hartford CT VA Regional Office 555 Willard Avenue,
Building 2E – Room 5137
Newington, CT 06111‐2693
Mailing Address:
P.O. Box 310909
Newington, CT 06131
Wilmington DE VA Regional Office 1601 Kirkwood Highway
Wilmington, DE 19805
St. Petersburg FL VA Regional Office 9500 Bay Pines Boulevard
St. Petersburg, FL 33708
Mailing Address:
P.O. Box 1437
St. Petersburg, FL 33731
Atlanta GA VA Regional Office 1700 Clairmont Road
Atlanta, GA 30033‐4032
Mailing Address:
P.O. Box 100026
Decatur, GA 30031‐7026
Honolulu HI VA Regional Office 459 Patterson Road, East Wing
Honolulu, HI 96819
Des Moines IA VA Regional Office 210 Walnut Street – Room 1063
Des Moines, IA 50309‐9825
Boise ID VA Regional Office 444 West Fort Street
Boise, ID 83702
Chicago IL VA Regional Office 2122 W. Taylor Street
Chicago, IL 60612
Indianapolis IN VA Regional Office 575 North Pennsylvania Street
Indianapolis, IN 46204‐1526
Wichita KS VA Regional Office Robert J. Dole Regional Office
5500 E. Kellogg Avenue
Wichita, KS 67218‐1698
Louisville KY VA Regional Office 321 West Main Street, Suite 390
Louisville, KY 40202‐3835
New Orleans LA VA Regional Office 1250 Polydras Street, Rm 200
New Orleans, LA 70113‐2692
Boston MA VA Regional Office John F. Kennedy Building
Government Center – Room 1265
Boston, MA 02203‐0393
Baltimore MD VA Regional Office Federal Building
31 Hopkins Plaza – Room 233
Baltimore, MD 21201‐0001
Togus ME VA Regional Office One VA Center
Augusta, ME 04330‐6795
U.S. Departmentof Veterans Affairs
Administration
Com
pens
atio
n - P
age
51
of 5
2
Detroit MI VA Regional Office Patrick V. McNamara
Federal Building
477 Michigan Avenue –
Room 1400
Detroit, MI 48226‐2591
St. Paul MN VA Regional Office Bishop Henry Whipple
Federal Building
One Federal Drive – Fort Snelling
St. Paul, MN 55111‐4050
St. Louis MO Records Mgmt. Center 4300 Goodfellow Boulevard
Building 104
St. Louis, MO 63120‐8950
St. Louis MO VA Regional Office 400 South 18th Street
St. Louis, MO 63103‐2676
Jackson MS VA Regional Office 1600 East Woodrow Wilson Avenue
Jackson, MS 39216
Ft. Harrison MT VA Regional Office 3633 Veterans Drive
Ft. Harrison, MT 59636
Winston-Salem NC VA Regional Office Federal Building
251 North Main Street
Winston‐Salem, NC 27155‐1000
Fargo ND VA Regional Office 2101 Elm Street
Fargo, ND 58102
Lincoln NE VA Regional Office 3800 Village Drive
Lincoln, NE 68516‐4198
Mailing Address:
PO Box 85816
Lincoln, NE 68501‐5816
Manchester NH VA Regional Office Norris Cotton Federal Building
275 Chestnut Street
Manchester, NH 03101
Newark NJ VA Regional Office 20 Washington Place
Newark, NJ 07102‐3174
Albuquerque NM VA Regional Office 500 Gold Avenue, South West
Albuquerque, NM 87102‐3118
Reno NV VA Regional Office 5460 Reno Corporate Drive
Reno, NV 89511
Buffalo NY VA Regional Office 130 South Elmwood Avenue
Buffalo, NY 14202‐2478
New York NY VA Regional Office 245 W. Houston Street
New York, NY 10014‐4805
Cleveland OH VA Regional Office Anthony J. Celebrezze
Federal Building
1240 East 9th Street
Cleveland, OH 44199‐2001
Muskogee OK VA Regional Office Federal Building
125 South Main Street
Muskogee, OK 74401‐7025
Portland OR VA Regional Office 100 SW Main Street, Floor 2
Portland, OR 97204‐2998
Mailing Address:
100 SW Main St FL 2
Portland, OR 97204
Philadelphia PA VA Regional Office 5000 Wissahickon Avenue
Philadelphia, PA 19144
Mailing Address:
P.O. Box 8079
Philadelphia, PA 19101
Pittsburgh PA VA Regional Office 1000 Liberty Avenue
Pittsburgh, PA 15222‐4004
San Juan PR VA Regional Office 50 Carr 165
Guaynabo
San Juan, PR 00968‐8024
Providence RI VA Regional Office 380 Westminster Street
Providence, RI 02903‐3246
Columbia SC VA Regional Office 6437 Garners Ferry Road
Columbia, SC 29209‐2495
Sioux Falls SD VA Regional Office 2501 West 22nd Street
Sioux Falls, SD 57105
U.S. Departmentof Veterans Affairs
Administration
Compensation - Page 5
2 of 5
2
Nashville TN VA Regional Office 110 Ninth Avenue, South
Nashville, TN 37203‐3817
Houston TX VA Regional Office 6900 Almeda Road
Houston, TX 77030‐4200
Waco TX VA Regional Office One Veterans Plaza
701 Clay Avenue
Waco, TX 76799‐0001
Salt Lake City UT VA Regional Office 550 Foothill Drive
Salt Lake City, UT 84113
Roanoke VA VA Regional Office 116 North Jefferson Street
Roanoke, VA 24016
White River Junction VT VA Regional Office 215 North Main Street
White River Junction, VT 05001
Seattle WA VA Regional Office Federal Building
915 Second Avenue, Room 1392
Seattle, WA 98174‐1060
Milwaukee WI VA Regional Office 5400 W. National Avenue
Milwaukee, WI 53214
Huntington WV VA Regional Office 640 Fourth Avenue
Huntington, WV 25701‐1340
Cheyenne WY VA Benefits Office 2360 E. Pershing Blvd. Cheyenne, WY
82001‐5356
The above address is the Cheyenne
benefits office. The Denver regional
office processes claims for the state
of Wyoming.
Manila VA Regional Office U.S. Embassy
1501 Roxas Blvd
Pasay City, Philippines 1302
Mailing Address:
PSC 501
DPOAP 96515
District Office Addresses
North Atlantic PA District 5000 Wissahickon Avenue
Philadelphia, PA 19144
Southeast District TN 3322 West End, Suite 408
Nashville, TN 37203
Midwest District MO Robert A. Young Federal Building
1222 Spruce St., Suite 3.206
St. Louis, MO 63103
Pacific District AZ 3333 North Central Avenue,
Suite 3026
Phoenix, AZ 85012‐2402
Continental District CO 155 Van Gordon Street
Lakewood, CO 80228
Centralized Mail Address
SMS Janesville Facility – Centralized Mail Department of Veterans Affairs