42
2017 Annual Results Presentation 22 March 2018

2017Annual ResultsPresentation
22 March 2018

Highlights
01
Three-Year Plan (2017 - 2019) is on track with a strong start in its first year
Core Services Segment of supply chain solutions and logistics businesses delivered solid growth of 21.8% in core operating profit
Global network of 15,000 suppliers in over 40 markets well-positioned to absorb any shock from trade uncertainty
Declared a conditional special dividend of 47.6 HK cents per share and a final dividend of 2 HK cents per share for a total of 49.6 HK cents per share
Strategic divestment of three Product Verticals to generate US$1.1 billion of cash
Three-Year Plan Targets (2017-2019)
02

2019 Target
The Group
Three-Year Plan on Track
2017 2018 2019> >
Top Line
COP
COP Margin
Additional Capex
Stabilize Growth
Stabilize Growth
Stabilize Expansion
$150M for Digitalization over 3 years
Low double-digit by 2019(1)
Low double-digit CAGR
50+ bps by 2019
(1) Low double-digit total growth from 2016 to 2019 period; single-digit CAGR
03

2017 Financial Results
04
ReportedLike-for-like(2)
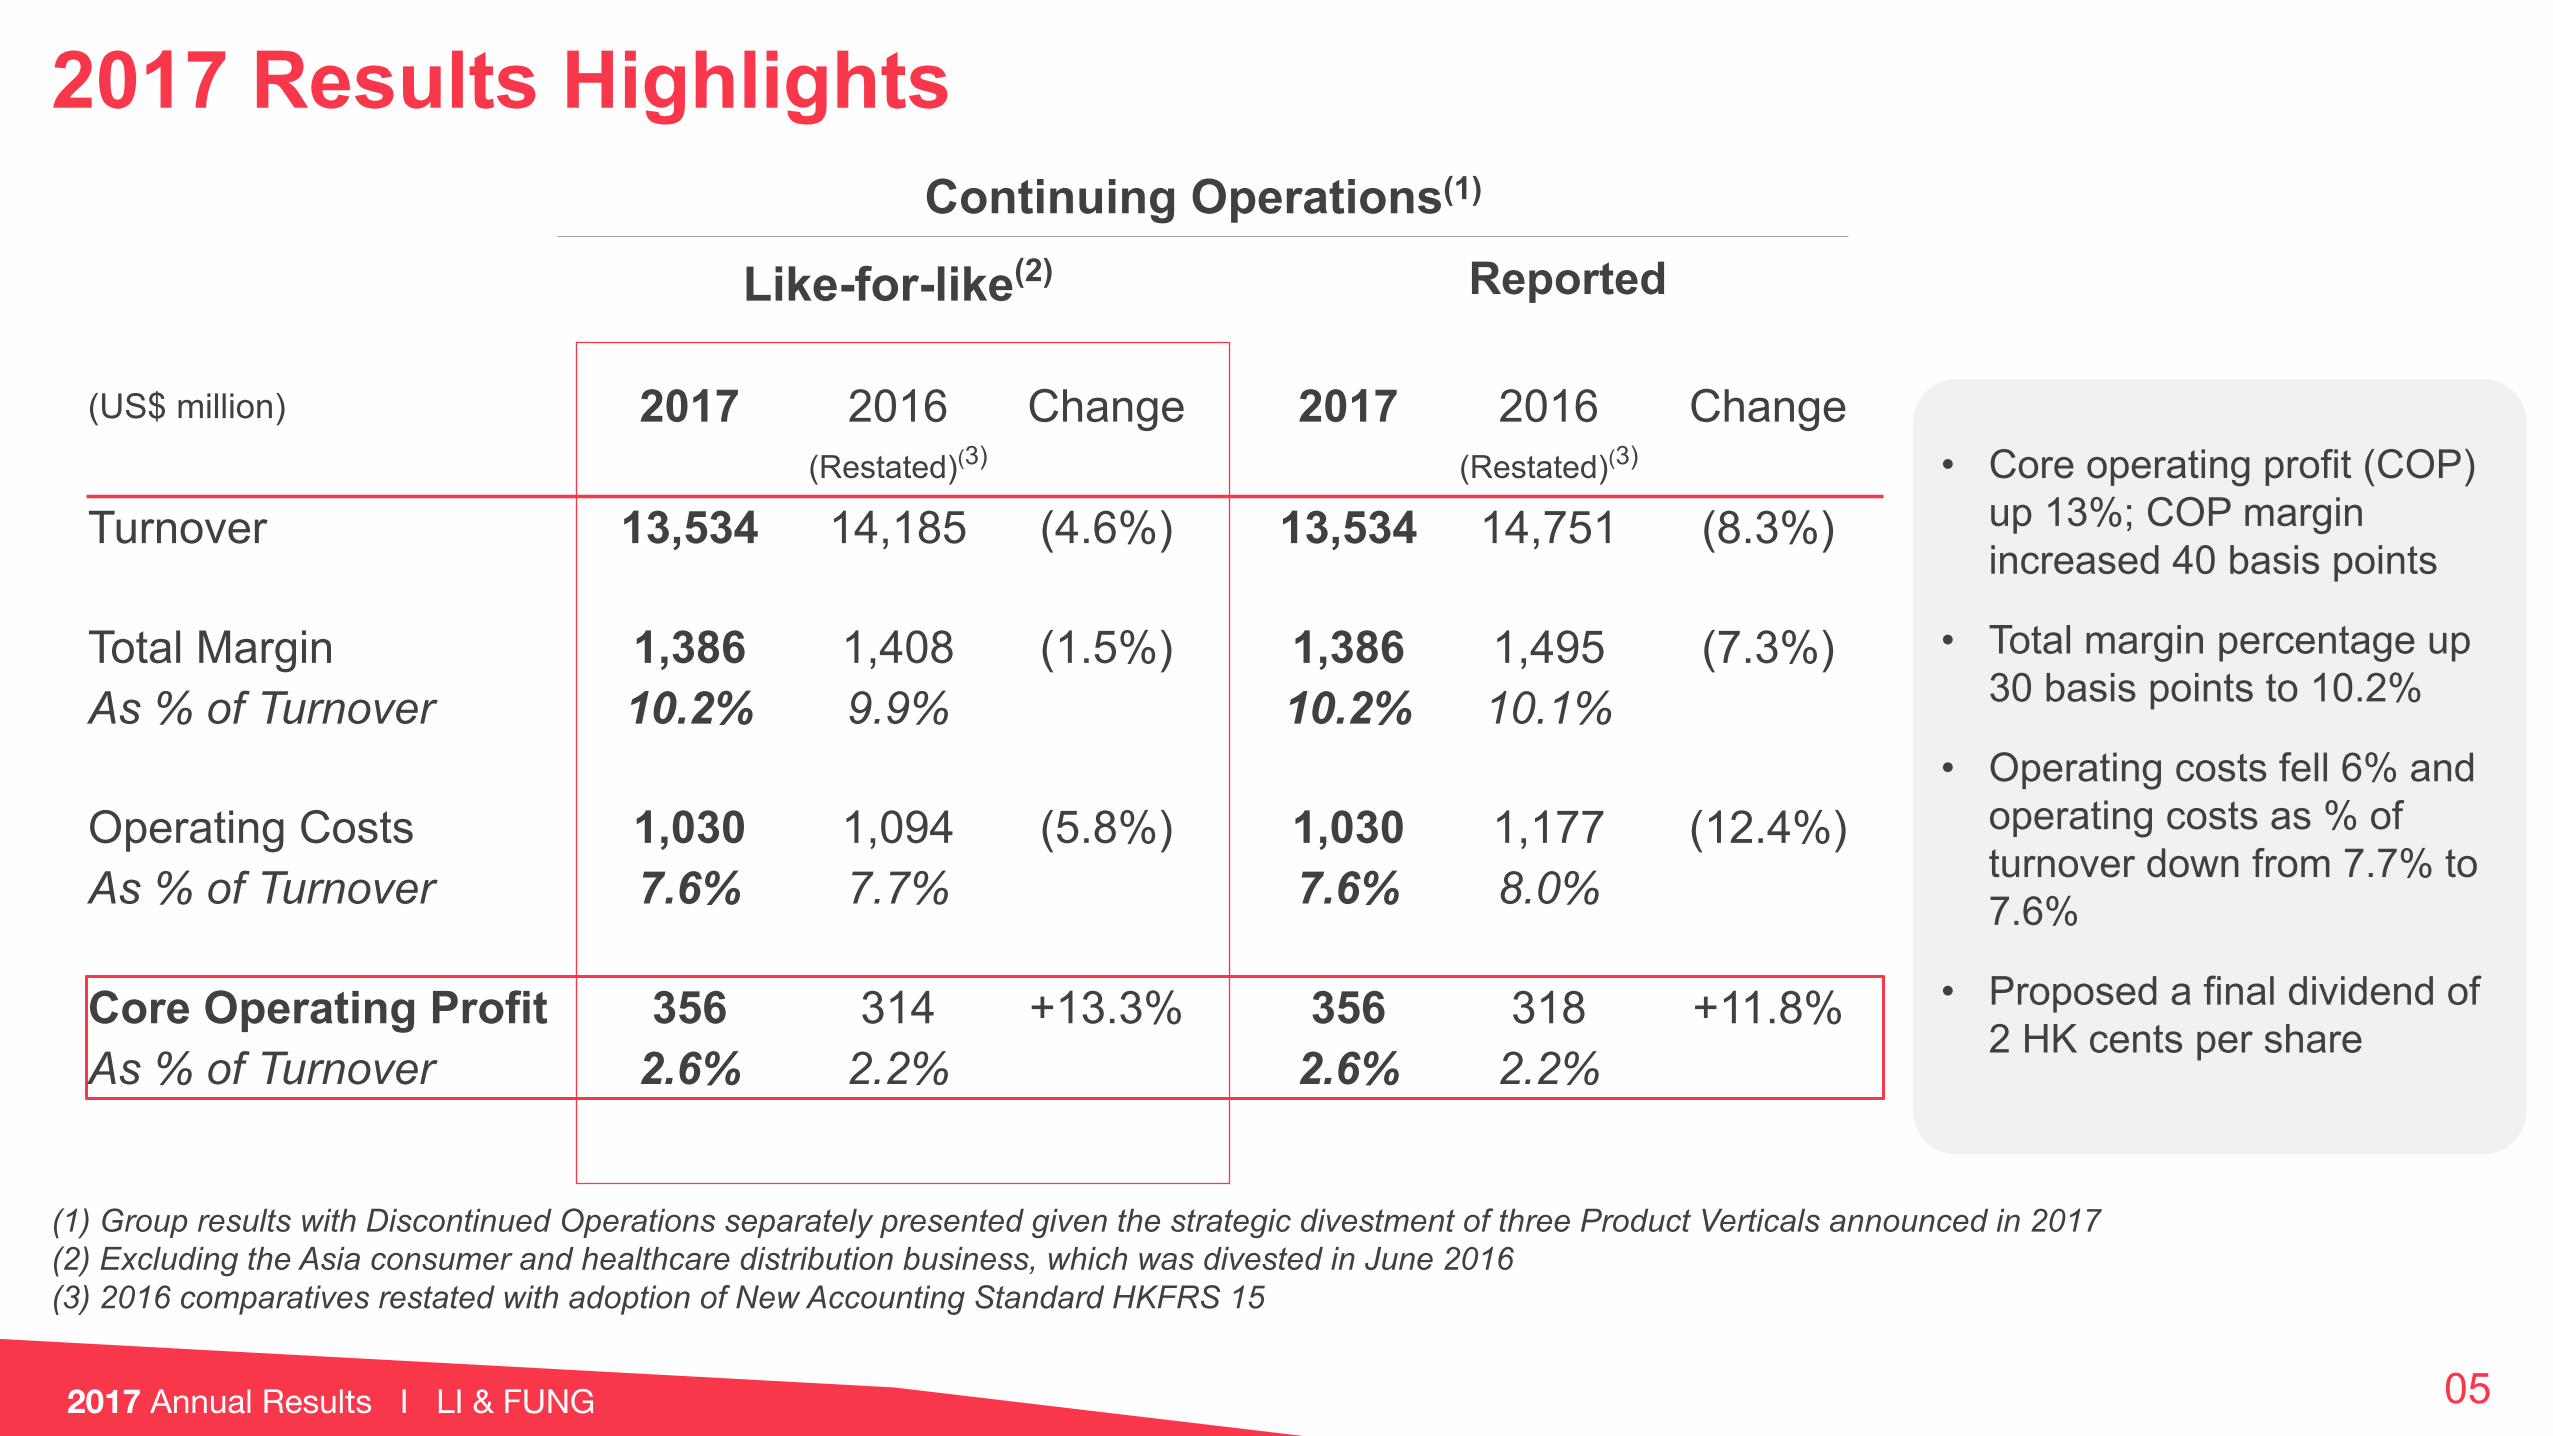
(US$ million) 2017 2016 Change 2017 2016 Change(Restated)(3) (Restated)(3)
Turnover 13,534 14,185 (4.6%) 13,534 14,751 (8.3%)
Total Margin 1,386 1,408 (1.5%) 1,386 1,495 (7.3%)As % of Turnover 10.2% 9.9% 10.2% 10.1%
Operating Costs 1,030 1,094 (5.8%) 1,030 1,177 (12.4%)As % of Turnover 7.6% 7.7% 7.6% 8.0%
Core Operating Profit 356 314 +13.3% 356 318 +11.8%As % of Turnover 2.6% 2.2% 2.6% 2.2%
2017 Results Highlights
(1) Group results with Discontinued Operations separately presented given the strategic divestment of three Product Verticals announced in 2017(2) Excluding the Asia consumer and healthcare distribution business, which was divested in June 2016(3) 2016 comparatives restated with adoption of New Accounting Standard HKFRS 15
• Core operating profit (COP) up 13%; COP margin increased 40 basis points
• Total margin percentage up 30 basis points to 10.2%
• Operating costs fell 6% and operating costs as % of turnover down from 7.7% to 7.6%
• Proposed a final dividend of 2 HK cents per share
05
Continuing Operations(1)

2017 Results Net Profit Analysis• Write-back of acquisition
payable of US$31m
• One-off reorganization costs of US$34m
• Net interest expense decreased while distribution to perpetual securities increased due to US$650m raised in 2016
• Profit attributable to shareholders from Continuing Operations increased 7%
2017US$M
2016US$M
(Restated)(1)
Change%
Core Operating Profit 356 314(2) +13.3%Write-back of Acquisition Payable 31 -One-off Reorganization Costs (34) (6)Amortization of Other Intangible Assets (23) (20)Asia Consumer and Healthcare Distribution Business - 4Gain on Disposal of Business - 8
Operating Profit 330 300 +9.9%Non-cash Interest Expenses (3) (4)Net Cash Interest Expenses (54) (71)Share of Profits from Associated Companies & Joint Venture 2 2Taxation (41) (32)
Profit for the Year (Continuing Operations) 234 195 +19.7%Distribution to Perpetual Capital Securities (64) (36)Non-controlling Interests (1) 1
Profit Attributable to Shareholders (Continuing Operations) 170 160 +6.5%
Profit Attributable to Shareholders (Discontinued Operations) (545) 61
Total (375) 221
(1) 2016 comparatives restated with adoption of New Accounting Standard HKFRS 15(2) Excluding the Asia consumer and healthcare distribution business, which was divested in June 2016
06
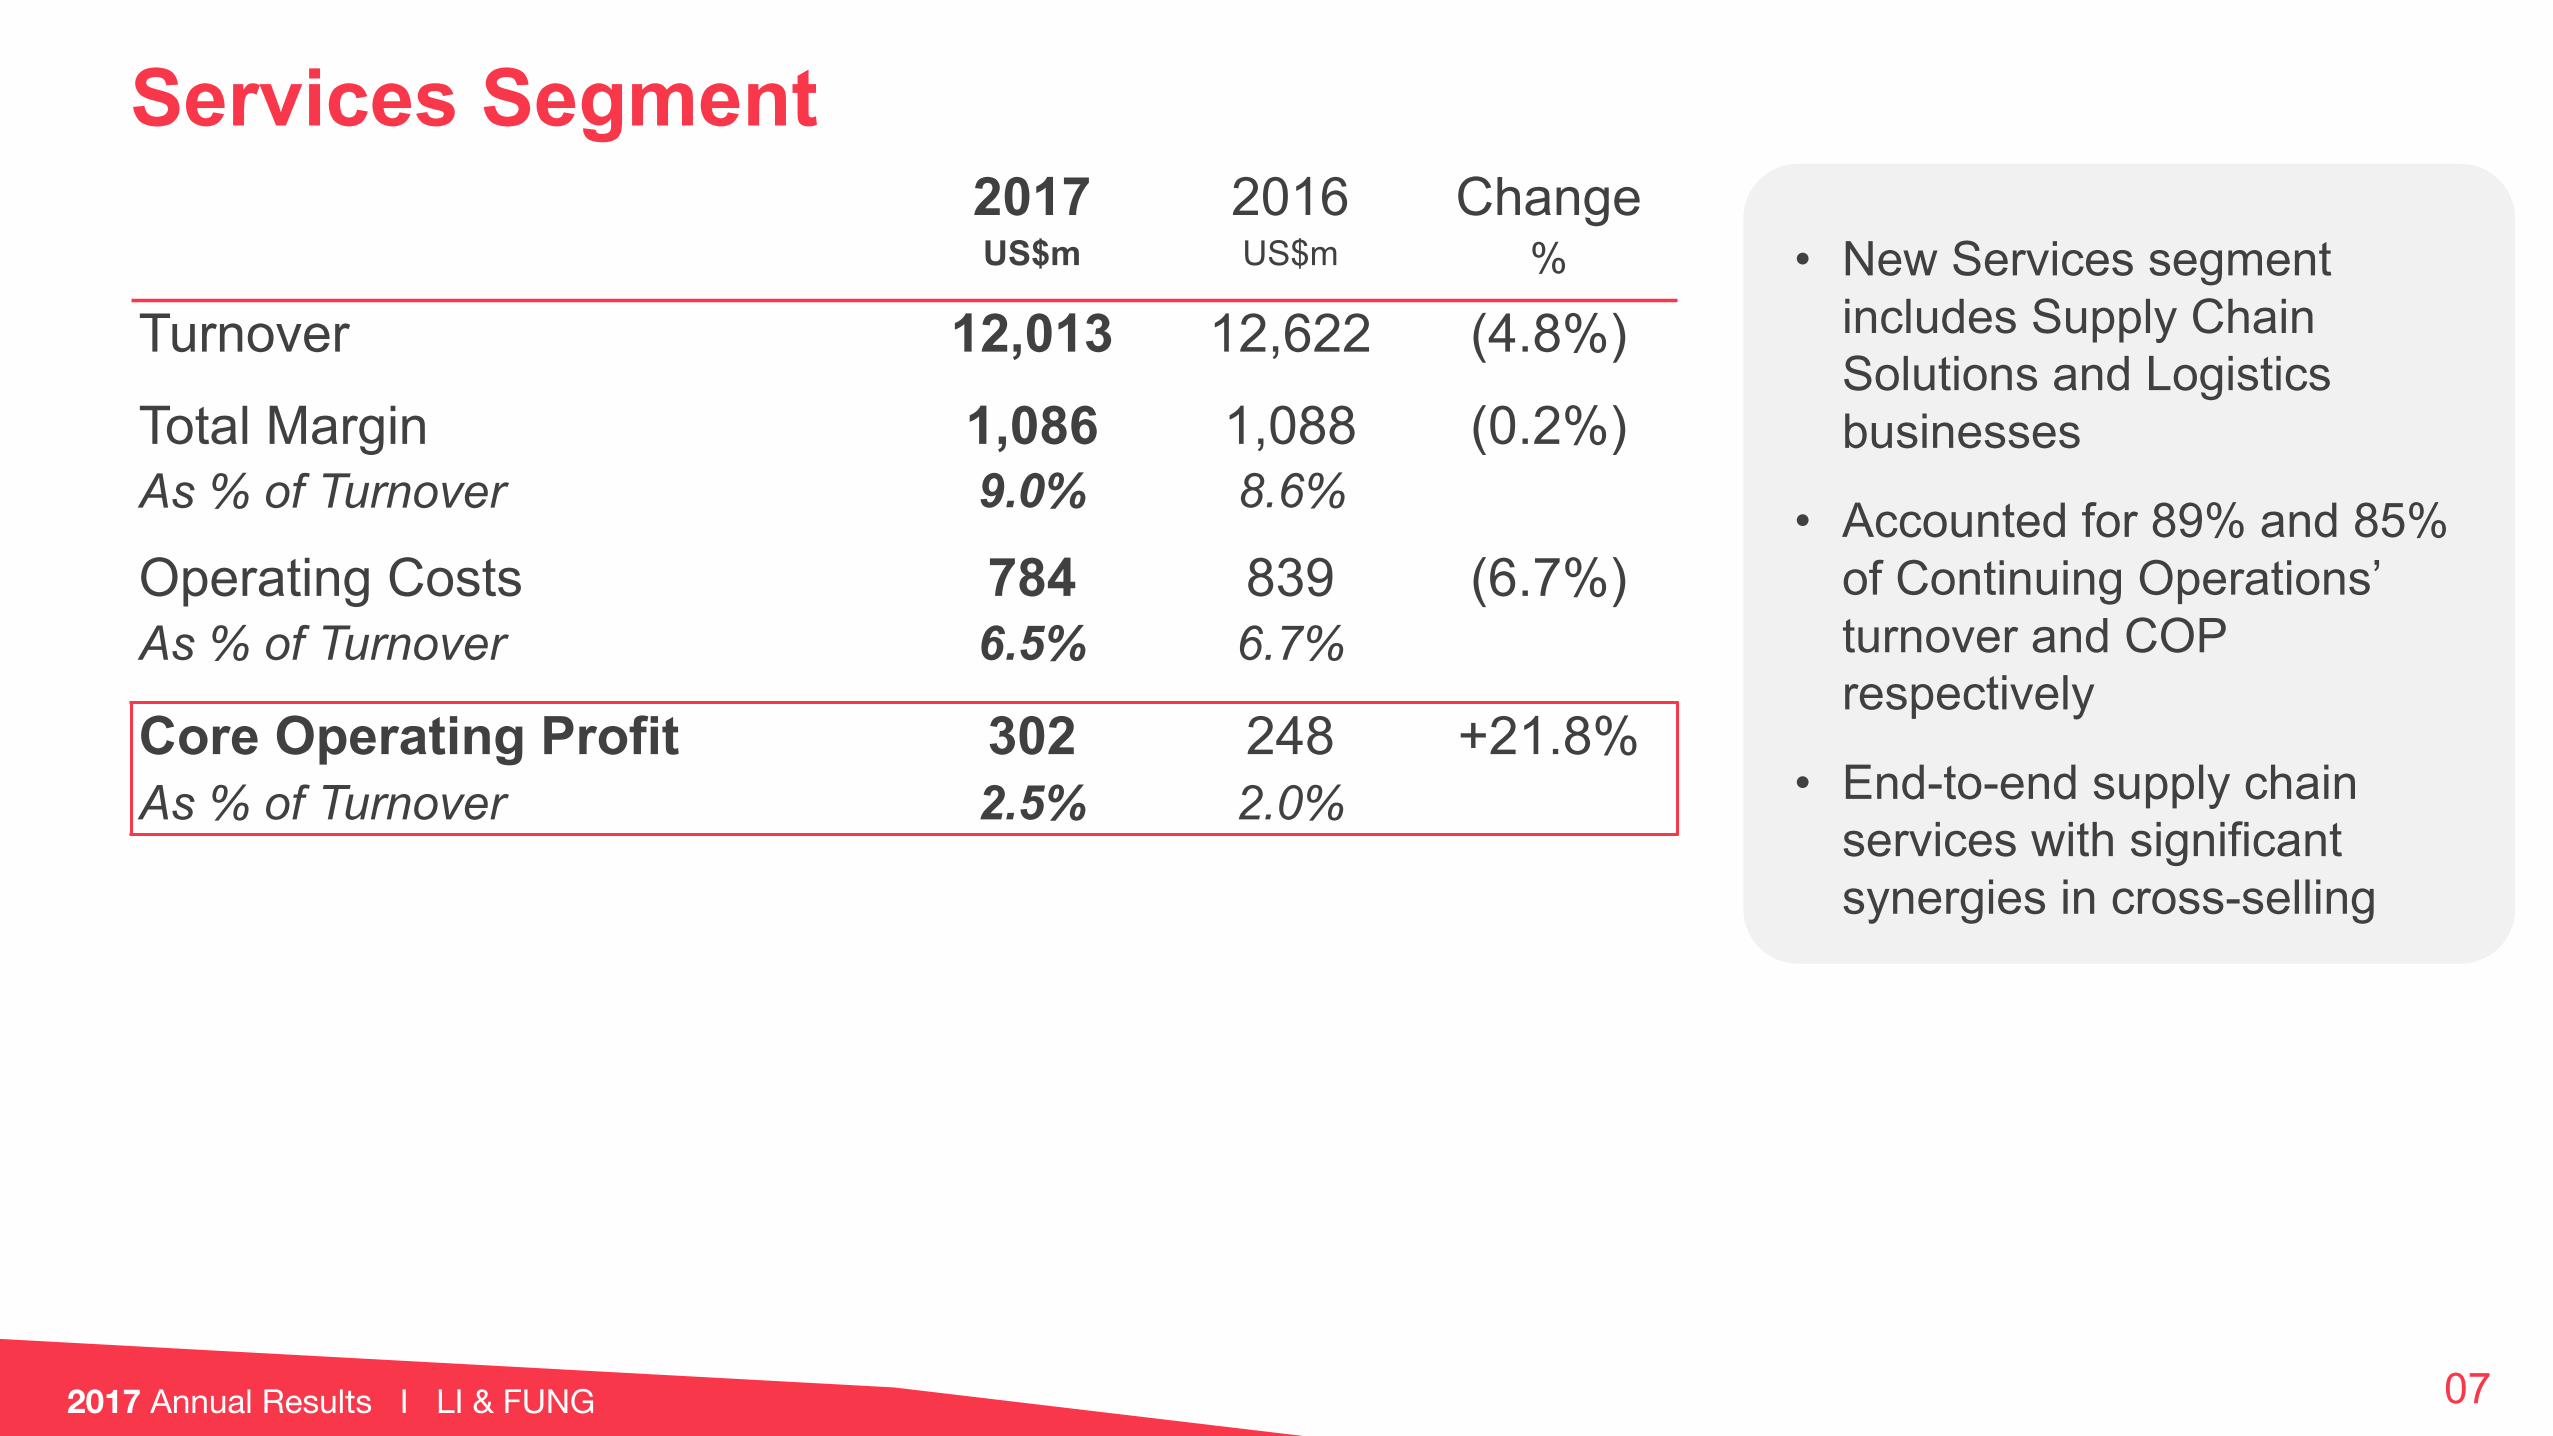
Services Segment2017 2016 ChangeUS$m US$m %
Turnover 12,013 12,622 (4.8%)
Total Margin 1,086 1,088 (0.2%)As % of Turnover 9.0% 8.6%
Operating Costs 784 839 (6.7%)As % of Turnover 6.5% 6.7%
Core Operating Profit 302 248 +21.8%As % of Turnover 2.5% 2.0%
• New Services segment includes Supply Chain Solutions and Logistics businesses
• Accounted for 89% and 85% of Continuing Operations’ turnover and COP respectively
• End-to-end supply chain services with significant synergies in cross-selling
07
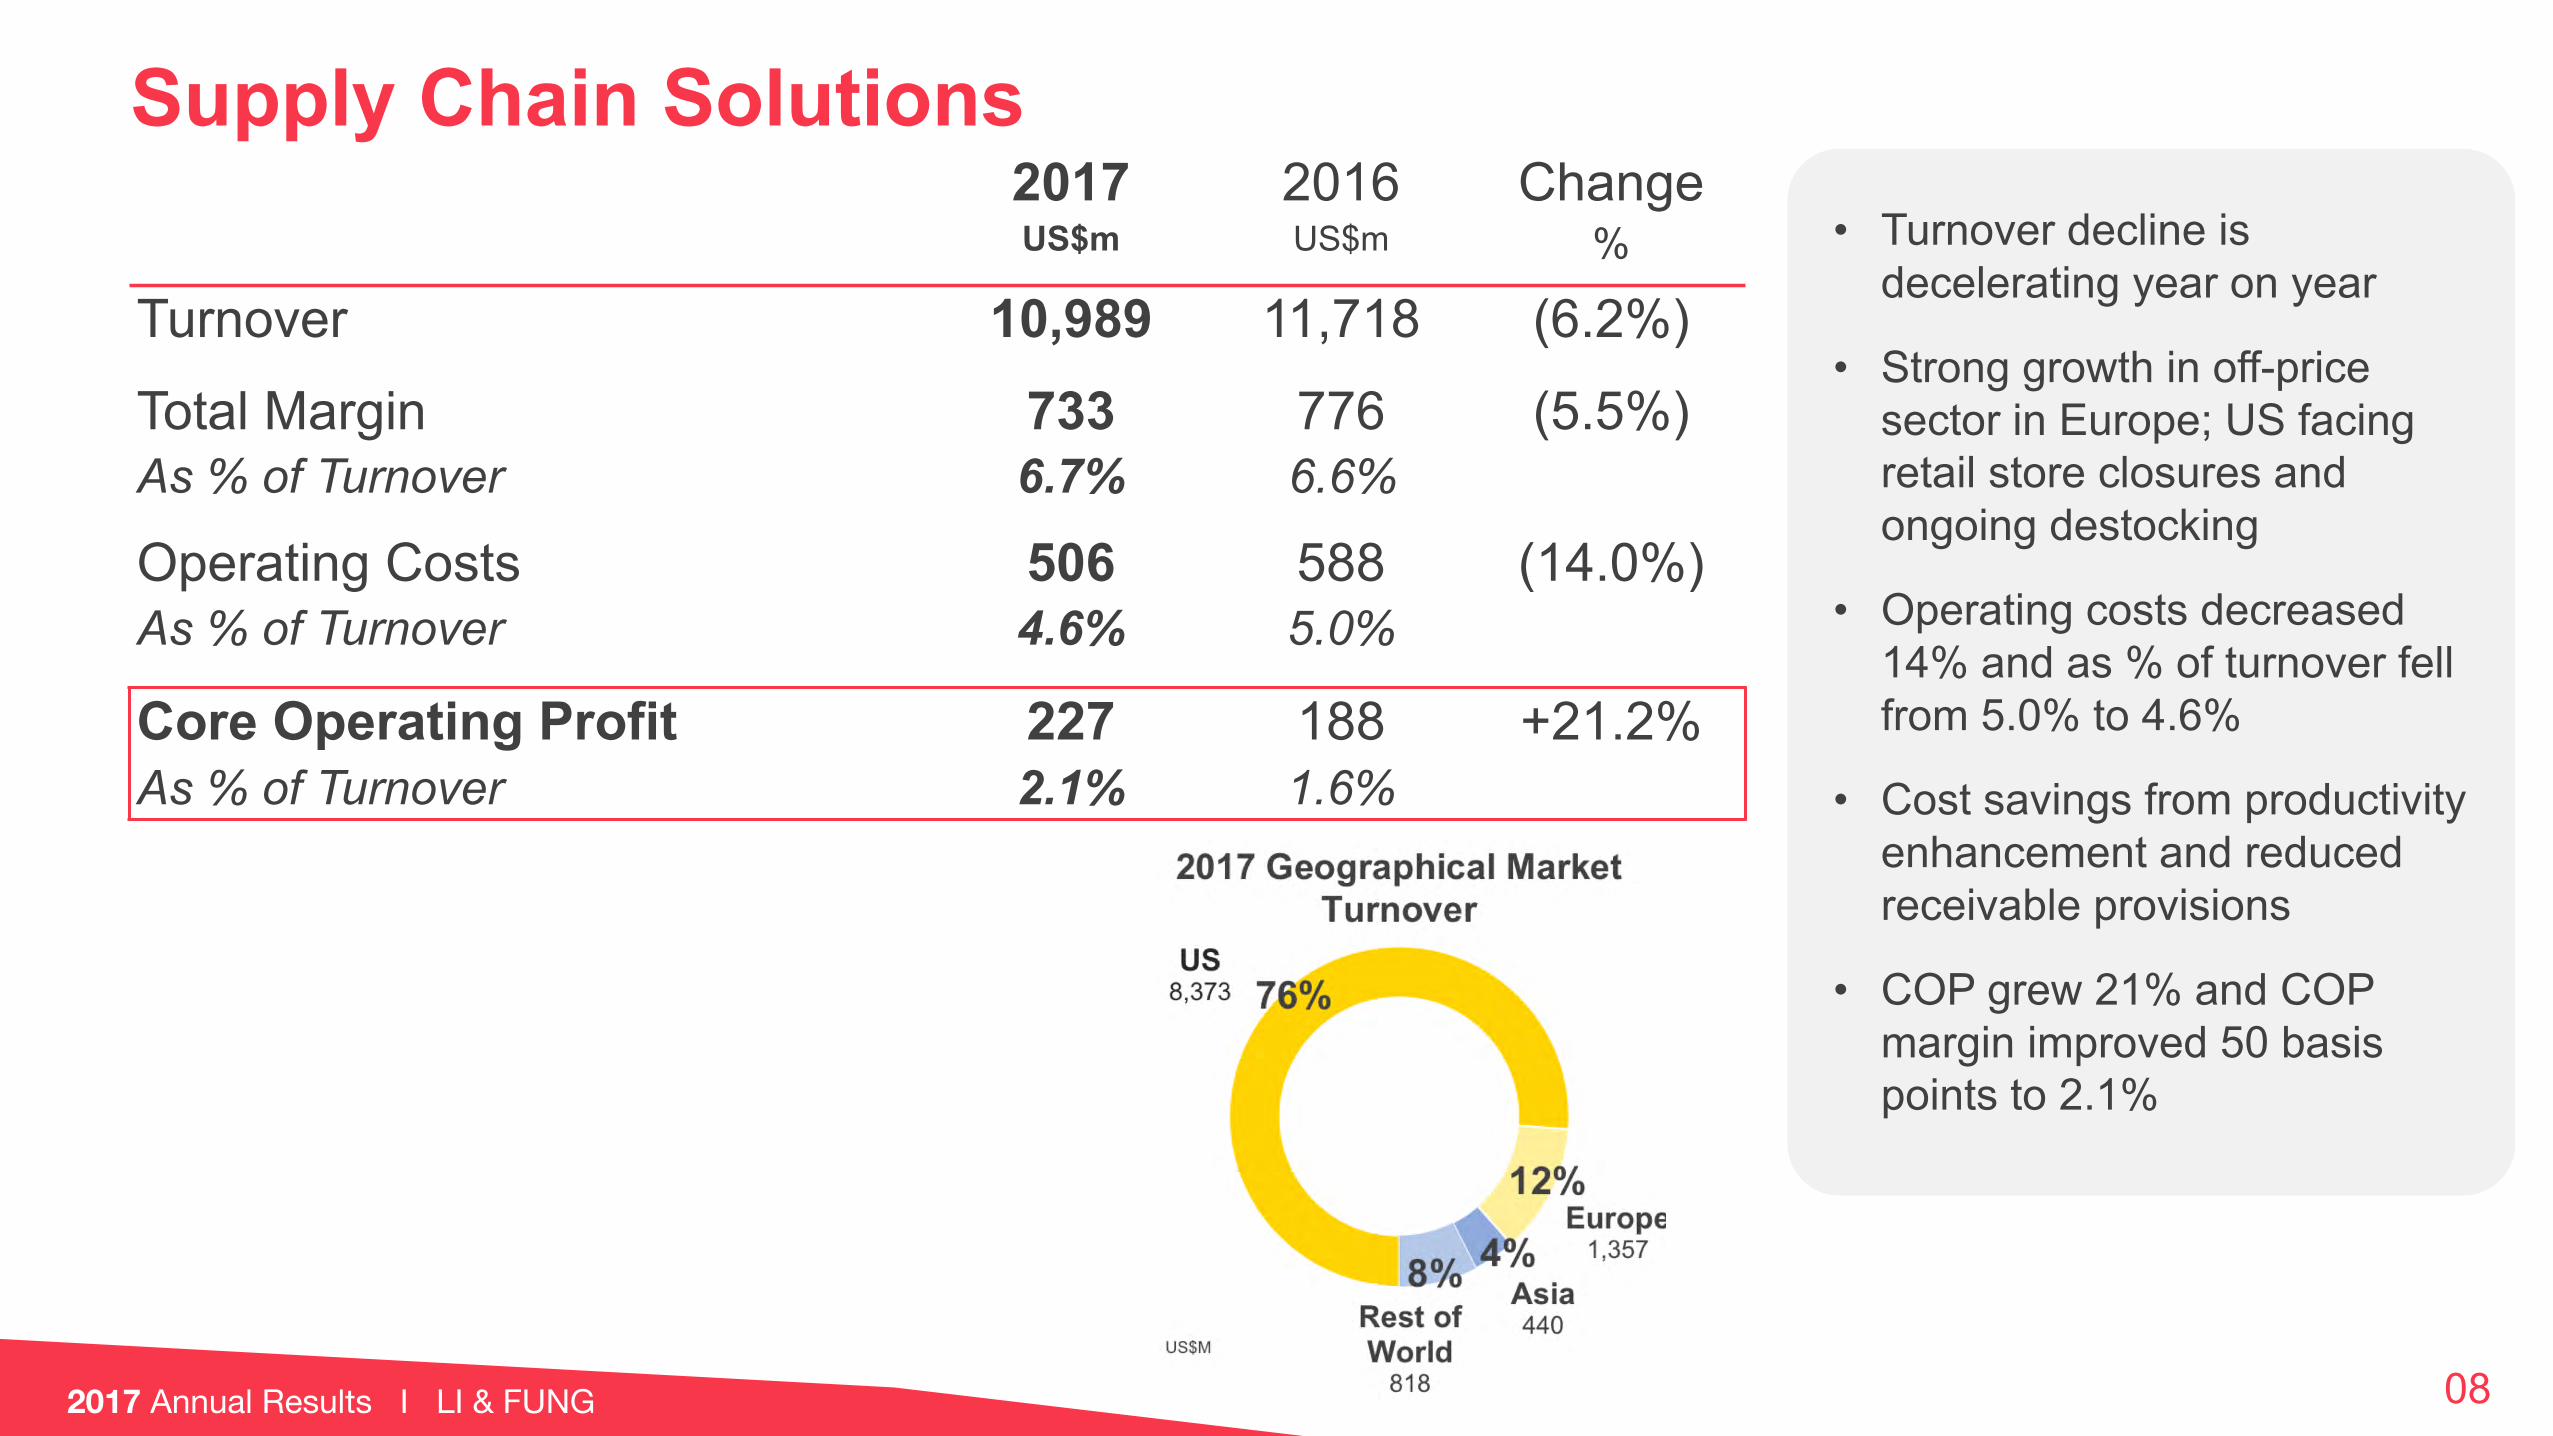
Supply Chain Solutions2017 2016 ChangeUS$m US$m %
Turnover 10,989 11,718 (6.2%)
Total Margin 733 776 (5.5%)As % of Turnover 6.7% 6.6%
Operating Costs 506 588 (14.0%)As % of Turnover 4.6% 5.0%
Core Operating Profit 227 188 +21.2%As % of Turnover 2.1% 1.6%
• Turnover decline is decelerating year on year
• Strong growth in off-price sector in Europe; US facing retail store closures and ongoing destocking
• Operating costs decreased 14% and as % of turnover fell from 5.0% to 4.6%
• Cost savings from productivity enhancement and reduced receivable provisions
• COP grew 21% and COP margin improved 50 basis points to 2.1%
08

Logistics2017 2016 ChangeUS$m US$m %
Turnover 1,028 907 +13.3%
Total Margin 353 312 +13.1%As % of Turnover 34.3% 34.3%
Operating Costs 278 251 +10.6%As % of Turnover 27.0% 27.7%
Core Operating Profit 75 61 +23.8%As % of Turnover 7.3% 6.7%
09
• Growth mainly driven by market share gains, geographical expansion and success in new markets
• Robust consumption growth in Asia provided strong impetus to in-country logistics, particularly e-logistics
• COP increased 24% and COP margin improved 60 basis points to 7.3%

Products Segment (Continuing Operations)2017 2016 ChangeUS$m US$m %
Turnover 1,552 1,590 (2.4%)Total Margin 300 320 (6.2%)As % of Turnover 19.4% 20.1%
Operating Costs 247 255 (3.0%)As % of Turnover 15.9% 16.0%
Core Operating Profit 53 66 (18.6%)As % of Turnover 3.4% 4.1%
• Products segment consists of Onshore Wholesale business
• Turnover driven down by anemic consumer sentiment and unstable economic environment, particularly in Europe
• Total margin percentage declined 70 basis points to 19.4%, largely resulted from persistent promotional activities in the US and weak economy in Europe
• COP fell 19% and COP margin declined 70 basis points to 3.4%
• It will be restructured
10
Onshore Wholesale Business
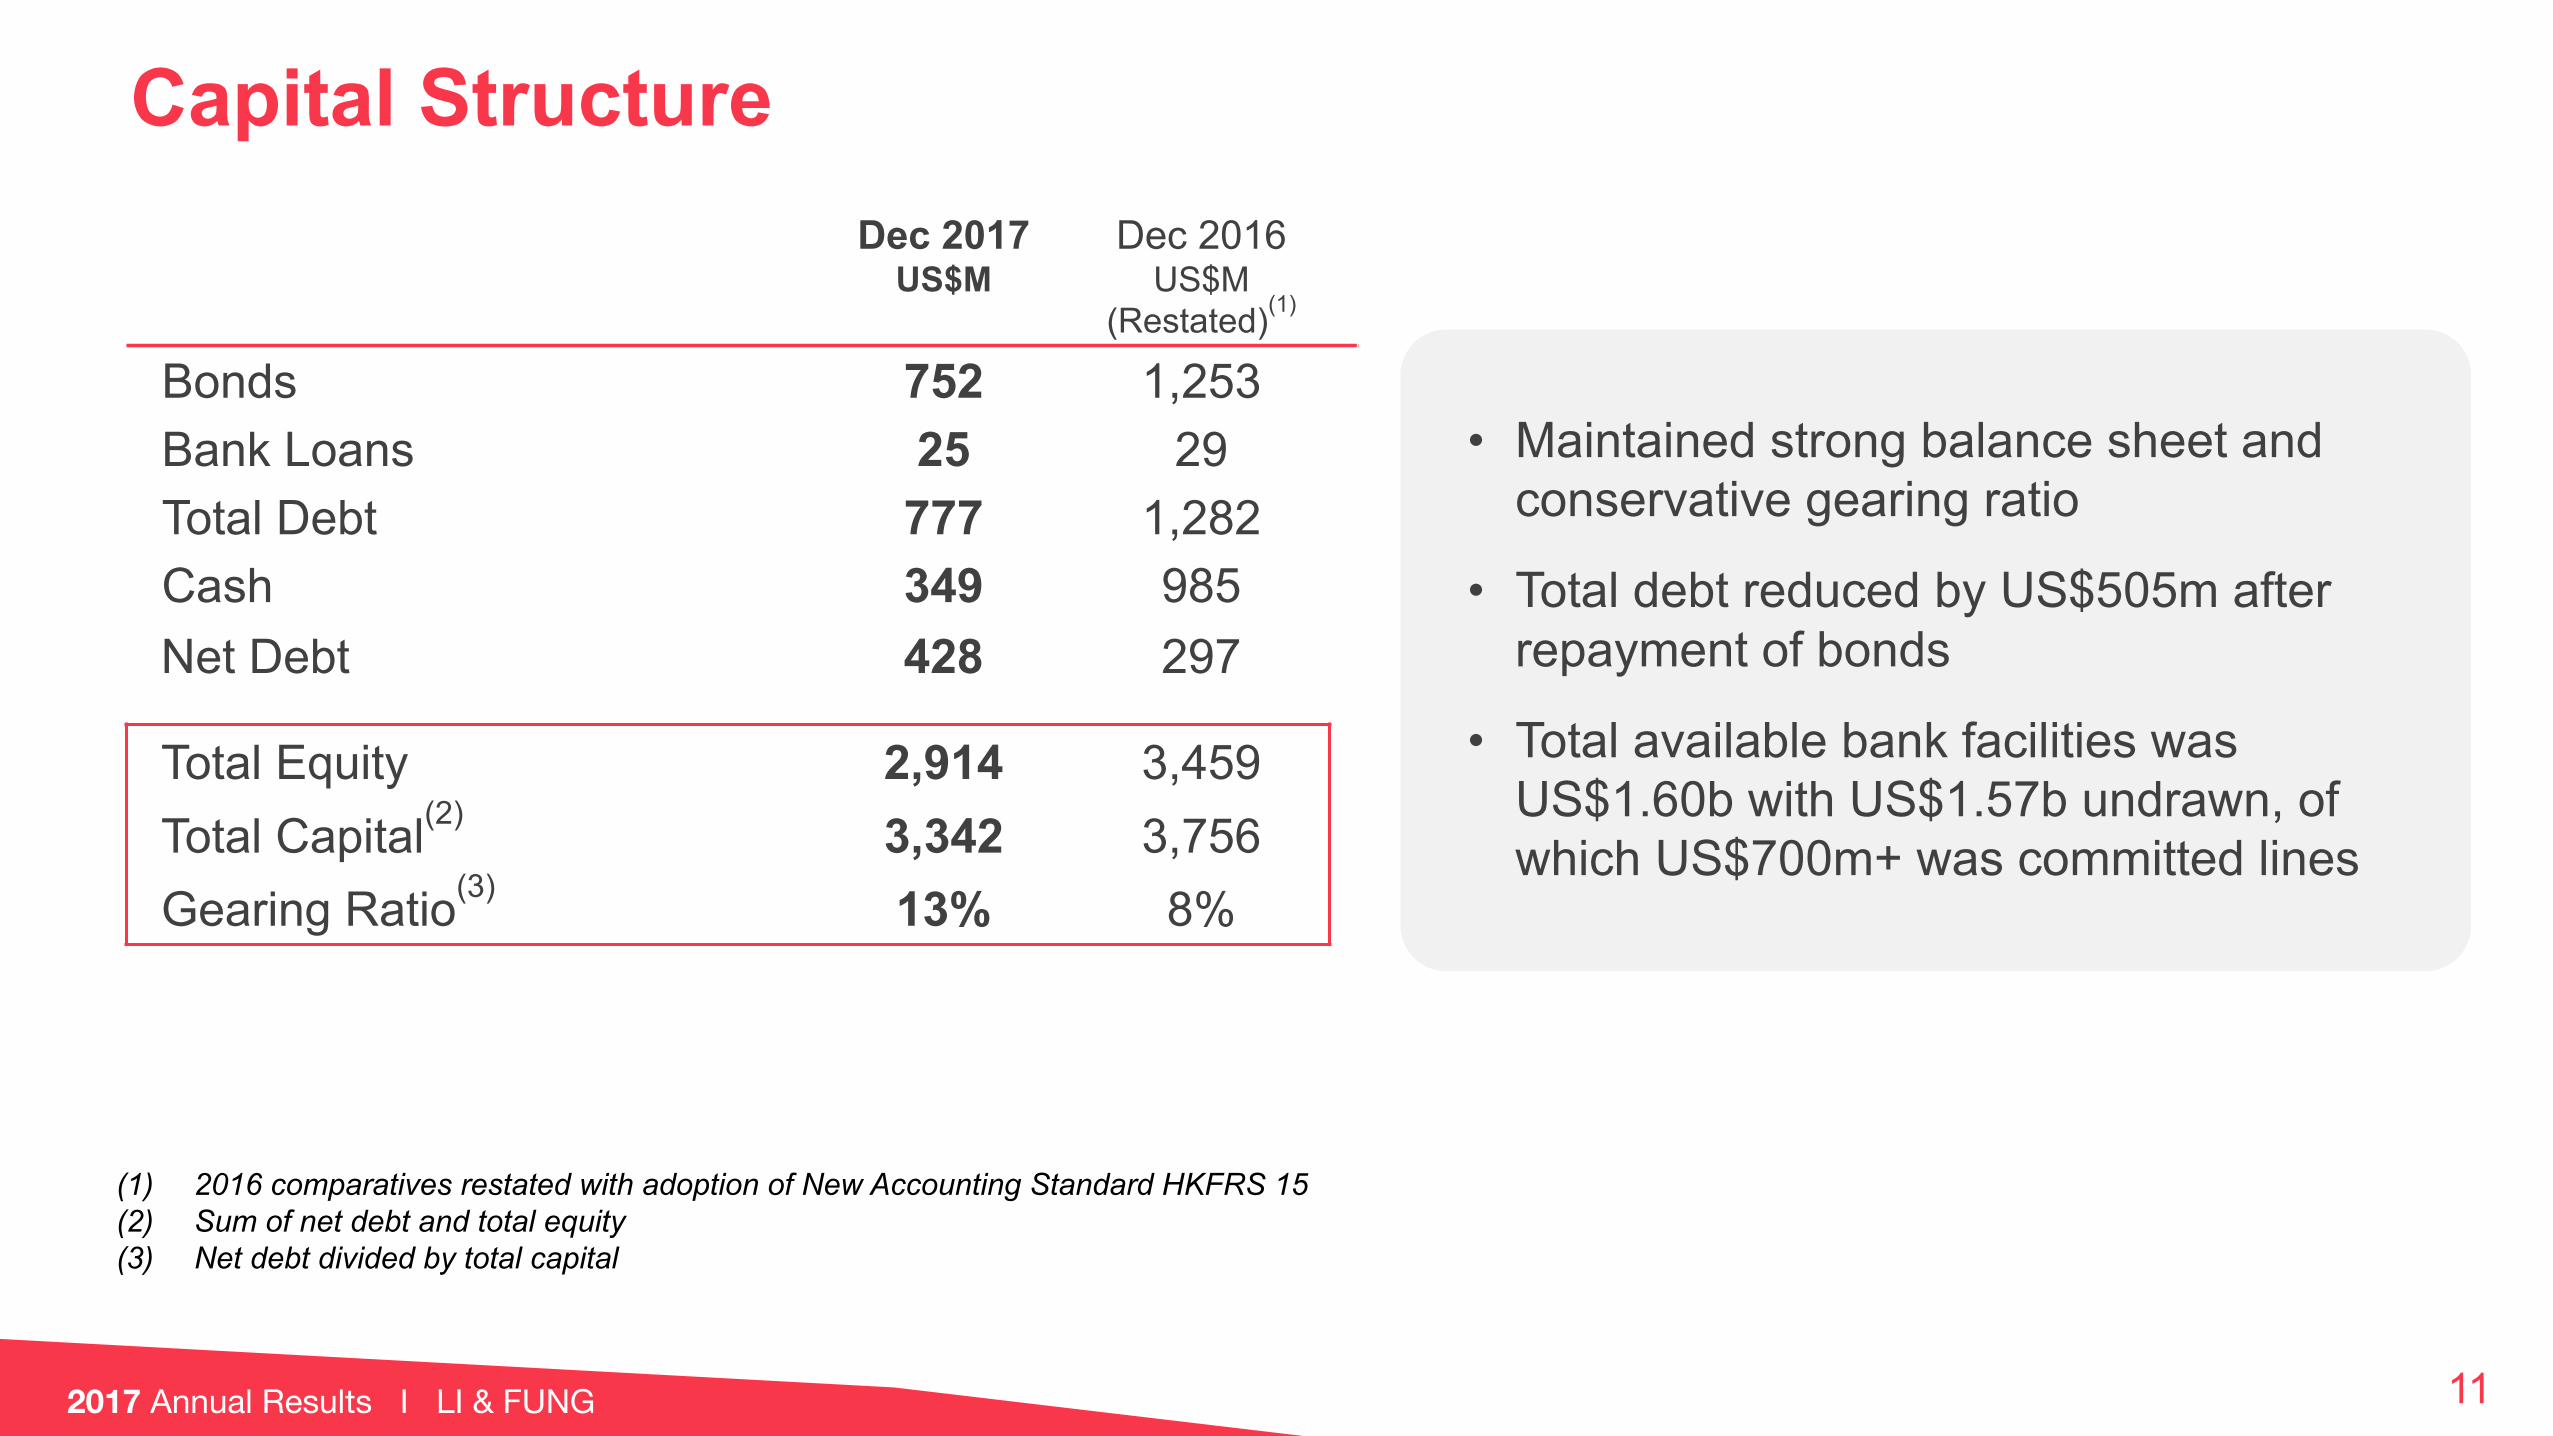
Capital StructureDec 2017
US$MDec 2016
US$M(Restated)(1)
Bonds 752 1,253Bank Loans 25 29Total Debt 777 1,282Cash 349 985Net Debt 428 297
Total Equity 2,914 3,459Total Capital(2) 3,342 3,756Gearing Ratio(3) 13% 8%
• Maintained strong balance sheet and conservative gearing ratio
• Total debt reduced by US$505m after repayment of bonds
• Total available bank facilities was US$1.60b with US$1.57b undrawn, of which US$700m+ was committed lines
11
(1) 2016 comparatives restated with adoption of New Accounting Standard HKFRS 15(2) Sum of net debt and total equity(3) Net debt divided by total capital

Strategic Divestment I Simplifying Our Business
Product Verticals
Furniture
Spin-off StrategicDivestment
StrategicDivestment
Asia Consumer & Healthcare
Distribution Business
12
2014 2016 2017

Furniture
Special Dividend
US$520m
47.6 HK cents / share
Consideration
$1.1b Further strengthens capital structure
US$580m
Strategic Divestment I Strengthens Capital Structure
13
US
99.94% of the Independent Shareholder votes were in favor of the strategic divestment; the transaction is subject to regulatory approval
14
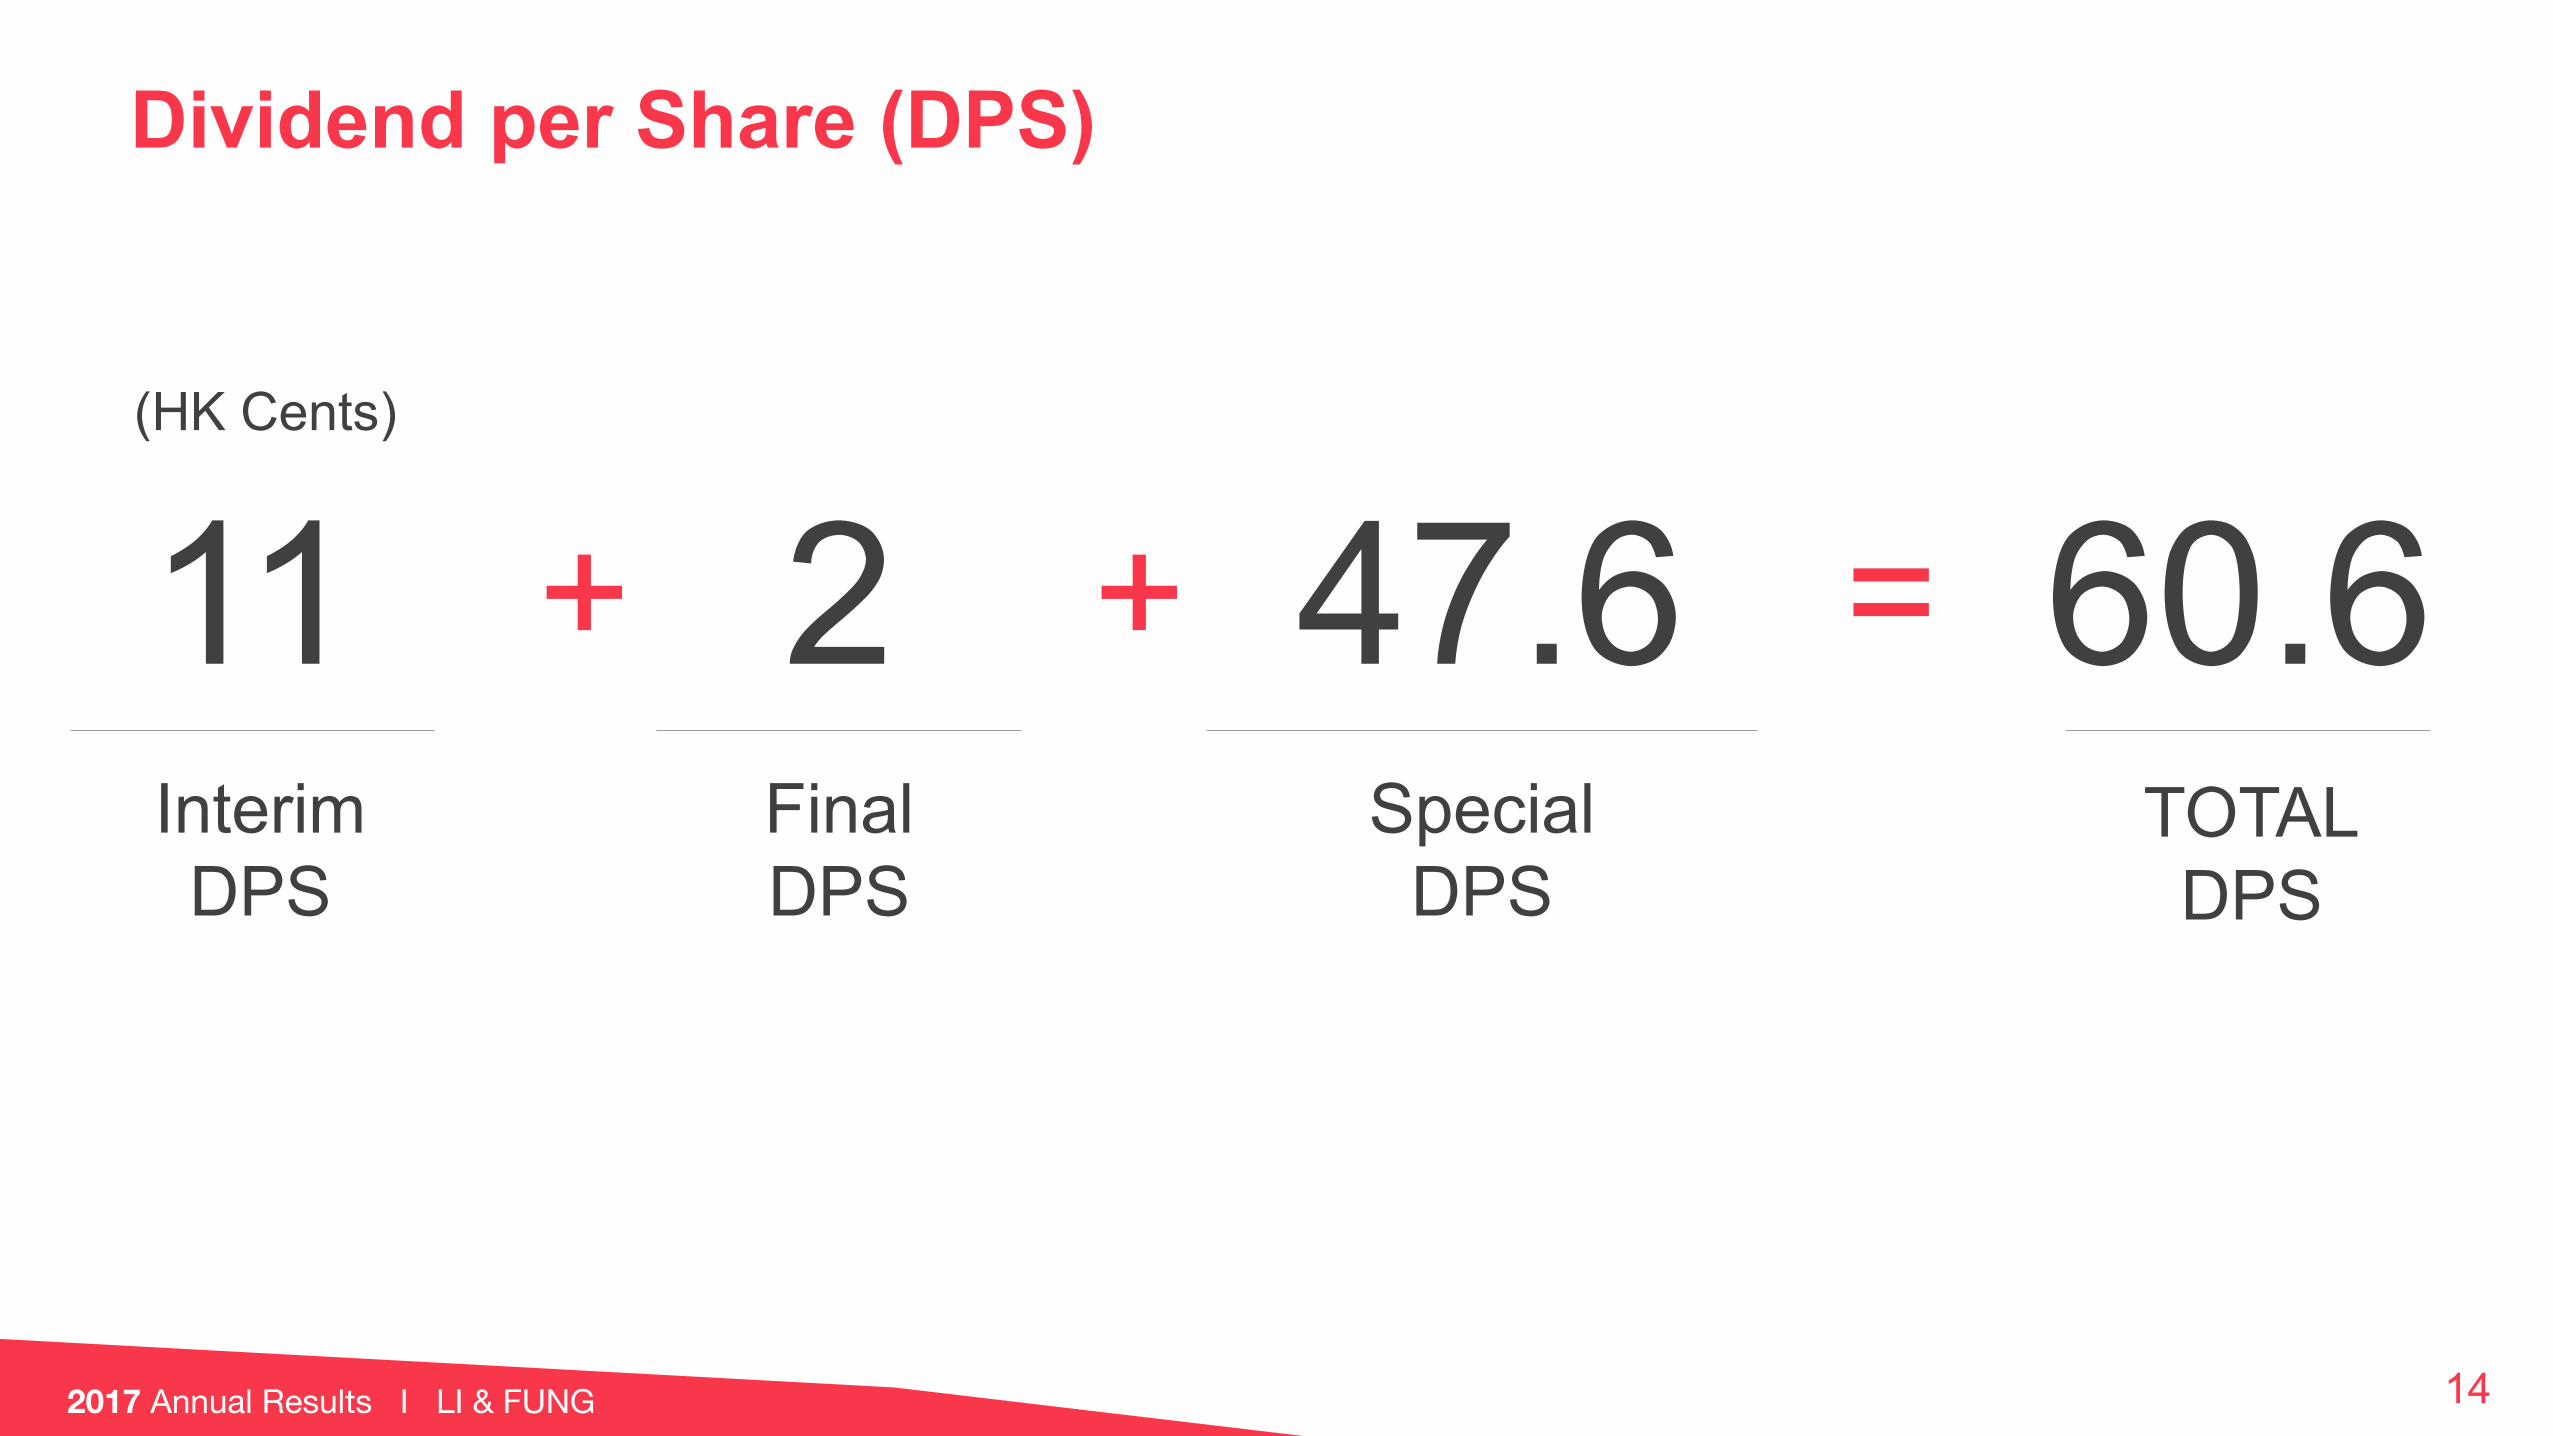
11InterimDPS
2FinalDPS
+ 47.6Special
DPS
+ = 60.6TOTALDPS
(HK Cents)
Dividend per Share (DPS)

Macro Environment
15

Global Network Absorbs Trade Uncertainty
• Increased complexities due to FTAs, geopolitical instability and rising costs
• Trump Administration’s tougher, protectionist stance on trade may disrupt the sourcing landscape
• Potential tariff hikes and new trade policies may accelerate the diversification of production base away from China
• Global footprint provides flexibility and diversification
• Li & Fung well positioned to weather trade uncertainty
16
Strong network of offices and suppliers across 40+ economies

Our goal is to create the supply chain of the future to help our customers navigate the digital economy and to improve the lives of one billion people in the supply chain.
17
Three-Year Plan Goal

18
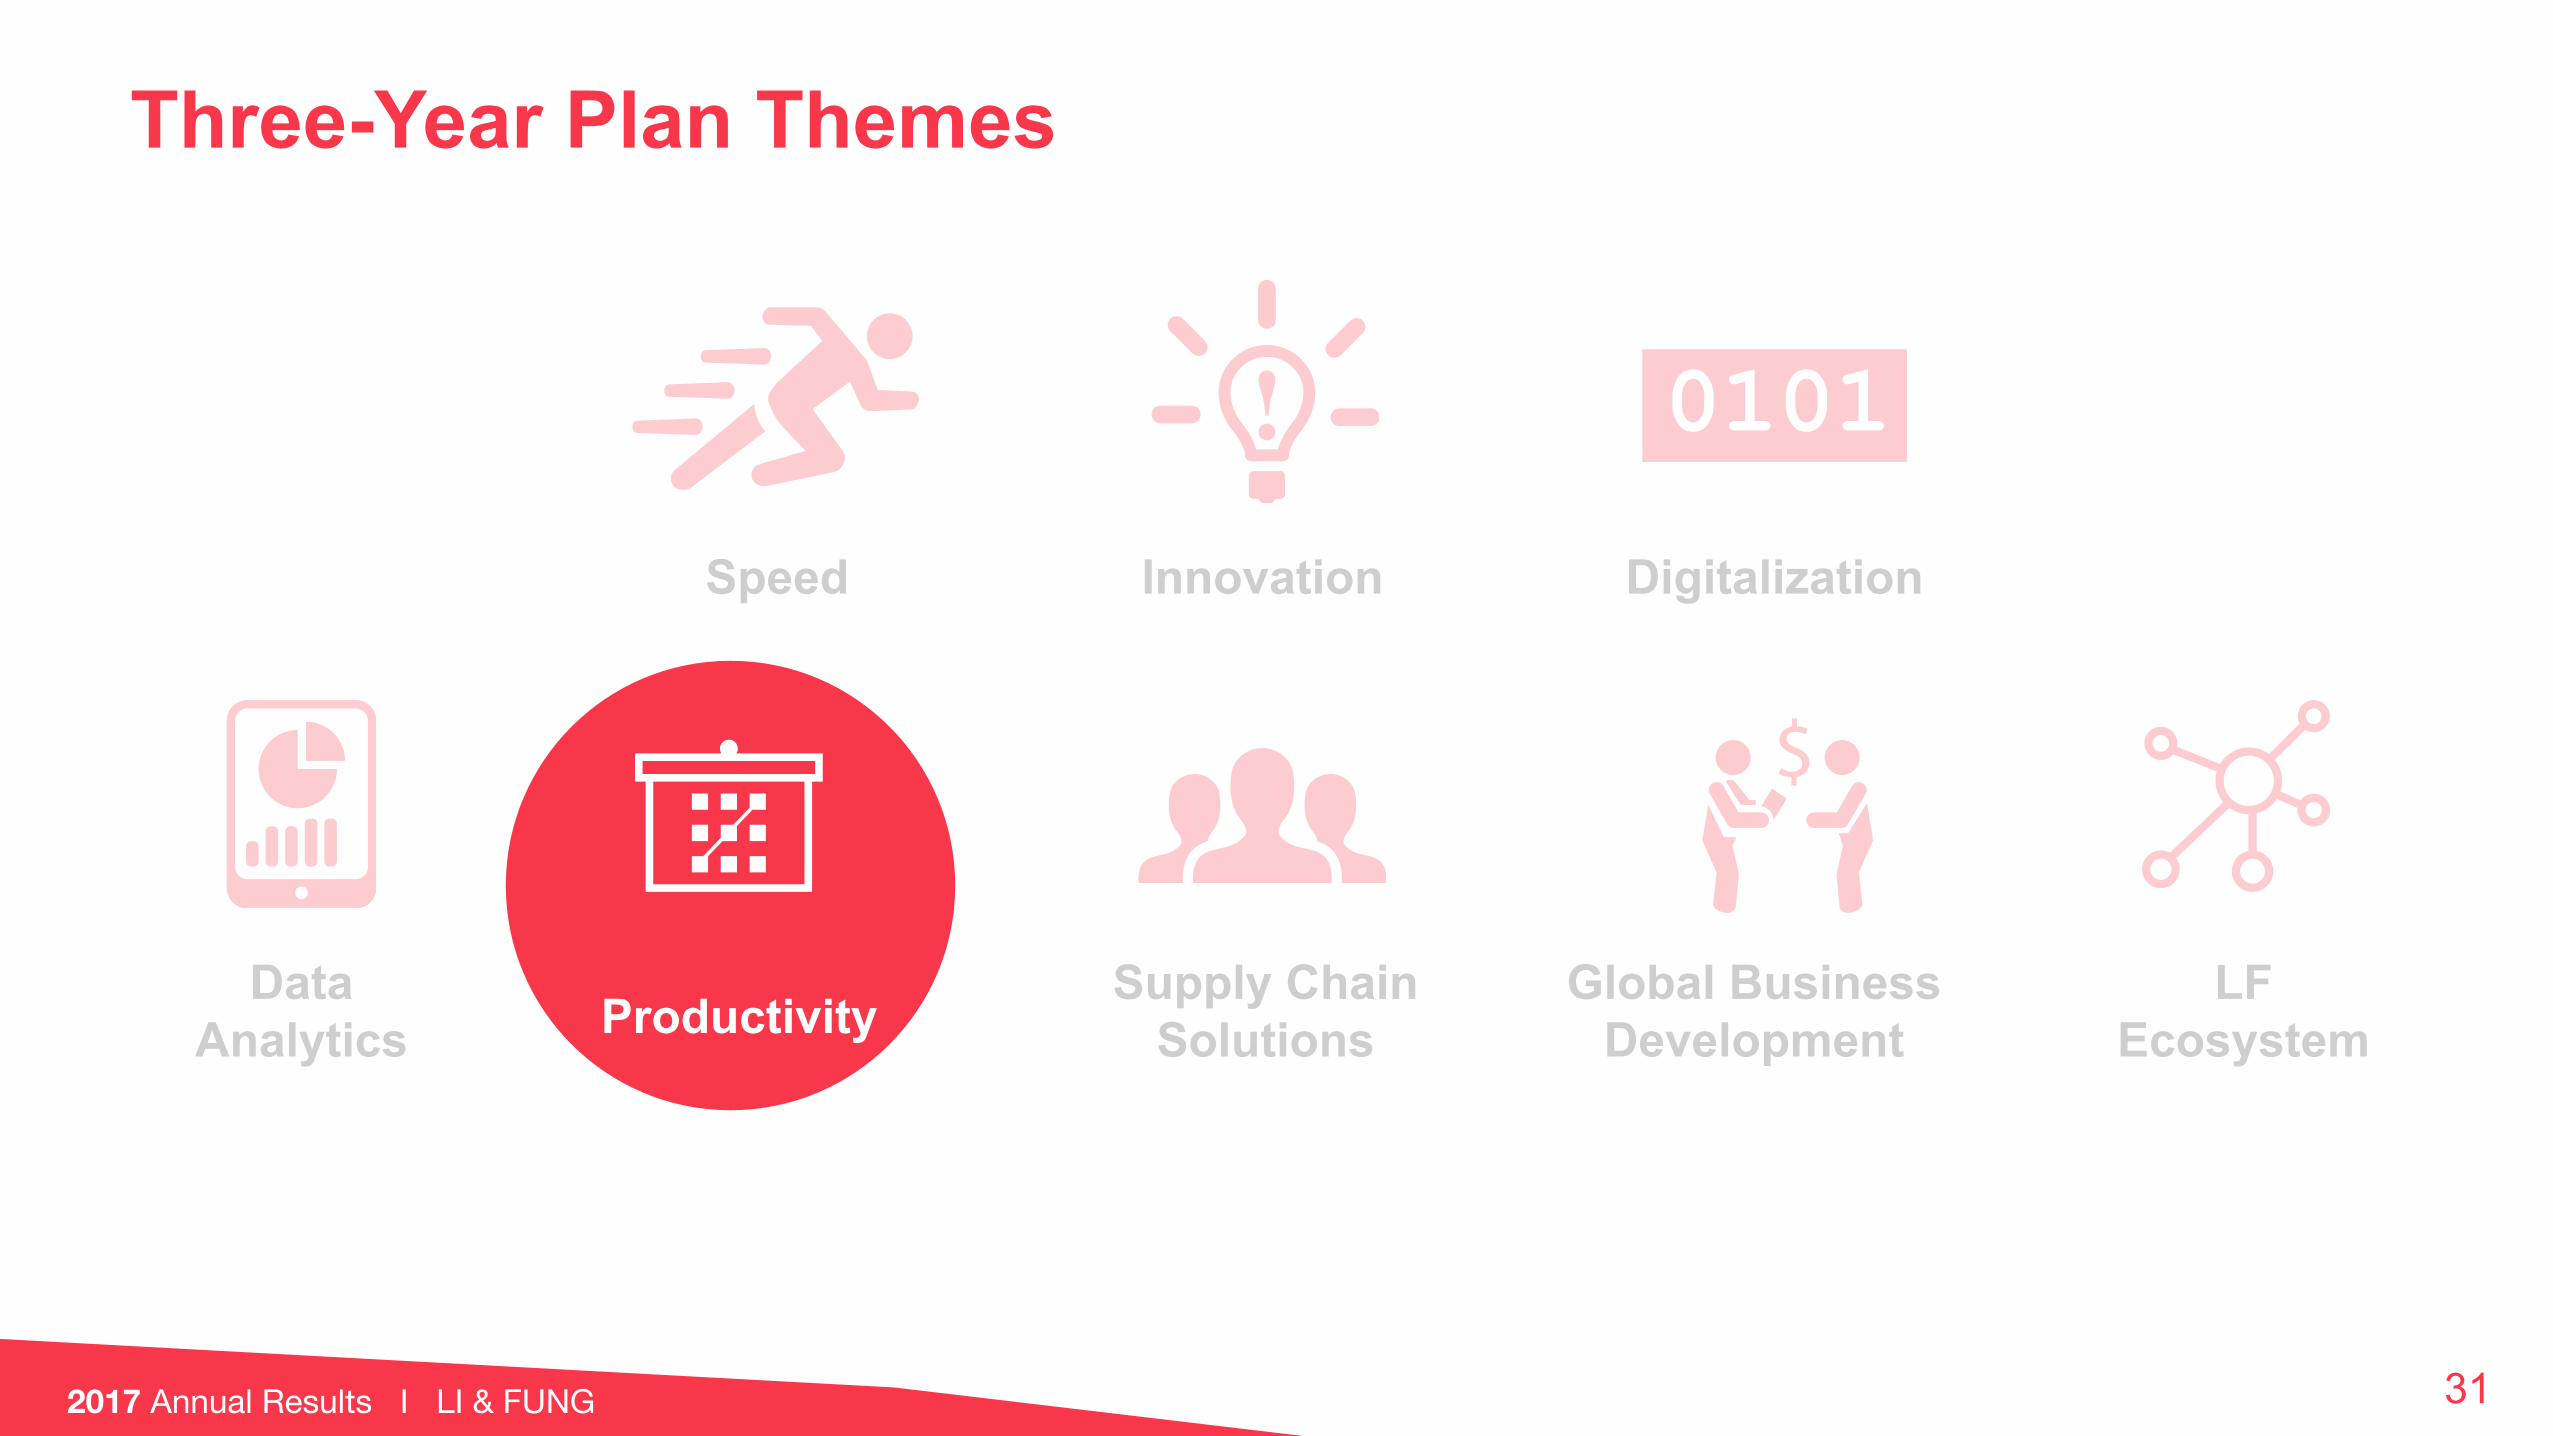
Data Analytics Productivity Supply Chain
SolutionsGlobal Business
DevelopmentLF
Ecosystem
Speed Innovation Digitalization
Three-Year Plan Themes
Speed

19
Speed
Stabilize
40 weeksFirst week
Lead time
20 weeks

20
Speed
Stabilize
20 weeks 40 weeksFirst week
Lead time
1.25XIncreased speed
8 weeks
Increased speed 2X
GOAL
Reduced by 20%

21
TOTAL
40WEEKS
Speed I The Results

22
TOTAL
SALES
INVENTORY MARK-DOWN
25%
25% 30%
40WEEKS
Speed I The Results
3.1XSPEED
MaterialsManagement
Role Alignment
EmpowermentOf Vendors
Speed“Buckets”
1
23
Tactical Speed Strategies
13WEEKS

23
Speed I Using 3D to Enhance Speed
28DAYS
21DAYS
84DAYS

24
Speed I Using 3D to Enhance Speed
28DAYS
21DAYS
84DAYS
14
7
14
Increase speed
2X
3X
6X

Year 1 Year 2 Year 3
Customer Turnover
Speed
Inventory
+30% to 40% yearly
25
Year 1 Year 2 Year 3
Speed I Financial Implications

26
Data Analytics Productivity Supply Chain
SolutionsGlobal Business
DevelopmentLF
Ecosystem
Speed Innovation Digitalization
Three-Year Plan Themes
Innovation

27
MON TUE WED THUSUN FRIDAY
Successfully crowdfunded in ONE DAY!
Innovation I BetabrandCustomers co-designed product in 5 days

28
Data Analytics Productivity Supply Chain
SolutionsGlobal Business
DevelopmentLF
Ecosystem
Speed Innovation Digitalization
Three-Year Plan Themes
Digitalization

Resulting in operational improvements of digital product development time savings
29
10X
Digitalization I 3D Virtual Design
More customers
Increase in total number of
styles
More full-time 3D designers
12X40XIncrease in
weekly output per designer
3X

30
Digitalization I 3D Virtual Store
31
Data Analytics Productivity Supply Chain
SolutionsGlobal Business
DevelopmentLF
Ecosystem
Speed Innovation Digitalization
Three-Year Plan Themes
Productivity
32
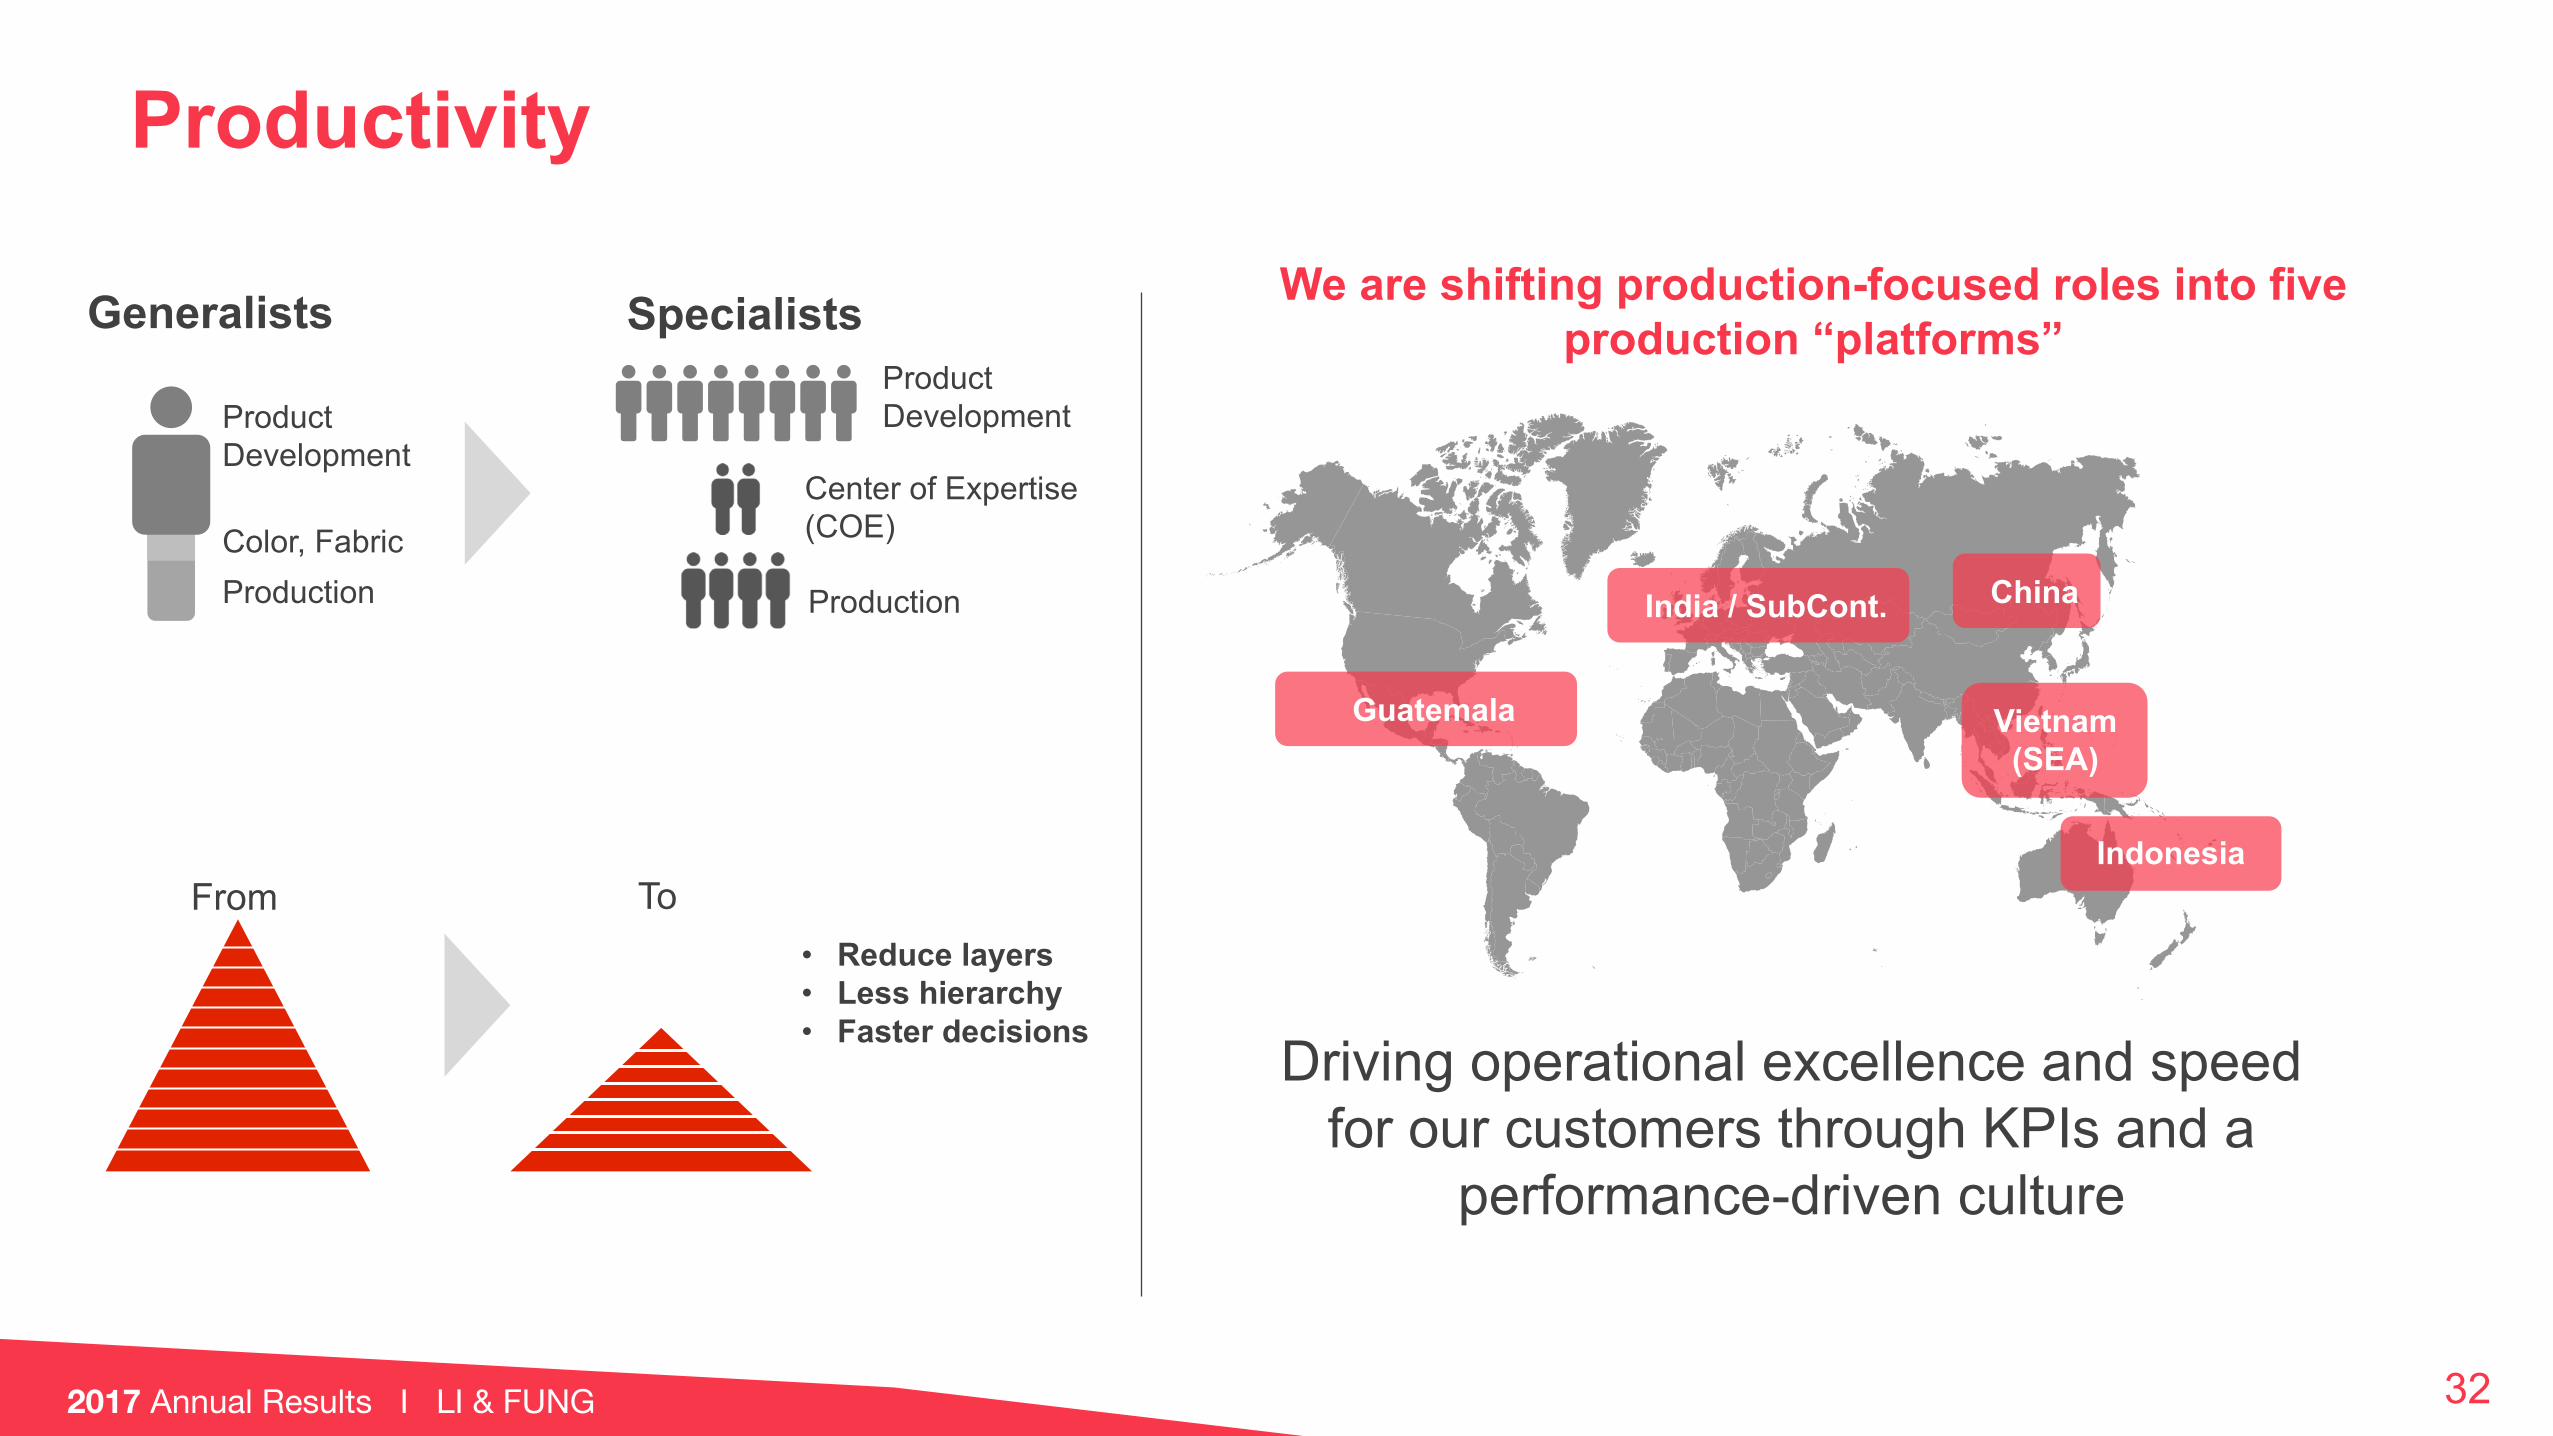
We are shifting production-focused roles into five production “platforms”
Driving operational excellence and speed for our customers through KPIs and a
performance-driven culture
• Reduce layers• Less hierarchy• Faster decisions
From To
ProductDevelopment
Color, FabricProduction
Center of Expertise (COE)
Production
Generalists Specialists
India / SubCont. China
Vietnam (SEA)
Indonesia
Guatemala
Productivity
ProductDevelopment

33
85.7%
14.3%
78.9%
21.1%
79.2%
20.8%
57.3%
42.7%
40.5%
59.5%
33.4%
66.6%
33.4%
66.6%
30.8%
69.2%
32.2%
67.8%
100%
0%
50%
Jun 17 Jul 17 Aug 17 Sep 17 Oct 17 Nov 17 Dec 17 Jan 18 Feb 18
AutomationManual
Global Transaction Services
25.4%
Mar 18
74.6%
Productivity I Automation
34
Data Analytics Productivity Supply Chain
SolutionsGlobal Business
DevelopmentLF
Ecosystem
Speed Innovation Digitalization
Three-Year Plan Themes
LF Ecosystem

35
We will expand the LF Ecosystem using our convening power with access to US$2T+ of retail sales to bring together diverse players in the global supply chain and beyond.
LF Ecosystem
Consumer
Consumer Needs Product
Design Product Development
Vendor Compliance
Raw Material Sourcing
Factory Sourcing
Manufacturing Control
Shipping ControlForwarderConsolidation
Customs Clearance
Local Forwarding
Consolidation
Wholesaler
Retailer
Distribution & logistics
Raw materials / suppliers
InnovatorsBrands & retailers
Tech providers
Commercialpartners
Financial institutions
Consumer & market insight
In-store technologies / e-Com
e-Wholesaler
Virtual Sampling
Procurement platforms
Finished products marketplace
Production optimization
Fulfillment & warehouseDigital
Analog

Logistics
36

37
Logistics I In-country e-Logistics Growth
2010 2011 2012 2013 2014 2015 2016 - 2017

38
May 2017
Delhi site visit
Sep 2017
Completed Delhi facility
set up
Oct 2017
Delhi DC Go Live
Jan 2018
Completed Mumbai
facility set up
Mar 2018
Mumbai DC Go Live
Logistics I Geographic entry into India

39
Logistics I World Gateway Distribution Centre, Singapore
40
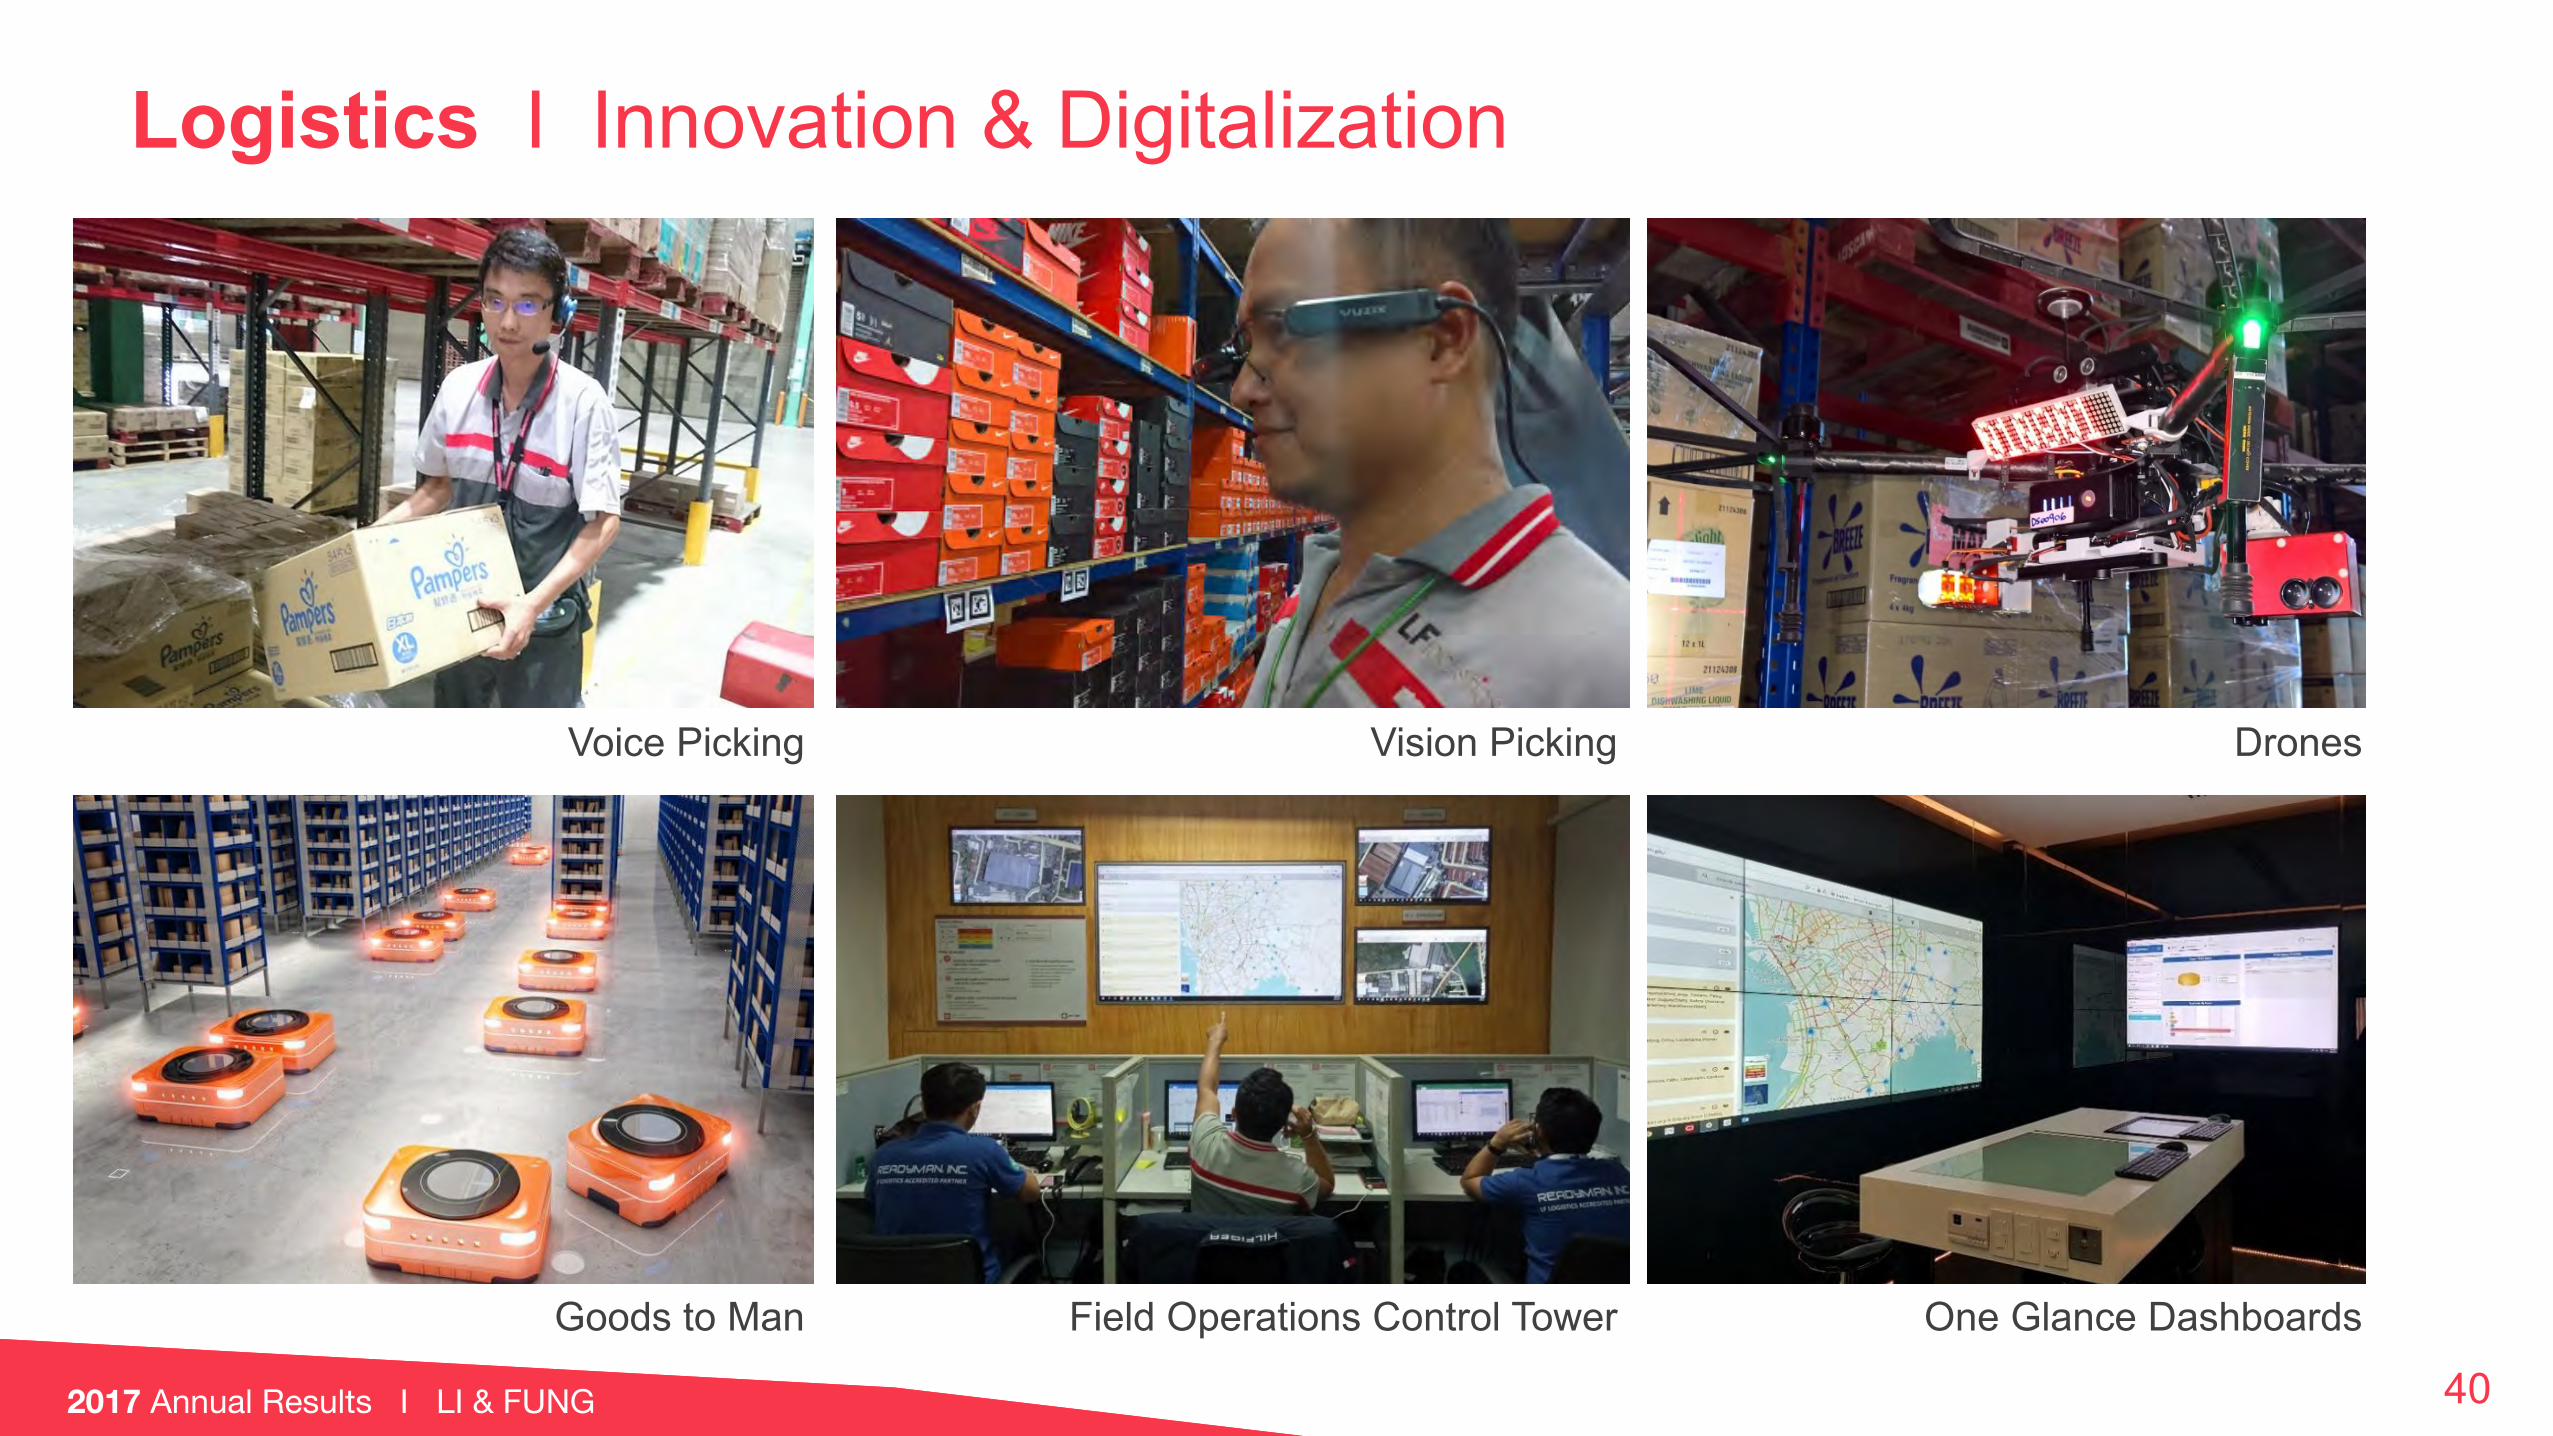
Voice Picking Vision Picking Drones
Goods to Man Field Operations Control Tower One Glance Dashboards
Logistics I Innovation & Digitalization

Summary
41
Three-Year Plan (2017 - 2019) is on track with a strong start in its first year
Core Services Segment of supply chain solutions and logistics businesses delivered solid growth of 21.8% in core operating profit
Global network of 15,000 suppliers in over 40 markets well-positioned to absorb any shock from trade uncertainty
Declared a conditional special dividend of 47.6 HK cents per share and a final dividend of 2 HK cents per share for a total of 49.6 HK cents per share
Strategic divestment of three Product Verticals to generate US$1.1 billion of cash


