Page 1
Reference Model
GAIL India LimitedPrepared By: Disha Vyas, Distance learning, Mumbai
Mumbai
IMS Proschool Pvt Ltd,
Maharashtra High School Complex,
Principal N.M Kale Marg, Off Gokhale Rd,
Dadar (W), Mumbai 400028
+91 9372895050
http://proschoolonline.comEmail ID : [email protected]
Tel. No. : 022-65285393/94
Page 2
Directions
IMS Proschool Pvt Ltd,
Maharashtra High School Complex,
Principal N.M Kale Marg, Off Gokhale Rd,
Dadar (W), Mumbai 400028
+91 9372895050
GAIL has successfully evolved into a major integrated gas company with presence across the natural gas value chain and with global footprints. A financial model of such a company is in great demand in the investment market. This gave us the opportunity to guide our student to come out with a financial model on the company. These exercises help the student at IMS Proschool to hone their financial modeling skills.
This model is being developed by a financial modeling student at IMS Proschool. This is provided as reference model and is for information purpose only. Keeping in view the objective of the reference model, the formulas and linkages of the model are kept intact.
IMS Proschool provides certificate programs in Financial Modeling. The program grooms the candidates for entry level jobs in the finance sector which require financial analysis and modeling skills. The program aims to impart the necessary skills required to perform the role of a Financial Research Analyst. The program equips students with the practical skill sets required to perform financial analysis, modeling and valuation through Excel. For more details, please contact the address furnished below. You can also email us at the below mentioned email-id.
Tel. No. : 022-65285393/94
Email ID : [email protected]
Page 3
IMS Proschool Pvt Ltd,
Maharashtra High School Complex,
Principal N.M Kale Marg, Off Gokhale Rd,
Dadar (W), Mumbai 400028
+91 9372895050
GAIL has successfully evolved into a major integrated gas company with presence across the natural gas value chain and with global footprints. A financial model of such a company is in great demand in the investment market. This gave us the opportunity to guide our student to come out with a financial model on the company. These exercises help the student at IMS Proschool to hone their financial
This model is being developed by a financial modeling student at IMS Proschool. This is provided as reference model and is for information purpose only. Keeping in view the objective of the reference model, the formulas and linkages of the model are kept intact.
IMS Proschool provides certificate programs in Financial Modeling. The program grooms the candidates for entry level jobs in the finance sector which require financial analysis and modeling skills. The program aims to impart the necessary skills required to perform the role of a Financial Research Analyst. The program equips students with the practical skill sets required to perform financial analysis,
For more details, please contact the address furnished below. You can also email us at the below mentioned email-id.
Tel. No. : 022-65285393/94
Email ID : [email protected]
Page 4
GAIL (INDIA) LTD.Company Overview(Figures in Rs. Millions.)
Company Information Company Description
Industry Natural Gas Industry
Sector Natural Gas Sector
Country INDIA
Current Market Price RS.420.65
Ticker NSE
Market Capitalization ($MM) 5,335,861.0
Relative Index (S&P 500) (S&P 500)
Year end 31-Mar Products
Reporting currency INDIAN (Rs.)
Per Share Data & Key Ratios
(in Rs.crores)
RATIOS31MAR '06 31MAR '07 31MAR '08 31MAR '09 31MAR '10 31MAR '11 31MAR '12
2005-06A 2006-07A 2007-08 A 2008-09 A 2009-2010E 2010-11E 2011-12E
EPS BASIC 28.22 30.76 22.02 18.40 21.14 29.10
EBITDA/sales (%) 19% 22% 17% 18% 13% 13%
Net income/sales (%) 14% 12% 12% 9% 8% 8%
Interest Cover 22.6 42.5 40.1 56.8 49.3 80.0
EV/Sales 2.25 2.16 1.64 1.21
EV/EBITDA 13.21 12.08 12.12 9.11
P/E 19.10 22.86 19.90 14.46
P/Sales 0.02% 0.02% 0.01% 0.01%
Segment revenue breakup for 2009
Natural Gas Trading 183,084
25,081
Petrochemicals 27,335
LPG & Liquid Hydrocarbons 29,900
Transmission Services - LPG 3,819
Gailtel 243
Others 5749
Total 275,211
GAIL (India) Limited, is India's flagship Natural Gas company, integrating all aspects of the Natural Gas value chain (including Exploration & Production, Processing, Transmission, Distribution and Marketing) and its related services. In a rapidly changing scenario, we are spearheading the move to a new era of clean fuel industrialisation, creating a quadrilateral of green energy corridors that connect major consumption centres in India with major gas fields, LNG terminals and other cross border gas sourcing points. GAIL is also expanding its business to become a player in the International Market.
Natural Gas value chain and beyond including Exploration, Production, Transmission, Marketing, Extraction, Processing, Distribution, utilisation including Petrochemicals and Power and Natural Gas related infrastructure, products and services.
Transmission Services - Natural Gas
183,084
25,081
27,335
29,900 3,819 5749
Natural Gas Trading
Transmission Services - Natural Gas
Petrochemicals
LPG & Liquid Hydrocarbons
Transmission Services - LPG
Gailtel
Others
Page 5
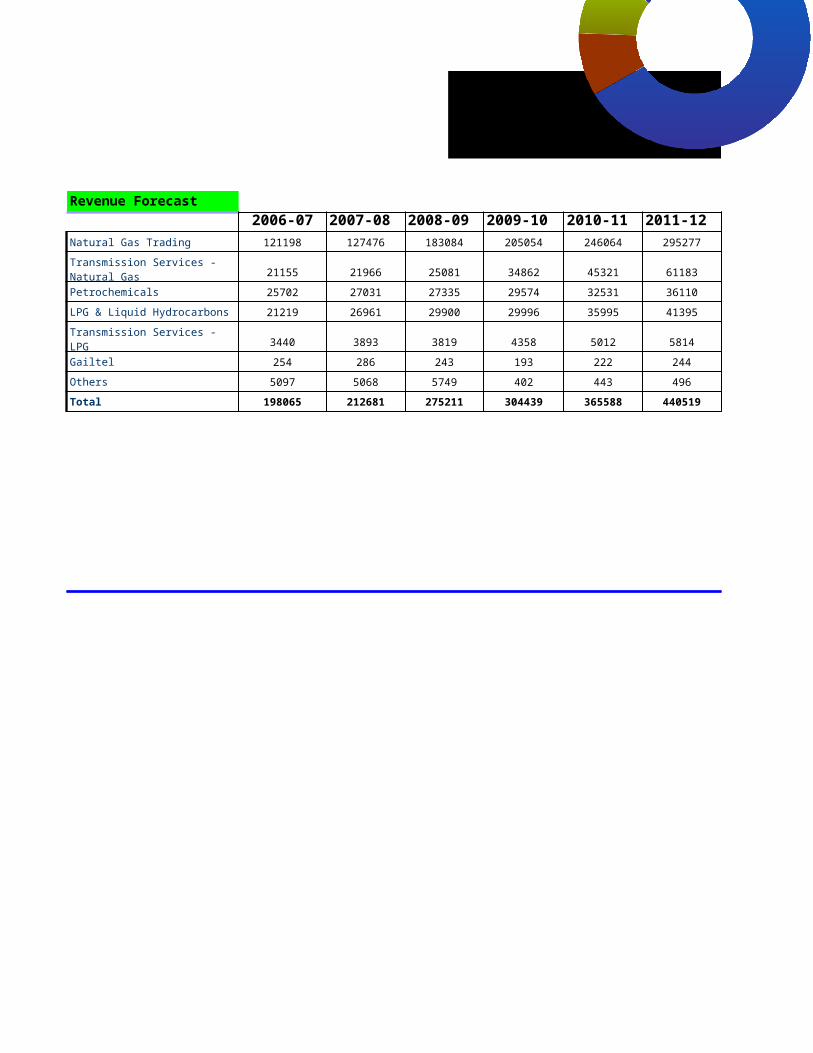
Revenue Forecast2006-07 2007-08 2008-09 2009-10 2010-11 2011-12
Natural Gas Trading 121198 127476 183084 205054 246064 295277
21155 21966 25081 34862 45321 61183Petrochemicals 25702 27031 27335 29574 32531 36110LPG & Liquid Hydrocarbons 21219 26961 29900 29996 35995 41395Transmission Services - LPG
3440 3893 3819 4358 5012 5814Gailtel 254 286 243 193 222 244Others 5097 5068 5749 402 443 496Total 198065 212681 275211 304439 365588 440519
Transmission Services - Natural Gas
183,084
25,081
27,335
29,900 3,819 5749
Natural Gas Trading
Transmission Services - Natural Gas
Petrochemicals
LPG & Liquid Hydrocarbons
Transmission Services - LPG
Gailtel
Others
Page 6
31MAR '13 31MAR '14
2012-13E 2013-14E
35.35 60.67
11% 13%
7% 9%
117.6 188.7
0.87 0.60
7.66 4.56
11.90 6.93
0.01% 0.0047%
GAIL (India) Limited, is India's flagship Natural Gas company, integrating all aspects of the Natural Gas value chain (including Exploration & Production, Processing, Transmission, Distribution and Marketing) and its related services. In a rapidly changing scenario, we are spearheading the move to a new era of clean fuel industrialisation, creating a quadrilateral of green energy corridors that connect major consumption centres in India with major gas fields, LNG terminals and other cross border gas sourcing points. GAIL is also expanding its business to become a player in the International Market.
Natural Gas value chain and beyond including Exploration, Production, Transmission, Marketing, Extraction, Processing, Distribution, utilisation including Petrochemicals and Power and Natural Gas related infrastructure, products and services.
183,084
25,081
27,335
29,900 3,819 5749
Natural Gas Trading
Transmission Services - Natural Gas
Petrochemicals
LPG & Liquid Hydrocarbons
Transmission Services - LPG
Gailtel
Others
Page 7
183,084
25,081
27,335
29,900 3,819 5749
Natural Gas Trading
Transmission Services - Natural Gas
Petrochemicals
LPG & Liquid Hydrocarbons
Transmission Services - LPG
Gailtel
Others
Page 9
GAIL (INDIA) LTD.Segment Revenue Model
(Figures in Rs. Millions.) 2006-07 2007-08
APR - JUN JUL - SEPT OCT - DEC JAN - MAR 31st MAR '07 APR - JUN
Q1 2006 Q2 2006 Q3 2006 Q4 2007 2006-07A Q1 2007
Segment RevenuesNatural Gas Trading 30,767 29,237 31,494 29,701 121,198 30,067Transmission Services - Natural Gas 5,009 4,972 6,413 4,762 21,155 4,895 Petrochemicals 5,503 5,456 7,306 7,437 25,702 7,784 LPG & Liquid Hydrocarbons 6,406 4,219 6,261 4,332 21,219 6,752 Transmission Services - LPG 715 816 994 915 3,440 923 Gailtel 51 63 71 69 254 67 Others 742 1,607 1,764 984 5,097 806 Total 49,192 46369 54,302 48,200 198,063 51,293Less: Inter Segment Revenue 6,519 6,513 7,279 6,844 27,155 6,452 Net sales/income from Operations 42,673 39,856 47,024 41,356 170,908 44,841
INCOME STATEMENT MODEL FY 2006-07
(Figures in Rs. Crores.) Q1 Q2 6M Q3 9M Q4
APR-JUN JUL-SEPT OCT-DEC JAN-MAR
Net Sales/ Income from Operation 473034 435830 908864 510622 1419486 388340
Total Expenditure 405447 347032 752479 412443 1164922 359317
(Increase) / Decrease In Stock In Trad 13288 -27170 -13882 -5883 -19765 28380
Consumption of Raw Materials 356206 329333 685539 361270 1046809 278947
Employees Cost 5513 9047 14560 6509 21069 8163
Other Expenditure 30440 35822 66262 50547 116809 43827
Consumption of Materials/Purchase 0 0 0 0 0
OPBDIT 67587 88798 156385 98179 254564 29023
OP Margin 14 20 17 19 18 7
Interest 2880 2912 5792 2705 8497 2211
Depreciation 14081 14357 28438 14387 42825 14713
PBT From Operations 50626 71529 122155 81087 203242 12099
Other Income 8006 16737 24743 18463 43206 11289
PBT & Exceptional Item 58632 88266 146898 99550 246448 23388
Exceptional Item 0 0 0 0 0 5540
Profit Before Tax 58632 88266 146898 99550 246448 28928
Current Tax -26000 13539 -12461 -21238 -33699 13466
Deferred Tax 0 0 0 0 0 0
Fringe Benefit Tax 0 0 0 0 0 0
Page 10
Profit After Tax 84632 74727 159359 120788 280147 15462
NET PROFIT 84632 74727 159359 120788 280147 15462
NO.OF EQUITY SHARES 8457 8457 8457 8457 8457 8457
EPS Basic 0.10 0.22 0.16 0.15 0.15 0.73
Other Selected Items and RatiosMAR '06 MAR '07 MAR '08 MAR '09 MAR '10 MAR '11
2005-06A 2006-07A 2007-08 A 2008-09 A2009-2010E 2010-11E
Cash and Bank balances 4496 2660 4473 3456 3501 3658CAPEX 1784 905 2256 2568 115 3401
Total Debt 1917 1338 1266 1200 1186 1172Inventory Turnover 3210 4060 4007 5063
Valuation Metrics
Gross Profit Margin(%) 18.68 21.93 17.01 17.88 13.50EBITDA Margin (%) 123% 128% 120% 122% 116%
Net Profit Margin (%) 14.87 14.45 11.75 9.44 8.22 Interest Cover 22.62 42.46 40.05 56.77 49.33
Page 11
2007-08 2008-09 2009-10
JUL - SEPT OCT - DEC JAN - MAR 31st MAR '07 APR - JUN JUL - SEPT OCT - DEC JAN - MAR 31st MAR '07 APR - JUN
Q2 2007 Q3 2007 Q4 2008 2007-08A Q1 2008 Q2 2008 Q3 2008 Q4 2009 2008-09A Q1 2009
32,487 31120.1 33,802 127,476 41192.8 44953.8 49507.4 47429.6 183084 46417 5,289 6,022 5,762 21,966 6,214 6,215 6,141 6511 25,081 7331.5 6,402 5,378 7,467 27,031 8,008 6,287 6,227 6,813 27,335 6,226 7,033 5,278 7,898 26,961 7,997 10,902 3,330 7,671 29,900 6,839 896 996 1,079 3,893 855 906 1,065 992 3,819 1,057
76 70 72 286 65 65 64 49 243 38 1,636 1,571 1,055 5,068 1,231 1,929 2,526 63 5,749 100
53,820 50435 57,133 212,681 65563.3 71258.8 68859.6 69529.6 275,211 68009
6,725 5,604 6,784 8,245 7,109 7,677 8,392 8,487 31,663 (7,795)
47,095 44,832 50,349 204,436 58,455 63,582 60,468 61,043 243,548 60,214
A FY 2007-08 A FY 2008-09
FY 2007 Q1 Q2 6M Q3 9M Q4 FY 2008 Q1 Q2
APR-JUN JUL-SEPT OCT-DEC JAN-MAR APR-JUN JUL-SEPT
1604718 424568 452890 877458 429833 1307291 493529 1800820 573071 617261
1304989 171663 365059 39178 342607 879329 377533 1405896 433128 482283
-7526 322 -563 -241 5466 5225 -8213 -2988 2858 -7349
1121412 129390 45029 174419 47246 221665 36070 1191550 49620 55114
29232 6876 8239 15115 9854 24969 22032 47001 8663 11802
161871 35075 58378 93453 38138 131591 38742 170333 39182 47979
0 235285 253976 253976 241903 495879 288902 0 332805 362240
299729 252905 87831 390655 87226 427962 115996 394924 139943 134978
19 60 19 91 20 33 24 22 24 22
10708 2040 2009 4049 1955 6004 1953 7957 1902 1890
57538 14070 14916 28986 13869 42855 14247 57102 14296 13858
231483 236795 70906 357620 71402 379103 99796 329865 123745 119230
54495 9127 18060 27187 18482 45669 9966 55635 11477 4333
285978 245922 88966 384807 89884 424772 109762 385500 135222 123563
0 0 0 0 0 0 0 0
285978 245922 88966 384807 89884 424772 109762 385500 135222 123563
47311 27547 29708 57255 24150 81405 43093 125354 44394 48928.00
0 514 1684 2198 3463 5661 -5760 0 999 -1156
0 -1404 320 -1084 139 -945 191 0 142 169
Page 12
238667 219265 57254 326438 62132 338651 72238 260146 89687 75622
238667 219265 57254 326438 62132 338651 72238 260146 89687 75622
8457 8457 8457 8457 8457 8457 8457 8457 8457 8457
0.23 0.04 0.32 0.08 0.30 0.13 0.14 0.21 0.13 0.06
MAR '12 MAR '13 MAR '14
2011-12E 2012-13E 2013-14E
3699 3734 38001246 25771154 1142 11366564 8803 12279
13.30 11.30 13.10115% 113% 115%
8.38 7.27 8.6179.99 117.58 188.74
Page 13
BSE Q RES
2009-10
JUL - SEPT OCT - DEC JAN - MAR 31st MAR '10 31st MAR '11 31st MAR '12 31st MAR '13 31st MAR '14
Q2 2009 Q3 2009 Q4 2010 2009-10E 2010-11E 2011-12E 2012-13E 2013-14E
49691 45274 63671 205054 246064 295277 369097 479825
8,430 8,528 10,573 34,862 45321 61183 82597 113984 6,157 7,927 9,265 29,574 32531 36110 40443 46105 5,151 7,103 10,904 29,996 35995 41395 49674 60602 1,029 1,161 1,111 4358 5012 5814 6860 8232
34 29 93 193 222 244 273 309
142 137 23 402 443 496 555 633
70634 70158 95,638.13 304439 365588 440519 549499 709690
(8,612) (8,279) 35,175 10,489 26223 62935 151043 370055
62,022 61,878 60,463 293,950 339,365 377584 398456 339635
FY 2008-09 A FY 2009-10
6M Q3 9M Q4 FY 2009 Q1 Q2 6M Q3
OCT-DEC JAN-MAR APR-JUN JUL-SEPT OCT-DEC
1190332 581602 1771934 623395 2377595 604133 622434 1226567 620571
915411 554568 1469979 519212 1973164 495592 518488 1014080 493520
-4491 6256 1765 2265 500 3839 1354 5193 849
104734 52395 157129 55702 212831 51644 58766 110410 55557
20465 32256 52721 4946 57667 13201 12685 25886 25387
99658 46490 146148 60476 194127 48476 44481 92957 40451
695045 417171 1112216 395823 1508039 378432 401202 779634 371276
274921 27034 301955 104183 404431 108541 103946 212487 127051
23 5 17 17 17 18 17 17 20
3792 1851 5643 3057 8700 1792 1785 3577 1422
28154 13739 41893 14098 55991 14041 14162 28203 14091
242975 11444 254419 87028 339740 92708 87999 180707 111538
15810 437 16247 12964 79662 1991 2216 4207 1787
258785 11881 270666 99992 419402 94699 90215 184914 113325
0 0 0 0.00 0.00 0.00
258785 11881 270666 99992 419402 94699 90215 184914 113325
93322 7561 100883 37752 140032 33982 30940 64922 37111
-157 1372 1215 591 0 -865 412 -453 2720
311 254 565 208 0 0 0
Page 14
165309 2694 168003 61441 279370 61582 58863 120445 73494
165309 2694 168003 61441 279370 61582 58863 120445 73494
8457 12685 12685 12685 12685 12685 12685 12685 12685
0.10 0.16 0.10 0.21 0.29 0.03 0.04 0.03 0.02
Page 15
FY 2009-10 E FY 2010-11 EFY 2011-12 EFY 2012-13 EFY 2013-14 E
9M Q4 FY 2010
JAN-MAR
1847138 625000 2472138 3263222 4405350 6167490 8942860
1507600 522430 2030030 2822687 3819437 5470563 7771344
6042 1000.00 7042.00 48948 74891 104847 169914
165967 56280.00 222247.00 293690 396481 555074 804857
51273 40150 91423 195793 308374 431724 626000
133408 50000 183408 261058 396481 555074 804857
1150910 375000 1525910 2023198 2643210 3823844 5365716
339538 102570 442108 440535 585913 696927 1171516
18 16 18 14 13 11 13
4999 1790 6789 7765 6594 5423 5889
42294 14397 56691 57516 58466 59266 60050
292245 86383 378628 375254 520853 632238 1105577
5994 2000.00 7994.00 25000 30000 37000 43000
298239 88383 386622 400254 550853 669238 1148577
0 0 0 0 0
298239 88383 386622 400254 550853 669238 1148577
102033 46236 148269 132084 181781 220849 379030
2267 2720 4987 0 0 0 0
0 0.00 0 0 0 0
APR 1,2010-
MAR 31,2011
APR 1,2011-MAR
31,2012
APR 1,2012-
MAR 31,2013
APR 1,2013-MAR
31,2014
Page 16
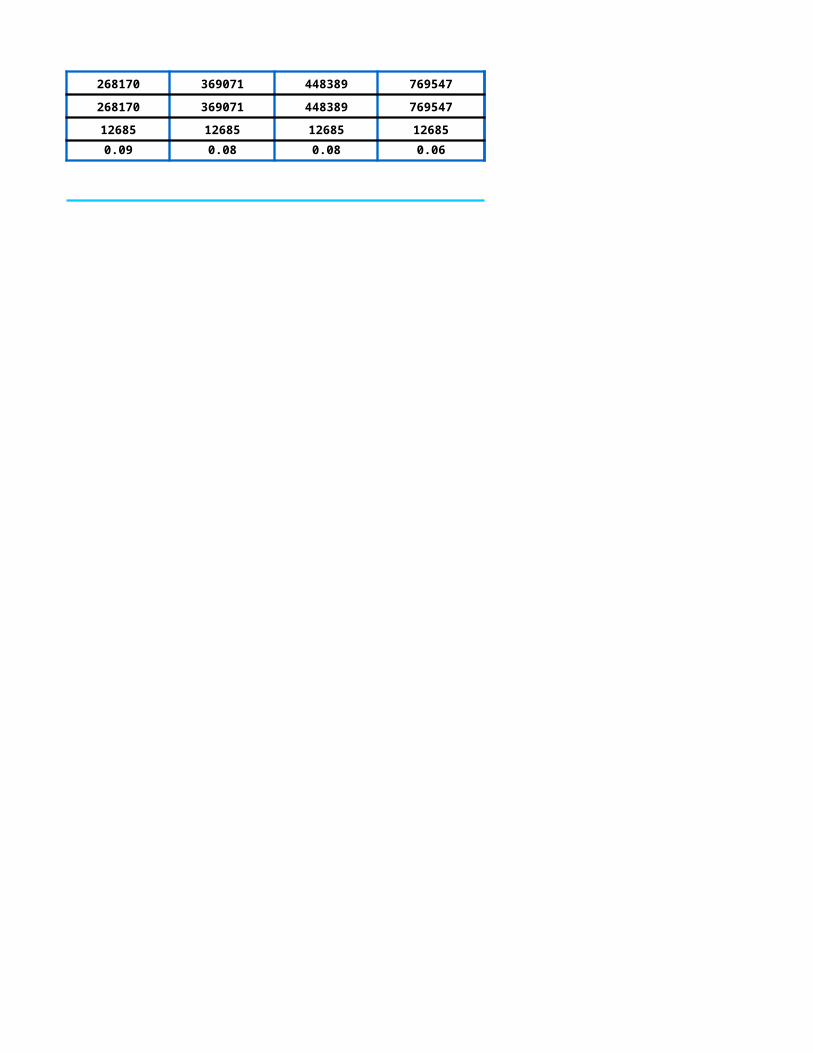
193939 39427 233366 268170 369071 448389 769547
193939 39427 233366 268170 369071 448389 769547
12685 12685 12685 12685 12685 12685 12685
0.03 0.05 0.03 0.09 0.08 0.08 0.06
Page 17
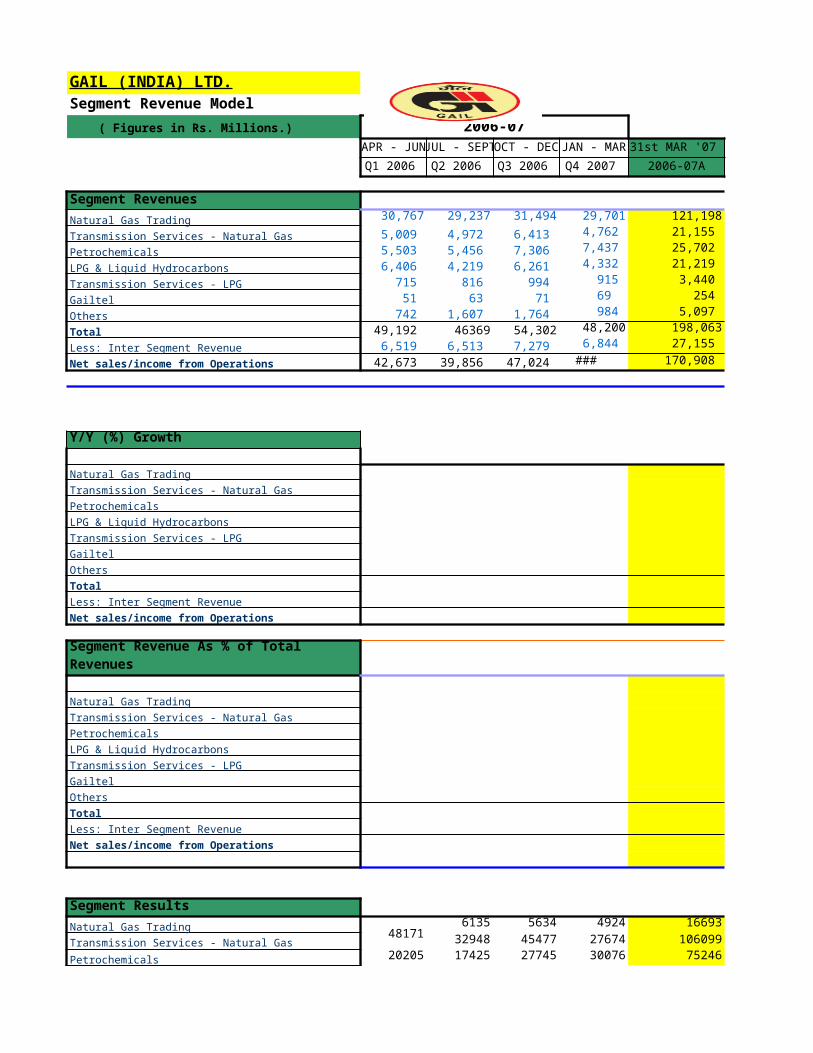
GAIL (INDIA) LTD.Segment Revenue Model
( Figures in Rs. Millions.) 2006-07 2007-08APR - JUN JUL - SEPT OCT - DEC JAN - MAR 31st MAR '07 APR - JUN JUL - SEPT
Q1 2006 Q2 2006 Q3 2006 Q4 2007 2006-07A Q1 2007 Q2 2007
Segment RevenuesNatural Gas Trading 30,767 29,237 31,494 29,701 121,198 30,067 32,487Transmission Services - Natural Gas 5,009 4,972 6,413 4,762 21,155 4,895 5,289 Petrochemicals 5,503 5,456 7,306 7,437 25,702 7,784 6,402 LPG & Liquid Hydrocarbons 6,406 4,219 6,261 4,332 21,219 6,752 7,033 Transmission Services - LPG 715 816 994 915 3,440 923 896 Gailtel 51 63 71 69 254 67 76 Others 742 1,607 1,764 984 5,097 806 1,636 Total 49,192 46369 54,302 48,200 198,063 51,293 53,820Less: Inter Segment Revenue 6,519 6,513 7,279 6,844 27,155 6,452 6,725 Net sales/income from Operations 42,673 39,856 47,024 41,356 170,908 44,841 47,095
Y/Y (%) Growth
Natural Gas Trading -2.27% 11.12%Transmission Services - Natural Gas -2.27% 6.37%Petrochemicals 41.45% 17.35%LPG & Liquid Hydrocarbons 5.39% 66.70%Transmission Services - LPG 29.04% 9.80%Gailtel 32.09% 21.85%Others 8.61% 1.81%Total 4.27% 16.07%Less: Inter Segment Revenue -1.03% 3.25%Net sales/income from Operations 5.08% 18.16%
Segment Revenue As % of Total Revenues
Natural Gas Trading 67.05% 68.98%Transmission Services - Natural Gas 10.92% 11.23%Petrochemicals 17.36% 13.59%LPG & Liquid Hydrocarbons 15.06% 14.93%Transmission Services - LPG 2.06% 1.90%Gailtel 0.15% 0.16%Others 1.80% 3.47%Total 114.39% 114.28%Less: Inter Segment Revenue 14.39% 14.28%Net sales/income from Operations 100.00% 100.00%
Segment ResultsNatural Gas Trading 48171
6135 5634 4924 1669339304 46584
Transmission Services - Natural Gas 32948 45477 27674 106099Petrochemicals 20205 17425 27745 30076 75246 34305 31953
B51
Amount includes , Both 'Natural Gas Trading' & 'Transmission Services - Natural Gas'.
G51
Amount includes , Both 'Natural Gas Trading' & 'Transmission Services - Natural Gas'.
H51
Amount includes , Both 'Natural Gas Trading' & 'Transmission Services - Natural Gas'.
Page 18
LPG & Liquid Hydrocarbons 13940 -5454 9048 -7319 -3725 19855 22338Transmission Services - LPG 3681 4490 6026 4866 15382 5450 5212Gailtel -3 41 5 54 100 51 138Others 0 0 0 0 0 0 -15250Total 85994 55585 93935 60275 209795 59661 90975Interest 2880 2912 2705 2211 10708 2040 2009
-2094 -5706 3446 3457 -897 37 0Total Profit Before Tax 85208 58379 87784 54607 199984 57584 88966
CAPITAL EMPLOYEDNatural Gas Trading 314687 0 356823 0 671510 457797 520280
Petrochemicals 194855 193493 190702 191284 770334 182821 183124
LPG & Liquid Hydrocarbons 113110 100718 102180 89700 405708 101411 108037
Transmission Services - Natural Gas 0 348145 0 370113 718258 0 0
Others 0 0 0 0 0 0 385851
Transmission Services - LPG 109001 107365 106716 105095 428177 102776 101090
Gailtel 3055 3078 2934 4745 13812 4427 4335
Total 734708 752799 759355 760937 3007799 849232 1302717
Other Unallocable Items 0 0 0 0 0 0 0
Total 734708 752799 759355 760937 3007799 849232 1302717
Other un-allocable expenditure net off un-allocable income
B65
Amount includes , Natural Gas Trading + Natural Gas Transmission , values together. Therefore Transmission Services-Natural Gas is shown as "0".
G65
Amount includes , Natural Gas Trading + Natural Gas Transmission , values together. Therefore Transmission Services-Natural Gas is shown as "0".
H65
Amount includes , Natural Gas Trading + Natural Gas Transmission , values together. Therefore Transmission Services-Natural Gas is shown as "0".
Page 19
BSE BSE BSE BSE BSE
2007-08 2008-09 2009-10OCT - DEC JAN - MAR 31st MAR '07 APR - JUN JUL - SEPT OCT - DEC JAN - MAR31st MAR '07 APR - JUN JUL - SEPT
Q3 2007 Q4 2008 2007-08A Q1 2008 Q2 2008 Q3 2008 Q4 2009 2008-09A Q1 2009 Q2 2009
31120.1 33,802 127,476 41192.8 44953.8 49507.4 47429.6 183084 46417 49691 6,022 5,762 21,966 6,214 6,215 6,141 6511 25,081 7331.5 8,430 5,378 7,467 27,031 8,008 6,287 6,227 6,813 27,335 6,226 6,157 5,278 7,898 26,961 7,997 10,902 3,330 7,671 29,900 6,839 5,151 996 1,079 3,893 855 906 1,065 992 3,819 1,057 1,029
70 72 286 65 65 64 49 243 38 34 1,571 1,055 5,068 1,231 1,929 2,526 63 5,749 100 142
50435 57,133 212,681 65563.3 71258.8 68859.6 69529.6 275,211 68009 70634 5,604 6,784 8,245 7,109 7,677 8,392 8,487 31,663 (7,795) (8,612)
44,832 50,349 204,436 58,455 63,582 60,468 61,043 243,548 60,214 62,022
-1.19% 13.81% 5.18% 37.00% 38.38% 59.08% 40.32% 43.62% 12.68% 10.54%-6.10% 20.99% 3.84% 26.95% 17.52% 1.98% 13.01% 14.18% 17.99% 35.63%
-26.39% 0.40% 5.17% 2.88% -1.79% 15.78% -8.75% 1.12% -22.26% -2.08%-15.70% 82.31% 27.06% 18.45% 55.01% -36.91% -2.87% 10.90% -14.48% -52.75%
0.18% 17.93% 13.18% -7.27% 1.10% 6.97% -8.03% -1.91% 23.60% 13.62%-0.57% 3.31% 12.58% -2.68% -14.40% -9.67% -31.52% -14.78% -42.11% -47.71%
-10.93% 7.20% -0.57% 52.74% 17.92% 60.76% -94.05% 13.44% -91.84% -92.63%-7.12% 18.53% 7.38% 27.82% 32.40% 36.53% 21.70% 29.40% 3.73% -0.88%
-23.01% -0.88% -69.64% 10.17% 14.16% 49.75% 25.10% 284.03% -209.65% -212.18%-4.66% 21.75% 19.62% 30.36% 35.01% 34.88% 21.24% 19.13% 3.01% -2.45%
69.42% 67.13% 62.35% 70.47% 70.70% 81.87% 77.70% 75.17% 77.09% 80.12%13.43% 11.44% 10.74% 10.63% 9.77% 10.16% 10.67% 10.30% 12.18% 13.59%12.00% 14.83% 13.22% 13.70% 9.89% 10.30% 11.16% 11.22% 10.34% 9.93%11.77% 15.69% 13.19% 13.68% 17.15% 5.51% 12.57% 12.28% 11.36% 8.30%
2.22% 2.14% 1.90% 1.46% 1.42% 1.76% 1.63% 1.57% 1.76% 1.66%0.16% 0.14% 0.14% 0.11% 0.10% 0.11% 0.08% 0.10% 0.06% 0.06%3.51% 2.09% 2.48% 2.11% 3.03% 4.18% 0.10% 2.36% 0.17% 0.23%
112.50% 113.47% 104.03% 112.16% 112.07% 113.88% 113.90% 113.00% 112.94% 113.89%12.50% 13.47% 4.03% 12.16% 12.07% 13.88% 13.90% 13.00% -12.94% -13.89%
100.00% 100.00% 100.00% 100.00% 100.00% 100.00% 100.00% 100.00% 100.00% 100.00%
402.3 6915134898.3
947.5 1113.4 823.1 592 3476 1062.6 1104.74141 37552 4337 3952.7 3590.7 4342.3 16222.7 5221.8 6156.9
2288.2 36283 104829.2 4395.1 3287.7 1296.5 3275 12254.3 2643.2 2753.2
Page 20
1252 35330 78775 3178.2 5751 -2473 2239.7 8695.9 1500 -731.1564.5 6877 18103.5 467.5 539.4 615 639.5 2261.4 682.4 589.2
8.2 40 237.2 12.7 -46 9 -16.9 -41.2 -10.8 -21.4527.7 -11282 -26004.3 374.4 619.4 -223.9 -1649.7 -879.8 -1169.9 -280.1
9183.9 111715 310838.9 13712.4 15217.6 3637.4 9421.9 41989.3 9929.3 9571.4-195.5 1953 5806.5 -190.2 -189 -185.1 -305.7 -870 -179.2 -178.5
0 0 37 0 0 0 920.9 920.9 120 874.68988.4 109762 265300.4 -190.2 15028.6 3452.3 10037.1 42040.2 9630.1 8518.3
0 0 978077 0 0 60216.6 67949 128165.6 0 020330.5 200207 586482.5 18856.4 19512.3 18433.1 19918.3 76720.1 18737.9 18359.4
9357.1 103522 322327.1 11581 11593.5 7791.2 12155.6 43121.3 10886.3 7302.752394.8 541615 594009.8 56944.6 57307.7 0 0 114252.3 61582.8 66150.5
0 380383 766234 67516.8 76518.4 81004.4 -1042.3 223997.3 -938.9 -792.89966.6 98831 312663.6 9526.5 9510.3 9408.8 9526.3 37971.9 8934.1 8935.2
406.9 3732 12900.9 358.7 279 301.3 301.7 1240.7 259 238.292455.9 1328290 3572694.9 164784 174721.2 177155.4 108808.6 625469.2 99461.2 100193.241099.5 0 41099.5 0 0 0 64148.3 64148.3 79778.5 87698.3
133555.4 1328290 3613794.4 164784 174721.2 177155.4 172956.9 689617.5 179239.7 187891.5
Page 21
BSE Q RES
2009-10OCT - DEC JAN - MAR 31st MAR '10 31st MAR '11 31st MAR '11 31st MAR '11 31st MAR '11
Q3 2009 Q4 2010 2009-10E 2010-11E 2011-12E 2012-13E 2013-14E
45274 63671 205054 246064 295277 369097 479825 8,528 10,573 34862 45321 61183 82597 113984 7,927 9,265 29,574 32531 36110 40443 46105 7,103 10,904 29,996 35995 41395 49674 60602 1,161 1,111 4358 5012 5814 6860 8232
29 92 193 222 244 273 309 137 23 402 443 496 555 633
70158 95,639.09 304440 365589 440534 549500 709691 (8,279) 35,175 10,489 26223 62935 151043 370055
61,878 60,464 293,950 339,366 377600 398457 339635
-8.55% 34.24% 12.00% 20.00% 20.00% 25.00% 30.00%38.87% 62.39% 39.00% 30.00% 35.00% 35.00% 38.00%27.31% 35.98% 8.19% 10.00% 11.00% 12.00% 14.00%
113.30% 42.13% 0.32% 20.00% 15.00% 20.00% 22.00%8.99% 11.96% 14.12% 15.00% 16.00% 18.00% 20.00%
-55.12% 88.26% -20.70% 15.00% 10.00% 12.00% 13.00%-94.58% -63.12% -93.00% 10.00% 12.00% 12.00% 14.00%
1.89% 37.55% 2.45% 11.00% 20.50% 24.74% 29.15%-198.66% 314.48% 90.00% 150.00% 140.00% 140.00% 145.00%
2.33% -0.95% 20.70% 15.45% 11.27% 5.52% -14.76%
73.17% 105.30% 69.76% 72.51% 78.20% 92.63% 141.28%13.78% 17.49% 11.86% 13.35% 16.20% 20.73% 33.56%12.81% 15.32% 10.06% 9.59% 9.56% 10.15% 13.57%11.48% 18.03% 10.20% 10.61% 10.96% 12.47% 17.84%
1.88% 1.84% 1.48% 1.54% 1.72% 2.42%0.05% 0.15% 0.07% 0.07% 0.06% 0.07% 0.09%0.22% 0.04% 0.14% 0.13% 0.13% 0.14% 0.19%
113.38% 158.18% 103.57% 107.73% 116.67% 137.91% 208.96%-13.38% 58.18% 3.57% 7.73% 16.67% 37.91% 108.96%100.00% 100.00% 100.00% 100.00% 100.00% 100.00% 100.00%
1179.2 1,286.70 4633.2 5104 5673 6123 67005924.2 6,824.20 24127.1 27754 30124 33125 360553413.8 4,415.80 13226 15346 17683 19986 23441
Page 22
1251.9 2,051.90 4072.7 6526 8588 9989 11230638.5 733.5 2643.6 3000 3456 3887 4200-39.4 -40 -111.6 -265 -230 -254 -109
-109.5 -100 -1659.5 100 380 -215 -10412258.7 15,172 46931.5 57565 65674 72641 81413
-142.2 -125 -624.9 -500 -534 -676 555
436.1 500 1930.7 1267 1568 1838 205012552.6 15,547 48237.3 58332 66708 73803 84018
17144.8 19887 37031.89274.3 10,987.00 57358.6
176.2 6,785.00 25150.266245 67,543.00 261521.3
94070.9 77755 170094.28507.4 8,655.00 35031.7-860.7 250 -113.5
194557.9 191,862.00 586074.30 0.00 167476.8
194557.9 191,862.00 753551.1 763900 163850 148640 458000
Page 23
GAIL (INDIA) LTD.
INCOME STATEMENT
(Figures in Rs. Crores.)
Net Sales/ Income from Operation
% full year
% growth y-o-y
% growth q-o-q
Total Expenditure
(Increase) / Decrease In Stock In Trad
% of Revenue
Consumption of Raw Materials
% of Revenue
Employees Cost
% of Revenue
Other Expenditure
% of Revenue
Consumption of Materials/Purchase
% of Revenue
OPBDIT
% full year (OR) %Y-o-Y
% growth y-o-y
% growth q-o-q
OP Margin
Interest
Depreciation
PBT From Operations
Other Income
PBT & Exceptional Item
Exceptional Item
Profit Before Tax
Current Tax
Deferred Tax
Fringe Benefit Tax
Eff tax rate - non deferred
Eff tax rate (%)
Profit After Tax
Prior Period Items
Extraordinary Items
Net Profit
% full year
% growth y-o-y
% growth q-o-q
PAT(% of Sales)
Equity
No of Equity shares
EPS Basic
Page 24
GAIL INDIA LTD.
CASH FLOW STATEMENT
(in Rs.crores)
CASH FLOW STATEMENT31st MAR '07
2006-07A 2007-08 A 2008-09 A 2009-2010E
Particulars
PBT 285978 385500 419402 386622
Tax - non deferred 47311 125354 140032 143282
PAT 238667 260146 279370 243340
Depreciation 57538 57102 55991 56691
Operating Cash Flow 296205 317248 335361 300031
Capex 1784 905 2256 2568
Net cash Flow 294421 316343 333105 297462
Cash Flow / Share 5171 3704 3919 3500
Dividend/dividend tax 0 0 0 0
Increase in equity capital 0 0 423 0
Inc/(Dec) in Investments 513 0 -4 103
Inc/Dec in Net Working Capital 1455 -656 749 1700
Inc/Dec in loan funds -579 -72 -66 -14
Opening cash balance 4496 2260 4473 3456
Total cash flow 291873 314960 334253 296596
Closing cash balance 2660 4473 3456 300052
31st MAR '08 31st MAR '09 31st MAR '10
Page 25
2010-11E 2011-12E 2012-13E 2013-14E
550852 669237 1148576 0
181781 220848 379030 0
369071 448389 769546 0
57516 58466 59266 60050
426587 506855 828812 60050
115 3401 1246 2577
426472 503454 827565 57473
0 0 0 0
82 65 56 84
719 -2765 452 -1093
-14 -18 -13 -6
3500.76 3657.75 3699 3734
424676 502652 830262 56931
428176 506309 833961 60665
31st MAR '11 31st MAR '12 31st MAR '13 31st MAR '14
Page 26
GAIL INDIA LTD.BALANCESHEET
(in Rs.crores)
BALANCESHEET 31st MAR '06 31st MAR '07
2005-06A 2006-07A 2007-08 A 2008-09 A
SOURCES OF FUNDSShareholder's funds 9973.3 11392.91 13004.88 14769.63
845.65 845.65 845.65 1268.48
Reserves and Surplus: 9127.65 10547.26 12159.23 13501.15
Capital Reserve 2.1 1.98 1.86 1.74
Share Premium Account 0.27 0.27 0.27 0.27
Investment Allowance Reserve 251.31 215.1 146.48 19.11
Bonds Redemption Reserve 96.38 128.51 160.64 192.77
Foreign Currency Translation Reserve -2.33 0 0 0
General Reserve 1409.49 1684.37 2013.14 1997.68
Profit and Loss A ccount 7370.43 8517.03 9836.84 11289.58
Loan Funds 1916.56 1337.85 1265.87 1200.13
Secured Loans 1600 1100 1100 1100
Unsecured Loans 316.56 237.85 165.87 100.13
Deferred Tax Liability (Net) 1299.7 1318.67 1319.69 1325.93
TOTAL 13189.56 14049.43 15590.44 17295.69
APPLICATION OF FUNDS
Fixed Assets 8171.55 9391.31 9749.95 11476.65
Gross Block 14469.48 14932.56 16957.86 17603.98
Less: Depreciation 6913.52 7478.19 8024.57 8553.66
NET BLOCK 7555.96 7454.37 8933.29 9050.32
Capital Work -in- Progress 615.59 1936.94 816.66 2426.33
Investments 927.57 1441.05 1441.09 1437.52
Advances For Investment (Pending Allotment) 515.79 22.79 49.79 299.75
Current Assets, Loans and Advances
12288.64 7745.51 10410.02 12236.54
Inventories 483.19 552.36 569.81 601.41
Sundry Debtors 753.47 790.71 1073.54 1503.34
Cash and Bank balances 4495.94 2660.41 4472.99 3456.15
Other Current Assets 39.65 31.67 56.82 54.63
Loans and Advances 6516.39 3710.36 4236.86 6621.01
Less: Current Liabilities and Provisions
8713.99 4551.23 6059.28 8153.52
Current Liabilities: 3164.62 2585.59 3359.89 4176.67
Sundry Creditors 1520.24 1448.36 1797.75 1972.49
31st MAR '08 31st MAR '09
Capital:Issued, Subscribed & Paid-up.
Page 27
123.91 308.14 185.38 212.28
Other Liabilities 762.93 726.25 637.5 452.93
Gas Pool Money 726.67 71.49 710.6 1512.25
Unclaimed Dividend 1.96 2.83 2.23 2.88
Interest Accrued But not due 28.91 28.52 26.43 23.84
Provisions: 5549.37 1965.64 2699.39 3976.85
Provision for Taxation(FBT) 5316.15 1716.12 2018.64 3390.53
Provision for Proposed dividend 169.13 169.13 507.39 380.54
Provision for Corporate Dividend Tax 23.72 28.74 86.23 64.67
40.37 51.65 87.13 141.11
Net current Assets 3574.65 3194.28 4350.74 4083.02
TOTAL 13189.56 14049.43 15591.57 17296.94
Deposits/Retention Money from Contractors and Others
Provision for Leave Encashment & Post Retirement Medical Benefits
Page 28
2009-2010E 2010-11E 2011-12E 2012-13E 2013-14E
16571.75 18423.86 20301.02 22203.16 24155.29
1268.48 1268.48 1268.48 1268.48 1268.48
15303.27 17155.38 19032.54 20934.68 22886.81
1.7 1.65 1.65 1.63 1.6
0.27 0.27 0.27 0.27 0.27
19.11 19.11 19.11 19.11 19.11
192.77 192.77 192.77 192.77 192.77
0 0 0 0 0
2347.68 2747.68 3172.68 3622.68 4122.68
12741.74 14193.9 15646.06 17098.22 18550.38
1186.33 1172.34 1154.36 1141.82 1136.24
1100 1100 1100 1100 1100
86.33 72.34 54.36 41.82 36.24
1327.87 1333.54 1341.86 1351.67 1363.51
19085.95 20929.74 22797.24 24696.65 26655.04
13535.77 13157.92 16073.08 16853.66 18982.47
18850.98 19850.77 20977.16 21301.43 22623.13
9062.89 9555.53 10041.85 10507.54 10955.43
9788.09 10295.24 10935.31 10793.89 11667.7
3747.68 2862.68 5137.77 6059.77 7314.77
1540.88 1623.35 1688.45 1744.54 1828.77
50.8 235.98 435 33.45 480
12456.66 12135.32 11435.87 12345.34 12675.57
632.45 656.67 685.55 715.65 740.99
1828.76 2135.56 2465 2667.78 2989.97
3500.76 3657.75 3699 3734 3800
58.87 61.98 64.65 66.67 68.88
6435.82 5623.36 4521.67 5161.24 5075.73
6629.29 5432.23 7456.68 7878.78 9235.53
0 0 0 0 0
31st MAR '10 31st MAR '11 31st MAR '12 31st MAR '13 31st MAR '14
F43
The Figures here are total of Current Liabilities & Provisions.
Page 29
4009.3 6148.47 5035.71 4829.97 4575.32
19136.75 21165.72 23232.24 23461.62 25866.56
Page 30
GAIL (INDIA) LTD.DEBT SCHEDULE FY 2006-07 A FY 2008 A FY 2009 A FY 2010 E(Figures in Rs. Millions.)
SECURED LOANS
BOND SERIES-I
6.10% Non-Convertible Redeemable Bonds 5000 5000 5000 5000
BOND SERIES-II
5.85% Secure Non-Convertible Redeemable Bond 6000 6000 6000 6000
Total 11000 11000 11000 11000
UNSECURED LOANS
OTHER LOANS & ADVANCES
From Banks:
State Bank Of India, London 62 0 0 0
From Others:
Oil Industry Development Board 2316 1659 1001.30 86
Total 2379 1659 1001 86
TOTAL DEBT 13379 12659 12001 11086
Page 31
A50
psec: balancing figure
Page 32
FY 2011 E FY 2012 E FY 2013 E FY 2014 E
5000 5000 5000 5000
6000 6000 6000 6000
11000 11000 11000 11000
0 0 0 0
72.34 54.36 41.82 36.24
72 54 42 36
11072 11054 11042 11036
Page 33
GAIL INDIA LTD.Valuation
(in Rs. Crores)
Growth Assumptions Enterpsire Value (EV)Long term World GDP growth rate 3%
Current Market PriceDiluted Shares 12,685
CAPM Assumptions Market Capitalisation 5335861Ke 12.3% Long Term Liabilities 1,200.1 RFR 4% Less: Cash & Cash Equivalents 3,456.2 Beta 1.4 Net Debt 4,656.3 Rp 6% Enterprise Value (EV) 5340517
Calculation of Free Cash Flow
Explicit Forecast Period First Stage of Valuation 2009A 2010E 2011E 2012E 2013E 2014E
Revenues 2,377,595 2,472,138 3,263,222 4,405,350 6,167,490 8,942,860 EBITDA 404,431 442,108 440,535 585,912 696,926 1,171,515 EBIT 348,440 385,417 383,019 527,446 637,660 1,111,465 Tax Expense 140,032 148,269 132,084 181,781 220,848 379,030
Net Operating Profit After Tax 208,408 237,148 250,935 345,665 416,812 732,435 Depreciation & Amortisation 55,991 56,691 57,516 58,466 59,266 60,050 Working Capital Change 749 1,700 719 (2,765) 452 (1,093)
Operating Cash Flow 263,650 292,139 307,732 406,896 475,626 793,577 Capex 2,256 2,568 115 3,401 1,246 2,577
FCF 265,906 294,707 307,847 410,297 476,872 796,154
Diluted Shares 12,685 12,685 12,685 12,685 12,685 12,685
Projection Year 1 2 3 4 5 Discount Factor 0.89 0.79 0.71 0.63 0.56 Present Value of FCF 262,757 244,715 290,795 301,337 448,550
Y/Y Growth AnalysisRevenues 4% 32% 35% 29% 23%EBITDA 9% 0% 33% 19% 68%EBIT 11% -1% 38% 21% 74%Depreciation & Amortisation 1% 1% 2% 1% 1%
Margin Analysis (As % of Revenues)EBITA Margin 17% 18% 13% 13%EBIT Margin 15% 16% 12% 12% 12% 12%Depreciation & Amortisation 2% 2% 2% 1% 1% 1%Capex -0.095% -0.104% -0.004% -0.077% -0.077% -0.077%
Tax Rate (Tax Expense/EBIT) 40% 38% 34% 34% 34% 34%
Terminal Value Calculated Equity ValueSum of PV of FCF for explicit forecast 2,985,837 Enterprise Value 7,875,414 WACC 12% - Debt (1,200)Long term growth in EBIT 3% + Cash (3,456)Present Value of terminal value 4,889,578 Net Debt (4,656)Terminal Value as % of Total Value 62% Equity Value 7,870,758
रु 420.65
B12
Hp: Value taken from finance.yahoo.com
Page 34
Sensitivity - Varying Terminal Growth Rate
PV of Terminal ValueWACC PV of FCF 4,889,578 2% 3% 3%10.0% 3,297,538 10.0% 92,943 99,770 107,573 11.0% 3,147,900 11.0% 76,846 81,885 87,553 12.2% 2,985,837 12.2% 62,204 65,827 69,843 13.0% 2,875,574 13.0% 54,504 57,463 60,718 14.0% 2,751,593 14.0% 46,562 48,895 51,441
Sensitivity - EV/EBITDA Exit Multiple
PV of Terminal Value (EV/EBITDA)WACC PV of FCF 5.0 5.5 6.010.0% 3,297,538 3,963,104 4,359,414 4,755,725 11.0% 3,147,900 3,686,321 4,054,953 4,423,585 12.2% 2,985,837 3,392,180 3,731,398 4,070,616 13.0% 2,875,574 3,195,578 3,515,135 3,834,693 14.0% 2,751,593 2,978,092 3,275,901 3,573,711
Page 35
Debt Equity WeightageE/(D+E) @ Enterprise Value 99.91%D/(D+E) @ Enterprise Value 0.1%
Interest Rate (%) 6%Tax Rate (%) 33
WACC CalculationWACC 12%
First Stage of Valuation 2015E 2016E 2017E Terminal Year
10,516,803 11,757,786 12,463,253 12,774,835 1,398,735 1,563,786 1,657,613 1,699,053 1,259,160 1,407,741 1,492,206 1,529,511 433,962 485,170 514,280 527,137 825,198 922,571 977,926 1,002,374 139,575 156,045 165,407 169,542 (1,093) (1,093) (1,093) (1,093) 965,865 1,079,708 1,144,425 1,173,009 8,120 9,078 9,623 9,864 973,986 1,088,787 1,154,049 1,182,872
12,685 12,685 12,685 12,685
6 7 8 0.50 0.45 0.40 489,248 487,621 460,814
18% 12% 6% 3%19% 12% 6% 3%13% 12% 6% 3%
132% 12% 6% 2%
12% 12% 12% 12%1% 1% 1% 1%
-0.077% -0.077% -0.077% -0.077%
34% 34% 34% 34%
Intrinsic ValueEquity Value 7,870,758 Diluted Shares 12,685
Intrinsic Value $620.49
Second Stage of Valuation
Page 36
Intrinsic Value2% 3% 3%
266.92 267.46 268.07 253.85 254.25 254.70 239.92 240.21 240.53 230.62 230.86 231.11 220.22 220.41 220.61
Intrinsic Value5 5.5 6
572.02 603.26 634.51 538.41 567.47 596.53 502.44 529.18 555.92 478.25 503.44 528.63 451.33 474.81 498.29
Page 37
GAIL INDIA LTD.RATIO ANALYSIS
(in Rs.crores)
RATIOS31st MAR '06 31st MAR '07
2005-06A 2006-07A 2007-08 A 2008-09 A 2009-2010E
GEARING % 24.4 18.9 16.6 14.6 13.2DEBT EQUITY 0.19 0.12 0.10 0.08 0.07CURRENT RATIO 1.41 1.70 1.72 1.50 1.88
ASSET TURNOVER 91.37 94.1 112.01 98.84RONW(%) 20.95 20.00 18.92 14.08
ROCE(%) 21.78 16.13 15.41 12.55OPM(%) 18.68 21.93 17.01 17.88NPM(%) 14.87 14.45 11.75 9.44Effective Interest Rate 3.29 3.06 3.53 2.84Effective Tax Rate(%) 0.17 0.33 0.33 0.40Cash/Net Assets 55.02% 28.33% 45.88% 30.11% 25.86%Other Income/PBT 19.06% 14.43% 18.99% 2.07%Interest Coverage 22.62 42.46 40.05 56.77Growth in Gross Block 0.03 0.14 0.04 0.07Sales Growth 0.122 0.32 0.04Operating Profit Growth 0.32 0.02 0.09Inventory Turnover 3209.53 4060.03 4007.16Net Current Assets/Sales 0.20% 0.24% 0.17% 0.16%Tax Rate Non-Deferred 17% 33% 33% 38%
PBT From Operations Growth 0.35 0.09 -0.08
EPS Growth 28.22 30.76 22.02 18.40
31st MAR '08 31st MAR '09 31st MAR '10
Page 38
2010-11E 2011-12E 2012-13E 2013-14E
12.0 10.9 10.1 9.40.06 0.06 0.05 0.052.23 1.53 1.57 1.37
122.25 150.71 187.31 249.5514.56 18.18 20.19 31.86
11.66 14.40 15.87 24.9013.50 13.30 11.30 13.108.22 8.38 7.27 8.613.29 2.83 2.36 2.590.33 0.33 0.33 0.33
27.80% 23.01% 22.16% 20.02%6.25% 5.45% 5.53% 3.74%49.33 79.99 117.58 188.740.05 0.06 0.02 0.064.40 6.08 4.03 13.413.06 4.64 2.28 8.22
5062.71 6564.27 8803.15 12278.750.19% 0.11% 0.08% 0.05%33% 33% 33% 33%
3.23 5.11 2.62 9.14
21.14 29.10 35.35 60.67
31st MAR '11 31st MAR '12 31st MAR '13 31st MAR '14