52
Waterstone Environmental Hydrology Inc.

WaterstoneEnvironmental Hydrology Inc.

Groundwater Availability Model (GAM):
Gulf Coast Aquifer
Stakeholders Advisory Forum
1st Quarterly Meeting
RWPG Regions K,L,N & P
April 27, 2001
Texas A&M University
Corpus Christi, TX
Presentation TopicsPresentation TopicsPresentation Topics
Groundwater Availability and the GAM ProgramGroundwater Availability and the GAM Program
•• What is groundwater availability?What is groundwater availability?•• What is the GAM Program?What is the GAM Program?•• Why is GAM important?Why is GAM important?•• Previous StudiesPrevious Studies
Who is the Gulf Coast GAM Team?Who is the Gulf Coast GAM Team?
•• Overview and QualificationsOverview and Qualifications
Presentation Topics (cont)Presentation Topics Presentation Topics (cont)(cont)
Overview of the Gulf Coast Aquifer GAMOverview of the Gulf Coast Aquifer GAM
•• Basics of groundwater flow in the GC aquiferBasics of groundwater flow in the GC aquifer
•• Why use a numerical model?Why use a numerical model?
•• Where are we heading and how fast are we going?Where are we heading and how fast are we going?
What is Groundwater Availability ?What is Groundwater Availability ?
Groundwater availability… is simply the amount
of groundwater that is available for use from an
aquifer.
It requires both the guidance of policy and the
procedures of science (hydrology).

What is the TWDB GroundwaterWhat is the TWDB GroundwaterAvailability Model (GAM) ProgramAvailability Model (GAM) Program
Approved during the 76Approved during the 76thth legislative session to:legislative session to:
Provide reliable and timely information on Provide reliable and timely information on
groundwater availability to the citizens of groundwater availability to the citizens of
Texas,Texas,
A tool to ensure adequate supplies (or A tool to ensure adequate supplies (or
recognize inadequate supplies) over a 50recognize inadequate supplies) over a 50--year year
planning period.planning period.
What is the TWDB GroundwaterWhat is the TWDB GroundwaterAvailability Model (GAM) ProgramAvailability Model (GAM) Program
GW Availability is accessed by the Regional Water GW Availability is accessed by the Regional Water
Planning Groups. The Planning Groups. The RWPGsRWPGs will pose the policy will pose the policy
question (What if?) and GAM models of the major question (What if?) and GAM models of the major
aquifers will provide an estimate of the GW aquifers will provide an estimate of the GW
Availability. Availability.
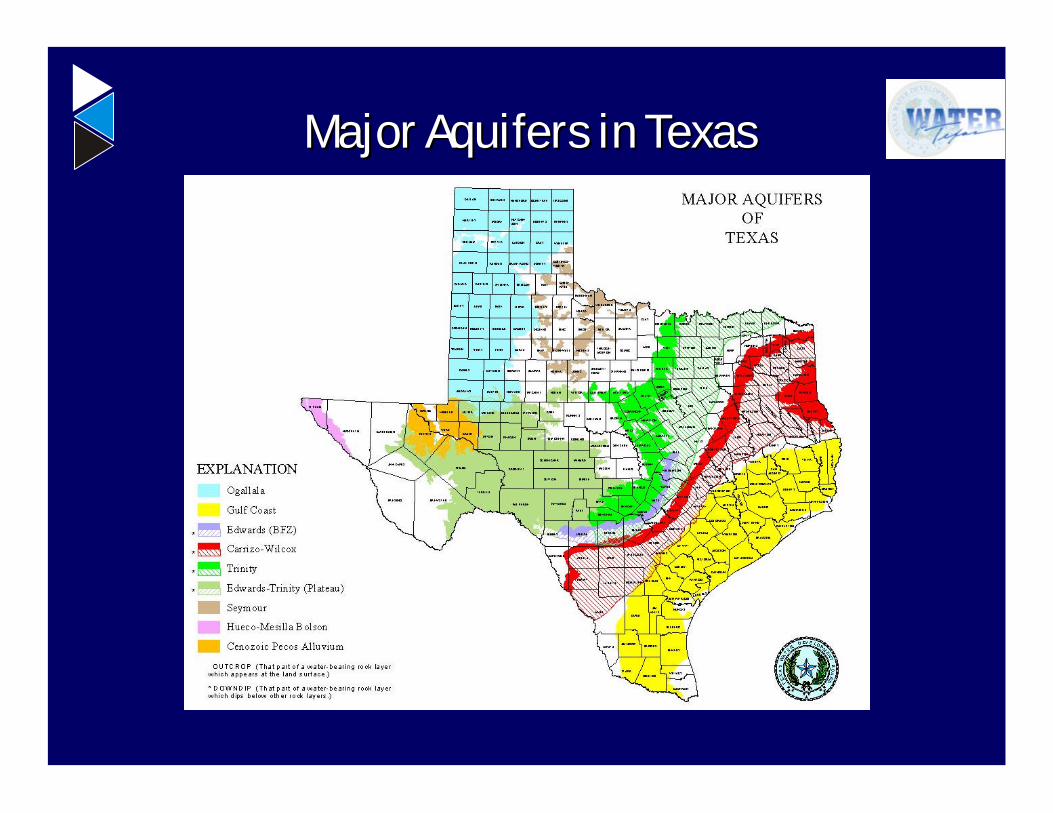
Major Aquifers in TexasMajor Aquifers in Texas
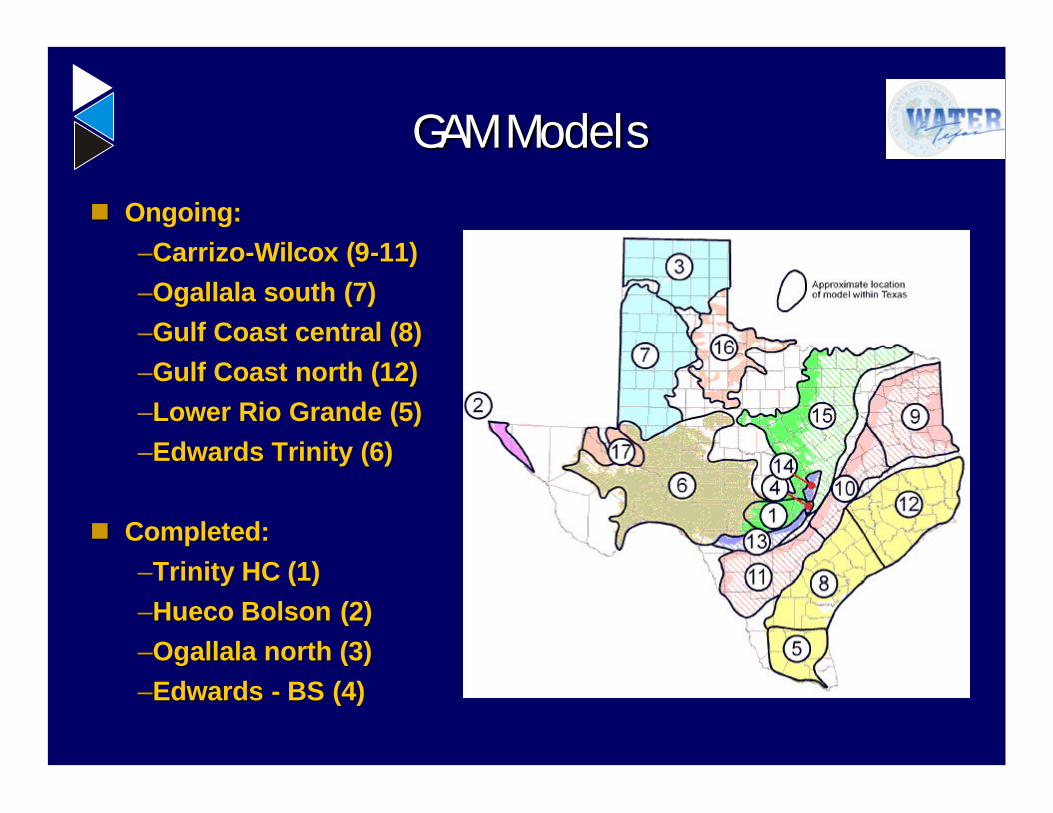
GAM ModelsGAM Models
nn Ongoing:Ongoing:
––CarrizoCarrizo--Wilcox (9Wilcox (9--11)11)
––Ogallala south (7)Ogallala south (7)
––Gulf Coast central (8)Gulf Coast central (8)
––Gulf Coast north (12)Gulf Coast north (12)
––Lower Rio Grande (5)Lower Rio Grande (5)
––Edwards Trinity (6)Edwards Trinity (6)
nn Completed:Completed:
––Trinity HC (1)Trinity HC (1)
––Hueco BolsonHueco Bolson (2)(2)
––Ogallala north (3)Ogallala north (3)
––Edwards Edwards -- BS (4)BS (4)
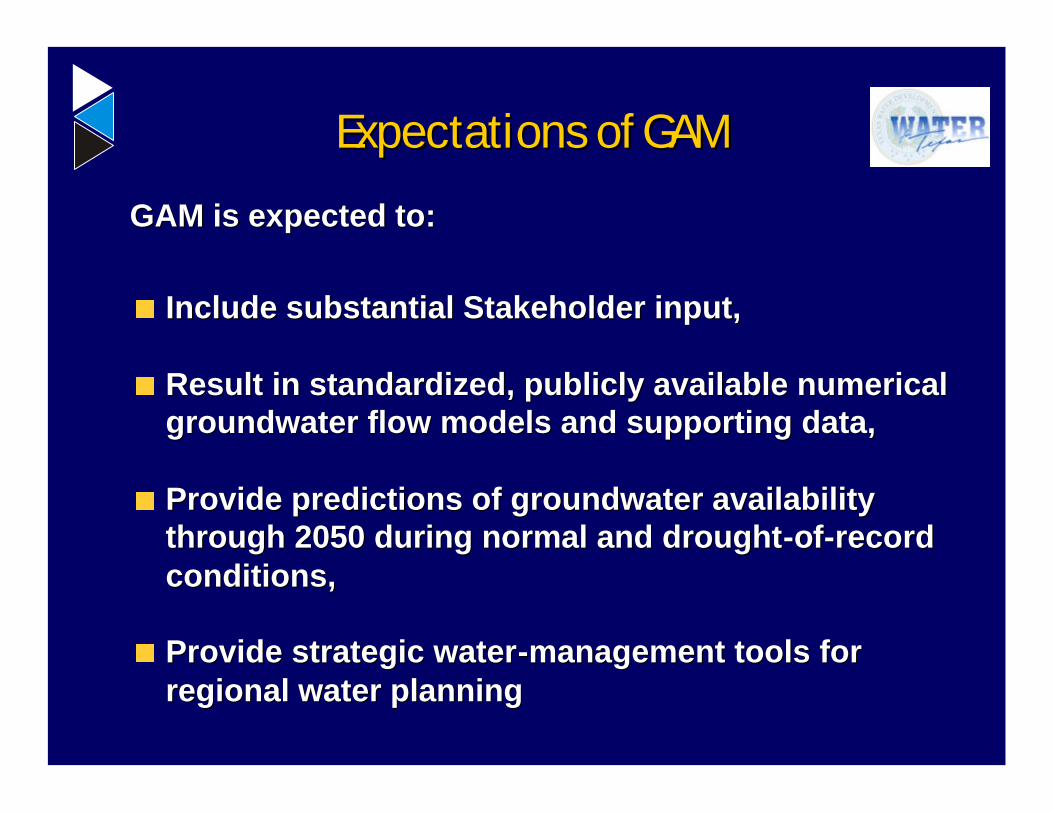
GAM is expected to:GAM is expected to:
Include substantial Stakeholder input,Include substantial Stakeholder input,
Result in standardized, publicly available numerical Result in standardized, publicly available numerical groundwater flow models and supporting data,groundwater flow models and supporting data,
Provide predictions of groundwater availability Provide predictions of groundwater availability through 2050 during normal and droughtthrough 2050 during normal and drought--ofof--record record conditions,conditions,
Provide strategic waterProvide strategic water--management tools for management tools for regional water planning regional water planning
Expectations of GAMExpectations of GAM
Why Is GAM Important ?Why Is GAM Important ?
Groundwater availability directly impacts socioGroundwater availability directly impacts socio--economic and environmental goals of the economic and environmental goals of the communities.communities.
GAM will facilitate standardized longGAM will facilitate standardized long--term planning term planning across each RWPG with the best available scientific across each RWPG with the best available scientific technology.technology.
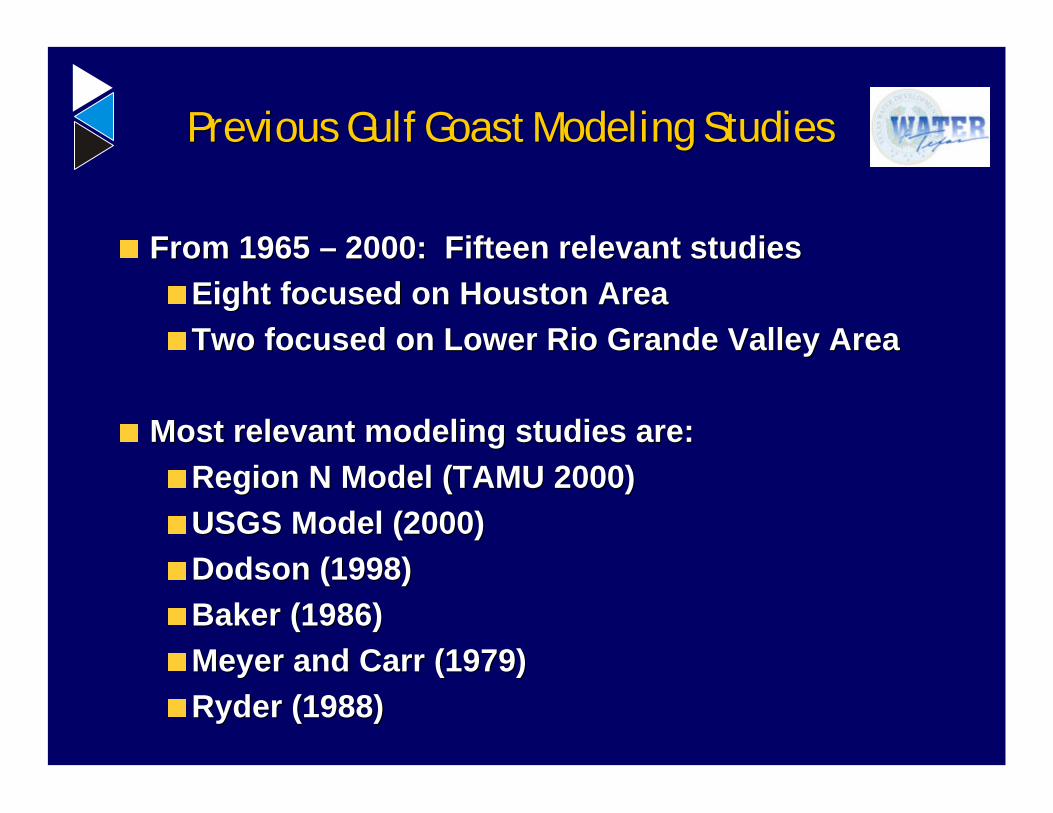
Previous Gulf Previous Gulf GoastGoast Modeling StudiesModeling Studies
From 1965 From 1965 –– 2000: Fifteen relevant studies2000: Fifteen relevant studiesEight focused on Houston AreaEight focused on Houston AreaTwo focused on Lower Rio Grande Valley AreaTwo focused on Lower Rio Grande Valley Area
Most relevant modeling studies are: Most relevant modeling studies are: Region N Model (TAMU 2000) Region N Model (TAMU 2000) USGS Model (2000) USGS Model (2000) Dodson (1998)Dodson (1998)Baker (1986)Baker (1986)Meyer and Carr (1979)Meyer and Carr (1979)Ryder (1988)Ryder (1988)
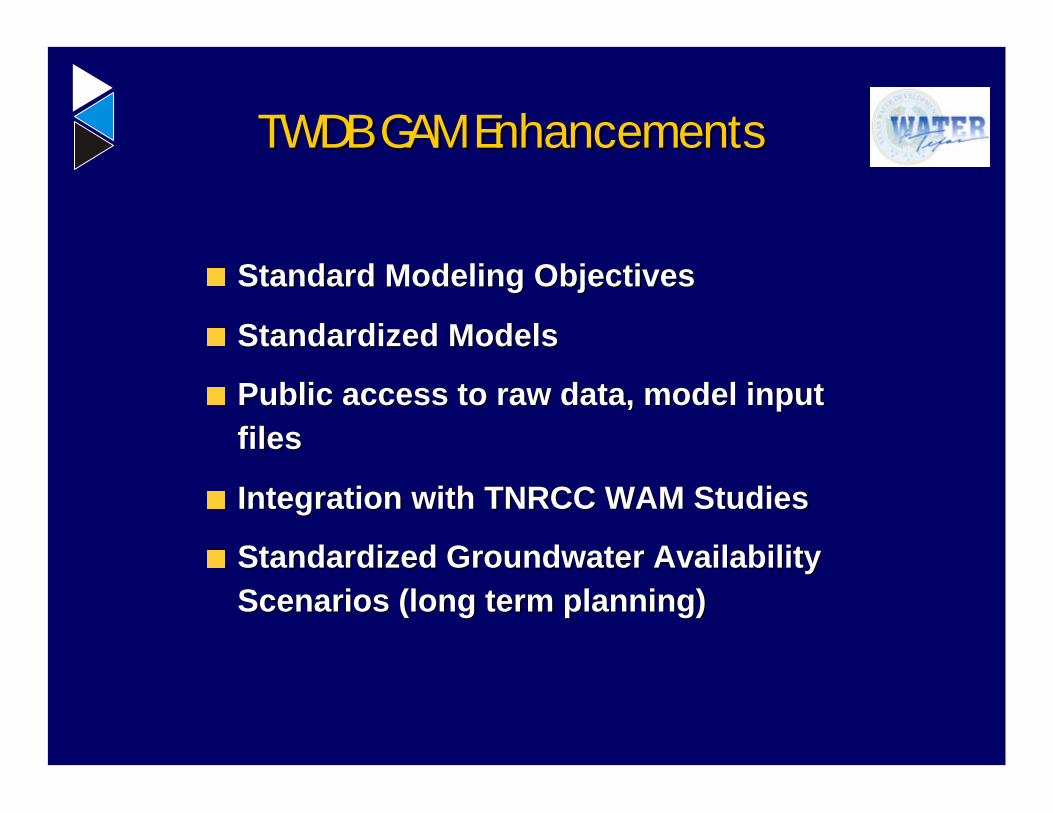
TWDB GAM EnhancementsTWDB GAM Enhancements
Standard Modeling Objectives Standard Modeling Objectives
Standardized ModelsStandardized Models
Public access to raw data, model input Public access to raw data, model input filesfiles
Integration with TNRCC WAM StudiesIntegration with TNRCC WAM Studies
Standardized Groundwater Availability Standardized Groundwater Availability Scenarios (long term planning)Scenarios (long term planning)
. . . Questions or . . . Questions or
Comments Concerning Comments Concerning
Groundwater Availability Groundwater Availability
or the GAM Program . . .or the GAM Program . . .
. . . Who is the Gulf Coast GAM Team ?. . . Who is the Gulf Coast GAM Team ?

Who is the Gulf Coast GAM Team ?Who is the Gulf Coast GAM Team ?
WaterstoneWaterstone Environmental Hydrology Inc. Environmental Hydrology Inc.
Data Acquisition, Data Analysis, Database, GIS, Data Acquisition, Data Analysis, Database, GIS, Groundwater Modeling, Reporting, Project Mgmt.Groundwater Modeling, Reporting, Project Mgmt.
ParsonsParsons Engineering Science Inc.Engineering Science Inc.
Stakeholder Communication, Planning, Stakeholder Communication, Planning, PumpagePumpage, , Water Quality, Database Design, WAM ContractorWater Quality, Database Design, WAM Contractor
DukeDuke Engineering and Services Inc.Engineering and Services Inc.
Groundwater Modeling SupportGroundwater Modeling Support
Technical Advisors:Technical Advisors:
•• Dr. Graham Dr. Graham FoggFoggRecognized Expert in Modeling and Recognized Expert in Modeling and GeostatisticalGeostatisticalAnalysis of Gulf Coast Sedimentary SystemsAnalysis of Gulf Coast Sedimentary Systems
•• Dr. John WilsonDr. John WilsonRecognized International Expert in Hydrology & Recognized International Expert in Hydrology & Sensitivity/Uncertainty Analysis of Model ResultsSensitivity/Uncertainty Analysis of Model Results
•• Dr. John PickensDr. John PickensRecognized Expert in Regional GW Modeling, Recognized Expert in Regional GW Modeling, Transport, and Aquifer Testing and Data AnalysisTransport, and Aquifer Testing and Data Analysis
Who is the Gulf Coast GAM Team ?Who is the Gulf Coast GAM Team ?

Waterstone Team QualificationsWaterstone Team Qualifications
Extensive experience in:Extensive experience in:
The development and design of regional The development and design of regional groundwater modelsgroundwater models
The development and design of sensitivity and The development and design of sensitivity and uncertainty analyses for hydrologic model resultsuncertainty analyses for hydrologic model results
Modeling Gulf Coast Aquifers and Texas Surface Modeling Gulf Coast Aquifers and Texas Surface Water Systems Water Systems
Application ofApplication of geostatisticsgeostatistics to improve model input to improve model input parameter estimatesparameter estimates

Waterstone Team QualificationsWaterstone Team Qualifications
Unique expertise in:Unique expertise in:
Water Demand ForecastingWater Demand Forecasting
Optimal groundwater management Optimal groundwater management (Decision Support Systems)(Decision Support Systems)
The application of The application of LandsatLandsat imagery and NEXRAD imagery and NEXRAD radar to quantify key hydrologic parameters on a radar to quantify key hydrologic parameters on a regional scale (GW Recharge)regional scale (GW Recharge)
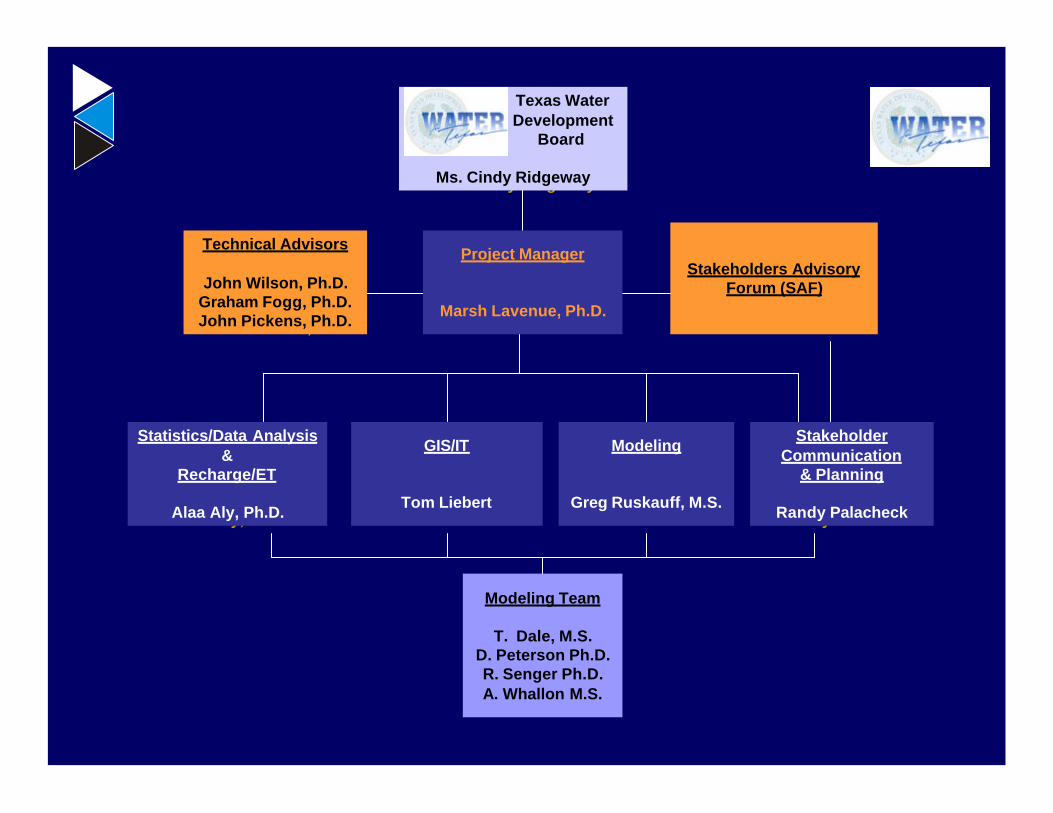
Stakeholders Advisory Forum (SAF)
Stakeholders Advisory Forum (SAF)
Modeling
Greg Ruskauff, M.S.
Modeling
Greg Ruskauff, M.S.
GIS/IT
Tom Liebert
GIS/IT
Tom Liebert
Stakeholder Communication
& Planning
Randy Palacheck
Stakeholder Communication
& Planning
Randy Palacheck
Modeling Team
T. Dale, M.S.D. Peterson Ph.D.R. Senger Ph.D.A. Whallon M.S.
Modeling Team
T. Dale, M.S.D. Peterson Ph.D.R. Senger Ph.D.A. Whallon M.S.
Statistics/Data Analysis &
Recharge/ET
Alaa Aly, Ph.D.
Statistics/Data Analysis &
Recharge/ET
Alaa Aly, Ph.D.
Technical Advisors
John Wilson, Ph.D.Graham Fogg, Ph.D.John Pickens, Ph.D.
Technical Advisors
John Wilson, Ph.D.Graham Fogg, Ph.D.John Pickens, Ph.D.
Texas Water Development
Board
Ms. Cindy Ridgeway
Texas Water Development
Board
Ms. Cindy Ridgeway
Project Manager
Marsh Lavenue, Ph.D.
Project Manager
Marsh Lavenue, Ph.D.
. . . Questions or . . . Questions or
Comments Concerning Comments Concerning
Gulf Coast GAM Team Gulf Coast GAM Team
Qualifications or CapabilitiesQualifications or Capabilities
Overview of the Gulf Coast Aquifer GAMOverview of the Gulf Coast Aquifer GAM
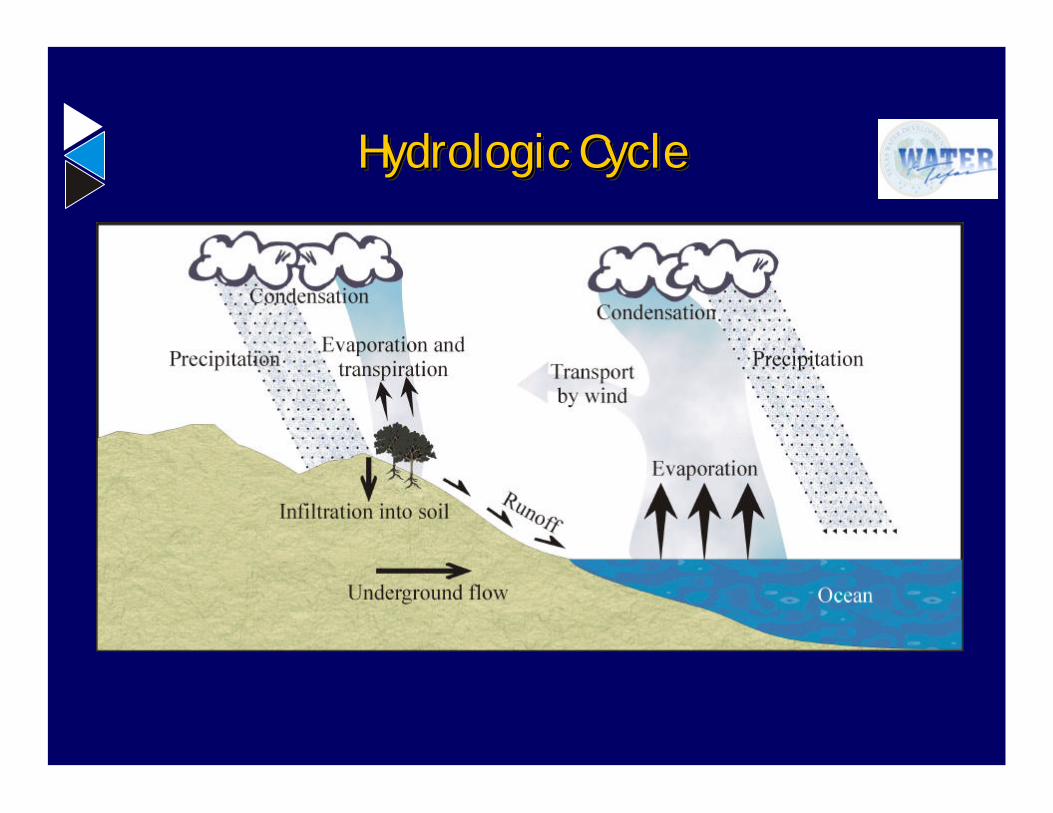
Hydrologic CycleHydrologic CycleHydrologic Cycle
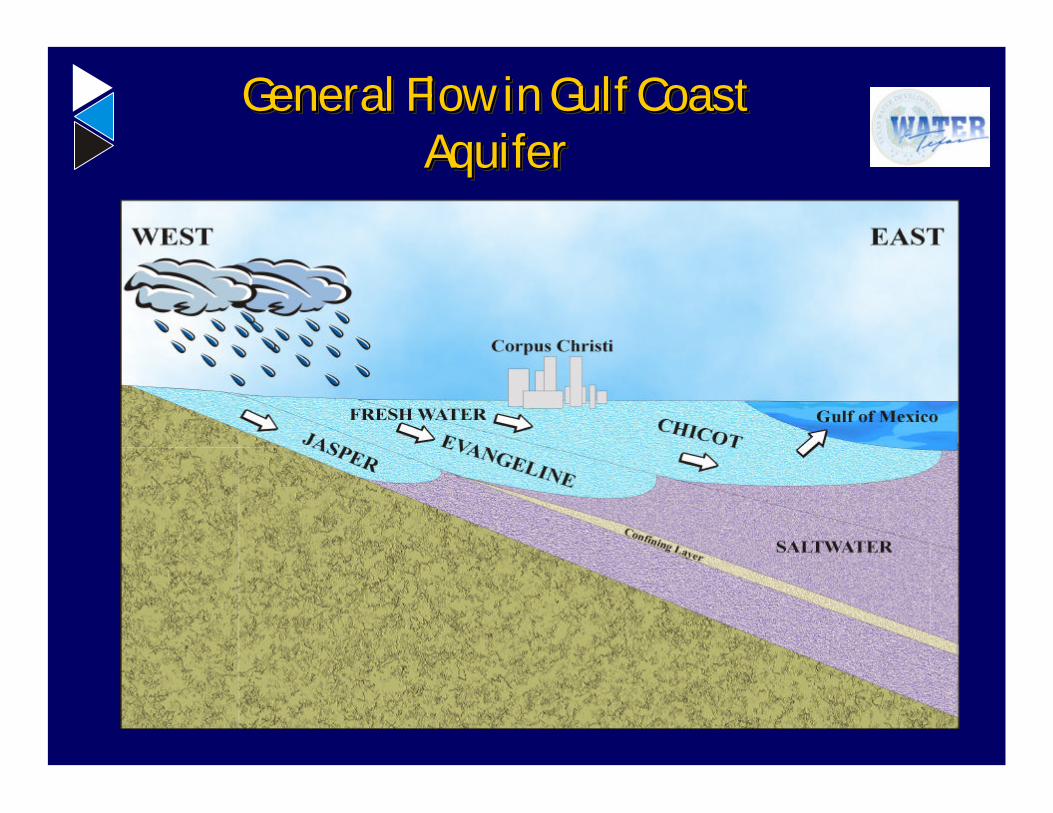
General Flow in Gulf Coast Aquifer
General Flow in Gulf Coast General Flow in Gulf Coast AquiferAquifer

A Coastal Aquifer Example –Salt Water Intrusion
A Coastal Aquifer Example A Coastal Aquifer Example ––Salt Water IntrusionSalt Water Intrusion

Impact of Pumping on Salt Water Intrusion
Impact of Pumping on Impact of Pumping on Salt Water IntrusionSalt Water Intrusion
A = No Pumping B = Pumping
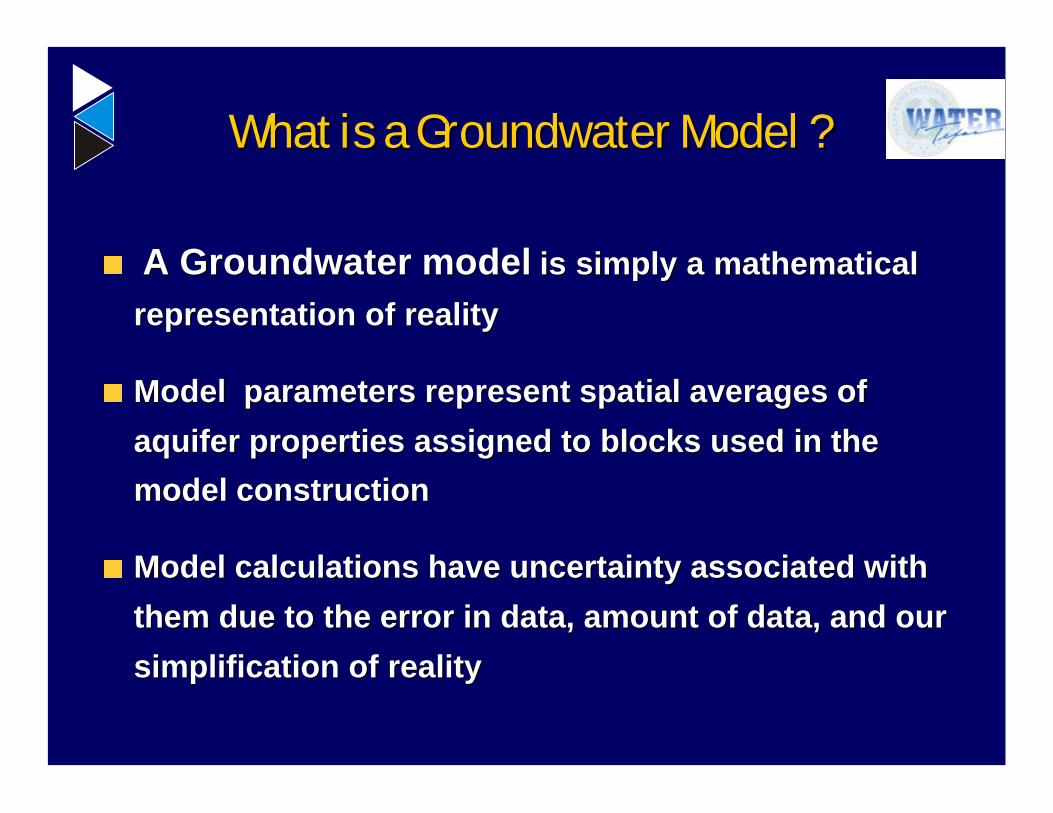
What is a Groundwater Model ?What is a Groundwater Model ?
A Groundwater modelA Groundwater model is simply a mathematical is simply a mathematical
representation of realityrepresentation of reality
Model parameters represent spatial averages of Model parameters represent spatial averages of
aquifer properties assigned to blocks used in the aquifer properties assigned to blocks used in the
model construction model construction
Model calculations have uncertainty associated with Model calculations have uncertainty associated with
them due to the error in data, amount of data, and our them due to the error in data, amount of data, and our
simplification of realitysimplification of reality

Limitations of a Groundwater Limitations of a Groundwater ModelModel
Spatial Scale Limitations Spatial Scale Limitations
(1 mile grid = 1 mile average water levels)(1 mile grid = 1 mile average water levels)
Temporal Scale Limitations Temporal Scale Limitations
Input Data Uncertainty (Input Data Uncertainty (pumpagepumpage))
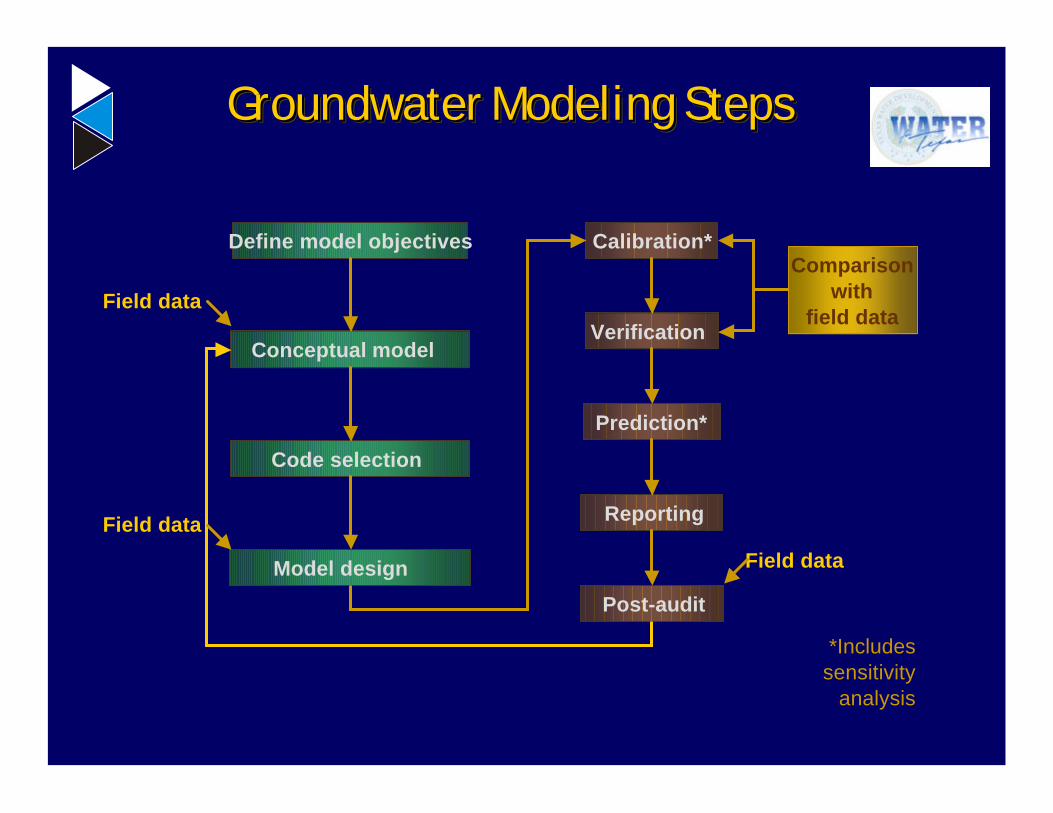
Groundwater Modeling StepsGroundwater Modeling StepsGroundwater Modeling Steps
Define model objectives
Conceptual model
Code selection
Field data
Calibration*
Reporting
Verification
Post-audit
Prediction*
Comparisonwith
field data
Model design
Field data
Field data
*Includes sensitivity
analysis
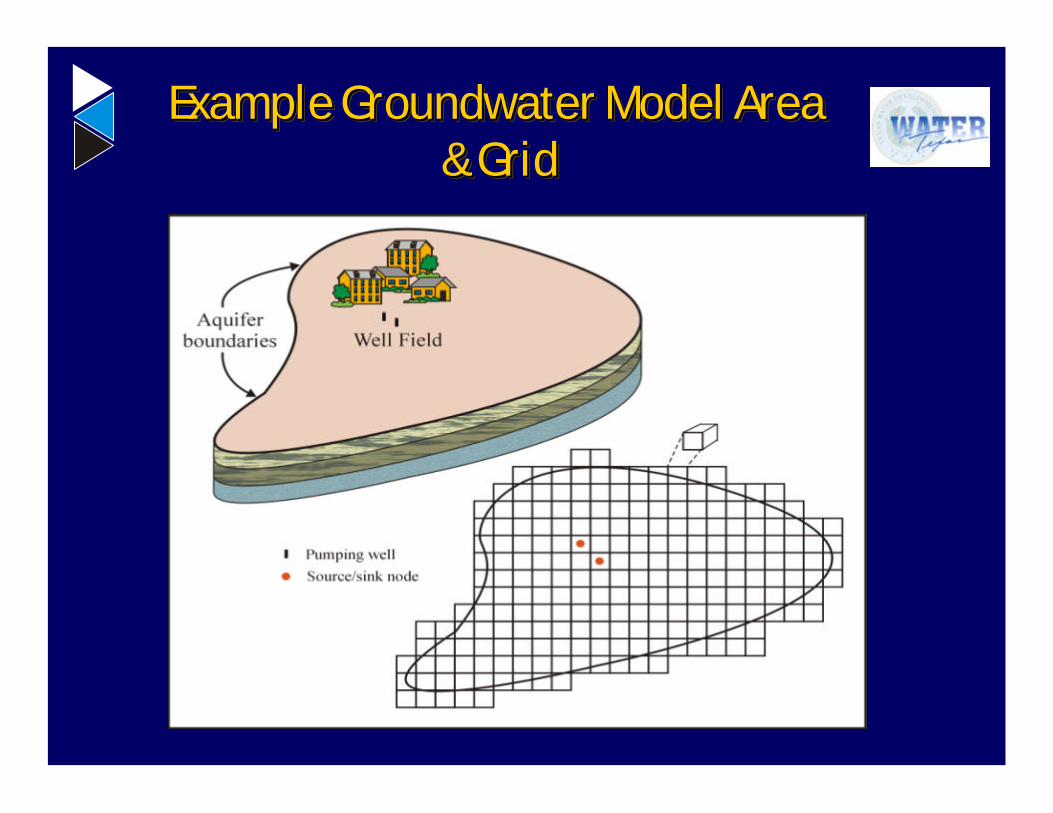
Example Groundwater Model Area& Grid
Example Groundwater Model AreaExample Groundwater Model Area& Grid& Grid
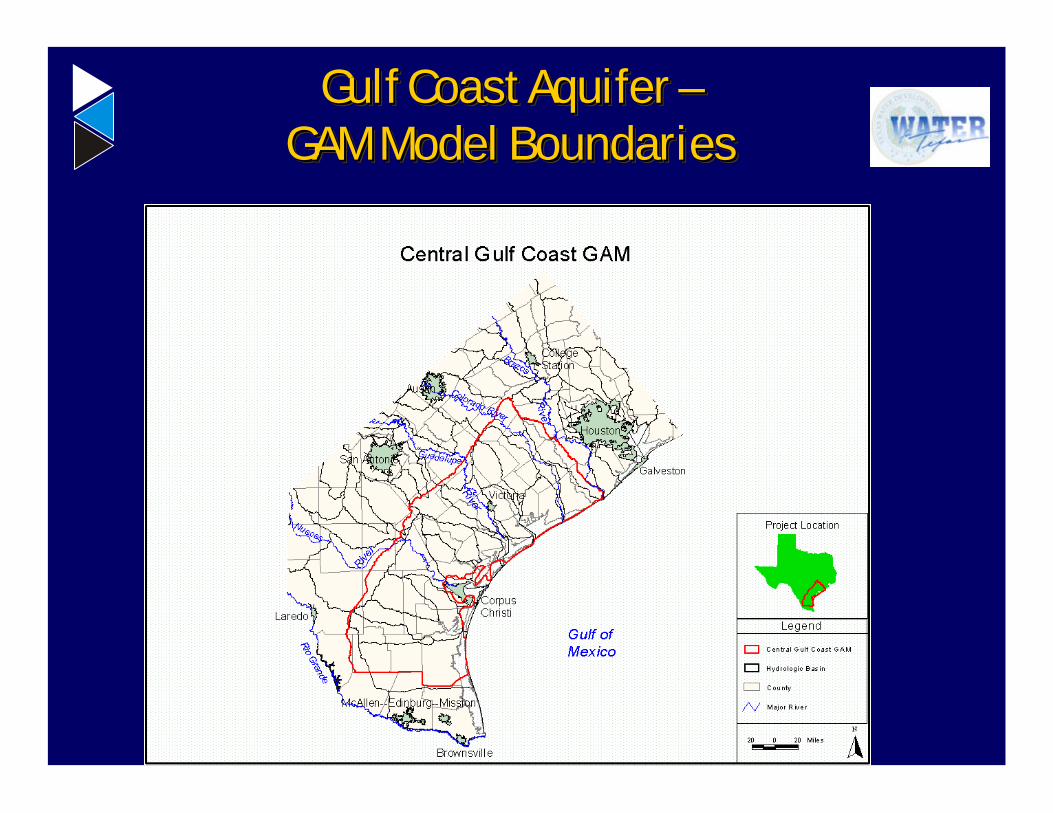
Gulf Coast Aquifer –GAM Model Boundaries
Gulf Coast Aquifer Gulf Coast Aquifer ––GAM Model BoundariesGAM Model Boundaries
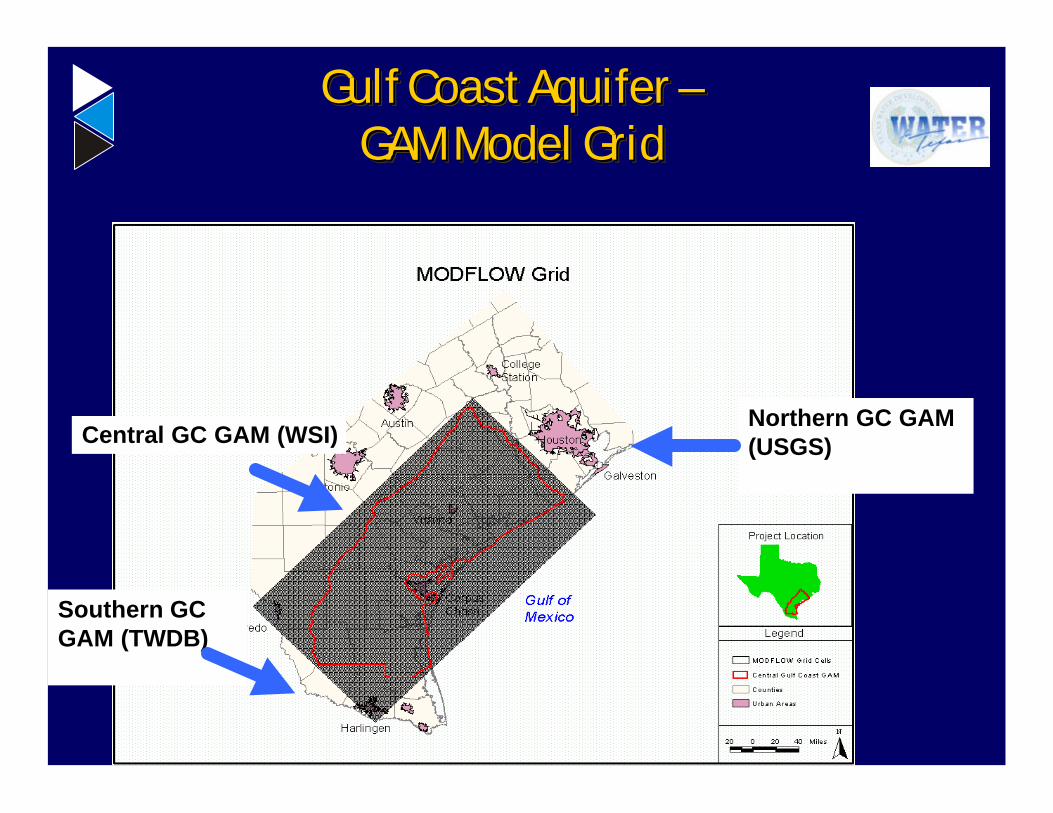
Gulf Coast Aquifer –GAM Model Grid
Gulf Coast Aquifer Gulf Coast Aquifer ––GAM Model Grid GAM Model Grid
Central GC GAM (WSI)
Southern GC GAM (TWDB)
Northern GC GAM (USGS)
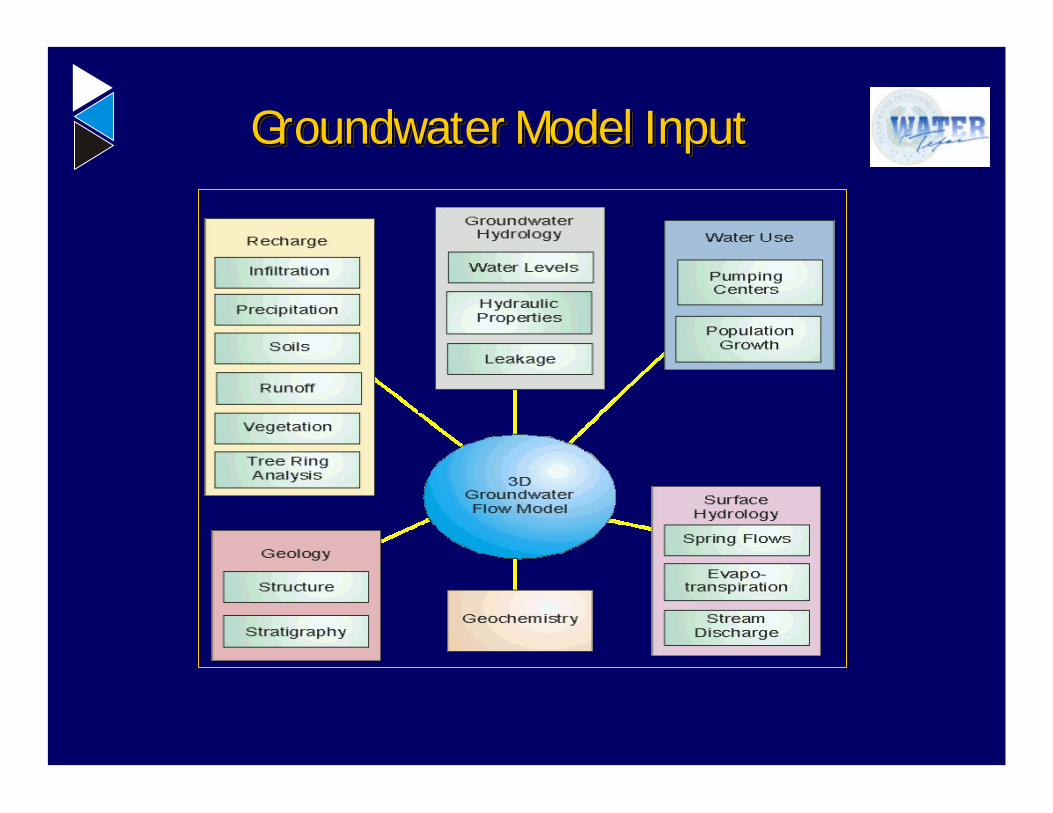
Groundwater Model InputGroundwater Model InputGroundwater Model Input
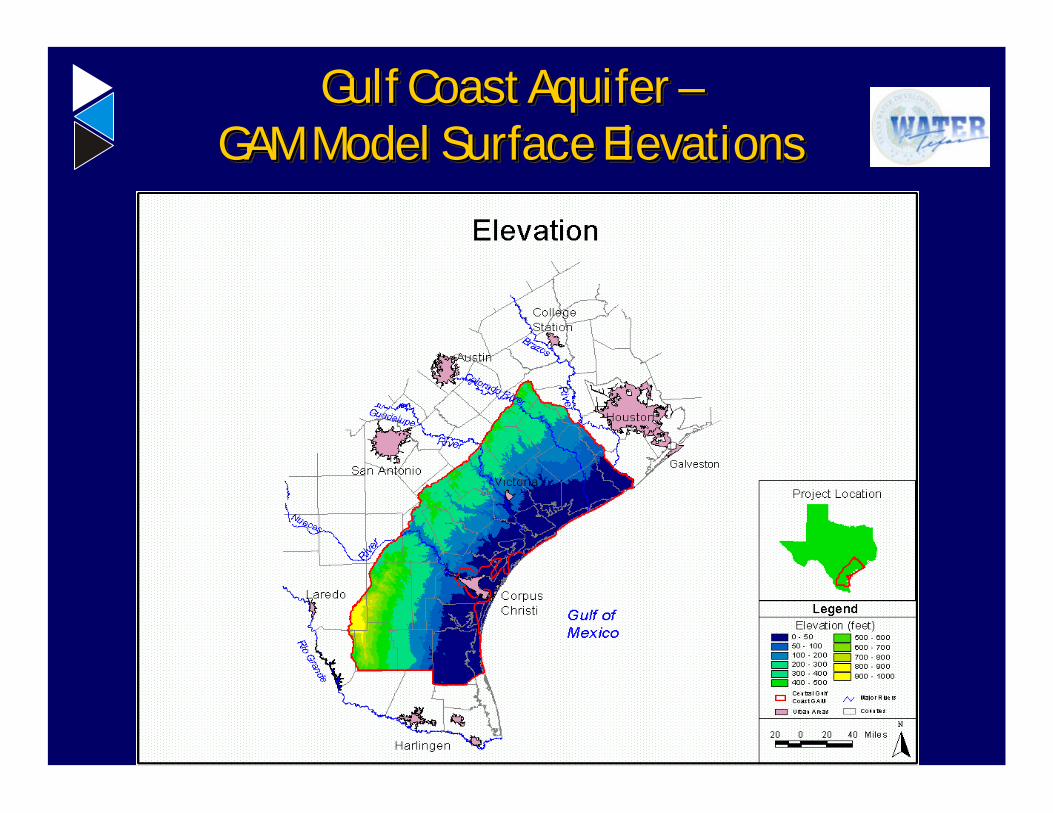
Gulf Coast Aquifer –GAM Model Surface Elevations
Gulf Coast Aquifer Gulf Coast Aquifer ––GAM Model Surface ElevationsGAM Model Surface Elevations
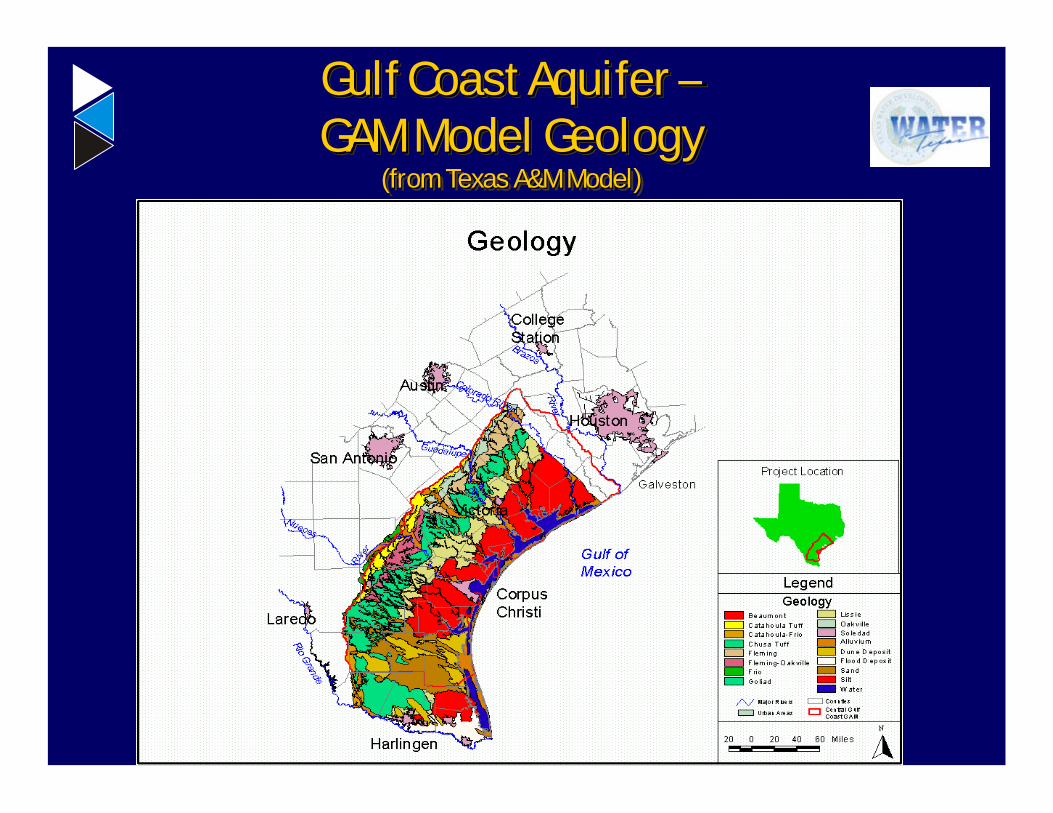
Gulf Coast Aquifer –GAM Model Geology
(from Texas A&M Model)
Gulf Coast Aquifer Gulf Coast Aquifer ––GAM Model Geology GAM Model Geology
(from Texas A&M Model)(from Texas A&M Model)
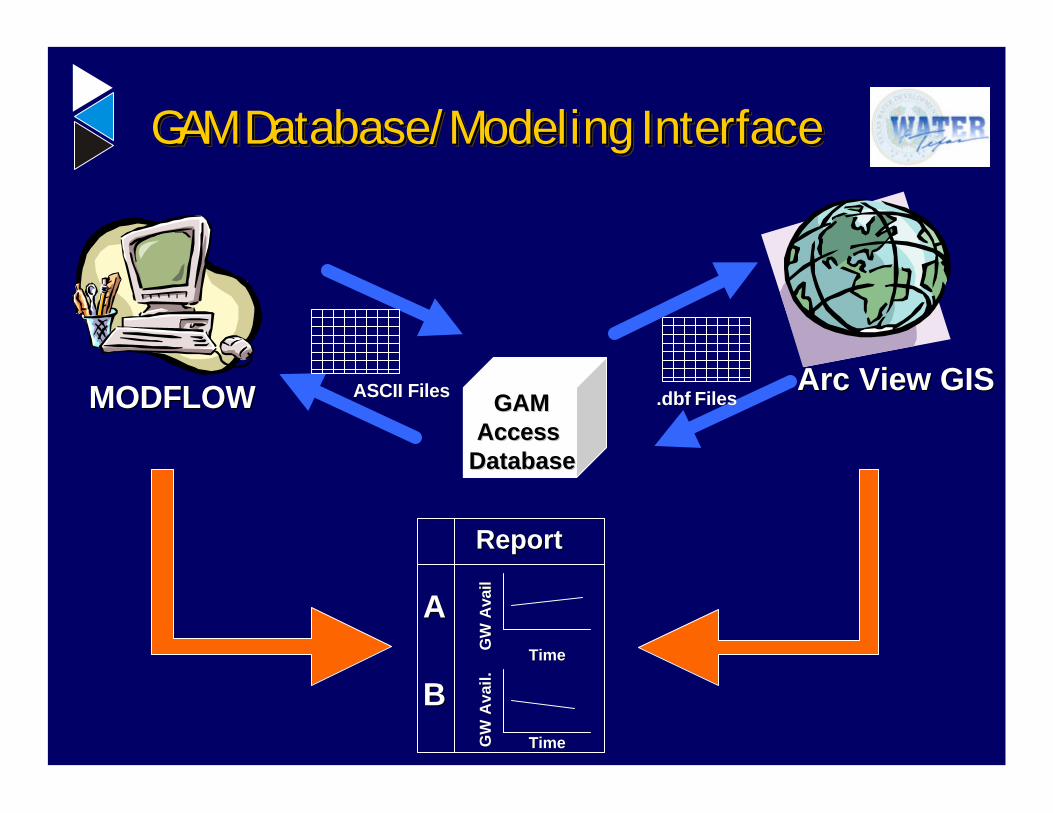
Arc View GISArc View GIS
GAM Database/Modeling InterfaceGAM Database/Modeling InterfaceGAM Database/Modeling Interface
GAMGAMAccess Access
DatabaseDatabase
MODFLOWMODFLOW ASCII FilesASCII Files .dbf Files.dbf Files
ReportReport
GW
Ava
il.G
W A
vail.
TimeTime
GW
Ava
ilG
W A
vail
TimeTime
AA
BB
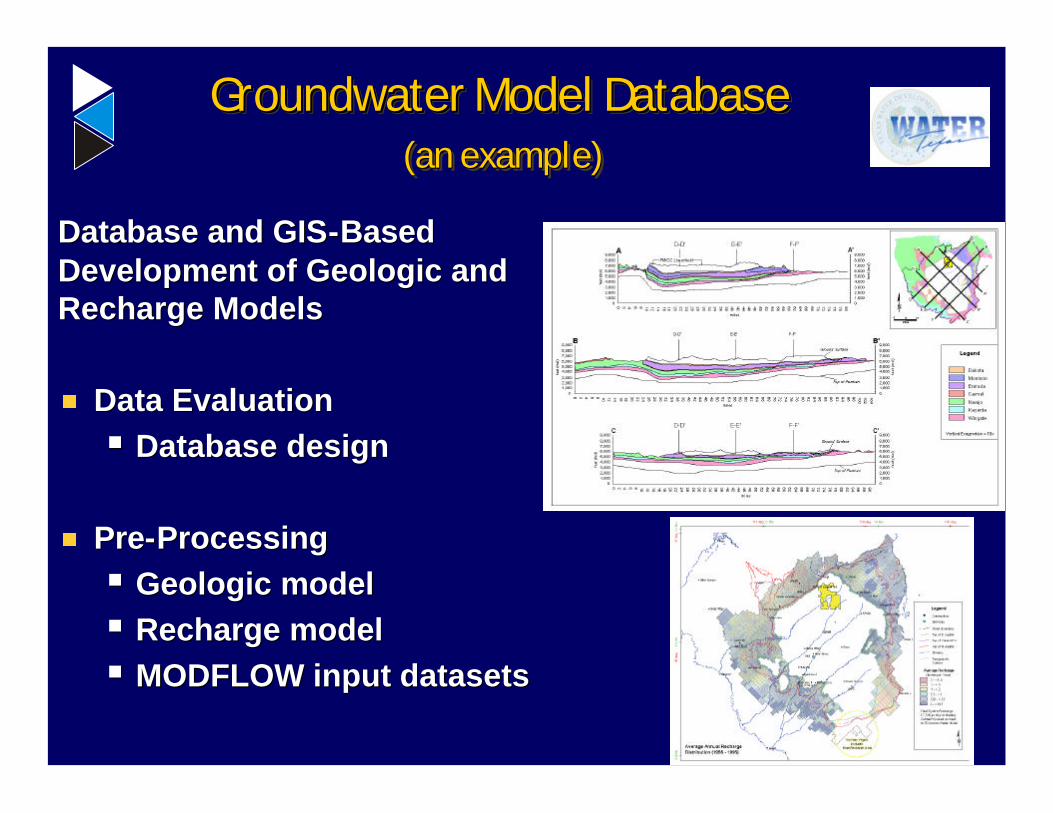
Groundwater Model Database(an example)
Groundwater Model DatabaseGroundwater Model Database(an example)(an example)
Database and GISDatabase and GIS--Based Based Development of Geologic andDevelopment of Geologic andRecharge ModelsRecharge Models
Data EvaluationData Evaluation§§ Database designDatabase design
PrePre--ProcessingProcessing§§ Geologic modelGeologic model§§ Recharge modelRecharge model§§ MODFLOW input datasetsMODFLOW input datasets
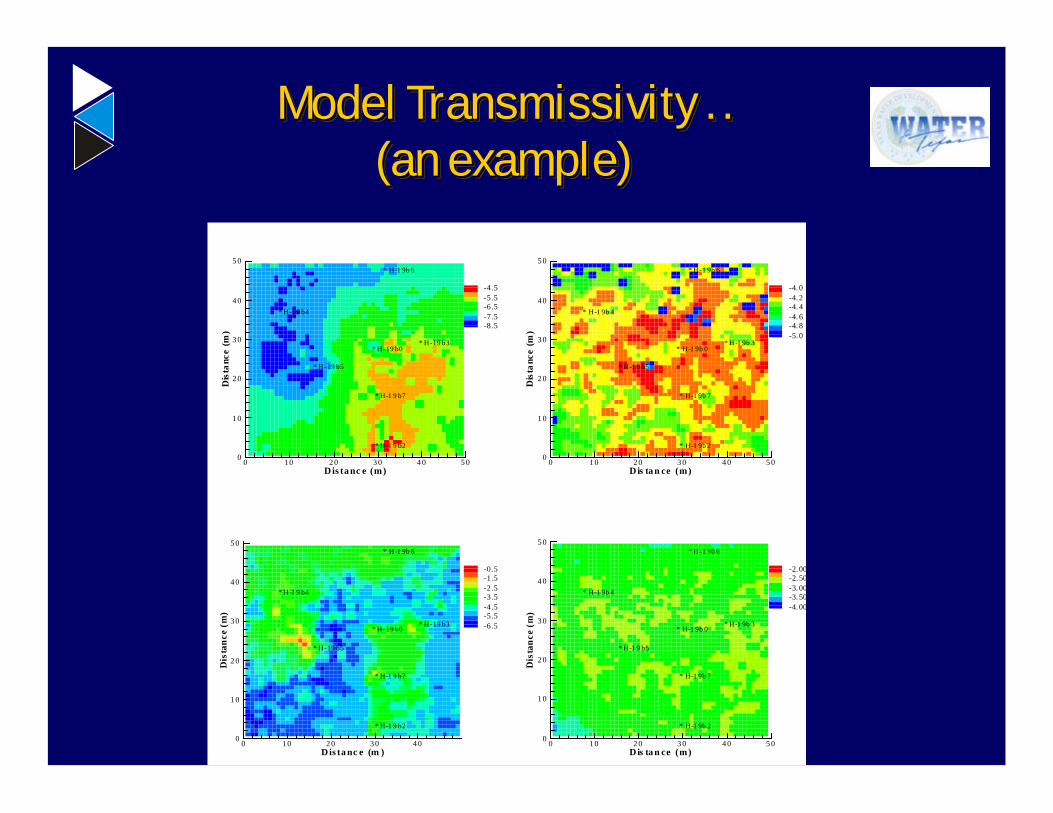
Model Transmissivity . . (an example)
Model Model TransmissivityTransmissivity . . . . (an example)(an example)
0 1 0 2 0 3 0 4 0Dis ta nc e (m )
0
1 0
2 0
3 0
4 0
5 0
Dis
tan
ce(m
)
-0 .5-1 .5-2 .5-3 .5-4 .5-5 .5-6 .5* H-19 b0
* H-1 9 b2
* H-19 b3
* H-1 9 b4
* H-19 b5
* H-1 9b 6
* H-1 9 b7
0 1 0 2 0 3 0 4 0 5 0Dis ta n ce (m)
0
1 0
2 0
3 0
4 0
5 0
Dis
tan
ce(m
)
-2. 00-2. 50-3. 00-3. 50-4. 00
* H-1 9b 0
* H-1 9b 2
* H-1 9b 3
* H-1 9b 4
* H-1 9 b5
* H-1 9b 6
* H-1 9b 7
0 1 0 2 0 3 0 4 0 5 0Dis ta nc e (m)
0
1 0
2 0
3 0
4 0
5 0
Dis
tanc
e(m
)
-4 .5-5 .5-6 .5-7 .5-8 .5
* H-19 b0
* H-1 9 b2
* H-19 b3
* H-1 9 b4
* H-19 b5
* H-1 9b 6
* H-1 9 b7
0 1 0 2 0 3 0 4 0 5 0Dis ta n ce (m)
0
1 0
2 0
3 0
4 0
5 0
Dis
tanc
e(m
)
-4. 0-4. 2-4. 4-4. 6-4. 8-5. 0
* H-1 9b 0
* H-1 9b 2
* H-1 9b 3
* H-1 9b 4
* H-1 9 b5
* H-1 9b 6
* H-1 9b 7

Model Calibration Quality
Evaluation Methods
Model Calibration Quality Model Calibration Quality
Evaluation MethodsEvaluation Methods
QualitativeQualitativeComparison of ContoursComparison of Contours
QuantitativeQuantitativeStatistical MeasuresStatistical Measures
SemiSemi--QuantitativeQuantitativeResidual Scatter PlotsResidual Scatter PlotsPost Residuals on ContoursPost Residuals on Contours
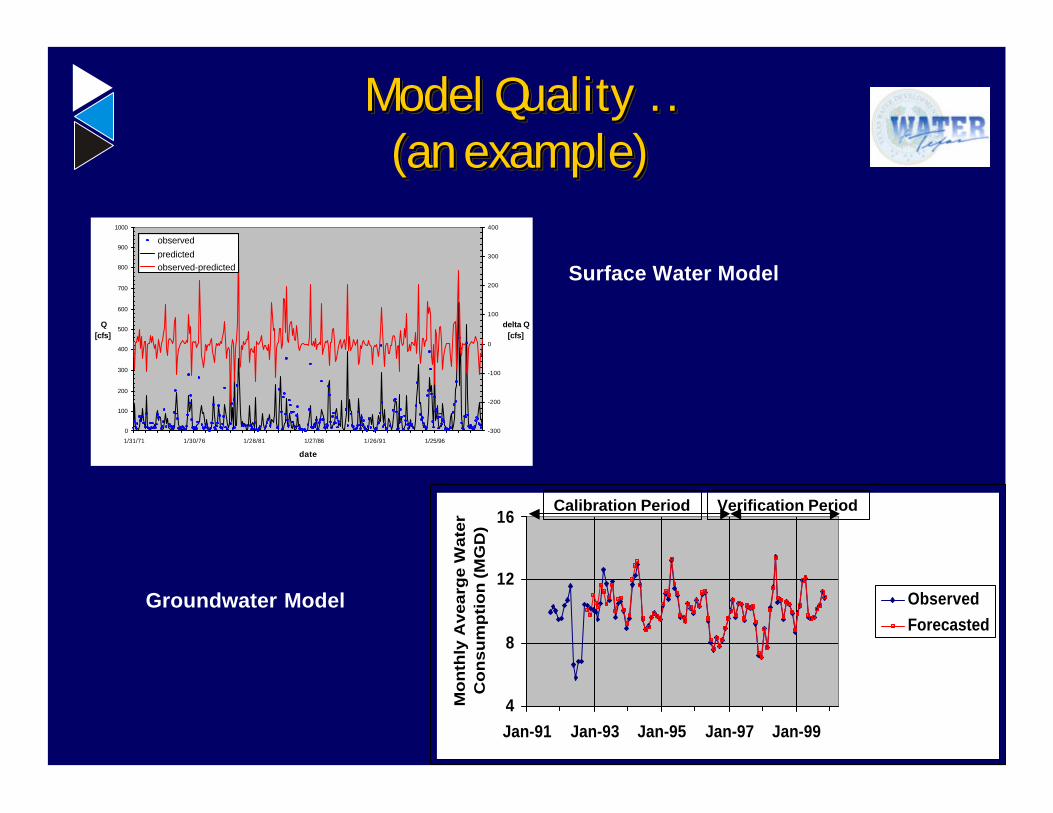
Model Quality . . (an example)
Model Quality . . Model Quality . . (an example)(an example)
4
8
12
16
Jan-91 Jan-93 Jan-95 Jan-97 Jan-99
Mo
nth
ly A
vearg
e W
ate
r C
on
su
mp
tio
n (
MG
D)
ObservedForecasted
Calibration Period Verification Period
0
100
200
300
400
500
600
700
800
900
1000
1/31/71 1/30/76 1/28/81 1/27/86 1/26/91 1/25/96
date
Q[cfs]
-300
-200
-100
0
100
200
300
400
delta Q[cfs]
observed
predictedobserved-predicted
Groundwater Model
Surface Water Model

Groundwater Modeling StepsGroundwater Modeling StepsGroundwater Modeling Steps
Define model objectives
Conceptual model
Code selection
Field data
Calibration*
Reporting
Verification
Post-audit
Prediction*
Comparisonwith
field data
Model design
Field data
Field data
*Includes sensitivity
analysis
Scope and Schedule for Gulf Coast Aquifer GAMScope and Schedule for Gulf Coast Aquifer GAM

FebFebFeb
Project quarterProject quarter Major milestoneMajor milestoneTechnical meetings
with TWDBTechnical meetings
with TWDBTWDB
major tasksTWDB
major tasks
MayMayMay
AugAugAug
NovNovNov
StartStart
Assemble SAFAssemble SAF
Intro SAF MeetingIntro SAF MeetingOverview of Project
Overview of Project
Assemble SAF
Assemble SAF
Introduce GAMto RWPG’s
Introduce GAMto RWPG’sReview of
conceptual modelReview of
conceptual model
2001
22000011
Review of steady-state calibration
Review of steady-state calibration
Monthly ReportsMonthly Reports
Quarterly Stakeholder AdvisoryQuarterly Stakeholder AdvisoryForum (SAF) meetingForum (SAF) meeting

FebFebFeb
Project quarterProject quarter Major milestoneMajor milestoneTechnical meetings
with TWDBTechnical meetings
with TWDBTWDB
major tasksTWDB
major tasks
MayMayMay
AugAugAug
NovNovNov
Draft ReportDraft Report
Review commentsReview comments
Review of predictions
Review of predictions
Post to WebPost to Web
Review of transient calibration
Review of transient calibration
2002
22000022
Review of draft reportReview of draft report
SAF model trainingSAF model training TWDB model trainingTWDB model training
Final deliverablesFinal deliverablesFebFeb
Review reportReview report
Monthly ReportsMonthly Reports
Quarterly Stakeholder AdvisoryQuarterly Stakeholder AdvisoryForum (SAF) meetingForum (SAF) meeting
. . . Questions or . . . Questions or
Comments Concerning Comments Concerning
Gulf Coast GAMGulf Coast GAM
Schedule or TasksSchedule or Tasks
WaterstoneEnvironmental Hydrology Inc.
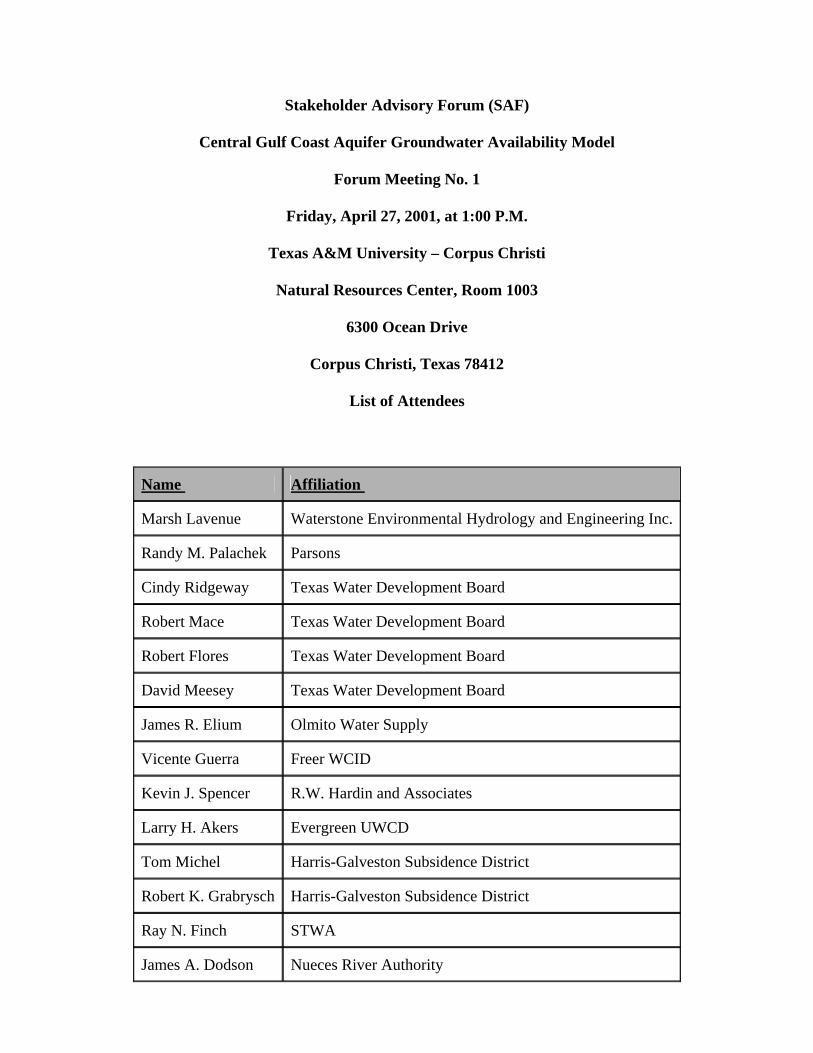
Stakeholder Advisory Forum (SAF)
Central Gulf Coast Aquifer Groundwater Availability Model
Forum Meeting No. 1
Friday, April 27, 2001, at 1:00 P.M.
Texas A&M University – Corpus Christi
Natural Resources Center, Room 1003
6300 Ocean Drive
Corpus Christi, Texas 78412
List of Attendees
Name Affiliation
Marsh Lavenue Waterstone Environmental Hydrology and Engineering Inc.
Randy M. Palachek Parsons
Cindy Ridgeway Texas Water Development Board
Robert Mace Texas Water Development Board
Robert Flores Texas Water Development Board
David Meesey Texas Water Development Board
James R. Elium Olmito Water Supply
Vicente Guerra Freer WCID
Kevin J. Spencer R.W. Hardin and Associates
Larry H. Akers Evergreen UWCD
Tom Michel Harris-Galveston Subsidence District
Robert K. Grabrysch Harris-Galveston Subsidence District
Ray N. Finch STWA
James A. Dodson Nueces River Authority
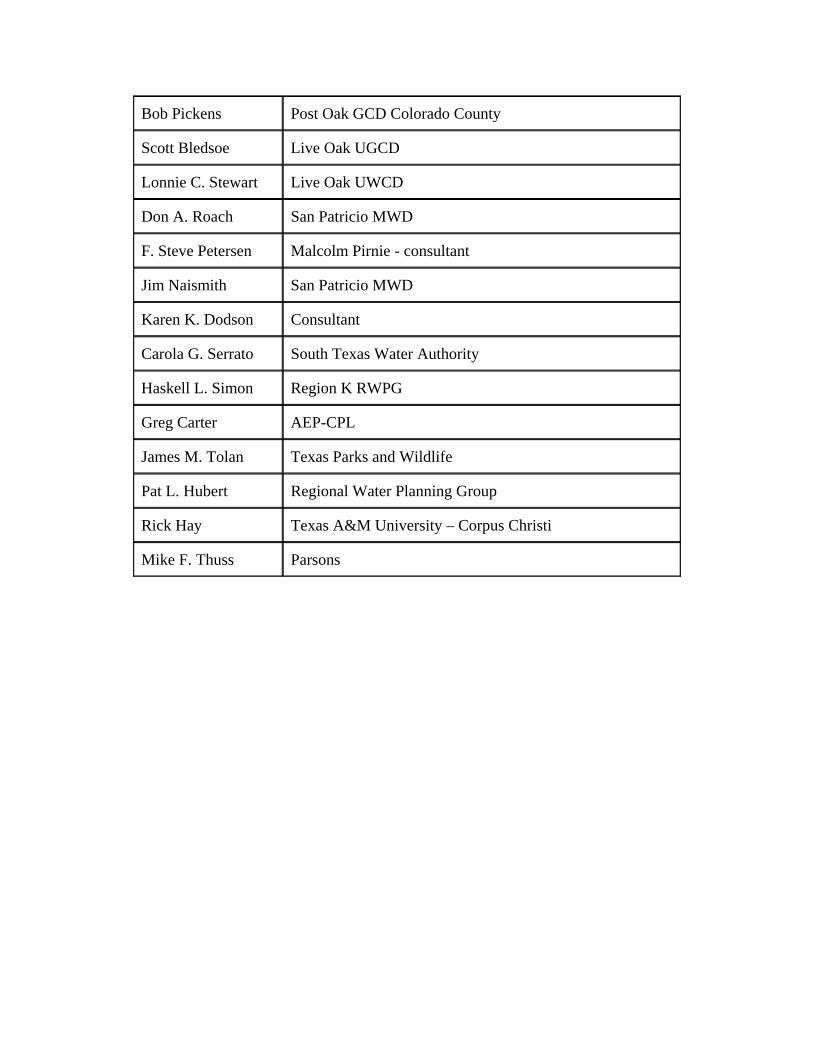
Bob Pickens Post Oak GCD Colorado County
Scott Bledsoe Live Oak UGCD
Lonnie C. Stewart Live Oak UWCD
Don A. Roach San Patricio MWD
F. Steve Petersen Malcolm Pirnie - consultant
Jim Naismith San Patricio MWD
Karen K. Dodson Consultant
Carola G. Serrato South Texas Water Authority
Haskell L. Simon Region K RWPG
Greg Carter AEP-CPL
James M. Tolan Texas Parks and Wildlife
Pat L. Hubert Regional Water Planning Group
Rick Hay Texas A&M University – Corpus Christi
Mike F. Thuss Parsons
Central Gulf Coast GAM SAF Meeting Corpus Christi, Texas (4/27/01)
C:\Documents and Settings \MLavenue\Local Settings\Temporary Internet Files\OLK1E\FirstSAFGulfnotes.doc Page 1 of 4
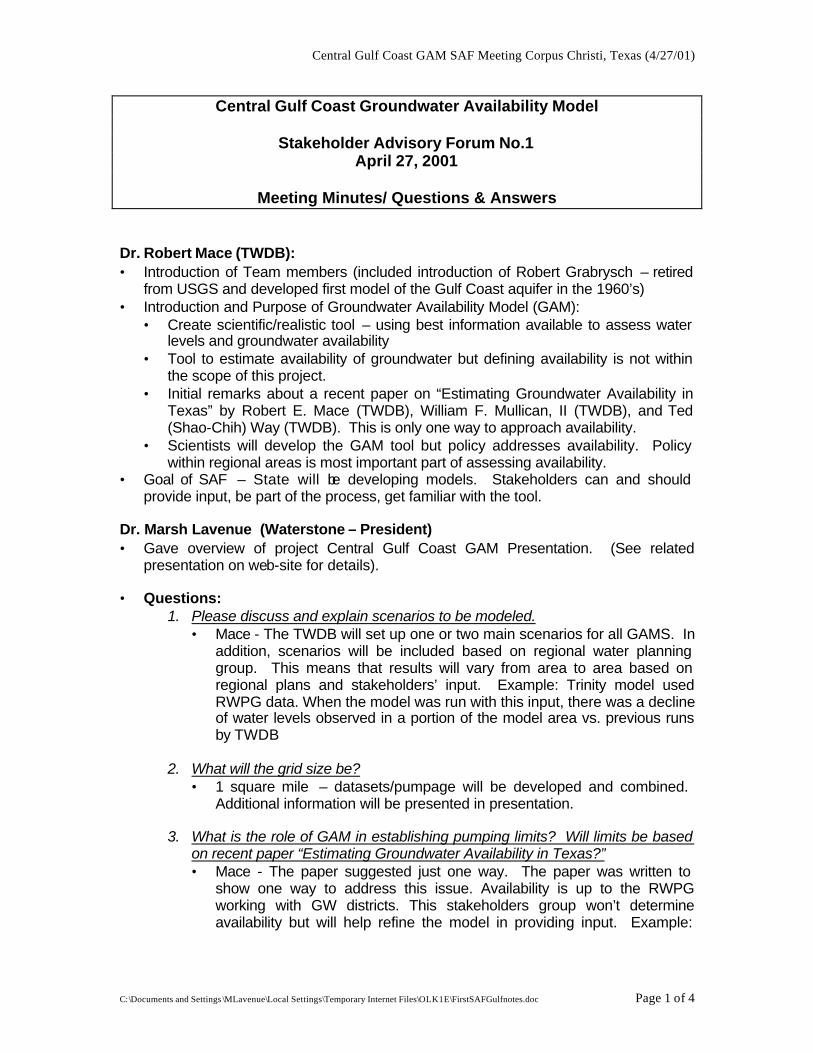
Central Gulf Coast Groundwater Availability Model
Stakeholder Advisory Forum No.1 April 27, 2001
Meeting Minutes/ Questions & Answers
Dr. Robert Mace (TWDB): • Introduction of Team members (included introduction of Robert Grabrysch – retired
from USGS and developed first model of the Gulf Coast aquifer in the 1960’s) • Introduction and Purpose of Groundwater Availability Model (GAM):
• Create scientific/realistic tool – using best information available to assess water levels and groundwater availability
• Tool to estimate availability of groundwater but defining availability is not within the scope of this project.
• Initial remarks about a recent paper on “Estimating Groundwater Availability in Texas” by Robert E. Mace (TWDB), William F. Mullican, II (TWDB), and Ted (Shao-Chih) Way (TWDB). This is only one way to approach availability.
• Scientists will develop the GAM tool but policy addresses availability. Policy within regional areas is most important part of assessing availability.
• Goal of SAF – State will be developing models. Stakeholders can and should provide input, be part of the process, get familiar with the tool.
Dr. Marsh Lavenue (Waterstone – President) • Gave overview of project Central Gulf Coast GAM Presentation. (See related
presentation on web-site for details). • Questions:
1. Please discuss and explain scenarios to be modeled. • Mace - The TWDB will set up one or two main scenarios for all GAMS. In
addition, scenarios will be included based on regional water planning group. This means that results will vary from area to area based on regional plans and stakeholders’ input. Example: Trinity model used RWPG data. When the model was run with this input, there was a decline of water levels observed in a portion of the model area vs. previous runs by TWDB
2. What will the grid size be?
• 1 square mile – datasets/pumpage will be developed and combined. Additional information will be presented in presentation.
3. What is the role of GAM in establishing pumping limits? Will limits be based
on recent paper “Estimating Groundwater Availability in Texas?” • Mace - The paper suggested just one way. The paper was written to
show one way to address this issue. Availability is up to the RWPG working with GW districts. This stakeholders group won’t determine availability but will help refine the model in providing input. Example:
Central Gulf Coast GAM SAF Meeting Corpus Christi, Texas (4/27/01)
C:\Documents and Settings \MLavenue\Local Settings\Temporary Internet Files\OLK1E\FirstSAFGulfnotes.doc Page 2 of 4
Alcoa sales to SAWS. Region K based their availability on recharge and Region L based the same supply with a higher availability value.
4. What is process and what will be provided to regional plans, will this trickle
down to default groundwater limits and does regional planning groups have to run model? Previous model had its own group to define water levels, but what about RWPGs who define availability differently? • Mace- Good question. The Trinity model did this with three different
RWPGs. Need to compare and contrast the results. Different regional planning groups may run the same model with different inputs and get different answers. For example, one region may run model with existing pumpage levels for the future, while another may run model with substantially higher pumping in their region and get drawdown which affects an adjacent region.
5. How “salty” does the water need to be to be excluded from model?
• Mace- Drinking water is typically less than 1000 ppm total dissolved solids, but TWDB uses up to 3000 ppm for other uses (livestock). Potential uses of water from desalination facilities may need to look at water up to 10,000 ppm. Waterstone will be looking at water quality (TDS).
6. How will the model be verified? Drawdown? Look at several wells?
• Lavenue - Yes, this will be covered later in the presentation but will use wells for calibration.
7. Define Gulf Coast aquifer, it consists of many aquifers.
• Lavenue - Gulf Cost units shown on slide including Chicot, Evageline, Jasper, Catahoula.
8. Are we mining the aquifer?
• Mace - This depends on your definition of mining, example Ogalalla and Hueco Bolson. This definition goes back to regional planning groups for modeling scenarios and inputs.
9. Are you using subsidence package in the model?
• Mace - No, at this time only the northern Gulf Coast GAM has this in their scope of work.
• USGS is still working on the subsidence package. The model is a living tool and this feature may be added in the future. Other areas of the state do not have as much data on subsidence as northern Gulf Coast.
• Lavenue- We may be able to look at this (clay storage/subsidence) in sensitivity analysis.
Central Gulf Coast GAM SAF Meeting Corpus Christi, Texas (4/27/01)
C:\Documents and Settings \MLavenue\Local Settings\Temporary Internet Files\OLK1E\FirstSAFGulfnotes.doc Page 3 of 4
10. Is there subsidence around here? Around Robstown? • Mace: No; however, measurements and documentation is not readily
available – if at all.
11. Question concerning well spacing, pumping restrictions i.e. rule of capture. • Groundwater districts have the ability to regulate and have the right to
establish spacing and production and additional language in SB-2 may strengthen groundwater districts.
12. Is GAM integrated with WAM, isn’t this done in the process?
• Lavenue – No they are not coupled at this time. However, information from WAM can be utilized in GAM.
13. Please discuss predictive runs, different RWPGs used different concepts and
strategies. • TWDB will test drive the model with information from the various RWPGs
plans for input. This will allow us to see results from different scenarios, how the model reacts, and where there may be problems.
14. Question: what will you do in areas of little data? Take an average?
• Lavenue- We haven’t seen all the data yet; however, an average per grid cell may be used with some input parameters. (Robert Grabeysch – responded that they [Waterstone] need the GW districts to gather/provide data for the model) Open discussion: Mace stated TWDB/USGS have collected water levels. For properties may need pump tests.
15. Question: Do the grids in the northern and central model areas overlay?
• Mace- No, they are oriented to generally match water flow direction. The models will share layer information but not necessarily model cell properties.
16. Question: Will the model cover well fields in the Gulf of Mexico?
• Lavenue - Currently had planned to shut model cells off in the Gulf. May use 10,000 ppm as limit.
17. Question: Discuss fact that Chicot disappears around Corpus Christi and cell
width. • Vertical cell width is based on layers. Vertical layer may have more
importance in some situations. This was discussed with USGS at an earlier meeting.
18. Question: Evageline has pockets of salt within freshwater – how is this
portrayed? • The model will not cover water quality transports. USGS suggested being
careful of salt pockets/fingers that occur around salt domes.
19. Question: Stakeholder lives 3 miles from Baffin Bay. How much intrusion occurs in his area? • Lavenue - Not much recharge but has good fresh water. Open
discussion: 3,000 ppm is used by TWDB and USGS to draw water line.
Central Gulf Coast GAM SAF Meeting Corpus Christi, Texas (4/27/01)
C:\Documents and Settings \MLavenue\Local Settings\Temporary Internet Files\OLK1E\FirstSAFGulfnotes.doc Page 4 of 4
This model will use available water quality data to depict these concentrations.
20. Question: If you pump too much what happens?
• Lavenue - Subsidence, salt water intrusion, or lowering of water table.
21. Question: Is the model considering subsidence? Salt water intrusion? • No, not at this time.
22. Question: Define sustainable yield.
• David Meesey (TWDB) stated: Model can be used to make decisions but need to know your question before we can use the model to answer. Sustainable yield, and available supply are a policy issue to be analyzed in a different forum and individual runs can be conducted by RWPG.
• Mace - The GAM can’t tell you an exact amount for sustainable pumping, due to all the regional and policy inputs and assumptions. It is a tool to evaluate various scenarios.
23. Question: Can you use logs for the Gulf?
• SAF answer - Many may have been shot too deep for our interests, since most information collected for oil and gas exploration.
24. Question: Is each block a layer? Is it thicker than the grid?
• Lavenue discussed example shown: Dolomitic regime with pumping well and 7 monitor wells. Only 8 meters thick but modeled in 2 layers since bottom layer was a fracture zone. This will be discussed in the conceptual plan after looking at all the data.
25. Question: What will the uncertainty based on your results become?
• Mace - you know the measured well point and the farther away you are, the more uncertain your results become. Lavenue also discusses how certain or uncertain you are about the model and conducting sensitivity analysis.
26. When is data and model available to everyone?
• Mace- January/February 2003
27. Will the SAF have training, and will it be available to everyone? • Mace - yes, training will be targeted for those who model but anyone can
attend.


