Gaming as Educational Technology and the Evaluation of Gaming Results
The Experiment of Sweden Game
Masashi Kawaguchi1,*, Takeshi Kougo1, Hideyuki Kanematsu1 and Norio Baba2 1National Institute of Technology, Suzuka College, Shiroko Suzuka Mie 510-0294, Japan
2Information Science, Osaka Kyoiku University, Asahiga-Oka, 4-698-1, Kashiwara City, Osaka 582-8582, Japan *Corresponding author
Abstract—In this research, we conducted the Sweden game and described its educational effect. The Sweden game is one way to determine cost-sharing for the construction of a pipeline. Three groups of about 40 students were used, with each group consisting of six teams. A good solution was obtained. Additionally, students learned practical methods, how to strategize, and how to bargain. We realized that this experiment resulted in a desirable educational effect. We also evaluated the results of the Sweden game.
Keywords-component; gaming; sweden game; students education
I. INTRODUCTION
In recent years, gaming has gradually been recognized by many people as a new and promising tool to deal with complex problems in which human decisions have far reaching effects on others. It has been used for various purposes such as education, training, decision-making, entertainment, and etc.[1]. Along with the appearance of various types of games, continuous effort has been put forth in order to make existing games more exciting [2].
FIGURE I. SIX REGIONS OF THE SOUTH-EAST AREA OF SWEDEN, PLANNING PIPE-LINE CONSTRUCTION.
In this research, we conducted the Sweden game and described its educational effect. The Sweden game is one kind of “Education Gaming”. Education Gaming attempts to educate and train all participants. For example, in one such game there was an assumption that participants did not have much interest in economics. After playing the game for a few hours, the participants noticed their lack of basic knowledge and felt the need to learn economics more deeply. The result was that this game had a very significant educational benefit [3].
The management game is a kind of Education Gaming which focuses on training. It is made for people working in a middle-class stage of companies. When a person is promoted to a position that has a direct impact on the management of a company, there is the possibility of significant “Risk”. This is because when a person who lacks experience is entrusted with important business, he or she may not know the appropriate action. To help in such a situation, playing a game which simulates the management of the company again and again will help enable the person to master "how to manage the company" without entailing a greater risk.
II. SWEDEN GAME
Figure 1 shows the six regions, A, H, K, L, M and T in the south area of Sweden. These six regions are planning to construct pipelines to cooperatively procure the water resource. The kinds of cooperation, A, H, K, L, M and T are 26-1=63. We show the cost for pipeline construction in Table 1. We show the population of each region and the spending quantity on water in Table 2. Of course, every area wants to minimize its financial expense for pipeline construction as much as possible. Under such a situation, what is the final conclusion? One method is the proportional distribution of an amount demand. Another method is the proportional distribution by population. Generally, these approaches are good determination methods. In this situation, it is necessary to construct in all regions the pipeline from the whole region viewpoint.
However, as shown in Tables 1 and 2, these are not necessarily proportional to the construction expense. When such difficulty arises, the method of dividing equally is often used. Table 2 shows the results of game playing by the water-resources staff and graduate school students of Sweden. Table 3 shows the assessed contribution according to the Shapley value, Nucleolus and SCRB. The result of game playing shown
2nd International Conference on Artificial Intelligence and Industrial Engineering (AIIE2016)
Advances in Intelligent Systems Research, volume 133
503
in Table 3 is considerably different from the result of an assessed contribution by the Shapley value, Nucleolus and SCRB in Table 4. It is very interesting that there are different values from the ratio of each district population or the ratio of each district amount of water demand [4].
TABLE I. THE COST OF PIPELINE CONSTRUCTION. (UNIT: 100,000 CRONE)
Team Cost Team Cost Team Cost Team CostA 219.5 KM 314.5 HKL 425.5 AKLM 639.6 H 170.8 KT 328.9 HKM 449.4 AKLT 707.2 K 108.1 LM 311.0 HKT 458.1 ALMT 734.1 L 158.8 LT 378.6 HLM 469.8 HKLM 480.7 M 208.1 MT 394.1 HLT 564.9 HKLT 492.4 T 219.8 AHK 407.4 HMT 420.1 HKMT 593.5
Our class of 14th grade College of Technology students have participated in the experiment since 2010. In Tables 5, 6 and 7, we show the results of the experiment of 7 terms for 43 students on Nov. 9, 2010. In Tables 8, 9 and 10, we show the results of the experiment for 4 terms for 46 students on Nov. 15, 2011.
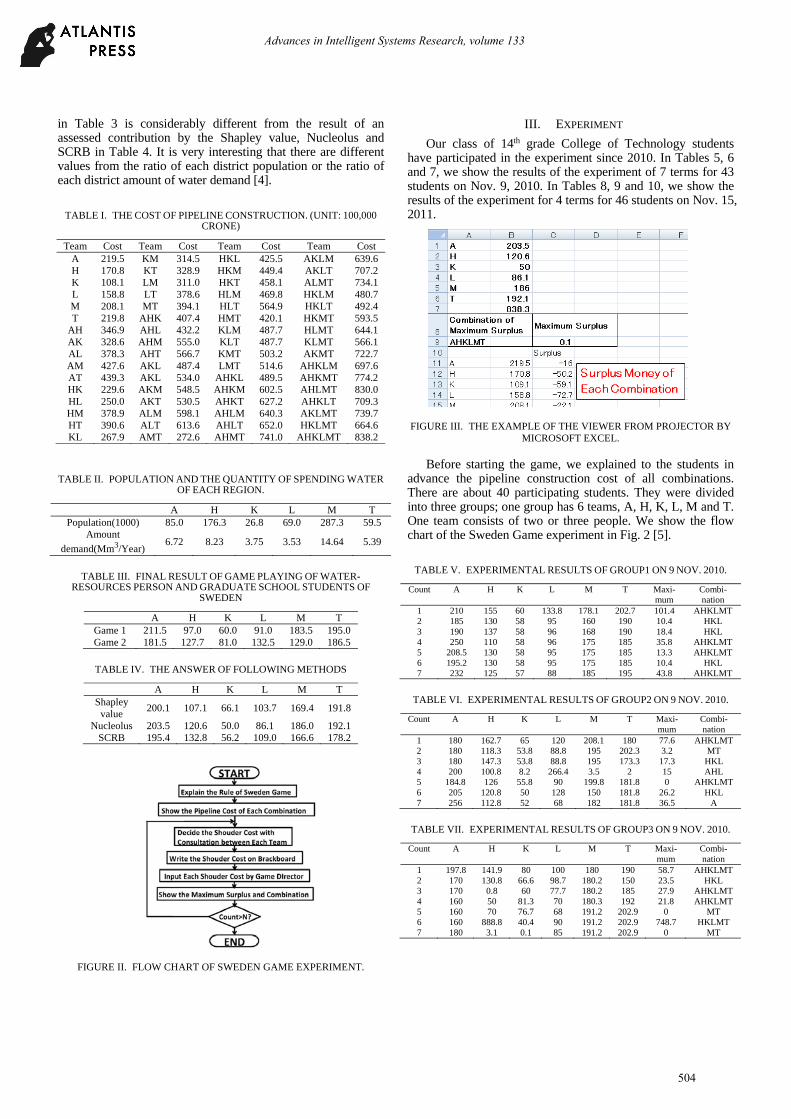
FIGURE III. THE EXAMPLE OF THE VIEWER FROM PROJECTOR BY MICROSOFT EXCEL.
Before starting the game, we explained to the students in advance the pipeline construction cost of all combinations. There are about 40 participating students. They were divided into three groups; one group has 6 teams, A, H, K, L, M and T. One team consists of two or three people. We show the flow chart of the Sweden Game experiment in Fig. 2 [5].
TABLE V. EXPERIMENTAL RESULTS OF GROUP1 ON 9 NOV. 2010.
We prepared the report sheet. When each team decided the shoulder charge, a player wrote down the cost on their report sheet and passed it to the game director. The game director inputted each term value in a laptop computer on the teacher’s desk. The maximum surplus value was calculated and the combination of teams was shown when the maximum surplus value was reached. These were calculated by Microsoft Excel and shown to the students by projector. We show the example of the viewer from projector in Fig. 3. The game director wrote down the shoulder charge of each team, the maximum surplus value and the combination of teams on the blackboard.
B. Experimental Results
Each team wants to decrease the amount of their contribution as much as possible. However, if one team tries to save on the shoulder cost, other teams may not join them. When each team cooperates with the others a surplus as large as possible can be attained.
However, the best condition is that 6 teams, "AHKLMT" construct a tie-up and the amount of the maximum surplus is just zero. Furthermore, in the situation where the maximum surplus is just zero for the 6 teams "AHKLMT" due to cooperation, it is important that each team saves the suitable shoulder cost.
Each team has about 10 minutes before deciding their shoulder cost. Consultation between each team is also allowed. The good solution was obtained by the 5th waging war of group 2 on the experiment of Nov. 2010. The good solution was obtained by the 4th waging war of group 1 on the experiment of Nov. 2011. In these situations the maximum surplus is just zero because of the 6 teams "AHKLMT" cooperation. On the other hand, when several teams made a combination “HKL”, at the 3rd waging war in Table.5, the team “AMT” was removed from the combination. Because team “AMT” proposed only little shoulder cost. However, at the 4th waging war in Table.5, team “AMT” proposed more shoulder cost, all 6 teams could make cooperation.
The square error by the 5th waging war of group 2 was 43.69. However, the square error by the 4th waging war of group 1 was only 19.08. The square error is the comparison with the Shapley value. We can get quite a good solution compared to the Shapley value.
FIGURE IV. THE SQUARE ERROR OF EACH GROUP ON 9 NOV. 2010.
TABLE XI. EXAMPLES OF GOOD ANSWER, EACH SHOULDER COST, COMBINATION IS “AHKLMT” MAXIMUM LESS THAN 2.0.
We showed only pipeline construction costs to students. Even though students did not know the Shapley value, we got the good results. In addition, we also got the very good solution, the maximum surplus equal zero. Figure 4 shows the sum of squared error between the game result and the Shapley value on 9 Nov. 2010. In Group 2 and Group 3, there is a portion of protruding large square error. The cause may be that students did not addressed situation seriously.
C. Evaluation of the Answers by Comparison with SHAPLEY Value
We had more experiments of 5 terms for 40 students on Nov. 20, 2012, 3 terms for 35 students on Nov. 25, 2013 and 4 terms for 46 students on Oct. 23, 2014. We obtained some good answers of Sweden Game for the past six years’ experiences from 2010 to 2015. Table 10 shows 6 examples of good answers. We picked up the data which the maximum surplus is less than 2.0 and the combination is “AHKLMT”.
Advances in Intelligent Systems Research, volume 133
505
TABLE XII. THE DIFFERENCE BETWEEN THE SHAPLEY VALUES OF TABLE.XI.
Result A H K L M T Max Remark 1 15.3 -18.9 10.3 13.7 -30.4 10 0 Group2,
They are considerably different from the result of an assessed contribution by the Shapley value. Table 12 shows the difference between the Shapley values. If this difference is a plus value, this team requires less shoulder costs. It means it is advantageous for the people in this district. In the case of the difference is a minus value, this team requires more shoulder costs. It means it is disadvantageous for the people in this district. However, team “A”,”K” and ”L” have an advantageous tendency. On the other hand, team “H”,”M” and ”T” have a disadvantageous tendency.
In Table 13, we show the cost of pipeline construction, combination “AKL” and “HMT”. In the combination of “AKL”, the subtotal cost is 486.4. However, combination cost is 487.4, it is higher than the subtotal cost which is a summation of each shoulder cost. It is the reason that the combination of “AKL” does not appear in the result of gaming. On the other hand, in the combination of “HMT”, the subtotal cost is 598.7. However, the combination cost is only 420.1. The team ”HMT” can save
the shoulder cost by making the combination. For the team “HMT”, in the combination of six regions, the shoulder cost is higher than in the combination of only three “HMT” regions. It is the reason why team “H”,”M” and ”T” have the disadvantageous tendency in table 12. In the result of gaming, we got the answer concerning the interest of each team.
For the past five years from 2010 to 2014, we divided the classroom into three groups. There were two or three people in one team. However, we have divided the classrooms into seven groups in the experience on October 29, 2015. There was only one person in one team. Thus the student could join the game aggressively without depending on others. All 7 groups and each 6 teams shoulder cost, the maximum-surplus and the combination are entered on the blackboard.Thus, participants can uplift the competitive spirit. Even though we have only three terms of gaming experience, we have the good answer shown in Table 14. Table 14 means 6 groups in the 7 groups get the complete solution, maximum-surplus is 0 and the combination is “AHKLMT”. Moreover, it is interesting that each shoulder cost has the variation between other groups. However, they got the good solution because the almost square errors were only 20 or 30 shown in Table 15 [6].
IV. CONCLUSION
We carried out the Sweden game. We created three groups of about 40 students. One group consisted of six teams. We had the good solution by the 5th waging war of group 2 on the experiment of Nov. 2010 and by the 4th waging war of group 1 on the experiment of Nov. 2011. The square error compared with the Shapley value was only 19.08 by the 4th waging war of group 1. On the experiment of Nov. 2015, even though we had only three terms of gaming experience, we had the good answer, the almost square errors were only 20 or 30. From students’ opinions, we believe that students learned practical methods and the way of strategy and bargaining. Students were also interested in this Sweden game. The education effect will increase by the fact that students play the game with interest. We realized that this experiment brought the educational effect. In the result of gaming, we got another answer concerning the interest of each team. It is different features than the Shapley value. Playing this game required teamwork in a stressful environment under the relationships of money and benefit. It is good real-world training for students.
REFERENCES [1] M. Shubik, “Games for Society Business and War,” Towards a Theory
of Gaming. Elsevier, Amsterdam, 1975.
[2] N. Baba, “PC-9801 Personal Computer Gaming System,” Nikkan Kogyo Publishing Company(in Japanese), 1986.
[3] N. Baba, L.C.Jain, H. Handa, “Advanced Intelligent Paradigms in Computer Games,” Springer, Heidelberg, 2007.
[4] N. Baba, Y. Takeuchi, M.Kawaguchi, “Foundations of Computer Information Processing and Applications (in Japanese) ,” Kyoritsu Publications, ISBN 978-4-320-12249-9, 2010.
[5] M. Kawaguchi, H. Kanematsu, N. Baba, “The Experiment of Sweden Game and the Effect of Students Education,” Frontiers in Artificial Intelligence and Applications Volume 243, pp1972-1980, 2012.
[6] M. Kawaguchi, H. Kanematsu, N. Baba, “The Experiment of Sweden Game and the Evaluations of Gaming Result,” Procedia Computer Science 60, 1170-1177, 2015.
Advances in Intelligent Systems Research, volume 133