INSTITUTO DE CIÊNCIAS BIOMÉDICAS ABEL SALAZAR GasparLobo. Effect of dietary seaweed supplementation on growth performance, antioxidant and immune responses in European Seabass (Dicentrarchus labrax) subjected to rearing temperature and salinity oscillations Effect of dietary seaweed supplementation on growth performance, antioxidant and immune responses in European Seabass (Dicentrarchus labrax) subjected to rearing temperature and salinity oscillations Gaspar Senosiain Mendes Lobo 2016 M .ICBAS 2016 MESTRADO Ciências do Mar – Recursos Marinhos. Effect of dietary seaweed supplementation on growth performance, antioxidant and immune responses in European Seabass (Dicentrarchus labrax) subjected to rearing temperature and salinity oscillations Gaspar Senosiain Mendes Lobo M
Transcript
INST
ITU
TO
DE C
IÊN
CIA
S B
IOM
ÉD
ICA
S A
BEL S
ALA
ZA
R
Gaspar Lobo. Effect of dietary seaw
eed supplementation on grow
th performance, antioxidant and
imm
une responses in European Seabass (Dicentrarchus labrax) subjected to rearing tem
perature and salinity oscillations
Effe
ct of d
ietary se
aweed su
pple
mentatio
n o
n gro
wth
perfo
rman
ce,
antio
xid
ant an
d im
mune re
sponse
s in E
uro
pean
Seab
ass (Dic
entra
rchus
labra
x) subje
cted to
rearin
g tem
peratu
re an
d salin
ity oscilla
tions
Gasp
ar Seno
siain M
end
es Lo
bo
2016
M.ICBAS 2
016
MESTRADO
Ciências do Mar – Recursos Marinhos.
Effect of dietary seaweed supplementation on
growth performance, antioxidant and
immune responses in European Seabass
(Dicentrarchus labrax) subjected to rearing
temperature and salinity oscillations
Gaspar Senosiain Mendes Lobo
M
Gaspar Senosiain Mendes Lobo
Effect of dietary seaweed supplementation on growth performance,
antioxidant and immune responses in European Seabass
(Dicentrarchus labrax) subjected to rearing temperature and salinity
oscillations.
Dissertação de Candidatura ao grau de
Mestre em Ciências do Mar – Recursos
Marinhos. Submetida ao Instituto de
Ciências Biomédicas de Abel Salazar da
Universidade do Porto.
Orientador – Doutor Rodrigo Otávio de
Almeida Ozório.
Categoria – Investigador Auxiliar, Prof.
Afiliado.
Afiliação – 1. Centro Interdisciplinar de
Investigação Marinha e Ambiental. 2.
Instituto de Ciências Biomédicas de Abel
Salazar da Universidade do Porto
Co-orientador – Professor José Fernando
Magalhães Gonçalves.
Categoria – Professor auxiliar,
Investigador.
Afiliação – 1. Instituto de Ciências
Biomédicas de Abel Salazar da
Universidade do Porto. 2. Centro
Interdisciplinar de Investigação Marinha e
Ambiental.
Funding acknowledgements
This MSc thesis was supported by the project MODELFISH - Modelo Preditivo de Ingestão
Alimentar como Ferramenta de Controlo Ambiental em Produção Aquática (referecence
31-03-01-FEP-0152), funded by PROMAR and co-funded by the European Fisheries Fund
(EFF).
Acknowledgements
Gostaria inicialmente de agradecer ao Dr. Rodrigo Ozório e ao Dr. Fernando Gonçalves
por me terem dado a oportunidade de fazer esta tese. Em maior pormenor, agradeço ao
Dr. Rodrigo Ozório ter depositado em mim a confiança para esta etapa da minha formação,
durante a qual realmente senti que contribuiu bastante para a evolução da minha
capacidade de trabalho e formação pessoal. Agradeço ainda à Dra. Teresa Baptista, pela
oportunidade que me proporcionou de forma a complementar a minha formação.
Gostaria ainda de agradecer a toda a equipa do LANUCE com a qual trabalhei, sem a qual
seria impossível este trabalho. Particularmente, o meu grande obrigado ao Luís Pereira e
Maria João Peixoto por me aturarem e apoiarem durante todo este percurso, quer como
colegas, mas também como amigos.
De uma forma mais pessoal agradeço a todos os meus amigos e família que de uma forma
ou outra me ajudaram.
O meu obrigado às mulheres da minha vida, à Sara, à minha mãe e irmã que sempre me
apoiaram de forma incondicional e me proporcionam mais do que poderia pedir.
Finalmente, obrigado avô.
1
Abstract Aquaculture is considered to be the fastest growing animal food-producing sector. The
increase in world fish per capita consumption, followed by the growing percentage of the
supply that derives from aquaculture, leads to high demand for more efficient fish
production. However, the intensification of aquaculture production brought some
constraints. In intensive aquaculture, fish are exposed to several, biological, chemical
and/or physical stressors. The decrease in water quality may reduce fish performance and
welfare, also increasing the risks of diseases outbreaks. Fungi, bacterial, and viral diseases,
as well as suboptimal abiotic conditions are a common cause of growth inhibition and mass
mortalities.
Until recently, intensive aquaculture production relied on the use of antibiotics for treatment.
However, strict regulations are limiting the over-use of antibiotics aiming at preventing
antibiotic resistant bacteria and minimizing consumer’s health risk. Vaccination is one of the
most effective methods of controlling disease but the development of vaccines against
intracellular pathogens has not been successful so far.
The use of immunostimulants appears to be an alternative to antibiotics and vaccines.
These components increase resistance to infectious disease and immune competency, not
by enhancing specific responses, but by enhancing non-specific mechanisms. The use of
immunostimulants, in addition to chemotherapeutic agents and vaccines, is now widely
accepted by fish farmers. Still, many questions remain unanswered about the efficiency of
immunostimulants, such as whether they can protect against all infectious diseases. Dietary
supplementation with immunostimulant substances seems to be a logical step to prevent
fish diseases or to lower stress levels, particularly when fish are subjected to environmental
oscillations, such as temperature and salinity.
This study evaluated the effect of dietary seaweed mix supplementation in European
seabass (Dicentrarchus labrax) subjected to rearing temperature and salinity oscillations.
Two experimental diets where formulated, a control and a supplemented one, with 7.5%
seaweed mix (2.5% Fucus, 2.5% Gracilaria and 2.5% Ulva). Three trials were conducted,
where salinity and temperature oscillated separately (trials 1 and 2) or simultaneously (trial
3), simulating natural variations in an aquaculture farm. Growth performance, immune and
oxidative stress responses were analyzed.
In trial 1 (salinity), fish fed diets supplemented with seaweed showed lower growth
performance than the control diet (P<0.05). Trial 2 (temperature), the seaweed diet
increased lysozyme activity (P<0.05). In trial 3 (simultaneous oscillation of salinity and
2
temperature), dietary seaweed supplementation did not affect the parameters analyzed.
TABLES LIST ................................................................................................................................................. 6
FIGURES LIST ............................................................................................................................................... 7
CURRENT STATE OF AQUACULTURE ...................................................................................................................... 11
EUROPEAN SEABASS (DICENTRARCHUS LABRAX, LINNAEUS, 1758) ............................................................................ 13
IMMUNE SYSTEM ............................................................................................................................................. 14
TEMPERATURE ................................................................................................................................................. 18
USE OF IMMUNOSTIMULANTS ............................................................................................................................ 21
FISH AND EXPERIMENTAL FACILITIES ..................................................................................................................... 32
TRIAL 2: TEMPERATURE ................................................................................................................................... 40
TRIAL 3: SALINITY AND TEMPERATURE ................................................................................................................ 43
conditions caused an increase in cortisol levels in Solea senegalensis, Sparus aurata, and
salmonid fishes (Pickering and Pottinger, 1989; Pickering, 1992; Montero et al., 1999;
Sangiao‐Alvarellos et al., 2005; Costas et al., 2008). High densities also negatively affect
growth, feed intake and/or feed conversion ratios (Pichavant et al., 2001; Ellis et al., 2002;
Person-Le Ruyet et al., 2003; Lemarie et al., 2004; Björnsson and Ólafsdóttir, 2006).
12
Additionally, suboptimal biotic (e.g. fungi, bacterial, and viral diseases) and abiotic (e.g.
temperature, salinity, dissolved oxygen) conditions are common causes of growth inhibition
and mass mortalities. Until recently, intensive aquaculture production relied on the use of
antibiotics for treatment (Bagni et al., 2000). However, current strict regulations are limiting
the use of anti-biotics aiming to prevent antibiotic resistant bacteria and to minimize
consumer’s health risk (Cook et al., 2003). Chemical therapy, for example, is used in
aquaculture even though it represents a potential environmental hazard and could also have
negative effects on the fillet quality (Bagni et al., 2000). Multiple chemotherapeutics were
used in the past 20 years to treat bacterial infections in fish cultures, but the incidence of
drug-resistant bacteria has risen to be a major problem in fish culture (Aoki, 1992). Vaccines
are used to reduce the risk of diseases, but the effectiveness is limited to few biological
agents (Sakai, 1999). For instance, vaccines against intracellular pathogens have not been
successful so far, and so, they are not a solution that covers all diseases (Sakai, 1999). The
use of immunostimulants, in addition to chemotherapeutic agents and vaccines, is now
widely accepted by fish farmers (Bricknell and Dalmo, 2005), appearing to be an effective
alternative and/or complement to traditional methods. Immunostimulants increase
resistance to infectious diseases and increase immunocompetency, not by enhancing
specific responses, but by enhancing non-specific mechanisms. This response is usually of
short duration and no memory component is involved (Sakai, 1999). However, many
questions remain about the efficacy of immunostimulants such as, whether they can protect
against all infectious diseases (Sakai, 1999). Other approaches, such as dietary
supplementation seem to be a logical step to prevent fish disease or lower stress levels,
particularly when subjected to abiotic oscillations, such as temperature and salinity.
13
EUROPEAN SEABASS (Dicentrarchus labrax, Linnaeus, 1758)
European Seabass (Dicentrarchus labrax) was chosen as a model species. It
belongs to the Chordata Phylum, Actinopterygii Class, Perciformes Order, Percoidei
Suborder, Moronidae Family and Dicentrarchus Genus. It possesses an elongated body,
males can reach 1 meter length, weight up to 12 kg and live up to 3 decades. Adults have
a bright silver tone throughout the body and juveniles tend to be slightly darker with black
spots over the back (Fishbase, 2016). European seabass can be found from Eastern
Atlantic to Morocco, Canary Islands, Senegal, Mediterranean and Black sea. It is a
gonochoristic species, with both sexes found in separate individuals. Spawning occurs in
batches and the males and females gather in large groups at open sea. There is only one
breeding season per year, which takes place in the winter (December to March) in the
Mediterranean population, and up to June in Atlantic populations. Young larvae are then
passively transported to nursery areas, such as shallow water lagoons and estuaries. These
remain in creeks, estuaries, backwaters, and shallow bays through their first and second
years, after which they migrate to over wintering areas in deeper waters, returning to larger
estuaries in the summer (ICES, 2013). Since it is a euryhaline (3 ‰ to full strength sea
water) and eurythermic (5-28 °C) marine species, it can inhabit different environments. It
can survive a wide range of salinities, between the sea, the brackish river estuaries and the
Mediterranean lagoons (Tsevis et al., 1992); (Dalla Via et al., 1998). European seabass
spends the early and more susceptible life stages in European estuaries and coastal areas
where the impact of temperature variation is higher in a daily and seasonal basis, in addition
to the increasing temperature due to global warming. It is a carnivore fish that feeds mainly
on crustaceans, mollusks and other fish. Adults tend to wander often alone, predating fish,
while juveniles form shoal groups in search for small crustaceans and mollusks. This fish
species has high ability to adapt to different prey, water and bottom compositions (FAO,
2014).
Barnabé (1990) recognized the fish as a new species for cultivation and as an
exploited resource in need for conservation and management. Currently, European
seabass is a popular and valuable species for commercial aquaculture in the Mediterranean
(Conides and Glamuzina, 2006) where 80% of total production is in Europe, providing a
revenue of 380 million Euros in 2009, followed by Egypt, with Greece being the biggest
exporter (INE, 2013). In 2010, Portugal reported a production of 400 tons, very low
compared to its European partners (INE, 2013). Despite the growth in volume,
overproduction of this species in the last two decades has led to a decline in sales price,
currently at 5 USD/kg. Nevertheless, it continues to be a highly desirable product in the
14
European markets (FAO, 2012) and improving feeding and production strategies is crucial
for the development of the sector.
IMMUNE SYSTEM
Aquaculture’s rapid development has increased the frequency of disease outbreaks.
It is well documented that the occurrence of a fish disease depends on the balance between
host, pathogen, and environment, three factors with continuous interaction (Roberts, 2012).
Fish defense system is very similar to that described in mammals (Hoar et al., 1997) and,
as in other vertebrates, the innate immune system of fish provides the first defense line.
From a phylogenetic point of view, the fish immune system has received interest since fish
were the first vertebrates showing the basic aspects of the immune system, such as true
lymphocytes, lymphoid tissues, antibody production, T cell cytotoxicity and long term
memory (Koumans-van Diepen, 1993). Teleost lymphoid system encompasses thymus,
head kidney, spleen and mucosal associated to lymphoid tissue. These, together with
cellular components, display humoral and cellular immune responses such as non-specific
cell-mediated cytotoxic and microbial killing (Scapigliati et al., 2002).
Regarding cellular defense systems, teleosts possess phagocytic cells similar to
macrophages, neutrophils, and natural killer cells (NK), and also T and B lymphocytes.
Teleosts have multiple humoral defense components like complement (classical and
alternative pathways), lysozyme, natural hemolysin, transferin and c-reactive protein. The
presence of cytokines (interferon, interleukin 2, macrophage activating factors) was also
reported (Secombes et al., 1996). Immunostimulant treatments using glucan (Yano and
Mangindaan, 1989; Chen and Ainsworth, 1992; Jørgensen and Robertsen, 1995; Sakai,
1999), lactoferrin (Sakai et al., 1993), levamisole (Kajita et al., 1990), FK-565 (Kitao et al.,
1987), chitin (Sakai et al., 1992), and EF203 (Yoshida et al., 1993) have shown to cause an
enhancement activity of phagocytic cells.
Complement system
The complement system is a particularly important first line of innate immune
response, and is, therefore, well studied in fish. The complement system consists of a
complex enzyme cascade and is composed of several inactive glycoproteins, which can be
activated by one of the three known activation routes: classical, alternative, and lectin-
mediated. It is composed of more than 35 soluble plasma proteins which are expressed in
the liver and released into the plasma. The functions of the complement system include lytic
activity (for viruses, bacteria, and parasites) and neutralization of pathogenic exotoxins. The
15
activated proteins can also provide an alert of potential pathogens present in the host,
hence contributing to the degradation of pathogens through the recruitment of immune cells
and through opsonization (Boshra et al., 2006). Fish complement system has been showed
to be affected by light exposure (Angeles Esteban et al., 2006), environment temperature
(Tort et al., 1998), diet (Geay et al., 2011), and more directly correlated, infections (Henry
et al., 2009).
Peroxidase
Both neutrophils and macrophages are important innate system components that
protect the organism against microbial infection. The functions of both cells include
phagocytosis, chemotaxis and bactericidal activity (Katzenback et al., 2012). Upon
activation, neutrophils release hydrogen peroxide and myeloperoxidase (EC 1.11.2.2), a
heme-containing lysosomal glycoprotein, found predominantly in neutrophils azurophilic
granules, and in much lower amounts in monocytes and some tissue macrophages.
Myeloperoxidase then catalyzes chloride ions and the hydrogen peroxide to form
hypochlorous acid, damaging the invading microorganisms (Klebanoff, 1968). Similar to
neutrophils myeloperoxidase, eosinophils produce an eosinophillic peroxidase (EC
1.11.1.7), consisting of a heavier glycosylated chain and a lighter non-glycosylated chain.
This enzyme prefers bromide over chloride as substrate, converting it to hypobromite which
is toxic to infecting pathogens (Bielek, 1981).
Peroxidases, released from the cytoplasmic granules of phagocytes, take part in the
oxidative responses against pathogens. Serum peroxide levels are known to increase in
response to infection (Alvarez-Pellitero, 2008). Therefore, peroxidases released into the
blood are often used as an indicator of the immunologically active status of circulating
leucocytes.
Lysozyme
Lysozyme was the first natural antibiotic isolated from humans in 1922 by Mr.
Alexander Fleming (Nakatsuji and Gallo, 2012). As a glycoside hydrolase enzyme,
lysozyme (EC 3.2.1.17) can damage bacterial cell walls by catalyzing hydrolysis of 1,4-beta-
linkages between N-acetylmuramic acid and N-acetyl-D-glucosamine residues in a
peptidoglycan and between N-acetyl-D-glucosamine residues in chitodextrins. Hence,
lysozyme is a useful tool when dealing with pathogens, especially gram positive bacteria,
as these have a peptidoglycan outer layer. With leucocyte origin, lysozyme is widely
distributed in bacteriophages, microbes, invertebrates and vertebrates and is found in a
large variety of animal secretions such as mucus, saliva, and blood (Jollès and Jollès,
16
1984). Studies have shown that plasmatic lysozyme activity can be modulated by several
factors. Lower temperatures have been shown to decrease lysozyme activity in gilthead
seabream (Sparus aurata) (Tort et al., 1998), but a less linear correlation was found in Nile
tilapia (Oreochromis niloticus), where a slight increase in temperature revealed to increase
lysozyme before a plateau was reached (Dominguez et al., 2005). Also, dietary
supplements of probiotic yeast (Saccharomyces cerevisiae) have shown to improve
lysozyme activity as well (Torrecillas et al., 2007).
OXIDATIVE STRESS
The liver has been the focus of toxicological studies and has, indeed, been shown
to be a very sensitive organ to oxidants presence (Ameur et al., 2012). Therefore, it is
accepted that the monitoring of antioxidant enzymes activities in the liver may create a good
evaluation of the antioxidant state.
Oxidative damage levels and energetic metabolism parameters are among the most
commonly used biomarkers of fish health status (Van der Oost et al., 2003). Levels of lipid
peroxidation (LPO) are good indicators of reactive oxygen species (ROS) overproduction
and induced oxidative damage in cells (Livingstone, 2001; Limón-Pacheco and Gonsebatt,
2009).
A consequence of all aerobic life is the production of potentially harmful, partially
reduced species of molecular oxygen radicals (ROS) which occur as a result of normal
oxygen metabolism. It has been estimated that about 1 to 3 % of O2 consumed in animal
systems is converted into ROS, generated by physical, chemical, and metabolic
processes(Livingstone, 2003). These convert O2 into reactive oxygen species, such as
superoxide, hydroxyl radicals and non-radical hydrogen peroxide or even singlet oxygen.
Most ROS production occurs by the auto-oxidation of the mitochondrial electron transport
chain, microsomal cytochrome P-450 and flavor-protein reductases (Livingstone, 2003).
Although ROS supply the body with humoral innate protection against pathogens, in
peroxidases parameter, disturbances in the normal redox state of cells can cause a toxic
effect, damaging cell components, including proteins, lipids and DNA. Furthermore, severe
oxidative stress can trigger apoptosis, while prolonged extreme oxidative damage may
cause tissue necrosis (Zong and Thompson, 2006). These effects depend upon the size of
these changes. A cell can be able to overcome small perturbations and regain its original
state, without further damage. Only when the production of these aggressions overcome
17
the organism defense capabilities, does the animal enter the oxidative stress condition
(Finkel and Holbrook, 2000).
ROS production can be induced by external factors, with the environmental pollution
being one of the most studied. Transition metals (Cu, Fe) represent a major path of
environmental oxidation, as they catalyze the production of hydroxyl radicals through
Fenton reaction. Other chemicals like biphenyls, quinones, and nitroaromatics can also
induce superoxide production by redox cycling (Sevcikova et al., 2011).
Environmental disturbances may induce ROS production since it does not always
require physical or chemical hazardous conditions. In aquaculture, several events common
to daily maintenance may cause stress to fish, hampering their health and growth
performances. Previous studies suggested that oxidative stress in aquaculture fish can be
correlated to several types of stressful conditions, such as feed composition (Olsen and
Henderson, 1997), feed deprivation (Pascual et al., 2003), crowding (Bagni et al., 2007),
hypoxia (Guerriero et al., 2002), acute thermal conditions (Vinagre et al., 2012), and
infectious diseases (Ali et al., 2011).
Olsen et al. (2002) and Olsen et al. (2005) described some negative effects of ROS
in the enterocytes lining and junctions of Atlantic salmon (Salmo salar) and rainbow trout
(Oncorhynchus mykiss) submitted to an acute stress, causing a decrease in feed digestion.
Vinagre et al. (2012) observed that seabass subjected to suboptimal temperatures showed
an increased in lipid peroxidation and catalase activity, showing that temperature deviations
may cause responses similar to environmental contaminants (Vinagre et al., 2012).
Antioxidant systems can be divided into two categories: enzymes, such as
superoxide dismutase (SOD), catalase (CAT) and peroxidases; and free radical
scavengers, such as carotenoids, peptides, amino acids and phenolic compounds. These
systems are capable of preventing cell membrane damages, enzyme inactivation and
nucleic acid alterations caused by ROS (Bragadóttir, 2001).
In a closer description of antioxidant enzymes: CAT (EC 1.11.1.6.) catalyses the
decomposition of hydrogen peroxides to water and oxygen and is interpreted as a protector
against hydrogen peroxide. Glutathione peroxidase (GPX) (EC 1.11.1.9.), reduces lipid
hydro-peroxides to their corresponding alcohols and reduces free hydrogen peroxide to
H2O, using a co-factor, glutathione (GSH). Glutathione reductase (GR) (EC 1.8.1.7), is an
enzyme responsible for recovering oxidized glutathione (GSSG) to its useful state (GSH).
Glutathione s-transferase (GST) (EC 2.5.1.18), another glutathione (GSH) dependent
enzyme, neutralizes xenobiotics, inhibiting these to cause cell damage (Eroglu et al., 2015).
18
Finally, total glutathione levels (TG), a sum of both GSH and GSSG, a tripeptide that when
in its reduced form works as an electron donor to GPX, also as cofactor for GST, in addition
to being a direct thiol-based antioxidant. Recent studies suggest that although GSH/GSSG
ratio may indicate a prompter antioxidant state, a reduction in total glutathione levels may
indicate high utilization of GSH (Eroglu et al., 2015). These molecular parameters constitute
the first line of antioxidant enzymatic defenses and are used as biomarkers for oxidative
stress condition in a variety of marine and freshwater organisms (Eroglu et al., 2015). Lipid
oxidation is the most used approach in free radical research once most aquatic organisms
contain lipids with high amounts of polyunsaturated fatty acids (Lushchak and Bagnyukova,
2006). Since lipids are oxidized usually through the formation of peroxides, the process of
their formation has been called “lipid peroxidation”, and is quantified to determine the
degree of damage that may have been caused by ROS over the lipid layers. As this damage
is avoided when antioxidant enzymes surpass the oxidants action on cell, this parameter
may indicate the organism vulnerability (Lushchak, 2011).
TEMPERATURE
One of the most important environmental factor affecting the biochemical and
physiological processes of aquatic organisms is water temperature (Reynolds and
Casterlin, 1979). As stated by Sengupta and Garrity (2013) “temperature is an omnipresent
physical variable reflecting the rotational, vibrational and translational motion of matter”. For
what matters in biology, temperature decides a great part of a species success and possible
proliferation, mostly due to temperature’s ability to mold matter. Temperature dominant
modulations can affect proteins and lipids re-conformation, as well as genetic modulation,
playing as an on/off trigger in genetic transcription, translation or path activation (Sengupta
and Garrity, 2013). A more immediate effect is the increase of kinetic energy in molecules,
such as enzymes, since temperature can make molecule collisions more frequent, enabling
the enzyme-subtract complex to occur more persistently, hence increasing the reaction rate
(Cornish-Bowden, 1979). For this reason, the control of the metabolic activity by
temperature is considered key for fish to optimize their ecosystem efficiency (Magnuson et
al., 1979). There are also other environmental factors, such as oxygen and salinity, that
represent potential determinants of fish metabolic state, being responsible for physiological
and/or behavioral changes (Priede, 1985). Temperature variations strongly impact fish due
to the lack of body insulation (they are poikilotherms), and the blood-water counter current
respiratory system in the gills (Schmidt-Nielsen, 1997; Beitinger et al., 2000). These kind of
alterations induce an initial stress phase (thermal stress) with the formation of reactive
19
oxygen species (ROS), which can damage protein, lipids or DNA, and potentially increase
energy demands/requirements (Lushchak and Bagnyukova, 2006).
The adult European seabass can withstand temperatures ranging from 2 to 32 ºC
(Barnabé, 1990), with an optimum temperature of 22 °C to 25 °C for best growth and feed
utilization performance (Person-Le Ruyet et al., 2004). During autumn, the falling of sea
temperature below 10ºC is associated with their migration into deeper, less cold waters
(Pickett and Pawson, 1994). Also, temperature has shown to modulate the immune system,
protein expressions (Sarropoulou et al., 2010) and antibody response (Cecchini and
Saroglia, 2002).
SALINITY
Growth performance of marine species is related to water salinity (Imsland et al.,
2007). Indeed, both salinity and temperature have been recognized as two of the most
important abiotic factors that can affect the biological metabolism in fish (Mosser and
Hettler, 1989; Dalla Via et al., 1998). The energetic costs of ion regulation are generally
observed to be lowest in an isosmotic environment, hence it has been hypothesized that
this energy saving may be substantial enough to increase growth (Morgan and Iwama,
1991).
Salinity seems to modify multiple aspects related to growth, including standard
metabolic rate (Dutil, 1997), feed intake and feed conversion efficiency (Imsland et al.,
2007) and the balance of hormones involved in overall metabolism (Bluf, 2001). Still, this
response differs depending on the species. Atlantic cod (Gadus morhua) (Lambert et al.,
1994) and freshwater catfish (Mystus vittatus) (Arunachalam and Reddy, 1979) have higher
feed conversion efficiency in low salinities (< 14‰), whereas European seabass (Dendrinos
and Thorpe, 1985), juvenile flounder (Platichthys flesus) (Gutt, 1985), and gilthead
seabream (Sparus aurata) (Conides et al., 1997) plateau at intermediate salinities (14–
28‰). Also, growth rates of European seabass were observed to be higher at salinities
above 28-30‰ (Fig. 1) (Conides and Glamuzina, 2006). Seabass of all ages can tolerate
freshwater, but it seems that osmoregulation and sexual maturation in brackish waters are
incompatible. According to Zanuy and Carrillo (1984), fish kept in brackish water (3‰)
managed to complete vitellogenesis and spermatogenesis but cannot release gametes.
Euryhaline fish adaptation to changing salinities induces changes/activation of ion
transport mechanisms. This is usually accompanied by changes in oxygen consumption,
suggesting variation in the energetic demands for osmoregulation (Sangiao-Alvarellos et
20
al., 2003). Changes in oxygen consumption can lead to variations in whole body metabolism
(Sangiao-Alvarellos et al., 2003). This metabolic response to different osmotic conditions
includes both stress and osmoregulation components, but the energy demands of each
process cannot be discerned from the whole fish energy allocation (Sangiao-Alvarellos et
al., 2003). The weight of environmental salinities on growth rate in fish also needs further
study (Boeuf and Payan, 2001).
The tolerance to hypotonic environment is an important physiological ability that is
observed in marine fish species in estuarine ecosystems (Day, 1989; Blaber, 1997). There
have been many studies on salinity tolerance in salmonids and freshwater fish (Morgan and
Iwama, 1991), but very few investigated the tolerance of marine and estuarine species to a
range of salinities (Partridge and Jenkins, 2002).
Figure 1: Relationship between maximum growth rates and salinity for European seabass, Dicentrarchus labrax, and Gilthead seabream, Sparus aurata, juveniles (Conides and Glamuzina, 2006).
21
Table 1: Maintenance requirement (m) was found to increase with decreasing salinity (Conides and Glamuzina, 2006).
USE OF IMMUNOSTIMULANTS IN AQUAFEEDS
An immunostimulant could be defined as a “naturally occurring compound that
modulates the immune system by increasing the host’s resistance against diseases that in
most circumstances are caused by pathogens’’ (Bricknell and Dalmo, 2005). These
compounds increase resistance to infectious diseases by enhancing non-specific defense
mechanisms (Sakai, 1999), which may occur before any exposure to a pathogen, improving
survival (Sakai, 1999). Immunostimulants can be grouped according to their origin: bacterial
(e.g. glucans), algae-derived, animal-derived (e.g. chitosan), nutritional factors, and
hormones (cytokines and others) (Sakai, 1999). They can also be used in dietary
supplementation due to the relatively low cost of their source ingredients (Bricknell and
Dalmo, 2005). Immunostimulants, used as dietary supplements, can improve the innate
defenses of fish, providing better resistance to pathogens during periods of greater stress
(transport, grading, netting, etc.) (Bagni et al., 2000).
Nowadays, the use of dietary immunomodulators is widely accepted in aquaculture.
Glucans in salmon diets were one of the first applications of immunostimulants in
aquaculture, showing effectiveness in managing disease outbreaks after stressful events
(Bricknell and Dalmo, 2005). In hybrid sturgeon (Acipenser ruthenus x A. baerii) (Jeney and
Jeney, 2002) and turbot (Scophthalmus maximus) (Low et al., 2003), glucans proved to be
effective on non‐specific defense mechanisms. Long term usage of glucans in seabass has
been reported benefits regarding alternative pathways of complement activation and
lysozyme activity (Bagni et al., 2000), and currently there are commercial diets
supplemented with nucleotides that have been proven to reduce sea lice settlement and
provide protection against Aeromonas salmonicida and Vibrio anguillarum infection
22
(Burrells et al., 2001). Also, the use of immunostimulants in vaccine formulations has given
very good antibody responses when used either to replace oil based adjuvants, without the
adverse side effects that have been reported for these types of adjuvants, or in addition to
them (Ogier de Baulny et al., 1996).
Introduction of dietary immunostimulatory substances in Mediterranean fish farms
has been done in an empirical way and there is little information available on their effects.
An increase in lysozyme and complement activities was observed by Obach et al. (1993) in
European seabass juveniles when fed high levels of α-tocopherol. Enhanced phagocytic
activity was reported in 1-year-old seabass fed a diet supplemented with levamisole and
glucans (Jeney et al., 1994). In vivo effects of immunostimulants in fish are described as
anti-parasitic (including reduced settlement of sea lice), growth enhancement, increased
antibody production following vaccination, increased lysozyme levels and increased
survival after bacterial challenges (Bricknell and Dalmo, 2005).
However, the use of immunostimulants can bring unforeseen drawbacks, especially
to fish larvae. In Atlantic salmon, when glucans were used as immunostimulants, antigen
competition has been observed, suggesting the presence of mechanisms for the induction
of tolerance (Killie and Jørgensen, 1994). This has also been studied for other species
(Waagbø et al., 1994). Other problems may include those associated with diets’ palatability
and group hierarchies, where the dominate fish will ingest significantly more feed, thus more
immunostimulants than the subordinate fish (Bricknell and Dalmo, 2005).
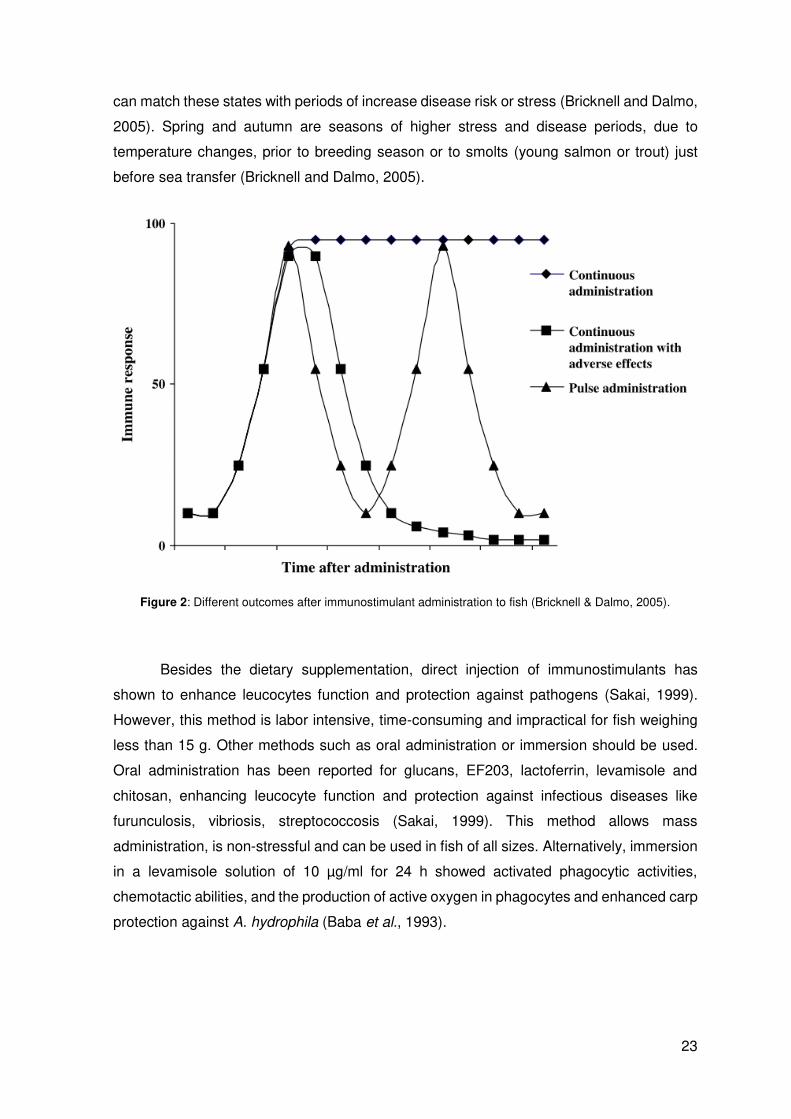
According to Bricknell and Dalmo 2005, “immunologically mature fish are those who
have undergone metamorphosis and have fully developed range of immune responses.”
Immunostimulant dietary supplementation in mature fishes only contemplates two effective
strategies. The continous feed or pulse feed. With continuous feeding, fish can respond by
maintaining the immune system up-regulated in high levels until the immunostimulant is
withdrawn or, more often, until it induces tolerance. This tolerance is built by the immune
system of the fish becoming de-sensitized to the immunostimulant. Continued exposure
can, in extreme circumstances, cause the immune response to be suppressed, giving the
host a lower level of innate defenses (Bricknell and Dalmo, 2005). To overcome this
condition, the most common technique used for adult fish is pulse feeding (Fig. 2). This
usually takes 4 to 6 weeks, so as to up-regulate the immune response. Then, the
immunostimulant is withdrawn for the same period and the immune system stimulation
drops back to the resting level before another dose of the immunostimulant is given
(Bricknell and Dalmo, 2005). This forces the immune system of the host to oscillate from
resting state to an enhanced response, which provides greater flexibility, since the farmer
23
can match these states with periods of increase disease risk or stress (Bricknell and Dalmo,
2005). Spring and autumn are seasons of higher stress and disease periods, due to
temperature changes, prior to breeding season or to smolts (young salmon or trout) just
before sea transfer (Bricknell and Dalmo, 2005).
Figure 2: Different outcomes after immunostimulant administration to fish (Bricknell & Dalmo, 2005).
Besides the dietary supplementation, direct injection of immunostimulants has
shown to enhance leucocytes function and protection against pathogens (Sakai, 1999).
However, this method is labor intensive, time-consuming and impractical for fish weighing
less than 15 g. Other methods such as oral administration or immersion should be used.
Oral administration has been reported for glucans, EF203, lactoferrin, levamisole and
chitosan, enhancing leucocyte function and protection against infectious diseases like
furunculosis, vibriosis, streptococcosis (Sakai, 1999). This method allows mass
administration, is non-stressful and can be used in fish of all sizes. Alternatively, immersion
in a levamisole solution of 10 µg/ml for 24 h showed activated phagocytic activities,
chemotactic abilities, and the production of active oxygen in phagocytes and enhanced carp
protection against A. hydrophila (Baba et al., 1993).
24
SEAWEEDS
Use of seaweeds in aquafeeds
Over the past decade, extensive efforts have been made worldwide to evaluate a
wide range of novel ingredients for fish feeds either as protein sources or as feed additives
(Wassef et al., 2013). At least since the 1980’s, seaweeds have been studied to be included
in fish feeds due to their nutritional quality (Montgomery and Gerking, 1980). Recently, the
studies on the dietary seaweed supplementation in fish feed has increased significantly due
to their good source of protein (Valente et al., 2006; Dantagnan et al., 2009), amino acids
and fatty acids (Wahbeh, 1997; Soler-Vila et al., 2009), vitamins and minerals, and as a
coloring agent (Kissil et al., 1992; Soler-Vila et al., 2009). In addition, seaweeds are a source
of biologically active compounds with great benefit for both humans and animals (Mustafa
and Nakagawa, 1995; Nakagawa, 1997). Several studies reported that supplementing fish
with macroalgae led to a considerable enhancement in growth rate, flesh quality and diet
utilization (Wassef et al., 2001; Valente et al., 2006; Dantagnan et al., 2009). They were
also successfully used as feed attractant for several fish species (Nakajima et al., 1989;
Nakajima, 1991; Shields and Lupatsch, 2012).
Many authors have previously shown that different species of seaweed, such as
Ascophyllum nodosum (Nakagawa et al., 1997), Gracilaria cornea and Gracilaria bursa-
pastoris (Valente et al., 2006), Porphyra sp. (Soler-Vila et al., 2009), and Ulva lactuca
(Wassef et al., 2001) can be used as up to 10% of dietary fishmeal replacement.
Even though seaweeds represent a potential food alternative, they can hold certain
substances with some level of toxic and anti-nutrient activity, which can contribute to the
reduction of its nutritional value and have a negative impact on fish growth (de Oliveira et
al., 2009). Anti-nutrients have been defined as substances which by themselves, or through
their metabolic products, interfere with food utilization and can affect the health and
production of animals (Makkar, 1993). Anti-nutritional factors, such as lectins, protease
inhibitors, goitrogens, allergens, anti-vitamins, saponins, tannins, phytate and toxins, are
widely distributed in plants and seaweeds. Also, multiple negative effects caused by these
anti-nutritional factors incorporation in fish diets have been reported. Thus, the wide
selection of these new food sources needs to previously consider the presence of anti-
nutritional factors (Liener, 1994; Francis et al., 2001; Bajpai et al., 2005).
25
Production of seaweeds
Seaweeds are the main representative of aquatic plant aquaculture, which
production is practiced in about 50 countries (FAO, 2016). In the last decades, seaweed
production has been increasing but still, commercial scale cultivation remains restricted to
a few species (Buschmann et al., 2001; Nagler et al., 2003). Even so, nitrogen-enriched
conditions such as aquaculture effluents, are good conditions to enhance seaweed protein
content (Lahaye et al., 1995; Pinchetti et al., 1998). Seaweeds produced in integrated
multitrophic aquaculture (IMTA) systems have high productivity levels and less variability in
protein content than seaweed obtained from natural environments. This is due to the
continuous supply of nutrients and the minimum disturbance by grazers or epiphytes
(Schuenhoff et al., 2003; Mata et al., 2010; Abreu et al., 2011).
Use of seaweeds as immunostimulants
Besides their high nutritive value, seaweeds are recognized as a valuable source of
biologically active substances (Jiménez-Escrig et al., 2011), and their antioxidant and
immune properties have been the subject of many studies (Plaza et al., 2008). These
bioactive compounds can act as dietary immunostimulants (Peddie et al., 2002; Liao et al.,
2003; Díaz-Rosales et al., 2005), consisting in a real asset for controlling disease and
improve production (Sakai, 1999).
In in vitro conditions, important anti-microbial and anti-viral activities (Hemmingson
et al., 2006; Cox et al., 2010; Narasimhan et al., 2013) and efficient antioxidant capacity
(Leonard et al., 2011; Narasimhan et al., 2013), have been demonstrated in extracts
obtained from representative species of Phaeophyta, Chlorophyte and Rhodophyta and
(brown, green, and red seaweed, respectively).
Brown seaweed (Phaeophyceae spp.) have nutraceutical properties due to the
presence of compounds, such as laminarin, fucoidan, and polyphenols, which have been
shown to improve human health (Plaza et al., 2008). Laminarin is able to modulate the
immune response (Neyrinck et al., 2007), and possesses anti-tumor antibodies (Jolles et
al., 1963) and anti-apoptosis proprieties (Kim et al., 2012). Fucoidan on the other hand, has
a positive effect on extracellular matrix proteins, on cell proliferation (Haroun-Bouhedja et
al., 2000; Koyanagi et al., 2003) and can activate apoptosis (Aisa et al., 2005). Fucoidan
is also known for its anticoagulant, anti-tumor, anti-thrombosis, anti-inflammatory and anti-
viral properties (Berteau and Mulloy, 2003).
Red and green seaweed showed to have significant effects on growth, feed
utilization, stress response, physiological condition, body constituents and carcass quality
26
of cultured fish (Yi and Chang, 1994). According to Xu and Hirata (1990), the use of Ulva
sp. as a feed additive for black seabream (Acanthopagrus schlegeli) and red seabream
(Pagrus major) has been shown to be beneficial on growth and color. Wassef et al. (2005)
reported that using Pterocladia capillacea (red algae) or U. lactuca (green algae) led to
enhanced growth performance and feed utilization, improvement in stress response, and
survival rate in gilthead seabream. Pham et al. (2006), using Hizikia fusiformis (brown
seaweed) in plaice (Pleuronectes platessa) diets was able to improve immune response
and to lower mortality rate when compared to fish fed diets without seaweed. Also,
supplementing with 5% Ulva spp. in diets for red seabream (Pagrus major) showed an
increased resistance to infection by Pasteurela piscicida, without compromising growth
(Satoh, 1987). Mustafa and Nakagawa (1995), in a review article, pointed out several
beneficial effects of seaweed supplementation to fish feeds, but this area remains rather
unexplored by the industry.
During in vitro studies, Ulva spp. and Chondrus crispus extracts and β-glucans have
shown to increase respiratory burst and immune system stimulation, through rapid release
of ROS and signaling proteins in turbot and Atlantic salmon phagocytes (Dalmo and Seljelid,
1995; Castro et al., 2004). Besides immunocompetency, a positive correlation has been
reported between phenolic content and the antioxidant capacity of lipid peroxidation
inhibition (Heo et al., 2005). Extract and product administration of red (Gracilaria folifera)
and brown (Padina gymnospora and Sargassum cinereum) seaweeds may be effective
therapeutic and prophylactic treatments against Pseudomonas spp. infection (Thanigaivel
et al., 2015). A 2.5% dietary supplementation with Gracilaria spp. led to an antioxidant
capacity enhancement, improving the innate immune system indicators in European
seabass (Peixoto et al., 2016).
Despite the potential of seaweeds, in vivo studies are rare in fish and it is vital that
additional research is carried out to accurately evaluate the potential of seaweed application
as a nutritional tool (Makkar et al., 2016).
Gracilaria vermiculophylla
One of the world’s most exploited seaweeds is Gracilaria (Pereira et al., 2008),
mostly due to the phycocolloid industry, which is a major source of agar (Peng et al., 2009).
Gracilaria vermiculophylla is a non-indigenous Asian red algae (Nyberg et al., 2009)
naturalized in the Ria de Aveiro, Portugal, and is the dominant Gracilaria species. It is
adapted to shallow soft-bottom bays, lagoons, estuaries, harbors, and inlets (Thomsen and
McGlathery, 2007).
27
It is very resistant to multiple stress factors, such as darkness, sedimentation, desiccation,
and different nutrient conditions. It grows under an extensive range of environmental
conditions and can be produced throughout the year (Thomsen and McGlathery, 2007;
Nyberg et al., 2009; Abreu et al., 2011). They are also efficient biofilters due to their good
capacity to remove ammonia and nitrite from the water (Neori et al., 2000; Yokoyama and
Ishihi, 2010; Abreu et al., 2011).
Ulva sp.
Ulva sp. is a green algae found in a variety of habitats and on several different
subtracts (Schijf and Ebling, 2010). It has a very good vitamin and mineral profile, also rich
in glutamic and ascorbic acid, alanine and iron (Briand and Morand, 1997; Ortiz et al., 2006;
García-Casal et al., 2007). Even though it does not have the economic value of Gracilaria
or Porphyra species, Ulva spp. has been already studied as an ingredient for herbivorous
aquatic animals (Dworjanyn et al., 2007) and various fish species, such as European
seabass (Valente et al., 2006), common carp (Cyprinus carpio) (Diler et al., 2007), Nile
tilapia (Güroy et al., 2007; Ergün et al., 2009; Pereira et al., 2012; Marinho et al., 2013), and
rainbow trout (Güroy et al., 2011; Güroy et al., 2013). Furthermore, according to Pereira et
al. (2012), Nile tilapia seems to digest and utilize G. vermiculophylla, Porphyra dioica, and
Ulva spp. better than other tested seaweeds (Sargassum muticum). The utilization of Ulva
spp. by European seabass juveniles was evidenced to have no negative consequences on
fish performance (Valente et al., 2006).
Fucus sp.
Fucus sp. (Linnaeus, 1753) is a brown macroalgae of the Phylum Ochrophyta, Class
Phaeophyceae, Order Fucales and Family Fucaceae. To date, studies on the dietary Fucus
sp. supplementation in fish feed is very scarce. In a more recent study, however, Peixoto et
al. (2016) showed that Fucus sp. supplementation of up to 7.5% in practical diets for
European seabass has no impact on growth performance
Objective of this study The objective of this study was to evaluate the effects of dietary seaweed
supplementation in European seabass, subjected to environmental stress. To do so, fish
were exposed to rearing temperature and salinity oscillations and several indicators of
growth performance, immune and oxidative stress responses were analyzed.
28
Materials and methods The current trial was conducted under the supervision of an accredited expert in
laboratory animal science by the Portuguese Veterinary Authority (1005/92, DGV-Portugal),
as according to the guidelines on the protection of animals used for scientific purposes from
the European directive 2010/63/UE.
EXPERIMENTAL DIETS
The experimental diets consisted in a control diet (CONTROL) without seaweed
supplementation, and a supplemented diet (SEAWEED), to which 7.5% of a seaweed mix
was added. The mix was supplied by ALGA+ ® and contained a mixture of Gracilaria sp.,
Ulva spp. and Fucus sp. Both diets were manufactured by Sparos Ltd., taking into account
the species requirements. Diets are isolipidic, isoproteic and isoenergetic (Table 2).
EXPERIMENTAL DESIGN
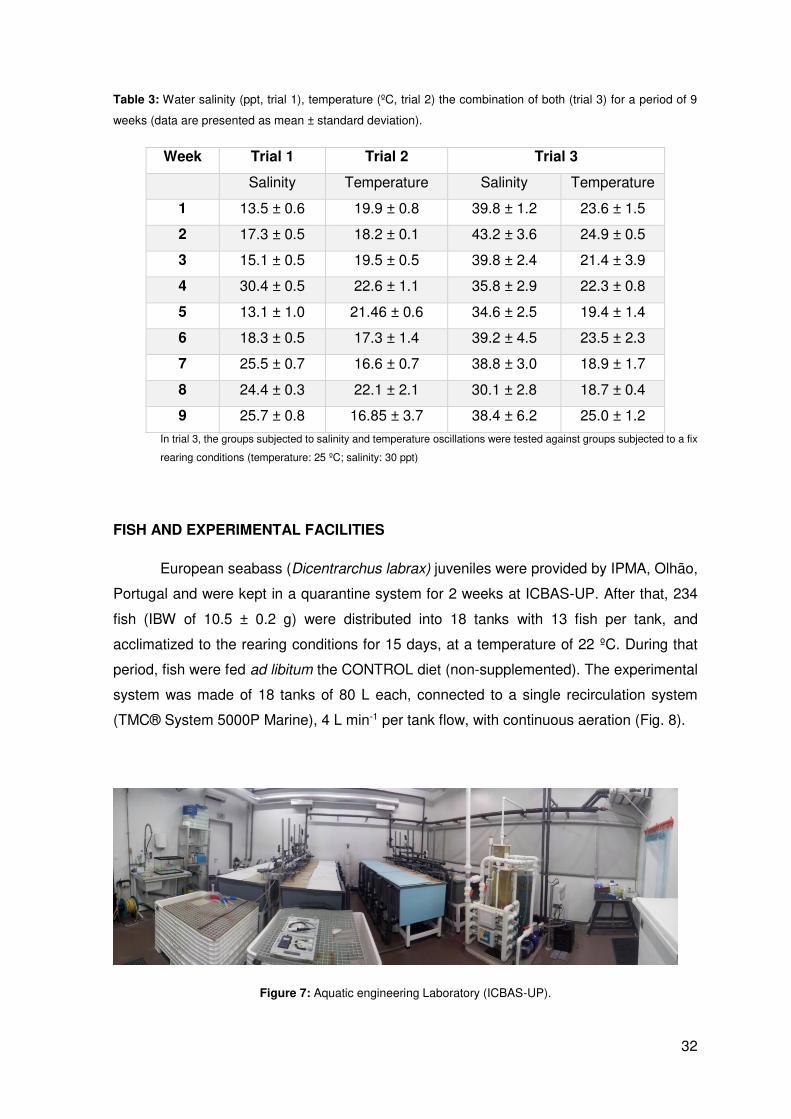
Three individual trials were performed where salinity, temperature, and a
combination of both variations were evaluated. The temperature and salinity values used
were selected as most representative according to the annual oscillations in a seabass farm
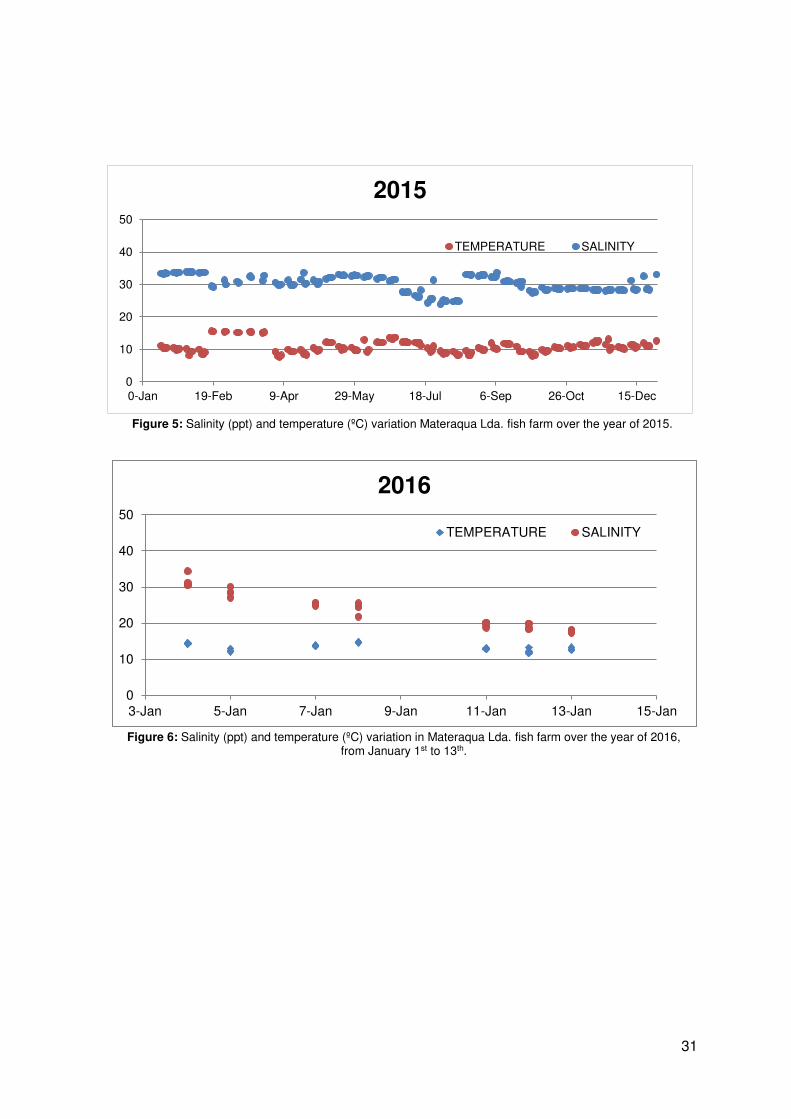
(Materaqua Lda, Ílhavo, Portugal) over the last 3 years (Fig. 3, 4, 5, 6). In trial 1, salinity
was used as the variable, and lasted for 56 days with random variations of salinity, changed
every 5 days (Table 3). The variations in salinity were obtained by adding sea salt to the
water system or replacing sea water with dechlorinated fresh water. In trial 2, water
temperature varied every 7 days (Table 3) for 63 days. The variations of temperature were
carried out using 2 thermostats heaters (Trixie® – 200 watts) to rise temperature and two
water chillers (TECO® TR60) to cool it down. In trial 3 (Table 3), salinity and temperature
varied simultaneously every 5 days, for a total period of 56 days, using the same
methodology as for the previous trials. In trial 3, the groups subjected to salinity and
temperature oscillations were tested against groups subjected to fix rearing conditions
(temperature: 25ºC; salinity: 30 ppt), which was named FIXED treatment. During trials 1, 2
and 3, the experimental diets (CONTROL and SEAWEED) were randomly assigned to each
tank and fish were hand fed, twice a day, to apparent satiation and feed intake was recorded
for each tank.
29
Table 2: Control and Supplemented Seaweed diets composition and Proximate composition.
Dietary treatments
CONTROL SEAWEED
Fish ingredients (% DM)
Fishmeal Standard 10.0 10.0
Fishmeal SOLOR 20.0 20.0
Soy protein concentrate (Soycomil) 11.8 10.3
Wheat gluten 4.0 4.0
Corn gluten 8.0 8.0
Soybean meal 48 12.0 12.0
Rapeseed meal 5.0 5.0
Wheat meal 9.0 3.0
Peas gelatinized (Aquatex 8071) 3.2 3.2
Fish oil - COPPENS 6.5 6.5
Soybean oil 4.0 4.0
Rapeseed oil 4.0 4.0
Vit & Min Premix PV01 1.0 1.0
Binder (Kieselghur) 0.5 0.5
Antioxidant powder (Paramega) 0.2 0.2
MCP 0.5 0.5
L-Lysine 0.2 0.2
DL-Methionine 0.1 0.1
Gracilaria sp. - 2.5
Ulva sp. - 2.5
Fucus sp. - 2.5
Proximate composition (%DM)
Dry matter 94.7 94.8
Ash 8.6 10.6
Crude protein 47.8 47.9
Crude fat 19.1 19.3
Gross energy (kJ. g-1 DM) 22.7 22.4
30
Figure 3: Salinity (ppt) and temperature (ºC) variation in Materaqua Lda. fish farm from September 16th to December 25th, year of 2013.
Figure 4: Salinity (ppt) and temperature (ºC) variation in Materaqua Lda. fish farm over the year of 2014.
Glutathione peroxidase was quantified following the method by Mohandas et al.
(1984). The reaction was measured by the formation of oxidized NADPH (NADP+), and
presented in the final unit of NADP+.
Glutathione reductase (µmol.min-1.mg.prot-1)
Glutathione reductase measurement assay was based on the reduction of 5,5'-
dithiobis (2-nitrobenzoic acid) to reduced glutathione (GSH) generated from an excess of
oxidized glutathione (GSSG), as described by Cribb et al. (1989). This activity was
quantified by the formation of oxidized NADPH (NADP+).
Total Glutathione (µmol.min-1.mg.prot-1)
Total glutathione is quantified by reaction of GSH with DTNB (5.5'-dithio-bis-2-
nitrobenzoic acid), which produces a yellow colored 5-thio-2-nitrobenzoic acid (TNB)
quantified at 412 nm, as described by Baker et al. (1990). During the reaction, the GSSG is
concomitantly reduced to GSH, hence enabling the measure of all glutathione.
STATISTICAL ANALYSES
Data was checked for normality (Grubbs' test) and homogeneity of variances
(Levene´s test). Two-way (salinity and temperature trial) and one-way ANOVA (salinity trial
and temperature trial) analyses were carried out using IBM SPSS statistics 20 - Windows
XP/Vista/7/8 software package. Data transformation was applied when normality of the
samples was not achieved. When data lacked homogeneity, Kruskal Wallis test was used.
Tukey was used for pairwise comparisons between treatments. Confidence level of 95%
was considered in all statistical analysis.
37
Results TRIAL 1: SALINITY OSCILLATION
Growth performance
At the end of Trial 1, no mortality was registered. Fish grew from an initial mean body
weight of 10.5 ± 0.7 g to a final mean body weight of 19.6 ± 1.3 g, in the 63-day period. No
significant statistical differences were observed in the growth performance parameters
(P≥0.05), except for feed intake and final body weight. Fish fed the SEAWEED diet had
significantly lower (P<0.05) feed intake and final body weight (Table 4) than fish fed the
CONTROL diet.
Table 4: Growth performance, feed utilization, and feed intake of seabass fed the experimental diets at the end of Trial 1.
Treatment CONTROL SEAWEED
Initial body weight (g) 10.6 ± 0.7 10.3 ± 0.9
Final body weight (g) 18.7 ± 3.8a 16.5 ± 0.9b
Weight gain (g) 8.10 ± 0.83 6.17 ± 1.07
Feed intake (g fish-1) 1.60 ± 0.93a 1.50 ± 0.77b
VFI (%ABW.day-1) 1.56 ± 0.08 1.61 ± 0.07
Protein intake (g) 0.72 ± 0.42 0.68 ± 0.35
FCR 1.38 ± 0.14 1.71 ± 0.15
DGI 0.94 ± 0.06 0.75 ± 0.09
PER 1.38 ± 0.11 1.33 ± 0.12
Values presented as mean (n = 6 tanks) ± SD. Different letters in the same row, for either CONTROL or SEAWEED diets, indicate significant differences (P<0.05; Final body weight P=0.048; Feed intake P=0.038). FCR, Feed conversion ratio = feed intake/weight gain; DGI, Daily growth index = 100 x [(Final body weight)1/3 – (Initial body weight)1/3]/days; PER, Protein efficiency ratio = weight gain/crude protein intake; ABW, Average body weight
38
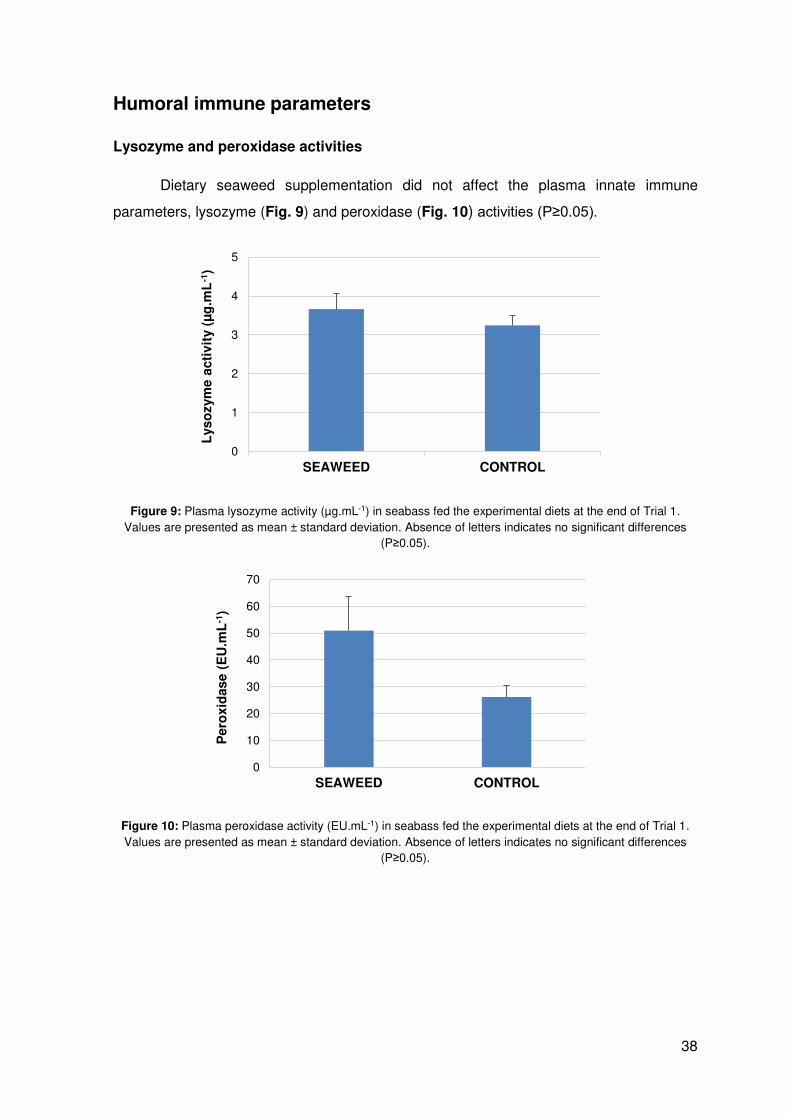
Humoral immune parameters
Lysozyme and peroxidase activities
Dietary seaweed supplementation did not affect the plasma innate immune
parameters, lysozyme (Fig. 9) and peroxidase (Fig. 10) activities (P≥0.05).
Figure 9: Plasma lysozyme activity (µg.mL-1) in seabass fed the experimental diets at the end of Trial 1. Values are presented as mean ± standard deviation. Absence of letters indicates no significant differences
(P≥0.05).
Figure 10: Plasma peroxidase activity (EU.mL-1) in seabass fed the experimental diets at the end of Trial 1. Values are presented as mean ± standard deviation. Absence of letters indicates no significant differences
(P≥0.05).
0
1
2
3
4
5
SEAWEED CONTROL
Lyso
zym
e a
cti
vit
y (
µg
.mL
-1)
0
10
20
30
40
50
60
70
SEAWEED CONTROL
Pero
xid
ase (
EU
.mL
-1)
39
Oxidative stress: Enzymatic and non-enzymatic analyses
The indicators of enzymatic (CAT, GPx, GST) and non-enzymatic (TG, GSSG, GSH)
antioxidant defenses and peroxidative damage (LPO) are presented in Table 5. At the end
of Trial 1, CAT, GPx, and GST activities did not vary significantly (P≥0.05) in seabass fed
the different dietary treatments. Similarly, no significant differences were observed on the
LPO, TG, GSSG, GSH, and the GSH / GSSG.
Table 5: Enzymatic (CAT, GPx, GST) and non-enzymatic (LPO, TG, GSSG, GSH) bio-indicators analyzed in liver of seabass fed the experimental diets.
Catalase (CAT, µmol.min-1.mg prot-1), glutathione peroxidase (GPx, nmol.min-1.mg prot-1), glutathione s-transferase (GST, pmol.min-1.mg prot-1) Lipid Peroxidation (LPO, nmol TBA.g-1), Total Glutathione (TG, nmol.min-1.mg prot-1), oxidized glutathione (GSSG, µmol min-1 mg-1), reduced glutathione (GSH, µmol min-1 mg-1) and the GSH-GSSG ratio. Values are presented as mean ± standard deviation. Absence of letters indicates no significant differences (P≥0.05).
40
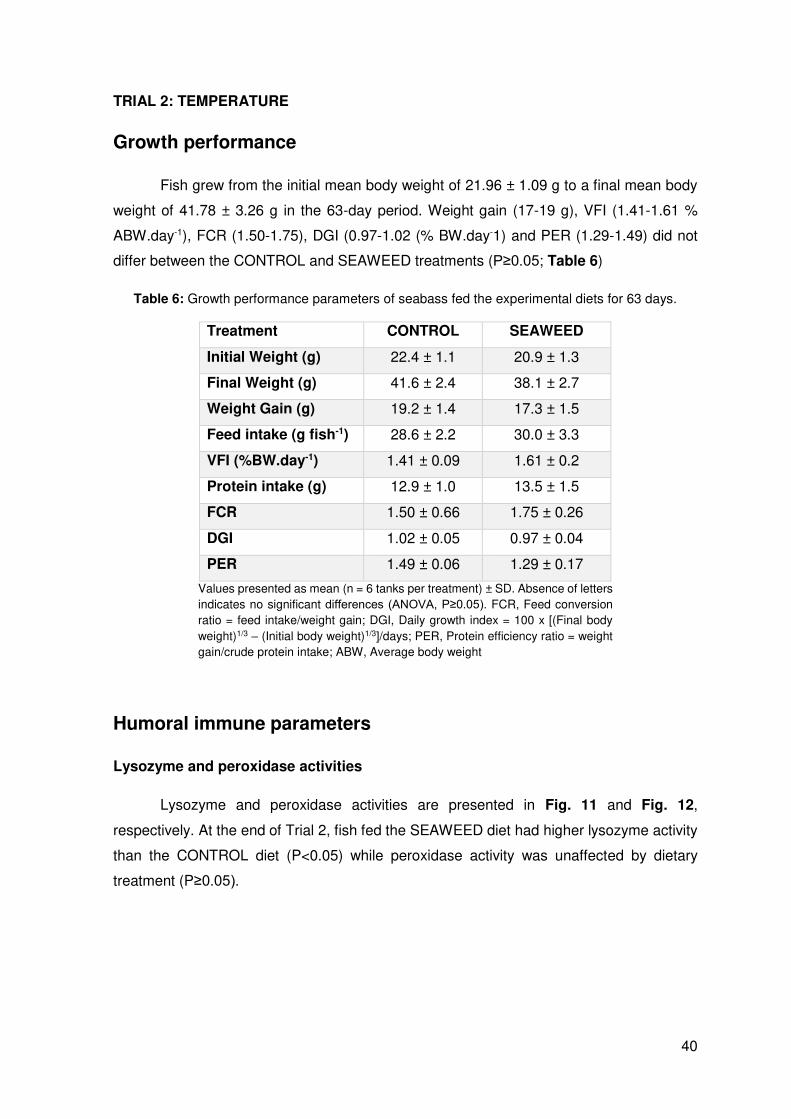
TRIAL 2: TEMPERATURE
Growth performance
Fish grew from the initial mean body weight of 21.96 ± 1.09 g to a final mean body
weight of 41.78 ± 3.26 g in the 63-day period. Weight gain (17-19 g), VFI (1.41-1.61 %
ABW.day-1), FCR (1.50-1.75), DGI (0.97-1.02 (% BW.day-1) and PER (1.29-1.49) did not
differ between the CONTROL and SEAWEED treatments (P≥0.05; Table 6)
Table 6: Growth performance parameters of seabass fed the experimental diets for 63 days.
Treatment CONTROL SEAWEED
Initial Weight (g) 22.4 ± 1.1 20.9 ± 1.3
Final Weight (g) 41.6 ± 2.4 38.1 ± 2.7
Weight Gain (g) 19.2 ± 1.4 17.3 ± 1.5
Feed intake (g fish-1) 28.6 ± 2.2 30.0 ± 3.3
VFI (%BW.day-1) 1.41 ± 0.09 1.61 ± 0.2
Protein intake (g) 12.9 ± 1.0 13.5 ± 1.5
FCR 1.50 ± 0.66 1.75 ± 0.26
DGI 1.02 ± 0.05 0.97 ± 0.04
PER 1.49 ± 0.06 1.29 ± 0.17
Values presented as mean (n = 6 tanks per treatment) ± SD. Absence of letters indicates no significant differences (ANOVA, P≥0.05). FCR, Feed conversion ratio = feed intake/weight gain; DGI, Daily growth index = 100 x [(Final body weight)1/3 – (Initial body weight)1/3]/days; PER, Protein efficiency ratio = weight gain/crude protein intake; ABW, Average body weight
Humoral immune parameters
Lysozyme and peroxidase activities
Lysozyme and peroxidase activities are presented in Fig. 11 and Fig. 12,
respectively. At the end of Trial 2, fish fed the SEAWEED diet had higher lysozyme activity
than the CONTROL diet (P<0.05) while peroxidase activity was unaffected by dietary
treatment (P≥0.05).
41
Figure 11: Lysozyme activity (µg.mL-1) determined in the plasma of seabass fed the experimental diets at the end of Trial 2. Values are presented as mean ± SD. Different letters indicate significant differences (P<0.05).
Figure 12: Peroxidase activity (EU.mL-1) determined in the plasma of seabass fed the experimental diets at the end of Trial 2. Values are presented as mean ± SD. Absence of letters indicates no statistical differences (
P≥0.05).
Oxidative stress: Enzymatic and non-enzymatic analyses
The indicators of enzymatic (CAT, GPx, GST) and non-enzymatic (TG, GSSG, GSH)
antioxidant defenses and peroxidative damage (LPO) are presented in Table 7. At the end
of Trial 1, CAT, GPx, and GST activities did not vary significantly (P≥0.05) in seabass fed
the different dietary treatments. Similarly, no significant differences were observed on the
LPO, TG, GSSG, GSH, and the GSH / GSSG.
b
a
0
0,5
1
1,5
2
2,5
3
CONTROL SEAWEED
Lyso
zym
e a
cti
vit
y (
µg
.mL
-1)
0
10
20
30
40
50
CONTROL SEAWEED
Pero
xid
ase a
cti
vit
y (
EU
.mL
-1)
42
Table 7 Enzymatic (CAT, GPx, GST), non-enzymatic (TG, GSSG, GSH) and peroxidative damage (LPO) bio-indicators in seabass fed the experimental diets during Trial 2.
Values presented as mean (N = 6 tanks) ± SD. Absence of letters indicates no significant differences (P≥0.05). FCR, Feed conversion ratio = feed intake/weight gain; DGI, Daily growth index = 100 x [(Final body weight)1/3 – (Initial body weight)1/3]/days; PER, Protein efficiency ratio = weight gain/crude protein intake; ABW, Average body weight
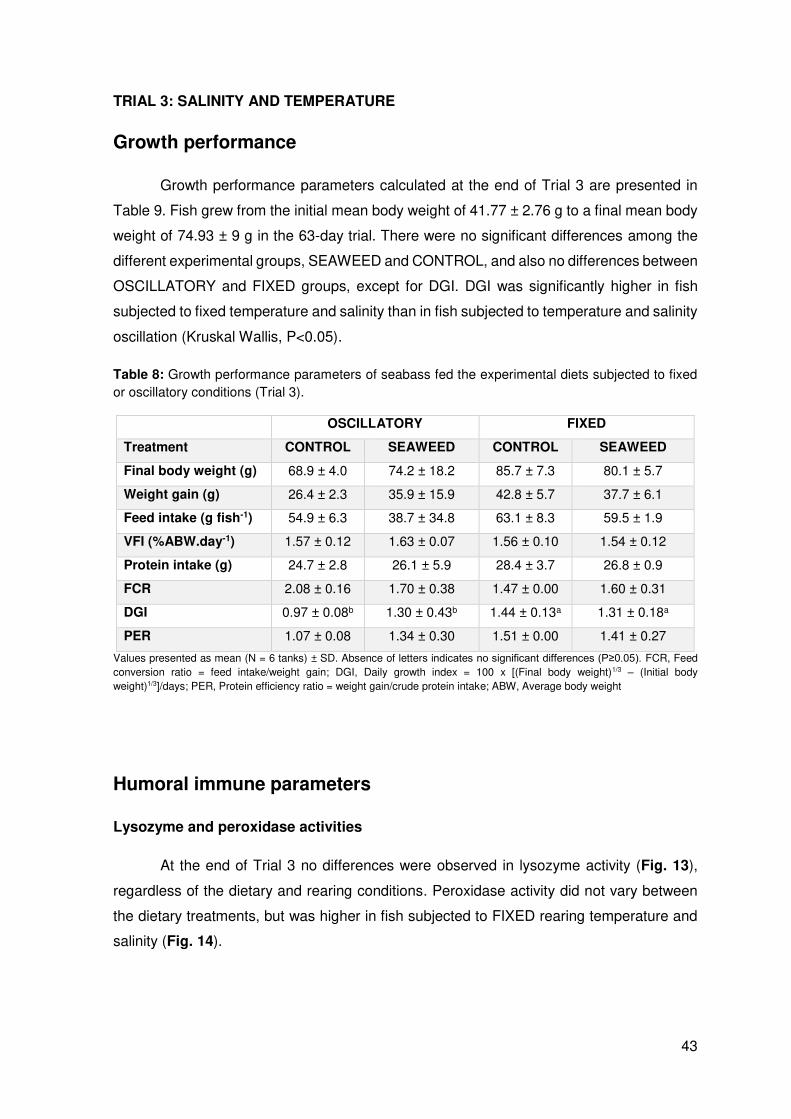
Humoral immune parameters
Lysozyme and peroxidase activities
At the end of Trial 3 no differences were observed in lysozyme activity (Fig. 13),
regardless of the dietary and rearing conditions. Peroxidase activity did not vary between
the dietary treatments, but was higher in fish subjected to FIXED rearing temperature and
salinity (Fig. 14).
44
Figure 13: Lysozyme activity (µg mL-1) determined in the liver of seabass fed the experimental diets subjected to fixed or oscillatory conditions (Trial 3) (mean ± SD). Absence of letters indicates no significant differences
(P≥0.05).
Figure 14: Peroxidase activity (EU.mL-1) determined in the liver of seabass fed the experimental diets subjected to fixed or oscillation conditions (Trial 3). Values are presented as mean ± SD. Different letters
indicate significant differences (P<0.05).
0
2
4
6
8
10
12
14
16
CONTROL SEAWEED CONTROL SEAWEED
FIXED OSCILLATORY
Lyso
zym
e ac
tivity
(µg
mL-
1)
a
a
b b
0
3
6
9
12
15
CONTROL SEAWEED CONTROL SEAWEED
FIXED OSCILLATORY
Pero
xid
ase a
cti
vit
y (
EU
.mL
-1)
45
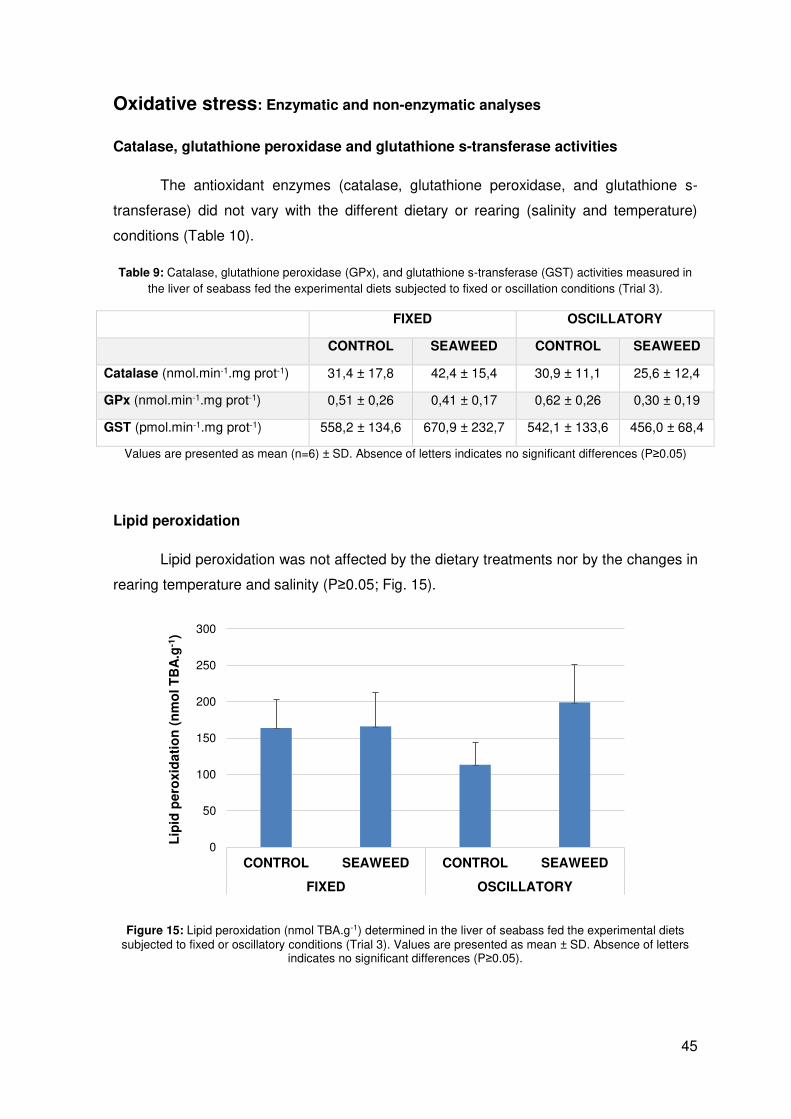
Oxidative stress: Enzymatic and non-enzymatic analyses
Catalase, glutathione peroxidase and glutathione s-transferase activities
The antioxidant enzymes (catalase, glutathione peroxidase, and glutathione s-
transferase) did not vary with the different dietary or rearing (salinity and temperature)
conditions (Table 10).
Table 9: Catalase, glutathione peroxidase (GPx), and glutathione s-transferase (GST) activities measured in the liver of seabass fed the experimental diets subjected to fixed or oscillation conditions (Trial 3).
Values are presented as mean (n=6) ± SD. Absence of letters indicates no significant differences (P≥0.05)
Lipid peroxidation
Lipid peroxidation was not affected by the dietary treatments nor by the changes in
rearing temperature and salinity (P≥0.05; Fig. 15).
Figure 15: Lipid peroxidation (nmol TBA.g-1) determined in the liver of seabass fed the experimental diets subjected to fixed or oscillatory conditions (Trial 3). Values are presented as mean ± SD. Absence of letters
indicates no significant differences (P≥0.05).
0
50
100
150
200
250
300
CONTROL SEAWEED CONTROL SEAWEED
FIXED OSCILLATORY
Lip
id p
ero
xid
ati
on
(n
mo
l T
BA
.g-1
)
46
Total Glutathione
Total glutathione concentration (Fig. 16) was not affected by the experimental diets;
however, it was significantly higher (P<0.05) in seabass subjected to temperature and
salinity changes (OSCILLATORY group), when compared to fish subjected to fixed
conditions (FIXED group).
Figure 16: Total glutathione (nmol.min-1.mg prot-1) measured in the liver of seabass fed the experimental diets subjected to fixed or oscillation conditions (Trial 3). Values are presented as mean ± SD. Different letters
indicate significant differences (P<0.05).
GSSG – oxidized glutathione and GSH – reduced glutathione
GSH activity was not affected by dietary treatment nor groups (P≥0.05) but GSSG
was significant higher in the OSCILLATORY groups, independently of the diet (P<0.05;
Table 11).
Table 10: Oxidized glutathione (GSSG) and reduced glutathione (GSH) measured in liver of seabass fed the experimental diets subjected to fixed or oscillation conditions (Trial 3).
Values are presented as means (n=6) ± SD. Different letters indicate significant differences (P<0.05).
a
abb
0
0,02
0,04
0,06
0,08
0,1
0,12
0,14
CONTROL SEAWEED CONTROL SEAWEED
Fixed Oscillatory
To
tal g
luta
thio
ne
(nm
ol.m
in-1
.mg
pro
t-1)
47
Discussion
The economic importance of seabass for the European aquaculture sector compels
this species to intensive rearing (Cabral and Costa, 2001; Vinagre et al., 2009). In order to
mitigate diseases outbreaks in intensive aquaculture, which cause substantial economic
losses, it is necessary to develop disease control strategies based on a better
understanding of the effects of husbandry methods and environmental stressors of farmed
fish (Bowden et al., 2007).
It is important not to rely solely on the use of antibiotics, which are undergoing strict
regulations to limit their over-use, in order to prevent antibiotic resistant bacteria and
minimize consumer’s health risk (Cook et al., 2003). Seaweed have been previously studied
as potential immunostimulants in seabass (Peixoto et al., 2016), as well as in tilapia (Güroy
et al., 2007), rainbow trout (Güroy et al., 2011, 2013) among other fish species (Mustafa
and Nakagawa, 1995; Güroy et al., 2011; Peixoto et al., 2016).
Growth Performance
In Trial 1, seaweed supplementation caused a decrease in growth performance and
feed consumption of seabass subjected to salinity variations. Similar results were also
observed by Davies et al. (1997), that reported a lower feed consumption in mullet (Chelon
labrosus) feeding high levels of red algae. On the contrary, other published studies reported
that the inclusion of seaweeds, such as U. rigida and G. cornea up to 10% and 5%
respectively, did not cause adverse effects on growth performance and feed utilization in
European seabass (Valente et al., 2006). Also, Hashim and Saat (1992) observed an
enhanced feeding activity and greater feed consumption of snakehead (Channa striatus)
fed 5% Ulva spp. meal diet, compared to other seaweeds, indicating the possibility of the
presence of a food attractant for this fish. Discrepancy in results using seaweed
supplementation has been previously reported. Indeed, in the current salinity trial (Trial 1),
the seaweeds used did not seem to positively affect the palatability of the diet for a
carnivorous fish like seabass, since feed consumption was higher in the control group. The
reduced final body weight could be related to the reduced feed consumption observed or to
the presence of some anti-nutritional factors (ANF). Seaweeds contain polysaccharides like
xylans, agar and alginates, which can limit their digestibility (Horie et al., 1995), causing a
lower growth performance and feed utilization, especially in carnivorous fish species. Other
authors assume that the existence of ANF in seaweed diets can reduce its nutritional quality,
interfere with the efficiency of digestive processes and reduce growth rates (Dallaire et al.,
48
2007; de Oliveira et al., 2009). Sáez et al. (2012) reported in Sparus aurata juveniles that
Ulva meal contains anti-nutritional compounds that inhibit digestive proteases. In addition,
de Oliveira et al. (2009) demonstrated the presence of many ANFs in Gracilaria species,
which was also present in our diet. This may explain the lower weight gain observed in
seabass fed the seaweed supplemented diet at such incorporation level.
In the temperature oscillatory trial (Trial 2), growth performance was not affected by
the different diets. Similar results were obtained by other authors with the same level of
seaweed supplementation in seabass (Bagni et al., 2000; Peixoto et al., 2016). Bagni et al.
(2000) proposed that the lack of growth enhancement in seabass was an effect of the water
temperature, which was below the optimal for the species.
According to Conides and Glamuzina (2006), the main parameter that affects the
growth of seabass is the temperature/salinity combined effect. Similar to the results
observed in the previously discussed trial, growth performance of seabass subjected to both
salinity and temperature oscillations was not affected by dietary treatment. Kissil et al.
(1992) also reported no differences in growth performance of grow-out gilthead seabream,
after the inclusion of Ulva meal. However, regardless of the dietary treatment, the salinity
and temperature oscillations (Trial 3) negatively affected growth performance (DGI), when
compared to the FIXED group. Since temperature was fixed at 25 ºC in the FIXED group,
these results are to be expected, as the temperature for optimal growth performance in
seabass is between 25 and 28ºC (Conides and Glamuzina, 2006). Moreover, it would be
expected to observe a lower weight gain in the OSCILLATORY group, but it was not the
case in Trial 3. Although there is a tendency to lower values in final weight and weight gain,
the high standard deviations difficult the interpretation of the results.
Peroxidase and Lysozyme
Lysozyme and peroxidase system are key components of fish immune defenses
since they act against pathogens by directly disrupting their cell walls or thought the
production of harmful chemicals, such as oxidative radicals (Nayak, 2010). Studies in fish
immunity showed that seaweed compounds can modulate fish immunological response,
playing a role in disease resistance in several species (Satoh, 1987; Dalmo and Seljelid,
1995; Castro et al., 2004). Lysozyme is a fundamental enzyme involved in the non-specific
immune response of many fish species (Tort et al., 2004). However, lysozyme levels can
vary considerably between fish species and, in most cases, it is positively correlated with
disease resistance (Fevolden et al., 1994). In this study, when seabass was exposed to
49
salinity oscillations alone, the innate immune system response did not appear to be affected
by seaweed supplementation, since lysozyme and peroxidase activities were not different
between dietary groups. These results were also observed by Valente et al. (2016) in Nile
tilapia, when fed a diet supplement with Ulva spp with 5% and 10% dietary inclusion. On
the other hand, when temperature oscillated, lysozyme activity was significantly higher in
fish fed the seaweed diet. These results are in agreement with Peixoto et al. (2016), which
used similar seaweed supplementation in seabass, and with Bagni et al. (2000), which
tested an immunostimulant diet in seabass. Increased peroxidase levels have been
detected in rainbow trout fed diets with 5% Gracilaria sp. supplementation (Araújo et al.,
2016), while no differences were observed in Nile tilapia when fed diets supplemented with
Ulva sp. at 5% and 10% levels (Valente et al., 2016). In the current study, when temperature
and salinity oscillated (Trial 3), peroxidase activity varied by changes of rearing temperature
and salinity, but was unresponsive to the dietary supplementation.
Oxidative Stress
External factors such as rearing temperature and salinity are long-known to
influence the oxidative stress indicators (Vinagre et al., 2012). Antioxidant enzymes, such
as catalase (CAT), glutathione peroxidase (GPx), and glutathione reductase (GR), and
levels of lipid peroxidation (LPO) are good indicators of ROS overproduction and induced
oxidative damage in cells (Livingstone, 2001; Limón-Pacheco and Gonsebatt, 2009). Both
for the salinity trial (Trial 1) and temperature trial (Trial 2), oxidative stress was not affected
by dietary supplementation, which is in accordance with Peixoto et al. (2016).
Roche and Bogé (1996) tested the effect of temperature on oxidative stress
biomarkers in seabass, concluding that lipid peroxidation and catalase activity were
increased by thermal stress. In our study, catalase activity was not affected by dietary
treatment or groups but results cannot be directly comparable with our study since the
mentioned study was conducted 12 h after exposure. Kopecka and Pempkowiak (2008)
also attributed the seasonal variation of catalase activity in European flounder (Platichthys
flesus) to temperature oscillations (Kopecka and Pempkowiak, 2008).
Total Glutathione (TG) and oxidized glutathione (GSSG) were only affected in Trial
3, and only by temperature and salinity oscillation (Trial 3). TG showed higher activity in the
OSCILLATORY group, mostly due to the GSSG fraction, since GSH was unaffected by any
of the experimental treatment. Hight glutathione levels are related to improved antioxidant
defenses (Sitjà-Bobadilla et al., 2005). When comparing the TG with the LPO results, it
50
seems plausible to infer that the greater TG levels may have caused a decrease in the lipid
damage (Sitjà-Bobadilla et al., 2005). Temperature influence in both TG and GSSG levels
has already been reported in other studies, although these where evaluating seasonal
variations in Dicentrarchus labrax. GSH/GSSG ratio is considered an index of the cellular
redox status and a biomarker of oxidative damage (Sitjà-Bobadilla et al., 2005). According
to Vinagre et al. (2012), lipid peroxidation and catalase activities in juvenile seabass are
very sensitive to environmental temperature, particularly at temperatures outside the
species optimal range. This contradicts this study results, in which FIXED and
OSCILLATORY groups had no significantly differences in LPO and CAT.
51
Conclusion For the salinity trial (Trial 1), the lower consumption and lower weight gain of fish fed
supplemented diets indicate that either the quantity or combination of the seaweeds used
as dietary supplement was not an appropriate supplementation for European seabass. No
differences were observed in humoral immune parameters and oxidative stress.
When subjected to temperature oscillations, higher lysozyme activity was observed
with the dietary seaweed supplementation.
When fish were subjected to salinity and temperature oscillation, seaweed
supplementation did not affect any of the analyzed parameters.
The effects of the seaweed supplementation were not as pronounced as the abiotic
factors (temperature and salinity). Further work should be carried out to test different
seaweed species combination at different levels. In addition, the evaluation of processed
seaweed (heat-treated seaweed) is of particular interest, since the thermal treatment of
seaweed may inactivate several of the ANF that might have enshroud the potential positive
results.
52
References Abreu, M.H., Pereira, R., Yarish, C., Buschmann, A.H., Sousa-Pinto, I., 2011. IMTA with
Gracilaria vermiculophylla: productivity and nutrient removal performance of the seaweed in a land-based pilot scale system. Aquaculture. 312, 77-87.
Aisa, Y., Miyakawa, Y., Nakazato, T., Shibata, H., Saito, K., Ikeda, Y., Kizaki, M., 2005. Fucoidan induces apoptosis of human HS‐Sultan cells accompanied by activation of caspase‐3 and down‐regulation of ERK Pathways. American journal of hematology. 78, 7-14.
Ali, E.H., Hashem, M., Al-Salahy, M.B., 2011. Pathogenicity and oxidative stress in Nile tilapia caused by Aphanomyces laevis and Phoma herbarum isolated from farmed fish. Diseases of aquatic organisms. 94, 17-28.
Ameur, W.B., de Lapuente, J., El Megdiche, Y., Barhoumi, B., Trabelsi, S., Camps, L., Serret, J., Ramos-López, D., Gonzalez-Linares, J., Driss, M.R., 2012. Oxidative stress, genotoxicity and histopathology biomarker responses in mullet (Mugil cephalus) and sea bass (Dicentrarchus labrax) liver from Bizerte Lagoon (Tunisia). Marine pollution bulletin. 64, 241-251.
Angeles Esteban, M., Cuesta, A., Rodríguez, A., Meseguer, J., 2006. Effect of photoperiod on the fish innate immune system: a link between fish pineal gland and the immune system. Journal of pineal research. 41, 261-266.
Aoki, T., 1992. Chemotherapy and drug resistance in fish farms in Japan. Diseases in Asian aquaculture. 1, 519-529.
Araújo, M., Rema, P., Sousa-Pinto, I., Cunha, L.M., Peixoto, M.J., Pires, M.A., Seixas, F., Brotas, V., Beltrán, C., Valente, L.M., 2016. Dietary inclusion of IMTA-cultivated Gracilaria vermiculophylla in rainbow trout (Oncorhynchus mykiss) diets: effects on growth, intestinal morphology, tissue pigmentation, and immunological response. Journal of Applied Phycology. 28, 679-689.
Arunachalam, S., Reddy, S.R., 1979. Food intake, growth, food conversion, and body composition of catfish exposed to different salinities. Aquaculture. 16, 163-171.
Baba, T., Watase, Y., Yoshinaga, Y., 1993. Activation of mononuclear phagocyte function by levamisole immersion in carp. Bulletin of the Japanese Society of Scientific Fisheries (Japan).
Bagni, M., Archetti, L., Amadori, M., Marino, G., 2000. Effect of long‐term oral administration of an immunostimulant diet on innate immunity in sea bass (Dicentrarchus labrax). Journal of Veterinary Medicine, Series B. 47, 745-751.
Bagni, M., Civitareale, C., Priori, A., Ballerini, A., Finoia, M., Brambilla, G., Marino, G., 2007. Pre-slaughter crowding stress and killing procedures affecting quality and welfare in sea bass (Dicentrarchus labrax) and sea bream (Sparus aurata). Aquaculture. 263, 52-60.
Bajpai, S., Sharma, A., Gupta, M.N., 2005. Removal and recovery of antinutritional factors from soybean flour. Food chemistry. 89, 497-501.
Baker, M.A., Cerniglia, G.J., Zaman, A., 1990. Microtiter plate assay for the measurement of glutathione and glutathione disulfide in large numbers of biological samples. Analytical biochemistry. 190, 360-365.
Barnabé, G., 1990. Rearing bass and gilthead bream. Aquaculture. 2, 647-686. Beitinger, T.L., Bennett, W.A., McCauley, R.W., 2000. Temperature tolerances of North
American freshwater fishes exposed to dynamic changes in temperature. Environmental biology of fishes. 58, 237-275.
Berteau, O., Mulloy, B., 2003. Sulfated fucans, fresh perspectives: structures, functions, and biological properties of sulfated fucans and an overview of enzymes active toward this class of polysaccharide. Glycobiology. 13, 29R-40R.
Björnsson, B., Ólafsdóttir, S.R., 2006. Effects of water quality and stocking density on growth performance of juvenile cod (Gadus morhua L.). ICES Journal of Marine Science: Journal du Conseil. 63, 326-334.
53
Blaber, S., 1997. Fish and fisheries in tropical estuaries. Springer Science & Business Media.
Boeuf, G., Payan, P., 2001. How should salinity influence fish growth? Comparative Biochemistry and Physiology Part C: Toxicology & Pharmacology. 130, 411-423.
Boshra, H., Li, J., Sunyer, J., 2006. Recent advances on the complement system of teleost fish. Fish & shellfish immunology. 20, 239-262.
Bowden, T.J., Thompson, K.D., Morgan, A.L., Gratacap, R.M., Nikoskelainen, S., 2007. Seasonal variation and the immune response: a fish perspective. Fish & shellfish immunology. 22, 695-706.
Bradford, M.M., 1976. A rapid and sensitive method for the quantitation of microgram quantities of protein utilizing the principle of protein-dye binding. Analytical biochemistry. 72, 248-254.
Bragadóttir, M., 2001. Endogenous antioxidants in fish. University of Iceland. Briand, X., Morand, P., 1997. Anaerobic digestion of Ulva sp. 1. Relationship between Ulva
composition and methanisation. Journal of Applied Phycology. 9, 511-524. Bricknell, I., Dalmo, R.A., 2005. The use of immunostimulants in fish larval aquaculture.
Fish Shellfish Immunol. 19, 457-472. Burrells, C., Williams, P., Forno, P., 2001. Dietary nucleotides: a novel supplement in fish
feeds: 1. Effects on resistance to disease in salmonids. Aquaculture. 199, 159-169. Buschmann, A.H., Troell, M., Kautsky, N., 2001. Integrated algal farming: a review. Cahiers
de Biologie marine. 42, 83-90. Cabral, H., Costa, M.J., 2001. Abundance, feeding ecology and growth of 0-group sea bass,
Dicentrarchus labrax, within the nursery areas of the Tagus estuary. Journal of the Marine Biological Association of the UK. 81, 679-682.
Castro, R., Zarra, I., Lamas, J., 2004. Water-soluble seaweed extracts modulate the respiratory burst activity of turbot phagocytes. Aquaculture. 229, 67-78.
Cecchini, S., Saroglia, M., 2002. Antibody response in sea bass (Dicentrarchus labrax L.) in relation to water temperature and oxygenation. Aquaculture Research. 33, 607-613.
Chen, D., Ainsworth, A., 1992. Glucan administration potentiates immune defence mechanisms of channel catfish, Ictalurus punctatus Rafinesque. Journal of Fish Diseases. 15, 295-304.
Claiborne, A., 1985. Catalase activity. CRC handbook of methods for oxygen radical research. 1, 283-284.
Conides, A., Parpoura, A., Fotis, G., 1997. Study on the effects of salinity on the fry of the euryhaline species gilthead sea bream (Sparus aurata L. 1758). Journal of Aquaculture in the Tropics. 12, 297-304.
Conides, A.J., Glamuzina, B., 2006. Laboratory simulation of the effects of environmental salinity on acclimation, feeding and growth of wild-caught juveniles of European sea bass Dicentrarchus labrax and gilthead sea bream, Sparus aurata. Aquaculture. 256, 235-245.
Cook, M.T., Hayball, P.J., Hutchinson, W., Nowak, B.F., Hayball, J.D., 2003. Administration of a commercial immunostimulant preparation, EcoActiva™ as a feed supplement enhances macrophage respiratory burst and the growth rate of snapper (Pagrus auratus, Sparidae (Bloch and Schneider)) in winter. Fish & Shellfish Immunology. 14, 333-345.
Cornish-Bowden, A., 1979. Chapter 2 - Introduction to enzyme kinetics, Fundamentals of Enzyme Kinetics. Butterworth-Heinemann, pp. 16-38.
Costas, B., Aragão, C., Mancera, J.M., Dinis, M.T., Conceição, L.E., 2008. High stocking density induces crowding stress and affects amino acid metabolism in Senegalese sole Solea senegalensis (Kaup 1858) juveniles. Aquaculture Research. 39, 1-9.
Cox, S., Abu-Ghannam, N., Gupta, S., 2010. An assessment of the antioxidant and antimicrobial activity of six species of edible Irish seaweeds.
54
Cribb, A.E., Leeder, J.S., Spielberg, S.P., 1989. Use of a microplate reader in an assay of glutathione reductase using 5, 5′-dithiobis (2-nitrobenzoic acid). Analytical biochemistry. 183, 195-196.
Dalla Via, J., Villani, P., Gasteiger, E., Niederstätter, H., 1998. Oxygen consumption in sea bass fingerling Dicentrarchus labrax exposed to acute salinity and temperature changes: metabolic basis for maximum stocking density estimations. Aquaculture. 169, 303-313.
Dallaire, V., Lessard, P., Vandenberg, G., de la Noüe, J., 2007. Effect of algal incorporation on growth, survival and carcass composition of rainbow trout (Oncorhynchus mykiss) fry. Bioresource technology. 98, 1433-1439.
Dalmo, R., Seljelid, R., 1995. The immunomodulatory effect of LPS, laminaran and sulphated laminaran [β (l, 3)‐D‐glucan] on Atlantic salmon, Salmo salar L., macrophages in vitro. Journal of fish diseases. 18, 175-185.
Dantagnan, P., Hernández, A., Borquez, A., Mansilla, A., 2009. Inclusion of macroalgae meal (Macrocystis pyrifera) as feed ingredient for rainbow trout (Oncorhynchus mykiss): effect on flesh fatty acid composition. Aquaculture Research. 41, 87-94.
Davies, S., Brown, M., Camilleri, M., 1997. Preliminary assessment of the seaweed Porphyra purpurea in artificial diets for thick-lipped grey mullet (Chelon labrosus). Aquaculture. 152, 249-258.
D.I.A., Gouveia, S.T., Pereira, J.G., 2009. Nutritive and non-nutritive attributes of washed-up seaweeds from the coast of Ceará, Brazil. Food chemistry. 115, 254-259.
Dendrinos, P., Thorpe, J., 1985. Effects of reduced salinity on growth and body composition in the European bass Dicentrarchus labrax (L.). Aquaculture. 49, 333-358.
Díaz-Rosales, P., Burmeister, A., Aguilera, J., Korbee, N., Moriñigo, M., Figueroa, F., Chabrillón, M., Arijo, S., Lindequist, U., Balebona, M., 2005. Screening of algal extracts as potential stimulants of chemotaxis and respiratory burst activity of phagocytes from sole (Solea senegalensis). Bulletin of the European Association of Fish Pathologists. 25, 9-19.
Diler, I., Tekinay, A.A., Guroy, D., Guroy, B.K., Soyuturk, M., 2007. Effects of Ulva rigida on the growth, feed intake and body composition of common carp, Cyprinus carpio L.
Dominguez, M., Takemura, A., Tsuchiya, M., 2005. Effects of changes in environmental factors on the non‐specific immune response of Nile tilapia, Oreochromis niloticus L. Aquaculture Research. 36, 391-397.
Dworjanyn, S.A., Pirozzi, I., Liu, W., 2007. The effect of the addition of algae feeding stimulants to artificial diets for the sea urchin Tripneustes gratilla. Aquaculture. 273, 624-633.
Ellis, A.E., 1990. Lysozyme assays. Techniques in fish immunology. 1, 101-103. Ellis, T., North, B., Scott, A., Bromage, N., Porter, M., Gadd, D., 2002. The relationships
between stocking density and welfare in farmed rainbow trout. Journal of Fish Biology. 61, 493-531.
Ergün, S., Soyutürk, M., Güroy, B., Güroy, D., Merrifield, D., 2009. Influence of Ulva meal on growth, feed utilization, and body composition of juvenile Nile tilapia (Oreochromis niloticus) at two levels of dietary lipid. Aquaculture International. 17, 355-361.
Eroglu, A., Dogan, Z., Kanak, E., Atli, G., Canli, M., 2015. Effects of heavy metals (Cd, Cu, Cr, Pb, Zn) on fish glutathione metabolism. Environmental Science and Pollution Research. 22, 3229-3237.
FAO, 2014. The State of World Fisheries and Aquaculture: Opportunities and challenges. in: NATIONS, F.A.A.O.O.T.U. (Ed.), Rome, 2014.
FAO, 2016. Aquaculture Department (2009) The state of world fisheries and aquaculture 2008. Food and agriculture organization of the United Nations, Rome.
55
FAO, F.a.A.D., 2012. The State of World Fisheries and Aquaculture. FOOD AND AGRICULTURE ORGANIZATION OF THE UNITED NATIONS, Rome.
Fevolden, S., Røed, K., Gjerde, B., 1994. Genetic components of post-stress cortisol and lysozyme activity in Atlantic salmon; correlations to disease resistance. Fish & Shellfish Immunology. 4, 507-519.
Finkel, T., Holbrook, N.J., 2000. Oxidants, oxidative stress and the biology of ageing. Nature. 408, 239-247.
Fishbase, 2016. European seabass - Dicentrarchus labrax (Linnaeus, 1758), http://www.fishbase.org/summary/Dicentrarchus-labrax.html.
Francis, G., Makkar, H.P., Becker, K., 2001. Antinutritional factors present in plant-derived alternate fish feed ingredients and their effects in fish. Aquaculture. 199, 197-227.
García-Casal, M.N., Pereira, A.C., Leets, I., Ramírez, J., Quiroga, M.F., 2007. High iron content and bioavailability in humans from four species of marine algae. The Journal of nutrition. 137, 2691-2695.
Guerriero, G., Di Finizio, A., Ciarcia, G., 2002. Stress-induced changes of plasma antioxidants in aquacultured sea bass, Dicentrarchus labrax. Comparative Biochemistry and Physiology Part A: Molecular & Integrative Physiology. 132, 205-211.
Güroy, B., Ergün, S., Merrifield, D.L., Güroy, D., 2013. Effect of autoclaved Ulva meal on growth performance, nutrient utilization and fatty acid profile of rainbow trout, Oncorhynchus mykiss. Aquaculture International. 21, 605-615.
Güroy, B.K., CİRİK, Ş., Güroy, D., Sanver, F., TEKİNAY, A.A., 2007. Effects of Ulva rigida and Cystoseira barbata meals as a feed additive on growth performance, feed utilization, and body composition of Nile tilapia, Oreochromis niloticus. Turkish Journal of Veterinary and Animal Sciences. 31, 91-97.
Güroy, D., Güroy, B., Merrifield, D., Ergün, S., Tekinay, A., Yiğit, M., 2011. Effect of dietary Ulva and Spirulina on weight loss and body composition of rainbow trout, Oncorhynchus mykiss (Walbaum), during a starvation period. Journal of animal physiology and animal nutrition. 95, 320-327.
Gutt, J., 1985. The growth of juvenile flounders (Platichthys flesus L.) at salinities of 0, 5, 15 and 35%%. Journal of Applied Ichthyology. 1, 17-26.
Habig, W.H., Pabst, M.J., Jakoby, W.B., 1974. Glutathione S-transferases the first enzymatic step in mercapturic acid formation. Journal of biological Chemistry. 249, 7130-7139.
Haroun-Bouhedja, F., Ellouali, M., Sinquin, C., Boisson-Vidal, C., 2000. Relationship between sulfate groups and biological activities of fucans. Thrombosis research. 100, 453-459.
Hashim, R., Saat, M.A.M., 1992. The utilization of seaweed meals as binding agents in pelleted feeds for snakehead (Channa striatus) fry and their effects on growth. Aquaculture. 108, 299-308.
Hemmingson, J., Falshaw, R., Furneaux, R., Thompson, K., 2006. Structure and antiviral activity of the galactofucan sulfates extracted from Undaria pinnatifida (Phaeophyta). Journal of Applied Phycology. 18, 185-193.
Heo, S.-J., Park, E.-J., Lee, K.-W., Jeon, Y.-J., 2005. Antioxidant activities of enzymatic extracts from brown seaweeds. Bioresource Technology. 96, 1613-1623.
Hoar, W.S., Randall, D.J., Iwama, G., Nakanishi, T., 1997. The fish immune system: organism, pathogen, and environment. Academic Press.
Horie, Y., Sugase, K., Horie, K., 1995. Physiological differences of soluble and insoluble dietary fibre fractions of brown algae and mushrooms in pepsin activity in vitro and protein digestibility. Asian Pacific Journal of Clinical Nutrition. 4, 251-255.
ICES, 2013. Report of the Working Group on Assessment of New MoU Species (WGNEW). Imsland, A.K., Björnsson, B.T., Gunnarsson, S., Foss, A., Stefansson, S.O., 2007.
Temperature and salinity effects on plasma insulin-like growth factor-I concentrations and growth in juvenile turbot (Scophthalmus maximus). Aquaculture. 271, 546-552.
INE, 2013. Instituto Nacional de Estatistica. Jeney, G., Jeney, Z., 2002. Application of immunostimulants for modulation of the non‐
specific defense mechanisms in sturgeon hybrid: Acipenser ruthenus× A. baerii. Journal of Applied Ichthyology. 18, 416-419.
Jeney, G., Galeotti, M., Volpatti, D., 1994. Effect of immunostimulation on the non specific immune response of sea bass Dicentrarchus labrax, International Symposium on Aquatic Animal Health, Seattle, Washington, USA, 4e8 September.
Jiménez-Escrig, A., Gomez-Ordonez, E., Rupérez, P., 2011. Seaweed as a source of novel nutraceuticals: sulfated polysaccharides and peptides. Adv Food Nutr Res. 64, 325-337.
Jollès, P., Jollès, J., 1984. What's new in lysozyme research? Molecular and cellular biochemistry. 63, 165-189.
Kajita, Y., Sakai, M., Atsuta, S., Kobayashi, M., 1990. The immunomodulatory effects of levamisole on rainbow trout, Oncorhynchus mykiss. 魚病研究. 25, 93-98.
Katzenback, B.A., Katakura, F., Belosevic, M., 2012. Regulation of teleost macrophage and neutrophil cell development by growth factors and transcription factors. INTECH Open Access Publisher.
Killie, J.-E.A., Jørgensen, T.Ø., 1994. Immunoregulation in fish I: Intramolecular-induced suppression of antibody responses to haptenated protein antigens studied in Atlantic salmon (Salmo salar L). Developmental & Comparative Immunology. 18, 123-136.
Kim, J.-H., Lee, J.-S., Kang, J.-C., 2012. Effect of inorganic mercury on hematological and antioxidant parameters on olive flounder Paralichthys olivaceus. Fisheries and aquatic sciences. 15, 215-220.
Kissil, G., Lupatsch, I., Neori, A., 1992. Approaches to fish feed in Israeli mariculture as a result of environmental constraints. Collected reprints. 18. 359Á369.
Kitao, T., Yoshida, T., Anderson, D., Dixon, O., Blanch, A., 1987. Immunostimulation of antibody‐producing cells and humoral antibody to fish bacterins by a biological response modifier. Journal of Fish Biology. 31, 87-91.
Kopecka, J., Pempkowiak, J., 2008. Temporal and spatial variations of selected biomarker activities in flounder (Platichthys flesus) collected in the Baltic proper. Ecotoxicology and environmental safety. 70, 379-391.
Koumans-van Diepen, J.C.E., 1993. Characterisation of fish leucocytes. An immunocytochemical and functional study in carp (Cyprinus carpio L.), Department of Experimental Animal Morphology and Cell Biology. Wageningen Agricultural University, Netherlands.
Koyanagi, S., Tanigawa, N., Nakagawa, H., Soeda, S., Shimeno, H., 2003. Oversulfation of fucoidan enhances its anti-angiogenic and antitumor activities. Biochemical pharmacology. 65, 173-179.
Lahaye, M., Gomez‐Pinchetti, J.L., del Rio, M.J., Garcia‐Reina, G., 1995. Natural decoloration, composition and increase in dietary fibre content of an edible marine algae, Ulva rigida (Chlorophyta), grown under different nitrogen conditions. Journal of the Science of Food and Agriculture. 68, 99-104.
Lambert, Y., Dutil, J.-D., Munro, J., 1994. Effects of intermediate and low salinity conditions on growth rate and food conversion of Atlantic cod (Gadus morhua). Canadian Journal of Fisheries and Aquatic Sciences. 51, 1569-1576.
Lemarie, G., Dosdat, A., Covès, D., Dutto, G., Gasset, E., Person-Le Ruyet, J., 2004. Effect of chronic ammonia exposure on growth of European seabass (Dicentrarchus labrax) juveniles. Aquaculture. 229, 479-491.
Leonard, S., Sweeney, T., Bahar, B., Lynch, B., O'Doherty, J., 2011. Effects of dietary seaweed extract supplementation in sows and post-weaned pigs on performance, intestinal morphology, intestinal microflora and immune status. British journal of nutrition. 106, 688-699.
57
Liao, W.-R., Lin, J.-Y., Shieh, W.-Y., Jeng, W.-L., Huang, R., 2003. Antibiotic activity of lectins from marine algae against marine vibrios. Journal of Industrial Microbiology and Biotechnology. 30, 433-439.
Liener, I.E., 1994. Implications of antinutritional components in soybean foods. Critical Reviews in Food Science & Nutrition. 34, 31-67.
Limón-Pacheco, J., Gonsebatt, M.E., 2009. The role of antioxidants and antioxidant-related enzymes in protective responses to environmentally induced oxidative stress. Mutation Research/Genetic Toxicology and Environmental Mutagenesis. 674, 137-147.
Livingstone, D., 2001. Contaminant-stimulated reactive oxygen species production and oxidative damage in aquatic organisms. Marine pollution bulletin. 42, 656-666.
Livingstone, D., 2003. Oxidative stress in aquatic organisms in relation to pollution and aquaculture. Revue de Medecine Veterinaire. 154, 427-430.
Low, C., Wadsworth, S., Burrells, C., Secombes, C., 2003. Expression of immune genes in turbot (Scophthalmus maximus) fed a nucleotide-supplemented diet. Aquaculture. 221, 23-40.
Lushchak, V.I., Bagnyukova, T.V., 2006. Effects of different environmental oxygen levels on free radical processes in fish. Comparative Biochemistry and Physiology Part B: Biochemistry and Molecular Biology. 144, 283-289.
Magnuson, J.J., Crowder, L.B., Medvick, P.A., 1979. Temperature as an ecological resource. American Zoologist. 19, 331-343.
Makkar, H., 1993. Antinutritional factors in foods for livestock. BSAP occasional publication: An occasional publication of the British Society of Animal Production.
Makkar, H.P., Tran, G., Heuzé, V., Giger-Reverdin, S., Lessire, M., Lebas, F., Ankers, P., 2016. Seaweeds for livestock diets: A review. Animal Feed Science and Technology. 212, 1-17.
Marinho, G., Nunes, C., Sousa-Pinto, I., Pereira, R., Rema, P., Valente, L.M., 2013. The IMTA-cultivated Chlorophyta Ulva spp. as a sustainable ingredient in Nile tilapia (Oreochromis niloticus) diets. Journal of applied phycology. 25, 1359-1367.
Mata, L., Schuenhoff, A., Santos, R., 2010. A direct comparison of the performance of the seaweed biofilters, Asparagopsis armata and Ulva rigida. Journal of Applied Phycology. 22, 639-644.
Mohandas, J., Marshall, J.J., Duggin, G.G., Horvath, J.S., Tiller, D.J., 1984. Differential distribution of glutathione and glutathione-related enzymes in rabbit kidney: possible implications in analgesic nephropathy. Biochemical pharmacology. 33, 1801-1807.
Montero, D., Izquierdo, M., Tort, L., Robaina, L., Vergara, J., 1999. High stocking density produces crowding stress altering some physiological and biochemical parameters in gilthead seabream, Sparus aurata, juveniles. Fish Physiology and Biochemistry. 20, 53-60.
Montgomery, W.L., Gerking, S.D., 1980. Marine macroalgae as foods for fishes: an evaluation of potential food quality. Environmental Biology of Fishes. 5, 143-153.
Morgan, J.D., Iwama, G.K., 1991. Effects of salinity on growth, metabolism, and ion regulation in juvenile rainbow and steelhead trout (Oncorhynchus mykiss) and fall chinook salmon (Oncorhynchus tshawytscha). Canadian Journal of Fisheries and Aquatic Sciences. 48, 2083-2094.
Mosser, M., Hettler, W., 1989. Routine metabolism of juvenile spot, Leiostomus xanthurus. J Fish Biol. 35, 703-707.
Mustafa, M.G., Nakagawa, H., 1995. A review: dietary benefits of algae as an additive in fish feed. Israeli Journal of Aquaculture-Bamidgeh. 47, 155-162.
Nagler, P.L., Glenn, E.P., Nelson, S.G., Napolean, S., 2003. Effects of fertilization treatment and stocking density on the growth and production of the economic seaweed Gracilaria parvispora (Rhodophyta) in cage culture at Molokai, Hawaii. Aquaculture. 219, 379-391.
58
Nakagawa, H., 1997. Effect of dietary algae on improvement of lipid metabolism in fish. Biomedicine & pharmacotherapy. 51, 345-348.
Nakagawa, H., Umino, T., Tasaka, Y., 1997. Usefulness of Ascophyllum meal as a feed additive for red sea bream, Pagrus major. Aquaculture. 151, 275-281.
Nakajima, K., 1991. Effects of dimethyl-beta-propiothetin on growth and thrust power of rainbow trout. Bulletin of the Japanese Society of Scientific Fisheries (Japan).
Nakajima, K., Uchida, A., Ishida, Y., 1989. Effect of a feeding attractant, dimethyl-beta-propiothetin, on growth of marine fish [red sea bream, yellowtail and flounder]. Bulletin of the Japanese Society of Scientific Fisheries (Japan).
Nakatsuji, T., Gallo, R.L., 2012. Antimicrobial peptides: old molecules with new ideas. Journal of Investigative Dermatology. 132, 887-895.
Narasimhan, M.K., Pavithra, S.K., Krishnan, V., Chandrasekaran, M., 2013. In vitro analysis of antioxidant, antimicrobial and antiproliferative activity of Enteromorpha antenna, Enteromorpha linza and Gracilaria corticata extracts. Jundishapur Journal of Natural Pharmaceutical Products. 8, 151.
Nayak, S., 2010. Probiotics and immunity: a fish perspective. Fish & shellfish immunology. 29, 2-14.
Neori, A., Shpigel, M., Ben-Ezra, D., 2000. A sustainable integrated system for culture of fish, seaweed and abalone. Aquaculture. 186, 279-291.
Neyrinck, A.M., Mouson, A., Delzenne, N.M., 2007. Dietary supplementation with laminarin, a fermentable marine β (1–3) glucan, protects against hepatotoxicity induced by LPS in rat by modulating immune response in the hepatic tissue. International immunopharmacology. 7, 1497-1506.
Nyberg, C.D., Thomsen, M.S., Wallentinus, I., 2009. Flora and fauna associated with the introduced red alga Gracilaria vermiculophylla. European Journal of Phycology. 44, 395-403.
Obach, A., Quentel, C., Laurencin, F.B., 1993. Dicen trarch us la brax. Diseases of Aquatic Organisms. 15, 175-185.
Ogier de Baulny, M., Quentel, C., Fournier, V., Lamour, F., Le Gouvello, R., 1996. Effect of long-term oral administration of β-glucan as an immunostimulant or an adjuvant on some non-specific parameters of the immune response of turbot Scophthalmus maximus. Diseases of Aquatic Organisms. 26, 139-147.
Ohkawa, H., Ohishi, N., Yagi, K., 1979. Assay for lipid peroxides in animal tissues by thiobarbituric acid reaction. Analytical biochemistry. 95, 351-358.
Olsen, R., Henderson, R., 1997. Muscle fatty acid composition and oxidative stress indices of Arctic charr, Salvelinus alpinus (L.), in relation to dietary polyunsaturated fatty acid levels and temperature. Aquaculture Nutrition. 3, 227-238.
Olsen, R.E., Sundell, K., Mayhew, T.M., Myklebust, R., Ringø, E., 2005. Acute stress alters intestinal function of rainbow trout, Oncorhynchus mykiss (Walbaum). Aquaculture. 250, 480-495.
Olsen, R.E., Sundell, K., Hansen, T., Hemre, G.-I., Myklebust, R., Mayhew, T.M., Ringø, E., 2002. Acute stress alters the intestinal lining of Atlantic salmon, Salmo salar L.: An electron microscopical study. Fish physiology and biochemistry. 26, 211-221.
Ortiz, J., Romero, N., Robert, P., Araya, J., Lopez-Hernández, J., Bozzo, C., Navarrete, E., Osorio, A., Rios, A., 2006. Dietary fiber, amino acid, fatty acid and tocopherol contents of the edible seaweeds Ulva lactuca and Durvillaea antarctica. Food chemistry. 99, 98-104.
Partridge, G.J., Jenkins, G.I., 2002. The effect of salinity on growth and survival of juvenile black bream (Acanthopagrus butcheri). Aquaculture. 210, 219-230.
Pascual, P., Pedrajas, J., Toribio, F., López-Barea, J., Peinado, J., 2003. Effect of food deprivation on oxidative stress biomarkers in fish (Sparus aurata). Chemico-biological interactions. 145, 191-199.
Peddie, S., Zou, J., Secombes, C.J., 2002. Immunostimulation in the rainbow trout (Oncorhynchus mykiss) following intraperitoneal administration of Ergosan. Veterinary immunology and immunopathology. 86, 101-113.
59
Peixoto, M.J., Salas-Leitón, E., Pereira, L.F., Queiroz, A., Magalhães, F., Pereira, R., Abreu, H., Reis, P.A., Gonçalves, J.F.M., de Almeida Ozório, R.O., 2016. Role of dietary seaweed supplementation on growth performance, digestive capacity and immune and stress responsiveness in European seabass (Dicentrarchus labrax). Aquaculture Reports. 3, 189-197.
Peng, C., Hong-BO, S., Di, X., Song, Q., 2009. Progress in Gracilaria biology and developmental utilization: main issues and prospective. Reviews in Fisheries Science. 17, 494-504.
Pereira, R., Kraemer, G., Yarish, C., Sousa-Pinto, I., 2008. Nitrogen uptake by gametophytes of Porphyra dioica (Bangiales, Rhodophyta) under controlled-culture conditions. European Journal of Phycology. 43, 107-118.
Pereira, R., Valente, L.M., Sousa-Pinto, I., Rema, P., 2012. Apparent nutrient digestibility of seaweeds by rainbow trout (Oncorhynchus mykiss) and Nile tilapia (Oreochromis niloticus). Algal Research. 1, 77-82.
Person-Le Ruyet, J., Mahe, K., Le Bayon, N., Le Delliou, H., 2004. Effects of temperature on growth and metabolism in a Mediterranean population of European sea bass, Dicentrarchus labrax. Aquaculture. 237, 269-280.
Person-Le Ruyet, J., Lacut, A., Le Bayon, N., Le Roux, A., Pichavant, K., Quéméner, L., 2003. Effects of repeated hypoxic shocks on growth and metabolism of turbot juveniles. Aquatic Living Resources. 16, 25-34.
Pham, M.A., Lee, K., Lee, B., Lim, S., Kim, S., Lee, Y., Heo, M., Lee, K., 2006. Effects of dietary Hizikia fusiformis on growth and immune responses in juvenile olive flounder (Paralichthys olivaceus). ASIAN AUSTRALASIAN JOURNAL OF ANIMAL SCIENCES. 19, 1769.
Pichavant, K., Person‐Le‐Ruyet, J., Bayon, N.L., Severe, A., Roux, A.L., Boeuf, G., 2001. Comparative effects of long‐term hypoxia on growth, feeding and oxygen consumption in juvenile turbot and European sea bass. Journal of Fish Biology. 59, 875-883.
Pickering, A., 1992. Rainbow trout husbandry: management of the stress response. Aquaculture. 100, 125-139.
Pickering, A., Pottinger, T., 1989. Stress responses and disease resistance in salmonid fish: effects of chronic elevation of plasma cortisol. Fish physiology and biochemistry. 7, 253-258.
Pickett, G.D., Pawson, M.G., 1994. Sea Bass: Biology. Springer Science & Business Media. Pinchetti, J.L.G., del Campo Fernández, E., Díez, P.M., Reina, G.G., 1998. Nitrogen
availability influences the biochemical composition and photosynthesis of tank-cultivated Ulva rigida (Chlorophyta). Journal of Applied Phycology. 10, 383-389.
Plaza, M., Cifuentes, A., Ibáñez, E., 2008. In the search of new functional food ingredients from algae. Trends in Food Science & Technology. 19, 31-39.
Priede, I.G., 1985. Metabolic scope in fishes, Fish Energetics. Springer, pp. 33-64. Quade, M.J., Roth, J.A., 1997. A rapid, direct assay to measure degranulation of bovine
neutrophil primary granules. Veterinary Immunology and Immunopathology. 58, 239-248.
Reynolds, W.W., Casterlin, M.E., 1979. Behavioral thermoregulation and the “final preferendum” paradigm. American zoologist. 19, 211-224.
Roberts, R.J., 2012. Fish pathology. John Wiley & Sons, USA. Roche, H., Bogé, G., 1996. Fish blood parameters as a potential tool for identification of
stress caused by environmental factors and chemical intoxication. Marine Environmental Research. 41, 27-43.
Sáez, M., Martinez, T., Alarcon, J., 2012. Effect of dietary inclusion of seaweeds on intestinal proteolytic activity of juvenile seabream, Sparus aurata, 15th Int. Symp. of Nutrition and Feeding of Fish P.
Sakai, M., 1999. Current research status of fish immunostimulants. Aquaculture. 172, 63-92.
60
Sakai, M., Otubo, T., Atsuta, S., Kobayashi, M., 1993. Enhancement of resistance to bacterial infection in rainbow trout, Oncorhynchus mykiss (Walbaum), by oral administration of bovine lactoferrin. Journal of Fish Diseases. 16, 239-247.
Sakai, M., Kamiya, H., Ishii, S., Atsuta, S., Kobayashi, M., 1992. The immunostimulating effects of chitin in rainbow trout, Oncorhynchus mykiss. Diseases in Asian aquaculture. 1, 413-417.
Sangiao-Alvarellos, S., Laiz-Carrión, R., Guzmán, J.M., del Río, M.P.M., Miguez, J.M., Mancera, J.M., Soengas, J.L., 2003. Acclimation of S. aurata to various salinities alters energy metabolism of osmoregulatory and nonosmoregulatory organs. American Journal of Physiology-Regulatory, Integrative and Comparative Physiology. 285, R897-R907.
Sangiao‐Alvarellos, S., Guzmán, J.M., Láiz‐Carrión, R., Míguez, J.M., Martín Del Río, M.P., Mancera, J.M., Soengas, J.L., 2005. Interactive effects of high stocking density and food deprivation on carbohydrate metabolism in several tissues of gilthead sea bream Sparus auratus. Journal of Experimental Zoology Part A: Comparative Experimental Biology. 303, 761-775.
Sarropoulou, E., Fernandes, J.M., Mitter, K., Magoulas, A., Mulero, V., Sepulcre, M.P., Figueras, A., Novoa, B., Kotoulas, G., 2010. Evolution of a multifunctional gene: the warm temperature acclimation protein Wap65 in the European seabass Dicentrarchus labrax. Molecular phylogenetics and evolution. 55, 640-649.
Satoh, K., 1987. Effect of Ulva meal supplementation on disease resistance of red sea bream. 日本水産学会誌. 53, 1115-1120.
Scapigliati, G., Romano, N., Buonocore, F., Picchietti, S., Baldassini, M., Prugnoli, D., Galice, A., Meloni, S., Secombes, C., Mazzini, M., 2002. The immune system of sea bass, Dicentrarchus labrax, reared in aquaculture. Developmental & Comparative Immunology. 26, 151-160.
Schijf, J., Ebling, A.M., 2010. Investigation of the Ionic Strength Dependence of Ulva lactuca Acid Functional Group p K as by Manual Alkalimetric Titrations. Environmental science & technology. 44, 1644-1649.
Schmidt-Nielsen, K., 1997. Animal physiology: adaptation and environment. Cambridge University Press.
Schuenhoff, A., Shpigel, M., Lupatsch, I., Ashkenazi, A., Msuya, F.E., Neori, A., 2003. A semi-recirculating, integrated system for the culture of fish and seaweed. Aquaculture. 221, 167-181.
Secombes, C., Hardie, L., Daniels, G., 1996. Cytokines in fish: an update. Fish & Shellfish Immunology. 6, 291-304.
Sengupta, P., Garrity, P., 2013. Sensing temperature. Current Biology. 23, R304-R307. Sevcikova, M., Modra, H., Slaninova, A., Svobodova, Z., 2011. Metals as a cause of
oxidative stress in fish: a review. Vet Med. 56, 537-546. Shields, R.J., Lupatsch, I., 2012. Algae for aquaculture and animal feeds. J Anim Sci. 21,
Sánchez, J., 2005. Effect of fish meal replacement by plant protein sources on non-specific defence mechanisms and oxidative stress in gilthead sea bream (Sparus aurata). Aquaculture. 249, 387-400.
Soler-Vila, A., Coughlan, S., Guiry, M.D., Kraan, S., 2009. The red alga Porphyra dioica as a fish-feed ingredient for rainbow trout (Oncorhynchus mykiss): effects on growth, feed efficiency, and carcass composition. Journal of Applied Phycology. 21, 617-624.
Sunyer, J., Gomez, E., Tort, L., Navarro, V., Quesada, J., 1995. Physiological responses and depression of humoral components of the immune system in gilthead sea bream (Sparus aurata) following daily acute stress. Canadian Journal of Fisheries and Aquatic Sciences. 52, 2339-2346.
61
Thanigaivel, S., Chandrasekaran, N., Mukherjee, A., Thomas, J., 2015. Investigation of seaweed extracts as a source of treatment against bacterial fish pathogen. Aquaculture. 448, 82-86.
Thomsen, M., McGlathery, K.J., 2007. Stress tolerance of the invasive macroalgae Codium fragile and Gracilaria vermiculophylla in a soft-bottom turbid lagoon. Biological Invasions. 9, 499-513.
Torrecillas, S., Makol, A., Caballero, M., Montero, D., Robaina, L., Real, F., Sweetman, J., Tort, L., Izquierdo, M., 2007. Immune stimulation and improved infection resistance in European sea bass (Dicentrarchus labrax) fed mannan oligosaccharides. Fish & Shellfish Immunology. 23, 969-981.
Tort, L., Rotllant, J., Rovira, L., 1998. Immunological suppression in gilthead sea bream Sparus aurata of the North-West Mediterranean at low temperatures. Comparative Biochemistry and Physiology Part A: Molecular & Integrative Physiology. 120, 175-179.
Tort, L., Balasch, J., MacKenzie, S., 2004. Fish health challenge after stress. Indicators of immunocompetence. Contributions to Science. 2, 443-454.
Tsevis, N., Klaoudatos, S., Conides, A., 1992. Food conversion budget in sea bass, Dicentrarchus labrax, fingerlings under two different feeding frequency patterns. Aquaculture. 101, 293-304.
Vadstein, O., 1997. The use of immunostimulation in marine larviculture: possibilities and challenges. Aquaculture. 155, 401-417.
Valente, L., Gouveia, A., Rema, P., Matos, J., Gomes, E., Pinto, I., 2006. Evaluation of three seaweeds Gracilaria bursa-pastoris, Ulva rigida and Gracilaria cornea as dietary ingredients in European sea bass (Dicentrarchus labrax) juveniles. Aquaculture. 252, 85-91.
Valente, L.M., Araújo, M., Batista, S., Peixoto, M.J., Sousa-Pinto, I., Brotas, V., Cunha, L.M., Rema, P., 2016. Carotenoid deposition, flesh quality and immunological response of Nile tilapia fed increasing levels of IMTA-cultivated Ulva spp. Journal of Applied Phycology. 28, 691-701.
Van der Oost, R., Beyer, J., Vermeulen, N.P., 2003. Fish bioaccumulation and biomarkers in environmental risk assessment: a review. Environmental toxicology and pharmacology. 13, 57-149.
Vinagre, C., Ferreira, T., Matos, L., Costa, M., Cabral, H., 2009. Latitudinal gradients in growth and spawning of sea bass, Dicentrarchus labrax, and their relationship with temperature and photoperiod. Estuarine, Coastal and Shelf Science. 81, 375-380.
Vinagre, C., Madeira, D., Narciso, L., Cabral, H.N., Diniz, M., 2012. Effect of temperature on oxidative stress in fish: lipid peroxidation and catalase activity in the muscle of juvenile seabass, Dicentrarchus labrax. Ecological indicators. 23, 274-279.
Waagbø, R., Glette, J., Sandnes, K., Hemre, G., 1994. Influence of dietary carbohydrate on blood chemistry, immunity and disease resistance in Atlantic salmon, Salmo salar L. Journal of Fish Diseases. 17, 245-258.
Wahbeh, M.I., 1997. Amino acid and fatty acid profiles of four species of macroalgae from Aqaba and their suitability for use in fish diets. Aquaculture. 159, 101-109.
Wassef, E., El Masry, M., Mikhail, F., 2001. Growth enhancement and muscle structure of striped mullet, Mugil cephalus L., fingerlings by feeding algal meal‐based diets. Aquaculture Research. 32, 315-322.
Wassef, E.A., El-Sayed, A.-F.M., Sakr, E.M., 2013. Pterocladia (Rhodophyta) and Ulva (Chlorophyta) as feed supplements for European seabass, Dicentrarchus labrax L., fry. Journal of applied phycology. 25, 1369-1376.
Wassef, E.A., El-Sayed, A.F.M., Kandeel, K.M., Sakr, E.M., 2005. Evaluation of Pterocladia (Rhodophyta) and Ulva (Chlorophyta) meals as additives to gilthead seabream Sparus aurata diets. Egypt J Aquat Res. 31, 321-332.
Xu, B., Hirata, H., 1990. Effects of feed additive Ulva reproduced in feedback culture system on the growth and color of red sea bream, Pagrus major. Suisanzoshoku (Japan).
62
Yano, T., Mangindaan, Mangindaan, R.E., 1989. Enhancement of the resistance of carp Cyprinus carpio to experimental Edwardsiella tarda infection, by some. BETA.-1, 3-glucans. 日本水産学会誌. 55, 1815-1819.
Yi, Y.-H., Chang, Y.-J., 1994. Physiological effects of seamustard supplement diet on the growth and body composition of young rockfish, Sebastes schlegeli. Korean Journal of Fisheries and Aquatic Sciences. 27, 69-82.
Yokoyama, H., Ishihi, Y., 2010. Bioindicator and biofilter function of Ulva spp.(Chlorophyta) for dissolved inorganic nitrogen discharged from a coastal fish farm—potential role in integrated multi-trophic aquaculture. Aquaculture. 310, 74-83.
Yoshida, T., Sakai, M., Kitao, T., Khlil, S.M., Araki, S., Saitoh, R., Ineno, T., Inglis, V., 1993. Immunomodulatory effects of the fermented products of chicken egg, EF203, on rainbow trout, Oncorhynchus mykiss. Aquaculture. 109, 207-214.
Zanuy, S., Carrillo, M., 1984. La salinité: un moyen pour retarder la ponte du bar. L’aquaculture du bar. INRA Publication, Paris, 73-80.
Zong, W.-X., Thompson, C.B., 2006. Necrotic death as a cell fate. Genes & development. 20, 1-15.
63
Attachments LABORATORY ANALYSIS PROCEDURES
Complement system – (Sunyer et al., 1995)
First, the sample of rabbit red blood cells was cleaned with physiological serum (NaCl 0.9%)
in a 1:4 ratio (blood:serum), and centrifuged for 5 min. at 2000 G. We collected a clear pink
solution with 2.8x10⁸ cell/ml (RaRBC), determined using a 1:200 dilution and resorting to
cell counting and a microscope. We measured the correct dilution required for 50%
hemolysis, by adding a previously calculated amount of rabbit’s blood solution and 10µl of
our plasma samples to the 96-well microplate. In this experiment, we tested serial dilutions
from 1:8 to 1:96. Incubation occurred for 100 minutes, with continuous agitation, and
stopped with a solution composed of 0.1 % gelatin, 5mM sodium barbiturate, 0.13 mM
sodium chloride and 20mM EDTA, pH of 7.3.
Finally, microplates were centrifuged at 122G for 2.5 min. 150µl were then pipetted to a new
microplate and the lysed cells measured at the absorbance of 414 nm wavelength. The
alternative complement pathway (ACH50) units were defined as the concentration of
plasma giving 50% hemolysis of RaRBC. All analyses were conducted in triplicates.
Peroxidase - (Quade and Roth, 1997)
To estimate the plasmatic peroxidase content, 135 µl of a stabilizing environment of Hank's
Balanced Salt Solution (HBSS Ca2+ free) was added to a flat bottom 96-well microplate,
followed by 15µl of plasma sample, 50µl of tetremethylbenzidine hydrochloride (TMB) and
50 µl of hydrogen peroxide (H2O2), allowing reaction to occur. After 2 min, 50 µl of 2 mM of
sulfuric acid (H2SO4) to stop the reaction. The principle behind the reaction is that TMB can
act as a hydrogen donor for the reduction of hydrogen peroxide to water by peroxidase
enzymes, such as the exocytosis myeloperoxidase and eosinophilic peroxidase. By adding
sulfuric acid, TMB turns yellow and the absorbance is read at 450 nm. Final unit is presented
as enzymatic units, with one enzymatic being defined as the amount producing an
absorbance change of 1.62 units.
Lysozyme - (Ellis, 1990)
This procedure starts with the preparation of a 0.5 mg/ml of Micrococus lysodeikticusa
solution in a 0.05M sodium phosphate dibasic (Na2HPO4) buffer. This bacterial solution will
be used as target subtract for the lysozyme present in the samples. 15 consecutive dilutions
of Hen egg-white lysozyme (HEWL), from 1 mg/ml to 0.0049µg/ml, are used to find the
64
equation from where we can calculate the actual concentration. A reaction mix of 15µl
plasma sample and 250µl of bacterial suspension was then read at 450nm wavelength in 2
timings, 30 seconds and 270 seconds.
Protein quantification - (Bradford, 1976)
Initially, a standard curve of 250 µl BioRad® with 10µl of a known concentration of bovine
gamma globulin (0, 0.2, 0.5 and 1 mg.ml-1) was created. After a 15 min incubation in the
dark (to avoid light damage), and a final reading at 600 nm, we were able to calculate the
concentration of our samples placed under the same conditions.
Lipid peroxidation - (Ohkawa et al., 1979)
The reaction complex is composed of: 150 µl of liver homogenate, 500 µl of TBA
(Thiobarbituric acid), 500 µl of TCA (Trichloroacetic acid), 400 µl of Tris-HCl
(Trisaminometane) at 60 mM with 0.1 mM DTPA (diethylene triamine pentaacetic acid).
After an incubation period of 60 min at 100 ºC, a centrifugation of 11500G, at 25 ºC, for 5
min was made. Samples were then read at 535nm. The principle of this analysis is that the
MDA-TBA adducts formed by the reaction of MDA and TBA under high temperature (100°C)
and acidic conditions (TCA) can be measured calorimetrically at 535 nm. With the
absorbance of this measurement and the extinction coefficient of the MDA-TBA complex
(1.56 x 10⁵ M-1.cm-1), the actual concentration of the lipid, peroxidation product (MDA), can
be quantified. Units are presented as nmoles of MDA formed.mg protein-1.
Catalase - (Claiborne, 1985)
The reaction complex was based on 15 µl of sample, 135 µl of K-phosphate buffer at 0.05
M (pH 7) and 150 µl of peroxide hydrogen (H2O2) at 0.03 M. The peroxide hydrogen
concentration was then accessed by spectrophotometry at 240 nm for the first minute. This
absorbance, along with the peroxide hydrogen extinction coefficient (40 M-1.cm-1) allowed
the calculation of the catalase activity slope. Final unit is presented µmol.min-1.protein mg-
1.
Glutathione s-transferase - (Habig et al., 1974)
For this reaction, 100 µl of sample was added to 4.95 ml of phosphate buffer (0.1M; pH 6.5),
900μL of reduced glutathione (GSH) at 10mM and to 150μL of CDNB (1-chloro-2,4-
dinitrobenzene) at 10mM. Spectrophotometer readings were made at 340nm wavelength
every 20 secs. for 5 min., after all reagents were combined. The enzyme Glutathione-S-
transferase (GST) conjugates CDNB (substrate) with glutathione (GSH) originating a
complex. The formation of this compound (ε =9.6 mM-1.cm-1) can be monitored at 340 nm,
65
registering an increase in the absorbance over time. Results are expressed in µmol GSH-
CDNB conjugate formed in min-1.protein mg-1.
Glutathione peroxidase - (Mohandas et al., 1984)
This requires the peptide GSH and peroxide hydrogen to recreate a reaction mix composed
of: 840 µl of K-Phosphate 0.05M (pH 7.0) with EDTA 1mM and Sodium azide (1mM) and
GR at 1 U/ml; 50 µL GSH 4mM, 50µL NADPH (Nicotinamide adenine dinucleotide
phosphate) 0.8mM, 10 µL H2O2 0.5mM and finally 50 µL of sample. Measurements were
recorded at 340nm for 5 min (every 20 seconds = 15 readings total). The decrease in
NADPH absorbance measured at 340 nm during the oxidation of NADPH to NADP+ is
indicative of GPX activity, since GPX is the rate limiting factor of the coupled reactions.
Glutathione reductase - (Cribb et al., 1989)
In this method, a reaction buffer (pH 7.0) with 0.0085g of NADPH, 0.0033g of GSSG and
0.0098g of DTPA is mixed. Then, 15µL of sample (or homogenization buffer as blank) plus
285 µL of reaction buffer is added to a microplate. Readings were made at 340 nm wave
length for 1 min (every 20 sec readings = 3 total readings). The absorbance increasing rate
is directly proportional to the amount of glutathione reductase in the sample.
Total Glutathione - (Baker et al., 1990)
Total glutathione (TG) required a previous treatment, where 10 µl of ultra-pure water were
added to 200µl sample and left to incubate for 1 hour at 25 ºC. After this, 200 µl of 12%
pure TCA (Trichloroacetic acid) were added, incubated for 1 hour at 4ºC, followed by a
centrifugation at 10000G for 5 min. The reaction per se included 20µL of treated sample,
175µL Na-K phosphate (0.2M pH 8.0), 30µL of NADPH, 60µL of DTNB and 15µL of GR.
Samples were read at 412nm wavelength for 10 min.
66
POSTER PRESENTATION
IJUP – Meeting of young researchers at University of Porto February 17th 2016 – Poster Presentation