Page 1
FACTORS INFLUENCING THE OPTIMIZATION OF ORGANIZATIONAL
SUSTAINABLE PERFORMANCE:
A CASE STUDY OF PT. MULIA REALTY BATINDO IN BATAM, INDONESIA
GAYATHRI SELVARAJU
Research report in partial fulfilment of the requirement for the degree of Master of
Business Administration (International Business)
UNIVERSITI SAINS MALAYSIA
2014
brought to you by COREView metadata, citation and similar papers at core.ac.uk
provided by Repository@USM
Page 2
ii
ACKNOWLEDGEMENT
This international business management project is the challenging research yet
enriches the knowledge. Firstly, I would like to thank my faculty, Graduate School of
Business (GSB), USM for giving me this valuable opportunity to conduct the
research in the beautiful country of Indonesia as well as experience the real-life work
situation in PT. Mulia Ralty Batindo, Batam for the period of 21 days.
The research could not be done without the guidance and support of my
supervisor. Therefore, I would like to express my gratitude to Dr. Rajendran
Muthuveloo for his time and effort to help and motivate me throughout the course of
doing this case study.
I would also like to thank Mr.Mulia Pamadi, the director of the company and
all the department managers of PT. Mulia Realty Batindo who helped and supported
me during the period of my stay in Batam, Indonesia.
Last but not least, I sincerely thank my parents, Selvaraju Sangan and Rakini
Govindasamy; my brothers, Sures Kumar Selvaraju and Bragkash Selvaraju and my
sis in law, Subaleka Satyanarayana for their caring, motivation and trust on me. Also
I thank my close friends for their guidance and support in completing this project.
Page 3
iii
TABLE OF CONTENTS
ACKNOWLEDGEMENT ........................................................................................... ii
TABLE OF CONTENTS ............................................................................................ iii
LIST OF TABLES .................................................................................................... viii
LIST OF FIGURES ..................................................................................................... x
ABSTRAK .................................................................................................................. xi
ABSTRACT ............................................................................................................... xii
CHAPTER 1: INTRODUCTION ................................................................................ 1
1.1. Introduction ................................................................................................... 1
1.2. Background of the Case Study ...................................................................... 1
1.3. Problem Statement ........................................................................................ 6
1.4. Review on I-TOP Model ............................................................................... 8
1.5. Research Objectives .................................................................................... 10
1.6. Case Issues .................................................................................................. 11
1.7. Definition of Key Terms ............................................................................. 11
1.8. Significance of Study .................................................................................. 12
1.9. Organization of Chapters ............................................................................. 13
CHAPTER 2: COUNTRY ANALYSIS .................................................................... 14
2.1 Introduction ................................................................................................. 14
2.2 An Overview of Indonesia........................................................................... 14
2.3 An Overview of Batam ................................................................................ 19
2.4 PESTLE Analysis ........................................................................................ 20
2.4.1 Political and Legal View of Batam ...................................................... 20
2.4.2 Economic View of Batam .................................................................... 22
Page 4
iv
2.4.3 Social View of Batam .......................................................................... 24
2.4.4 Technological View of Batam ............................................................. 25
2.4.5 Environmental View Of Batam ............................................................ 26
CHAPTER 3: INDUSTRY PROFILE AND ANALYSIS ........................................ 28
3.1 Introduction ................................................................................................. 28
3.2 Real Estate Industry Profile ......................................................................... 28
3.2.1 Overview of Real Estate Industry ........................................................ 28
3.2.2 United States Housing Bubble ............................................................. 30
3.3 Overview of Real Estate Industry in Indonesia ........................................... 32
3.4 Porter’s Five Forces Analysis ...................................................................... 33
3.4.1 Threat of New Entrants ........................................................................ 33
3.4.2 Bargaining Power of Buyers ................................................................ 34
3.4.3 Bargaining Power of Suppliers ............................................................ 34
3.4.4 Threat of Substitute Products and Services .......................................... 35
3.4.5 Rivalry among Existing Competitors ................................................... 35
3.5 Conclusion ................................................................................................... 36
CHAPTER 4: LITERATURE REVIEW ................................................................... 37
4.1 Literature Review ........................................................................................ 37
4.1.1 Organizational Sustainable Performance ............................................. 37
4.1.2 Technology Affecting Organizational Sustainable Performance ......... 39
4.1.3 Organization Type Affecting Organizational Sustainable
Performance ......................................................................................... 42
4.1.4 People Affecting Organizational Sustainable Performance ................. 45
Page 5
v
CHAPTER 5: RESEARCH METHODOLOGY ....................................................... 49
5.1 Introduction ................................................................................................. 49
5.2 Qualitative Case Study Approach ............................................................... 49
5.3 Research Design .......................................................................................... 51
5.3.1 Unit of Analysis ................................................................................... 51
5.3.2 Selection of Case Organization ............................................................ 52
5.4 Data Collection Methods ............................................................................. 52
5.4.1 Semi Structured Interviews .................................................................. 52
5.4.2 Observation and Secondary Data Collection ....................................... 53
5.5 Data Linkages .............................................................................................. 55
5.6 Details of Interview ..................................................................................... 57
5.6.1 List of People Interviewed ................................................................... 57
5.6.2 Interview Questions ............................................................................. 58
5.7 Documents Reviewed .................................................................................. 58
5.8 Analysis Approach ...................................................................................... 59
5.8.1 PESTEL Analysis ................................................................................ 59
5.8.2 Porter’s Five Forces Analysis .............................................................. 61
5.8.3 SWOT Analysis ................................................................................... 63
5.8.4 Diagnostic Tools for Corporate Strategy ............................................. 64
CHAPTER 6: CASE WRITE UP .............................................................................. 65
6.1 Introduction ................................................................................................. 65
6.2 Company Profile – PT. Mulia Realty Batindo ............................................ 65
6.3 The Vision, Mission and Tagline of PT. Mulia Realty Batindo .................. 67
6.4 Finance Department .................................................................................... 70
Page 6
vi
6.4.1 Organizational Structure Of Finance Department................................ 70
6.4.2 Process Mapping in Finance Department ............................................ 71
6.4.3 Job Description of Finance Department ............................................... 72
6.5 Human Resource Department ..................................................................... 75
6.5.1 Organizational Structure Of Human Resource Department................. 75
6.5.2 Process Mapping in Human Resource Department ............................. 76
6.5.3 Job Description of Human Resource Department ................................ 77
6.6 Marketing Department ................................................................................ 79
6.6.1 Organizational Structure Of Marketing Department............................ 79
6.6.2 Process Mapping in Marketing Department ........................................ 80
6.6.3 Job Description of Marketing Department ........................................... 81
6.7 Project Coordinator Department.................................................................. 86
6.7.1 Organizational Structure Of Project Coordinator Department............. 86
6.7.2 Process Mapping in Project Coordinator Department ......................... 87
6.7.3 Job Description of Project Coordinator................................................ 88
6.8 Quality Management System Department (QMS) .................................... 101
6.8.1 Organizational Structure Of Quality Management System
Department ........................................................................................ 101
6.8.2 Process Mapping in Quality Management System Department ........ 102
6.8.3 Job Description of Quality Management System (QMS)
Department ........................................................................................ 103
6.9 Conclusion ................................................................................................. 106
CHAPTER 7: CASE ANALYSIS ........................................................................... 107
7.1 Introduction ............................................................................................... 107
7.2 SWOT Analysis ......................................................................................... 107
7.3 Diagnostic Tool for Corporate Strategy .................................................... 115
Page 7
vii
7.4 Summary ................................................................................................... 120
CHAPTER 8: RECOMMENDATION AND CONCLUSION ............................... 122
8.1 Introduction ............................................................................................... 122
8.2 Recommendations ..................................................................................... 122
8.2.1 Technology (T)................................................................................... 122
8.2.2 Organizational Type (O) .................................................................... 124
8.2.3 People (P) ........................................................................................... 126
8.3 Implication on Practitioners ...................................................................... 130
8.4 Conclusion ................................................................................................. 130
REFERENCES ......................................................................................................... 132
APPENDIX 1
APPENDIX 2
APPENDIX 3
Page 8
viii
LIST OF TABLES
Table 2. 1: Average Annual GDP Growth from 1998 - 2013 .................................... 16
Table 2. 2: GDP of Indonesia from 2006 -2013 ........................................................ 17
Table 5. 1: List of the Department and Date Interview ............................................. 54
Table 5. 2: Data Sources, Method and Justification .................................................. 55
Table 5. 3: List of People Interviewed ....................................................................... 57
Table 5. 4: List of Documents Reviewed .................................................................... 58
Table 6. 1: Job Description, code of ethics and Authority of Finance Manager ....... 72
Table 6. 2: Job Description, code of ethics and Authority of Accountant ................. 73
Table 6. 3: Job Description, code of ethics and Authority of Cashier ....................... 74
Table 6. 4: Scope of Responsibility, Job Description and Code of Ethics of
Human Resource Manager...................................................................... 77
Table 6. 5: Scope of Responsibility, Job Description and Code of Ethics of
Human Resource Admin .......................................................................... 78
Table 6. 6: Job Description, Code of Ethics and authority of Marketing
Manager .................................................................................................. 81
Table 6. 7: Job Description, Code of Ethics and authority of Assistant
Marketing Manager................................................................................. 82
Table 6. 8: Job Description, Code of Ethics, Authority and Prohibition of
Marketing Executive ................................................................................ 83
Table 6. 9: Job Description, Code of Ethics, Authority and Prohibition of
Marketing Associate ................................................................................ 83
Table 6. 10: Job Description, Code of Ethics and Authority of Marketing
Administrator .......................................................................................... 84
Table 6. 11: Job Description, Code of Ethics and Authority of Marketing
Administrator .......................................................................................... 85
Table 6. 12: Scope of responsibility, Job Description and Code of Ethics for
Project Coordinator ................................................................................ 88
Table 6. 13: Scope of responsibility, Job Description and Code of Ethics for
Project Manager ..................................................................................... 90
Table 6. 14: Scope of responsibility, Job Description and Code of Ethics for
Site Engineer ........................................................................................... 91
Page 9
ix
Table 6. 15: Scope of responsibility, Job Description and Code of Ethics for
Supervisor................................................................................................ 92
Table 6. 16: Scope of responsibility, Job Description and Code of Ethics for
Surveyor .................................................................................................. 93
Table 6. 17: Scope of responsibility, Job Description and Code for Ethics of
Security .................................................................................................... 94
Table 6. 18: Scope of responsibility, Job Description and Code of Ethics for
Driver ...................................................................................................... 95
Table 6. 19: Scope of responsibility, Job Description and Code of Ethics for
Project Officer ......................................................................................... 96
Table 6. 20: Scope of responsibility, Job Description and Code of Ethics for
Utility Officer .......................................................................................... 97
Table 6. 21: Scope of responsibility, Job Description and Code of Ethics for
Property Manager ................................................................................... 98
Table 6. 22: Scope of responsibility, Job Description and Code of Ethics for
Project Administration .......................................................................... 100
Table 6. 23: Scope of responsibility, Job Description and Code of Ethics of
Management Representative ................................................................. 103
Table 6. 24: Scope of responsibility, Job Description and Code of Ethics of
Quality System Officer .......................................................................... 104
Table 6. 25: Scope of responsibility, Job Description and Code of Ethics of
Assistant Quality System Officers ......................................................... 105
Table 6. 26: Scope of responsibility, Job Description and Code of Ethics of
Internal Audit Coordinator ................................................................... 105
Table 6. 27: Scope of responsibility, Job Description and Code of Ethics of
Assistant IAC ......................................................................................... 106
Table 7. 1: SWOT Analysis for PT. Mulia Realty Batindo ...................................... 108
Table 7. 2: Diagnostic Tool for Pt.Mulia Realty Batindo ........................................ 115
Page 10
x
LIST OF FIGURES
Figure 3. 1: Median New House Prices vs Median Household Income in the
United State, 1967-2010 .......................................................................... 31
Figure 3. 2: Percentage Difference Between Median New Houses Price from
1987 to 2010 ............................................................................................ 32
Figure 6. 1: Organizational Chart of Finance Department ...................................... 70
Figure 6. 2: Process Mapping in Finance Department ............................................. 71
Figure 6. 3: Organizational Chart of Human Resources Department ...................... 75
Figure 6. 4: Process Mapping in Human Resource Department............................... 76
Figure 6. 5: Organizational Chart of Marketing Department ................................... 79
Figure 6. 6: Process Mapping in Marketing Department.......................................... 80
Figure 6. 7: Organizational Structure Of Project Coordinator Department ............ 86
Figure 6. 8: Process Mapping in Project Coordinator Department ......................... 87
Figure 6. 9: Organizational Structure Of Quality Management System
Department ............................................................................................ 101
Figure 6. 10: Process Mapping in Project Coordinator Department ..................... 102
Page 11
xi
ABSTRAK
Prestasi mampan organisasi cepat menjadi objektif strategik penting untuk setiap
organisasi yang semakin meningkat dan dengan itu meningkatkan dan mengekalkan
prestasi organisasi adalah sangat menjadi bagian integral dari dunia korporat.
Tujuan kajian ini adalah untuk mengenal pasti faktor-faktor yang
mempengaruhi pengoptimuman prestasi mampan organisasi di PT. Mulia Realty
Batindo di Batam, Indonesia. Sistem pengurusan prestasi organisasi dianalisis untuk
mencari kelemahan dalam sistem yang sedang memberi batasan dan cabaran kepada
organisasi, dalam usaha untuk mendapatkan pencapaian yang berterusan organisasi.
Analisis kajian kes yang dilakukan dengan menggunakan analisis SWOT dan
Patuk diagnostik untuk Strategi Korporat untuk menentukan sama ada Sdn. Mulia
Realty Batindo telah dipengaruhi oleh teknologi, jenis organisasi dan orang-orang
yang akan membawa kepada prestasi mampan organisasi. Cadangan ini disediakan
berdasarkan penemuan utama daripada analisis.
Page 12
xii
ABSTRACT
Organizational sustainable performance is fast becoming a critical strategic objective
for any growing organizations and thus improving and sustaining the organizational
performance is vastly becoming an integral part to the corporate world.
The purpose of this case study is to identify the factors influencing the
optimization of organizational sustainable performance in PT. Mulia Realty Batindo
at Batam, Indonesia. The performance management system of the organization is
analyzed to find the weaknesses in the system that is providing the limitations and
challenges to the organization, in its pursuit for organizational sustainable
performance.
Analysis of the case study is conducted using SWOT analysis and diagnostic
sotol for Corporate Strategy to determine whether PT. Mulia Realty Batindo has
influenced by the technology, organizational type and people that would leads to the
organizational sustainable performance. Recommendations are provided based on the
key findings from the analysis.
Page 13
1
CHAPTER 1
INTRODUCTION
1.1. Introduction
This chapter provides the background of the case study, the problem statement of the
case study and review on the I-TOP model which is the basis of the framework for
the case analysis. Subsequently, the research objectives and case issues of study are
stated. Definition of Key Terms and Significance of Study are discussed in the last
part of the this chapter.
1.2. Background of the Case Study
Sustainability plays a major significant role in the business world and it contributes
to the performance of the organization. According to Labuschagne et al. (2005),
business sustainability defined as a business strategies adoption that meet the needs
of the organization and it is protecting, sustaining and enhancing the stakeholders
rights, human and natural resources that needed in the future.
Organization sustainable performance implemented and developed using the
effective and efficient corporate strategies of the organization. According to Epstein
Page 14
2
and Roy (2001), the organization should decide in what industry they going to invest
and operate in the future. The organization must know how the they going to utilize
the internal and external resources of the organization and competencies to gain the
competitive advantages in the chosen market and industry. The corporate strategies
set by the organization drives them towards the organizational sustainable
performance and given major impact to the corporate social, environment and
financial performance of the organization. Thus, the organization should examine
how effective the corporate strategies are could impacts the organizational
sustainable performance in human and employee rights and environments protections
elements (Epstein and Roy, 2001).
In the current business world, the organizational sustainable performance
refers to the maintenance of an organization's high performance level in respect of
financial indicators, people management, quality of product and environmental
contributions over the long term. Organizational sustainable performance plays an
important role in its industry and it is indirectly contributing to the economic
development of the countries in which it operates.
Asian Financial Crisis (AFC) in 1997 has severe impact on the economic
development program of the several ASEAN economies. According to Kam and Kee
(2009), Indonesia is the most affected country among the ASEAN countries. AFC in
1997, give the major impact to the economic of the Indonesia for almost ten years
and Indonesia cannot regain the vitality and exuberance same as before this crisis
happen. The Indonesian government developed the Special Economic Zone (SEZ),
Page 15
3
consists of Batam, Bintan and Karimun Island (known as BBK) and this helps the
Indonesian government to regain the growth and enjoy the economy in the past. SEZ
attract the investor interest to invest again and helps in the development of the
Indonesian economy.
The BBK is one of the famous and unique location for the successes of SEZs
in Indonesia and it is attracting most of the foreign investors. Batam is one of the
islands in BBK and Batam well known for the cheapest manufacturing base in
ASEAN. Batam is a part of the growth triangle involved Singapore, Malaysia and
Indonesia. Transportation and communication sectors are the highest GDP
contribution sectors to the economy of Indonesia.
In Indonesia, the competitions between the organizations are more
complicated compared with other countries. The organizations in Indonesia have to
manage time, money and energy more efficiently to sustain in their business. The
Sustainable Business Awards (SBA) is introduced in Indonesia to motivate the
organization. The purpose of this award is to increase the awareness of sustainable
business best practices and demonstrate how sustainable business benefits the
companies, the environment and all stakeholders, for today and for the future.
There are a few factors which need to be well taken care of in order to
maintain the success of the organization. Running an organization is one thing, but
steering it and keep it moving is another thing all together. According to Svensson
Page 16
4
and Wood (2005), organizational sustainable performance has a strong relationship
between the leadership decision making and corporate strategy. Organization
nowdays are lacking in leadership, management which leads to poor management
and downsizing. Taking into consideration of the major Multinational Companies
(MNC’s) like Motorola, Intel, Dell, Agilent, Robert Bosch, AMD and etc, they are
all dealing with the same challenges which is to maintain their organizational
sustainable performance and to be the leader in the own market and various strategies
being introduced to be sustainable. Despite the strategies introduced, organizations
are still confronted with difficulties and failures.
The organization should have effective strategies and good leadership to
achieve the organization's vision, mission and goal that will lead the organization to
sustain in their business or industry. There are some important elements which the
organization needs to be managed in order to maintain the success of the
organization. Human character and behavior is one of the major elements which
contribute to the organization's success. Management practices and hiring the correct
type of characters of a person in specific job function as human is most complex
elements. Each employee is unique from the others and it is a challenge to monitor
them and create the harmonious environment between the manager and the
subordinates.
Working conditions and organizational culture play a significant role in the
organization sustainable performance. Attractive and comfortable working
conditions will motivate the employees to engage in the organization and it is often
Page 17
5
influenced to high sustainable performance. Cheung et al. (2012), concluded that
organizational performance relating to an organization’s culture with well integrated
set of values, set of beliefs and behavior.
Technologies help the employees to think out of the box and it leads the
organization towards the sustainable performance (Gadenne et al., 2011).
Organizations need to improve the product design, develop the innovative product
and introduce unique products to the market at the right time. To become more
competitive in the global market, technological innovation driven organization
delivering new product to the market quickly and cost effectively. The organization
should focus on producing the new product at the right time and with the good
quality. According to Gadenne (2011), the product quality needs to be satisfied by
the customers with the less number of customer returns. Less customer returns lead
to less reworking costs and it leads to the organizational sustainable performance.
As illustrated, there are some factors that influencing the optimization of
organizational sustainable performance. The organization has to build the effective
strategy to manage their technology, environment and people in the company
(Epstein and Roy, 2001). Selecting the right strategy will leads to the organizational
sustainable performance.
As a conclusion, organizational sustainable performance, by having a strategy
to support the influencing factors of the success dimensions intended to be achieved,
Page 18
6
would have it easier in establishing a performance management strategy that would
bring in the competitive advantage to remain in the business. This case study is
intended to examine factors that influencing PT Mulia Realty Batindo to optimize the
organizational sustainable performance.
1.3. Problem Statement
Organizational or real estate organization is one of the important key performance
success factors for the organization itself, shareholders and as well as for the origin
country. However, larger organizations or Multinational Corporation (MNC’s) is
having a high demand for the sustainability elements in their organizations. PT Mulia
Realty Batindo tends to lose talented and skillful employees as well as losing
business to the competitors. New technologies and innovations should be introduced
to the market fast before the competitors take advantage and grab the market share.
According to Nandakumar (2011), firms adopting cost leadership or
differentiation perform better than firms which do not have a dominant strategic
orientation. Most organizations lack the focus on product differentiation and on new
product introduction (NPI). Performance measurement of an organization differs
from one organization to the other and puzzles as well. Hiring the right people,
displaying the appropriate management style, introducing the right technologies and
all contributes to the organization’s success as well.
Page 19
7
According to Waal (2009), failure rates of performance management
implementations has decreased in the past decade and that the most severe problems
organizations encounter are due to the lack of the top management commitment.
Competitors are becoming more alert to the technological changes and taking prompt
action to be ahead and they continually request for the quality improvement, rapid
product delivery, competitive pricing, and some other features that are best achieved
in the complex environments by the innovative organizational practices.
As mentioned above, there were few experimental studies carried out on the
factors influencing the optimization of organizational sustainability, which produces
different experimental results where optimization refers to the appropriate strategies
applied by organization to maximize the performance. Detailed studies are needed to
determine which common factor which leads to optimization of organizational
sustainability, therefore this research is aimed to conclude the real factors involve.
This case study looks into the elements of the organization that influencing
the sustainability performance in the subsidiary of the Mulia Batindo Group. This
case study focuses mainly on PT Mulia Realty Batindo a real estate company
provides building contractor and has built several projects in Batam, Karimun and
Bintan, Indonesia.
There are few elements will be analysis to understand the relationship
between the Technology (T), Organizational Environment (O) and People (P) which
Page 20
8
have the effects on the subsidiary of Mulia Batindo Group sustainable performance.
The research identifies which are the real factors are influencing the subsidiary of
Mulia Batindo Group sustainability performance and whether is it from a single
factor or from the combination of all factors introduced in this study.
1.4. Review on I-TOP Model
Corporate strategy formulation is one of the important factors to achieve the actual
goal of the organization through organizational sustainable performance. The three
strategic models commonly used in corporate strategic formulation are Market-Based
Model, Resource-Based Model and I-TOP Model.
Market-Based Model (Gadenne, 2011) of Above Average Return that
basically tries to capitalize opportunities available in the industry, which the
organization is operating in to optimize the rate of return. Resource-Based Model
(Gadenne, 2011) of Above Average Return tries to utilize existing unused funds or
capacity within the organization to capitalize opportunities in the industry to
optimize their rate of return.
Muthuveloo. R (2013) introduced the third model called as I-TOP model.
This model is built based on the experience in the business development industry and
continuous research work. This strategy is a very flawed model that helps the
organizations to optimize the Return on Investment (ROI) in order for the
Page 21
9
organization to be the ROI champion in their respective business world. An
organization can become a top or a leader in the industry, when only the organization
optimized the Return on Investment (ROI). The organization can become the ROI
champion through optimizing the Technology Infinite Possibilities (T),
Organizational Environment (O), and People (P).
Technology Infinite Possibilities (T) are one of the elements to maximize the
Return on Investment which will lead to the organizational sustainable performance.
The organization should think differently from the competitors by injecting ideas of
novel and noble via Blue Ocean Strategy and Business Intelligence. This can help the
organization to focus on optimizing the Return on Investment (ROI) rather than
getting into a competitive dynamic world where the organization always has to spend
a lot of time in outdoing their competitors.
Organizational Environment (O) is a major element to optimize the Return on
Investment (ROI). The organization should create comfortable and attractive
working conditions that lead and inspire the employees and the cultivation of culture
in an organization is also an important factor. The working environment often
influences the employees’ commitment and performance of the organization.
The human resources department in each organization has an important role
to identify the right People (P) to the right role or position in the organizations.
People in this context refer to the employees and different types of people have
Page 22
10
different type of characters and personalities. Parker et al. (2006) predicted that there
is a link between a person’s appraisal, emotions and behavior where appraisal from
management towards an employee’s working role contributes to motivate the
employee to strive for more and eventually contributing to the organization’s
success.
The combination of the Technology Infinite Possibilities (T), Organizational
Environment (O), and People (P) would help the organization and management to
maximize the Return on Investment as well as help to sustain in the business world.
1.5. Research Objectives
The main objective of this research are as follows:
1. To investigate whether Technology (T) leads to the Optimization of
Organizational Sustainable Performance in PT Mulia Realty Batindo
2. To investigate whether Organization Type (O) leads to the Optimization of
Organizational Sustainable Performance in PT Mulia Realty Batindo
3. To investigate whether People (P) leads to the Optimization of Organizational
Sustainable Performance in PT Mulia Realty Batindo
Page 23
11
1.6. Case Issues
In this study, the following are the case issues to be examined:
1. Whether Technology (T) leads to Optimize the Organizational Sustainable
Performance in PT Mulia Realty Batindo?
2. Whether Organizational Environment (O) leads to Optimize the Organizational
Sustainable Performance in PT Mulia Realty Batindo?
3. Whether People (P) lead to Optimizing the Organizational Sustainable
Performance in PT Mulia Realty Batindo?
1.7. Definition of Key Terms
The key terms in this case study are defined as follows:
Organization Sustainable Performance – The actual goal achieved by the
proper organization strategies (Muthuveloo and Ping, 2013).
Income (I) – Monetary reward which could motivate human to be satisfied
with work and be productive. (Tang, 2006) examined the pay model and
concluded that Income leads to pay satisfaction for employees
Technology (T) – Green technology, latest up to date technology, new
product introduction, (Alain et al. 2011) suggested that for optimum the
organization performance, focusing on the innovativeness is crucial.
Page 24
12
Organization Type (O) – Local, international, multinational and transnational.
Refers to the type of organization which leads to higher performance
(Muthuveloo and Ping, 2013).
People (P) – Performer, follower, transactor, transformers. Refers to the type
of human characteristics and personalities which differs from one person to
another. (Iimenez-Jimenez, 2008) considered human resources have a major
impact on a firm’s productivity and facilitate the success of an organization.
1.8. Significance of Study
Optimization of organizational sustainable performance is the most important
elements to sustain in certain industry. There are three important factors that that
influencing the optimization of organizational sustainable performance; Technology,
Organizational type and people. This report is using the case analysis method to
explore the factors influencing the optimization of organizational sustainable
performance in Mulia Batindo Group and its’ subsidiaries of PT. Mulia Realty
Batindo in Batam, Indonesia.
The factors influencing the optimization of organizational sustainable
performance would serve as a major element that can be adopted by PT. Mulia
Realty Batindo in Batam. The result of this research will benefit the PT. Mulia
Realty Batindo to be aware of the common factors which could lead to organization
failure of no actions or strategies in place. From the practical point of view;
technology, organizational type and people are the most effective factors that
Page 25
13
influencing the optimization of organizational sustainable performance. Besides that,
this study will provide recommendations on to overcome the weaknesses and threats
of the PT. Mulia Realty Batindo to optimatize the organizational sustainable
performance.
1.9. Organization of Chapters
Chapter 1: Provides the background of the case study, problem statements,
research objective and case issues.
Chapter 2: Briefly discusses about an overview of the country background and
analysis of the country related to the case issues.
Chapter 3: Covers the industry profile, analysis of the industry, literature review
and definition of the terminology used in the case study.
Chapter 4: Covers the data collection method, linkages between data sources and
interview schedule.
Chapter 5: Covers the company profile and analysis of the company.
Chapter 6: This chapter presents the case write-up of the PT. Mulia Realty
Batindo
Chapter 7: Covers the research contribution of practitioners and academicians.
Page 26
14
CHAPTER 2
COUNTRY ANALYSIS
2.1 Introduction
This chapter provides an introduction about Indonesia and Batam, where the research
company is located. The following section provides an overview about the Batam
using PESTEL analysis. The characteristics of the economy are highlighted in this
chapter embracing the economics features, growth and business environment.
However, the study about the economy provides a link for the organization chosen
and the industry involved and provide the knowledge on the Industry in Indonesia
and Batam that will further elabrote in the Chapter 3.
2.2 An Overview of Indonesia
The name of Indonesia origin from the Greek words “Indós” and “nèsos”, which
means island. The declaration of Indonesian Independence was announced on August
17, 1945 and Sukarno appointed as the first President of Indonesia. The national
independence marked as the start of the diplomatic, armed resistance of the
Indonesian National Revolution and fighting against the forces of the Netherlands
and pro-Dutch civilians. The United Nations formally acknowledge the date of
Page 27
15
independence as 27 December 1949 and the documents were signed by Sukarno and
Mohammad Hatta, who is appointed as President and Vice-president.
Republic of Indonesia is a sovereign state in Southeast Asia and Oceania.
Indonesia comprises of 13,466 islands that encompasses with 33 provinces and 1
Special Administrative Region. Indonesia is world's fourth most populous country
with an estimated of over 249 million people. The capital of the Indonesia is Jakarta
and is the nation’s largest city, followed by the Surabaya, Bandung, Semarang and
Medan. Indonesia shares land borders with Malaysia, Papua New Guinea and East
Timor. The neighboring countries for the Indonesia are Philippines, Australia, Palau,
Singapore and Indian Territory of the Andaman and Nicobar Islands.
Indonesia is famous for the republic with presidential system and the power is
concentrated in the central government. There are some major reforms are undergone
by the Indonesian political and governmental structure after resignation of President
Suharto in 1998. The amendments are made in Constitution of Indonesia 1945 in
executive, judicial and legislative branches. President of the Indonesia plays a role as
a head of government, head of state, director of domestic governance, policy making
and foreign affairs and it is plays a major role as a commander-in-chief of the
Indonesian National Armed Forces.
The president of Indonesia can appoint a council of ministers, who is not
required to be an elected member of the legislature. In 2004’s presidential election,
Page 28
16
people directly elected the president and vice president for the first time and the
president may serve a maximum of two consecutive five year terms. People’s
Consultative Assembly (MPR) is the highest representative body at national level
and its main functions are amending and supporting the constitution, formalizing
broad outlines of state policy and appoint the president. People's Representative
Council (DPR) has a major role in national governance since reforms in 1998 and
Regional Representative Council (DPD) is a new chamber for matters of regional
management.
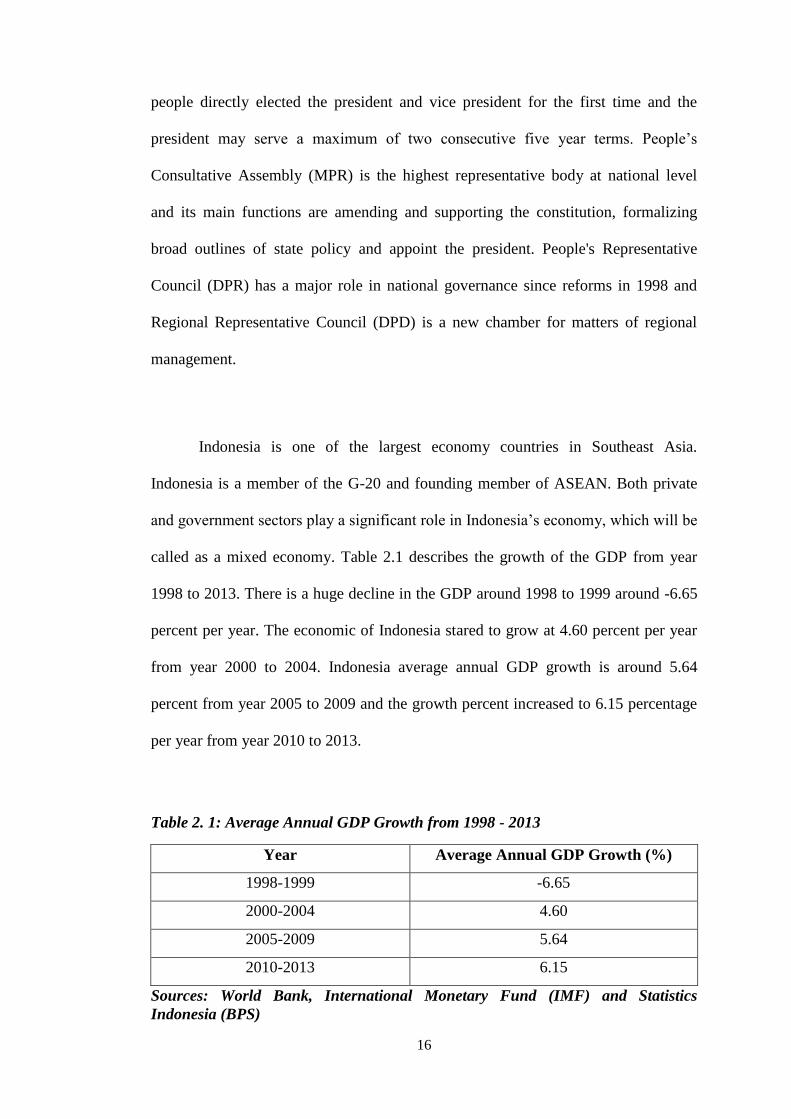
Indonesia is one of the largest economy countries in Southeast Asia.
Indonesia is a member of the G-20 and founding member of ASEAN. Both private
and government sectors play a significant role in Indonesia’s economy, which will be
called as a mixed economy. Table 2.1 describes the growth of the GDP from year
1998 to 2013. There is a huge decline in the GDP around 1998 to 1999 around -6.65
percent per year. The economic of Indonesia stared to grow at 4.60 percent per year
from year 2000 to 2004. Indonesia average annual GDP growth is around 5.64
percent from year 2005 to 2009 and the growth percent increased to 6.15 percentage
per year from year 2010 to 2013.
Table 2. 1: Average Annual GDP Growth from 1998 - 2013
Year Average Annual GDP Growth (%)
1998-1999 -6.65
2000-2004 4.60
2005-2009 5.64
2010-2013 6.15
Sources: World Bank, International Monetary Fund (IMF) and Statistics
Indonesia (BPS)
Page 29
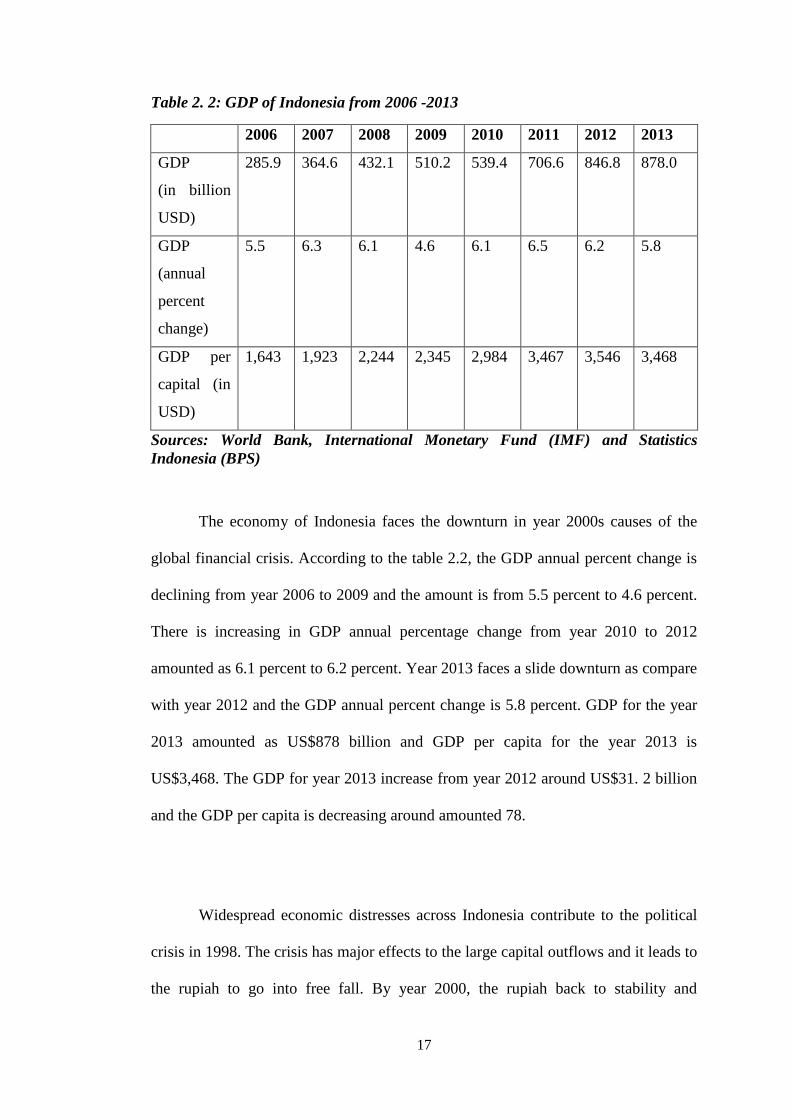
17
Table 2. 2: GDP of Indonesia from 2006 -2013
2006 2007 2008 2009 2010 2011 2012 2013
GDP
(in billion
USD)
285.9 364.6 432.1 510.2 539.4 706.6 846.8 878.0
GDP
(annual
percent
change)
5.5 6.3 6.1 4.6 6.1 6.5 6.2 5.8
GDP per
capital (in
USD)
1,643 1,923 2,244 2,345 2,984 3,467 3,546 3,468
Sources: World Bank, International Monetary Fund (IMF) and Statistics
Indonesia (BPS)
The economy of Indonesia faces the downturn in year 2000s causes of the
global financial crisis. According to the table 2.2, the GDP annual percent change is
declining from year 2006 to 2009 and the amount is from 5.5 percent to 4.6 percent.
There is increasing in GDP annual percentage change from year 2010 to 2012
amounted as 6.1 percent to 6.2 percent. Year 2013 faces a slide downturn as compare
with year 2012 and the GDP annual percent change is 5.8 percent. GDP for the year
2013 amounted as US$878 billion and GDP per capita for the year 2013 is
US$3,468. The GDP for year 2013 increase from year 2012 around US$31. 2 billion
and the GDP per capita is decreasing around amounted 78.
Widespread economic distresses across Indonesia contribute to the political
crisis in 1998. The crisis has major effects to the large capital outflows and it leads to
the rupiah to go into free fall. By year 2000, the rupiah back to stability and
Page 30
18
economic growth return to 4% per year. However, the rupiah still fluctuates and drop
below Rp 12,000 per dollar in September 2014. Indonesia gained its investment
grade rating in the late in 2011 after losing it in the year 1997. However, in the year
2012 an estimated of 11.7% of the total population in Indonesia lived below the
poverty line. In year 2013, the official open unemployment rate was at 6.6% and its
increases 0.5% compared to the year 2012.
Indonesia consists of 300 distinct native, ethnic, linguistic groups and 742
different dialects and languages. Javanese are the politically dominant and largest
ethnic group. Shared identity is developed in Indonesia, which defined by an ethnic
diversity, language of national and pluralism of religious in the population of
Muslim. The national language in Indonesia is a form of Malay. The language based
on the prestige dialect of Malay, from the Johor-Riau Sultanate, which for the past
centuries has been the Lingua Franca and standard of which are the official
languages in Malaysia and Brunei.
Despite its large population and densely populated regions, Indonesia has a
vast areas of wilderness that support the world's second highest level of biodiversity
after Brazil. The flora and fauna in Indonesia consist of Asian and Australian mixed
species. Indonesia is one of the Asian members of the Organization of Petroleum
Exporting Countries (OPEC) with sort of mineral resources. The country has
abundant natural resources, yet poverty remains widespread. However, Indonesia
continues to have stable progress in economy regardless of major natural disasters
with the support of proper macroeconomic policies.
Page 31
19
2.3 An Overview of Batam
Batam Island is one of the largest islands in Riau Island Province and there are 329
islands around the territory of the Batam city. Batam is one of the popular tropical
holiday destinations in South East Asia among tourists and famous as the oil rich
province. The area of Batam Island is 415 sq. Km. Due to the demand of space and
progress of investments, the Batam Industrial area was expanded with the inclusion
of two other islands, namely Rempang and Galang. The new names for Rempang and
Galang are Barelang and Batam-Rempang-Galang. Total area of Batam became 715
sq. Km. All the islands are connected with the Trans-Barelang road, which include 6
bridges.
Batam is located about ten miles south of Singapore, north of Rempang, west
of Bintan Island and east of Bulan Island. Batam and Bintan separated by the Riau
Strait and Batam is located in between the Straits of Malacca and Singapore water.
The main transportation system from Singapore to Batam is water transportation.
The ferry terminals are located at Singapore Cruice Centre, Tanah Merah at
Singapore and Johor Bharu at Malaysia and the terminals located at Batam Island are
at Batam Centre, Sekupang and Waterfront. Batam Fast and Wavemaster are the
famous ferry transport companies in Batam. The travelling duration is around 30
minutes to 45 minutes.
Batam is one of the popular islands in Asia and well known as a fully free-
trade zone. Batam has two different climates; dry and wet seasons. The dry season
Page 32
20
start from May to October and the average temperature are range from 26 to 32°C.
The wet season start from November to April and the humidity in the Batam ranges
from 73% to 96%.
2.4 PESTLE Analysis
PESTLE Analysis is a widely-used tool that helps to analyze the political, economic,
social-culture, technologies, legal and environment situation of a country. The
analysis will help to obtain a deeper understanding about the overview of the
business operations as well as the threats and opportunities associated with.
2.4.1 Political and Legal View of Batam
Batam, Indonesia is a republic island with presidential system and the decision
making authority are based in the central government. The Batam center is
surrounded by the local government officials. The Batam province divided into 12
districts and these districts are including several adjoining islands such as Rempang,
Galang and Bintan as well as Batam Island itself. In August 2014, the government
has implemented some new regulations on Batam Island. The Batam Centre, Ferry
Terminal has a sign of finger over a pair of the lips and this sign is defined as the
visitors have to be silent when the queue for immigration clearance. The visitors
have to follow the immigration officers’ instructions or will be sent back to
Singapore immediately.
Page 33
21
There are a number of facilities offered to foreign investment in Batam such
as allowance to establish 100 percent foreign ownership, streamlined procedure for
foreign investment, foreign investment license for 30 years and extendable, simple
immigration procedure for expatriates, land lease up to 80 years and extendable and
easy import and export procedure. The foreigners are allowed to own a house and
shop houses on Batam Island even they did not work in Batam.
Further, the government in Batam also increases the competitiveness of
Batam by offering the following incentives:
a. No import or export duties on the machine, the equipment, the spare parts and
the raw material. The whole island is declared as a duty-free zone with no import
or export taxes on any items.
b. No Value-Added Tax (VAT) for all processing industries for the export
purposes. Unlike the other parts of Indonesia. Batam is a bonded zone, thus, it
does not apply for VAT to processed products or for the consumption goods, and
neither does sales tax on the luxury goods. If the manufacturing company’s
products are sold in other non-bonded parts of Indonesia, they will then be
applied 10 percent of VAT.
c. Generalized System of Preferences (GSP) facility with 28 donor countries; also
Common Effective Preferential Tariff for ASEAN countries.
d. Investment allowance with a reduction of income tax for certain industries with
various incentives in a reduction in calculation of net income, accelerated
depreciation, compensation for losses and lower tax rate consideration.
e. Double Taxation Avoidance Agreement with 51 countries.
Page 34
22
f. Competitive cost of investment due to competitive tariffs on land leases, labor
cost, utilities and other operating costs.
2.4.2 Economic View of Batam
Batam Island went through the major transformation from the biggest forest to the
famous industrial zone and harbor. The Indonesia government declared Batam Island
as an Industrial Zone in year 1971 and Batam Industrial Development Authority
(BIDA) established to support the development of Batam. The state-owned company
plays a major role in industrial development and the company expanded the
operations in light manufacturing industry, real estate industry, oil and gas industry
and chemical industries.
Batam is developed to serve the four main functions; trade, industrial,
transshipment area and tourism. The foreign companies like to operate their
businesses in Batam because of the lower labor costs and special government
incentives compare with other neighboring countries. According to the framework
agreed on June 2006, Batam, Bintan and Karimun are declared as bonded area or
formally called as a Special Economic Zone. All the imported and exported goods
for the purpose of production, such as raw material and capital goods are tax
exempted. Batam well known as one of the facilitators of the Controversial Ivory
Trade.
Page 35
23
Batam has 21 industrial parks with more than 1,000 foreign companies
currently reside. Today, Batam Free Trade Zone plays an important role in the world
of the electronics manufacturing hub, created significantly with a capital of
Singaporean. Initially, Batam was appointed as an industrial area by Indonesia
Presidential Decree No74/1971. Batam then was declared a bonded zone for export-
oriented industry by a presidential decree in November 1978.
Batam Island gives the freedom and there is no restriction for industries to
invest. There are a lot of industries in Batam and it can be categories into three
groups; heavy, light and chemical. Construction, pipe threading, steel fabrication, oil
exploration equipment, heavy equipment, offshore jackets, and oil rig fabrication,
repair shipbuilding are categories into heavy industries. The light industries include
toys, garments, cosmetics, shoes, leather, health care product, foods, drinks, car
accessories, ladies accessories and bag. The chemical industries in Batam Island
consist with chemical companies, fatty alcohol companies, paint producing
companies, and pipe coating companies. The chemical industry is allowed with
adequate control of hazardous waste.
Batam is more suitable for some industries and the largest operating industry
in Batam is the electronics and computer industry. This is because the labor in Batam
is not limited and there are easy to train by expertises. Batam is located strategically
within a route of international shipping between the Pacific Ocean and Indian and it
helps to increase the frequency of shipping the products and distribution of the
product. The strategic route plays major roles in the Batam Island’s economy.
Page 36
24
2.4.3 Social View of Batam
Batam Island is well known for its multiracial society with its diverse culture. Being
the largest island in Riau Island Province, it is one of the best islands to invest with
fully free trade zone features. Thought the culture is a blend of different racial,
business etiquettes and relationship values are given much significance.
According to the Head of population and Civil Batam, the population of
Batam Island increased an average of 100,000 people in year 2013 and increase
around 97,757 people in the year 2012. The population growth in the year 2012
consists of the newcomers contributed about 65 percent and about 35 percent of new
entrants’ souls. According to the Registry Survey April 2012, the total population of
Batam Island is 1,153,860. The largest population of Batam Island is at Batam
Centre and consist of 162,238 people. All the people like to live in Batam Centre
even the Island covers with different neighboring islands. The growth of annual
population considers significant because of the active recruitment of labor in order to
expand the industry.
The population of Batam is ethnically different from overseas and Indonesia
and there is a mixture of races, languages, religions and beliefs. The majority religion
at Batam is Islam followed by Protestantism, Buddhism, Catholicism, Confucianism
and Hinduism. Bahasa Indonesia is a national language and is commonly used by
Indonesian regardless of various in the language and culture in this Archipelago.
There are some other languages are widely used in Batam, such as Malay, Chinese