14
1 Gazprom’s Financial and Economic Policy Andrey KRUGLOV Deputy Chairman of the Management Committee, Head of the Finance and Economics Department

11
Gazprom’s Financial and
Economic PolicyAndrey KRUGLOV
Deputy Chairman of the Management Committee,
Head of the Finance and Economics Department
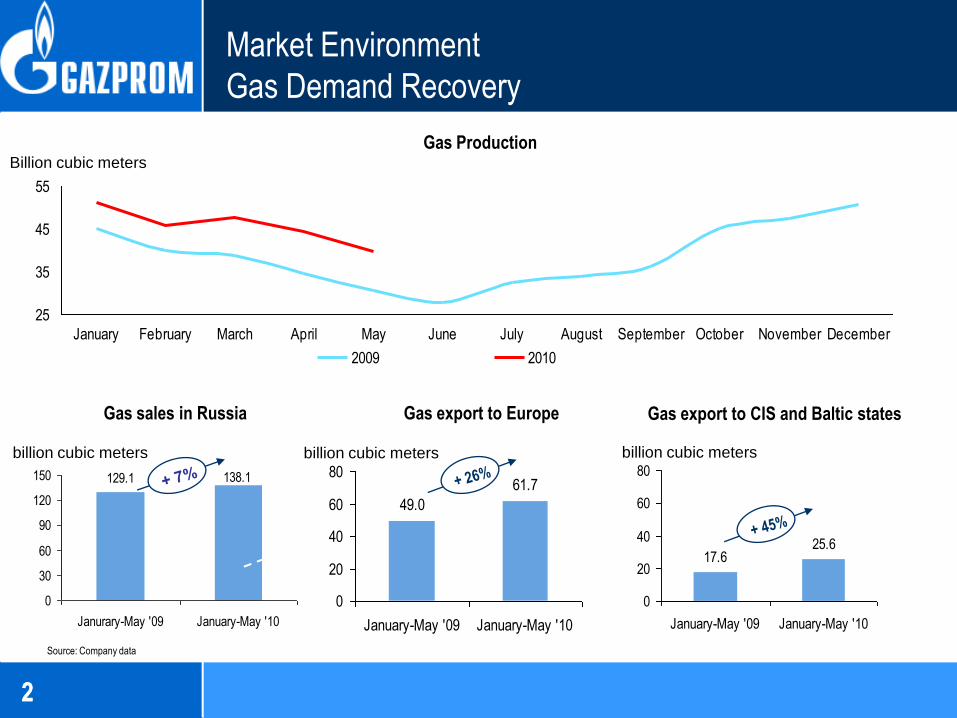
129.1 138.1
0
30
60
90
120
150
Janurary-May '09 January-May '10
2
Billion cubic meters
Gas Production
2
Source: Company data
25.617.6
0
20
40
60
80
January-May '09 January-May '10
billion cubic meters
Gas sales in Russia
billion cubic meters
Gas export to Europe
billion cubic meters
Market Environment
Gas Demand Recovery
61.7
49.0
0
20
40
60
80
January-May '09 January-May '10
25
35
45
55
January February March April May June July August September October November December
2009 2010
Gas export to CIS and Baltic states

333
2009 Financial Performance
1 4641 090
2008 2009
3 290 2 999
2008 2009
292343
202 211
334
4Q08 1Q09 2Q09 3Q09 4Q09
37.5103.7
192.6 174.6
308.7
4Q08 1Q09 2Q09 3Q09 4Q09
13% (26%)
(9%)
59%Adjusted EBITDA(2)
(RUB billion)
– An increase in 2009 operating expenses is provoked by higher expenditures for purchased oil and gas, as well as for their transit.
– The growth of these expenditures is caused by an increase in the Central Asian suppliers’ gas purchase prices and in the rates for gas transit across Kazakhstan and Uzbekistan.
– The 2009 decline in the operating profit was offset by non-recurring income and positive financial activity of associated companies.
– As a result the income attributable to the Gazprom shareholders showed a 5% increase in 2009.
Proceeds(1)
(RUB billion)
– Sales fell 9% YoY due to a drop in global gas demand, which resulted in the decreased supply volume and gas price on the key markets in 2009.
– Starting from 2009, the financial result of the trading activity is given separately as net income in the consolidated statement of total income.
723% 5%
Profit (3)
(RUB billion)
77%
743.0 780.0
2008 2009
The exchange rate is applied as of the end of the appropriate period.
1. The proceeds are calculated as a sum of sales proceeds and net trading profit excluding actual deliveries.2. EBITDA is calculated as operating profit plus depreciation and provisions for assets impairment (excluding provisions for accounts receivable and prepayment).3. The profit for the period attributable to the shareholders of Gazprom.

4
Gas Sales Proceeds
Net proceeds from gas sales in and beyond Europe
Net proceeds from gas sales in the former Soviet Union
RUB billion
1 103.01 260.6
0
500
1000
1500
2008 2009
(13%)
RUB billion
309.9356.50
500
1000
1500
2008 2009
(13%)
Proceeds decreased due to a drop in
demand and a significant decline in gas
prices on the European market
Proceeds decreased due to a drop in sales
volume, which was partially offset by an
increase in gas prices within the FSU states

5
Gas Sales in Russia
Net proceeds from gas sales
RUB billion
503.1479.4
0
200
400
600
2008 2009
+ 5%
Proceeds grew due to a rise in the average
regulated gas price, which was partially
evened by the sales drop
0
1 000
2 000
3 000
4 000
5 000
2005 2006 2007 2008 2009 2010E 2011E 2012E 2013E
Industrial consumers Population
+27%
+15%+15%
+15%
+16%+26%
+15%+11%
Annual average gas price for industrial consumers and population (1)
RUB per 1 000 m3
1. Starting from 2009 the gas price growth rates are brought in line with the Scenario Conditions and Forecast for Russia’s Social and Economic Development in 2010–2012 published by the Russian Ministry of Economic Development in June 2010.
2. The actual price was changed by 5% on January 1, 2010; and by 15% on April 1, 2010. It is planned to increase the price by 5% on January 1, 2011 and by 9.5% on April 1, 2011.
+19.2%+15%
+15%+25%+15%+16%
+27%+17%

6
Oil price, USD per barrel
RUB/USD exchange rate
Investment program, RUB billion
Borrowing program, RUB billion
Weighted average price for the gas sold beyond FSU,
USD per 1,000 cubic meters
Net profit, RUB million
61
31.69
803.7
304.9
298.4
624,613 (3)
58
33.90
802.4
90.0
280.0
554,504
2010
Estimated (2)
Gazprom’s Budget (1)
2009
ActualBudget parameters
1. The parent company.2. The plan approved by the resolution of the Gazprom Board of Directors No.1511 dated November 24, 2009.3. With the adjusted amount of financial investment (RUB 301,561 million).
7
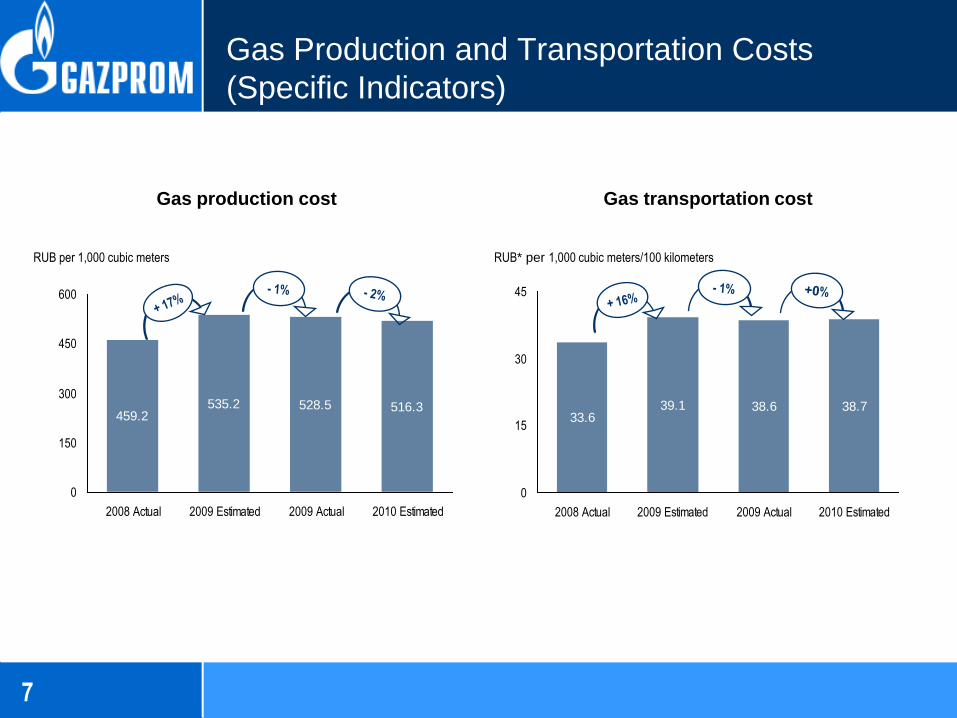
Gas Production and Transportation Costs
(Specific Indicators)
Gas production cost Gas transportation cost
RUB per 1,000 cubic meters
516.3528.5535.2459.2
0
150
300
450
600
2008 Actual 2009 Estimated 2009 Actual 2010 Estimated
RUB* per 1,000 cubic meters/100 kilometers
38.738.639.133.6
0
15
30
45
2008 Actual 2009 Estimated 2009 Actual 2010 Estimated
8
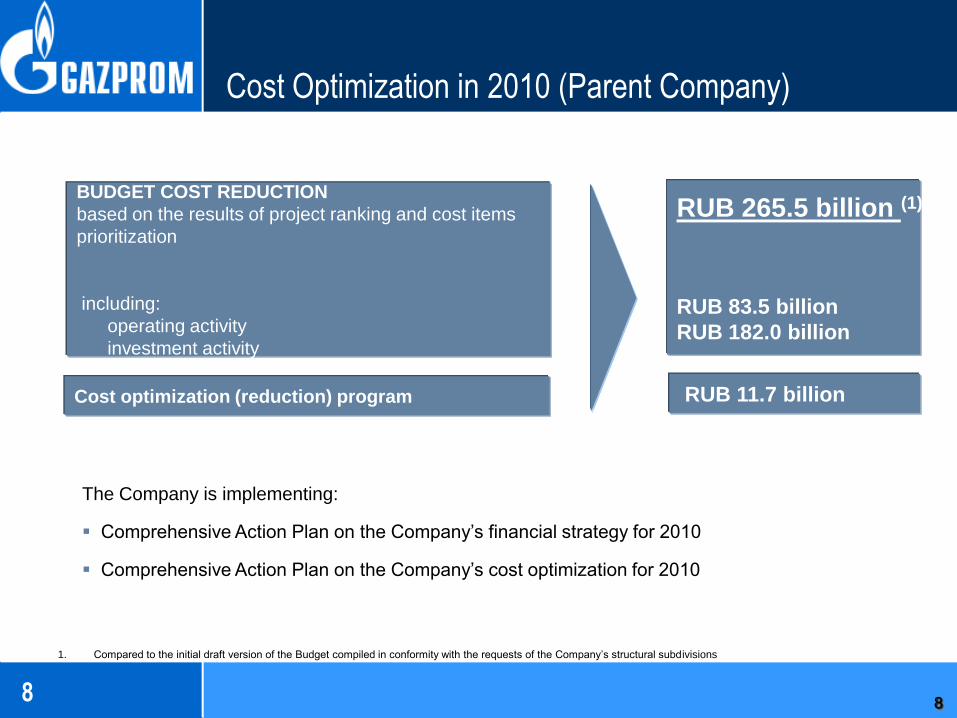
BUDGET COST REDUCTION
based on the results of project ranking and cost items
prioritization
including:
operating activity
investment activity
RUB 265.5 billion (1)
RUB 83.5 billion
RUB 182.0 billion
RUB 11.7 billion
1. Compared to the initial draft version of the Budget compiled in conformity with the requests of the Company’s structural subdivisions
8
Cost optimization (reduction) program
The Company is implementing:
Comprehensive Action Plan on the Company’s financial strategy for 2010
Comprehensive Action Plan on the Company’s cost optimization for 2010
Cost Optimization in 2010 (Parent Company)

9
Asset Management and Corporate Relations
Before
revaluation
After
revaluation
RUB 3,293 billion
RUB 3,775 billion
+ RUB 482 billion
Fixed assets revaluation results
(balance sheet value) as of January 1, 2010
Gazprom’s fixed assets revaluation was carried out
as of January 1, 2010:
assets value increased by RUB 482 billion
27 subsidiaries of Gazprom Group simultaneously
carried out revaluation of their fixed assets
2.392.662.54
1.51.19
0.690.4
0.36
0
1
2
3
2002 2003 2004 2005 2006 2007 2008 2009
0
10
20
30
40
50
60
70
Amount of dividends Payouts per share
Payouts per share
RUB billionRUB
The Gazprom Board of Directors proposed RUB 2.39
dividend payout per share
payout grew 664% versus 2008
maximum payout level of 2006-2007 reached

Export financing
Export financing for construction of the Portovaya compressor station – some USD 940 million
Project financing
Phase II financing of Sakhalin II, Gazprom Group cost recovery – up to USD 700 million
Signing documents to raise EUR 3.9 billion in project finance for Phase I of the Nord Stream project
European commercial paper program
Issue I – September 18, 2009 worth USD 600 million with a 3.4% interest rate was repaid on December 18, 2009
Issue II – October 9, 2009 worth USD 600 million with a 3.2% interest rate was repaid on December 18, 2009
10
1.2x
1.5x1.7x
0.9x
1.7x
1.0x
1.3x1.4x
0.7x
1.4x
2007 2008 9M09 2009 2010E
Total debt / Adjusted EBITDA Net debt / Adjusted EBITDA
Relative debt indicators(1)
10
Debt and Liquidity Management
1219 10181469 1372
291348
293254
2007 2008 9M09 2009
Net debt Monetary assets and their equivalents
Total and net debt
1. Calculated as of the end of the respective period.
Financial instruments diversification
RUB billion
11
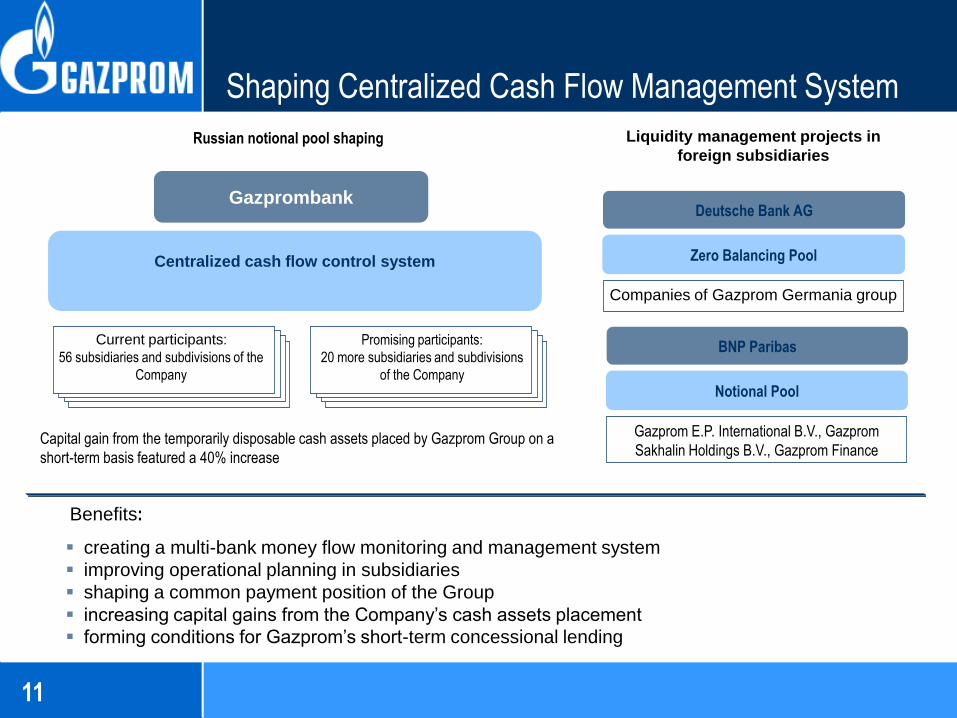
Shaping Centralized Cash Flow Management System
Centralized cash flow control system
Gazprombank
Current participants:
56 subsidiaries and subdivisions of the
Company
Promising participants:
20 more subsidiaries and subdivisions
of the Company
Capital gain from the temporarily disposable cash assets placed by Gazprom Group on a
short-term basis featured a 40% increase
Liquidity management projects in
foreign subsidiaries
Deutsche Bank AG
Zero Balancing Pool
Companies of Gazprom Germania group
Gazprom E.P. International B.V., Gazprom
Sakhalin Holdings B.V., Gazprom Finance
BNP Paribas
Notional Pool
Benefits:
creating a multi-bank money flow monitoring and management system
improving operational planning in subsidiaries
shaping a common payment position of the Group
increasing capital gains from the Company’s cash assets placement
forming conditions for Gazprom’s short-term concessional lending
Russian notional pool shaping

Gazprom’s Informatization Strategy
• Automated system for development of
management reports on the basis of
key performance indicators (KPI)
CORPORATE DATA STORAGE
Integration platform
Inte
gra
tion
pla
tfo
rm
Corporate
portal
Vertically integrated
Information management systems (IMS)
IMS
MR
MB
IMS
ТG
GC
IMS
HC
RM
AB
MS
IMS
I
AC
RS
AD
CS
UG
SS
AL
MS
AH
RM
S
MR
AC
S
IMS
ME
Typical information management systems of an enterprise
(IMS E) according to the types of activity
Production Gas
transportationUGS Processing Gas
distribution
and sale
Secto
ra
l d
ata
refe
ren
ce
ba
nk
(SD
RB
)
IMS MRMB IMS for replenishment of mineral and raw material base and hydrocarbon production
IMS T IMS for transportation of gas and gas condensate
IMS HCRM IMS for hydrocarbon refining and marketing
ABMS Automated budget management system
IMSI IMS for investments
ACRS Automated consolidated reporting system
ADCS UGSS Automated dispatch control system for UGSS
ALMS Asset and liability management system
AHRMS Automated human resources management system
MRACS Management and repair automated control system
IMS ME IMS for materials and equipment
Gazprom Group
Types of business
Investment projectsSubsidiariesSubsidiaries Investment projects
Investment projects
Business processesTypes of activity
KPI

Corporate Data Bank is Efficient Tool of
Managerial Decision Making
Finance
Production
ManagementInnovation and human resources
Sales markets
• Gazprom Group• Businesses• Activities• Gazprom and subsidiaries• Investment projects• Business processes

14
Conclusion
Carrying on major production projects financing
Ensuring strict cost control
Effective debt management and fund raising
Maintaining a reasonable level of working capital
Continuing a dialogue with the Russian Government on switching to market-based gas pricing principles in Russia
Cooperating with authorities to freeze the tax burden and customs duties
Improving inter-group liquidity management quality
Enhancing transparency and corporate governance
We continue improving the efficiency of our activity


