Budget vs. Actuals and Forecast ........................................................................................................... 7
Financial Metrics for the Service Delivery Role ........................................................................................ 7
Total Cost of Ownership by Business Application ................................................................................. 8
Service Costs ......................................................................................................................................... 9
Operating Profit and Margin ............................................................................................................... 10
Return on IT Assets ............................................................................................................................. 11
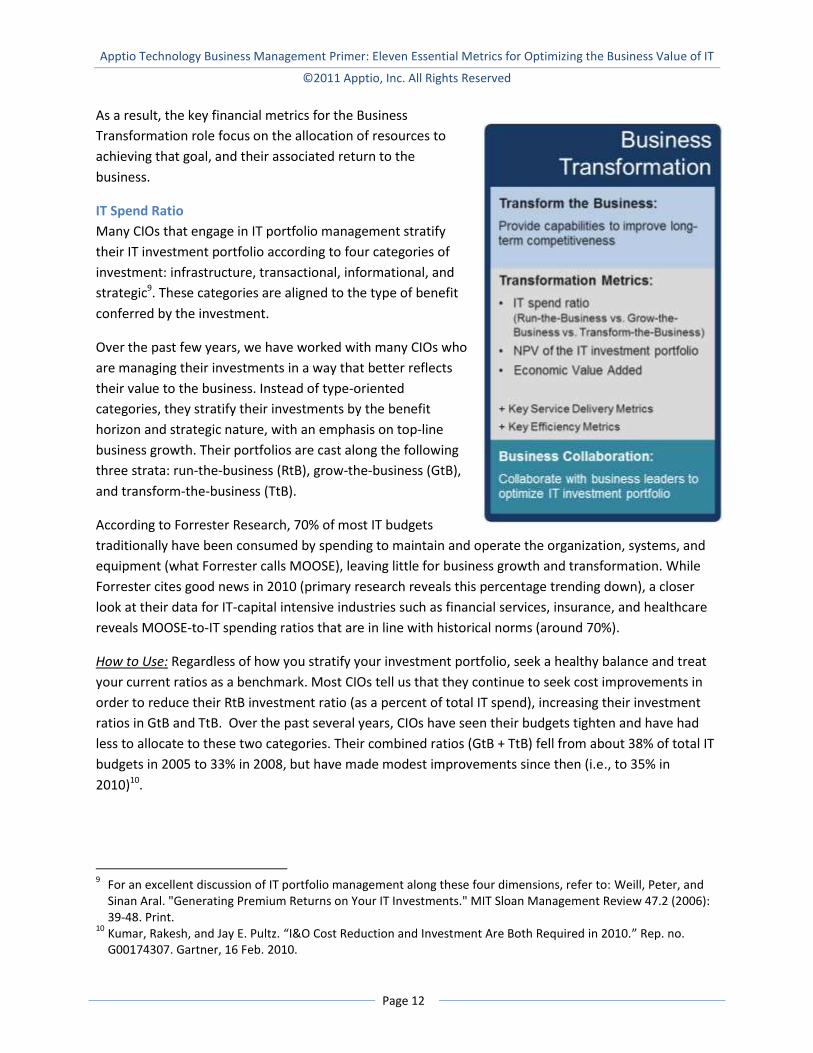
Financial Metrics for the Business Transformation Role ........................................................................ 11
IT Spend Ratio ..................................................................................................................................... 12
NPV of the IT Investment Portfolio ..................................................................................................... 13
Economic Value Added (EVA) ............................................................................................................. 14
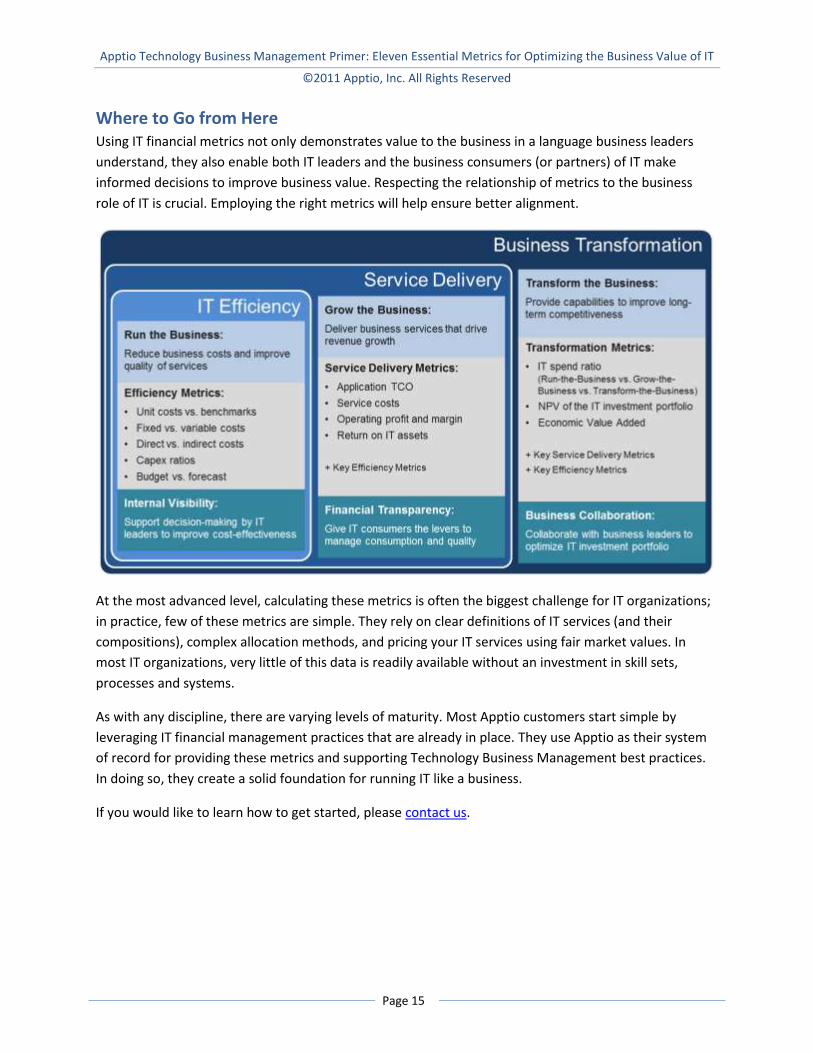
Where to Go from Here .............................................................................................................................. 15
About Apptio ............................................................................................................................................... 16
Case Studies St. Luke’s Health System Reduces Costs by Over $1 million ......................................................................... 4
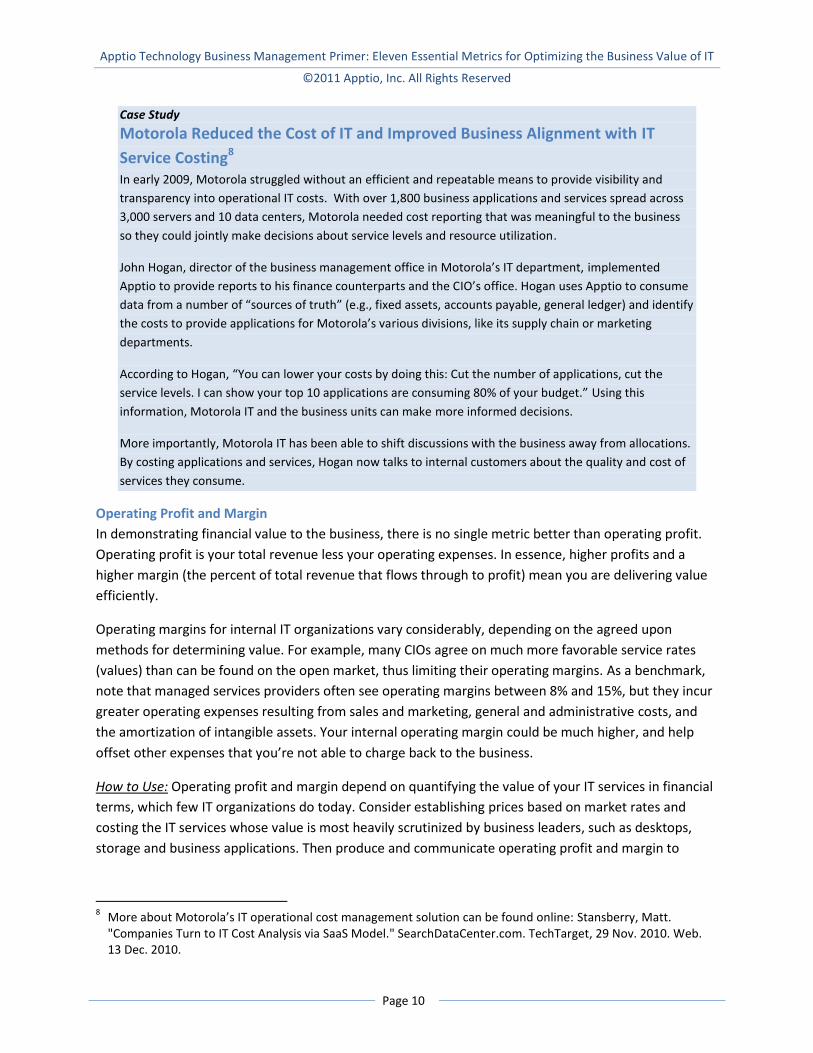
Motorola Reduced the Cost of IT and Improved Business Alignment with IT Service Costing .................. 10
Cisco Optimizes Its IT Investment Portfolio to Maximize Growth .............................................................. 13
CIOs Must Address a Broad Spectrum of Business Demands Different business models and goals exert different pressures on IT. Like most CIOs today, yours may be
asked to support a variety of simultaneous business models, placing your IT organization at different
points in your company’s value chain. At one end of the spectrum, the role of IT is a utility provider
where IT is bound to tight operational budgets to support existing business services as efficiently as
possible. This is where cost-reduction is king. On the other end of the spectrum, IT serves as a strategic
partner with business leaders in delivering new lines of revenue or penetrating new markets.
Unfortunately, there is no one-size-fits-all approach to managing the business of IT. You must not only
deliver value based on the unique (and often varied) demands of your business units, but you must
demonstrate that value in terms that are familiar to your business leaders. Financial metrics combined
with data on consumption and quality will prove invaluable to achieving these objectives – but they
must be utilized in the proper context based on the needs of your business customers and partners.
However, it is imperative that you choose the right metrics based on your business role.
Using sets of performance metrics that vary based on the particular business model chosen is nothing
new. Consider the different approaches to company valuations. Mature companies, or those in mature
industries, are generally valued on profitability metrics such as earnings per share, gross margin, and
EBITDA. Young companies, especially those in high growth markets, are primarily measured on revenue
growth, market share, the value of their intellectual property, and other metrics that indicate emerging
market dominance.
IT financial managers must deliver both financial and non-financial metrics to IT decision makers and
business stakeholders. In turn, these enable the business to manage different IT objectives:
balance the cost of and demand for IT resources;
deliver services that match or beat the cost and quality of those offered on the open market;
and
invest in projects that enable long-term competitiveness and business growth.
In this executive brief, we discuss the Technology Business Management (TBM) metrics employed by
many of today’s leading IT organizations and how they align to the expectations of the business. We
focus on IT financial metrics, which will help you communicate with stakeholders in the language they
understand. By reading this executive brief, you will better understand how TBM helps you align to the
business role that your IT organization serves.
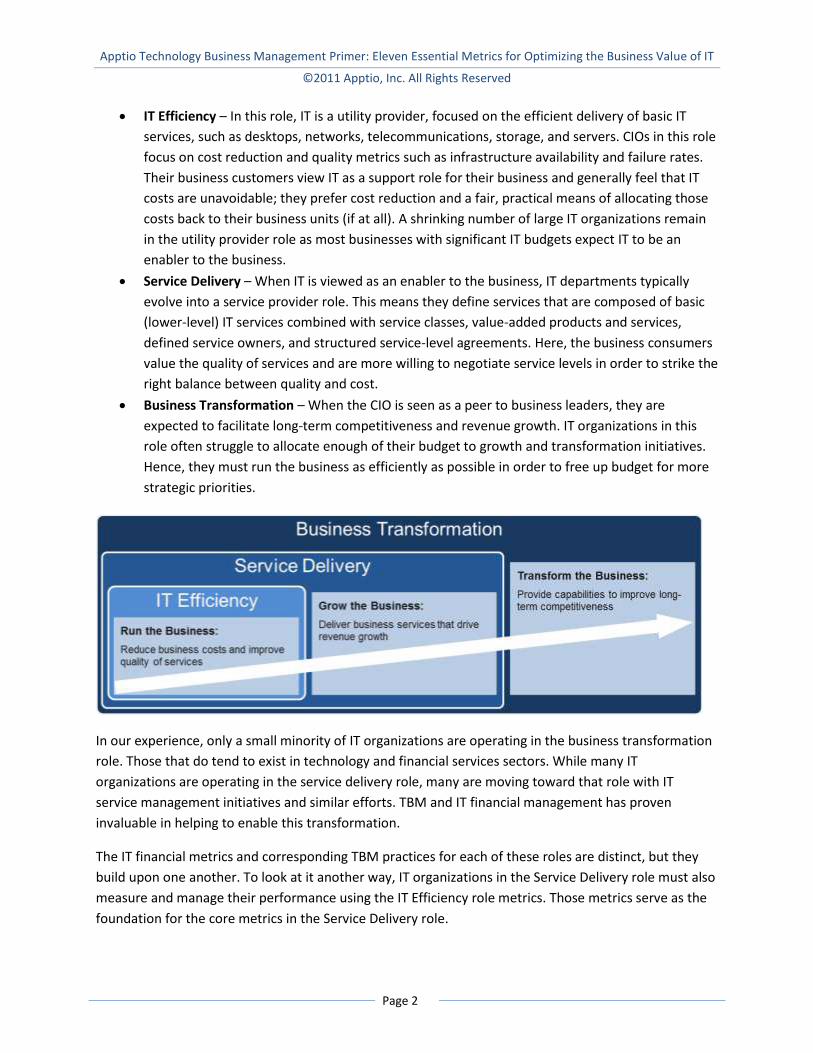
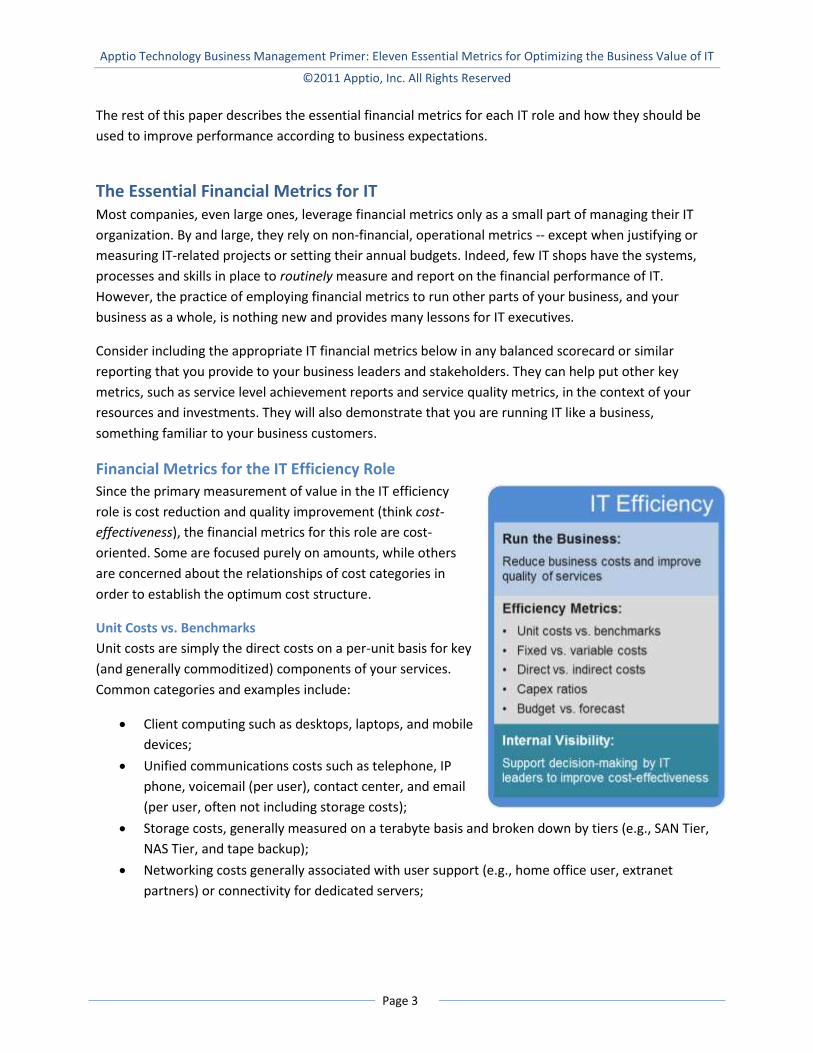
Understanding the Business Roles of IT
In general, IT plays one of three distinct roles in the business. Since these roles depend on your business
demands, your IT organization may exhibit different characteristics of these roles with different business
Physical data center space, often at the cabinet or unit level and broken down by data center
(which often correspond to different levels of service such as network latency or disaster
tolerance); and
Computing costs, generally measured at a tier or level of service that has been established for
your business customers.
Since most of your services comprise these various components, it is vital that you carefully manage
their costs. This means you must understand what subcomponents constitute their cost drivers (direct
and indirect) so you can get an accurate view of their unit costs. When those costs rise, you will know it
is time to take action. This may involve renegotiating with a supplier, finding new sources, or
reconsidering your sourcing model (insourced vs. outsourced).
How to Use: Benchmark your unit costs against those of your industry and between your own business
units. Your unit costs should be in line with the industry benchmarks, and those of each business unit
should be in line with each other. Unit costs that are significantly higher and represent a significant
portion of your budget should be targeted for further analysis1 and reduction.
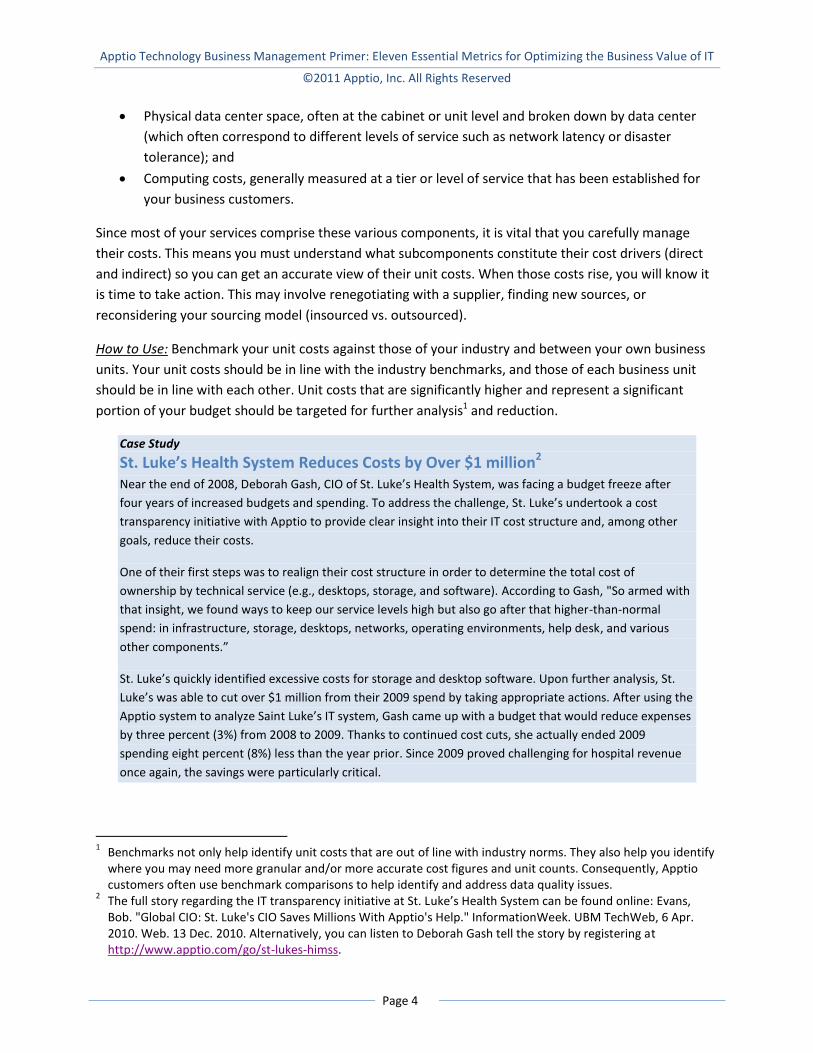
Case Study
St. Luke’s Health System Reduces Costs by Over $1 million2 Near the end of 2008, Deborah Gash, CIO of St. Luke’s Health System, was facing a budget freeze after
four years of increased budgets and spending. To address the challenge, St. Luke’s undertook a cost
transparency initiative with Apptio to provide clear insight into their IT cost structure and, among other
goals, reduce their costs.
One of their first steps was to realign their cost structure in order to determine the total cost of
ownership by technical service (e.g., desktops, storage, and software). According to Gash, "So armed with
that insight, we found ways to keep our service levels high but also go after that higher-than-normal
spend: in infrastructure, storage, desktops, networks, operating environments, help desk, and various
other components.”
St. Luke’s quickly identified excessive costs for storage and desktop software. Upon further analysis, St.
Luke’s was able to cut over $1 million from their 2009 spend by taking appropriate actions. After using the
Apptio system to analyze Saint Luke’s IT system, Gash came up with a budget that would reduce expenses
by three percent (3%) from 2008 to 2009. Thanks to continued cost cuts, she actually ended 2009
spending eight percent (8%) less than the year prior. Since 2009 proved challenging for hospital revenue
once again, the savings were particularly critical.
1 Benchmarks not only help identify unit costs that are out of line with industry norms. They also help you identify
where you may need more granular and/or more accurate cost figures and unit counts. Consequently, Apptio customers often use benchmark comparisons to help identify and address data quality issues.
2 The full story regarding the IT transparency initiative at St. Luke’s Health System can be found online: Evans,
Bob. "Global CIO: St. Luke's CIO Saves Millions With Apptio's Help." InformationWeek. UBM TechWeb, 6 Apr. 2010. Web. 13 Dec. 2010. Alternatively, you can listen to Deborah Gash tell the story by registering at http://www.apptio.com/go/st-lukes-himss.
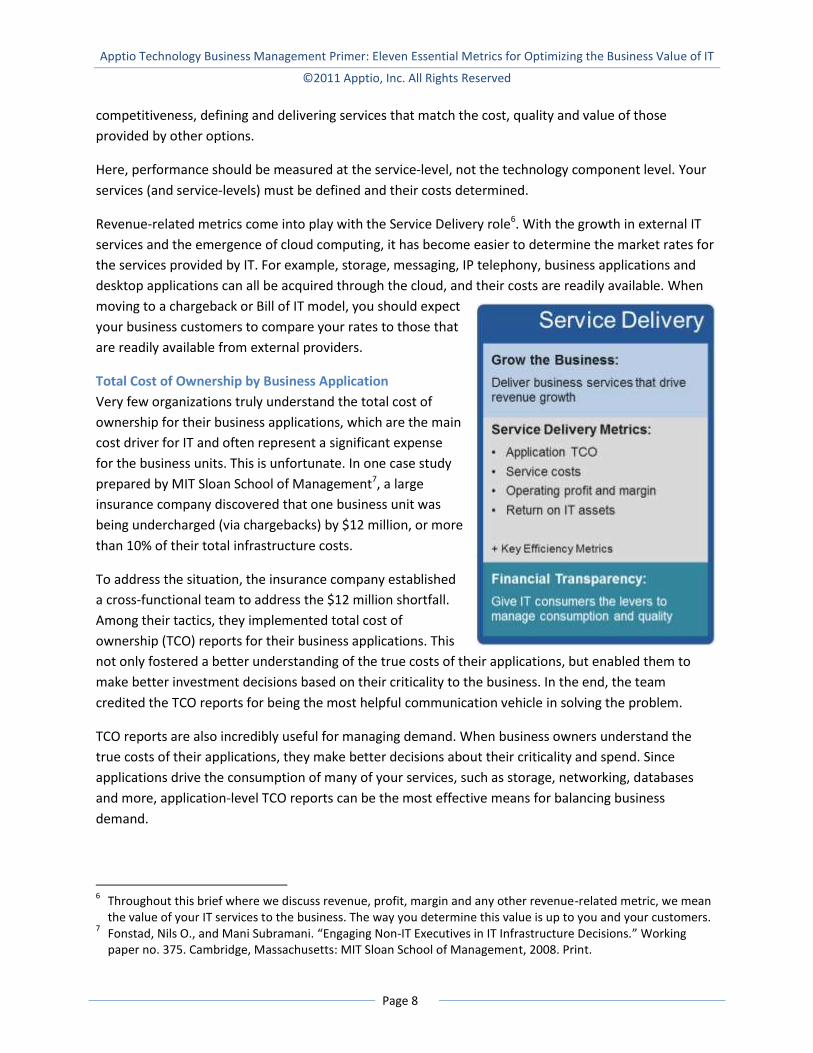
competitiveness, defining and delivering services that match the cost, quality and value of those
provided by other options.
Here, performance should be measured at the service-level, not the technology component level. Your
services (and service-levels) must be defined and their costs determined.
Revenue-related metrics come into play with the Service Delivery role6. With the growth in external IT
services and the emergence of cloud computing, it has become easier to determine the market rates for
the services provided by IT. For example, storage, messaging, IP telephony, business applications and
desktop applications can all be acquired through the cloud, and their costs are readily available. When
moving to a chargeback or Bill of IT model, you should expect
your business customers to compare your rates to those that
are readily available from external providers.
Total Cost of Ownership by Business Application
Very few organizations truly understand the total cost of
ownership for their business applications, which are the main
cost driver for IT and often represent a significant expense
for the business units. This is unfortunate. In one case study
prepared by MIT Sloan School of Management7, a large
insurance company discovered that one business unit was
being undercharged (via chargebacks) by $12 million, or more
than 10% of their total infrastructure costs.
To address the situation, the insurance company established
a cross-functional team to address the $12 million shortfall.
Among their tactics, they implemented total cost of
ownership (TCO) reports for their business applications. This
not only fostered a better understanding of the true costs of their applications, but enabled them to
make better investment decisions based on their criticality to the business. In the end, the team
credited the TCO reports for being the most helpful communication vehicle in solving the problem.
TCO reports are also incredibly useful for managing demand. When business owners understand the
true costs of their applications, they make better decisions about their criticality and spend. Since
applications drive the consumption of many of your services, such as storage, networking, databases
and more, application-level TCO reports can be the most effective means for balancing business
demand.
6 Throughout this brief where we discuss revenue, profit, margin and any other revenue-related metric, we mean
the value of your IT services to the business. The way you determine this value is up to you and your customers. 7 Fonstad, Nils O., and Mani Subramani. “Engaging Non-IT Executives in IT Infrastructure Decisions.” Working
paper no. 375. Cambridge, Massachusetts: MIT Sloan School of Management, 2008. Print.
Apptio Technology Business Management Primer: Eleven Essential Metrics for Optimizing the Business Value of IT
Cisco Optimizes Its IT Investment Portfolio to Maximize Growth11 Apptio customer, partner and investor, Cisco Systems, takes its IT spend very seriously. With over 3,000
Cisco-badged IT employees and a multi-billion dollar budget, Cisco CIO Rebecca Jacoby works hard to
maximize the amount of investment in growth and transformation initiatives.
According to Jacoby, Cisco divides its IT spending into three categories of investment. At the most basic
level is Operational Functionality, which represents IT services to run the business. Most of this
investment goes to the services portfolio that Cisco IT delivers to the business and is aimed at improving
employee productivity and maintaining compliance.
The next category of investment is called Business Capabilities. This represents improvements in business
scale (expanding capabilities within Cisco’s current or adjacent markets) and large optimizations
(significantly improving operational capabilities or delivering innovation).
The third category is Strategic Growth. This includes investments to drive long-term business growth, such
as tapping into new or early stage markets or improving the speed-to-market of new products and
services.
Working with Apptio, Cisco IT has been able to cost their IT services and report on the amounts spent in
each of their categories of IT investment. Furthermore, Cisco has been able to identify cost-optimization
opportunities (e.g., around directory services and storage) that help reduce Operational Functionality
(run-the-business) spending. In doing so, Cisco is rebalancing its IT investment portfolio to provide greater
value back to the business.
NPV of the IT Investment Portfolio
Net present value (NPV) is a method of determining the return on investment from a projected stream
of cash flows. It reflects the value, in today’s dollars, of expected cash receipts less expected cash paid
out for a project or investment. In discounting the cash flow, most organizations use their average cost
of capital or another discount rate that reflects their cost of money. Generally this is set by the finance
department.
Most IT organizations determine NPV of projects when they prepare business cases for them. Some
organizations periodically reevaluate NPV at various intervals or as costs and other assumptions change.
However, the cash receipts for these calculations are generally based on the receipts of the business.
Instead, we recommend you base the inflows on your expected bills of IT (or other service valuation) to
better reflect the value of IT’s contribution.
How to Use: Evaluate the NPV of your projects and portfolio on a very regular basis, just like you should
stay on top of your personal investment portfolio. IT projects are fraught with risk, and rarely do they
come in on time and under budget. Budgets and forecasts are key components of this periodic
evaluation. Moreover, the business value (and therefore service value) often changes over the course of
11
More about Cisco’s IT investment philosophy can be found online: Lawson, Stephen. "CIO Rebecca Jacoby Steers Cisco's IT Ship." CIO.com. CXO Media, Inc., 13 Dec. 2010. Web. 15 Dec. 2010.
Apptio Technology Business Management Primer: Eleven Essential Metrics for Optimizing the Business Value of IT
a project. Frequent reevaluation gives you the opportunity to shift investment from less productive
projects to more productive ones.
There are no simple rules for calculating the NPV of your portfolio. Most importantly, it should grow,
just like any investment portfolio. Growth demonstrates that you are delivering more value to the
business, helping it grow revenues and meet strategic goals.
Economic Value Added (EVA)
Gartner recently predicted12 that many IT organizations will begin using a different measure called
Economic Value Added, or EVA, to determine and communicate the value provided by IT. While not
without its flaws, EVA provides an effective measure of profitability from the operations of a business
unit from the perspective of the shareholder. It does so by essentially reducing the net operating profit
(after taxes) by the average cost of capital for the business unit.
EVA was developed in the 1980s and has since become the dominant corporate measure of value
creation. Many boards of directors incent their top managers according to EVA calculations. According
to Joel Stern, co-author of the EVA model, “EVA makes managers think more like shareholders because
they have a better understanding of what’s been invested to generate earnings. Like entrepreneurs,
they become much more cost conscious, aggressively seeking ways to conserve capital and operate
more efficiently.”13 Hence, it promises to effectively incent IT leaders to make the best decisions in the
interests of the shareholders.
The major difference between EVA and NPV (described above) are the time horizons for each. EVA
considers only the current time period (e.g., current fiscal year) while NPV is based on the expected
long-term cash flows of an investment. Therefore, EVA promises to provide an accurate measure of
profit contribution for a period of activity, while NPV is subject to errors in future cash flow estimations.
This is why it is so important that the NPV of projects or investments be adjusted from time-to-time to
reflect the most current understanding of future cash flows.
How to Use: EVA is not a measure to be undertaken by IT alone, as it relies on assumptions about the
amount of capital invested in IT that is not traditionally available to IT decision makers. Instead, employ
EVA if the rest of your business is also applying EVA valuations. If that is the case, corporate finance
should have a well-defined method of allocating capital and determining average capital costs, both of
which are required for EVA calculations. If EVA is not employed by your business, instead rely on NPV
and your IT spend ratio to determine, manage and communicate the business value of IT.
12
Biswajeet Mahapatra. “EVA Helps Companies Evaluate the Cost of IT Operations.” Rep. no. G00209593. Gartner, 3 Feb. 2011.
13 "The Distinguished Alumnus Awards: Joel Stern." GSB | Chicago. The University of Chicago Booth School of Business, Sept. 1998. Web. 10 Feb. 2011. <http://www.chicagobooth.edu/magazine/summer98/Stern.html>.
Apptio Technology Business Management Primer: Eleven Essential Metrics for Optimizing the Business Value of IT