
www.apptio.com ©2011 Apptio, Inc. All Rights Reserved
IT Financial Metrics Primer: Eleven Essential Metrics for Optimizing the Business Value of IT
Abstract
In this primer, we discuss the IT financial metrics employed by many of today’s leading IT organizations
to provide better transparency and align IT to the needs of the business. We focus on the essential IT
financial metrics that help you make better decisions (i.e., internal financial transparency) and
communicate with stakeholders in the language they understand (i.e., external financial transparency).
By reading this primer, you will better understand how to use IT financial metrics to improve the
business value of IT.
www.apptio.com ©2011 Apptio, Inc. All Rights Reserved
Contents CIOs Must Address a Broad Spectrum of Business Demands ....................................................................... 1
Understanding the Business Roles of IT .................................................................................................... 1
The Essential Financial Metrics for IT............................................................................................................ 3
Financial Metrics for the IT Efficiency Role ............................................................................................... 3
Unit Costs vs. Benchmarks .................................................................................................................... 3
Fixed vs. Variable Cost Ratio ................................................................................................................. 5
Direct vs. Indirect Cost Ratio ................................................................................................................. 5
Capex Ratios .......................................................................................................................................... 6
Budget vs. Actuals and Forecast ........................................................................................................... 7
Financial Metrics for the Service Delivery Role ........................................................................................ 7
Total Cost of Ownership by Business Application ................................................................................. 8
Service Costs ......................................................................................................................................... 9
Operating Profit and Margin ............................................................................................................... 10
Return on IT Assets ............................................................................................................................. 11
Financial Metrics for the Business Transformation Role ........................................................................ 11
IT Spend Ratio ..................................................................................................................................... 12
NPV of the IT Investment Portfolio ..................................................................................................... 13
Economic Value Added (EVA) ............................................................................................................. 14
Where to Go from Here .............................................................................................................................. 15
About Apptio ............................................................................................................................................... 16
Case Studies St. Luke’s Health System Reduces Costs by Over $1 million ......................................................................... 4
Motorola Reduced the Cost of IT and Improved Business Alignment with IT Service Costing .................. 10
Cisco Optimizes Its IT Investment Portfolio to Maximize Growth .............................................................. 13
Apptio Technology Business Management Primer: Eleven Essential Metrics for Optimizing the Business Value of IT
©2011 Apptio, Inc. All Rights Reserved
Page 1
CIOs Must Address a Broad Spectrum of Business Demands Different business models and goals exert different pressures on IT. Like most CIOs today, yours may be
asked to support a variety of simultaneous business models, placing your IT organization at different
points in your company’s value chain. At one end of the spectrum, the role of IT is a utility provider
where IT is bound to tight operational budgets to support existing business services as efficiently as
possible. This is where cost-reduction is king. On the other end of the spectrum, IT serves as a strategic
partner with business leaders in delivering new lines of revenue or penetrating new markets.
Unfortunately, there is no one-size-fits-all approach to managing the business of IT. You must not only
deliver value based on the unique (and often varied) demands of your business units, but you must
demonstrate that value in terms that are familiar to your business leaders. Financial metrics combined
with data on consumption and quality will prove invaluable to achieving these objectives – but they
must be utilized in the proper context based on the needs of your business customers and partners.
However, it is imperative that you choose the right metrics based on your business role.
Using sets of performance metrics that vary based on the particular business model chosen is nothing
new. Consider the different approaches to company valuations. Mature companies, or those in mature
industries, are generally valued on profitability metrics such as earnings per share, gross margin, and
EBITDA. Young companies, especially those in high growth markets, are primarily measured on revenue
growth, market share, the value of their intellectual property, and other metrics that indicate emerging
market dominance.
IT financial managers must deliver both financial and non-financial metrics to IT decision makers and
business stakeholders. In turn, these enable the business to manage different IT objectives:
balance the cost of and demand for IT resources;
deliver services that match or beat the cost and quality of those offered on the open market;
and
invest in projects that enable long-term competitiveness and business growth.
In this executive brief, we discuss the Technology Business Management (TBM) metrics employed by
many of today’s leading IT organizations and how they align to the expectations of the business. We
focus on IT financial metrics, which will help you communicate with stakeholders in the language they
understand. By reading this executive brief, you will better understand how TBM helps you align to the
business role that your IT organization serves.
Understanding the Business Roles of IT
In general, IT plays one of three distinct roles in the business. Since these roles depend on your business
demands, your IT organization may exhibit different characteristics of these roles with different business
units. The three roles are:
Apptio Technology Business Management Primer: Eleven Essential Metrics for Optimizing the Business Value of IT
©2011 Apptio, Inc. All Rights Reserved
Page 2
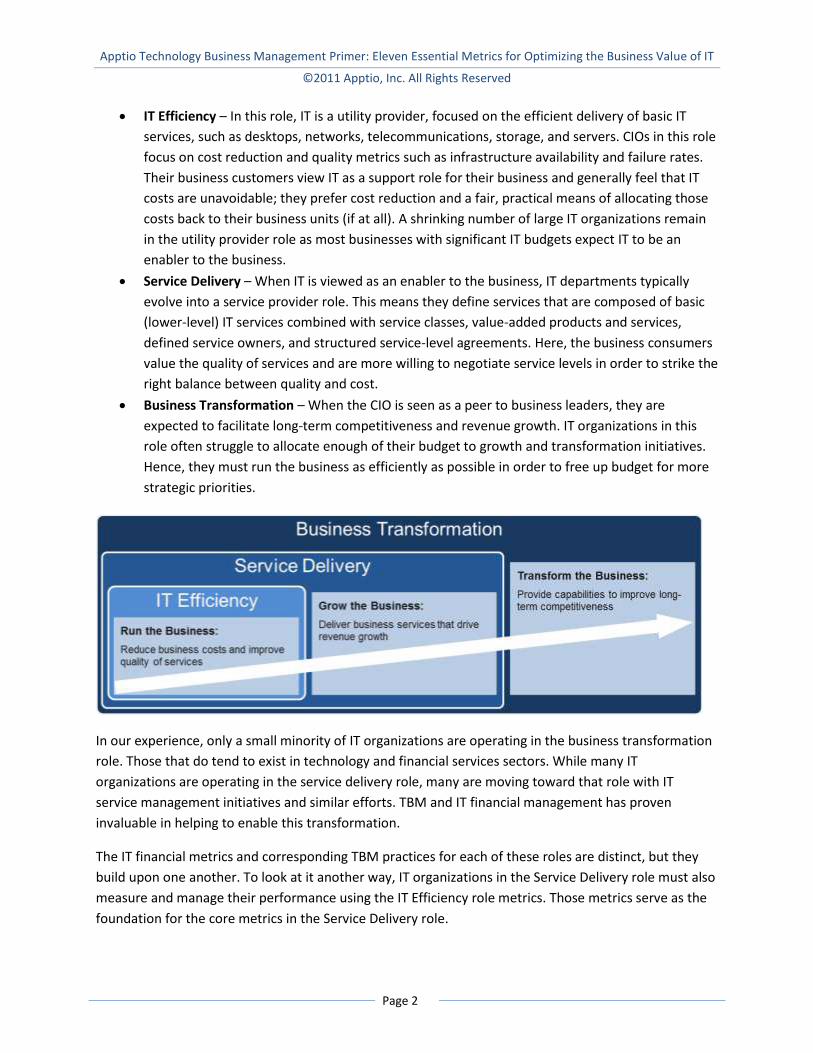
IT Efficiency – In this role, IT is a utility provider, focused on the efficient delivery of basic IT
services, such as desktops, networks, telecommunications, storage, and servers. CIOs in this role
focus on cost reduction and quality metrics such as infrastructure availability and failure rates.
Their business customers view IT as a support role for their business and generally feel that IT
costs are unavoidable; they prefer cost reduction and a fair, practical means of allocating those
costs back to their business units (if at all). A shrinking number of large IT organizations remain
in the utility provider role as most businesses with significant IT budgets expect IT to be an
enabler to the business.
Service Delivery – When IT is viewed as an enabler to the business, IT departments typically
evolve into a service provider role. This means they define services that are composed of basic
(lower-level) IT services combined with service classes, value-added products and services,
defined service owners, and structured service-level agreements. Here, the business consumers
value the quality of services and are more willing to negotiate service levels in order to strike the
right balance between quality and cost.
Business Transformation – When the CIO is seen as a peer to business leaders, they are
expected to facilitate long-term competitiveness and revenue growth. IT organizations in this
role often struggle to allocate enough of their budget to growth and transformation initiatives.
Hence, they must run the business as efficiently as possible in order to free up budget for more
strategic priorities.
In our experience, only a small minority of IT organizations are operating in the business transformation
role. Those that do tend to exist in technology and financial services sectors. While many IT
organizations are operating in the service delivery role, many are moving toward that role with IT
service management initiatives and similar efforts. TBM and IT financial management has proven
invaluable in helping to enable this transformation.
The IT financial metrics and corresponding TBM practices for each of these roles are distinct, but they
build upon one another. To look at it another way, IT organizations in the Service Delivery role must also
measure and manage their performance using the IT Efficiency role metrics. Those metrics serve as the
foundation for the core metrics in the Service Delivery role.
Apptio Technology Business Management Primer: Eleven Essential Metrics for Optimizing the Business Value of IT
©2011 Apptio, Inc. All Rights Reserved
Page 3
The rest of this paper describes the essential financial metrics for each IT role and how they should be
used to improve performance according to business expectations.
The Essential Financial Metrics for IT Most companies, even large ones, leverage financial metrics only as a small part of managing their IT
organization. By and large, they rely on non-financial, operational metrics -- except when justifying or
measuring IT-related projects or setting their annual budgets. Indeed, few IT shops have the systems,
processes and skills in place to routinely measure and report on the financial performance of IT.
However, the practice of employing financial metrics to run other parts of your business, and your
business as a whole, is nothing new and provides many lessons for IT executives.
Consider including the appropriate IT financial metrics below in any balanced scorecard or similar
reporting that you provide to your business leaders and stakeholders. They can help put other key
metrics, such as service level achievement reports and service quality metrics, in the context of your
resources and investments. They will also demonstrate that you are running IT like a business,
something familiar to your business customers.
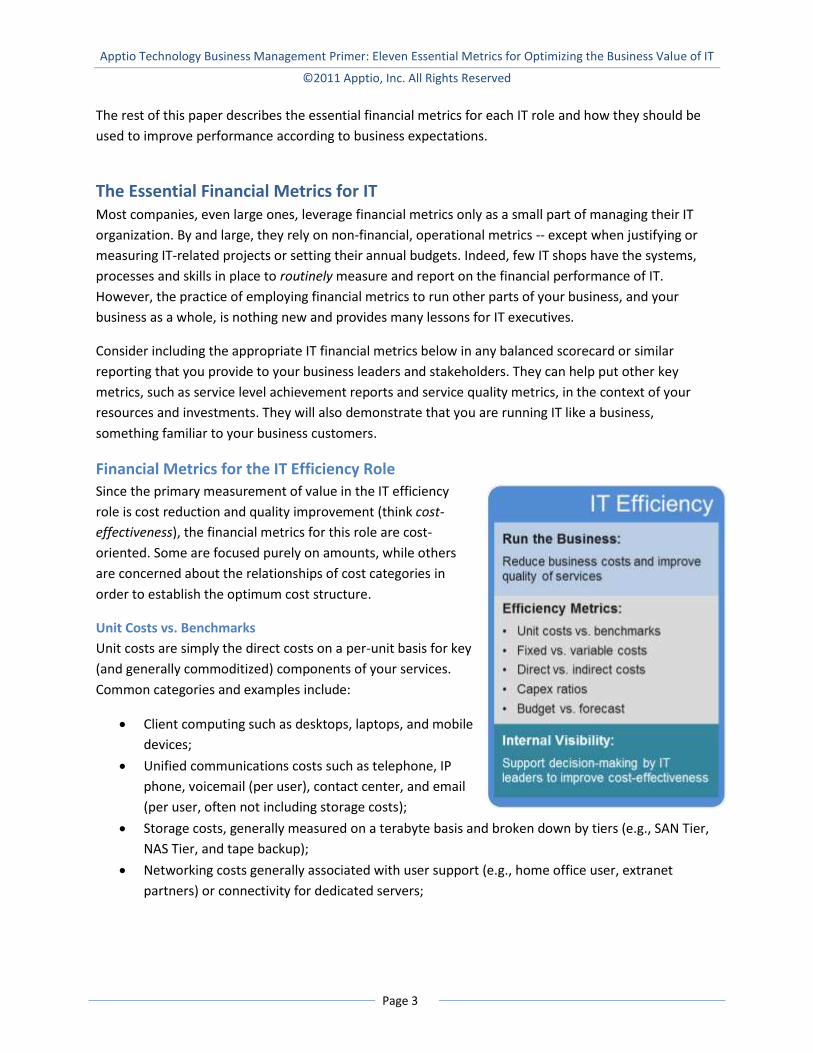
Financial Metrics for the IT Efficiency Role
Since the primary measurement of value in the IT efficiency
role is cost reduction and quality improvement (think cost-
effectiveness), the financial metrics for this role are cost-
oriented. Some are focused purely on amounts, while others
are concerned about the relationships of cost categories in
order to establish the optimum cost structure.
Unit Costs vs. Benchmarks
Unit costs are simply the direct costs on a per-unit basis for key
(and generally commoditized) components of your services.
Common categories and examples include:
Client computing such as desktops, laptops, and mobile
devices;
Unified communications costs such as telephone, IP
phone, voicemail (per user), contact center, and email
(per user, often not including storage costs);
Storage costs, generally measured on a terabyte basis and broken down by tiers (e.g., SAN Tier,
NAS Tier, and tape backup);
Networking costs generally associated with user support (e.g., home office user, extranet
partners) or connectivity for dedicated servers;
Apptio Technology Business Management Primer: Eleven Essential Metrics for Optimizing the Business Value of IT
©2011 Apptio, Inc. All Rights Reserved
Page 4
Physical data center space, often at the cabinet or unit level and broken down by data center
(which often correspond to different levels of service such as network latency or disaster
tolerance); and
Computing costs, generally measured at a tier or level of service that has been established for
your business customers.
Since most of your services comprise these various components, it is vital that you carefully manage
their costs. This means you must understand what subcomponents constitute their cost drivers (direct
and indirect) so you can get an accurate view of their unit costs. When those costs rise, you will know it
is time to take action. This may involve renegotiating with a supplier, finding new sources, or
reconsidering your sourcing model (insourced vs. outsourced).
How to Use: Benchmark your unit costs against those of your industry and between your own business
units. Your unit costs should be in line with the industry benchmarks, and those of each business unit
should be in line with each other. Unit costs that are significantly higher and represent a significant
portion of your budget should be targeted for further analysis1 and reduction.
Case Study
St. Luke’s Health System Reduces Costs by Over $1 million2 Near the end of 2008, Deborah Gash, CIO of St. Luke’s Health System, was facing a budget freeze after
four years of increased budgets and spending. To address the challenge, St. Luke’s undertook a cost
transparency initiative with Apptio to provide clear insight into their IT cost structure and, among other
goals, reduce their costs.
One of their first steps was to realign their cost structure in order to determine the total cost of
ownership by technical service (e.g., desktops, storage, and software). According to Gash, "So armed with
that insight, we found ways to keep our service levels high but also go after that higher-than-normal
spend: in infrastructure, storage, desktops, networks, operating environments, help desk, and various
other components.”
St. Luke’s quickly identified excessive costs for storage and desktop software. Upon further analysis, St.
Luke’s was able to cut over $1 million from their 2009 spend by taking appropriate actions. After using the
Apptio system to analyze Saint Luke’s IT system, Gash came up with a budget that would reduce expenses
by three percent (3%) from 2008 to 2009. Thanks to continued cost cuts, she actually ended 2009
spending eight percent (8%) less than the year prior. Since 2009 proved challenging for hospital revenue
once again, the savings were particularly critical.
1 Benchmarks not only help identify unit costs that are out of line with industry norms. They also help you identify
where you may need more granular and/or more accurate cost figures and unit counts. Consequently, Apptio customers often use benchmark comparisons to help identify and address data quality issues.
2 The full story regarding the IT transparency initiative at St. Luke’s Health System can be found online: Evans,
Bob. "Global CIO: St. Luke's CIO Saves Millions With Apptio's Help." InformationWeek. UBM TechWeb, 6 Apr. 2010. Web. 13 Dec. 2010. Alternatively, you can listen to Deborah Gash tell the story by registering at http://www.apptio.com/go/st-lukes-himss.
Apptio Technology Business Management Primer: Eleven Essential Metrics for Optimizing the Business Value of IT
©2011 Apptio, Inc. All Rights Reserved
Page 5
Fixed vs. Variable Cost Ratio
The fixed to variable cost ratio helps you understand your cost structure relative to your strategy. With
nearly two-thirds of most IT budgets being fixed cost3, you may be seeking a more variable cost
structure that favors agility and flexibility (i.e., lower fixed-to-variable cost ratio). By maintaining a high
proportion of your costs as variable, oftentimes you can more cost-effectively scale up or down based
on demand.
Outsourcing and external service providers offer significant potential for lowering the fixed-to-variable
cost ratio. However, the benefits of agility and flexibility must be balanced against other factors, such as
potential vendor lock-in, integration requirements, and security and compliance concerns. Furthermore,
many businesses have economies of scale or investment horizons that favor a higher degree of fixed
investments (i.e., a higher fixed-to-variable ratio) in order to achieve lower service unit costs. In the long
run, owning can be more cost-effective than renting.
A deeper understanding of your variable costs also allows you to perform variable cost dynamics. This
analysis helps you understand how anticipated changes in your business are going to affect your total
costs and budget demands. For example, if a business unit is going to add a site with new employees,
how will that impact the cost of delivering IT services? Without knowing your variable cost dynamics, it
is impossible to answer this question.
For most IT organizations, this ratio is especially difficult to track without the right system in place. Most
purchasing processes and general ledger systems do not tag expenses as either fixed or variable. This
must be done separately by taking into account the true nature of your expenses.
How to Use: Monitor your fixed-to-variable cost ratio and ensure it is in line with the needs of your
business. Keep in mind that with this ratio, lower is not always better. For some organizations, especially
those with economies of scale, a higher proportion of fixed costs may be advantageous. Businesses that
experience more significant organizational changes, especially reductions in staff, generally benefit from
a higher proportion of variable costs. If adjustments are needed, work with procurement and/or finance
to establish guidelines that encourage the right types of purchase contracts.
Direct vs. Indirect Cost Ratio
When determining direct vs. indirect, you must answer one question first: to what are your costs
(primarily) allocated? In organizations that have not completed the transformation to a service delivery
model, the objects of allocation are generally business units or cost centers. For example, IT
organizations in this model may allocate the cost of a server to the business unit (cost center) to which it
is dedicated. In organizations that are aligned to service delivery, the objects of allocation are generally
their services. Resources that are dedicated to a business unit or a service would be described as a direct
cost.
3 Gartner. “Gartner Says Changing the Cost Structure of IT Will Become a Business Imperative for Most CIOs.”
Gartner, 14 Oct. 2008. Web. 15 Dec. 2010.
Apptio Technology Business Management Primer: Eleven Essential Metrics for Optimizing the Business Value of IT
©2011 Apptio, Inc. All Rights Reserved
Page 6
The relative proportion of your indirect costs to your direct costs indicates the degree to which your
business employs shared resources. This is especially important in organizations that are moving to a
shared services model and are hoping to optimize their investments in dedicated resources such as
servers, storage, databases and physical data center space. A higher proportion of indirect costs
generally indicates greater employment of shared resources, which generally leads to improved rates of
utilization and efficiencies.
Some technologies drive shared resource adoption, such as virtualization and cloud computing, both of
which share the costs of hardware, utilities, floor space and manpower. However, most technologies,
such as applications, database management systems, and communications technologies can equally
support a shared model depending on how they are deployed.
Organizational changes to improve a shared resource model include a move (in whole or in part) to a
shared services IT department, whereby IT personnel that were dedicated to specific business units are
moved into a centralized IT organization. Business unit incentives generally stem from your method for
charging (including nominal chargebacks or showback) the business units for resource utilization:
dedicated resources should come at a higher cost to the business units.
As with the fixed vs. variable cost ratio above, the direct vs. indirect metric is difficult for most
organizations to track due to limitations in their systems and processes. However, this metric, along with
utilization metrics, can quickly identify opportunities for cost reduction. In particular, look for direct
costs that are associated with poorly utilized resources.
How to Use: Monitor your indirect-to-direct cost ratio and seek opportunities for improvement. To
improve this ratio, you should seek technologies, organizational changes, and business unit incentives to
improve the adoption of shared resources.
Capex Ratios
Opex, or operating expense, is an expenditure that immediately flows through your income statement.
Capex, or capital expense, is an expenditure that gets capitalized, or booked as an asset, and flows
through your income statement as depreciation over a period of time (generally equal to the useful life
of the asset). Capex not only includes hardware and software, but also the costs to deploy them and
certain application development costs. The accounting rules governing the capitalization of costs are
complex and vary from company to company, but every CIO and IT executive should understand how
the rules apply to them.
Many CIOs focus on raising their capex-to-opex ratio. This gives you an indicator of how much of your
expense represents an investment for the business. Since these investments create useful assets, a
higher ratio means you are investing more of your money in long-term value. However, a higher ratio
Apptio Technology Business Management Primer: Eleven Essential Metrics for Optimizing the Business Value of IT
©2011 Apptio, Inc. All Rights Reserved
Page 7
also contributes to a higher fixed cost structure, as fixed asset depreciation is a fixed cost4. Regardless,
there is no magic number for the right level of investment; it depends on your business.
More important than opex-to-capex ratio is the IT capex-to-asset ratio. For CapEx requirements to
address asset refresh needs, we recommend using a ratio that compares your annual capex budget with
the purchase value (original value at time of creation) of your assets that are fully depreciated or will be
fully depreciated within the planning horizon. For example, if you have fully depreciated servers with a
combined purchase price of $10 million, and another $2 million in servers that will fully depreciate in the
next fiscal year, your capex budget for server refresh should be based on $12 million. Studies have
shown that failing to invest adequate capital back into IT generally costs more in the long run. This ratio
is crucial to maintaining the long-term cost-effectiveness of your IT organization.5
How to Use: There is no magic capex-to-asset value for IT. Many organizations will find a capex-to-asset
value (as calculated above) of less than one (100%) adequate as the price/performance ratio of different
technologies improves. While this metric provides a gross measure of capital adequacy, it should be
combined with a more careful planning for asset refresh that considers break-fix cycles, mean time
between failure (MTBF) rates and other measures that drive hardware refreshes. Furthermore, capacity
planning and business projects add to capital requirements and should be included separately.
Budget vs. Actuals and Forecast
While budgeting is generally an annual exercise, forecasting should be done on at least a monthly basis.
Forecasting is the process of estimating how much you expect to spend in a given period or for the
remainder of a project. Forecasted amounts are generally added to actual expenses in order to
determine any variance that is expected from your budget.
How to Use: Knowing your expected variances is vital for effective IT management. By identifying
variances early, you can take prescriptive action. At a minimum, you must inform stakeholders who are
directly impacted by variances, such as the business units that will be charged for them. There are few
things as detrimental to the CIO-to-business relationship than large, unexpected budget variances.
Armed in advance, you can also look for ways to offset any variances. You may be able to reduce
expenditures in other areas, or in other quarterly periods, to make up for any shortfall. On the other
hand, you may identify budget surpluses that allow you to invest more heavily in other projects that are
important to the business.
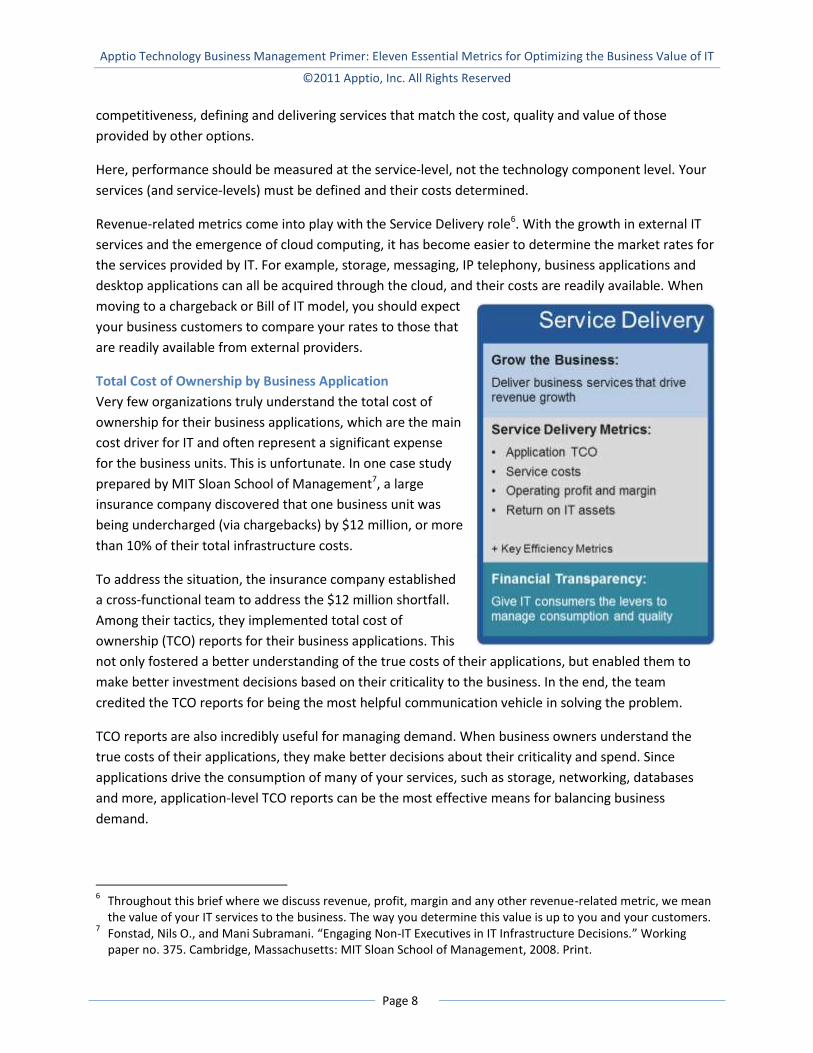
Financial Metrics for the Service Delivery Role
In some organizations, the business units have tremendous freedom to outsource some or all of their IT
services. This puts significant pressure on internal IT departments to demonstrate competitiveness and
cost-effectiveness. In the Service Delivery role, IT is focused on both internal and external
4 On the other hand, renting capacity through service providers represents opex, but generally provides a much
more variable cost structure. 5 For a discussion of IT capex-to-asset ratio, see: Buchanan, Stewart and Jack Heine. “Use Financial Sustainability
Metrics That Optimize the IT Asset Portfolio to Optimize Cost.” Rep. no. G00171629. Gartner, 26 Oct. 2009.
Apptio Technology Business Management Primer: Eleven Essential Metrics for Optimizing the Business Value of IT
©2011 Apptio, Inc. All Rights Reserved
Page 8
competitiveness, defining and delivering services that match the cost, quality and value of those
provided by other options.
Here, performance should be measured at the service-level, not the technology component level. Your
services (and service-levels) must be defined and their costs determined.
Revenue-related metrics come into play with the Service Delivery role6. With the growth in external IT
services and the emergence of cloud computing, it has become easier to determine the market rates for
the services provided by IT. For example, storage, messaging, IP telephony, business applications and
desktop applications can all be acquired through the cloud, and their costs are readily available. When
moving to a chargeback or Bill of IT model, you should expect
your business customers to compare your rates to those that
are readily available from external providers.
Total Cost of Ownership by Business Application
Very few organizations truly understand the total cost of
ownership for their business applications, which are the main
cost driver for IT and often represent a significant expense
for the business units. This is unfortunate. In one case study
prepared by MIT Sloan School of Management7, a large
insurance company discovered that one business unit was
being undercharged (via chargebacks) by $12 million, or more
than 10% of their total infrastructure costs.
To address the situation, the insurance company established
a cross-functional team to address the $12 million shortfall.
Among their tactics, they implemented total cost of
ownership (TCO) reports for their business applications. This
not only fostered a better understanding of the true costs of their applications, but enabled them to
make better investment decisions based on their criticality to the business. In the end, the team
credited the TCO reports for being the most helpful communication vehicle in solving the problem.
TCO reports are also incredibly useful for managing demand. When business owners understand the
true costs of their applications, they make better decisions about their criticality and spend. Since
applications drive the consumption of many of your services, such as storage, networking, databases
and more, application-level TCO reports can be the most effective means for balancing business
demand.
6 Throughout this brief where we discuss revenue, profit, margin and any other revenue-related metric, we mean
the value of your IT services to the business. The way you determine this value is up to you and your customers. 7 Fonstad, Nils O., and Mani Subramani. “Engaging Non-IT Executives in IT Infrastructure Decisions.” Working
paper no. 375. Cambridge, Massachusetts: MIT Sloan School of Management, 2008. Print.
Apptio Technology Business Management Primer: Eleven Essential Metrics for Optimizing the Business Value of IT
©2011 Apptio, Inc. All Rights Reserved
Page 9
How to Use: Upon determining your application TCO, work closely with business leaders to ensure the
value of their applications is in line with their expectations. If significant differences exist, look for
opportunities to alter the cost structure of your applications, such as reducing storage tiers or
renegotiating your license and/or maintenance agreements with the vendor.
Furthermore, monitor the unit or per-user TCO trends for each of your major applications. In general,
the unit costs of your applications should fall over time as your hardware depreciates and your license
costs are fully amortized, along with other benefits of application maturity such as reduced operating
costs. They should also fall as more users adopt your applications, resulting in a broader distribution of
fixed costs. In some cases, you application TCO will rise as the result of major new releases and
upgrades.
Service Costs
Service costs are comprised of your unit costs (i.e., those described above in the IT Efficiency role) plus
the costs of the activities and products that constitute the value of the service to the business. For
example, a desktop service includes more than just a PC (hardware), but also the setup, maintenance,
technical support, network, and software as well. Without those additional components, a desktop is of
little value to the business consumer.
At the service level is where your cost accounting becomes much more complex: many IT organizations
are unable to determine the total cost of their services due to the multitude of options, cost pools, and
allocation methods. This is where activity-based costing, or ABC, is helpful. With ABC, you determine the
standard cost of services by costing the activities that comprise them. ABC not only provides more
accurate cost allocation, but it supports decision-making to improve the quality and reliability of IT
services and service components. ABC also helps identify outlying cost drivers in IT operations and
shows how the use of IT services drives cost increases.
Having a system that enables you to allocate cost pools at multiple levels and based on a variety of
drivers is crucial to understanding your service costs. Some cost pools support multiple services which,
in turn, support other services. Take the cost of your network, for example. Your network supports your
data center systems and applications, desktop services, IP telephony, video, and others, many of which
are part of other higher-level services.
How to Use: Similar to the recommendation above for application TCO, work closely with business
leaders to ensure the value of your services is in line with their expectations. You may have the
opportunity to define additional service levels at lower costs that adequately meet the needs of your
business users, thus providing clear opportunities for cost reduction. Also, monitor the trend of unit
(per-user) service costs.
Apptio Technology Business Management Primer: Eleven Essential Metrics for Optimizing the Business Value of IT
©2011 Apptio, Inc. All Rights Reserved
Page 10
Case Study
Motorola Reduced the Cost of IT and Improved Business Alignment with IT
Service Costing8 In early 2009, Motorola struggled without an efficient and repeatable means to provide visibility and
transparency into operational IT costs. With over 1,800 business applications and services spread across
3,000 servers and 10 data centers, Motorola needed cost reporting that was meaningful to the business
so they could jointly make decisions about service levels and resource utilization.
John Hogan, director of the business management office in Motorola’s IT department, implemented
Apptio to provide reports to his finance counterparts and the CIO’s office. Hogan uses Apptio to consume
data from a number of “sources of truth” (e.g., fixed assets, accounts payable, general ledger) and identify
the costs to provide applications for Motorola’s various divisions, like its supply chain or marketing
departments.
According to Hogan, “You can lower your costs by doing this: Cut the number of applications, cut the
service levels. I can show your top 10 applications are consuming 80% of your budget.” Using this
information, Motorola IT and the business units can make more informed decisions.
More importantly, Motorola IT has been able to shift discussions with the business away from allocations.
By costing applications and services, Hogan now talks to internal customers about the quality and cost of
services they consume.
Operating Profit and Margin
In demonstrating financial value to the business, there is no single metric better than operating profit.
Operating profit is your total revenue less your operating expenses. In essence, higher profits and a
higher margin (the percent of total revenue that flows through to profit) mean you are delivering value
efficiently.
Operating margins for internal IT organizations vary considerably, depending on the agreed upon
methods for determining value. For example, many CIOs agree on much more favorable service rates
(values) than can be found on the open market, thus limiting their operating margins. As a benchmark,
note that managed services providers often see operating margins between 8% and 15%, but they incur
greater operating expenses resulting from sales and marketing, general and administrative costs, and
the amortization of intangible assets. Your internal operating margin could be much higher, and help
offset other expenses that you’re not able to charge back to the business.
How to Use: Operating profit and margin depend on quantifying the value of your IT services in financial
terms, which few IT organizations do today. Consider establishing prices based on market rates and
costing the IT services whose value is most heavily scrutinized by business leaders, such as desktops,
storage and business applications. Then produce and communicate operating profit and margin to
8 More about Motorola’s IT operational cost management solution can be found online: Stansberry, Matt.
"Companies Turn to IT Cost Analysis via SaaS Model." SearchDataCenter.com. TechTarget, 29 Nov. 2010. Web. 13 Dec. 2010.
Apptio Technology Business Management Primer: Eleven Essential Metrics for Optimizing the Business Value of IT
©2011 Apptio, Inc. All Rights Reserved
Page 11
business leaders and other stakeholders in order to demonstrate the importance of quantifying the
value of your services. This can justify the expansion of pricing to other IT services.
Return on IT Assets
The term return on IT assets has been abused by technology marketers, yet a clear definition remains
elusive. The term is borrowed from a common metric applied to capital intensive companies and reflects
how efficiently your assets generate income. Since IT is capital intensive, it applies equally well here.
The return on IT assets (ROITA) is calculated by dividing your annual (or trailing twelve month) operating
income by your average annual IT assets (capitalized hardware, software, and other costs). The higher
the return (as a percentage), the better you’re doing to derive service value (e.g., IT billings) from your
fixed assets.
As with the other metrics, ROITA varies considerably from one company to the next. You should focus
on improving this metric over time. For example, many CIOs have grown this metric over the past few
years through virtualization efforts, which helped reduce hardware costs and free up data center space,
both of which are components of IT asset value. Some grew it by improving the value of their services
through differentiation, raising their operating income. With ROITA, a dollar earned (added to operating
income) is generally better than a dollar saved (removed from IT assets).
Note that the Return on Assets from managed services providers typically ranges from 5% to 10%. Due
to their corporate cost structure, you should strive for better.
How to Use: As with operating profit and margin, you may need to segment your IT services and assets
to calculate ROITA. Use this metric to identify opportunities to minimize capital expenditures (or
potentially write-down assets due to impairment). Capitalized assets with poor returns generally
indicate there are market alternatives that are more cost-effective.
Financial Metrics for the Business Transformation Role
Leveraging IT to support business transformation demands a clear alignment of IT priorities to the
business. A transformational IT role often results in the rationalization of service levels to maximize
investments in transformational projects. As such, the Business Transformation role clearly builds on the
Service Delivery role.
What are transformational projects?
The definition of transformational projects largely depends on your business, and many CIOs and
business leaders define them somewhat differently. In general, transformational projects are those that
improve the long-term competitiveness and growth opportunities of the company. They are game-
changing, so to speak. They often allow the business to employ revolutionary sourcing models, tap into
new markets, dramatically improve efficiency or rapidly launch new and significantly different products
and services.
Apptio Technology Business Management Primer: Eleven Essential Metrics for Optimizing the Business Value of IT
©2011 Apptio, Inc. All Rights Reserved
Page 12
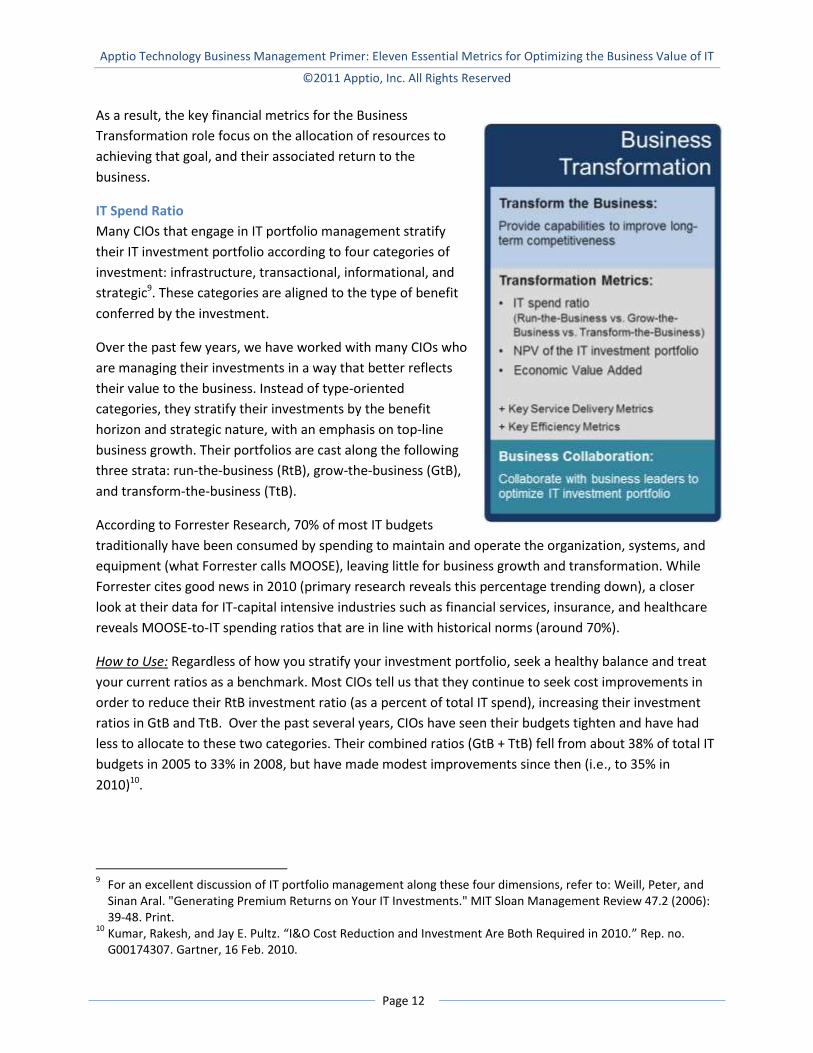
As a result, the key financial metrics for the Business
Transformation role focus on the allocation of resources to
achieving that goal, and their associated return to the
business.
IT Spend Ratio
Many CIOs that engage in IT portfolio management stratify
their IT investment portfolio according to four categories of
investment: infrastructure, transactional, informational, and
strategic9. These categories are aligned to the type of benefit
conferred by the investment.
Over the past few years, we have worked with many CIOs who
are managing their investments in a way that better reflects
their value to the business. Instead of type-oriented
categories, they stratify their investments by the benefit
horizon and strategic nature, with an emphasis on top-line
business growth. Their portfolios are cast along the following
three strata: run-the-business (RtB), grow-the-business (GtB),
and transform-the-business (TtB).
According to Forrester Research, 70% of most IT budgets
traditionally have been consumed by spending to maintain and operate the organization, systems, and
equipment (what Forrester calls MOOSE), leaving little for business growth and transformation. While
Forrester cites good news in 2010 (primary research reveals this percentage trending down), a closer
look at their data for IT-capital intensive industries such as financial services, insurance, and healthcare
reveals MOOSE-to-IT spending ratios that are in line with historical norms (around 70%).
How to Use: Regardless of how you stratify your investment portfolio, seek a healthy balance and treat
your current ratios as a benchmark. Most CIOs tell us that they continue to seek cost improvements in
order to reduce their RtB investment ratio (as a percent of total IT spend), increasing their investment
ratios in GtB and TtB. Over the past several years, CIOs have seen their budgets tighten and have had
less to allocate to these two categories. Their combined ratios (GtB + TtB) fell from about 38% of total IT
budgets in 2005 to 33% in 2008, but have made modest improvements since then (i.e., to 35% in
2010)10.
9 For an excellent discussion of IT portfolio management along these four dimensions, refer to: Weill, Peter, and
Sinan Aral. "Generating Premium Returns on Your IT Investments." MIT Sloan Management Review 47.2 (2006): 39-48. Print.
10 Kumar, Rakesh, and Jay E. Pultz. “I&O Cost Reduction and Investment Are Both Required in 2010.” Rep. no. G00174307. Gartner, 16 Feb. 2010.
Apptio Technology Business Management Primer: Eleven Essential Metrics for Optimizing the Business Value of IT
©2011 Apptio, Inc. All Rights Reserved
Page 13
Case Study
Cisco Optimizes Its IT Investment Portfolio to Maximize Growth11 Apptio customer, partner and investor, Cisco Systems, takes its IT spend very seriously. With over 3,000
Cisco-badged IT employees and a multi-billion dollar budget, Cisco CIO Rebecca Jacoby works hard to
maximize the amount of investment in growth and transformation initiatives.
According to Jacoby, Cisco divides its IT spending into three categories of investment. At the most basic
level is Operational Functionality, which represents IT services to run the business. Most of this
investment goes to the services portfolio that Cisco IT delivers to the business and is aimed at improving
employee productivity and maintaining compliance.
The next category of investment is called Business Capabilities. This represents improvements in business
scale (expanding capabilities within Cisco’s current or adjacent markets) and large optimizations
(significantly improving operational capabilities or delivering innovation).
The third category is Strategic Growth. This includes investments to drive long-term business growth, such
as tapping into new or early stage markets or improving the speed-to-market of new products and
services.
Working with Apptio, Cisco IT has been able to cost their IT services and report on the amounts spent in
each of their categories of IT investment. Furthermore, Cisco has been able to identify cost-optimization
opportunities (e.g., around directory services and storage) that help reduce Operational Functionality
(run-the-business) spending. In doing so, Cisco is rebalancing its IT investment portfolio to provide greater
value back to the business.
NPV of the IT Investment Portfolio
Net present value (NPV) is a method of determining the return on investment from a projected stream
of cash flows. It reflects the value, in today’s dollars, of expected cash receipts less expected cash paid
out for a project or investment. In discounting the cash flow, most organizations use their average cost
of capital or another discount rate that reflects their cost of money. Generally this is set by the finance
department.
Most IT organizations determine NPV of projects when they prepare business cases for them. Some
organizations periodically reevaluate NPV at various intervals or as costs and other assumptions change.
However, the cash receipts for these calculations are generally based on the receipts of the business.
Instead, we recommend you base the inflows on your expected bills of IT (or other service valuation) to
better reflect the value of IT’s contribution.
How to Use: Evaluate the NPV of your projects and portfolio on a very regular basis, just like you should
stay on top of your personal investment portfolio. IT projects are fraught with risk, and rarely do they
come in on time and under budget. Budgets and forecasts are key components of this periodic
evaluation. Moreover, the business value (and therefore service value) often changes over the course of
11
More about Cisco’s IT investment philosophy can be found online: Lawson, Stephen. "CIO Rebecca Jacoby Steers Cisco's IT Ship." CIO.com. CXO Media, Inc., 13 Dec. 2010. Web. 15 Dec. 2010.
Apptio Technology Business Management Primer: Eleven Essential Metrics for Optimizing the Business Value of IT
©2011 Apptio, Inc. All Rights Reserved
Page 14
a project. Frequent reevaluation gives you the opportunity to shift investment from less productive
projects to more productive ones.
There are no simple rules for calculating the NPV of your portfolio. Most importantly, it should grow,
just like any investment portfolio. Growth demonstrates that you are delivering more value to the
business, helping it grow revenues and meet strategic goals.
Economic Value Added (EVA)
Gartner recently predicted12 that many IT organizations will begin using a different measure called
Economic Value Added, or EVA, to determine and communicate the value provided by IT. While not
without its flaws, EVA provides an effective measure of profitability from the operations of a business
unit from the perspective of the shareholder. It does so by essentially reducing the net operating profit
(after taxes) by the average cost of capital for the business unit.
EVA was developed in the 1980s and has since become the dominant corporate measure of value
creation. Many boards of directors incent their top managers according to EVA calculations. According
to Joel Stern, co-author of the EVA model, “EVA makes managers think more like shareholders because
they have a better understanding of what’s been invested to generate earnings. Like entrepreneurs,
they become much more cost conscious, aggressively seeking ways to conserve capital and operate
more efficiently.”13 Hence, it promises to effectively incent IT leaders to make the best decisions in the
interests of the shareholders.
The major difference between EVA and NPV (described above) are the time horizons for each. EVA
considers only the current time period (e.g., current fiscal year) while NPV is based on the expected
long-term cash flows of an investment. Therefore, EVA promises to provide an accurate measure of
profit contribution for a period of activity, while NPV is subject to errors in future cash flow estimations.
This is why it is so important that the NPV of projects or investments be adjusted from time-to-time to
reflect the most current understanding of future cash flows.
How to Use: EVA is not a measure to be undertaken by IT alone, as it relies on assumptions about the
amount of capital invested in IT that is not traditionally available to IT decision makers. Instead, employ
EVA if the rest of your business is also applying EVA valuations. If that is the case, corporate finance
should have a well-defined method of allocating capital and determining average capital costs, both of
which are required for EVA calculations. If EVA is not employed by your business, instead rely on NPV
and your IT spend ratio to determine, manage and communicate the business value of IT.
12
Biswajeet Mahapatra. “EVA Helps Companies Evaluate the Cost of IT Operations.” Rep. no. G00209593. Gartner, 3 Feb. 2011.
13 "The Distinguished Alumnus Awards: Joel Stern." GSB | Chicago. The University of Chicago Booth School of Business, Sept. 1998. Web. 10 Feb. 2011. <http://www.chicagobooth.edu/magazine/summer98/Stern.html>.
Apptio Technology Business Management Primer: Eleven Essential Metrics for Optimizing the Business Value of IT
©2011 Apptio, Inc. All Rights Reserved
Page 15
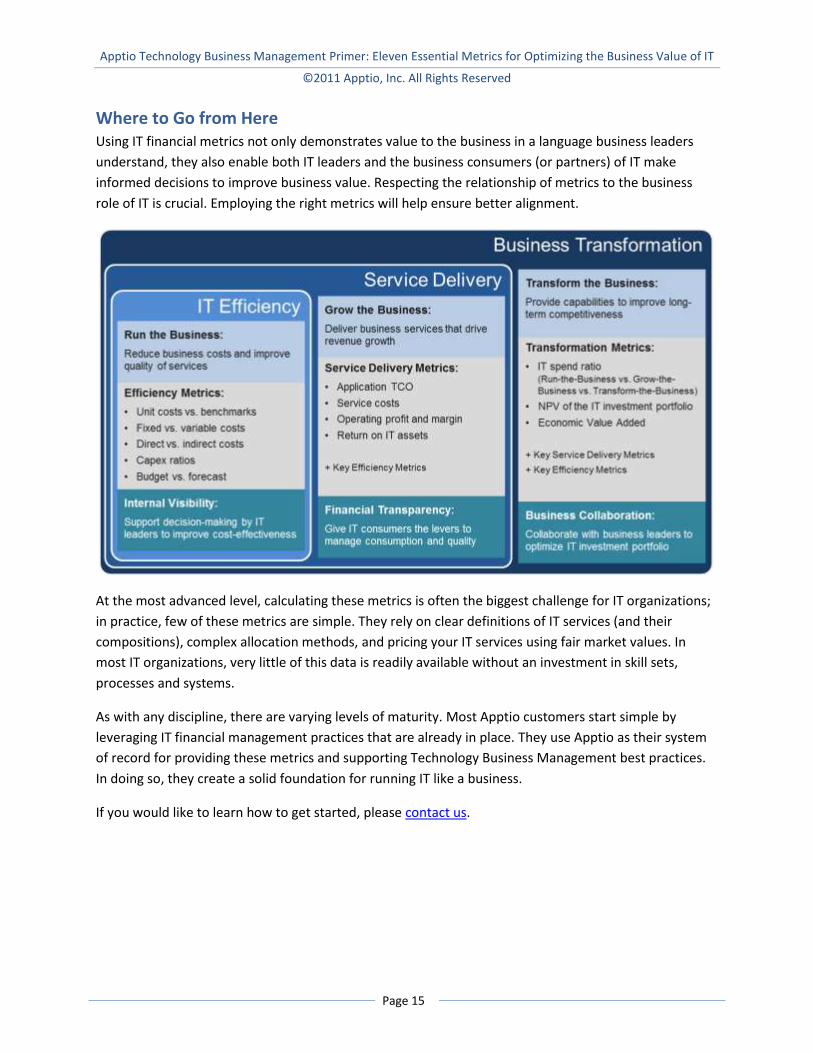
Where to Go from Here Using IT financial metrics not only demonstrates value to the business in a language business leaders
understand, they also enable both IT leaders and the business consumers (or partners) of IT make
informed decisions to improve business value. Respecting the relationship of metrics to the business
role of IT is crucial. Employing the right metrics will help ensure better alignment.
At the most advanced level, calculating these metrics is often the biggest challenge for IT organizations;
in practice, few of these metrics are simple. They rely on clear definitions of IT services (and their
compositions), complex allocation methods, and pricing your IT services using fair market values. In
most IT organizations, very little of this data is readily available without an investment in skill sets,
processes and systems.
As with any discipline, there are varying levels of maturity. Most Apptio customers start simple by
leveraging IT financial management practices that are already in place. They use Apptio as their system
of record for providing these metrics and supporting Technology Business Management best practices.
In doing so, they create a solid foundation for running IT like a business.
If you would like to learn how to get started, please contact us.
Apptio Technology Business Management Primer: Eleven Essential Metrics for Optimizing the Business Value of IT
©2011 Apptio, Inc. All Rights Reserved
Page 16
About Apptio Apptio is the leading, independent provider of SaaS-based Technology Business Management (TBM)
solutions for managing the business of IT. Apptio enables IT leaders to manage the cost, quality and
value of IT Services by providing deep visibility into the total cost of IT services, communicating the value
of IT to the business through an interactive "Bill of IT," and strategically aligning the planning, budgeting
and forecasting processes. Apptio's TBM solutions play a critical role in helping companies understand
and drive chargeback, virtualization, cloud and other key technology initiatives. Organizations such as
Blue Cross Blue Shield of Kansas City, BNP Paribas, Cisco, EMD Chemical and Starbucks use Apptio to
reduce costs and align IT with business priorities. For more information on Apptio, please visit
http://www.apptio.com or the Lean IT blog at http://leanit.apptio.com/.


