GEF-TWAP Methodology Transboundary Aquifers – Revised Version August 2012 2
TABLE OF CONTENTS List of Figures ............................................................................................................................... 4 List of Boxes ................................................................................................................................. 4 General Introduction .................................................................................................................... 5 Part I - CONCEPTUAL FRAMEWORK ............................................................................................... 6
1. Introduction ................................................................................................................................ 6 2. Terminology, concepts, activities and products relevant for TWAP/Groundwater ................... 9
2.1 Some definitions .................................................................................................................... 9 2.2 DPSIR Framework ................................................................................................................. 11 2.3 The GIWA Project ................................................................................................................. 12 2.4 AQUASTAT, GEO and WWAP ............................................................................................... 13 2.5 Global groundwater assessment: ISARM, WHYMAP, IGRAC and other initiatives .............. 14 2.6 GEF-IW RAF Transboundary Aquifers .................................................................................. 16 2.7 The GEF IW: Science project ................................................................................................ 17
3. Conceptual framework for TWAP’s global assessment............................................................ 18 3.1 Overall conceptual framework ............................................................................................ 18 3.2 The conceptual framework in the context of the groundwater component ...................... 19
4. Outline of a methodology for TWAP Groundwater ................................................................. 24 4.1 Defining the core outputs to be produced .......................................................................... 24 4.2 General approach to indicators development ..................................................................... 27 4.3 Identification and selection of transboundary groundwater systems to be considered .... 29 4.4 Defining which data to collect ............................................................................................. 32 4.5 Current conditions versus projections ................................................................................. 42 4.6 Level 2 assessment and causal chain analysis ..................................................................... 42
Part II – IDENTIFICATION AND CHARACTERIZATION OF TBAS ........................................................ 43
Part III - INDICATORS .................................................................................................................. 49
9. Background ............................................................................................................................... 49 10. Objectives............................................................................................................................. 50 11. Some points of departure for defining the set of indicators ............................................... 50
11.1 Key aspects to be incorporated in the set of indicators .................................................. 50 11.2 Data for assessing TWAP groundwater indicators ......................................................... 51 11.3 Indicator categories ......................................................................................................... 51
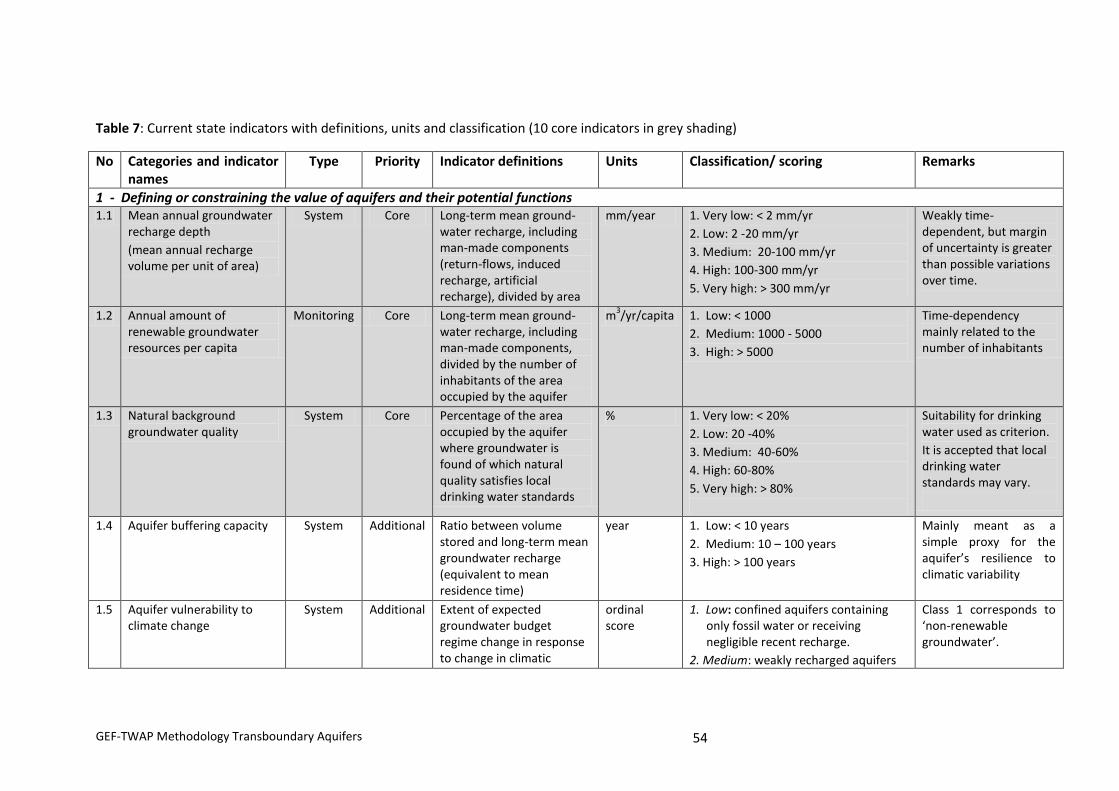
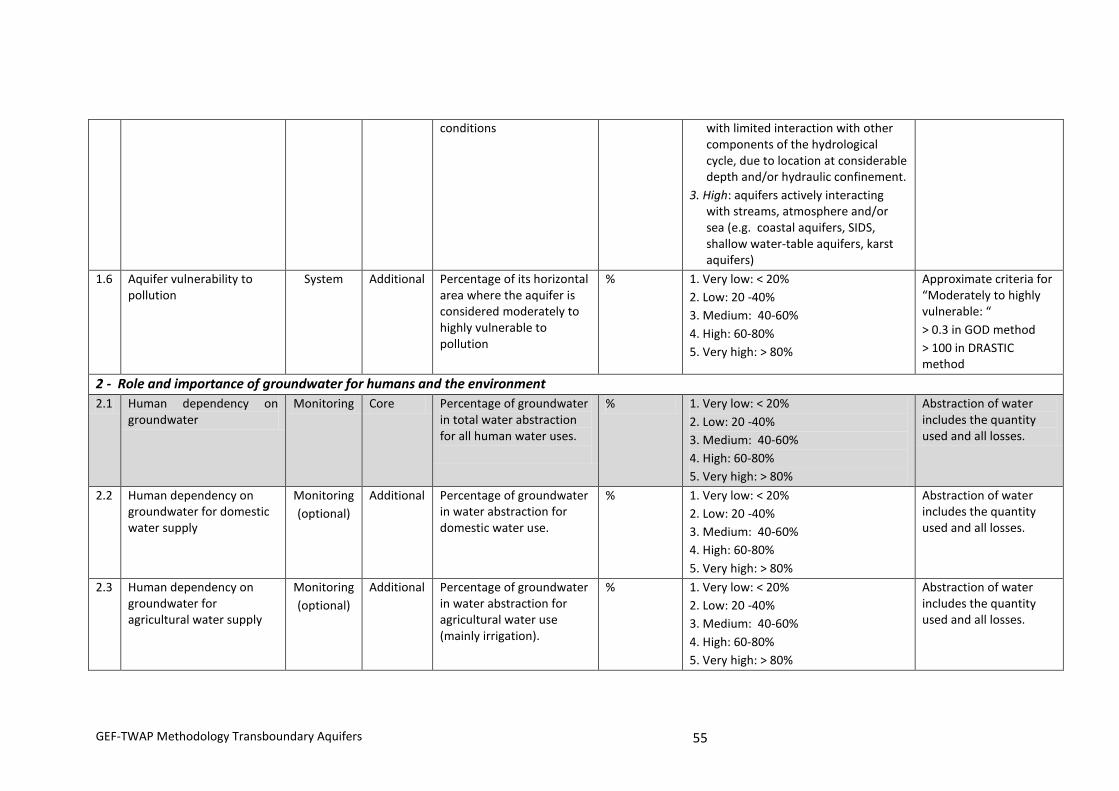
12. Current State Indicators ....................................................................................................... 52 13. Projected groundwater stress indicators ............................................................................. 59
Part IV – INTERLINKAGES WITH OTHER WATER SYSTEMS ............................................................. 61
14. Interlinkages among water systems .................................................................................... 61 14.1 Governance and socio-economic interlinkages ............................................................... 62
15. Input-Output Analysis .......................................................................................................... 63 Part V – DATA AND INFORMATION MANAGEMENT ..................................................................... 64
GEF-TWAP Methodology Transboundary Aquifers – Revised Version August 2012 3
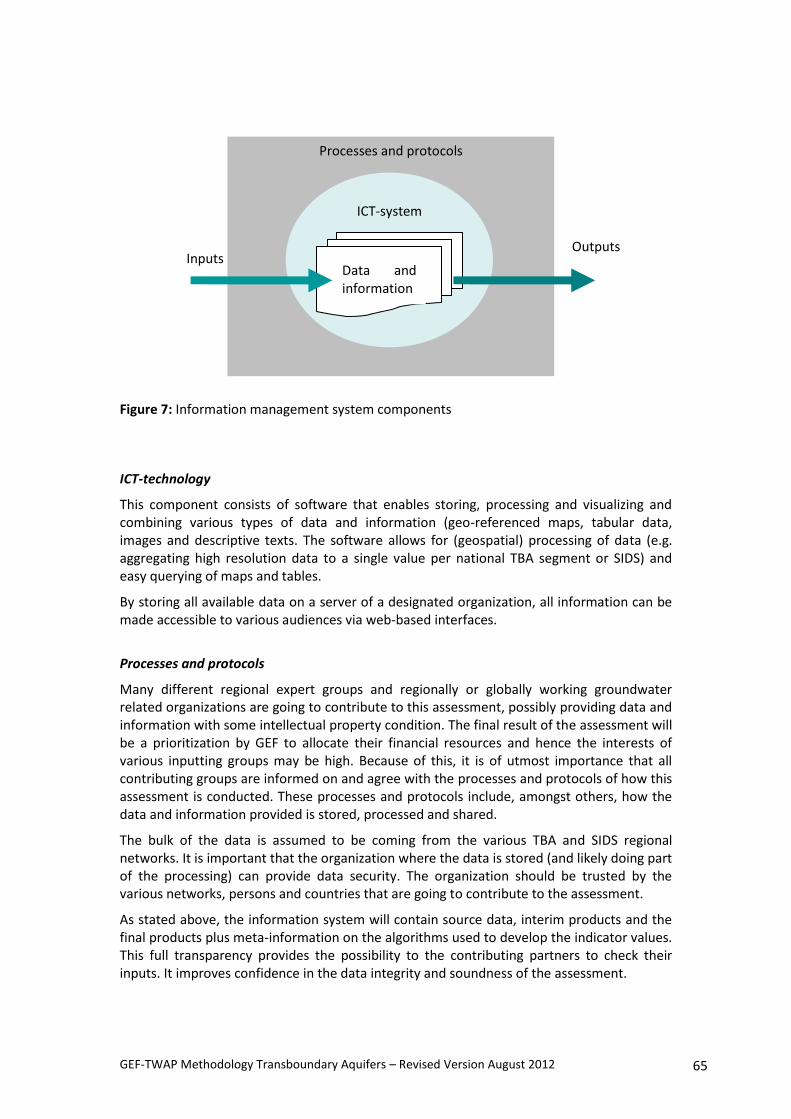
16. Background .......................................................................................................................... 64 17. Information management system components .................................................................. 64 18. Information management system steps .............................................................................. 66 19. The flow of information in the assessment ......................................................................... 67 20. Organisational information management structure............................................................ 71
Part VI – TOWARDS IMPLEMENTATION OF THE ASSESSMENT OF TRANSBOUNDARY AQUIFERS .... 72
Annex 1: Working Group Members ....................................................................................... 77 Annex 2: Data & Information Sources.................................................................................... 78 Annex 3: Glossary of Terms ................................................................................................... 87 Annex 4: GEF-IW RAF Transboundary Aquifers ...................................................................... 88 Annex 5: Minutes of the Utrecht Workshop .......................................................................... 88 Annex 6: Example of ISARM Questionnaire ........................................................................... 88 Annex 7: Cross-cutting and common issues (removed)........................................................... 89
List of Authors Part I: Lead author – Jac van der Gun (UNESCO-IHP), with contributions by Frank van
Weert
Part II: Lead author – Michela Miletto (WWAP), with contributions by Jorge Rucks, Nelson da Franca, Andrea Merla
Part III: Lead author – Jac van der Gun (UNESCO-IHP); with contributions by Jaroslav Vrba, Bo Appelgren, Sharon Megdal, Stefano Burchi and Raya Stephan
Part IV: Lead authors – Frank van Weert and Jac van der Gun
Part V: Lead author – Frank van Weert (IGRAC); with contributions by Cheryl van Kempen (IGRAC)
Part VI: Lead author – Andrea Merla (UNESCO-IHP)
Coordination: Andrea Merla (UNESCO-IHP), Holger Treidel (UNESCO-IHP) and Frank van Weert (IGRAC)
GEF-TWAP Methodology Transboundary Aquifers – Revised Version August 2012 4
List of Tables
Table 1: Diagram showing tentatively the prevailing relations between DPSIR Framework, TWAP indicators in relevant professional fields and GEF’s Status and Process Indicators. In this case, the central system considered is a groundwater system. ........................................................................... 28
Table 2: Number of transboundary aquifers with area above a certain threshold size. ..................... 30
Table 3: Small Island Developing States according to UNDESA ............................................................ 30
Table 4: Number of SIDSs with area above a certain threshold ........................................................... 32
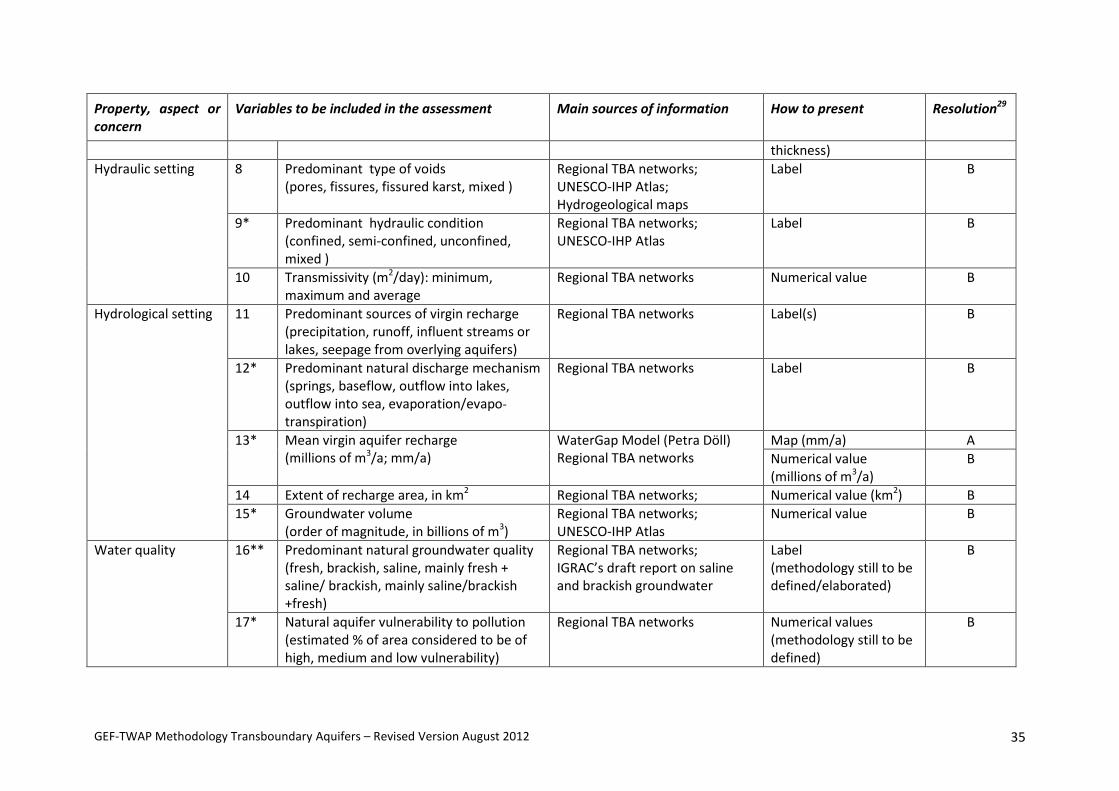
Table 5: Key aquifer properties to be defined as a general reference ................................................. 34
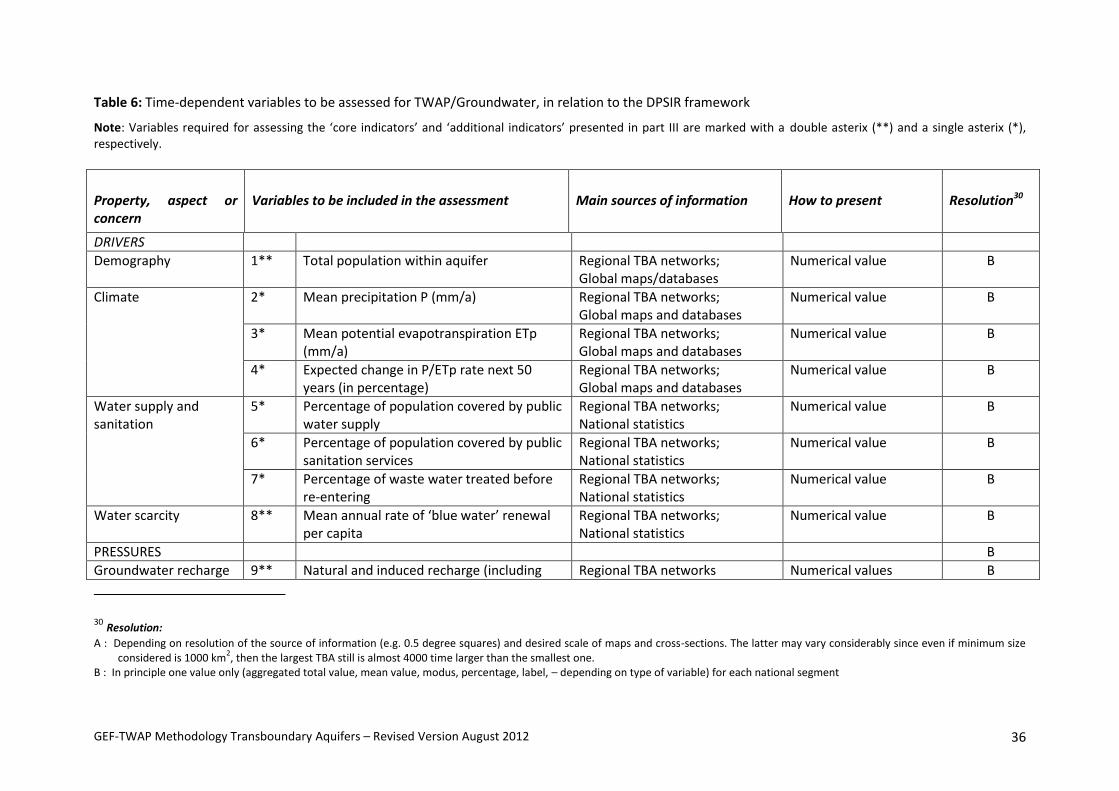
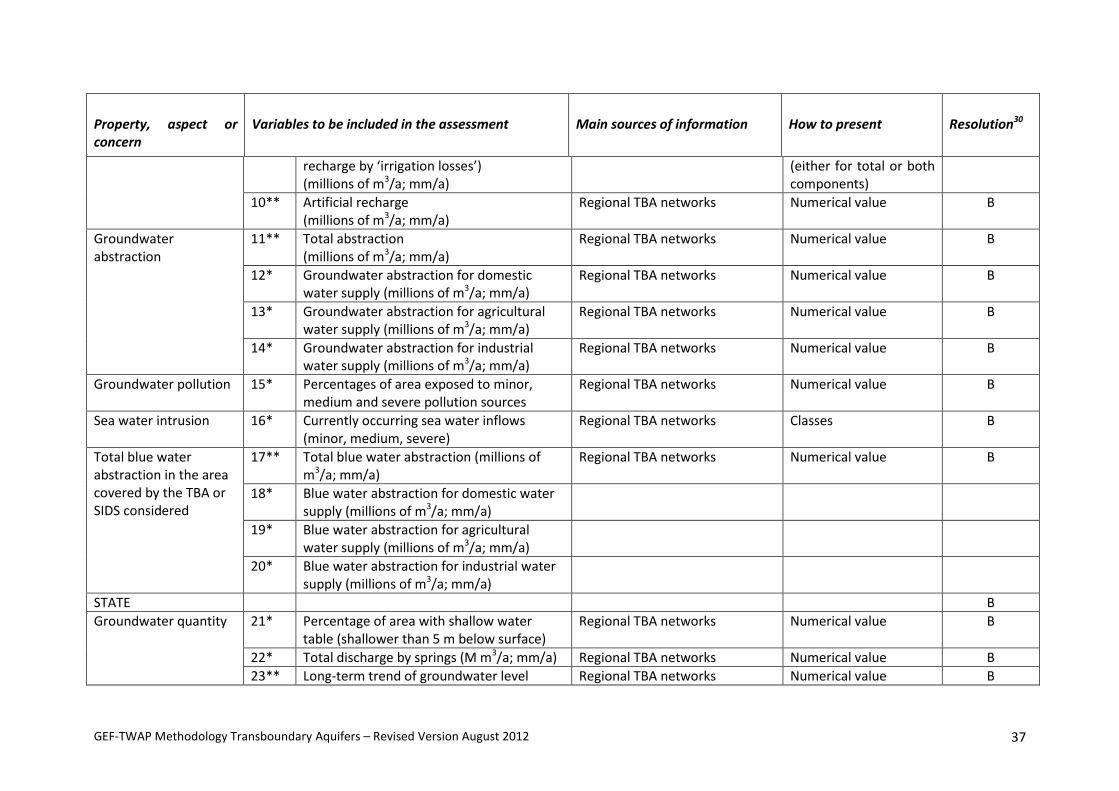
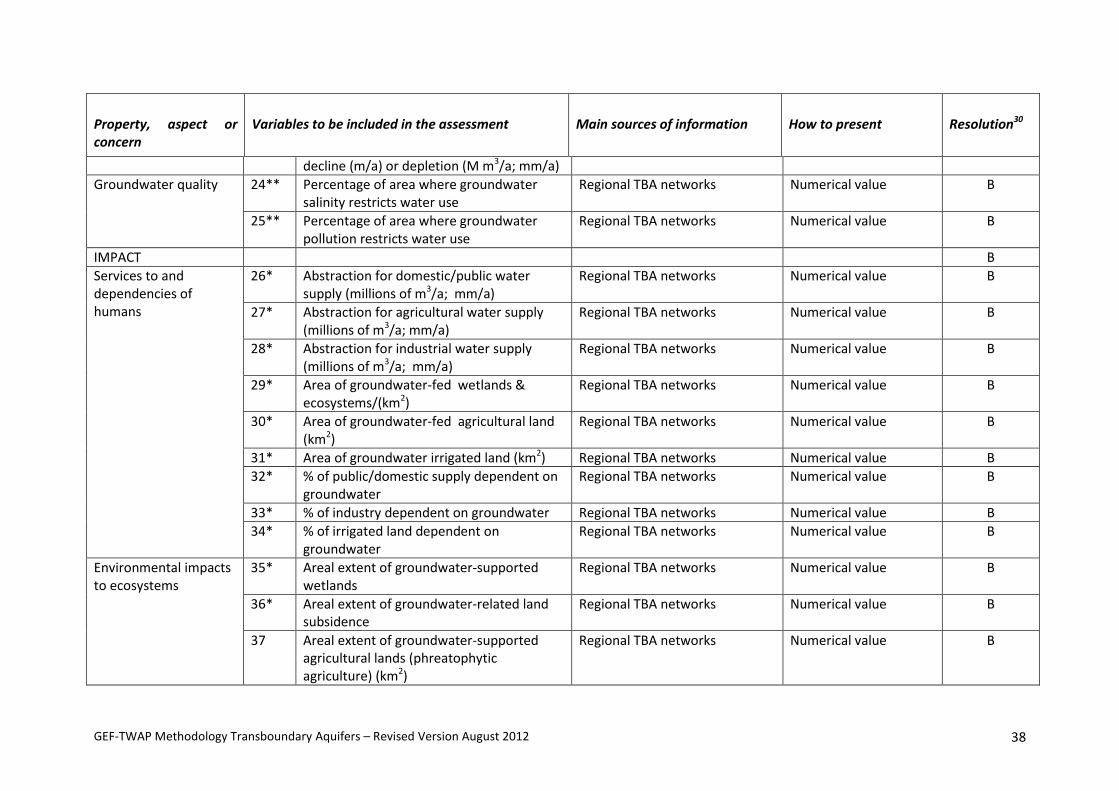
Table 6: Time-dependent variables to be assessed for TWAP/Groundwater, in relation to the DPSIR framework ............................................................................................................................................. 36
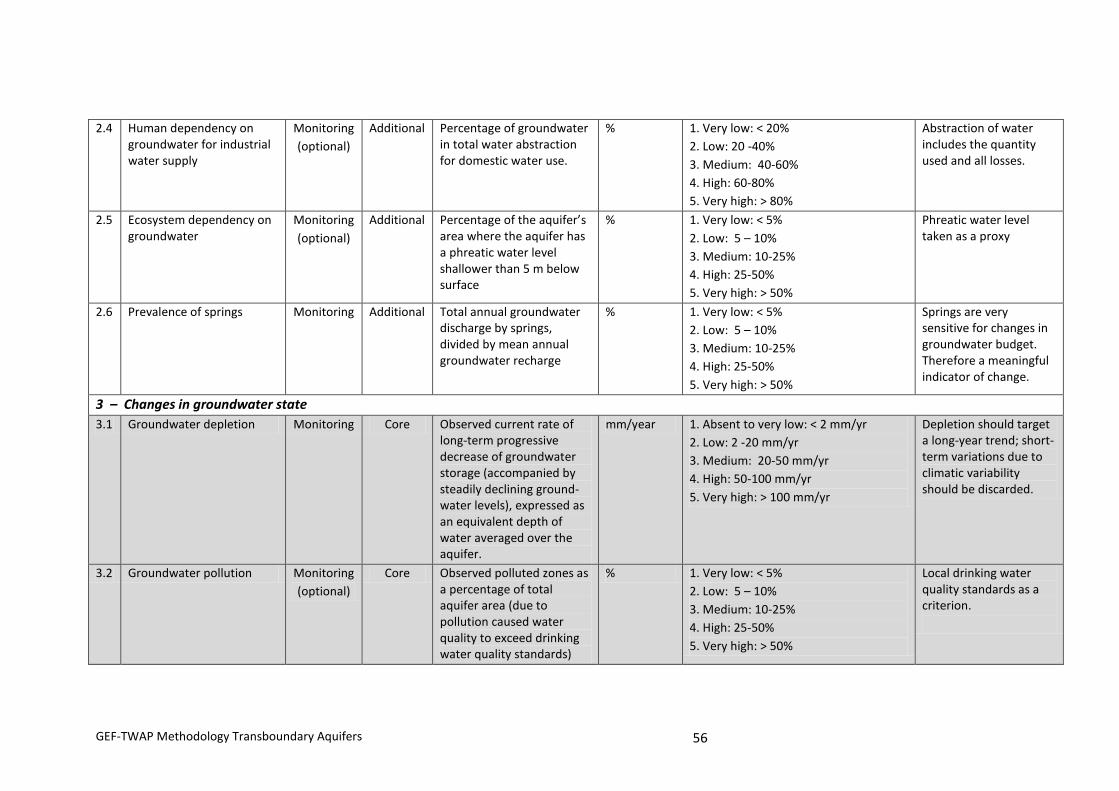
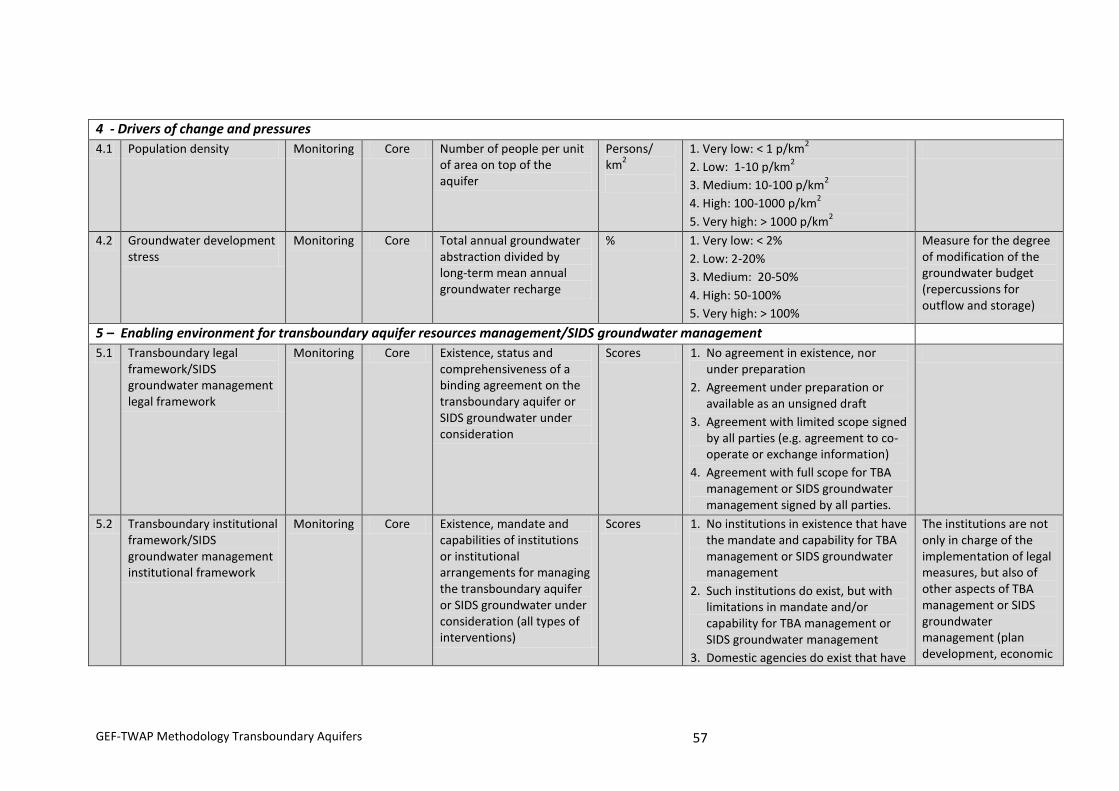
Table 7: Current state indicators with definitions, units and classification (10 core indicators in grey shading) ................................................................................................................................................. 54
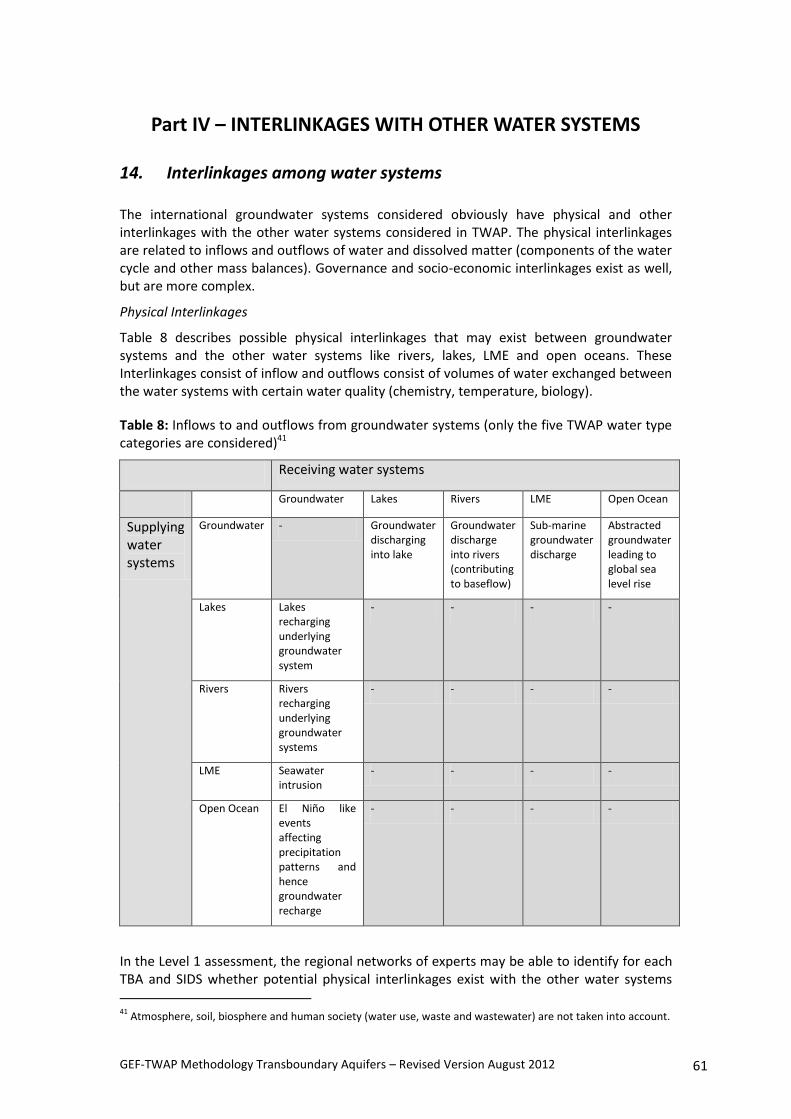
Table 8: Inflows to and outflows from groundwater systems (only the five TWAP water type categories are considered) .................................................................................................................... 61
List of Figures Figure 1: Overall architecture of TWAP phases (groundwater) .............................................................. 1
Figure 2: The DPSIR Framework of analysis (WWAP, 2006) ................................................................. 12
Figure 3: Main conceptual framework of GEF IW:RAF/Groundwater .................................................. 17
Figure 4: Overall conceptual framework for TWAP’s global assessment ............................................. 19
Figure 5: Conceptual framework of TWAP Groundwater component in the context of the overall TWAP project ......................................................................................................................................... 20
Figure 6: Upscaling spatially variable data by averaging over the spatial assessment units ................ 24
Figure 7: Information management system components .................................................................... 65
Figure 8: TWAP Groundwater assessment information flow chart ...................................................... 68
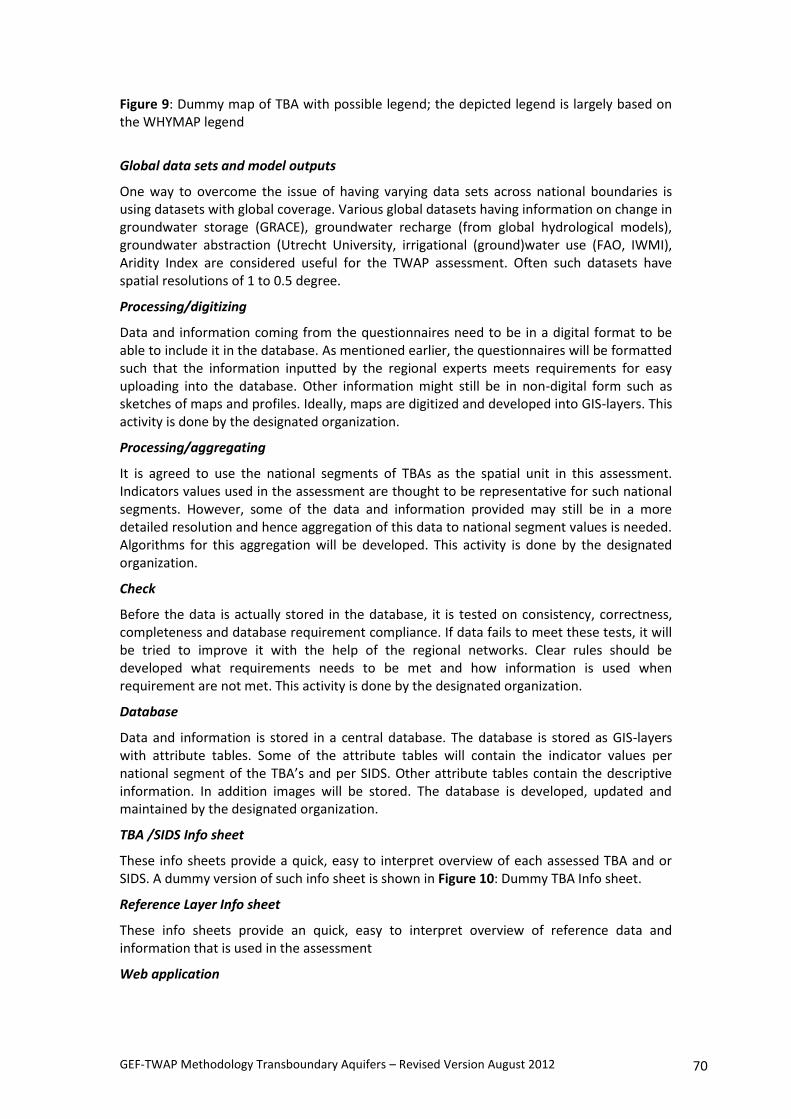
Figure 9: Dummy map of TBA with possible legend; the depicted legend is largely based on the WHYMAP legend ................................................................................................................................... 70
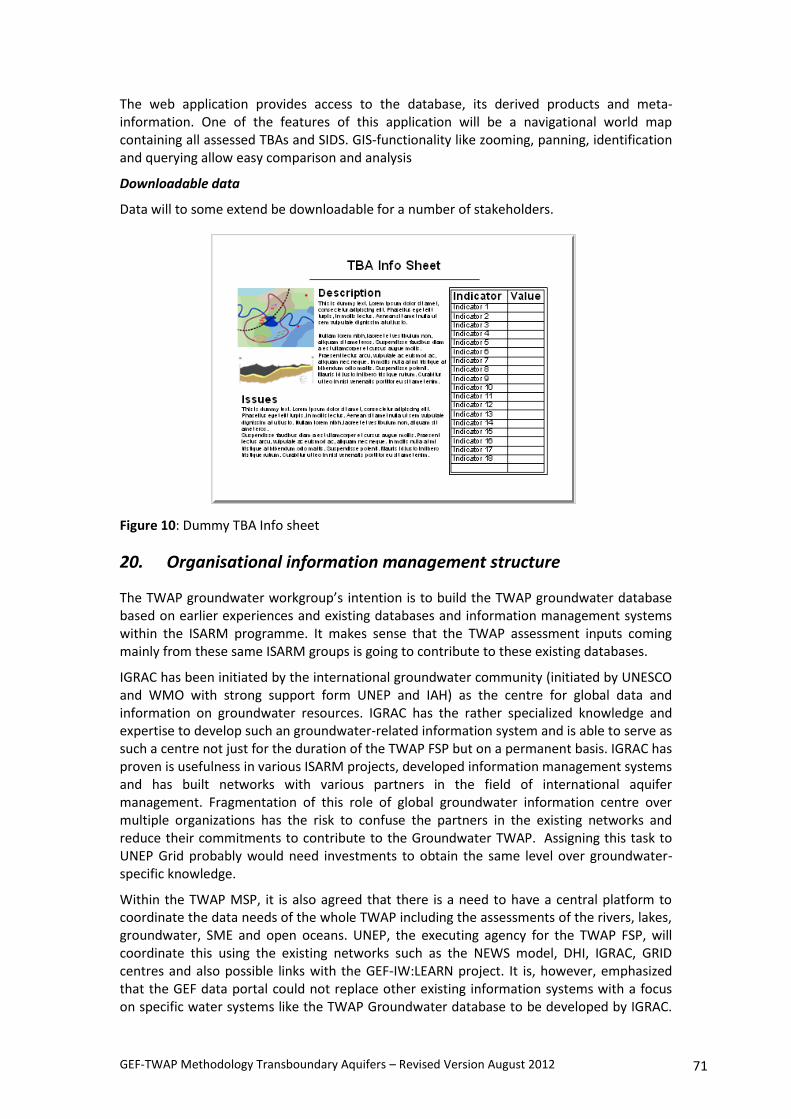
Figure 10: Dummy TBA Info sheet ........................................................................................................ 71
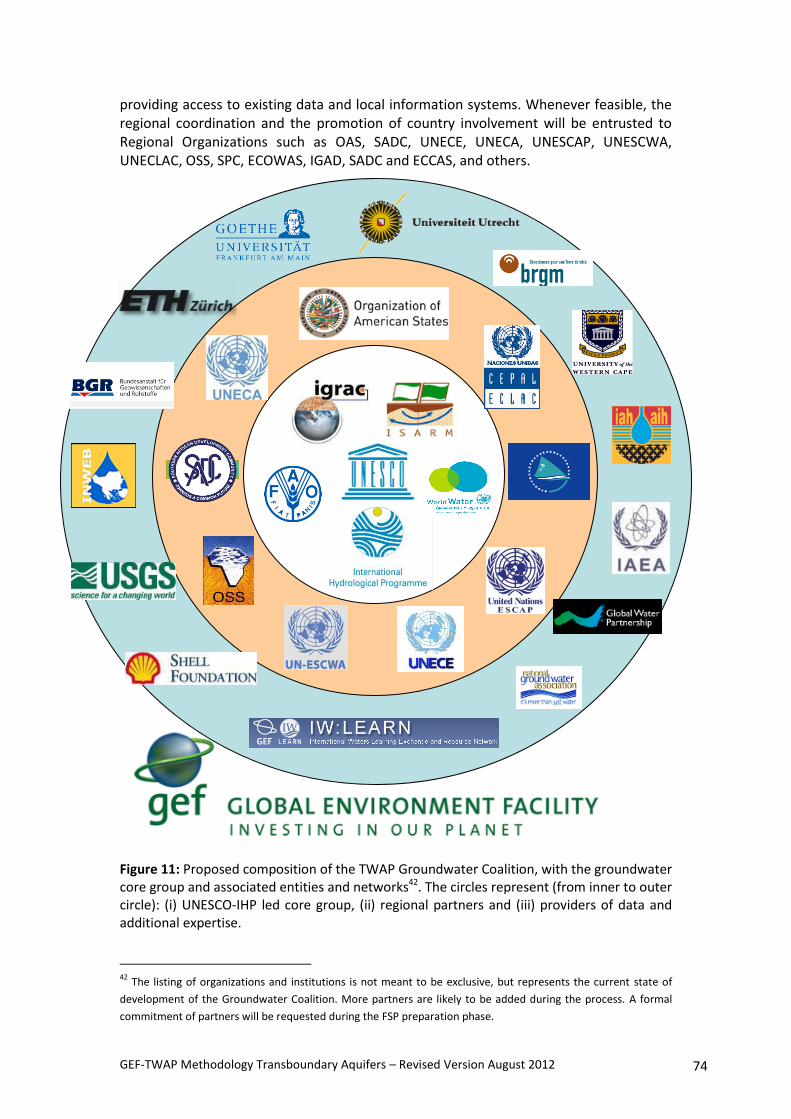
Figure 11: Proposed composition of the TWAP Groundwater Coalition, with the groundwater core group and associated entities and networks. The circles represent (from inner to outer circle): (i) UNESCO-IHP led core group, (ii) regional partners and (iii) providers of data and expertise. .............. 74
Figure 12: Execution structure and arrangements of the TWAP Transboundary Aquifers and Groundwater component...................................................................................................................... 75
List of Boxes Box 1: ‘Static’ key parameters for TBA system characterization. The SIDS aquifer characterisation will use a similar outline but does not need to differentiate between various national segments. ........... 26
GEF-TWAP Methodology Transboundary Aquifers – Revised Version August 2012 5
General Introduction The design of a Transboundary Water Assessment Programme (TWAP) was approved by GEF in January 2009 as a medium sized project (MSP) with a time frame of 18 months (June 2009-November 2010). The objectives of this MSP were to develop an agreed methodology for the assessment to catalyse partnerships and define the execution arrangements for conducting such an assessment1. Based on the corresponding outputs of the MSP, the TWAP Full Size Project A Transboundary Waters Assessment Programme: Aquifers, Lake/Reservoir Basins, River Basins, Large Marine Ecosystems, and Open Ocean to catalyze sound environmental management was approved for funding by the GEF in January 2012. The TWAP Full Size Project is aimed at conducting the first ‘baseline’ assessment and strengthening partnership arrangements for future periodic assessments and monitoring.
The long-term overall goal of the Assessment is “to promote real investment in management and development of transboundary water systems through strong stakeholder engagement”. The assessment is meant to be a tool for the GEF, other international agencies, and policy makers, to set science-based priorities for financial resource allocation to transboundary water systems. The assessment will cover five interconnected water system types: river basins, lake basins, groundwater basins, Large Marine Ecosystems (LME’s) and open oceans.
In this context, UNESCO-IHP has been entrusted with the execution of the groundwater component in the framework of TWAP.
More specifically, the objectives of the Groundwater component of TWAP are to develop
(1) the methodology that will enable the GEF IW Focal Area to determine priority aquifers/regions for resources allocation; this will include the key indicators that will allow the categorization of aquifers and their comparative assessment and, in specific cases, to monitor trends in the evolution of the state of aquifer systems and the impacts of human interventions and of climatic change and variability. Further, the sources of existing data required to calculate the indicators and proposals for cost-effective collection of additional data will be provided by the Groundwater Group’s contribution.
(2) the execution arrangements for the TWAP baseline assessment, as well as for future periodic assessments. This includes setting up a partnership between relevant agencies, organizations and institutions.
This document presents the TWAP methodology for transboundary aquifers and groundwater in SIDSs, which was prepared with the broad involvement of the TWAP groundwater expert group. The TWAP Groundwater Expert Group is compound of senior international experts on transboundary groundwater resources assessment and management, covering the various aspects and disciplines relevant to the subject (please find a list of members of the expert group attached as Annex 1: Working Group Members). The methodology was prepared under the overall supervision of the TWAP groundwater coordinator, supported by the TWAP groundwater task leaders.
Some elements of the methodology as prepared during the MSP project needed to be adjusted in order to reflect changes applied during the design of the Full Size Project. Most notably, the level 2 (in-depth) assessment was excluded from the FSP proposal due a reduction of funding and will not be
1 More in particular, the outputs of the MSP were:
(1) Provide a list of major transboundary aquifers, and a characterization of each (2) Identify key indicators that will allow the categorization of aquifers and their comparative assessment. (3) Propose cost-effective arrangements for the execution of the “TBA Baseline Assessment” and sustainable
mechanisms for long term to monitoring of trends in the evolution of the state of aquifer systems and of the impacts of human interventions and of climatic change and variability.
GEF-TWAP Methodology Transboundary Aquifers – Revised Version August 2012 6
carried out in the framework of the TWAP FSP. It is foreseen, however, that level 2 assessments will be carried out as a contribution to TWAP, with additional sources of funding from partners. For this reason, the respective part of the methodology related to the level 2 assessment has been maintained in this document.
The methodology presented in this document is an revision of the methodology document that has prepared and published in 2011, and is further tailored to the requirements of the TWAP Full Size Project. The methodology has not been tested in practice. Therefore some adjustments may be needed during the course of its application (refer also to Part III).
The document contains six main parts, namely (i) the Conceptual Framework; (ii) Identification and Characterization of Transboundary Aquifers; (iii) Transboundary Aquifers Indicators; (iv) Interlinkages; (v) Data and Information Management; and (vi) Towards Implementation.
Part I - CONCEPTUAL FRAMEWORK
1. Introduction The objectives of the Groundwater component of TWAP are to:
(1) Provide a description of the present conditions of transboundary aquifers (TBA) and aquifers in small island developing states (SIDS) that will enable the GEF IW Focal Area to determine priority aquifers/regions for resources allocation; and
(2) Bring to the global attention the major issues, concerns and hotspots of these transboundary aquifer systems and SIDS aquifers, and catalyze action.
It is expected that the TWAP Groundwater methodology and assessment will help the GEF and other potential clients to find answers to, amongst others, the following questions:
(i) What human and ecosystem uses of the water resources are currently affected or impaired (use conflicts, depletion, and degradation);
(ii) How will water conditions and uses develop during the next decades (15-20 year projection or outlook). Global change is likely to produce increased pressures during the next decades, such as higher water demands for food security/irrigation and domestic use, more intensive use of fertilizers and nitrogen, and increasing seawater intrusion in coastal zones;
(iii) Where will all these problems be occurring? Increasing droughts or floods are observed in some areas and have been projected through modelling - these projections need to be incorporated and summarized in the assessment.
(iv) Which international groundwater systems are likely to prevent, buffer or mitigate water related problems under increasing stresses during the coming decades.
The TWAP Assessment was originally conceived to be carried out at two levels:
Level 1 includes a baseline global assessment and provides for periodic follow up monitoring of trends and impacts achieved from GEF and other interventions, applying simple and feasible2
2 Feasible means that the data required to calculate the indicators are either readily available or can be collected in the
framework of the GEF TWAP Full Size Project.
GEF-TWAP Methodology Transboundary Aquifers – Revised Version August 2012 7
indicators. It includes as well a tentative projection of key conditions and concerns over the next few decades. This part of the assessment will be funded by GEF.
Level 2 activities consist of a more detailed assessment of a few selected pilot systems. This part of the assessment is expected to be carried out with financial resources from other donors (resources yet to be secured).
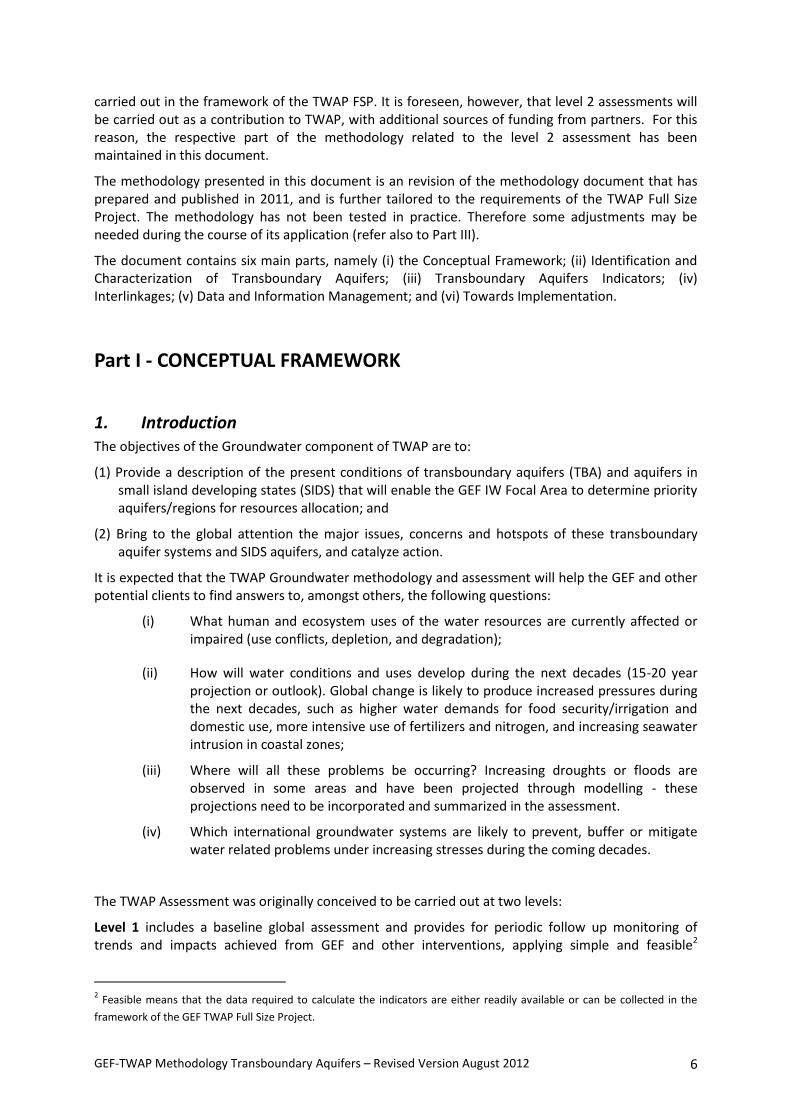
The overall architecture of TWAP and its different phases is depicted in Error! Not a valid bookmark self-reference..
Figure 1: Overall architecture of TWAP phases (groundwater)
Notwithstanding the objectives depicted above, TWAP and its groundwater component can be interpreted and addressed in many different ways. Individuals involved may easily have very different ideas on geographical scope, relevant categories of variables to be assessed, level of detail, time interval between successive assessments, how to collect the data, how to process them, etc.
Medium Size Project (MSP)
Definition of Conceptual Framework
Design of TBA Inventory and Characterization process
Identification of Status Indicators and Projections
Definition of Outputs and Information Management System
Full Size Project (FSP)
Post-FSP
TWAP Design Phase
Baseline Transboundary
Waters Assessment
Long Term Monitoring
Global Inventory and Characterization of TBAs
Data collection for application of Indicators
Implementation of Data Management System
Periodic Update of Inventory and Characterization of TBAs
Monitoring of Trends and Impacts
Level 1: Global baseline assessment applying simple and feasible indicators
Level 2: more detailed assessment of a few selected pilot systems (not included in TWAP FSP anymore)
GEF-TWAP Methodology Transboundary Aquifers – Revised Version August 2012 8
Consequently, the TWAP Groundwater Expert Group has converged to a common understanding of the project and made its contributions in tune with an agreed conceptual framework. The Framework attempts to function as an agreed road map for activities to be undertaken as part of the Groundwater Baseline Assessment in the framework of TWAP.
A chapter on terminology and some relevant information precedes the presentation of the conceptual framework, and is followed by an outline of the methodology proposed for the groundwater component of TWAP.
GEF-TWAP Methodology Transboundary Aquifers – Revised Version August 2012 9
2. Terminology, concepts, activities and products relevant for TWAP/Groundwater
2.1 Some definitions
2.1.1 What is transboundary waters assessment? What is monitoring?
Transboundary waters: In general, water systems (river basins, lakes, aquifers, large marine ecosystems or deep oceans) that are crossed by administrative boundaries. In the context of the mandate of the GEF these administrative boundaries only refer to boundaries between countries.
Assessment: quantitative characterization of a chosen object, usually in order to make a judgement on its value or importance from a certain point of view. In hydrology and hydrogeology it mostly refers to a ‘snapshot’ description or characterization, frozen in time. In that context, it may be distinguished from ‘reconnaissance’ or ‘exploration’ at the one hand, and ‘monitoring’ at the other. It is more advanced and more quantitative than ‘reconnaissance’ or ‘exploration’ and less focusing on change over time than ‘monitoring’.
Monitoring: continuously repeated measurement of a certain variable at the same location, resulting in a time series that gives information on relevant variations and trends over time. The interval between successive measurements is tuned to the time-variability of the chosen variable and to the adopted monitoring objectives.
GWP’s Toolbox defines ‘water resources assessment’ (WRA) as “a tool to evaluate water resources in relation to a reference frame, or evaluate the dynamics of the water resource in relation to human impacts or demand. WRA is applied to a unit such as a catchment, sub-catchment or groundwater reservoir.” GWP observes a trend from traditional water resources assessment aimed to provide a basis for the design of water supply infrastructure to assessments with much wider remit in IWRM perspective3. The World Water Assessment Program (WWAP) associates its global water assessment with the achievement of a better understanding of “the state, use and management of the world’s freshwater resources and the demands on these resources, define critical problems and assess the ability of nations to cope with water-related stress and conflict” 4.
In TWAP the concept ‘assessment’ has to be interpreted in the wider sense adopted by WWAP and suggested by GWP Toolbox, rather than in the narrower sense of traditional hydrological or hydrogeological studies. It is not limited to a single ‘snapshot’ but has the ambition to capture trends in time, and its scope includes physical water systems as well as human-related and environmental aspects, in order to allow for a diagnostic characterisation. ‘Assessment’ as expressed in the name ‘Transboundary Waters Assessment Program (TWAP)” should be seen as an overarching concept, covering all the project’s activities with respect to content.
2.1.2 Some groundwater related and geographic definitions5
(a) “Aquifer” means a permeable water-bearing geological formation underlain by a less permeable layer and the water contained in the saturated zone of the formation;
(b) “Aquifer system” means a series of two or more aquifers that are hydraulically connected6;
GEF-TWAP Methodology Transboundary Aquifers – Revised Version August 2012 10
(c) “Transboundary aquifer” or “transboundary aquifer system” means respectively, an aquifer or aquifer system, parts of which are situated in different States;
(d) “Aquifer State” means a State in whose territory any part of a transboundary aquifer or aquifer system is situated;
(e) “Utilization of transboundary aquifers or aquifer systems” includes extraction of water, heat and minerals, and storage and disposal of any substance;
(f) “Recharging aquifer” means an aquifer that receives a non-negligible amount of contemporary water recharge;
(g) “Recharge zone” means the zone that contributes water to an aquifer, consisting of the catchment area of rainfall water and the area where such water flows to an aquifer by runoff on the ground and infiltration through soil7.
(h) “Discharge zone” means the zone where water originating from an aquifer flows to its outlets, such as a watercourse, a lake, an oasis, a wetland or an ocean.
(i) “Coastal aquifer”: aquifer located at the coast, usually hydraulically connected to the adjoining Large Marine Ecosystem.
(j) “Virgin recharge” or “natural recharge”: recharge or replenishment of ‘natural’ origin (rainfall, runoff, seepage from rivers or lakes, etc.), not significantly affected by human activity (artificial or induced recharge; return flows or other replenishment by used water; surfacing of terrains, etc.).
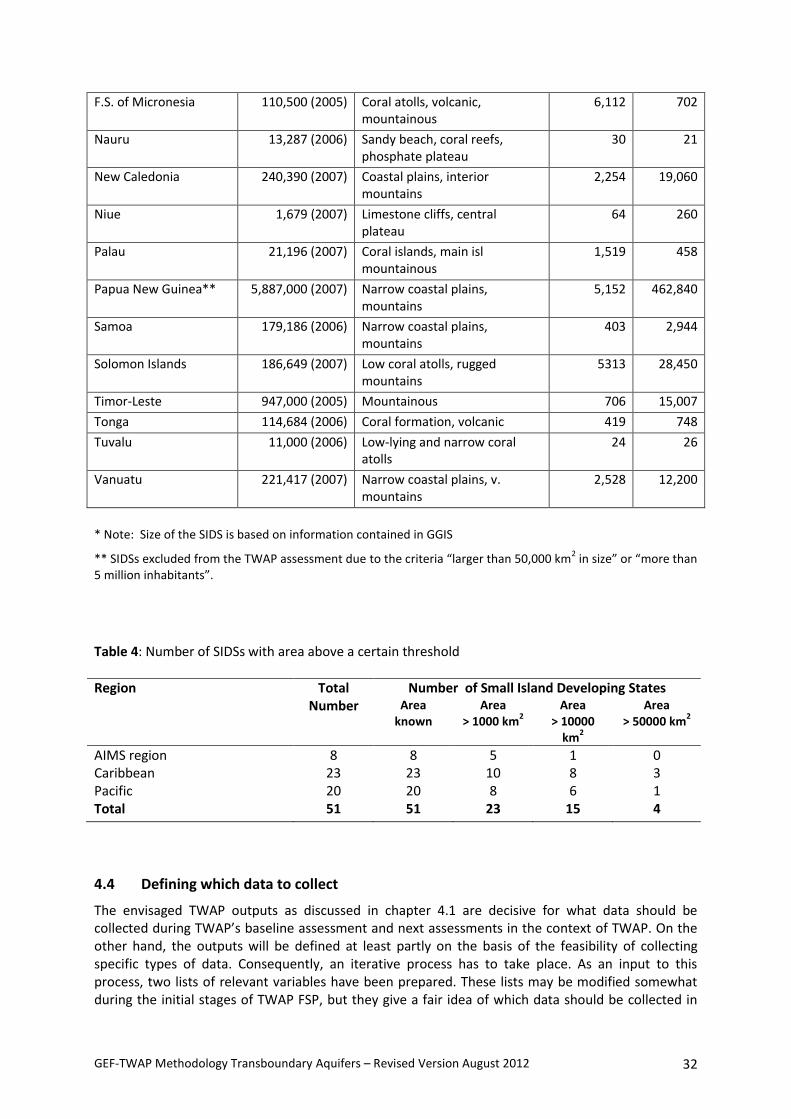
(k) “SIDS” are all island developing countries and territories with a population of less than 5 million people. While both the UN and the Commonwealth Secretariat make use of population as the benchmark for determining smallness, there is no officially agreed international definition of smallness8. Factors such as small size (land and population), insularity and remoteness, limited natural resource base and problems associated with the local environment are all obstacles to achieving efficiency in livelihood development, economic production, environmental sustainability and climate change adaptation.
(l) ”Groundwater governance” is the process by which groundwater resources are managed through the application of responsibility, participation, information availability, transparency, custom, and rule of law. It is the art of coordinating administrative actions and decision making between and among different jurisdictional levels – one of which may be global. (Adapted by Thematic Paper 5 drafting group after Saunier and Meganck, 2007. Dictionary and Introduction to Global Environmental Governance)9
2.1.3 Variable, metric, indicator, index
Variable or measure: Quantity to which a value (or a time series of values) may be assigned on the basis of observation.
6 Another possible definition is: “Aquifer system means an aquifer or a complex of hydraulically interconnected aquifers”.
This definition is consistent with the ubiquitous practice to use ‘aquifer system’ as well for indicating one single aquifer
only. 7 Another possible definition is: “zone where significant recharge (=replenishment) of the aquifer’s groundwater is taking
place, from whatever source of water”. 8 UNCTAD/DITC/TNCD/17, 2002, Sink or Swim? Assessing the impact of agricultural trade liberalization
on small island developing States, http://192.91.247.38/tab/atpsmres/SoS.pdf
9 Taken from Thematic Paper 5: Groundwater Governance and Policy, GEF Groundwater Governance Project
GEF-TWAP Methodology Transboundary Aquifers – Revised Version August 2012 11
Indicator: Usually, a combination of variables, intended to convey a message. The message follows from comparing the values of the variables in a normative framework enabling to assign qualifications to the variable in a transparent way. Examples for indicators are: income per capita, renewable water per capita, groundwater abstraction rate per km2, groundwater abstraction as percentage of total abstraction. Eventually, an indicator may consist as well of a statistic of a variable (e.g. mean, maximum or minimum of observed values, spatial average or aggregated value10).
Index: Combination of indicators calculated according to formal algorithm aimed at determining ranking positions. It is usually dimensionless. The relation to the underlying observed variables is less transparent than in the case of an indicator.
2.2 DPSIR Framework
The DPSIR framework is a generally accepted analytical framework to understand the structure of processes of change. This framework, graphically shown in Figure 2, contributes to understanding the dynamics of changing water resources systems by making a distinction between five interconnected classes of variables:
Driving forces or drivers (D): root-cause of change.
Pressures (P): immediate cause of change inside a water resources system, originating under influence of drivers (D) and/or human responses (R).
State (S): the quantity, quality and other measurable conditions of water inside the water resources systems
Impacts (I): negative or positive effect of changes in state on human society, ecosystems and/or the environment
Responses (R): human action triggered by observed or expected undesired changes in state (S) or impacts (I).
The DPSIR framework can help identifying which variables and categories of variables have to be taken into account.
10
Some people use also the term ‘metric’ for a relatively simple indicator (composed of only few observed
variables), e.g. population density, per capita income In this report there was no need to do so.
GEF-TWAP Methodology Transboundary Aquifers – Revised Version August 2012 12
Figure 2: The DPSIR Framework of analysis (WWAP, 2006)
2.3 The GIWA Project
The Global International Waters Assessment (GIWA) is a project carried out during the period 1999-2006, after GEF’s Scientific and Technical Advisory Panel (STAP) had noted in 1996 that the “lack of an International Waters Assessment comparable with that of IPCC, the Global Biodiversity Assessment and the Stratospheric Ozone Assessment, was a unique and serious impediment to the implementation of the International Waters component of the GEF”.11
Although GIWA’s aim was to produce a holistic, globally comparable assessment of the world’s international waters, it did not cover transboundary groundwater resources.
The methodology includes the following main components:
Scaling: subdivides the world into 66 regions, grouped into nine macro-regions
Scoping: assesses and scores the severity of present and predicted future environmental and socio-economic impacts for each of 22 predefined issues related to five major concerns. These major concerns are: fresh water shortage; pollution; overexploitation of living resources; habitat and community modification; and global change.
Causal chain analysis: traces cause-and-effect paths from impacts back to root causes.
11
Detailed project information and downloadable documents can be found on http://www.unep.org/dewa/giwa/
GEF-TWAP Methodology Transboundary Aquifers – Revised Version August 2012 13
Policy option analysis: outlines potential course of action for mitigating or resolving problems.
GIWA’s methodology deserves appreciation because of a number of strong elements. It has a good balance between physical and human aspects of water systems, it recognizes the links between freshwater and coastal marine environment, and it provides criteria to assign as systematically as possible scores (in four classes) to each issue and aggregate these scores. Nevertheless, the regions distinguished are too large and not adequate to address individual international aquifer systems. Furthermore, it is not transparent how observations in the field on groundwater and surface water are contributing to the scores. Due to the probably strong subjective influence on the scores, the methodology is suitable for producing a global impression rather than for repeated assessments that should reveal changes over time.
2.4 AQUASTAT, GEO and WWAP
FAO’s on-line AQUASTAT12 presents comprehensive data on water resources and water use as reported and validated at both country and sub-national level where available. In addition to the country profiles and regional analyses that include data on water resources and water use, AQUASTAT includes the following:
AQUASTAT main country database (more than 100 variables, searchable by country or by region per 5-year period)
Water resources balance sheets by country, containing information on surface water and groundwater resources by country, taking into consideration agreements between countries sharing the same river basin
Agricultural water use, containing irrigated cropping calendars and crop water requirements by country
Global distribution of irrigation areas at 5 arc minute resolution in GIS format which has produced a Global Map of Irrigation Areas (GMIA)
Geo-referenced database on African dams
Institutions database (searchable by country, type main activity or keyword)
River sediment yields (searchable by river, country or continent)
Investment costs in irrigation
Among these, the AQUASTAT main country database, the GMIA, the water resources balance sheets, and the institutions database have relevance for TWAP. The national water use data in the AQUASTAT database are updated every 5 years on a rolling programme allowing the derivation of some time series for certain countries where data is reliably reported and can be validated. For those countries for which the information is available, groundwater withdrawal in volume is also reported. The GMIA will be updated in 2011 to include the results of a recent global inventory of irrigation dependent upon surface water, groundwater and non-conventional sources of water (Siebert et al. 2010)13. The supplementary country data on groundwater areas and use are available online14. The GIS data for this distribution is available at the open access FAO GeoNetworks portal15.
12
http://www.fao.org/nr/aquastat 13
Siebert S., Burke J., Faurès J. M., Frenken K., Hoogeveen J., Döll P. and Portmann F. T. 2010. Groundwater use for irrigation – a global inventory. Hydrol. Earth Syst. Sci., 14, 1863–1880.
GEF-TWAP Methodology Transboundary Aquifers – Revised Version August 2012 14
UNEP’s Global Environmental Outlook (GEO)16 is a consultative, participatory process emerging out of the fundamental mandate of UNEP for assessing and reporting on the state of the world’s environment. Main product of GEO is the periodical GEO-report, of which the first one (GEO-1) was published in 1997 and the fourth one (GEO-4) in 2007. GEO-4 follows a DPSIR based conceptual framework and describes the environment on the basis of 22 regions. The report distinguishes four environmental systems: atmosphere, land, water and biodiversity. State and trends in all four systems are depicted for the period 1987-2007, followed by regional descriptions, a review of human dimensions of environmental change, an outlook towards 2015 and beyond, and – finally – a section on options for action. Given the broad scope of GEO, information on water is concise and descriptive rather than accompanied by globally covering data.
The United Nations World Water Assessment Programme (WWAP)17 has a high degree of similarity to GEO. Its main product is the World Water Development Report (WWDR), which is presented on a regular basis in three-year intervals. The first one (WWDR-1) appeared in 2003 and the fourth one (WWDR-4, Managing Water under Uncertainty and Risk) in 2012. As its subject is limited to freshwater, it brings much more detail on water than GEO. However, it is equally descriptive in nature, with only a limited number of worldwide data sets (e.g. those on water resources indicators). WWAP brings existing information together rather than producing new information. Water related indicators are presented in many parts of WWDR-3, although not yet in a rigorously consistent way and usually referring to much larger spatial units than aquifers. In the WWDR 4 indicators on groundwater quality and quantity have been further developed.
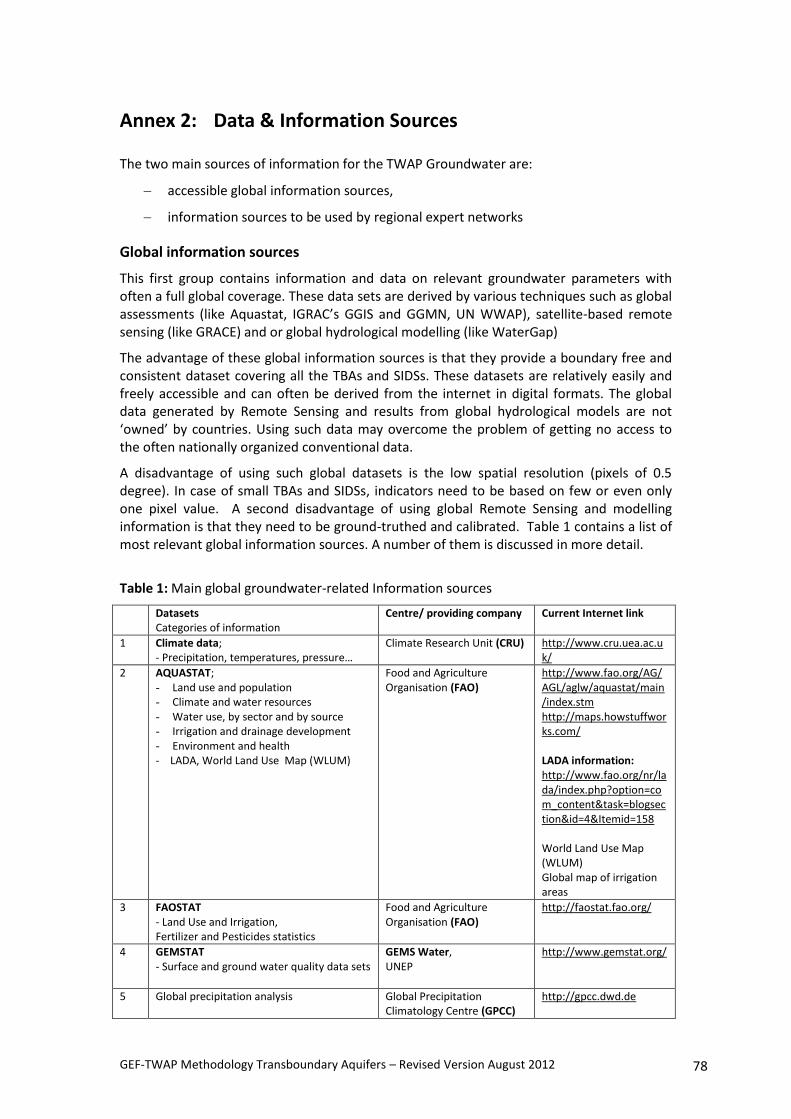
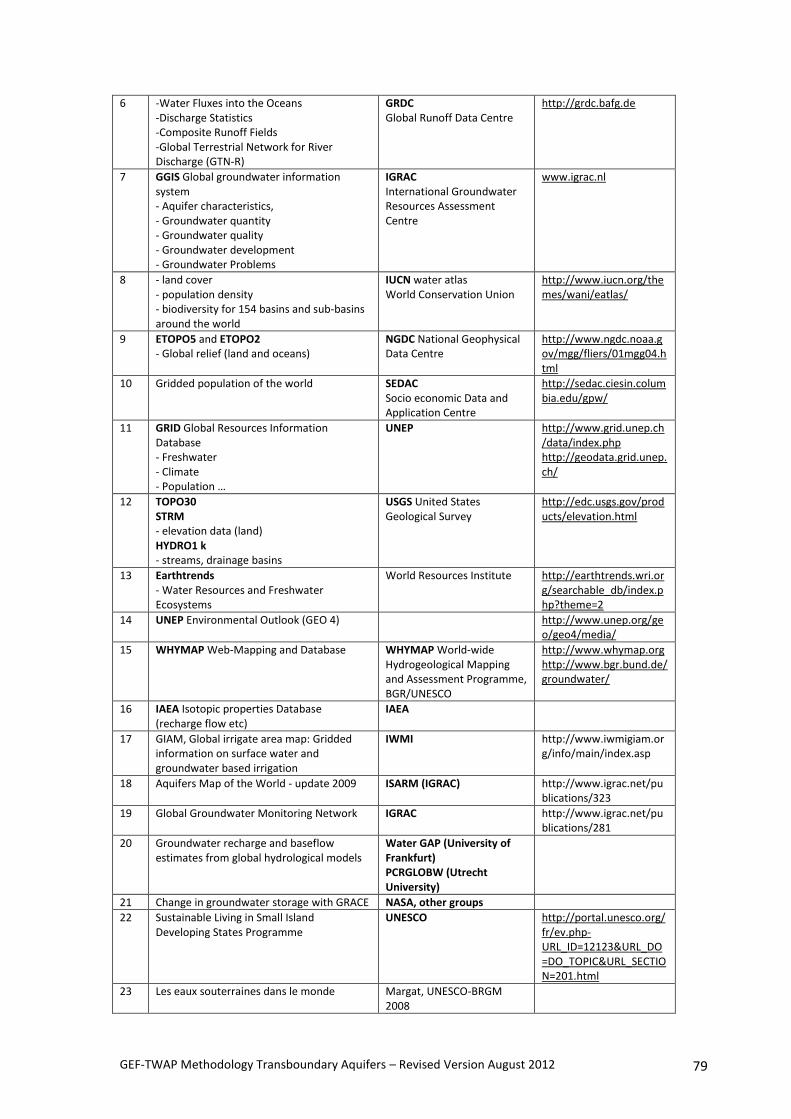
2.5 Global groundwater assessment: ISARM, WHYMAP, IGRAC and other initiatives
UNESCO launched in 2002 its programme dedicated to International Shared Aquifer Resources Management (ISARM). Its objectives are to identify transboundary aquifers on each continent, support countries in the assessment of these aquifers and formulate recommendations on their management. ISARM is a multidisciplinary programme addressing hydrogeological, socio-economic, environmental, legal and institutional aspects of transboundary aquifers. Regional ISARM groups scattered over the globe systematically collect information on these aspects. Most of regional groups have produced a series of reports on their inventory and additional work (thematic characterization of the aquifers and case studies). This information forms the point of departure for virtually all global transboundary aquifer products. At the same time, the process of co-operation initiated within the regional ISARM groups is contributing to the development of a mind-set required for coordinated or joint management of the transboundary aquifer resources. More information can be found on www.isarm.net.
In the framework of ISARM the Atlas of Transboundary Aquifers was produced in 2009, as a comprehensive compilation of all relevant information collected by ISARM since its beginnings. The publication starts with a section on groundwater resources and global maps, followed by a description of the ISARM programme’s activities and a section on legal issues. The core of the Atlas, however, is found in the third section, in the form of a systematic description of almost 200 transboundary aquifers in different regions of the world. Each aquifer is presented on a separate page: the name of the aquifer and the sharing countries are mentioned, accompanied by a location map and an aquifer map, and with a brief groundwater system characterization in key words (such as size, lithology, hydraulic condition, volume, water use, management concerns, etc.) as well as some remarks on interstate instruments and agreements. In addition transboundary aquifer case studies in each of the regions are mentioned and described.
GEF-TWAP Methodology Transboundary Aquifers – Revised Version August 2012 15
The World-wide Hydrogeological Mapping and Assessment Programme (WHYMAP) – carried out under leadership of BGR (Germany) and with special support of UNESCO - was launched in 2002. The programme compiles data on groundwater from national, regional and global sources, and visualizes them in maps, web map applications and services. The generated products provide information on quantity, quality and vulnerability of the planet’s groundwater resources and help communicating groundwater related issues to water experts as well as decision makers and the general public18. Most prominent among WHYMAP’s products are the Groundwater Resources Map of the World, scale 1: 25,000,000 (2008) and the map Groundwater Resources of the World – Transboundary Aquifer Systems, scale 1: 50,000,000 (2006). The latter shows not only the approximate locations of 98 transboundary aquifers around the world, it mentions as well the name of each of these aquifers and the countries sharing it. In addition, it specifies for part of the aquifers the horizontal extension and the type of aquifer system.
The International Groundwater Resources Assessment Centre (IGRAC) under the auspices of UNESCO and WMO is operational since the beginning of 2003 (www.igrac.net). Its mission is to make a significant contribution to the worldwide availability of relevant groundwater related information. It intends to do so by developing a Global Groundwater Information System (GGIS), and Guidelines and Protocols for data collection (G&P), and by carrying out special thematic projects and by participating in global or regional projects with a groundwater component. Among the modules of GGIS, the Global Overview (GO) and the Global Groundwater Monitoring Network (GGMN) are particularly relevant for TWAP/Groundwater. The Global Overview (GO) contains variables and indicators aggregated or averaged by country or by so-called Global Groundwater Region19. Although many of these variables and indicators are in principle time-dependent, GO is not designed to contain time series, but rather intends to present the latest available data. For presentation of times series of aggregated variables and indicators the Global Groundwater Monitoring Network has been designed, but it is still in a stage of initial development.
Regarding transboundary aquifers, IGRAC is responsible for ISARM’s website, it participates in several global or regional transboundary aquifer projects and it has developed a dedicated submodule in GO with special features for transboundary aquifers. In addition, IGRAC produced in 2012 the 1: 50M scale map “Transboundary Aquifers of the World20”, as an update of WHYMAP’s Transboundary Aquifer Systems map of 2006 and IGRAC’s transboundary aquifer map op 2009. It encompasses 448 transboundary aquifers and transboundary groundwater bodies across the globe, shows names and sharing countries for each of these, and specifies lateral boundaries, extension and aquifer type for a considerable number of aquifers.
UNESCO, IAEA and IAH have jointly carried out a project on Groundwater Resources Sustainability Indicators, which has resulted in a report published by UNESCO in 2007, report no 14 in the IHP-VI Series on Groundwater21.Ten groundwater indicators were developed and tested, as a potential
18
www.whymap.org 19
IGRAC has developed a telescopic system for scale-dependent subdivision of the World in hydrogeologically relevant
zones: it distinguishes 36 Global Groundwater Regions, each of which subdivided in a number of Groundwater Provinces
(217 on the entire globe), each of which contains a number of aquifers. Reference: Van der Gun, Vasak and Reckman:
Geography of the World’s groundwater: a hierarchical approach to scale-dependent zoning, Chapter in the book Sustaining
Groundwater Resources (2011), edited by J.A.J. Jones, initiative of the International Year of Planet Earth, Springer, Books on
Environmental Sciences. 20 For EU countries (plus Switzerland and Norway) this global map now displays transboundary Groundwater Bodies (GWB),
rather than transboundary aquifers, as adopted by the Water Framework Directive (WFD). Within this framework, EU
Member States are obliged to delineate groundwater bodies (managerial units) to identify the risk of failing to achieve
‘good status' by 2015. In many cases, aquifers are subdivided into groundwater bodies while occasionally groundwater
bodies may contain multiple aquifers. 21
For download in UNESCO’s online database: http://webworld.unesco.org/ihp_db/publications/GenericView.asp?KEY=524
GEF-TWAP Methodology Transboundary Aquifers – Revised Version August 2012 16
contribution to WWAP. Lessons learned included – inter alia – that it is not easy to design ‘good’ indicators and that availability of good and consistent data is crucial.
Worth mentioning as well is Jean Margat’s “Les Eaux Souterraines dans le Monde”, published in 2008 jointly by UNESCO and BRGM. This publication presents an excellent overview of the World’s groundwater resources in their geographic setting, paying attention to the different categories of aquifers, their dynamics, exploitation, use and management. Many small-sized maps are included, as well as tables. Special attention is paid to the World’s largest aquifers, most of which are transboundary.
Another valuable source of information on a number of large aquifers across the world and their management is the UNESCO publication “Non-Renewable Groundwater Resources – a guidebook on socially sustainable management for policy makers”. It was published in 2006, IHP-VI, Series on Groundwater No. 1022. This publication explores in particular how to manage groundwater resources that are not or not significantly replenished.
2.6 GEF-IW RAF Transboundary Aquifers
Indicators Approach Paper for Possible Application of the Resource Allocation Framework to the GEF International Waters Focal Area – Transboundary Aquifers
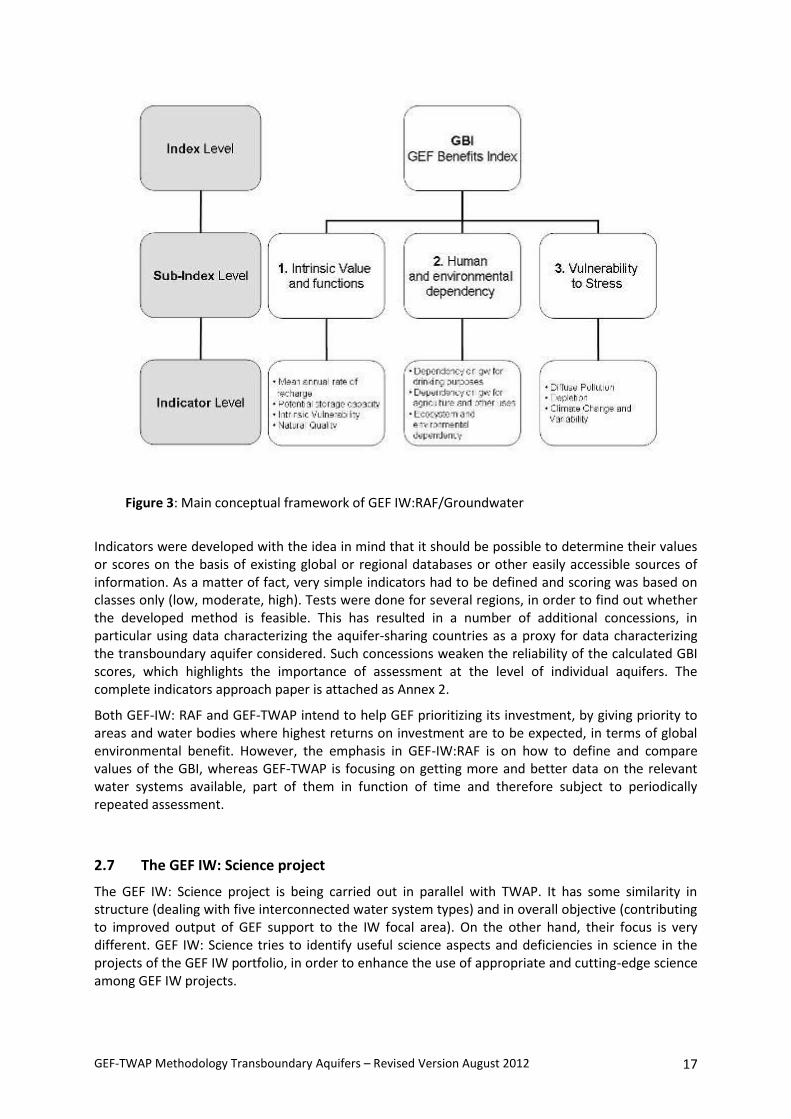
UNESCO-IHP was entrusted in 2009 by the Global Environmental Facility (GEF) with the development of an indicators approach paper for possible application of the Resources Allocation Framework (RAF) to Transboundary Aquifers (TBAs) in the GEF International Waters focal area. This activity is referred to as “GEF IW:RAF” in the following. The project’s main objective was developing for GEF a simple but effective methodology for priority ranking among transboundary aquifers suggested as candidates for GEF funding of interventions. A key role in this methodology is played by the so-called GEF Benefits Index (GBI), a measure of the potential to generate global environmental benefits that can be accrued through the International Waters focal area action on the groundwater resources contained in transboundary aquifers. A higher score on the GIB should correspond with higher priority for GEF support to interventions among the many transboundary aquifers in the world, and among the different types of transboundary aquifers with renewable or non-renewable groundwater resources.
The indicators approach developed by the UNESCO-IHP led expert group is based on decomposition of the GBI index into three sub-indices, each of which – in turn – is defined on the basis of a number of indicators. Figure 3 shows the corresponding conceptual framework. In addition to this main conceptual framework, two additional discipline-oriented frameworks were developed, but not integrated: one on socio-economic aspects, the other one on law and institutions.
GEF-TWAP Methodology Transboundary Aquifers – Revised Version August 2012 17
Figure 3: Main conceptual framework of GEF IW:RAF/Groundwater
Indicators were developed with the idea in mind that it should be possible to determine their values or scores on the basis of existing global or regional databases or other easily accessible sources of information. As a matter of fact, very simple indicators had to be defined and scoring was based on classes only (low, moderate, high). Tests were done for several regions, in order to find out whether the developed method is feasible. This has resulted in a number of additional concessions, in particular using data characterizing the aquifer-sharing countries as a proxy for data characterizing the transboundary aquifer considered. Such concessions weaken the reliability of the calculated GBI scores, which highlights the importance of assessment at the level of individual aquifers. The complete indicators approach paper is attached as Annex 2.
Both GEF-IW: RAF and GEF-TWAP intend to help GEF prioritizing its investment, by giving priority to areas and water bodies where highest returns on investment are to be expected, in terms of global environmental benefit. However, the emphasis in GEF-IW:RAF is on how to define and compare values of the GBI, whereas GEF-TWAP is focusing on getting more and better data on the relevant water systems available, part of them in function of time and therefore subject to periodically repeated assessment.
2.7 The GEF IW: Science project
The GEF IW: Science project is being carried out in parallel with TWAP. It has some similarity in structure (dealing with five interconnected water system types) and in overall objective (contributing to improved output of GEF support to the IW focal area). On the other hand, their focus is very different. GEF IW: Science tries to identify useful science aspects and deficiencies in science in the projects of the GEF IW portfolio, in order to enhance the use of appropriate and cutting-edge science among GEF IW projects.
GEF-TWAP Methodology Transboundary Aquifers – Revised Version August 2012 18
There is potential synergy between the two projects, not only because they are complementary, but also because they may use each other’s outputs. GEF IW: Science outputs that may be highly relevant for TWAP include the IW: Science on-line document database and relevant science components and approaches identified, that may give inspiration for the TWAP indicators to be developed.
3. Conceptual framework for TWAP’s global assessment
3.1 Overall conceptual framework
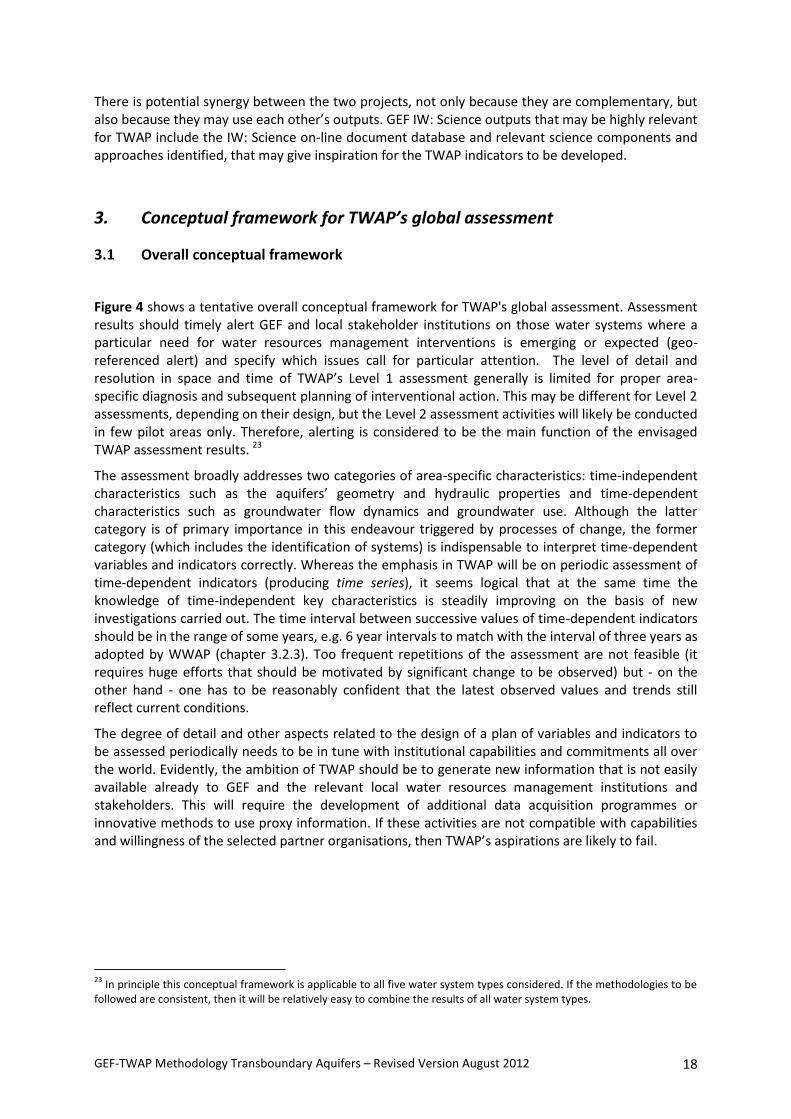
Figure 4 shows a tentative overall conceptual framework for TWAP's global assessment. Assessment results should timely alert GEF and local stakeholder institutions on those water systems where a particular need for water resources management interventions is emerging or expected (geo-referenced alert) and specify which issues call for particular attention. The level of detail and resolution in space and time of TWAP’s Level 1 assessment generally is limited for proper area-specific diagnosis and subsequent planning of interventional action. This may be different for Level 2 assessments, depending on their design, but the Level 2 assessment activities will likely be conducted in few pilot areas only. Therefore, alerting is considered to be the main function of the envisaged TWAP assessment results. 23
The assessment broadly addresses two categories of area-specific characteristics: time-independent characteristics such as the aquifers’ geometry and hydraulic properties and time-dependent characteristics such as groundwater flow dynamics and groundwater use. Although the latter category is of primary importance in this endeavour triggered by processes of change, the former category (which includes the identification of systems) is indispensable to interpret time-dependent variables and indicators correctly. Whereas the emphasis in TWAP will be on periodic assessment of time-dependent indicators (producing time series), it seems logical that at the same time the knowledge of time-independent key characteristics is steadily improving on the basis of new investigations carried out. The time interval between successive values of time-dependent indicators should be in the range of some years, e.g. 6 year intervals to match with the interval of three years as adopted by WWAP (chapter 3.2.3). Too frequent repetitions of the assessment are not feasible (it requires huge efforts that should be motivated by significant change to be observed) but - on the other hand - one has to be reasonably confident that the latest observed values and trends still reflect current conditions.
The degree of detail and other aspects related to the design of a plan of variables and indicators to be assessed periodically needs to be in tune with institutional capabilities and commitments all over the world. Evidently, the ambition of TWAP should be to generate new information that is not easily available already to GEF and the relevant local water resources management institutions and stakeholders. This will require the development of additional data acquisition programmes or innovative methods to use proxy information. If these activities are not compatible with capabilities and willingness of the selected partner organisations, then TWAP’s aspirations are likely to fail.
23
In principle this conceptual framework is applicable to all five water system types considered. If the methodologies to be followed are consistent, then it will be relatively easy to combine the results of all water system types.
GEF-TWAP Methodology Transboundary Aquifers – Revised Version August 2012 19
Figure 4: Overall conceptual framework for TWAP’s global assessment
3.2 The conceptual framework in the context of the groundwater component
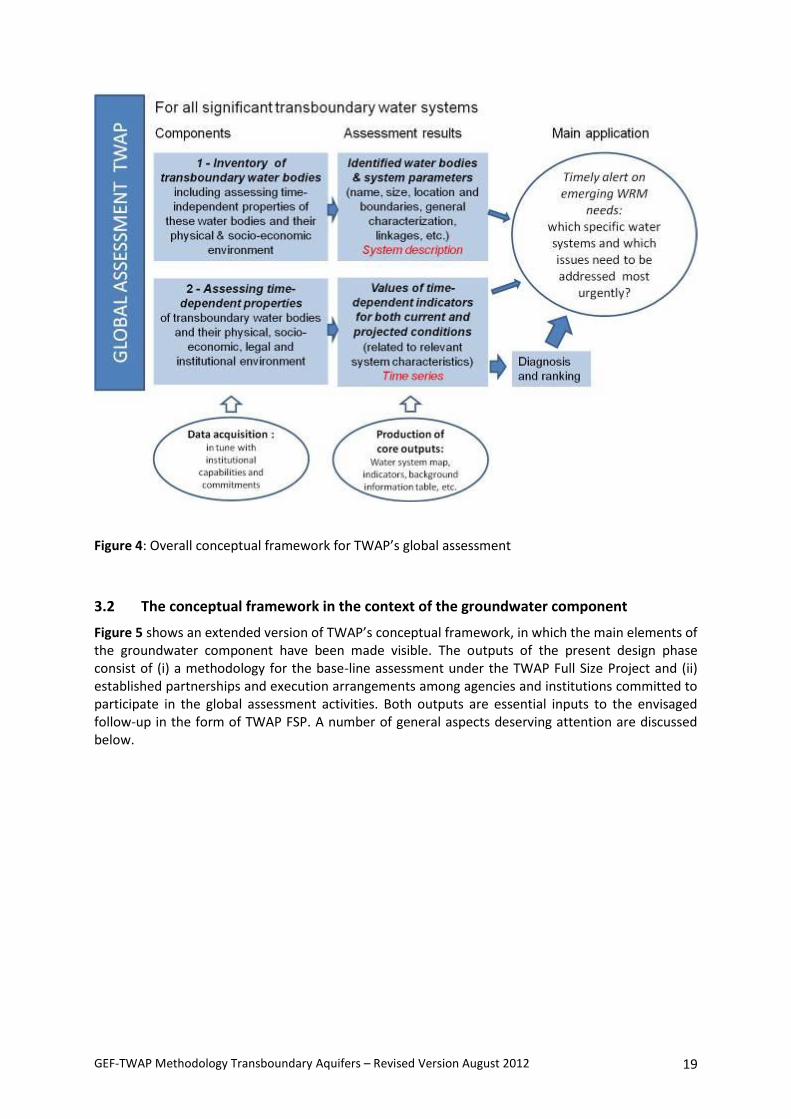
Figure 5 shows an extended version of TWAP’s conceptual framework, in which the main elements of the groundwater component have been made visible. The outputs of the present design phase consist of (i) a methodology for the base-line assessment under the TWAP Full Size Project and (ii) established partnerships and execution arrangements among agencies and institutions committed to participate in the global assessment activities. Both outputs are essential inputs to the envisaged follow-up in the form of TWAP FSP. A number of general aspects deserving attention are discussed below.
GEF-TWAP Methodology Transboundary Aquifers – Revised Version August 2012 20
Figure 5: Conceptual framework of TWAP Groundwater component in the context of the overall TWAP project
GEF-TWAP Methodology Transboundary Aquifers – Revised Version August 2012 21
3.2.1 Interpretation of TWAP’s objectives
It is very important that all participants in TWAP share a common interpretation of TWAP’s objectives. It is postulated here that TWAP’s aspirations go beyond those of GEF IW:RAF. The latter was a rapid exercise to develop an index (GBI – global benefits index) that might be used for rapid priority rating on the basis of data readily available in global or regional databases, excluding the option to acquire more data. TWAP instead puts emphasis on the acquisition of sufficient information to understand relevant characteristics and trends of the groundwater systems and the interconnected socio-economic and environmental systems. TWAP aims to give a major boost to our understanding of conditions and trends in and around the world’s internationally shared groundwater resources. Since this implies that changes in time should be known and understood, the assessment should be repeated periodically, in order to remain up-to-date regarding current conditions and trends.
3.2.2 Geographic aspects, scale and geometry
TWAP is designed as a global assessment; hence in principle all transboundary aquifers and Small Island Developing States’ (SIDS) groundwater systems should be taken into account. However, given the specific purposes of TWAP Groundwater, as well as time and financial constraints there is the need to exclude small systems (‘quantité negligeable’)24 and for establishing a similar degree of spatial aggregation in the transboundary systems across the world. As IGRAC’s world map of transboundary aquifers (2012) suggests, the latter needs some attention. A more consistent pattern will be obtained by merging identified local transboundary aquifers (e.g. in Europe) into larger transboundary aquifer systems. This would contribute to global harmonization and better reflect TWAP’s global perspective.
If TWAP has to contribute in the first place to a better knowledge and understanding of the international water bodies in the wider sense, then the spatial resolution of the assessment should be good enough to characterize the present status of individual aquifer systems, including trends and interactions. Past experience – e.g. in ISARM activities and in GEF IW:RAF - shows that it is already very difficult to obtain data at the aggregated level of an aquifer system, which suggests that it is not advisable for TWAP to go beyond this scale level. Therefore, it is proposed to take national segments of the transboundary aquifer system25 as the primary spatial unit for TWAP’s groundwater activities. This means that indicators should as far as possible depict the conditions of each national segment of an individual aquifer system and its surroundings. In the case of SIDS aquifers, the whole SIDS is taken as the primary spatial unit for the assessment. The socio-economic, environmental, institutional and legal systems related to the aquifer body considered tend to be shared partly or entirely with other water bodies in the same region, hence they are often not confined to an aquifer, but only related to it (and to other bodies as well).
An essential element in the assessment of transboundary aquifers across the world is the delineation of aquifer system boundaries. At present, reasonably accurate lateral boundaries are known for less than half of the inventoried transboundary aquifers in the world26. In many cases (e.g. for Europe) the maps show the locations only symbolically, which precludes any values of corresponding indicators to be defined and understood unambiguously. In addition to the lateral boundaries, vertical boundaries of the aquifer systems are important as well, but generally they are even less
24
E.g.: the thousands of small and unconfined aquifers present along international borders. This does not apply to SIDS, where small aquifers may play an important socio-economic role. 25
Intrinsically large and including the vertical dimension, as opposed to each specific generally small shallow unconfined aquifer linked to surface drainage. 26
Not all boundaries of delineated transboundary aquifer systems match perfectly within the productive hydrogeological units shown on WHYMAP’s map ‘Groundwater Resources of the World’ (2008). As the delineation of the transboundary aquifers and WHYMAP units both include simplification and subjectivity, they will have to be adjusted jointly if it is required to make them match.
GEF-TWAP Methodology Transboundary Aquifers – Revised Version August 2012 22
known than the lateral boundaries. It will be a challenge for TWAP to improve the knowledge on the geometry of the world’s transboundary aquifer systems, including the delineation of recharge areas, and produce improved maps and cross-sections, as well as reliable numbers on size, thickness and volume of the individual aquifer systems.
In some cases, transboundary aquifer systems have been organized and described within larger geographic units in order to highlight their interconnection and/or similarity:
(a) River basins of the world: see e.g. GRDC map of 2007 (405 river basins; endorrheic basins and some other territories not covered). Well-defined and often related to well-known toponyms (rivers), but large number, large variation in size and moderate to weak spatial correspondence with deeper groundwater systems.
(b) GIWA’s regions: 66 regions grouped into 11 macro-regions. The latter are strongly linked to current geographical names but may cause confusion by sometimes diverging boundaries (e.g. Central America). The regions do not contribute to better understanding of patterns in groundwater characteristics.
(c) Global Groundwater Regions (IGRAC): 36 Global Groundwater Regions have been defined on the basis of physical contrast (mainly geological differences). They help understanding the general patterns of hydrogeological variation on the globe. They are relatively weakly correlated with river basins. Global Groundwater Regions, Groundwater Provinces and Aquifer Systems represent three different hierarchical levels of a consistent nested system of groundwater zoning in the world.
(d) ISARM regions: The ISARM project was carried out in a regional approach and in close cooperation with Member States, several United Nations organizations, other international organizations and associations, as well as non-governmental organizations. The regions covered are (i) the Americas, (ii) Africa, (iii) South Eastern Europe, and (iv) Asia. ISARM is also closely cooperating with UNECE that is carrying out transboundary aquifer activities in Europe, the Caucasus and Central Asia.
The need for organizing transboundary aquifers within larger spatial units in TWAP arises primarily for operational purposes (efficient implementation of the assessment). It has been hence decided to adopt the same regions as the ISARM programme. It is expected that this will create conditions for cooperation between ISARM and TWAP, producing the highest possible degree of efficiency and synergy between both programmes. Successful elements of the ISARM methodology for the inventory and characterization of aquifer systems will be adopted by TWAP (refer to part II for further details).
Apart from transboundary aquifer systems, groundwater systems to be addressed by GEF’s International Waters programme include the groundwater systems of Small Island Developing States (SIDS) as well. The corresponding aquifer systems are small compared to most of the transboundary aquifer systems. They may be combined either into one single group (SIDS) or into three regional groups: AIMS Region27 (8 SIDS), Caribbean (23 SIDS) and the Pacific (20 SIDS).
3.2.3 Time interval between successive assessments
TWAP is not in the position to monitor worldwide with a frequency that would allow analysing detailed processes at field level. Rather, keeping a reasonably up-to-date picture of local conditions and perceiving multi-annual trends in lumped key variables and indicators is already a big challenge.
27
The title AIMS derives from the initial letters of the marine areas in which the islands in the original group are located; Atlantic (Cape Verde, Guinea Bissau, Sao Tome and Principe); Indian Ocean (Bahrain, Comoros, Maldives, Mauritius, Seychelles); Mediterranean (Cyprus, Malta); South China Seas (Singapore).
GEF-TWAP Methodology Transboundary Aquifers – Revised Version August 2012 23
Therefore, the time interval between successive assessments after the initial base-line assessment should be in the order of 3 to 6 years. Gearing with WWAP would suggest a 3-year or a 6-year time interval. Provisionally, a time interval of 6 years is proposed. Such a large time interval will strike a good balance between observing significant trends in due time and the considerable efforts needed to do so.
3.2.4 Which measurement scale to use for presenting assessment results?
Commonly, four types of scale are distinguished to characterize observations or measurements:
Nominal scale: just uses a label e.g. ‘igneous rock’.
Ordinal scale: indicates the ranking order, e.g. Mohs’ scale of mineral hardness (numerical differences between observations have restricted meaning, ratios are meaningless).
Interval scale: assigns quantity on a scale with arbitrary zero, e.g. temperature scale in oC (numerical differences between observations are meaningful, ratios are meaningless).
Ratio scale: assigns quantity on a scale with non-arbitrary zero, e.g. length or weight (numerical differences between observations as well as ratios are meaningful).
Some of the assessment data will come by their very nature in terms of a nominal scale. In IW:RAF, an ordinal scale was used consistently for all indicators developed. This was prompted particularly by the lack of reliable and accurate data. Using an ordinal scale, however, limits the options for arithmetic and statistical operations considerably. E.g. it is hardly possible to define trends if data or indicators are expressed as values on an ordinal scale. Therefore, the attempt will be made to base the values of TWAP’s most relevant indicators of change on a ratio scale.
3.2.5 Upscaling information to the spatial unit of assessment
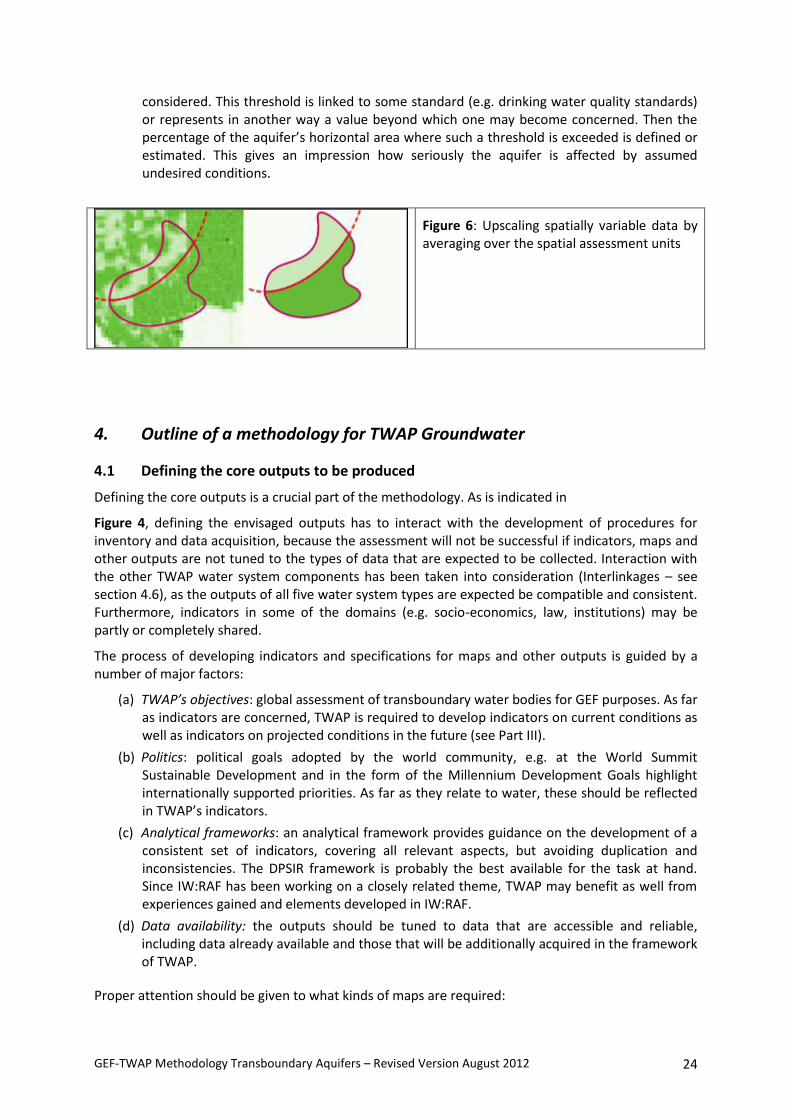
As mentioned in section 3.2.2 the proposed primary spatial units for the TWAP groundwater assessment will be the national segments of each transboundary aquifers and the whole territory of SIDS. Characterising the TBAs and SIDS aquifers on the proposed spatial units with a list of indicators enables such a comparison, provided that the indicators are ‘lumped’ over the entire spatial unit. According to the type of indicator, different upscaling procedures may be considered to produce a representative and meaningful lumped value:
(1) Summation: Appropriate for some types of variables (inputs and outputs), but inappropriate for other ones (local ‘state variables’). While local groundwater recharge and discharge components (in m3/year) can be summed to produce meaningful lumped variables related to the entire spatial unit (total aquifer recharge, total aquifer discharge, total abstraction, etc...), this procedure does not make sense in the case of groundwater levels or groundwater quality, because these variables do not belong to the type to which ‘additivity’ applies.
(2) Averaging: Producing average values (over the entire spatial) is a valid procedure that in theory may yield correct – although simplified - information on the state of groundwater depletion and pollution (see Figure 6). However, the process of averaging removes information about the extreme values and may introduce bias, especially if the aquifer is large and groundwater conditions vary considerably in space. E.g. excessive concentrations of nitrate in 20% of the aquifer’s extent (which is substantial) may remain unnoticed in the aquifer mean value of the nitrate content; whereas the mean TDS value of a fresh aquifer with a relatively modest sea water intrusion zone may give the impression of an overall brackish aquifer.
(3) Defining the percentage of the aquifer’s area where a predefined threshold value is exceeded: The idea here is that first a threshold is specified for the value of the variable
GEF-TWAP Methodology Transboundary Aquifers – Revised Version August 2012 24
considered. This threshold is linked to some standard (e.g. drinking water quality standards) or represents in another way a value beyond which one may become concerned. Then the percentage of the aquifer’s horizontal area where such a threshold is exceeded is defined or estimated. This gives an impression how seriously the aquifer is affected by assumed undesired conditions.
Figure 6: Upscaling spatially variable data by averaging over the spatial assessment units
4. Outline of a methodology for TWAP Groundwater
4.1 Defining the core outputs to be produced
Defining the core outputs is a crucial part of the methodology. As is indicated in
Figure 4, defining the envisaged outputs has to interact with the development of procedures for inventory and data acquisition, because the assessment will not be successful if indicators, maps and other outputs are not tuned to the types of data that are expected to be collected. Interaction with the other TWAP water system components has been taken into consideration (Interlinkages – see section 4.6), as the outputs of all five water system types are expected be compatible and consistent. Furthermore, indicators in some of the domains (e.g. socio-economics, law, institutions) may be partly or completely shared.
The process of developing indicators and specifications for maps and other outputs is guided by a number of major factors:
(a) TWAP’s objectives: global assessment of transboundary water bodies for GEF purposes. As far as indicators are concerned, TWAP is required to develop indicators on current conditions as well as indicators on projected conditions in the future (see Part III).
(b) Politics: political goals adopted by the world community, e.g. at the World Summit Sustainable Development and in the form of the Millennium Development Goals highlight internationally supported priorities. As far as they relate to water, these should be reflected in TWAP’s indicators.
(c) Analytical frameworks: an analytical framework provides guidance on the development of a consistent set of indicators, covering all relevant aspects, but avoiding duplication and inconsistencies. The DPSIR framework is probably the best available for the task at hand. Since IW:RAF has been working on a closely related theme, TWAP may benefit as well from experiences gained and elements developed in IW:RAF.
(d) Data availability: the outputs should be tuned to data that are accessible and reliable, including data already available and those that will be additionally acquired in the framework of TWAP.
Proper attention should be given to what kinds of maps are required:
GEF-TWAP Methodology Transboundary Aquifers – Revised Version August 2012 25
Location maps, showing the boundaries and identification of the world’s transboundary aquifers (update and elaboration of WHYMAP’s and IGRAC’s world maps of transboundary aquifer systems)
Aquifer maps, showing for individual aquifers the boundaries, topographic and/or hydrogeological features and relevant cross-sections
Thematic maps: world maps or regional maps or aquifer maps showing the values of selected variables or indicators (for baseline assessment or any assessment afterwards). These maps are optional (not belonging to the core outputs for Level 1), but they may be generated as part of the functionalities of the information system for optimal presentation of the information contained.
Except for the world maps, there is no obvious need to standardize scale and resolution of these maps, as appearing on the computer screen or in the form of hard copies. Standardizing resolution would lead to unnecessary loss of information. Standardizing scale among the entire set of international groundwater systems may even be very inconvenient, because the size of the aquifer systems may differ by orders of magnitude. However, it may be opportune to prepare all maps for each individual aquifer on one and the same scale.
It needs to be emphasized that all these envisaged outputs could be produced only if relevant sets of basic data are available. The variables for which basis data have to be collected are discussed in section 4.4. Although not belonging to the core outputs, these data are of primordial importance for TWAP, both for the baseline assessment and for later assessments.
4.1.1 Defining the core outputs for Level 1 Assessment
The envisaged core outputs can be summarized as follows for Level 1 (global baseline assessment):
(1) List and world map of transboundary aquifer systems and SIDS to be considered. (More details on this output can be found in section 4.3).
(2) Location map of each of these each of these transboundary aquifers and SIDS, if possible accompanied with cross-sections.
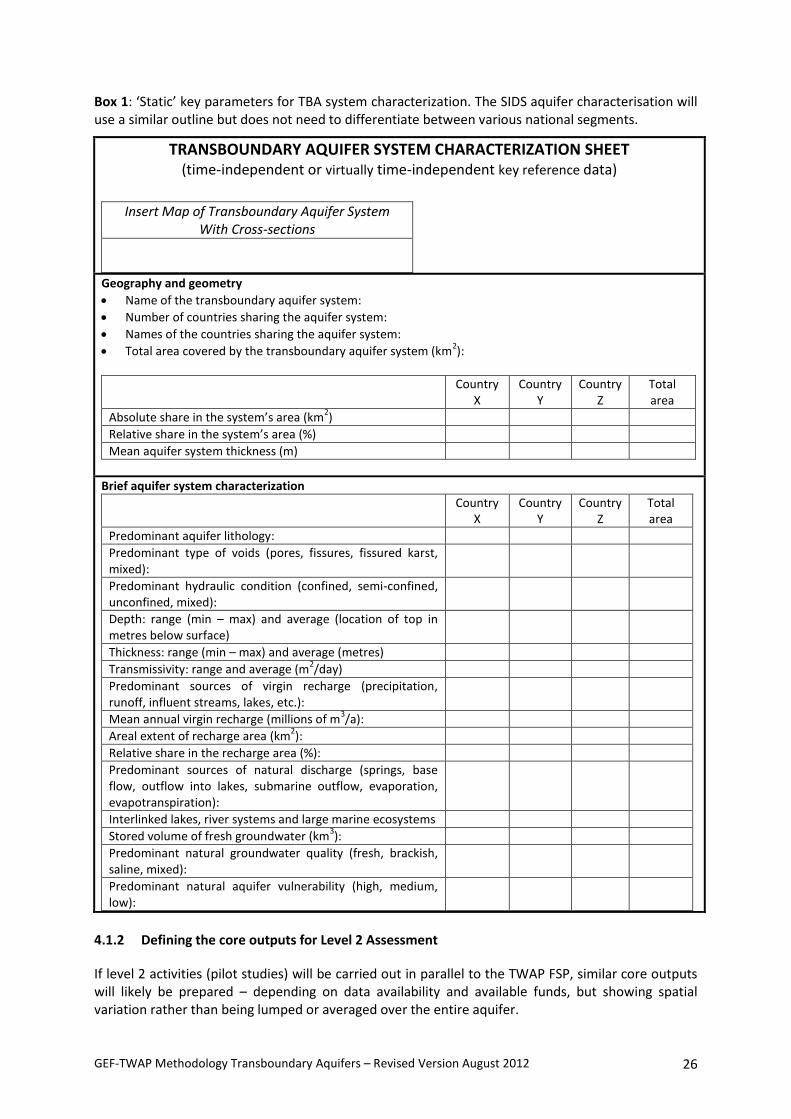
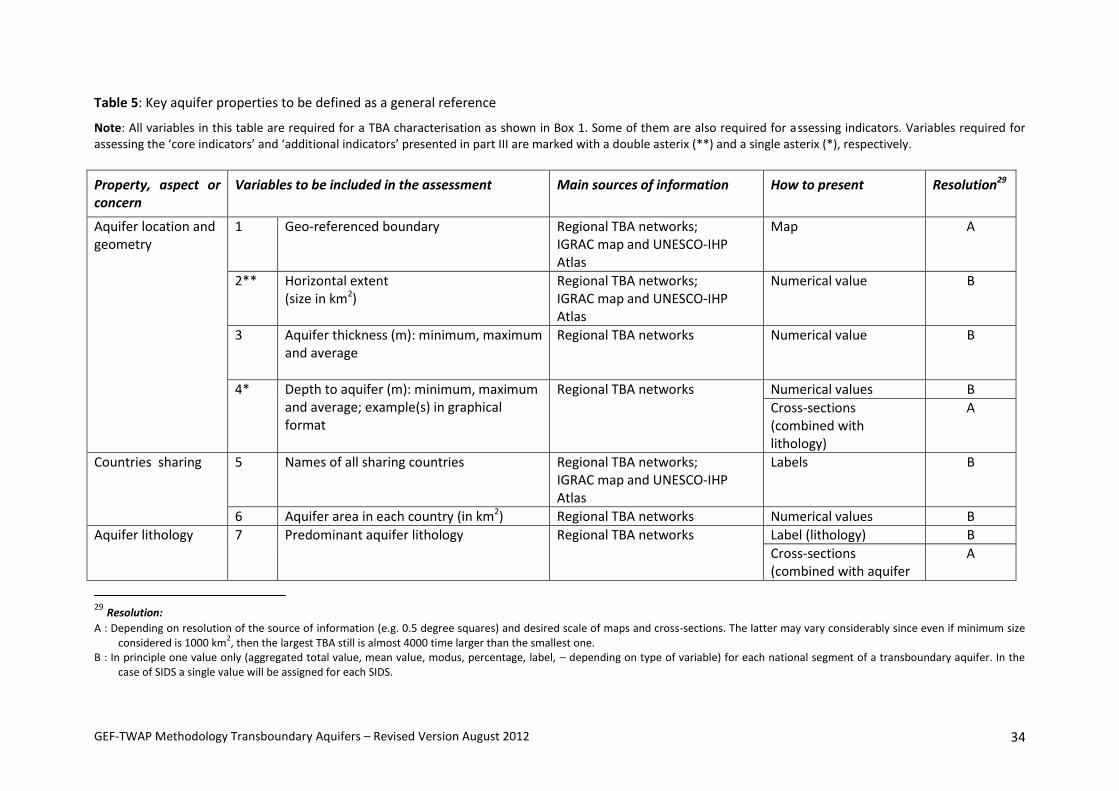
(3) Description of each transboundary aquifer and SIDS considered, including name, administrative data, geographic position, and some other ‘static’ key characteristics (Box 1 gives an idea of parameters to be included).
(4) Values of the set of selected TWAP groundwater indicators, defined to convey clear messages on the needs and relative priority of joint management of the international groundwater systems, including the issues to be addressed (Section 4.2 depicts the general approach, whereas a detailed elaboration follows in Part III).
(5) Values of the variables that have been collected to enable the outputs (3) and (4).
(6) A dedicated information system to facilitate storage, retrieval and presentation of the outputs as mentioned above, as well as all underlying data (this is elaborated in Part V).
(7) A summary report to present the major findings and to list all core outputs produced, indicating how and where these can be accessed.
GEF-TWAP Methodology Transboundary Aquifers – Revised Version August 2012 26
Box 1: ‘Static’ key parameters for TBA system characterization. The SIDS aquifer characterisation will use a similar outline but does not need to differentiate between various national segments.
TRANSBOUNDARY AQUIFER SYSTEM CHARACTERIZATION SHEET (time-independent or virtually time-independent key reference data)
Insert Map of Transboundary Aquifer System
With Cross-sections
Geography and geometry
Name of the transboundary aquifer system:
Number of countries sharing the aquifer system:
Names of the countries sharing the aquifer system:
Total area covered by the transboundary aquifer system (km2):
Country X
Country Y
Country Z
Total area
Absolute share in the system’s area (km2)
Relative share in the system’s area (%)
Mean aquifer system thickness (m)
Brief aquifer system characterization
Country X
Country Y
Country Z
Total area
Predominant aquifer lithology:
Predominant type of voids (pores, fissures, fissured karst, mixed):
4.1.2 Defining the core outputs for Level 2 Assessment
If level 2 activities (pilot studies) will be carried out in parallel to the TWAP FSP, similar core outputs will likely be prepared – depending on data availability and available funds, but showing spatial variation rather than being lumped or averaged over the entire aquifer.
GEF-TWAP Methodology Transboundary Aquifers – Revised Version August 2012 27
4.2 General approach to indicators development
The DPSIR framework has been employed in defining the set of groundwater indicators and underlying variables. The DPSIR methodology helps establishing the relationships between social, economic and environmental issues and the most burning issues in groundwater resources development, protection and management.
Although the DPSIR framework is very convenient and useful, in practice one may observe substantial divergence between its users on what belongs to which component of the framework. In particular, the distinction between Drivers and Pressures appears to be difficult. Table 1 attempts to give some clarification and make a link to different professional fields (subject as well to differences in interpretation). When using the DPSIR framework, it may be helpful to consider the global existence of ‘primary concerns’ on groundwater (maintaining the integrity of groundwater quantity and quality; optimal benefit from use and environmental functions of groundwater; minimal negative impacts of changing boundary conditions) and ‘secondary concerns’ focusing on conditions for groundwater management and control (awareness, legal framework, plans and regulations, institutions, stakeholders attitudes, governance, etc.), superposing the social impacts and responses for adaptation to climate change.
The indicators are developed on the basis of variables. Which variables are relevant in the context of TWAP’s groundwater component and related indicators is discussed in section 4.4.
GEF-TWAP Methodology Transboundary Aquifers – Revised Version August 2012 28
Table 1: Diagram showing tentatively the prevailing relations between DPSIR Framework, TWAP indicators in relevant professional fields and GEF’s Status and Process Indicators. In this case, the central system considered is a groundwater system.
Comments/interpretations Indicators related to different professional fields Science
(hydrogeology, hydrochemistry etc.)
Environment, including climate
Socio-economics, including demography
Law Institutions Combination
Drivers (D) Root causes of change with respect to ‘virgin’ conditions
(Demography, economic development, land use, poverty, politics, climate, etc.)
X X (X) X
Pressures (P) Factors that are acting as ‘boundary conditions’ (stresses) to the groundwater system, often in the form of in-/output of substances into/from the groundwater body (Groundwater recharge, discharge, abstraction, pollution, imposed water level)
X X X (X) X
State (S) Physical conditions of the groundwater (water quantity, water level and water quality)
X
Impacts (I) Social, economic and environmental functions and effects produced by the groundwater system and its exploitation (benefits and disbenefits/problems, current or expected in the future, i.e. issues of concern)
X
X
(X) X
Responses (R) Human actions intended to increase socio-economic and/or environmental benefits from groundwater or to reduce problems/disbenefits (current and expected). Include two categories:
(a) pro-active (‘enabling environment’) X X X X (b) re-active (measures for control and mitigation)
X
GEF-TWAP Methodology Transboundary Aquifers – Revised Version August 2012 29
4.3 Identification and selection of transboundary groundwater systems to be
considered
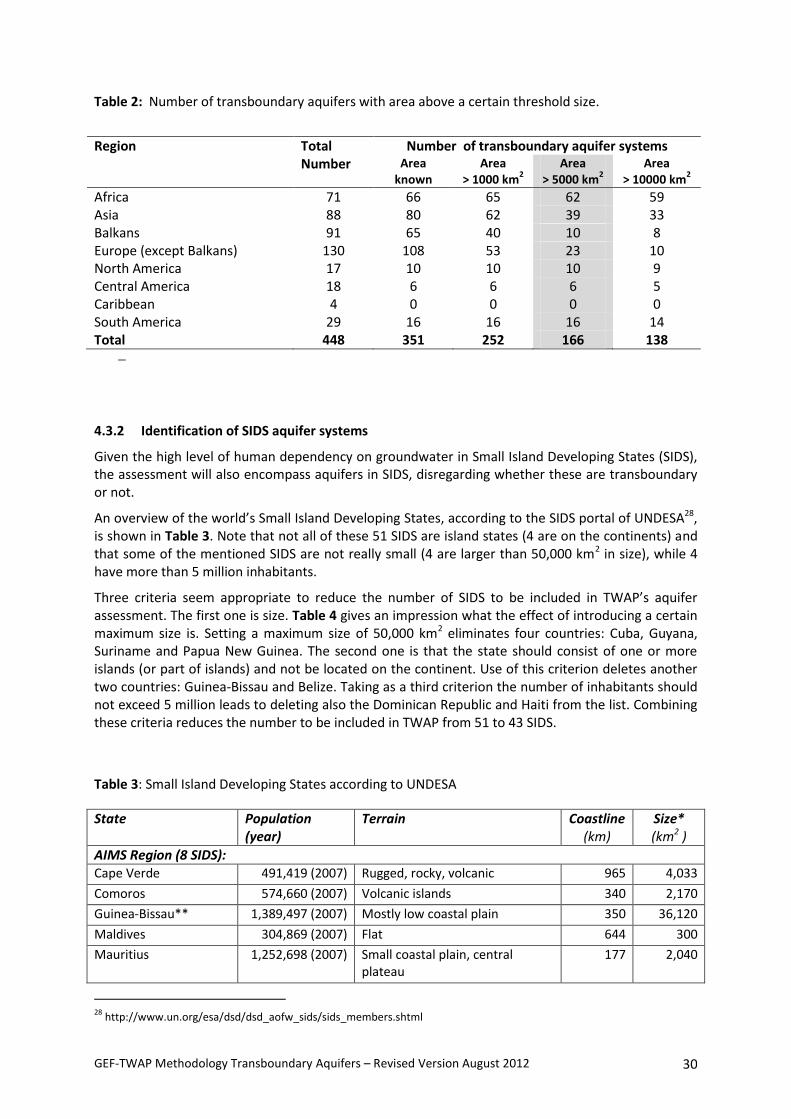
4.3.1 Identification of transboundary aquifers
Point of departure for the identification of transboundary aquifers is formed by three sources: (1) UNESCO-IHP’s “Atlas of Transboundary Aquifers” (2009), the latest overview presented by IGRAC‘s map 1:50,000,000 entitled “Transboundary Aquifers of the World” (2012) and WHYMAP’s “Transboundary Aquifers of the World” (2006).
IGRAC ‘s map presents 448 transboundary aquifers and groundwater bodies(see foot note 18) across the globe, shows the names and sharing countries for each of these, and specifies lateral boundaries, areal extent and aquifer type for a considerable number of the aquifers. UNESCO’s Atlas includes a smaller number of transboundary aquifers (almost 200), but presents a brief characterization (name, countries sharing it, location map and summary information) for each of them. In addition, the Atlas mentions and summarizes transboundary aquifer case studies in each of the regions.
Based upon these sources, a provisional list of aquifers can be prepared. The following steps have been taken into consideration to convert this list to a list of transboundary aquifers selected for TWAP:
Verification, updating and supplementation of the list, in cooperation with relevant regional networks (regional ISARM groups, UNECE, etc.). Some additional regional networks may have to be formed for this purpose (e.g. in Asia). The objective is to make the list consistent with the latest information available and to ensure that important transboundary aquifers are not overlooked.
Homogenization of the list, in cooperation with relevant regional networks (regional ISARM groups, UNECE, etc.). Different concepts and different degrees of spatial aggregation have been used to define transboundary aquifer systems. In particular, there is a need to revise the European transboundary aquifer systems (many of them more “transboundary aquifer zones” than entire transboundary aquifers) with the aim to integrate them into larger units that are more meaningful in a global context. In some other regions (e.g. the Americas) there are considerable variations in the concepts used to define transboundary aquifer systems.
Preliminary classification of the identified aquifers according to their relative importance. A criterion for relative importance has to be defined – a pragmatic criterion could be the size (in km2) of the aquifer’s horizontal extent. The purpose of this preliminary classification is to reduce the number of transboundary aquifers to be included in TWAP, by removing those that are considered ‘a priori’ to be of limited importance.
Preparing a list of aquifers to be considered by TWAP. This list should include all aquifers that are considered relevant for this global assessment. Criteria could include the importance of the aquifers (e.g. deleting all aquifers smaller than in 1000, 2000 or 5,000 km2 in size).
Size is currently considered to be the most pragmatic criterion to reduce the number of transboundary aquifers to be assessed in the framework of the TWAP level 1 assessment. Table 2 gives an impression of how effective this criterion may be. From this table it may be deduced that deleting transboundary aquifers less than 5000 km2 in size will reduce the number of aquifers: from 448 to 166 (assuming that aquifers with unknown area – probably poorly explored and poorly known - will also be deleted)
GEF-TWAP Methodology Transboundary Aquifers – Revised Version August 2012 30
Table 2: Number of transboundary aquifers with area above a certain threshold size.
Region Total Number
Number of transboundary aquifer systems Area
known Area
> 1000 km2
Area > 5000 km
2
Area > 10000 km
2
Africa 71 66 65 62 59 Asia 88 80 62 39 33 Balkans 91 65 40 10 8 Europe (except Balkans) 130 108 53 23 10 North America 17 10 10 10 9 Central America 18 6 6 6 5 Caribbean 4 0 0 0 0 South America 29 16 16 16 14 Total 448 351 252 166 138
4.3.2 Identification of SIDS aquifer systems
Given the high level of human dependency on groundwater in Small Island Developing States (SIDS), the assessment will also encompass aquifers in SIDS, disregarding whether these are transboundary or not.
An overview of the world’s Small Island Developing States, according to the SIDS portal of UNDESA28, is shown in Table 3. Note that not all of these 51 SIDS are island states (4 are on the continents) and that some of the mentioned SIDS are not really small (4 are larger than 50,000 km2 in size), while 4 have more than 5 million inhabitants.
Three criteria seem appropriate to reduce the number of SIDS to be included in TWAP’s aquifer assessment. The first one is size. Table 4 gives an impression what the effect of introducing a certain maximum size is. Setting a maximum size of 50,000 km2 eliminates four countries: Cuba, Guyana, Suriname and Papua New Guinea. The second one is that the state should consist of one or more islands (or part of islands) and not be located on the continent. Use of this criterion deletes another two countries: Guinea-Bissau and Belize. Taking as a third criterion the number of inhabitants should not exceed 5 million leads to deleting also the Dominican Republic and Haiti from the list. Combining these criteria reduces the number to be included in TWAP from 51 to 43 SIDS.
Table 3: Small Island Developing States according to UNDESA
The envisaged TWAP outputs as discussed in chapter 4.1 are decisive for what data should be collected during TWAP’s baseline assessment and next assessments in the context of TWAP. On the other hand, the outputs will be defined at least partly on the basis of the feasibility of collecting specific types of data. Consequently, an iterative process has to take place. As an input to this process, two lists of relevant variables have been prepared. These lists may be modified somewhat during the initial stages of TWAP FSP, but they give a fair idea of which data should be collected in
GEF-TWAP Methodology Transboundary Aquifers – Revised Version August 2012 33
order to be able to produce the proposed outputs (TBA location map; TBA characterisation sheet as defined in Box 1; indicators as defined in Part III).
The first list, presented in Table 5, proposes 17 variables that together give a general, more or less time-independent characterization of each transboundary aquifer system or SIDS groundwater system. Table 6 shows the second list that contains 67 time-dependent variables identified with the help of the DPSIR framework and considered as being relevant in the context of TWAP. One should not be frightened by this number of variables, as many of them will be known for aquifers that have been subject to studies, and several sets of ‘variables’ of the ‘yes/no’ category in fact could be considered as single variables. In the tables it has been indicated which variables are required for the assessing the core indicators (as presented in part III) and which ones for the additional indicators. Of course, collecting additional variables and information may contribute to a considerably better interpretation of the local conditions.
The sources of information mentioned in Tables 3 and 4 are suggested primary sources to be consulted by TWAP’s assessment teams. They basically consist of
(i) Easily accessible global or regional publications and databases. Many of these have been identified already in Chapter 2 and in Annex 2. One should be aware that the resolution of these data global data sources is not always adequate for deriving values that are representative for the aquifers considered. In cases where variables are assessed that are also relevant for other TWAP components, attention should be paid to using the same data sources (e.g. for climate and demographic data)
(ii) Regional networks of knowledgeable experts. This is probably the most promising sources of information for TWAP/Groundwater. The experts may themselves have ample knowledge of the aquifers considered, but in turn, may have access to other experts in their region and to more detailed information sources (e.g. national databases or even primary data sources such as project data bases or technical project reports, often ‘grey’ literature). Together, the two lists of Tables 3 and 4 may, among others, inform the design of “questionnaires” for the acquisition of data through regional expert networks (see Part II).
(iii) Global or regional modelling (e.g. using WaterGap) or remote sensing projects (including GRACE results).
Including the values of the specified elementary variables in TWAP’s databases (along with the indicator values) is essential to ensure optimal comparability of indicator values between different TBAs/SIDSs and between different moments of time.
GEF-TWAP Methodology Transboundary Aquifers – Revised Version August 2012 34
Table 5: Key aquifer properties to be defined as a general reference
Note: All variables in this table are required for a TBA characterisation as shown in Box 1. Some of them are also required for assessing indicators. Variables required for assessing the ‘core indicators’ and ‘additional indicators’ presented in part III are marked with a double asterix (**) and a single asterix (*), respectively.
Property, aspect or concern
Variables to be included in the assessment Main sources of information How to present Resolution29
A : Depending on resolution of the source of information (e.g. 0.5 degree squares) and desired scale of maps and cross-sections. The latter may vary considerably since even if minimum size considered is 1000 km
2, then the largest TBA still is almost 4000 time larger than the smallest one.
B : In principle one value only (aggregated total value, mean value, modus, percentage, label, – depending on type of variable) for each national segment of a transboundary aquifer. In the case of SIDS a single value will be assigned for each SIDS.
GEF-TWAP Methodology Transboundary Aquifers – Revised Version August 2012 35
Property, aspect or concern
Variables to be included in the assessment Main sources of information How to present Resolution29
thickness)
Hydraulic setting 8 Predominant type of voids (pores, fissures, fissured karst, mixed )
Regional TBA networks; IGRAC’s draft report on saline and brackish groundwater
Label (methodology still to be defined/elaborated)
B
17* Natural aquifer vulnerability to pollution (estimated % of area considered to be of high, medium and low vulnerability)
Regional TBA networks Numerical values (methodology still to be defined)
B
GEF-TWAP Methodology Transboundary Aquifers – Revised Version August 2012 36
Table 6: Time-dependent variables to be assessed for TWAP/Groundwater, in relation to the DPSIR framework
Note: Variables required for assessing the ‘core indicators’ and ‘additional indicators’ presented in part III are marked with a double asterix (**) and a single asterix (*), respectively.
Property, aspect or concern
Variables to be included in the assessment Main sources of information How to present Resolution30
DRIVERS
Demography 1** Total population within aquifer Regional TBA networks; Global maps/databases
Numerical value B
Climate 2* Mean precipitation P (mm/a) Regional TBA networks; Global maps and databases
Numerical value B
3* Mean potential evapotranspiration ETp (mm/a)
Regional TBA networks; Global maps and databases
Numerical value B
4* Expected change in P/ETp rate next 50 years (in percentage)
Regional TBA networks; Global maps and databases
Numerical value B
Water supply and sanitation
5* Percentage of population covered by public water supply
Regional TBA networks; National statistics
Numerical value B
6* Percentage of population covered by public sanitation services
Regional TBA networks; National statistics
Numerical value B
7* Percentage of waste water treated before re-entering
Regional TBA networks; National statistics
Numerical value B
Water scarcity 8** Mean annual rate of ‘blue water’ renewal per capita
Regional TBA networks; National statistics
Numerical value B
PRESSURES B
Groundwater recharge 9** Natural and induced recharge (including Regional TBA networks Numerical values B
30 Resolution:
A : Depending on resolution of the source of information (e.g. 0.5 degree squares) and desired scale of maps and cross-sections. The latter may vary considerably since even if minimum size considered is 1000 km
2, then the largest TBA still is almost 4000 time larger than the smallest one.
B : In principle one value only (aggregated total value, mean value, modus, percentage, label, – depending on type of variable) for each national segment
GEF-TWAP Methodology Transboundary Aquifers – Revised Version August 2012 37
Property, aspect or concern
Variables to be included in the assessment Main sources of information How to present Resolution30
recharge by ‘irrigation losses’) (millions of m3/a; mm/a)
(either for total or both components)
10** Artificial recharge (millions of m3/a; mm/a)
Regional TBA networks Numerical value B
Groundwater abstraction
11** Total abstraction (millions of m3/a; mm/a)
Regional TBA networks Numerical value B
12* Groundwater abstraction for domestic water supply (millions of m3/a; mm/a)
Regional TBA networks
Numerical value B
13* Groundwater abstraction for agricultural water supply (millions of m3/a; mm/a)
Regional TBA networks
Numerical value B
14* Groundwater abstraction for industrial water supply (millions of m3/a; mm/a)
Regional TBA networks
Numerical value B
Groundwater pollution 15* Percentages of area exposed to minor, medium and severe pollution sources
Regional TBA networks Numerical value B
Sea water intrusion 16* Currently occurring sea water inflows (minor, medium, severe)
Regional TBA networks Classes B
Total blue water abstraction in the area covered by the TBA or SIDS considered
17** Total blue water abstraction (millions of m3/a; mm/a)
Regional TBA networks Numerical value B
18* Blue water abstraction for domestic water supply (millions of m3/a; mm/a)
19* Blue water abstraction for agricultural water supply (millions of m3/a; mm/a)
20* Blue water abstraction for industrial water supply (millions of m3/a; mm/a)
STATE B
Groundwater quantity 21* Percentage of area with shallow water table (shallower than 5 m below surface)
Regional TBA networks Numerical value B
22* Total discharge by springs (M m3/a; mm/a) Regional TBA networks Numerical value B
23** Long-term trend of groundwater level Regional TBA networks Numerical value B
GEF-TWAP Methodology Transboundary Aquifers – Revised Version August 2012 38
Property, aspect or concern
Variables to be included in the assessment Main sources of information How to present Resolution30
decline (m/a) or depletion (M m3/a; mm/a)
Groundwater quality 24** Percentage of area where groundwater salinity restricts water use
Regional TBA networks Numerical value B
25** Percentage of area where groundwater pollution restricts water use
Regional TBA networks Numerical value B
IMPACT B
Services to and dependencies of humans
26* Abstraction for domestic/public water supply (millions of m3/a; mm/a)
Regional TBA networks Numerical value B
27* Abstraction for agricultural water supply (millions of m3/a; mm/a)
Regional TBA networks Numerical value B
28* Abstraction for industrial water supply (millions of m3/a; mm/a)
Regional TBA networks Numerical value B
29* Area of groundwater-fed wetlands & ecosystems/(km2)
Regional TBA networks Numerical value B
30* Area of groundwater-fed agricultural land (km2)
Regional TBA networks Numerical value B
31* Area of groundwater irrigated land (km2) Regional TBA networks Numerical value B
32* % of public/domestic supply dependent on groundwater
Regional TBA networks Numerical value B
33* % of industry dependent on groundwater Regional TBA networks Numerical value B
34* % of irrigated land dependent on groundwater
Regional TBA networks Numerical value B
Environmental impacts to ecosystems
35* Areal extent of groundwater-supported wetlands
Regional TBA networks Numerical value B
36* Areal extent of groundwater-related land subsidence
Regional TBA networks Numerical value B
37 Areal extent of groundwater-supported agricultural lands (phreatophytic agriculture) (km2)
Regional TBA networks Numerical value B
GEF-TWAP Methodology Transboundary Aquifers – Revised Version August 2012 39
Property, aspect or concern
Variables to be included in the assessment Main sources of information How to present Resolution30
RESPONSES Regional TBA networks
Legal instruments (Existence, status and comprehensiveness of a binding agreement on the transboundary aquifer or SIDS groundwater under consideration)
38** Does any signed agreement exist? Regional TBA networks Yes/no for each of the countries involved
B
39** If not, has an agreement been drafted but not yet signed?
40** If not, is any agreement under preparation? Regional TBA networks Yes/no for each of the countries involved
B
41** If a signed agreement exists, how to classify its scope: (a) limited scope (e.g. agreement to co-operate or exchange information) (b) full scope for TBA management or SIDS groundwater management
Regional TBA networks Select (a) or (b) B
Institutional framework (Existence, mandate and capabilities of institutions or institutional arrangements for managing the transboundary aquifer or SIDS groundwater under consideration)
42** Do institutions exist that have the mandate and capability for TBA management or SIDS groundwater management?
Regional TBA networks Yes/no for each of the countries involved
B
43** If this is the case, how to characterise the mandate of the institution(s) with respect to TBA/SIDS groundwater management:
(a) limited mandate (b) domestic institutions with full
mandate (c) special TBA or SIDS institution with
full mandate
Regional TBA networks Select (a), (b) or (c) B
44** If this is the case, how to characterise the capacity of the institution(s) with respect to TBA/SIDS groundwater management:
(d) limited capacity (e) domestic institutions with adequate
Regional TBA networks Select (a), (b) or (c) B
GEF-TWAP Methodology Transboundary Aquifers – Revised Version August 2012 40
Property, aspect or concern
Variables to be included in the assessment Main sources of information How to present Resolution30
capacity (f) special TBA or SIDS institution with
adequate capacity
Implementation of measures – Law and regulations
45* Groundwater well drilling permits required? (licensing with strictly adhered criteria for granting or refusal)
Regional TBA networks Yes/no for each of the countries involved
B
46* Groundwater abstraction permits required? (licensing with strictly adhered criteria for granting or refusal)
Regional TBA networks Yes/no for each of the countries involved
B
47* Any other regulations in vigour for controlling groundwater abstraction? (e.g. for drainage purposes)
Regional TBA networks Label (specify type of regulation)
B
48* Land use regulations for water quality protection
Regional TBA networks Yes/no for each of the countries involved
B
49* Groundwater protection zones present? Regional TBA networks Yes/no for each of the countries involved
B
50* Regulations on use/control of hazardous substances
Regional TBA networks Yes/no for each of the countries involved
B
51* Waste disposal regulations Regional TBA networks Yes/no for each of the countries involved
B
52* Waste water treatment obligations Regional TBA networks Yes/no for each of the countries involved
Regional TBA networks Select (a), (b), (c), (d) or (e)
B
GEF-TWAP Methodology Transboundary Aquifers – Revised Version August 2012 41
Property, aspect or concern
Variables to be included in the assessment Main sources of information How to present Resolution30
(e) none
Implementation of measures - Incentives/ disincentives
55* Subsidies/credits/taxes on wells Regional TBA networks Yes/no for each of the countries involved
B
56* Subsidies energy used by wells Regional TBA networks Yes/no for each of the countries involved
B
57* Taxes on groundwater abstraction (tariff) Regional TBA networks Yes/no for each of the countries involved
B
58* Subsidies on water saving actions Regional TBA networks Yes/no for each of the countries involved
B
59* Restrictions on power supply Regional TBA networks Yes/no for each of the countries involved
B
60* Well retirement bonus Regional TBA networks Yes/no for each of the countries involved
B
61* “Polluter pays” principle applied Regional TBA networks Yes/no for each of the countries involved
B
62* Public awareness Regional TBA networks Yes/no for each of the countries involved
B
Implementation of measures – structural works
63* Government well schemes (no of wells) Regional TBA networks Numerical value B
64* Artificial recharge schemes (total mean capacity, in millions of m3/a )
Regional TBA networks Numerical value B
65* Sewerage systems (% of waste water sewered)
Regional TBA networks Numerical value B
66* Treatment plants ((% of waste water treated)
Regional TBA networks Numerical value B
67* Controlled landfills (% of total solid waste) Regional TBA networks Numerical value B
GEF-TWAP Methodology Transboundary Aquifers 42
4.5 Current conditions versus projections
The TWAP Full Size Project is going to provide information on the current and assumed future status of the TBAs and SIDS aquifers that will be assessed in the framework of the level 1 assessment, as presented in chapter 4.3. For the future status, projections of global change drivers and a limited set of indicators referring to priority issues in the groundwater systems will be developed for the years 2030 and 2050.
Consequently, the TWAP Groundwater Methodology includes two main types of indicators:
(1) Indicators of current conditions. These indicators form core outputs of the baseline assessment. They are based on observations and thus on factual information, although the accuracy and reliability of the underlying data may not be optimal.
(2) Indicators of projected future conditions. These indicators attempt to predict the future, 20-40 years ahead. Unlike the indicators of the previous category, these ones are not based on observations, but rather are ‘guestimates’, based on extrapolation of observed data, assumed trends and some basic transfer relation (model). Hence the indicators of this category are subject to uncertainty and should be used with caution.
All proposed indicators are presented and discussed in part III of this report.
4.6 Level 2 assessment and causal chain analysis
A Level 2 assessment is likely to be carried out in selected pilots, as a complement to the GEF funded level 1 assessment. During the Level 2 assessment, the full set of indicators as specified in part III of this document will be applied, in order to increase the level of detail of the assessment in selected sites. In addition, causal chain analyses will be carried out in the pilot sites. This causal chain analysis investigates the priority issues within the selected transboundary groundwater systems and/or SIDS (defined during the Level 1 assessment) and identifies their underlying causes in more detail.
GEF-TWAP Methodology Transboundary Aquifers 43
Part II – IDENTIFICATION AND CHARACTERIZATION OF TBAS31
5. Objectives
(a) Making transboundary aquifer systems32 “visible” and recognized by the countries that share them.
(b) Collecting, to the extent feasible within the context of TWAP, for each transboundary aquifer a set of data that combined give a first description of its present hydro-geological, environmental, socio-economic, and governance conditions, and of its interactions with adjoining water-bodies and ecosystems.
Contrary to all other water bodies, aquifers are located in the subsurface and visible only through the eyes of science – hydrogeology. As a consequence, while in all countries of the world groundwater is being used intensively, in many cases this happens in the absence of a full understanding of the nature and characteristics of the resource, including of its occurrence in defined geological permeable rock formations, called “aquifers”. Moreover, groundwater resource boundaries, or aquifer boundaries, are often very poorly known and so many aquifers remain unknown or only partly recognized as separate, often unconnected, entities.
This is particularly true for transboundary aquifers, which are often not recognized as shared resources by countries because of differing geological litho-stratigraphic approaches, lack of communication among countries, uneven availability of data, or sovereignty issues. Lack of recognition of their nature of shared resources increases their vulnerability to anthropogenic pressures.
During the last decade, the Internationally Shared Aquifer Resources Management (ISARM) Program launched by UNESCO IHP33 with the purpose of raising international awareness on the need to properly manage these highly vulnerable resources, has succeeded in completing for the first time a preliminary regionally based inventory of transboundary aquifers and in focusing global attention on these widespread and valuable water resources. The ISARM approach and experience inform the methodological design of the “Identification and Characterization of TBAs” part of TWAP groundwater, which will strive to expand and complement the ISARM inventory of transboundary aquifer systems globally.
31
Including SIDS 32
For a definition, see Part 1 33
A meeting of experts held in parallel with the International Conference on Regional Aquifer Systems in Arid Zones organized by UNESCO in Tripoli 20–24 November 1999 indicated the need to create an international network supported by IAH, UNESCO, FAO and UNECE. Therefore with the support of UNESCO and IAH in co-operation with FAO and UNECE a meeting of experts was held at UNESCO in Paris 27–28 March 2000. As a result of the meeting a proposal for an international initiative on Internationally Shared/transboundary Aquifer Resources Management (ISARM/TARM) was formulated, and later approved by the IHP Intergovernmental Council.
GEF-TWAP Methodology Transboundary Aquifers 44
6. Methodological Approaches
As stated, the TWAP methodology for the implementation of the Identification and Characterization activities will draw heavily from the ISARM experience34, in particular from its most advanced regional effort – ISARM Americas, thus building on what has already been achieved globally in terms of TBA identification and initial characterization. It is expected that by doing so, and by providing new and additional financial resources and overall technical oversight and management, the global TWAP Baseline Assessment of Transboundary Aquifers will be produced within a reasonably short period of time.
The methodology for this part of TWAP Groundwater will adopt the following approaches:
1. Harmonization of information
The methodology for the Identification and Characterization of TBAs has been designed in such a way as to provide, within a defined period of time, a harmonized and comparable synopsis of transboundary aquifers globally, reflecting the present state of knowledge and availability of information. This harmonization will be achieved by ensuring technical and scientific supervision, using predefined guidelines, methodologies, information formats and forms and coordination of efforts at the regional and global level. The ISARM experience will be of great value in identifying ways to ensure harmonization and comparability of TWAP results.
2. Regional Approach
The global Identification-Characterization of TBAs, while using a common methodology will be regionally based, i.e. executed by “regions”: geographical units with borders represented by oceans or by other major geologic discontinuities (e.g.: the Himalayas – Hindu Kush Chain). This regional approach will allow to better capture existing knowledge and expertise, and to create partnerships with regional organizations and networks, cornerstones of the TWAP GW execution arrangements. The ISARM regions will be adopted (Americas, Africa, Western and South Eastern Europe, Caucasus and Central Asia, Middle East, Asia), with the addition of special SIDS groupings.
3. Country Involvement
The Identification-Characterization exercise will strive to involve directly all countries likely to share aquifers. Country involvement is considered an essential element of the TBA methodology, given the need to improve data availability, and to achieve visibility of the aquifers and mutual recognition of their shared nature.
4. Acquisition of information
The data acquisition is a complex activity because it encompasses a large number of aquifer systems, spread over almost all countries of the world. Thus conditions may range from well-documented aquifer systems managed by institutions that monitor all relevant aspects (only a few ones!) to poorly explored aquifer systems that are not monitored or managed at all (the majority of transboundary aquifers).
With the exception of ISARM and its related programs (WHYMAP, IGRAC and others), information on TBAs is not being systematically collected or stored in publicly available
34
The ISARM Atlas (2009) contains a synthesis of the methodology and lessons learned so far
GEF-TWAP Methodology Transboundary Aquifers 45
databases. The need to make within the context of TWAP an effort to complement with newly acquired information what is already available has hence emerged as a priority. Two ways have been identified as feasible within the financial and time constraints of TWAP:
(i) The systematic use of questionnaires and regional networks of experts, and
(ii) Reliance on remote sensing and modelling whenever technically and economically feasible.
Retrieving data from easily accessible databases will be the first step. However, the experience in IW: RAF has shown that currently existing global databases may allow to get an initial limited description of the groundwater systems only. For most aquifer systems they certainly do not meet the requirements for quantifying even a simple set of indicators at aquifer level, let alone that they could fulfil TWAP’s ambition to assess trends over time.
Other steps are needed to ensure that sufficient data will become available. A very evident one is to form partnerships with groundwater related institutions all over the world and get these involved in accessing, processing and compiling information from databases within their respective countries. The work will be guided by dedicated questionnaires. This is basically the ISARM methodology. Regional ISARM groups will be invited to contribute to TWAP and new groups of this type will be established in areas not yet covered. Eventually, these groups may be motivated to expand their field assessment and monitoring programmes. As demonstrated before by ISARM, well-designed questionnaires are a powerful tool for targeted, efficient and standardized collection of data by means of these regional working groups.
Questionnaires will be used as a way to guide and organize in a harmonized way the Identification/Characterization process, and to complement existing information. Questionnaires will be directed to country and regional experts thus strengthening country/local participation and ownership. Responses to questionnaires will be the responsibility of “regional expert networks”, who will coordinate country inputs and complement them (e.g.: through regional geological considerations and expertise) whenever possible.
Questionnaires will address primarily:
The existence and spatial distribution of TBAs and their mutual recognition by countries sharing them;
Information on the key elements that characterize their “status”, and the situation relating to governance and other “processes” (see Tables 3 and 4);
The identification of issues of transboundary concern
Interactions with other water bodies.
In addition to information that will be derived from national and regional sources and expert networks, the feasibility of the utilization within the context of TWAP Groundwater of newly collected data that could be obtained through satellite imagery processing, and modelling, has been explored during the ad hoc event organized by UNESCO and IGRAC in Utrecht, April 201035. Experts convened in Utrecht concluded that these tools might in some cases allow, in a cost-effective manner, to fill gaps in information coverage, complement/extrapolate available information, produce forecasts and scenarios, and identify parameters to be monitored in time.
35
The report of the Utrecht workshop is being attached as Annex. 5
GEF-TWAP Methodology Transboundary Aquifers 46
It is envisaged that for the purposes of the TWAP baseline assessment, a special task force on innovative approaches will be created to complement whenever feasible with newly acquired information the work of regional networks as they advance in the characterization of transboundary aquifers.
7. Emerging & priority issues and hotspots
Within TWAP, an emerging issue is defined as a problem, opportunity or concern that only recently started developing or becoming perceived (the latter may relate to current conditions or to expected future conditions). A priority issue is defined as a problem, opportunity or concern that needs to be addressed with priority. Priorities may change over time, gradually (in response to gradually changing conditions) or suddenly (in response to disasters or other sudden events). A hot spot is defined as a demarcated geographical location or zone deserving special attention from a certain point of view, usually because of the presence of a specified current or potential problem or concern.
There are some complicating factors surrounding these issues that need to be clarified before one can define how these issues are addressed in TWAP. First of all the selection and definition of emerging and priority issues and of hotspots has a strong element of human perception and preferences in it (subjectivity). Secondly, the scale at which we want to define emerging and priority issues and hotspots is important. A priority issue can be chosen within the limits of one single transboundary aquifer and/or SIDS but they also can be selected at a global scale.
Emerging issues, priority issues and hotspots may be defined at 2 scales:
Scale of individual transboundary aquifer and/or SIDS: The regional networks of groundwater experts describing and characterizing the individual transboundary aquifer and/or SIDS (see part II) give a narrative description of at least one emerging issue and one priority issue. Moreover, they grossly delineate hotspot zones within the transboundary groundwater system and/or SIDS where the emerging and priority issues are occurring. This identification takes place in the level 1 assessment.
Scale of the global TWAP assessment: The indicators-based Level 1 assessment (with lumped figures of various indicators per transboundary groundwater system and/or SIDS reveals which groundwater issues occur often and which locations have many issues. GEF (with the help of the TWAP groundwater core group) prioritizes which issues deserve more GEF attention thematically and which transboundary groundwater systems and/or SIDS deserve more GEF-attention geographically. This ‘ranking’ exercise should be based on the needs and objectives of GEF IW. Consequently, ranking criteria (like weighting factors) are defined by GEF. At this scale and only at this stage a number of global groundwater hotspots are selected for the Level 2 TWAP assessment to be carried out.
GEF-TWAP Methodology Transboundary Aquifers 47
8. Outputs36
Inventory:
The inventory will consist of a listing by region of all major37 known TBAs and of their spatial distribution and expression on surface. A tentative delineation of aquifer boundaries will be attempted using the physical boundaries of the host rock formation that provide a rough approximation of the boundaries of aquifer systems, which are hardly identifiable with precision. A name will be assigned to each aquifer system (scientific, international, local).
It will be based on (i) existing specific information (e.g.: ISARM atlas), (ii) newly acquired information (questionnaires/regional networks, remote sensing and modelling) and (iii) regional geological considerations (wherever, in absence of specific information, regional geology suggests the likely presence of important aquifer systems).
Further, the Inventory will delimit areas with no information, or where information exists, but is not available.
The Inventory will include a listing of SIDS and their categorization on the basis of their geomorphologic nature.
Characterization:
This output will include:
(1) All collected data and information, organized according to Box 1. This represents the cornerstone of all TWAP outputs.
(2) A short narrative, that for each identified aquifer system will strive to include, but might not be limited to (see Tables 3 and 4):
(i) Scientific information: Hydraulic state, hydrogeological nature of the host rock, its three dimensional distribution, storage capacity, its recharge and discharge zones, the regional hydrology, climatic conditions and likely scenarios, the natural physical and chemical characteristics of the water, and the aquifer’s role and relevance in maintaining the integrity of ecosystems (wetlands, base flow of rivers, oasis, alluvial plans, etc.);
(ii) Legal information: the legislative context in each country sharing the aquifer; the existence of legally defined management systems; the presence of and adherence to international agreements, aquifer treaty, soft law guidance etc.; the relationships with river/lake basin authorities and management frameworks.
(iii) Socio-economic information: Human uses and trends (domestic, agriculture, industry, energy, environment), socio-economic drivers.
(iv) Institutional setting: existing institutional frameworks and governance issues.
(v) Environmental conditions: Anthropogenic and natural stresses/disturbances, essentially pollution and level of abstraction, saline intrusion; impacts of climate variability and change; level of integrity of groundwater dependent ecosystems.
36
See also Part IV. 37
See Part I for a definition.
GEF-TWAP Methodology Transboundary Aquifers 48
(vi) Issues of Transboundary concern: whenever possible, the main stresses requiring the coordinated mitigation actions of countries sharing the aquifer will be identified.
(vii) Interactions with other water bodies. Particular emphasis will be placed on collecting information and data relevant for the application of the TWAP GW Indicators (Part III).
The collected data sets are to be stored in an information system, readily available for retrieval and presentation in different formats, but also as key elements for scientific verification of all TWAP’s outputs.
Cartographic representation:
The imperative of making TBAs “visible” which underpins the whole methodology, will necessarily require that each identified TBA be, to the extent possible, represented two dimensionally on a map - with its approximate boundaries, recharge and discharge areas including dependent ecosystems, and three dimensionally in geologic cross sections of the subsurface, indicating the approximate geometry of the aquifer, its varying depth, its relations with aquitards and aquicludes, the major tectonic discontinuities and preferential permeability pathways and barriers. This will be a fundamental contribution of TWAP to the better understanding and governance of groundwater resources globally.
A preliminary systematic attempt at representing aquifers on maps and sections has been made by ISARM, IGRAC, and WHYMAP. In several cases the geographic location of TBAs was provided using symbols, often along political boundaries. More recently WHYMAP has produced possibly the best examples of cartographic and web based representations of various typologies of aquifers (using a simple and very effective legend), including transboundary aquifers at a global and continental scales.38 We have to bear in mind however that WHYMAP’s level of spatial aggregation of hydrogeological units is different from what is appropriate at the level of most individual transboundary aquifers, with exception perhaps of some very large ones. This is the reason why WHYMAP units and transboundary aquifer boundaries often have an imperfect match. The TWAP Groundwater Component will build upon and complement, whenever possible, the ISARM-IGRAC-WHYMAP approach.
38
While TWAP will have to build upon previous efforts at the global/regional scales, it will be nonetheless useful to analyze during TWAP execution the results achieved by the Guarani Aquifer Project as far as mapping and three-dimensional representation of this huge aquifer system (in the case of the Guarani, countries sharing the aquifer agreed on a common legend and on a common geographic and geological cartography for the aquifer system).
GEF-TWAP Methodology Transboundary Aquifers 49
Part III - INDICATORS
9. Background
The main function of indicators is to convey a relevant message in a very compact, simple way. Simplification and quantification (or at least classification) are typical features of indicators. They facilitate communication and allow for comparisons between different countries, regions and groundwater systems. They provide information ‘in a nutshell’ and in an understandable format on the functioning of the aquifer system and its response to stress and they act as an important communication tool for policy and decision makers, planners and the general public. They also help identifying which data have to be collected to satisfy information needs and translating collected data into policy relevant information. However, we must have in mind that an indicator is an instrument for identification of opportunities and problems and not for plan development or problem solution. The most common use of indicators is description of the state of the resource. Repeated assessment of indicators provides time series that show trends and may thus provide information on the functioning of the system or its response to stress. An indicator can also used to compare current conditions to a reference condition and so it can be used as a tool for assessment. Finally, indicators can also be used for predicting the future. When models are linked to indicators, a time series of an estimated future may be derived.
Indicators must be carefully planned and developed. First of all, the set of indicators should cover the most relevant aspects for transboundary groundwater resources management (see section 10). Next, the indicators should be clearly and unambiguously defined, and be meaningful at the scale level considered. Furthermore, the procedures to assign values, classes or scores should be adequately described, be consistent with the indicator’s definition and appropriately tuned to the scale level considered. Finally, use of the defined indicators should be feasible, which means that for the majority of the aquifers concerned it should be possible to collect the data needed to assess the indicators. This feasibility criterion produces a particular challenge: wide applicability of the indicator should be reconciled with maintaining a relevant level of content.
During the design phase of TWAP (MSP), monitoring and evaluation requirements have been discussed during a number of general meetings, with – among others - the following conclusions:
Each water system working group (WG) should develop its indicators covering state, process, stress factors and taking into consideration the scientific, socioeconomic and governance issues with overarching impairment of ecosystems goods and services. It was also noted the need to link the indicators to ongoing regional and global processes and related political goals and targets such as the World Summit on Sustainable Development (WSSD) and the Millennium Development Goals (MDG).
The WGs were to consider a common approach for the scoring of the indicators taking into consideration the following approaches: numeric, arrow, traffic light, maps. It was suggested that harmonization of scoring should be further discussed.
A set of indicators for transboundary aquifers was presented already in the Methodology for the GEF Transboundary Water Assessment Programme (Volume 2) published in September 2011 by UNEP. Due to a number of changes in the boundary conditions for the forthcoming TWAP FSP, this set was critically revised and amended. The outcomes are presented below.
GEF-TWAP Methodology Transboundary Aquifers 50
10. Objectives
The set of indicators defined and developed for the purpose of TWAP Groundwater should serve the following objectives:
(i) capture the current state and projected trends of transboundary groundwater resources globally, as a basis for continuing, long-term monitoring.
(ii) allow a comparative assessment of transboundary aquifers (TBAs), in a region or globally, in terms of various parameters (quantity, quality, vulnerability, and others). These indicators and their integration into indices will in turn facilitate priority setting for GEF action and strategies.
(iii) monitor the evolution of these parameters over time, i.e. the status of transboundary aquifers, and hence provide an indication of the effectiveness of stress reduction measures being implemented by the GEF and by others.
11. Some points of departure for defining the set of indicators
11.1 Key aspects to be incorporated in the set of indicators
Given the range of potential transboundary aquifer management issues, the following categories of aspects are considered most relevant: (a) Characteristics that define or constrain the value of aquifers and their potential
functions:
Magnitude of the groundwater resources in terms of recharge and stored volume; water quality; accessibility (depth to groundwater and groundwater level); vulnerability with respect to pollution, or to climatic variation and climate change, etc. Relating these aspects to the number or specific requirements of (potential) users strengthens the message.
(b) Role and importance of groundwater for humans and the environment:
In particular reflected by quantities of groundwater exploited for different purposes (sectors), by the acreage of groundwater dependent wet ecosystems or phreatophytic agricultural land, by the magnitude of baseflow and spring flows and their relevance for different uses, etc.
(c) Changes in groundwater state:
Changes in stored volume and/or groundwater level (in particular depletion); changes in water quality (in particular by pollution).
(d) Most important area-specific drivers of change and pressures:
Demography (population density and growth, urbanisation, migration, etc); socio-economic development (changes in wealth, water use efficiency or water profitability, transition to economy with other water use intensity, etc); groundwater development stress (=abstraction/recharge); presence of active pollution sources (emissions).
(e) Enabling environment for groundwater resources management interventions:
Presence and quality of legal and regulatory frameworks for groundwater management at domestic levels and transboundary aquifer level; presence and quality of institutions at domestic levels and transboundary aquifer level for developing groundwater
GEF-TWAP Methodology Transboundary Aquifers 51
management plans and for implementing legal, regulatory, economic and other interventions; presence, nature and quality of monitoring networks.
(f) Implementation and impacts of groundwater management interventions:
Types and number of groundwater management interventions per unit of time (year); degree of stakeholder involvement; visibility of impacts and their ‘added value’, etc. It is believed that monitoring the efforts done is feasible, while monitoring impacts in an objective way may be too ambitious for TWAP Level-1.
11.2 Data for assessing TWAP groundwater indicators 39
Assessing TWAP groundwater indicators - using the type of data and information already specified in Part I and Part II - will be based on:
‘Newly’ acquired information through regional expert networks. This is expected to be the most important source of data and information. It draws upon the local knowledge of the experts involved, their access to other knowledgeable experts in their region, and their access to ‘grey’ literature and to databases that are only locally accessible. In principle, huge amounts of data/information could in this way be made available to the global groundwater community. A critical condition is that regional expert groups are properly developed and are motivated to do their job.
Existing databases that are globally accessible (e.g. via Internet). These may provide very useful information for some types of variables, for some other variables they are at most ‘second best’ due to limited incorporation of local knowledge. Relying too much on global databases includes the danger of recycling ‘old’ information with often limited verification in the field, and missing the opportunity of using TWAP for generating new flows of information. Where applicable, it should be ensured that there is coherence in the data sources across TWAP. This is e.g. the case in relation to climate and demographic data.
This may be complemented by:
“Synoptic” information generated by ‘new’ technologies (remote sensing, numerical models).
The variables that are relevant in this respect are listed in the Table 5 and Table 6. Chapter 2 and Annex 2 contain information on relevant global data sources specific for groundwater. No exact specifications can be given on the data sources to be tapped by the regional expert networks, as these may vary from case to case. Searching for relevant national and project databases, and for aquifer-related publications and reports certainly will be needed. Among remote sensing outputs, those of GRACE are certainly spectacular and valuable, but they are limited to a few aquifers in the world only. The information generated by models should be critically analysed in order to properly assess uncertainly in the model output, as they are not products of observation.
11.3 Indicator categories
As already stated in section 4.5, the proposed TWAP transboundary aquifers methodology will be focused on the following categories of indicators:
1) Current State Indicators40. These are related to conditions and processes as currently present or occurring. Some of these indicators relate to the aquifers’ physical and chemical 39
See also Part IV, as well as Parts I and II
GEF-TWAP Methodology Transboundary Aquifers 52
characteristics, such as (i) level of the water table; (ii) nutrient loads; (iii) health of groundwater-dependent ecosystems; (iv) extent of marine intrusion. Others, however, are focusing less on physical but more on human features, such as (v) socio-economic and (vi) legal- institutional attributes.
2) Projected Stress Indicators. These indicators intend to present a simplified prediction for the future, for the time horizons 2030 and 2050. The scores of these indicators will be based on extrapolation by simple models, using the present situation (Current State Indicators and underlying variables) as initial condition and expected trends of relevant key variables (e.g. demographic and climatic variables) as time-dependent drivers to enable projections of indicator scores over time.
12. Current State Indicators
A set of Current State Indicators, as evolved and modified from the set proposed in an earlier stage (See the above-mentioned Volume 2 Report, published in September 2011 by UNEP), is presented in Table 5.
A distinction has been made between two types of indicators:
(a) System indicators:
These relate to characteristics that are time-independent or weakly time-dependent, meant to contribute to a general aquifer characterisation, in addition to variables like name and size of the aquifer, names of the countries sharing it, aquifer thickness range, etc. The system indicators in principle are assessed only once, during the baseline assessment, although they may be subject to subsequent correction, if better data become available.
(b) Monitoring indicators:
These relate to time-dependent features and reveal changes that are relevant for defining the priority of investing in activities that aim for promoting the joint management of the individual transboundary aquifers considered. Assessing the monitoring indicators has to be repeated periodically after the baseline assessment. It is therefore important that these indicators and the way they should be assessed are defined in such a way that differences between successively monitored values are not due to differences in interpretation or observation method, but reflect real differences in the field.
Table 5 lists and specifies 20 indicators. Five of these are so-called ‘system indicators’ (see above) that need to be assessed only once. Of the remaining current state indicators (belonging to the category ‘monitoring indicators’), five are optional and ten are proposed to form the set of ‘core indicators’. Compared to the previous set of indicators, the new set of indicators is only slightly smaller in number (reduction from 27 to 20). However, a high degree of simplification has been achieved by eliminating a number of very complex indicators, reformulating part of the remaining ones and defining assessment approaches and ratings that are believed to be as simple and feasible as possible. The new indicators that were added have been formulated with the same attention for simplicity and feasibility.
40
In the July 2010 TWAP meeting in Geneva it was decided to abandon the formerly used distinction between
the categories of Status Indicators and Process Indicators. In order to avoid confusion, the newly merged
category is not called “Status Indicators” (as was suggested), but “Current State Indicators” as opposed to
“Projected Stress Indicators”.
GEF-TWAP Methodology Transboundary Aquifers 53
Further, considering the central role that IGRAC is expected to have in the continuation of the regular/periodic assessments of Transboundary Aquifers after the end of the TWAP FSP, much attention has been paid to ensure that the indicators build on and are fully aligned with the existing data structure of IGRAC.
GEF-TWAP Methodology Transboundary Aquifers 54
Table 7: Current state indicators with definitions, units and classification (10 core indicators in grey shading)
No Categories and indicator names
Type Priority Indicator definitions Units Classification/ scoring Remarks
1 - Defining or constraining the value of aquifers and their potential functions
1.1 Mean annual groundwater recharge depth
(mean annual recharge volume per unit of area)
System Core Long-term mean ground-water recharge, including man-made components (return-flows, induced recharge, artificial recharge), divided by area
mm/year 1. Very low: < 2 mm/yr
2. Low: 2 -20 mm/yr
3. Medium: 20-100 mm/yr
4. High: 100-300 mm/yr
5. Very high: > 300 mm/yr
Weakly time-dependent, but margin of uncertainty is greater than possible variations over time.
1.2 Annual amount of renewable groundwater resources per capita
Monitoring Core Long-term mean ground-water recharge, including man-made components, divided by the number of inhabitants of the area occupied by the aquifer
m3/yr/capita 1. Low: < 1000
2. Medium: 1000 - 5000
3. High: > 5000
Time-dependency mainly related to the number of inhabitants
1.3 Natural background groundwater quality
System Core Percentage of the area occupied by the aquifer where groundwater is found of which natural quality satisfies local drinking water standards
% 1. Very low: < 20%
2. Low: 20 -40%
3. Medium: 40-60%
4. High: 60-80%
5. Very high: > 80%
Suitability for drinking water used as criterion.
It is accepted that local drinking water standards may vary.
1.4 Aquifer buffering capacity System Additional Ratio between volume stored and long-term mean groundwater recharge (equivalent to mean residence time)
year 1. Low: < 10 years
2. Medium: 10 – 100 years
3. High: > 100 years
Mainly meant as a simple proxy for the aquifer’s resilience to climatic variability
1.5 Aquifer vulnerability to climate change
System Additional Extent of expected groundwater budget regime change in response to change in climatic
ordinal score
1. Low: confined aquifers containing only fossil water or receiving negligible recent recharge.
2. Medium: weakly recharged aquifers
Class 1 corresponds to ‘non-renewable groundwater’.
GEF-TWAP Methodology Transboundary Aquifers 55
conditions with limited interaction with other components of the hydrological cycle, due to location at considerable depth and/or hydraulic confinement.
System Additional Percentage of its horizontal area where the aquifer is considered moderately to highly vulnerable to pollution
% 1. Very low: < 20%
2. Low: 20 -40%
3. Medium: 40-60%
4. High: 60-80%
5. Very high: > 80%
Approximate criteria for “Moderately to highly vulnerable: “
> 0.3 in GOD method
> 100 in DRASTIC method
2 - Role and importance of groundwater for humans and the environment
2.1 Human dependency on groundwater
Monitoring Core Percentage of groundwater in total water abstraction for all human water uses.
% 1. Very low: < 20%
2. Low: 20 -40%
3. Medium: 40-60%
4. High: 60-80%
5. Very high: > 80%
Abstraction of water includes the quantity used and all losses.
2.2 Human dependency on groundwater for domestic water supply
Monitoring
(optional)
Additional Percentage of groundwater in water abstraction for domestic water use.
% 1. Very low: < 20%
2. Low: 20 -40%
3. Medium: 40-60%
4. High: 60-80%
5. Very high: > 80%
Abstraction of water includes the quantity used and all losses.
2.3 Human dependency on groundwater for agricultural water supply
Monitoring
(optional)
Additional Percentage of groundwater in water abstraction for agricultural water use (mainly irrigation).
% 1. Very low: < 20%
2. Low: 20 -40%
3. Medium: 40-60%
4. High: 60-80%
5. Very high: > 80%
Abstraction of water includes the quantity used and all losses.
GEF-TWAP Methodology Transboundary Aquifers 56
2.4 Human dependency on groundwater for industrial water supply
Monitoring
(optional)
Additional Percentage of groundwater in total water abstraction for domestic water use.
% 1. Very low: < 20%
2. Low: 20 -40%
3. Medium: 40-60%
4. High: 60-80%
5. Very high: > 80%
Abstraction of water includes the quantity used and all losses.
2.5 Ecosystem dependency on groundwater
Monitoring
(optional)
Additional Percentage of the aquifer’s area where the aquifer has a phreatic water level shallower than 5 m below surface
% 1. Very low: < 5%
2. Low: 5 – 10%
3. Medium: 10-25%
4. High: 25-50%
5. Very high: > 50%
Phreatic water level taken as a proxy
2.6 Prevalence of springs Monitoring Additional Total annual groundwater discharge by springs, divided by mean annual groundwater recharge
% 1. Very low: < 5%
2. Low: 5 – 10%
3. Medium: 10-25%
4. High: 25-50%
5. Very high: > 50%
Springs are very sensitive for changes in groundwater budget. Therefore a meaningful indicator of change.
3 – Changes in groundwater state
3.1 Groundwater depletion Monitoring Core Observed current rate of long-term progressive decrease of groundwater storage (accompanied by steadily declining ground-water levels), expressed as an equivalent depth of water averaged over the aquifer.
mm/year 1. Absent to very low: < 2 mm/yr
2. Low: 2 -20 mm/yr
3. Medium: 20-50 mm/yr
4. High: 50-100 mm/yr
5. Very high: > 100 mm/yr
Depletion should target a long-year trend; short-term variations due to climatic variability should be discarded.
3.2 Groundwater pollution Monitoring
(optional)
Core Observed polluted zones as a percentage of total aquifer area (due to pollution caused water quality to exceed drinking water quality standards)
% 1. Very low: < 5%
2. Low: 5 – 10%
3. Medium: 10-25%
4. High: 25-50%
5. Very high: > 50%
Local drinking water quality standards as a criterion.
GEF-TWAP Methodology Transboundary Aquifers 57
4 - Drivers of change and pressures
4.1 Population density Monitoring Core Number of people per unit of area on top of the aquifer
Persons/ km
2
1. Very low: < 1 p/km2
2. Low: 1-10 p/km2
3. Medium: 10-100 p/km2
4. High: 100-1000 p/km2
5. Very high: > 1000 p/km2
4.2 Groundwater development stress
Monitoring Core Total annual groundwater abstraction divided by long-term mean annual groundwater recharge
% 1. Very low: < 2%
2. Low: 2-20%
3. Medium: 20-50%
4. High: 50-100%
5. Very high: > 100%
Measure for the degree of modification of the groundwater budget (repercussions for outflow and storage)
Monitoring Core Existence, mandate and capabilities of institutions or institutional arrangements for managing the transboundary aquifer or SIDS groundwater under consideration (all types of interventions)
Scores 1. No institutions in existence that have the mandate and capability for TBA management or SIDS groundwater management
2. Such institutions do exist, but with limitations in mandate and/or capability for TBA management or SIDS groundwater management
3. Domestic agencies do exist that have
The institutions are not only in charge of the implementation of legal measures, but also of other aspects of TBA management or SIDS groundwater management (plan development, economic
GEF-TWAP Methodology Transboundary Aquifers 58
full mandate and adequate capabilities for TBA management or SIDS groundwater management
4. A special bi- or multi-national transboundary institution has been established with full mandate and adequate capabilities for joint management of the specific TBA.
(in case of SIDS: an institution has been established with full mandate and adequate capabilities for SIDS groundwater management)
measures and incentives, monitoring, etc.)
Note: Capabilities here interpreted in terms of staffing and budget (compared to needs)
6 – Implementation of groundwater resources management measures (In TBA or SIDS)
6.1 Control of groundwater abstraction
Monitoring Additional Current practices on the implementation of measures to control groundwater abstraction
3. Direct measures applied (licensing with strictly adhered criteria for granting or refusal)
4. Combination of indirect and direct methods applied.
Note: licensing systems that only require a licence fee to be paid after which a license always is granted should be rated as “no measures implemented”.
6.2 Groundwater quality protection
Monitoring Additional Current practices on the implementation of groundwater quality protection
Scores 1. No protective measures applied
2. Land use planning used as a tool for groundwater quality protection
3. Prohibition of the use or disposal of certain chemicals or waste
4. ‘Polluter pays’ principle applied
5. Combination of two or more categories of protective measures.
GEF-TWAP Methodology Transboundary Aquifers – Revised Version August 2012 59
Among these 20 indicators, two levels of priority have been indicated in Table 5. Ten of the indicators are so-called ‘core indicators’. Relevance and expected feasibility were the main criteria for assigning the status of core indicator to these ten. Strong efforts will be done to apply these ten core indicators to all selected transboundary aquifers and SIDSs (see next chapter). The other ten indicators – ‘additional indicators’ - are optional. If they can be assessed during TWAP, then they certainly will produce added value. However, if there are limitations in time and capacity, then priority will be given to the ten core indicators.
The proposed modified set is expected to be compatible with the modified boundary conditions for TWAP FSP, as mentioned before. Crucial for the assessment is the involvement of regional networks of groundwater experts familiar with the transboundary aquifers or SIDSs to be addressed. Global databases or other information sources accessible via the Internet may be used to obtain ‘default values’ for those variables (metrics) for which these networks are unable to produce the required inputs. With only a few exceptions (e.g. population density – indicator 4.1), the data in these databases generally cannot compete in reliability and accuracy with the data to be provided by the regional networks of experts, because they latter will incorporate much more local knowledge. An effort will therefore be made to collect as many data as possible through national and regional institutions and experts.
13. Projected groundwater stress indicators
Taking into account relevance at the one hand and feasibility at the other, out of the 10 core indicators described above, the following four have been selected as ‘projected stress indicators’:
Annual amount of renewable groundwater resources per capita (indicator 1.2)
Human dependency on groundwater (indicator 2.1)
Population density (indicator 4.1)
Groundwater development stress (indicator 4.2)
Naturally, all four belong to the monitoring indicator type. Estimated values for 2030 and 2050 necessarily are highly speculative.
It is useful to identify and explore the main factors responsible for change over time of these projected stress indicators. Below a quick appraisal:
Indicator 1.2 (Annual amount of renewable groundwater resources per capita)
The first factor is the annual amount of renewable groundwater resources (i.e. mean annual groundwater recharge). During the decades to come it will change due to climate change, but also due to direct human influences on the groundwater systems, e.g. by land use practices, urbanisation, groundwater abstraction (possibility of induced recharge), return flows of used water, artificial recharge and drainage.
The second factor is population density, but because the size of the areas remains constant this boils down to population growth. Databases do exist that produce projections of population statistics or population density anywhere on Earth. In some cases the change of groundwater recharge may be the dominant factor, but probably in the majority of the cases the factor population density dominates.
Indicator 2.1 (Human dependency on groundwater)
GEF-TWAP Methodology Transboundary Aquifers – Revised Version August 2012 60
Given the present level of total groundwater abstraction (in cubic metres per year) and its share in total blue water abstraction, first a prognosis of the expected time series of future groundwater abstraction has to be made and then this has to be compared to a prognosis of the evolution of water use from other sources. Each prognosis has to be based on a projection of total water demands and availability of surface water and groundwater as a function of time (both dependent on climate change but also on many other factors), comparative advantages/disadvantages of groundwater compared to surface water as a source of water, impacts of abstraction on water dependent ecosystem and other externalities, socio-economic feed-backs and adaptation, etc. In many cases it is extremely difficult to produce a reliable prognosis because of the dynamics of very complex systems with many poorly predictable factors involved. Most likely a reliable assessment of the indicator is only possible in some typical cases, e.g. if groundwater is the only source of water supply available (score 100%), if no groundwater is available at all (score 0%), or if water stress is sufficiently low and the socio-economic setting sufficiently stable to allow extrapolation of trends observed over the last few tens of years.
Indicator 4.1 (Population density)
This indicator is totally dependent on population projections. If these projections are available for the aquifer or SIDS considered, then the indicator can be assessed easily. Most probably the time horizon of TWAP goes beyond that of available projections, but even then fairly reliable estimates may be derived by extrapolating observed trends, taking into account the natural population growth, migration, urbanisation and other .
Indicator 4.2 (Groundwater development stress)
The two main inputs for assessing this indicator are (i) a time series of predicted groundwater abstraction until 2050 and (ii) a time series of predicted groundwater recharge until 2050. The first one has been discussed under indicator 2.1, the second one under indicator 1.2.
These remarks suggest that the feasibility of producing reliable predictions is generally not high, which may result in part of the outcomes being unsatisfactory. Feasibility is highest for indicator 4.1 and decreases progressively via indicator 1.2 and indicator 4.2 to indicator 1.2. Population projections are likely to dominate more than changes in aquifer conditions (directly as a component of the indicator or indirectly as an element in water demand projections). Demography being also a main driver for three other TWAP water system groups (namely, Rivers, Lakes and LMEs), it has to made sure that the same datasets will be used across the TWAP water system assessments.
GEF-TWAP Methodology Transboundary Aquifers – Revised Version August 2012 61
Part IV – INTERLINKAGES WITH OTHER WATER SYSTEMS
14. Interlinkages among water systems The international groundwater systems considered obviously have physical and other interlinkages with the other water systems considered in TWAP. The physical interlinkages are related to inflows and outflows of water and dissolved matter (components of the water cycle and other mass balances). Governance and socio-economic interlinkages exist as well, but are more complex.
Physical Interlinkages
Table 8 describes possible physical interlinkages that may exist between groundwater systems and the other water systems like rivers, lakes, LME and open oceans. These Interlinkages consist of inflow and outflows consist of volumes of water exchanged between the water systems with certain water quality (chemistry, temperature, biology).
Table 8: Inflows to and outflows from groundwater systems (only the five TWAP water type categories are considered)41
Receiving water systems
Groundwater Lakes Rivers LME Open Ocean
Supplying water systems
Groundwater - Groundwater discharging into lake
Groundwater discharge into rivers (contributing to baseflow)
Sub-marine groundwater discharge
Abstracted groundwater leading to global sea level rise
Lakes Lakes recharging underlying groundwater system
- - - -
Rivers Rivers recharging underlying groundwater systems
- - - -
LME Seawater intrusion
- - - -
Open Ocean El Niño like events affecting precipitation patterns and hence groundwater recharge
- - - -
In the Level 1 assessment, the regional networks of experts may be able to identify for each TBA and SIDS whether potential physical interlinkages exist with the other water systems 41
Atmosphere, soil, biosphere and human society (water use, waste and wastewater) are not taken into account.
GEF-TWAP Methodology Transboundary Aquifers – Revised Version August 2012 62
assessed within the framework of TWAP. This qualitative and boolean-type of assessment will be simply based on the mere existence of a physical connection between the water systems. For example, a deep confined aquifer like the Nubian Sandstone Aquifer System has no physical connection with the Nile River. The shallow and inland Iullemeden Aquifer System is connected to the Lake Chad, but has no interactions with West-African LMEs. On the contrary, some of the transboundary karst aquifers in the Balkan stretch out and are physically connected to the transboundary Adriatic Sea. The existence of these physical interlinkages, issues may transfer from one water system to the other. Actually two indicators are looking at these interlinkages: 2.5 the ecosystem dependency on groundwater and the 1.6 the aquifer’s vulnerability to pollution (like nutrients intruding the aquifer systems from recharge of polluted river water). While these interlinkages may be quantified with the indicators other interlinkages and transfer of issues from or to the groundwater systems to or from the other water systems may be described only qualitatively (like the potential decrease in river baseflow as projections may reveal significant future groundwater depletion in certain areas).
We propose that during the FSP executing cross-cutting working groups are informed that check the level of interconnections between systems and the identified transfers of issues between the.
14.1 Governance and socio-economic interlinkages
Obviously, the different water systems often fall within the same administrative boundaries of countries. Although there may be differences, socio-economic conditions and the governance structure for people that depend on, for example a lake system may be very similar to those being dependent on a groundwater system. The same case is assumed to be valid for the other water systems. Hence, it has been agreed that the socio-economic and governance indicators being assessed by the various water systems will be aligned as much as possible and feasible.
In the transboundary aquifer assessment the population density indicator will be used. Four of the five Working Groups use similar base data for population density and will use the same projections for 2030 and 2050. All working groups included a socio-economic indicator measuring people’s dependency on the water resources (and other ecosystem services) of the various water systems. Also in the transboundary aquifer assessment this dependency is measured (as the groundwater abstraction relative to the total water abstraction). Thirdly, all workings groups apply a type of vulnerability indicator (in this assessment the groundwater development stress).
This Groundwater Working Group adopted four governance indicators that are specific to groundwater resources management. There is similarity with other working groups in the sense that all indicators look at the existence and performance of governance structures. The latter is measured by the existence of implemented measures on the ground that address groundwater related issues.
Furthermore, the Groundwater Working Group will support and contribute to the application of the transboundary governance architecture methodology by the cross-cutting governance working group for case studies where there are clear biophysical connections between transboundary aquifers and one or more other transboundary water systems in a level 2 assessment (when financial resources become available). For this, a transboundary
GEF-TWAP Methodology Transboundary Aquifers – Revised Version August 2012 63
aquifer working group member will then be selected to be the representative to this cross-cutting working group.
15. Input-Output Analysis In spite of the physical inflows and outflows of volumes of water being conceptually simple, input/output analysis on the inflows and outflows between transboundary groundwater systems and other transboundary water systems during the baseline assessment (Level 1) does not seem feasible in most cases. This is because all data are lumped over the systems considered and because of the fact that the systems tend to be neither perfectly serially arranged, nor to have common boundaries. As a consequence, part (but not all) of the groundwater recharge produced by a certain transboundary river basin A may feed transboundary groundwater system B that - in turn - may contribute to baseflow in river basin A, but also to baseflow in other (non-transboundary) river systems. Likewise, groundwater system B may contribute to water storage and water quality of LME C, but the total inflow to this LME is likely to include many non-transboundary terrestrial water systems as well. As long as a clear and exclusive one-to-one relation is missing, it is not possible to carry out an input/output analysis on the basis of lumped data. This type of analysis can be carried out only in more detailed groundwater studies (pilots in the framework of the Level 2 assessment), if conditions are favourable, in particular in terms of data availability.
GEF-TWAP Methodology Transboundary Aquifers – Revised Version August 2012 64
Part V – DATA AND INFORMATION MANAGEMENT
- Data collection, handling, storing and distribution –
16. Background This part of the report looks at the TWAP groundwater assessment from the information management’s perspective. It is clear that the assessment is going to be based on large amounts of data and information and that it will produce even larger amounts of both. From one TBA and /or SIDS to the other data and information sources will likely differ. Moreover, the regional networks of experts, which are paramount in developing the indicator values, may have different interpretations of what data and information is requested from them by TWAP. In order to assess the TBA and SIDS as much as possible in a consistent way, the flow of data and information needs to be harmonized and streamlined as much as possible. In other words, use of an information management system in TWAP is paramount.
In this part of the report, the words data and information are often used. We define data as the raw measurements of property values of systems. Interpretation of that data leads to information. In that sense, the indicators to be used here are information as they are based on analysis of other data. On the other hand, the indicator values will be inputted into a multi-criteria prioritization and are as such data.
The information management system enables us to collect, store, analyze and share data and information on the TBAs in a consistent way. The approach to be followed is such that it is simple and transparent to understand how information is flowing from the stage of input to the final stage of outputs. Furthermore, the systematic approach enables us to replicate and repeat the various assessment steps in a consistent way. Moreover, the system is extendible such that possible future assessments can be added easily.
17. Information management system components The information management system consists of three components (Figure 7):
1. Data and information.
2. ICT-technology
3. Processes and protocols
Data and information
This component consists of all data and information that are used in the assessment as a reference and source, interim products and the final products on which GEF will base the prioritization. This component can be in the form of datasets with geospatially-referenced data (GIS-layers), tabular data with indicator values per TBA and SIDS, descriptive data and images with e.g. aquifer profiles and pictures.
The information system will also contain meta-information per data type. This meta-information describes how the data was generated, based on what data, by whom, etc. The various data products of this TWAP TBA and SIDS assessment are discussed in more detail in section 4.
GEF-TWAP Methodology Transboundary Aquifers – Revised Version August 2012 65
Figure 7: Information management system components
ICT-technology
This component consists of software that enables storing, processing and visualizing and combining various types of data and information (geo-referenced maps, tabular data, images and descriptive texts. The software allows for (geospatial) processing of data (e.g. aggregating high resolution data to a single value per national TBA segment or SIDS) and easy querying of maps and tables.
By storing all available data on a server of a designated organization, all information can be made accessible to various audiences via web-based interfaces.
Processes and protocols
Many different regional expert groups and regionally or globally working groundwater related organizations are going to contribute to this assessment, possibly providing data and information with some intellectual property condition. The final result of the assessment will be a prioritization by GEF to allocate their financial resources and hence the interests of various inputting groups may be high. Because of this, it is of utmost importance that all contributing groups are informed on and agree with the processes and protocols of how this assessment is conducted. These processes and protocols include, amongst others, how the data and information provided is stored, processed and shared.
The bulk of the data is assumed to be coming from the various TBA and SIDS regional networks. It is important that the organization where the data is stored (and likely doing part of the processing) can provide data security. The organization should be trusted by the various networks, persons and countries that are going to contribute to the assessment.
As stated above, the information system will contain source data, interim products and the final products plus meta-information on the algorithms used to develop the indicator values. This full transparency provides the possibility to the contributing partners to check their inputs. It improves confidence in the data integrity and soundness of the assessment.
Processes and protocols
ICT-system
Data and information
Inputs Outputs
GEF-TWAP Methodology Transboundary Aquifers – Revised Version August 2012 66
Another important aspect of using the same set of rules is that it will lead to a consistent assessment of all TBAs and SIDS and that the data and information in the system is harmonized as much as possible.
The web-based accessibility of the assessment results is assumed to provide an incentive to the contributing partners. Results of the regional network’s efforts will be displayed in attractive maps and tables. The querying and GIS functionality of the information systems enables further analyzing of their TBA or SIDS and comparing it with others. In the meta-information contributing partners will be acknowledged which forms another type of incentive.
18. Information management system steps From the information management’s perspective, this assessment has four steps: (i) Input, (ii) Data handling, (iii) Database, and (iv) Output.
The TWAP Groundwater assessment Information flow chart (Error! Reference source not found.) depicts these four basic steps. The figure shows that assessment as a flow of information from the stage of input to output. It provides an operational workflow of activities to be carried out to make this assessment concrete.
Input
The information management system serves as the technical backbone of the assessment. As long as the data and information has not been harmonized, digitized and checked it is considered as inputs. In this step, inputs will be delivered by TBA/SIDS networks in the form of filled in questionnaires based on their collected source data and from various global data sets. At this stage, many organizations will be contributing their data, information and knowledge to the assessment. A TWAP Groundwater core team of persons coming from various organizations is going to prepare and coordinate this step.
Data handling
In second step, the inputs will be processed. This processing includes digitizing of maps and profiles in GIS-layers and images, developing indicator values for each TBA/SIDS based on questionnaires and global data sets. Data is checked on consistency and correctness. It is assumed that this data handling is conducted by the designated (neutral) organization experienced in this type of geo-data handling and supervised by the TWAP groundwater core team.
It is true that the regional networks of experts will need to do substantial data handling too. They need to interpret and analyze various sources of information to be able to complete the questionnaires. However, this is a different type of data handling than meant here. The data handling meant here is a necessary step to be able to compare all the various individual inputs from the potentially hundreds of assessed TBAs and SIDS.
To make this data handling step as simple and lean as possible, questionnaires with strict formats will be used. The networks can be send digital forms where they can input their descriptions and estimates of indicator values in certain data entry slots. Such forms can be uploaded automatically into the database reducing the risks of data transfer noise.
Database
The database infrastructure will need to be created by the designated organization, and only filled in at this stage. It is assumed that this database will be on computer server of the
GEF-TWAP Methodology Transboundary Aquifers – Revised Version August 2012 67
designated organization. Database maintenance and updating is one aspect that has to be agreed upon from the very start of the assessment. This is an ongoing activity with associated costs, even long after the initial assessment has been carried out.
Output
The final step of the assessment is to generate those products that GEF needs in order to be able to do a prioritization. At this moment, it is assumed that the actual prioritization is carried out by GEF and not by the TWAP Groundwater core team. Possible end products or outputs that may facilitate GEF carrying out this task are info sheets per TBA and SIDS. Also global maps and tabular data showing all TBAs and SIDS and allowing for multi-criteria weighting of indicator values are assumed to be useful tools.
The exact forms and types of the final products should be based on GEF’s needs and hence discussed with them. The outputs as shown here could be assessed via a special dedicated website. Hardcopy versions of the various products are another obvious option.
The results of this assessment will be very useful for many more stakeholders besides the GEF. It has to be agreed with GEF to what extent these other stakeholders are allowed to use the data and information generated.
19. The flow of information in the assessment In this subsection, the various components of the flow of data from the input stage to the output stage are discussed in more detail.
TBA/SIDS specific source data
It is assumed that for each TBA and SIDS relevant data exists on the hydrogeological socio-economic institutional and legal status of the system. This data may include various kinds of maps, reports, monitoring networks, census data. In some cases, even remote-sensing studies and computer modelling results may be available. Often the source data will be country-bound. Hence, data sources of the various national segments of TBAs are likely going to differ.
One has to accept that the amount and accuracy of the data to be used for the TBAs across the world will be diverse.
Regional TBA/SIDS networks
The regional networks of experts and SIDS form an important step in harmonizing the diverse set of data sources with different quality into information that can be included in the assessment.
GEF-TWAP Methodology Transboundary Aquifers – Revised Version August 2012 68
Figure 8: TWAP Groundwater assessment information flow chart
GEF-TWAP Methodology Transboundary Aquifers – Revised Version August 2012 69
Questionnaires
The most important instrument in this harmonization process is the questionnaire. The questionnaire will generate descriptive information, maps and hydrogeological profiles and tabular data with estimates of the indicator values. Crucial for the streamlining of the assessment is that the questionnaires have a pre-set format.
Besides, clear instructions will be given to TBA/SIDS Regional networks on how to calculate and determine the various indicator values (see section 3.2.5). One of such instructions deals with what features to include on the maps and in the profiles. Figure 9 shows a dummy that might be used by the regional experts as an example to sketch the hydrogeological maps for their own TBA and or SIDS.
The map should include information on:
Aquifer delineation and national boundaries
WHYMAP classification on type of aquifer and level of recharge
Major recharge and discharge zones
Location of hydrological features such as rivers and lakes
Presence and location of groundwater dependent ecosystems
Locations (hotspots) of priority and emerging issues and concerns such as groundwater over-abstraction, salinisation, and pollution. A similar systematic approach needs to be taken as well for the profiles.
GEF-TWAP Methodology Transboundary Aquifers – Revised Version August 2012 70
Figure 9: Dummy map of TBA with possible legend; the depicted legend is largely based on the WHYMAP legend
Global data sets and model outputs
One way to overcome the issue of having varying data sets across national boundaries is using datasets with global coverage. Various global datasets having information on change in groundwater storage (GRACE), groundwater recharge (from global hydrological models), groundwater abstraction (Utrecht University, irrigational (ground)water use (FAO, IWMI), Aridity Index are considered useful for the TWAP assessment. Often such datasets have spatial resolutions of 1 to 0.5 degree.
Processing/digitizing
Data and information coming from the questionnaires need to be in a digital format to be able to include it in the database. As mentioned earlier, the questionnaires will be formatted such that the information inputted by the regional experts meets requirements for easy uploading into the database. Other information might still be in non-digital form such as sketches of maps and profiles. Ideally, maps are digitized and developed into GIS-layers. This activity is done by the designated organization.
Processing/aggregating
It is agreed to use the national segments of TBAs as the spatial unit in this assessment. Indicators values used in the assessment are thought to be representative for such national segments. However, some of the data and information provided may still be in a more detailed resolution and hence aggregation of this data to national segment values is needed. Algorithms for this aggregation will be developed. This activity is done by the designated organization.
Check
Before the data is actually stored in the database, it is tested on consistency, correctness, completeness and database requirement compliance. If data fails to meet these tests, it will be tried to improve it with the help of the regional networks. Clear rules should be developed what requirements needs to be met and how information is used when requirement are not met. This activity is done by the designated organization.
Database
Data and information is stored in a central database. The database is stored as GIS-layers with attribute tables. Some of the attribute tables will contain the indicator values per national segment of the TBA’s and per SIDS. Other attribute tables contain the descriptive information. In addition images will be stored. The database is developed, updated and maintained by the designated organization.
TBA /SIDS Info sheet
These info sheets provide a quick, easy to interpret overview of each assessed TBA and or SIDS. A dummy version of such info sheet is shown in Figure 10: Dummy TBA Info sheet.
Reference Layer Info sheet
These info sheets provide an quick, easy to interpret overview of reference data and information that is used in the assessment
Web application
GEF-TWAP Methodology Transboundary Aquifers – Revised Version August 2012 71
The web application provides access to the database, its derived products and meta-information. One of the features of this application will be a navigational world map containing all assessed TBAs and SIDS. GIS-functionality like zooming, panning, identification and querying allow easy comparison and analysis
Downloadable data
Data will to some extend be downloadable for a number of stakeholders.
Figure 10: Dummy TBA Info sheet
20. Organisational information management structure
The TWAP groundwater workgroup’s intention is to build the TWAP groundwater database based on earlier experiences and existing databases and information management systems within the ISARM programme. It makes sense that the TWAP assessment inputs coming mainly from these same ISARM groups is going to contribute to these existing databases.
IGRAC has been initiated by the international groundwater community (initiated by UNESCO and WMO with strong support form UNEP and IAH) as the centre for global data and information on groundwater resources. IGRAC has the rather specialized knowledge and expertise to develop such an groundwater-related information system and is able to serve as such a centre not just for the duration of the TWAP FSP but on a permanent basis. IGRAC has proven is usefulness in various ISARM projects, developed information management systems and has built networks with various partners in the field of international aquifer management. Fragmentation of this role of global groundwater information centre over multiple organizations has the risk to confuse the partners in the existing networks and reduce their commitments to contribute to the Groundwater TWAP. Assigning this task to UNEP Grid probably would need investments to obtain the same level over groundwater-specific knowledge.
Within the TWAP MSP, it is also agreed that there is a need to have a central platform to coordinate the data needs of the whole TWAP including the assessments of the rivers, lakes, groundwater, SME and open oceans. UNEP, the executing agency for the TWAP FSP, will coordinate this using the existing networks such as the NEWS model, DHI, IGRAC, GRID centres and also possible links with the GEF-IW:LEARN project. It is, however, emphasized that the GEF data portal could not replace other existing information systems with a focus on specific water systems like the TWAP Groundwater database to be developed by IGRAC.
GEF-TWAP Methodology Transboundary Aquifers – Revised Version August 2012 72
Part VI – TOWARDS IMPLEMENTATION OF THE ASSESSMENT OF TRANSBOUNDARY AQUIFERS
- PARTNERSHIP AND EXECUTION ARRANGEMENTS -
TWAP Groundwater Component
21. Validation A peer review session to validate the TWAP transboundary aquifers methodology was carried out during a side event at the ISARM2010 International Conference: "Transboundary Aquifers: Challenges and new directions", that was held at UNESCO HQs in Paris, on 8 December 2010.
The comments received were related to two main issues:
(i) The number of indicators was considered too high, which led to a discussion regarding their feasibility and applicability considering limited data availability. This comment was addressed by introducing two different categories of indicators in the present final version of the methodology document: “Core indicators” to be applied for each transboundary aquifer or transboundary aquifers system throughout the level 1 assessment and “Priority indicators”, that are more complex and require more data and will be used for the level 2 assessment in selected transboundary aquifers or transboundary aquifers systems only.
(ii) It was highlighted that mercury is an element not relevant to groundwater quality globally. It was suggested that the groundwater methodology should consider using arsenic instead.
These comments have been taken into consideration and have been included in the methodology. Following the approval of the TWAP Full Size Project, the methodology needed to be revised and adjusted in order to meet the requirements of the donor. This updated version of the document represents the final version of the methodology that will be applied in the framework of the TWAP FSP.
22. Partnership Arrangements As one of the outcomes of the GEF Medium Sized Project “Development of the Methodology and Arrangements for the GEF Transboundary Waters Assessment Programme (TWAP)” UNESCO-IHP in its capacity as lead agency for the TWAP Transboundary Aquifer and Groundwater component launched the establishment of the the TWAP Groundwater Coalition, a partnership of institutions and organizations at national, regional and global level.
The members of the Groundwater Coalition are committed to
(i) carry out and co-finance the GEF funded TWAP baseline assessment adopting the methodology and modalities defined as a result of the TWAP design phase (MSP), and
GEF-TWAP Methodology Transboundary Aquifers – Revised Version August 2012 73
(ii) explore ways to carry out long term periodic follow on assessments and monitoring with non-GEF resources in order to ensure the sustainability of TWAP’s Groundwater.
The Groundwater Coalition consists of three categories of partners based on their specific roles and functions:
1. The Core Group, led by UNESCO-IHP, and consisting of IGRAC, FAO, UN WWAP, and the global network of UNESCO water related centres and chairs
2. Regional Coordinators and Expert Networks
3. Key providers of expertise and data
Partners will benefit from the coalition by broadening the knowledge of transboundary aquifer systems, new partnerships and cooperation established, and having access to the data and information management system. Given the objective of TWAP to provide a basis for science-based allocation of financial resources (GEF and other donors) to priority transboundary aquifer systems, countries and regions will benefit from increased transparency in funds allocation.
Members of the core group and many of the other partners are co-operating already in ongoing transboundary aquifer projects and programmes (e.g. ISARM, GEF-funded projects). TWAP may benefit from their existing co-operation arrangements.
The proposed composition of the TWAP Groundwater Coalition is displayed in Figure 11. The circles represent (from inner to outer circle): (i) UNESCO-IHP led core group; (ii) regional coordinators and expert networks; (iii) providers of data and additional expertise.
1. TWAP Groundwater Core Group
The core group has a central role in guiding and coordinating the TWAP groundwater coalition to successfully execute the global baseline assessment, as well as the periodic follow-up assessments in the future. Consisting of the main players in the field of transboundary groundwater resources assessment and management globally, the Core Group will have overall responsibility and directly perform parts of the assessment. It will appoint a Project Manager and establish cooperation schemes and liaise with key partners.
Falling back on a wide array of ongoing cooperation and joint activities with numerous partners, the core group provides the main pillars of the TWAP assessment through programmes such as the Internationally Shared Aquifer Resources Management (ISARM) Initiative, the World-wide Hydrogeological Mapping and Assessment Programme (WHYMAP), the United Nations World Water Assessment Programme (WWAP) and its triennial World Water Development Report (WWDR), high resolution global data sets on soils, landuse and irrigation from FAO’s AQUASTAT and other related programmes, and IGRAC’s Global Groundwater Information System (GGIS) as well as the Global Groundwater Monitoring Network.
2. The Regional Coordinators and Expert Networks
Regional partners will contribute to the assessment with regional coordination mechanisms already in place. They will guide the acquisition of data on transboundary aquifers through regional expert networks and may facilitate the organization of regional expert meetings and workshops. Regional partners may also serve as data providers, having conducted previous studies and/or assessments at regional scale or by
GEF-TWAP Methodology Transboundary Aquifers – Revised Version August 2012 74
providing access to existing data and local information systems. Whenever feasible, the regional coordination and the promotion of country involvement will be entrusted to Regional Organizations such as OAS, SADC, UNECE, UNECA, UNESCAP, UNESCWA, UNECLAC, OSS, SPC, ECOWAS, IGAD, SADC and ECCAS, and others.
Figure 11: Proposed composition of the TWAP Groundwater Coalition, with the groundwater core group and associated entities and networks42. The circles represent (from inner to outer circle): (i) UNESCO-IHP led core group, (ii) regional partners and (iii) providers of data and additional expertise.
42
The listing of organizations and institutions is not meant to be exclusive, but represents the current state of
development of the Groundwater Coalition. More partners are likely to be added during the process. A formal
commitment of partners will be requested during the FSP preparation phase.
GEF-TWAP Methodology Transboundary Aquifers – Revised Version August 2012 75
3. Providers of Data and Additional Expertise
This category includes organizations or institutions at local, national or regional scale operating databases or information systems relevant to TWAP/Groundwater, and those that may provide additional useful information on the subject. This encompasses universities, and research institutes from developing and developed countries, geological surveys, international associations, and non-governmental organizations (NGOs), among others. In particular with regard to the Task Force on remote sensing and modeling aimed at filling data gaps and generate harmonized data at global or regional scale, this group of partners will have a central role. Besides the hydrogeological, technical or environmental expertise, the provision of expertise on socio-economics, legal and institutional issues will be of great important in the framework of TWAP-Groundwater.
Key partners may not pertain to only one of the above mentioned categories but serve as regional partner, provider of data and provider of expertise at the same time.
23. Execution Arrangements The Execution structure and arrangements of the TWAP Transboundary Aquifers and Groundwater component are displayed in Figure 12.
Core GroupOverall Coordination and Oversight
UNESCO IHP, IGRAC, WWAP, FAO
Regional Coordinators and Expert Networks
(inventory, characterization, indicators)
OAS, SADC, UN Economic Commissions, others
Task Force on Remote Sensing and Modeling
&Information
Management System
IGRAC
Advisory Panel
Key Expertise and Data Providers
IAH, Geological Surveys, NGOs, Academia
Countries
Figure 12: Execution structure and arrangements of the TWAP Transboundary Aquifers and Groundwater component.
GEF-TWAP Methodology Transboundary Aquifers – Revised Version August 2012 76
The Information Management System will be organized and managed by IGRAC and will provide the backbone of the TWAP assessment through efficient data and information management, allowing for storing, managing and visualizing the data gathered for TWAP.
In addition to the gathering of existing data at global scale, TWAP-Groundwater will also work towards filling data gaps by applying state of the art earth observation technology and modeling techniques. For this purpose a Task Force on remote sensing and modeling will be established and managed by IGRAC.
The TWAP-Groundwater Advisory Panel will consist of individual experts in hydrogeological, socio-economic, legal and institutional aspects (IAH, Geological Surveys, Academia, etc.) and will provide advice and support to the Core Group in view of the overall coordination of the assessment.
GEF-TWAP Methodology Transboundary Aquifers – Revised Version August 2012 77
GEF-TWAP Methodology Transboundary Aquifers – Revised Version August 2012 78
Annex 2: Data & Information Sources The two main sources of information for the TWAP Groundwater are:
accessible global information sources,
information sources to be used by regional expert networks
Global information sources
This first group contains information and data on relevant groundwater parameters with often a full global coverage. These data sets are derived by various techniques such as global assessments (like Aquastat, IGRAC’s GGIS and GGMN, UN WWAP), satellite-based remote sensing (like GRACE) and or global hydrological modelling (like WaterGap)
The advantage of these global information sources is that they provide a boundary free and consistent dataset covering all the TBAs and SIDSs. These datasets are relatively easily and freely accessible and can often be derived from the internet in digital formats. The global data generated by Remote Sensing and results from global hydrological models are not ‘owned’ by countries. Using such data may overcome the problem of getting no access to the often nationally organized conventional data.
A disadvantage of using such global datasets is the low spatial resolution (pixels of 0.5 degree). In case of small TBAs and SIDSs, indicators need to be based on few or even only one pixel value. A second disadvantage of using global Remote Sensing and modelling information is that they need to be ground-truthed and calibrated. Table 1 contains a list of most relevant global information sources. A number of them is discussed in more detail.
Table 1: Main global groundwater-related Information sources
2 AQUASTAT; - Land use and population - Climate and water resources - Water use, by sector and by source - Irrigation and drainage development - Environment and health - LADA, World Land Use Map (WLUM)
Food and Agriculture Organisation (FAO)
http://www.fao.org/AG/AGL/aglw/aquastat/main/index.stm http://maps.howstuffworks.com/ LADA information: http://www.fao.org/nr/lada/index.php?option=com_content&task=blogsection&id=4&Itemid=158 World Land Use Map (WLUM) Global map of irrigation areas
3 FAOSTAT - Land Use and Irrigation, Fertilizer and Pesticides statistics
Food and Agriculture Organisation (FAO)
http://faostat.fao.org/
4 GEMSTAT - Surface and ground water quality data sets
GEMS Water, UNEP
http://www.gemstat.org/
5 Global precipitation analysis Global Precipitation Climatology Centre (GPCC)
GEF-TWAP Methodology Transboundary Aquifers – Revised Version August 2012 80
Ad 2: AQUASTAT, FAO’s information system on water and agriculture and FAO’s atlas of water resources used for irrigation at river basin and country scales provide valuable information for the development of groundwater resources abstraction indicators.
Ad 7: IGRAC (UNESCO-WMO groundwater centre) has produced global groundwater indicator maps (groundwater abstraction as a percentage of average groundwater recharge, total exploitable non-renewable groundwater resources / annual abstraction on non-renewable groundwater resources, dependence of agricultural population on groundwater) for the UN WWAP and the UNESCO IHP project on development of groundwater resources sustainability indicators. Furthermore, IGRAC’s Global GIS includes world-wide coverage of many variables and indicators of potential relevance for the TWAP Groundwater.
Ad 15: UNESCO’s WHYMAP provides a global picture on the location, characteristics and lateral extent of 98 main transboundary aquifers or groups of aquifers. Other UNESCO-IHP regional maps and databases complement WHYMAP’s synoptic global maps with more detailed information, including maps, organized at the regional level. The WHYMAP groundwater resources map (2008) also shows mean annual recharge based the global water GAP model (Döll & Fiedler, 2008). In addition, hotspots of unsustainable groundwater abstraction or groundwater mining are shown, as well as assumed groundwater-dependent ecosystems.
Ad 18: The ISARM Project, UNESCO IHP: More than 270 transboundary aquifers have been identified so far. Approaches followed include many similarities, but there are substantial differences in the degree of aggregating subsurface hydrogeological units into the transboundary aquifer systems. Moreover, horizontal transboundary aquifer system limits are available for not more than one-third of the mentioned number of aquifers.
Within the framework of the UNESCO IHP VII phase, IGRAC has prepared an updated version of the world map of transboundary aquifers, presented at the 5th World Water Forum at Istanbul, in March 2009. The preparation of such a map is a time-consuming activity and requires the participation of experts from different regions and from the UNESCO network. Various methodologies have been used on different continents to define TBAs, however, this needs additional harmonization to be able to compile a new homogeneous world map on TBAs.
Ad 19: IGRAC is establishing the Global Groundwater Monitoring Network (GGMN) aiming at using monitored groundwater data for a periodic assessment of the global groundwater resources. It is expected that the periodic assessment will bring a new insight into the state of global groundwater resources, their dynamics and impact of various human activities and the climate change on quality, quantity and regime of groundwater resources. IGRAC intends to collaborate with the remote sensing (GRACE) and global hydrological models communities to couple the application with other groundwater observation sources.
GGMN’s purpose is not to collect “raw data” but to take advantage of the national expert’s knowledge to share “aggregated data” (1 degree cells). The aggregated data and information are stored in a database and the country expert retains the control of the country data. This way often disputed “delivering” of data to an international organisation is weakened if not completely dismissed.
GGMN will initially focus on collecting groundwater parameters that are less difficult to retrieve: groundwater levels and EC. At a later stage, additional groundwater parameters like abstraction data and quality data can be collected. GGMN will be an open access tool free to be used by anyone. GGMN is or is proposed to be embedded in several international water programs/networks like IGWCO, GEO, GTN-H, Graphic, AEGOS and WWAP.
GEF-TWAP Methodology Transboundary Aquifers – Revised Version August 2012 81
Ad 20: Various global hydrological models were developed in the recent decades (e.g. Water GAP by Frankfurt University, PCRGLOBWB by Utrecht University). These models often have a focus on surface runoff and do not model groundwater flow explicitly. However, such models do estimate groundwater recharge and base flow. Spatial resolutions are 0.5 degree and temporal resolutions are typically months or days. Dr. Wada (Utrecht University) developed a method where IGRAC’s GGIS-country statistics for groundwater abstraction are downscaled to 0.5° based on total water demand.
Ad 21: Groundwater data collected by various satellite remote sensing programmes (e.g. GRACE, ESA, WHYCOS-World Hydrological Cycle Observing Programme, IGOS-Integrating Global Observing System, IGWCO-Integrated Water Cycle Observation) with the recent advent of spatially discrete and high-resolution Earth systems data sets, significantly support groundwater database for deriving TWAP groundwater indicators. These digital products are often global in domain, are spatially and temporally coherent, and provide a consistent, political ‘boundary-free’ view of major elements defining the terrestrial water cycle, inclusive of groundwater. However, space-based groundwater data should be calibrating and validating according to the data acquired from terrestrial observation.
GRACE measures changes in the earth’s gravity field and is therefore useful to detect changes in the earth’s total water column. The groundwater part of this water column is obtained by removing ice caps, soil water, surface water and atmospheric water mass terms. These terms are often estimated using models (e.g. GLDAS for soil water) or other remote sense data and often have a large level of uncertainty. Therefore, although GRACE is increasingly used to observe trends in groundwater storage, caution is advised on the reliability of the results. Both due to processing technologies and due to assumptions made in the process.
Ad 22: Data sets for SIDS follow the same methodology as outlined below for transboundary aquifers. Information is available through UNESCO’s Sustainable Living in Small Island Developing States Programme and is available via the UNESCO Portal.
Ad 23: Many useful global groundwater related data sets and maps are available in the recently published book “Les eaux souterraines dans le monde” (Margat, UNESCO-BRGM 2008).
Information sources to be used by regional expert networks
This groups contains sources of information like:
Hydrological and geological maps and reports at aquifer, regional and national scales
In-situ measurements from terrestrial monitoring networks and various kinds of surveys (observation wells, borehole descriptions, geophysical bore logs, geophysical methods)
Results from regional groundwater and hydrological modelling studies
Satellite-based and airborne remote sensing studies
These sources of information are diverse and will differ in scope, details and even existence from one TBA or SIDS to another. This diversity provides a main challenge for TWAP Groundwater across TBAs and SIDSs. How to harmonize the results from the various regional assessments carried out by the regional expert networks?
GEF-TWAP Methodology Transboundary Aquifers – Revised Version August 2012 82
In this respect, it is worthwhile mentioning that some of the TBAs are already assessed in detail within the frameworks of ISARM and GEF International Waters. Both programmes provide frameworks, guidelines and methodologies for TBA delineation, characterisation and diagnostics. It is assumed that results from the ISARM and GEF IW TBA studies are relatively easily comparable. For the TBAs that have not already been assessed in the ISARM and GEF frameworks, the regional expert networks will face the challenge that most of the information is organized nation-wise and hence needs cross-boundary harmonization and interpretation.
A global information system that may assist in this respect is WHYMAP’s Web Mapping Application that contains a large number of national and regional hydrogeological maps43).
Data collection and projection methods:
1. Groundwater quantity
Projected groundwater stress indicators will be based on extrapolation of globally, regionally and country available groundwater data from terrestrial observations and remote sensing (satellite and air-born based) measurements, its assessment (considering present situation as initial conditions) and its use for different types of simulation and forecasting models. Existing data as well as data measured in future will be explored, evaluate and use for models calibration and validation. Development of models based on theoretical assumptions, not considering existing databases (in which will be collected every year longer time series data) will be reflected in low credibility of the model results obtained.
Terrestrial measurements: climatic, groundwater and surface water data from existing monitoring networks (precipitation, temperature and other climatic data, groundwater level and spring discharge data, surface water flow and discharge data) are monitored on countries national or state monitoring networks, transboundary aquifers geological and hydrogeological maps provide data about e.g. aquifer geometry, rocks permeability, groundwater flow net, and relevant data are available on soil and land use maps, and r risk maps (e.g. inundation areas).
Remote sensing measurements: spatial resolution and lower accuracy satellite based measurements, inclusive the most promising gravimetric and radar altimetry methods are very useful however, do not provide yet accurate data for groundwater level fluctuation and storage evaluation. Space-based data have to be therefore calibrated and validated according to the data acquired from in-situ terrestrial observations. It may be expected that in future decades development of satellite methods enlarge possibilities for more accurate groundwater detection. Various international satellite based programmes (e.g. WHYCOS – World Hydrological Cycle Observing Programme, IGWCO – Integrated Water Cycle Observation, IGOS – Integrating Global Observing System, GRACE – Gravity Recovery and Climate Experience, GOCE Gravity Field and Steady –State Ocean Circulation Explorer) provide spatially and temporally coherent time series data at the global and regional level and political boundary free view of major elements defining the water cycle. With respect to groundwater the most promising is GRACE mission implemented particularly in studies focused on assessment of variations in groundwater storage and their comparison with groundwater levels changes measured in monitoring wells. Low spatial and temporal resolution and uncertainty in groundwater level measurements in order of tens centimetres is registered for aquifers with spatial extent lower than 150,000 km2. Satellite imagines of
GEF-TWAP Methodology Transboundary Aquifers – Revised Version August 2012 83
vegetation cover, land use and soil type in recharge areas and their topography provide data useful for e.g. groundwater recharge evaluation.
Geophysical methods provide useful data for TWAP groundwater both for identification and characterization of transboundary aquifers. They are effective if markedly contrast between the rock environment, groundwater body and pollution plume exists. Ground gravimetry and magnetometry as well as aerial aeromagnetometry and aeroradiometry are commonly employed for studying fracture aquifers and tectonically disturbed zones exhibiting high fracture porosity. Continuous electromagnetic profiling measurements with high lateral resolution and resistivity methods with high vertical resolution are most frequently used for detecting aquifers geometry and spatial extent as well as pollution plume and its movement. However, other geophysical techniques are also applied, such as magnetometry and electromagnetic induction for e.g. identification of point pollution undergrounds spills or borehole logging methods for e.g. detection of groundwater – saline water interface. Airborn electromagnetic techniques for identification and characterization of aquifers has been presented by J. Nijman on Utrecht workshop. Geophysical methods support in many countries hydrogeological investigation and ground water related geophysical measurements and data will be very useful for development of indicators presenting initial hydrogeological conditions as a base for development of projected indicators.
Models: There are several simulation, forecasting, pollution transport and other types of models which can be used for development of projected groundwater stress indicators. However, groundwater related models have several limitations and their calibration by use of time series data acquired from terrestrial measurements is pointed out. Several models have been proposed for development of TWAP status indicators and can be also used for development of projected indicators. E.g. Water GAP Global Hydrological Model (Döel et all., 2006) for diffuse groundwater recharge at the global scale in combination with WHYMAP programme (Groundwater Resources Map of the World and other WHYMAP maps), Global NEWS model for the global nutrient transport, Water GAP Global Hydrological Model for impact of climate change on groundwater recharge (Döel et al., 2006) for simulation modelling of different climate scenarios in the 2050. Climatic models, e.g. ECHAM4 (Rockner et al., 1996), and HadCM3 model (Gordon et al., 1999) and other climatic models. Simulation modelling is particularly important for development groundwater projected indicators expressing potential influence of climate change and human impact on groundwater system.
Remote Sensing Sebal – model (Water Watch com.) may be applied for determination of evapotranspiration in areas (groundwater basins, aquifers) where precipitation and river runoff are fairly known and groundwater recharge can be estimated by subtracting direct runoff and evapotranspiration from the precipitation. Utrecht University developed Global hydrological model PCR – GLOBWB estimating groundwater recharge.
Other suitable models will be identified later by experts in groundwater modelling.
2. Groundwater quality
Terrestrial measurements: Automatic intelligent compact multi-parameter measurement loggers placed in monitoring and other type of wells completed with retrieval software, evaluation module and remote transmission system are the advance equipments for in situ groundwater quality measurements (e.g. electric conductivity, pH, redox potential, dissolved oxygen, salinity, chloride, temperature, turbidity). Assessment of monitored data supports groundwater quality modeling and formulation of projected groundwater stress indicators. However, for more complex groundwater quality assessment complementary groundwater chemical analysis in laboratories will be needed.
GEF-TWAP Methodology Transboundary Aquifers – Revised Version August 2012 84
Remote sensing measurements: satellite based groundwater quality measurements are not applied yet. Use of air-born photographic methods in combination with geobotanical methods has been done in many countries and is effective for the early detection of soil and shallow groundwater pollution. Both methods are based on the response of vegetation cover to the presence of specific substances in the soil and shallow groundwater. The state of plants health and the presence or absence of certain plant species and communities are helpful tools to reveal the presence of pollution in soil and water environment. (several species can be used as photo-indicators of different types of pollution, e.g. the negative response of nitrophobic species to an abundance of nitrogenous matter, algae blooms in coastal zones, dwarf growth of scots pine which manifests toxic effects of heavy metals, and others). IR photography detects vegetation stress manifested by loss of reflectance. Common species of corns cultivated in soils above shallow groundwater with high content of nitrate show increased growth, cover density and have deep dark green colours. Described remote techniques and methods produce supplementary and useful data for more precise transboundary groundwater quality and pollution identification and for evaluation of stresses on groundwater quality.
Models: Hydrogeochemical modelling strongly depends on the quality and consistency of available groundwater chemical and isotopic data. In addition one needs to know the hydrogeological conditions, i.e. the minerals which can be dissolved or precipitate and processes which may occur in the groundwater system and which are kinetically and thermo-dynamically possible. Furthermore a conceptual groundwater flow model is desirable with which to calculate travel time and to support the establishment of a relation between initial and final chemical composition of the studied groundwater system. The use of statistical methods– particularly factor and cluster analysis – can provide reliable data needed for geochemical modelling, groundwater chemistry studies and formulation of projected groundwater quality indicators. According to Griffionen (2004) present-day hydrochemical modeling of a groundwater system has to deal with mineralogical constraints, limitations in the knowledge of thermodynamics and kinetic reactions and uncertainties in the knowledge of the groundwater system of large aquifers. Hydrochemical data scarcity reflects in limitations of use of models for development of projected groundwater quality indicators on the level 1 TWAP assessment.
In case of groundwater pollution deterministic transport models are often applied to study the mechanism of nitrogen transport and transformation processes in the crop-soil-water-rock environment and nitrate vertical movement and lateral dispersion in aquifer system. However, to obtain credible model outcomes on transboundary aquifer scale many climatic, hydrological, soil, unsaturated zone and aquifer measurements and observations must be realised as well as collection and evaluation of agricultural data related to the origin, type and amount of nitrogen fertilizers used and form and time of their application with respect to cultivated agricultural products, sowing procedures, crop rotation / monocultures and irrigation regime (if applied). Data demanding deterministic models for groundwater nitrate pollution projection will be therefore applied in larger scale in the level 2 global TWAP assessment on aquifers in developed countries with long term monitoring programmes producing climatic, soil, water and agricultural related data.
The Global Nutrient Export from Watersheds model (Global NEWS) has been used to estimate coastal nutrients loads and sources in the years, 1970 and 2000. In addition model has been used to evaluate future trends in coastal nutrient delivery for the years 2030 and 2050. Implementation of Global News model to support TWAP objectives is proposed. In case of groundwater Global NEWS model may provide estimates of dissolved organic and inorganic nitrogen and would allow assessment of total estimated load of nitrate in t/yr for
GEF-TWAP Methodology Transboundary Aquifers – Revised Version August 2012 85
projection 2030 and 2050 as well as identify current problem areas with respect to nitrogen pollution, and identify major nutrient (nitrogen) sources.
Additional considerations regarding Economic Process Indicators Consideration of the economic, social and environmental implications of water use practices involves human behavior and responses to changing conditions. While indicators involving gross domestic product or the percentage of individuals receiving potable water provide information on the general state of the economy and/or health, they do not provide insights into an area’s ability to modify behavior through pricing signals, track changes in utilization and/or reallocation of water, or . Looking at processes related to water pricing, however, can provide information on a region’s capacity to affect the allocation of resources through price signals and measure the associated results. This information is useful for assessing whether the costs of infrastructure investment and/or maintenance, as well as ongoing operational costs, can be recovered over time through rates. Depending on the system for delivering groundwater, it may be pumped from an individual well, pumped by a community well or system of wells, or delivered via a spring. In any case, an important metric is the extent to which water use is metered. As important is information on the mechanism for pricing water and approval of prices. A flat water rate that does not vary with usage will have little ability to alter water use behavior. A water rate structure that differs across water using sectors, such as agricultural, municipal and industrial (which is commonly the case), may suggest the existence of subsidies for some water users. In addition to obtaining information about the water rates, it is important to know the mechanism and process for determining rates and the entity responsible for setting rates. Questions that can be answered through questionnaires, if not available through readily accessible documents, include: Water utilization Existence of water metering by sector (yes/or no) Agricultural (yes/or no) Individual user within sector (yes/or no) Municipal (community) Individual user within sector (yes/or no) Industrial Individual user within sector (yes/or no) Measurement (or estimation if not metered or reported officially) over time of water use by sector and by type of water (if multiple sources of water are used) Absolute quantities and also percentage distribution Agricultural Municipal (community) Industrial Environmental (if available) Water Pricing Structure
Water pricing by sector: Information to include whether charges are in place, the structure for charges, the mechanism for determining the rates, including who actually sets the rates, by sector.
GEF-TWAP Methodology Transboundary Aquifers – Revised Version August 2012 86
Agricultural Municipal
Is there a basic amount of water included at no charge or with a fixed charge set at a reasonable level?
Industrial Is Industrial water provided through a municipal (community) water system or by wells owned by the industrial user?
Water rate setting process where there is a community system in place
Is the community water provided by privately owned or publicly owned water systems
Who determines rate? What process is used by the rate setting body?
Is there public input? Are rates set based on the cost of infrastructure and operations?
Environmental Sector Considerations Because groundwater use may have impacts to the natural environment, it will be important to know if the TBA region has mechanisms in place, whether they are laws or other programs that protect or provide a mechanism for consideration of environmental tradeoffs associated with water use and changes to water use patterns. Reallocation Considerations As the economy grows, it is important to know whether need for water reallocation across sectors will be necessary. If so, it will be important to know if the institutional structure allows for reallocations either by fiat or by economically based transactions. A fiat system will include the quantification of water rights by user. An economically based transaction system will allow for sale or lease of water rights. Are water rights quantified? Who establishes the water rights or permits? Can they be changed? Who can change the water rights or permits? How can the water rights or permits be changed?
GEF-TWAP Methodology Transboundary Aquifers – Revised Version August 2012 87
Annex 3: Glossary of Terms
(a) “Aquifer” means a permeable water-bearing geological formation underlain by a less permeable layer and the water contained in the saturated zone of the formation;
(b) “Aquifer system” means a series of two or more aquifers that are hydraulically connected44; (c) “Transboundary aquifer” or “transboundary aquifer system” means respectively, an aquifer or aquifer system, parts of which are situated in different States;
(d) “Aquifer State” means a State in whose territory any part of a transboundary aquifer or aquifer system is situated;
(e) “Utilization of transboundary aquifers or aquifer systems” includes extraction of water, heat and minerals, and storage and disposal of any substance;
(f) “Recharging aquifer” means an aquifer that receives a non-negligible amount of contemporary water recharge;
(g) “Recharge zone” means the zone that contributes water to an aquifer, consisting of the catchment area of rainfall water and the area where such water flows to an aquifer by runoff on the ground and infiltration through soil45.
(h) “Discharge zone” means the zone where water originating from an aquifer flows to its outlets, such as a watercourse, a lake, an oasis, a wetland or an ocean.
(i) Coastal aquifer: aquifer located at the coast, usually hydraulically connected to the adjoining Large Marine Ecosystem.
(j) “Virgin recharge” or “natural recharge”: recharge or replenishment of ‘natural’ origin (rainfall, runoff, seepage from rivers or lakes, etc.), not significantly affected by human activity (artificial or induced recharge; return flows or other replenishment by used water; surfacing of terrains, etc.).
44
Another possible definition is: “Aquifer system means an aquifer or a complex of hydraulically interconnected
aquifers”. This definition is consistent with the ubiquitous practice to use ‘aquifer system’ as well for indicating
one single aquifer only. 45
Another possible definition is: “zone where significant recharge (=replenishment) of the aquifer’s groundwater
is taking place, from whatever source of water”.
GEF-TWAP Methodology Transboundary Aquifers – Revised Version August 2012 88
Annex 4: GEF-IW RAF Transboundary Aquifers Indicators Approach Paper for Possible Application of the Resource Allocation Framework to the GEF International Waters Focal Area – Transboundary Aquifers
Please refer to separate document
Annex 5: Minutes of the Utrecht Workshop Please refer to separate document
Annex 6: Example of ISARM Questionnaire Please refer to separate document
GEF-TWAP Methodology Transboundary Aquifers – Revised Version August 2012 89
Annex 7: Cross-cutting and common issues (removed) In an earlier stage of the TWAP MSP, there were intentions to work on cross-cutting issues. However, in a later stage of the MSP phase it was decided that these were not going to be dealt with in the level 1 FSP pahse of TWAP. For completeness reasons, the earlier approaches on how to deal with these cross-cutting issues within the transnoundary aquifer are incorporate in this annex: Cross-cutting issues are, within the context of TWAP, defined as a problem, opportunity or concern shared by several of TWAP’s water system types, often interlinking them to some extent. Nutrients and mercury have been defined and agreed upon as cross-cutting issues for the TWAP FSP-phase.
Nutrients, as a cross-cutting issue, are assessed in the transboundary groundwater systems and SIDS. Variables like nitrate concentration in groundwater, TDS and ground level decline are all related to these cross-cutting issues and are input for some of the selected indicators for the groundwater assessment (see part III). The values for the particular indicators related to the cross-cutting issues in a certain transboundary groundwater system and/or SIDS together with the level of interlinkages of that system with other water systems complete the picture of cross-cutting issues.
Mercury as a cross-cutting issue is of little relevance in groundwater systems. This issue was raised repeatedly throughout the preparation of the methodology and highlighted again during the peer review validation session of the TBA methodology. It was suggested that the groundwater group should focus on arsenic instead (please refer also to chapter 22 – Validation).
Common issues are, within the context of TWAP, defined as a problem or concern shared by several of TWAP’s water system types. In practice, it hardly can be distinguished from a ‘cross-cutting issue’, although the emphasis on interlinking may be less. By comparing the reports of all water system types the common issues may be identified.