ORIGINAL RESEARCH published: 10 October 2017 doi: 10.3389/fnsys.2017.00075 Gene Network Construction from Microarray Data Identifies a Key Network Module and Several Candidate Hub Genes in Age-Associated Spatial Learning Impairment Raihan Uddin* and Shiva M. Singh Department of Biology, University of Western Ontario, London, ON, Canada Edited by: Federico Bermudez-Rattoni, National Autonomous University of Mexico, Mexico Reviewed by: Jorge Medina, University of Buenos Aires, Argentina Humberto Gutierrez, University of Lincoln, United Kingdom *Correspondence: Raihan Uddin [email protected]Received: 03 April 2017 Accepted: 22 September 2017 Published: 10 October 2017 Citation: Uddin R and Singh SM (2017) Gene Network Construction from Microarray Data Identifies a Key Network Module and Several Candidate Hub Genes in Age-Associated Spatial Learning Impairment. Front. Syst. Neurosci. 11:75. doi: 10.3389/fnsys.2017.00075 As humans age many suffer from a decrease in normal brain functions including spatial learning impairments. This study aimed to better understand the molecular mechanisms in age-associated spatial learning impairment (ASLI). We used a mathematical modeling approach implemented in Weighted Gene Co-expression Network Analysis (WGCNA) to create and compare gene network models of young (learning unimpaired) and aged (predominantly learning impaired) brains from a set of exploratory datasets in rats in the context of ASLI. The major goal was to overcome some of the limitations previously observed in the traditional meta- and pathway analysis using these data, and identify novel ASLI related genes and their networks based on co-expression relationship of genes. This analysis identified a set of network modules in the young, each of which is highly enriched with genes functioning in broad but distinct GO functional categories or biological pathways. Interestingly, the analysis pointed to a single module that was highly enriched with genes functioning in “learning and memory” related functions and pathways. Subsequent differential network analysis of this “learning and memory” module in the aged (predominantly learning impaired) rats compared to the young learning unimpaired rats allowed us to identify a set of novel ASLI candidate hub genes. Some of these genes show significant repeatability in networks generated from independent young and aged validation datasets. These hub genes are highly co-expressed with other genes in the network, which not only show differential expression but also differential co-expression and differential connectivity across age and learning impairment. The known function of these hub genes indicate that they play key roles in critical pathways, including kinase and phosphatase signaling, in functions related to various ion channels, and in maintaining neuronal integrity relating to synaptic plasticity and memory formation. Taken together, they provide a new insight and generate new hypotheses into the molecular mechanisms responsible for age associated learning impairment, including spatial learning. Keywords: microarray, spatial learning, learning impairment, brains, data integration, mathematical modeling, gene networks, WGCNA Frontiers in Systems Neuroscience | www.frontiersin.org 1 October 2017 | Volume 11 | Article 75
Transcript
ORIGINAL RESEARCHpublished: 10 October 2017
doi: 10.3389/fnsys.2017.00075
Gene Network Construction fromMicroarray Data Identifies a KeyNetwork Module and SeveralCandidate Hub Genes inAge-Associated Spatial LearningImpairmentRaihan Uddin* and Shiva M. Singh
Department of Biology, University of Western Ontario, London, ON, Canada
Edited by:Federico Bermudez-Rattoni,
National Autonomous Universityof Mexico, Mexico
Reviewed by:Jorge Medina,
University of Buenos Aires, ArgentinaHumberto Gutierrez,
As humans age many suffer from a decrease in normal brain functions including spatiallearning impairments. This study aimed to better understand the molecular mechanismsin age-associated spatial learning impairment (ASLI). We used a mathematical modelingapproach implemented in Weighted Gene Co-expression Network Analysis (WGCNA)to create and compare gene network models of young (learning unimpaired) and aged(predominantly learning impaired) brains from a set of exploratory datasets in rats in thecontext of ASLI. The major goal was to overcome some of the limitations previouslyobserved in the traditional meta- and pathway analysis using these data, and identifynovel ASLI related genes and their networks based on co-expression relationshipof genes. This analysis identified a set of network modules in the young, each ofwhich is highly enriched with genes functioning in broad but distinct GO functionalcategories or biological pathways. Interestingly, the analysis pointed to a single modulethat was highly enriched with genes functioning in “learning and memory” relatedfunctions and pathways. Subsequent differential network analysis of this “learningand memory” module in the aged (predominantly learning impaired) rats comparedto the young learning unimpaired rats allowed us to identify a set of novel ASLIcandidate hub genes. Some of these genes show significant repeatability in networksgenerated from independent young and aged validation datasets. These hub genes arehighly co-expressed with other genes in the network, which not only show differentialexpression but also differential co-expression and differential connectivity across ageand learning impairment. The known function of these hub genes indicate that theyplay key roles in critical pathways, including kinase and phosphatase signaling, infunctions related to various ion channels, and in maintaining neuronal integrity relatingto synaptic plasticity and memory formation. Taken together, they provide a new insightand generate new hypotheses into the molecular mechanisms responsible for ageassociated learning impairment, including spatial learning.
Uddin and Singh Gene Networks in Learning Impairment
INTRODUCTION
One of the most significant effects of aging is the decrease innormal brain functions, particularly, cognition and memory.The incidence of cognitive impairments, including normalage-associated spatial learning impairment (ASLI), has risendramatically in past decades due to increasing human longevity(Burger et al., 2007; Peleg et al., 2010; Glorioso et al., 2011). Assuch trends are expected to continue, it has become imperativeto better understand the underlying molecular biology andgenetics of ASLI. Towards that goal, in a previous meta-analysisstudy (Uddin and Singh, 2013), we integrated several microarraygene-expression data generated from independent studies inthe context of ASLI in the hippocampus in rats. The datarepresented young rats that were learning unimpaired andaged rats that were learning impaired and unimpaired. Thecarefully designed original studies investigated spatial learningtasks in young (3–6 months old) and aged (24–26 monthsold) animals using the Morris Water Maze as the trainingand assessment protocol. All experimental young animalsdemonstrated learning unimpairment. While the majority of theexperimental aged animals demonstrated learning impairment,some demonstrated learning unimpairment. Since, hippocampusin the brain is integral to memory function including spatialmemory both in humans and in rodents (Morris et al.,1982; Burgess, 2002), microarray gene-expression data weregenerated using the hippocampus tissue. These datasets allowedus to assess a combined gene expression changes relatedto aging, as well as ASLI in rats across multiple studies(Uddin and Singh, 2013). We used traditional methods suchas differential expression analysis, followed by functional andpathway analysis using the Ingenuity Pathway Analysis (IPA)software1, to identify ASLI genes and networks. Though ourmeta-analysis identified a number of significant differentiallyexpressed genes and networks across age or across ASLI inseveral interesting biological categories, however, the resultshighlighted some limitations in such traditional analyses. One ofthe limitations is that gene networks and regulatory interactionsamong the genes in these networks are modeled based oncurrent biological knowledge only. For example, IPA pathwayor similar knowledge base analysis can only model genenetworks based on information that is available in the literature.Therefore, such analyses are unable to fully utilize the genetranscript expression information captured by the microarraydata. Another limitation is that they are not able to identifya single network that could be solely associated with ASLI,as we previously observed that the candidate ASLI geneswere all scattered in different networks (Uddin and Singh,2013). Finally, there is no prioritization of molecules withinthe knowledge-based network models of affected pathways.As a result, to overcome the above limitations, mathematicalmodeling of gene networks from large scale gene-expressiondata is becoming a popular alternative choice in the networkdiscovery process, and has proven highly useful in recentyears (Friedman et al., 2000; Margolin et al., 2006; Opgen-
1http://www.ingenuity.com
Rhein and Strimmer, 2007; Langfelder and Horvath, 2008;Ideker and Bandyopadhyay, 2010). Particularly, the correlation-based modeling method implemented in WGCNA (Zhangand Horvath, 2005) has gained a lot of popularity (Fulleret al., 2007; Oldham et al., 2008; Mason et al., 2009; Plaisieret al., 2009; Miller et al., 2010; Levine et al., 2013; Fontenotand Konopka, 2014; Rickabaugh et al., 2015; Ye and Liu,2015).
Numerous studies have applied gene co-expression networkanalysis using WGCNA to associate co-expression moduleswith brain and psychiatric diseases (Oldham et al., 2006;Miller et al., 2008; de Jong et al., 2010; Torkamani et al.,2010; Voineagu et al., 2011). However, no study investigatinggene network modeling in ASLI appears in the literature.Therefore, we felt it necessary to initiate such a modeling toexplore and identify key functional modules and gene hubsin the context of ASLI. Here, we performed a co-expressionnetwork analysis (using WGCNA) as a follow up to ourprevious study (Uddin and Singh, 2013) using the samedatasets. The specific goals in this study were to creategene network models from a set of exploratory datasets,separately for aged (predominantly learning impaired) andyoung (learning unimpaired) samples; to perform a differentialnetwork analysis between these aged and young networks;and to evaluate results (significant functional modules andhub genes) by comparing them against a set of validationdatasets.
This analysis has identified several reproducible networkmodules each highly significant with genes functioning inspecific biological functional categories (Uddin, 2015). Itidentifies a ‘‘learning and memory’’ specific module containingmany potential key ASLI hub genes, some of which werealso identified (but not prioritized) in the meta-analysis. Manyof these candidate hub genes not only show differentialco-expression between young and aged networks, but are alsoreproducible in independent datasets. Functions of these ASLIhub genes link a different set of mechanisms to learningand memory formation, which meta-analysis was unable todetect. Future follow up research can help further understandtheir potential molecular mechanisms underlying complexbehavioral traits such as cognitive impairments including ASLI.Modern meta- and network approaches as implemented inthis study can be applied to any large-scale dataset to identifypotential key molecules and networks and thus generate newhypotheses.
MATERIALS AND METHODS
Data Selection for Network AnalysisFor this study, we have selected five microarray datasets referredhere as BL (Blalock et al., 2003), B7 (Burger et al., 2007), R7(Rowe et al., 2007), B8 (Burger et al., 2008) and K9 (Kadishet al., 2009). They consist of a total of 287 arrays and usedtwo different Affymetrix chip types, RG_U34a and RAE230a.The data represented young rats that were learning unimpairedand aged rats majority of which were learning impaired withsome learning unimpaired animals. The BL and K9 studies
Frontiers in Systems Neuroscience | www.frontiersin.org 2 October 2017 | Volume 11 | Article 75
Uddin and Singh Gene Networks in Learning Impairment
were similar in design where only the unimpaired youngand impaired aged animals were considered for comparison.The B7, R7 and B8 studies were similar in design whereboth young and aged groups contained controls animals thatwere learning impaired, e.g., cage controls, stress controls andcontrols for visual impairment. These datasets were qualitychecked and normalized using RMA methods (Bolstad et al.,2003; Gautier et al., 2004), had outliers removed and batcheffect adjusted using age and spatial learning impairment ascovariates (Uddin and Singh, 2013). For each dataset, agedand young samples were separated and assessed further forthe presence of array outliers (Supplementary Table S1 andSupplementary Figures S1–S6). Since the WGCNA networkconstruction method is correlation based, before proceedingwith network analysis it was made sure that the correlationsbetween genes in each dataset were reasonable as suggested inthe literature (Miller et al., 2010). This was done by calculatingPearson’s correlations between the expression levels of each pairof genes in the aged or young preprocessed datasets and byplotting the correlation values in histogram plots (SupplementaryFigure S7). All data preparation steps including WGCNA, GO,and statistical analyses were performed in R using appropriatesoftware packages.
Co-Expression Network AnalysisUsing the preprocessed transformed data (genes in columnsand samples in rows), gene networks were constructed foraged and young using the WGCNA R package (Zhang andHorvath, 2005; Langfelder and Horvath, 2008) following aslightly modified protocol based on the approaches previouslydescribed (Oldham et al., 2006, 2008; Miller et al., 2008, 2010).The overall network analysis process for a single dataset isdescribed below.
Creating an Adjacency (ConnectionStrength) MatrixA weighted correlation between two genes represents connectionstrength between the genes in a network. For each dataset,a network adjacency or connection strength matrix (networkdata) was created by taking the signed correlations of the geneexpression values between each pair of genes raised to a powerof beta. Beta is the weight, a soft threshold, and was determinedin advance in such a way so that the resulting network followsapproximate scale free topology. The values in the diagonal (self-correlation) were converted to zero.
Filtering Out Genes with Very LowConnectivityTo save computational time, genes were filtered out from anetwork adjacency matrix based on their connectivity (i.e., onlygenes with above average median connectivity were kept fornetwork analysis). The overall connectivity for each gene(denoted by k) is the sum of connection strengths (weightedcorrelation) between that gene and all other genes in the network.It is scaled to lie between 0 and 1 and represents how strongly agene is connected to all other genes in the network.
Creating and Visualizing Network ModulesFollowing filtering an adjacency matrix contained geneswith reasonably high network connectivity. This adjacencymatrix was used to determine a network topologicaloverlap, construct a hierarchical clustering dendrogram of1—topological overlap, determine network modules usinga hybrid tree-cutting algorithm, and to visualize networkmodules. In a co-expression network, an edge between twogenes (nodes) represents a co-expression relationship. For eachdataset or module a network interaction file was created from itsadjacency matrix, and used in Cytoscape for visualization andanalysis.
Network analysis often results in a large number of modules.It is sometimes useful to reduce the number of modulesby merging those whose expression profiles are very similar.This was accomplished by merging modules whose membergenes were highly co-expressed. To calculate the co-expressionsimilarity of entire modules, their module eigengenes werecalculated. The module eigengene is defined as the first principalcomponent of a given module. It can be considered as arepresentative of the gene expression profiles in a module.The module eigengenes were clustered on their consensuscorrelation, which was the minimum correlation across thetwo sets.
Exploring the Functional Significance ofModulesA list of genes belonging to each network module was exportedto tab delimited text files along with all necessary information.For each module there were two files, the first file containeda list of genes with their gene symbols, mean expression,module names, and intra-modular connectivity. This file wasused for GO analysis using The Database for Annotation,Visualization and Integrated Discovery (DAVID)2 (Huanget al., 2007, 2009a,b). The second file contained co-expressioninteraction information between each pair of genes in a modulealong with the topological overlap and correlation information.This interaction file was used for network visualization andanalysis.
GO functional Annotation Clustering analysis was performedthrough DAVID web-services using the gene list for eachyoung network module. In this research, DAVID web-serviceswere accessed programmatically by using an R package calledRDAVIDWebService (Fresno and Fernández, 2013). Since genesymbols can be confusing and often fail to produce a perfectmatch, the corresponding affymetrix IDs were used to query theDAVID database. GO functional annotation information wasobtained for all modules in the young and the aged categories.
In DAVID, for each functional cluster an enrichment scoreis calculated. This enrichment score is the geometric mean (in−log scale) of the p-values of all member annotation terms andis used to rank their biological significance (Huang et al., 2009b).Thus, the top ranked annotation clusters will most likely haveconsistently lower p-values for their annotation members. Thesignificance of a gene-enrichment p-values for each annotation
2http://david.abcc.ncifcrf.gov/
Frontiers in Systems Neuroscience | www.frontiersin.org 3 October 2017 | Volume 11 | Article 75
Uddin and Singh Gene Networks in Learning Impairment
term is calculated based on a modified Fisher exact test methodknown as the EASE score (Hosack et al., 2003). The defaultthreshold of the EASE score was set at 0.1.
Validating Network ModulesNetwork modules for young and aged were compared acrossstudies and platforms for their repeatability using the statisticsimplemented in WGCNA software package. This was done intwo ways: (a) module preservation; and (b) module overlap.
Module PreservationModule preservation statistics (Zhang and Horvath, 2005;Miller et al., 2010; Langfelder et al., 2011) can qualitativelyand quantitatively measure network preservation at themodule level. As a qualitative assessment, the gene moduleassignment from one network was mapped on the samegenes in the second network. The results were then plotted ina dendrogram, which offers a visual mean to qualitativelyassess preservation. Quantitative measure of networkpreservation assesses how well a module in one study ispreserved in another study using a number of statistics.Module preservation was estimated quantitatively betweenthe young and the aged networks in different datasets. Inall comparisons, the R7 top most connected genes, theirtranscription profiles, and their module assignments were usedas a reference.
Module OverlapComparing networks by calculating module overlap allowsone to determine whether a module that was found in onedataset can also be found in another dataset (Miller et al.,2010; Horvath, 2011). Fisher’s exact test is used to calculatea p-value of significance of pair-wise module overlap. Inthis research, module overlaps were calculated along withtheir significance of overlaps between the young modulesand between the aged modules in different datasets followingthe approach described in Oldham et al. (2008). In brief,top most connectivity genes common between a networkfrom R7 (exploratory set) aged (or young) and another aged(or young) network from a validation set were selected.Next, the module labels between the two networks werematched. The purpose was to see which modules in onenetwork contain a significant number of overlapping geneswith modules in the second network. Next, module labelswere reassigned in the second network such that correspondingmodules were assigned the same color label. After matchinglabels between the modules in exploratory and validationnetworks, their percentage overlaps and significance p-valueswere calculated.
Differential Network Analysis of Young vs.AgedDifferential network analysis allows one to compare two differentnetworks side by side, for example, between a control anda disease network. Networks for several interesting modulesidentified in this research were visualized side by side between
the young and aged groups using Cytoscape and compared fortheir differential co-expression.
Identifying and Validating Hub GenesTop hub genes were identified by using module eigengene-based connectivity or kME values in both the young (learningunimpaired) and aged (predominantly learning impaired)networks. Module eigengene-based connectivity kME, also knownas module membership, is calculated for each gene. It isdefined by correlating each gene’s expression profile with themodule eigengene of a given module (Zhang and Horvath,2005; Langfelder and Horvath, 2008; Miller et al., 2010). Hubgenes were validated by assessing their repeatability in networksconstructed from independent datasets and by investigating theirfunctions in relevant pathways. In addition, expression patternsof selected hub genes were verified using meta-analysis and forestplots.
RepeatabilityRepeatability of the candidate hub genes were assessed as follows.For each module, hub genes identified in the exploratory (R7)networks were checked if they are also identified as hub genes inthe validation networks (e.g., B8, K9, or B7) with high kME valuesas well as with t-test p-values ≤ 0.05 (between two networks ata time e.g., one exploratory and one validation). In cases wherea module from an exploratory network matched to multiplemodules in a validation network, genes from multiple significantmodules in the validation network were combined together andthen compared to the hub genes in the exploratory networkmodule.
Literature SearchLiterature searches were performed using PubMed to explorecharacteristics and functions of selected ASLI candidate hubgenes and their relationship to learning and memory formation.
RESULTS
In order to model, explore and identify ASLI genes andtheir networks, this analysis followed a detailed and throughinvestigation that included the identification of GO enrichedsignificant functional modules and hub genes, as well asvalidation of results using independent datasets. The results aredescribed below.
Data Selection for Network AnalysisBased on the quality of data and number of samples(Supplementary Table S1), R7 aged (R7-A) and young (R7-Y)datasets were chosen as the exploratory datasets; B8 young(B8-Y), K9 young (K9-Y), B7 aged (B7-A), and B8 aged (B8-A)datasets were chosen as the validation datasets (Table 1).After preprocessing, other groups did not have sufficientnumber of samples for WGCNA, they were excluded from thisanalysis. The networks were constructed for each of the agedand young datasets separately (i.e., B7-A, B8-Y, B8-A, K9-Y,R7-Y, and R7-A). However, GO based functional analysis andvisualization was done only for the networks from R7 young
Frontiers in Systems Neuroscience | www.frontiersin.org 4 October 2017 | Volume 11 | Article 75
Uddin and Singh Gene Networks in Learning Impairment
TABLE 1 | Datasets selected for network analysis.
Dataset Number of young sample Exploratory/Validation (Young) Number of aged sample Exploratory/Validation (Aged)
B7 (Burger et al., 2007) 28 ValidationR7 (Rowe et al., 2007) 19 Exploratory 27 ExploratoryB8 (Burger et al., 2008) 18 Validation 28 ValidationK9 (Kadish et al., 2009) 18 Validation
and aged exploratory datasets, and the results were validatedindependently in networks constructed from the validationdatasets. All datasets combined, this research included 65 youngrat samples that were identified as learning unimpaired, 66 agedsamples that were identified as learning impaired, and 29 agedsamples that were identified as learning unimpaired.
Determining the Weights or Soft PowerBetaBased on the scale free topology model fit analysis thesoft-threshold power for both R7-Y and R7-A was determinedto be 6. This power also results in an approximate straightline relationship in the scale-free topology plots (SupplementaryFigures S8, S9). Performing similar analyses, the soft powers forB8-Y and B8-A were determined to be 10 and 8, respectively. Forthe B7-A dataset, the soft power was 9 and for K9-Y it was 10.
Creating Adjacency (Connection Strength)MatricesThe genes that remained after preprocessing (SupplementaryTable S2) were used to calculate the signed Pearson correlationcoefficients for all pairwise comparisons of gene-expressionvalues across all young and aged samples. The correlation matrixfor each group was then transformed into a matrix of connectionstrengths (i.e., an ‘‘adjacency’’ matrix) using a soft power betaas determined above. This resulted in a network adjacencymatrix for each dataset, for example, for R7 it generated an8053× 8053 matrix.
Filtering Out Genes with Very LowConnectivityFirst, connectivity value for each gene was calculated from theadjacency matrix. Next for each dataset, the average medianconnectivity kmed was used as a cut-off value to filter out geneswith very low connectivity. For R7-Y kmed was 0.46 and forR7-A kmed was 0.54. We selected the average kmed = 0.5 asthe minimum connectivity cut-off, which removed 2379 genes,leaving 5674 high connectivity genes for the R7 network analysis(Supplementary Table S2). For B8 and K9 the median kmed was0.4 and 0.35, which resulted in 5202 and 4796 high connectivitygenes, respectively. The number of B7 genes was already low andclose to the numbers of other filtered datasets. So, in order toprevent information loss no filtering was done on these B7 genes.
Creating and Visualizing Networks andModulesA major goal of gene correlation network analysis is toidentify groups of highly interconnected genes (Zhang and
Horvath, 2005; Oldham et al., 2006) termed as modules. Theexpression profiles of genes in a module are highly correlatedacross the samples. In a co-expression network, modulesare identified by searching for genes with similar patternsof connection strengths to other genes, or genes with hightopological overlap. The topological overlap values are calculatedusing the adjacency and connectivity values, which determinewhich genes will be in which module and form a network.The values range between 1 and 0 representing maximumand minimum interconnectedness. The module identificationmethod in WGCNA is based on using a node dissimilaritymeasure in conjunction with a clustering method. Since thetopological overlap matrix is non-negative and symmetric, itis turned into a dissimilarity measure by subtracting from 1.Genes are hierarchically clustered using the average linkagemethod, taking 1-topological overlap as the distance measureand modules are determined by choosing a height cutoff forthe resulting dendrogram. In the dendrogram, discrete branchesof the tree correspond to modules of co-expressed genes.Following these steps, gene network modules for the youngand aged samples were identified separately for each datasetusing the filtered weighted correlation matrices as preparedabove.
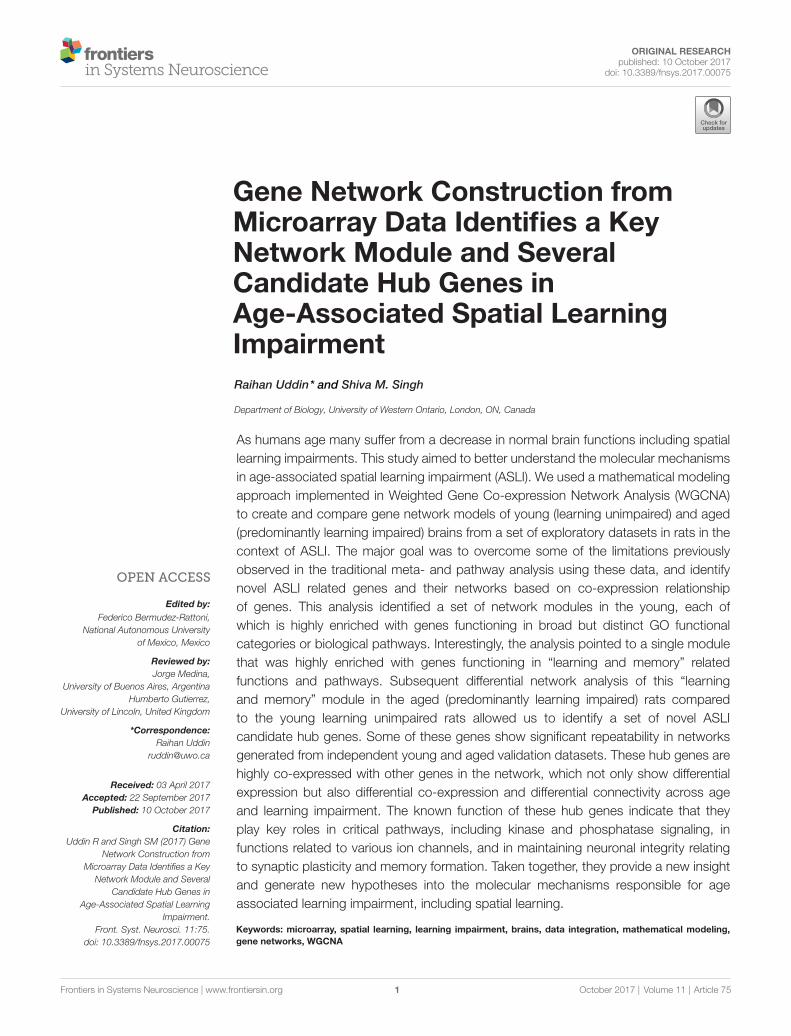
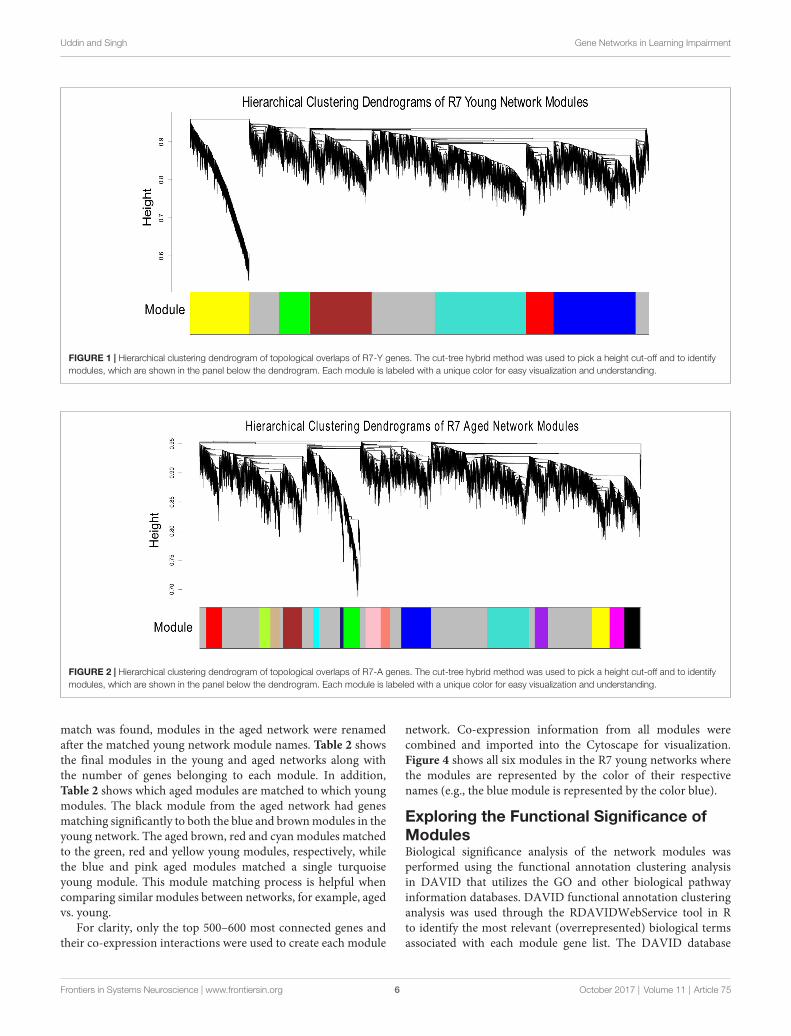
Figures 1, 2 show the hierarchical dendrograms of topologicaloverlaps for the 5674 genes in R7-Y and R7-A, respectively.There are several height cut-off algorithms implementedin the WGCNA R package. In this research, the cut-treehybrid method was chosen to pick a height cut-off andto identify modules, which are shown in the panel belowthe dendrograms. The default lowest cut-off resulted in sixmodules in the young network and 15 modules in theaged network. Each module is labeled with a unique color(except gray) for easy visualization and understanding. Thecolor gray is preserved for genes that do not belong to anymodule.
The aged network resulted in many modules, most withsmall numbers of genes, for example, 13 of the modules hadfewer than 300 genes each and nine of them had less than200 genes each (result not shown). For better comparison, thenumber of modules in the aged network was brought closer tothat of the young network. This was accomplished by mergingthe modules (Supplementary Figure S10). In order to keep themodule numbers similar to that of the young network, a cutheight of 0.4 was chosen that generated seven modules in the agednetwork (including the gray module; Figure 3).
Since module names/labels in a network were randomlygenerated, the seven aged modules were matched to the sevenyoung modules to check for similarity and module overlap ofgene members (Supplementary Tables S3, S4). Once a significant
Frontiers in Systems Neuroscience | www.frontiersin.org 5 October 2017 | Volume 11 | Article 75
Uddin and Singh Gene Networks in Learning Impairment
FIGURE 1 | Hierarchical clustering dendrogram of topological overlaps of R7-Y genes. The cut-tree hybrid method was used to pick a height cut-off and to identifymodules, which are shown in the panel below the dendrogram. Each module is labeled with a unique color for easy visualization and understanding.
FIGURE 2 | Hierarchical clustering dendrogram of topological overlaps of R7-A genes. The cut-tree hybrid method was used to pick a height cut-off and to identifymodules, which are shown in the panel below the dendrogram. Each module is labeled with a unique color for easy visualization and understanding.
match was found, modules in the aged network were renamedafter the matched young network module names. Table 2 showsthe final modules in the young and aged networks along withthe number of genes belonging to each module. In addition,Table 2 shows which aged modules are matched to which youngmodules. The black module from the aged network had genesmatching significantly to both the blue and brown modules in theyoung network. The aged brown, red and cyan modules matchedto the green, red and yellow young modules, respectively, whilethe blue and pink aged modules matched a single turquoiseyoung module. This module matching process is helpful whencomparing similar modules between networks, for example, agedvs. young.
For clarity, only the top 500–600 most connected genes andtheir co-expression interactions were used to create each module
network. Co-expression information from all modules werecombined and imported into the Cytoscape for visualization.Figure 4 shows all six modules in the R7 young networks wherethe modules are represented by the color of their respectivenames (e.g., the blue module is represented by the color blue).
Exploring the Functional Significance ofModulesBiological significance analysis of the network modules wasperformed using the functional annotation clustering analysisin DAVID that utilizes the GO and other biological pathwayinformation databases. DAVID functional annotation clusteringanalysis was used through the RDAVIDWebService tool in Rto identify the most relevant (overrepresented) biological termsassociated with each module gene list. The DAVID database
Frontiers in Systems Neuroscience | www.frontiersin.org 6 October 2017 | Volume 11 | Article 75
Uddin and Singh Gene Networks in Learning Impairment
FIGURE 3 | Hierarchical clustering of the final aged modules.
offers extended annotation coverage with over 40 annotationcategories, including GO terms, protein-protein interactions,protein functional domains, disease associations, bio-pathways,sequence features, homology and many more (Huang et al.,2009b). However, for reasons of simplicity and to betterunderstand the biological significance of the network modulesidentified above, only the biological processes (BP), molecularfunctions (MF), and cellular components (CC) GO terms and allKEGG Pathway terms were included in the functional annotationclustering analysis.
Affymetrix probe set identifiers of all the genes belonging to anetwork module (Table 2) were used as the input gene list. Thetotal number of genes from the RAE230A array for the R7 dataset(after preprocessing and filtering) was 5674, and was used as abackground population. Rattus norvegicus was used as species.The function getClusterReportFile(...) in RDAVIDWebServicewas used with default parameters to retrieve all relevant
information. Next getClusterReport(. . .) function was used toextract the functional annotation chart file, which was saved as atext file and later analyzed. An enrichment score cutoff of 1.0 wasused to minimize the number of clusters that were returned.
Table 3 shows the summary result of GO analysis for theyoung modules. The most significant GO functional categoriesrepresented by the genes belonging to each module are alsoshown in Figure 3. The results show that, in general, each moduleis highly enriched with genes functioning in broad but distinctGO functional categories or biological pathways with highlysignificant enrichment scores.
Validating Network ModulesNetwork modules were validated by assessing their preservationand overlap across datasets. This was done by comparing themodules’ gene expression data as follows: R7 young vs. R7 aged;R7 young vs. B8 and K9 young; R7 aged vs. B8 and B7 aged.
TABLE 2 | Modules in the R7 young and aged networks.
Samples Module names
Young Blue Brown Green Gray Red Turquoise Yellow# of genes 1015 759 380 1319 341 1129 731Aged (original labels∗∗) Blue (Black) Brown (Black) Green (Brown) Gray (Gray) Red (Red) Turquoise (Blue and Pink) Yellow (Cyan)# of genes 1151 1151 554 2600 206 508 and 366 289
There were seven modules in each group including the gray module. Aged modules were matched to the young modules to find modules containing the maximum numberof matching genes. Once identified, the aged module names were changed to match the respective young module names for easy comparison. ∗∗Original labels/namesof the aged modules before matching to the young modules are in bracket.
Frontiers in Systems Neuroscience | www.frontiersin.org 7 October 2017 | Volume 11 | Article 75
Uddin and Singh Gene Networks in Learning Impairment
FIGURE 4 | All six modules in the R7 young networks. The modules are represented by the color of their respective names, for example, the blue module isrepresented by the color blue. The most significant GO functional categories represented by the genes belonging to each module are also shown.
Module PreservationModule preservation was assessed quantitatively where the R75674 top most connected genes from the young networks werecompared to the same genes in other datasets to see how wellthe module assignment of these R7 genes and their module-wisefunctions are preserved in other datasets. However, in eachcomparison the R7-Y network module definition was used as areference and networks were created from gene expression dataaccordingly for comparison. For example, in the comparisonbetween R7-Y vs. B8-Y, the same R7 top most connected5674 genes were selected from B8-Y. Next, the same R7-Y genemodule definition was mapped to the B8-Y genes. There wasan exception for the R7-A vs. B7-A comparison where only2140 genes were used because only these genes were commonbetween the two different chip types used in the two independentstudies.
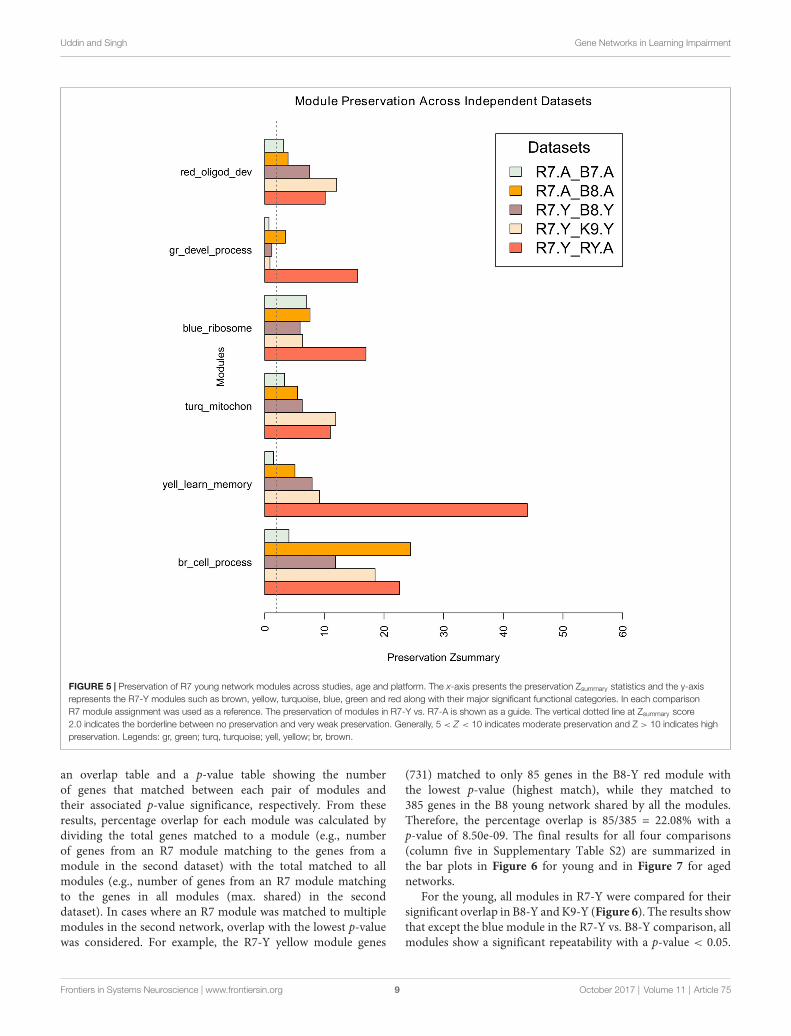
Module network preservations were estimated by keepingthe maximum module size at 700 and using 30 permutations.The results are summarized in the bar plot in Figure 5. Itpresents the preservation of R7 young and aged modules ineach comparison as Zsummary statistics along the x-axis. All theR7 young modules (e.g., brown, yellow, turquoise, blue, green
and red) along with their major significant functional categoriesare represented in the y-axis. Except the green module, allother modules generally show moderate to high preservationacross independent studies. The brown module shows the highestpreservation among all the modules while the green moduleshows the lowest preservation. All modules in general in theR7 aged vs. B7 aged comparison shows comparatively lowerpreservation than in the other comparisons.
Module Overlap between NetworksComparing networks by calculating module overlaps betweennetworks provides another way to validate network modulesusing independent datasets. We performed a pair-wisecomparison for all datasets. After merging datasets by matchinggenes, there were 3626 top most connectivity genes commonbetween R7 and B8, 3138 between R7 and K9, and 2140 betweenR7 and B7 networks (Supplementary Table S2).
Once two datasets had the same matching genes selected,next, for each comparison (e.g., between R7-Y and B8-Y) allmodules were compared between the two datasets (i.e., themodule assignment of the genes in R7 were matched to thesame genes in B8). For each comparison, the results generated
TABLE 3 | GO functional analysis summary for the R7 young modules.
Module Major GO Categories p-value
Blue Ribosome, translation elongation 9.85E-08–2.02E-09Brown Cellular process, GTPase activity, myelination, cell communication 0.02–0.006Green Developmental process 9.36E-04Red Oligodendrocyte development, histine deacetylase activity 0.01–0.005Turquoise Mitochondrion, many diseases, ribosome 1.20E-04–3.12E-06Yellow Synaptic activity, synaptic transmission, learning and memory 2.94E-04–4.77E-15
Frontiers in Systems Neuroscience | www.frontiersin.org 8 October 2017 | Volume 11 | Article 75
Uddin and Singh Gene Networks in Learning Impairment
FIGURE 5 | Preservation of R7 young network modules across studies, age and platform. The x-axis presents the preservation Zsummary statistics and the y-axisrepresents the R7-Y modules such as brown, yellow, turquoise, blue, green and red along with their major significant functional categories. In each comparisonR7 module assignment was used as a reference. The preservation of modules in R7-Y vs. R7-A is shown as a guide. The vertical dotted line at Zsummary score2.0 indicates the borderline between no preservation and very weak preservation. Generally, 5 < Z < 10 indicates moderate preservation and Z > 10 indicates highpreservation. Legends: gr, green; turq, turquoise; yell, yellow; br, brown.
an overlap table and a p-value table showing the numberof genes that matched between each pair of modules andtheir associated p-value significance, respectively. From theseresults, percentage overlap for each module was calculated bydividing the total genes matched to a module (e.g., numberof genes from an R7 module matching to the genes from amodule in the second dataset) with the total matched to allmodules (e.g., number of genes from an R7 module matchingto the genes in all modules (max. shared) in the seconddataset). In cases where an R7 module was matched to multiplemodules in the second network, overlap with the lowest p-valuewas considered. For example, the R7-Y yellow module genes
(731) matched to only 85 genes in the B8-Y red module withthe lowest p-value (highest match), while they matched to385 genes in the B8 young network shared by all the modules.Therefore, the percentage overlap is 85/385 = 22.08% with ap-value of 8.50e-09. The final results for all four comparisons(column five in Supplementary Table S2) are summarized inthe bar plots in Figure 6 for young and in Figure 7 for agednetworks.
For the young, all modules in R7-Y were compared for theirsignificant overlap in B8-Y and K9-Y (Figure 6). The results showthat except the blue module in the R7-Y vs. B8-Y comparison, allmodules show a significant repeatability with a p-value < 0.05.
Frontiers in Systems Neuroscience | www.frontiersin.org 9 October 2017 | Volume 11 | Article 75
Uddin and Singh Gene Networks in Learning Impairment
FIGURE 6 | Validation of young modules in independent datasets. All modules in R7-Y were compared for their significant overlaps in B8-Y and K9-Y. Thepercentage overlap is shown on the x-axis and the modules, along with their broad significant GO categories, are shown on the y-axis. Legends: gr, green; turq,turquoise; yell, yellow; br, brown.
The red module showed the maximum overlap trailed by brown,turquoise, yellow, green and blue.
For the aged, all modules in R7-A (using the R7 youngmodule definition) were compared for their significant overlapin B8-A and B7-A (Figure 7). The results show thatall modules demonstrate a significant repeatability with ap-value < 0.05 across independent datasets. The blue moduleshowed the maximum overlap trailed by turquoise, brown,yellow, red and green.
Differential Network Analysis of Young vs.AgedIn order to assess the changes in co-expression patterns of theyoung as they age and how the aging would affect learningimpairments, we compared several interesting network modulesbetween young (learning unimpaired) and aged (predominantlylearning impaired) networks generated from the R7 data. Thiscomparative investigation involved visualizing them side by side,comparing expression patterns between networks, and searchingfor key genes. In addition, it involved identifying the key genes’functions and pathways that can help explain the learningdifferences as well as the aging effect that had been observedbetween the young and aged animals. Differential expression
levels for the top 5674 genes in the R7 data were calculated byusing the limma package in Bioconductor. The log fold changesof expression differences between young and aged for all geneswere saved as a tab delimited text file, and later loaded as nodeattributes in Cytoscape for each module.
The module that is most relevant to this article is theyellow (‘‘learning and memory’’) module. Figures 8A,B presentsthe differential co-expression networks of this module betweenyoung (A) and aged (B) rats, which demonstrates a cleardifference in expression patterns between the young and the agedgenes. The majority of the genes in the aged yellow networkshow lower expression compared to the young. In addition,the comparative analysis demonstrates differential co-expressionfor many genes between the two networks (i.e., some genesdisplay more co-expression interaction than others and thisvaries between the young and the aged networks). The resultsallow one to identify a number of key ASLI genes for furtherinvestigation (see below).
Identifying and Validating ASLI CandidateHub GenesIn a co-expression network, genes that are highly connectedwith many other genes are called hub genes. These genes show
Frontiers in Systems Neuroscience | www.frontiersin.org 10 October 2017 | Volume 11 | Article 75
Uddin and Singh Gene Networks in Learning Impairment
FIGURE 7 | Validation of aged modules in independent datasets. All modules in R7-A were compared for their significant overlaps in B8-A and B7-A. Thepercentage overlap is shown on the x-axis and the modules, along with their broad significant GO categories, are shown on the y-axis. Legends: gr, green; turq,turquoise; yell, yellow; br, brown.
FIGURE 8 | Differential co-expression network analysis of the yellow “learning and memory” module in the young (A) and aged (B) in R7. The color of each nodedisplays differential expression level (log fold change value) between young and aged samples. Each node size is proportional to the number of co-expressioninteraction the node has. Legends: red is upregulation; green is downregulation.
significant correlation with the module eigengenes and have highwithin-module connectivity. After closely studying the networksin young (learning unimpaired) and aged (predominantlylearning impaired), we have identified a set of key hub genes ineach module. Some of the hub genes in the yellow module inR7 are shown in Table 4. Some of them are already known aslearning genes and were identified in our previous meta-analysis(Uddin and Singh, 2013). Table 5 shows the number of
significant AY (aged vs. young) meta-analysis genes that are alsomembers of different modules in the R7-Y network. Particularly,it shows that there are 165 AY significant meta-analysis genes inthe yellow module. Effect size estimates from the meta-analysisfor the above ASLI candidate hub genes are summarized inSupplementary Table S5. In addition, we have created individualforest plots for some of these hub genes, which are presented inSupplementary Figures S11–S25.
Frontiers in Systems Neuroscience | www.frontiersin.org 11 October 2017 | Volume 11 | Article 75
Uddin and Singh Gene Networks in Learning Impairment
TABLE 4 | Top candidate age-associated spatial learning impairment (ASLI) hub genes in the yellow module of the R7 dataset.
Hub gene Function description Reference
Camk1g Encodes a protein similar to calcium/calmodulin-dependent proteinkinase (CaMK), but its exact function is not known. CaMKs activatedby the neuronal Ca2+ influx phosphorylate cyclic adenosinemonophosphate (cAMP) responsive element binding protein (CREB),which has been implicated in spatial learning and memory formation.
Thomas and Huganir (2004) and Voglis and Tavernarakis (2006)
Cdk5r1∗ Involved in the pathology of Alzheimer’s disease through thederegulated activity of cyclin-dependent kinase 5 (Cdk5), and alsoinvolved in synaptic plasticity, and learning and memory.
Angelo et al. (2006) and Shukla et al. (2012)
Cntn1 Contributes to the formation and function of neuronal connections,axon-glia communication, and necessary for myelin sheathformation by oligodendrocytes.
Ranscht (1988) and Çolakoglu et al. (2014)
Dlg3∗ Encodes a member of the membrane-associated guanylate kinaseprotein family; may play a role in clustering of N-methyl-D-aspartate(NMDA) receptors at excitatory synapses. It is highly enriched inthe postsynaptic density (PSD), and plays essential roles in synapticorganization and plasticity.
Elias and Nicoll (2007), Elias et al. (2008) and Wei et al. (2015)
Dpp6 Encodes an auxiliary subunit of voltage-gated potassium-4 channelsand regulates the A-type K+ current gradient, which regulatesdendritic excitability.
Nadal et al. (2003) and Wolf et al. (2014)
Eif5 Make 80S ribosomal initiation complex functional for translation. Si et al. (1996)
Gabrg1 Belongs to the ligand-gated ionic channel family. It is an integralmembrane protein and plays an important role in inhibitingneurotransmission.
Pirker et al. (2000) and Ye and Carew (2010)
Kcnab2∗ Encodes one of the beta subunits of the shaker-related Kv channels(Kv1.1 to Kv1.8) and found as a component of almost all potassiumchannel complexes containing Kv1 α subunits. It is a learning genethat is known to contribute to certain types of learning
Voglis and Tavernarakis (2006) and McKeown et al. (2008)
Mapk1∗ Encodes a member of the MAP kinase family and is known as alearning gene. Hippocampal expression of Mapk1 is essential forsynaptic plasticity and spatial learning.
Selcher et al. (2001), Sweatt (2001) and Thomas and Huganir (2004)
Mapre1 It is involved in the regulation of microtubule structures andchromosome stability.
Tirnauer et al. (2002) and Kim et al. (2013)
Ndfip2 Affects receptor tyrosine kinase signaling by ubiquitinating severalkey components of the signaling pathways through binding toE3 ubiquitin ligases.
Cristillo et al. (2003) and Mund and Pelham (2010)
Ppp2r2c Ppp2r2c gene encodes one of the four B regulatory subunits of theprotein phosphatase 2A (PP2A) enzyme complex. Inhibition of PP2Aby inhibitor I1PP2A results in deficits in spatial reference memory andmemory consolidation in adult rats.
Xu et al. (2006) and Backx et al. (2010)
Prkacb Encodes the catalytic beta subunit of protein kinase A (PKA).PKA activates CREB and contributes to learning induced geneexpression. Prkacb expression is required for LTP in theHippocampus.
Qi et al. (1996), Howe et al. (2002) and Nguyen and Woo (2003)
Pten∗ It modulates activation of the phosphatidylinositol 3-kinase(PI3K)/protein kinase B (Akt) pathway. PTEN independently controlsthe structural and functional properties of hippocampal synapsesand plays a direct role in activity-dependent hippocampal synapticplasticity such as LTP and LTD.
Maehama and Dixon (1998), Blair and Harvey (2012) and Sperowet al. (2012)
Rasgrp1 It is a guanine nucleotide-exchange factor. When it is activated byCa2+/calmodulin and diacylglycerol (DAG), it facilitates exchange ofGDP to GTP and activates Ras.
Stone (2006)
Scn2b Scn2b is a complex glycoprotein comprised of an alpha subunit andoften one to several beta subunits. It was reported to have a role inepilepsy.
Baum et al. (2014) and XiYang et al. (2016)
Stxbp1 Plays a role in release of neurotransmitters via regulation of syntaxin,a transmembrane attachment protein receptor.
Kurps and de Wit (2012)
Genes with an “*” were also identified as learning genes in a previous meta-analysis (Uddin and Singh, 2013). Legend: Camk1g, Calcium/calmodulin-dependent proteinkinase I gamma; Cdk5r1, Cyclin-dependent kinase 5, regul. subunit 1 (p35); Cntn1, Contactin 1; Dlg3, Discs, large homolog 3; Dlgap1, Discs, large homolog-associatedprotein 1; Dpp6, Dipeptidyl-peptidase 6; Eif5, Eukaryotic translation initiation factor 5; Gabrg1, Gamma-aminobutyric acid (GABA) A receptor, gamma 1; Impact, ImpactRWD domain protein (RWDD5); Kcnab2, Potassium channel, voltage gated shaker related subfamily A regulatory beta subunit 2; Mapk1, Mitogen-activated proteinkinase 1 (ERK); Mapre1, Microtubule-associated protein, RP/EB family, member 1; Ndfip2, Nedd4 family interacting protein 2; Ppp2r2c, Protein phosphatase 2, regulatorysubunit B, gamma; Prkacb, Protein kinase, cAMP-dependent, catalytic, beta; Pten, Phosphatase and tensin homolog; Rasgrp1, RAS guanyl releasing protein 1 (calciumand DAG-regulated); Scn2b, Sodium channel, voltage-gated, type II, beta; Stxbp1, Syntaxin binding protein 1.
Frontiers in Systems Neuroscience | www.frontiersin.org 12 October 2017 | Volume 11 | Article 75
The candidate ASLI hub genes were checked for theirrepeatability in networks constructed independently from B8,K9, and B7. The results are summarized in Table 6. Detailsof the hub gene validation data are available in SupplementaryTables S6–S11. The results show that a number of hubgenes from the yellow module are repeated in one ormore independent datasets in B8, K9 or B7 with a p-value≤ 0.05. From the R7 yellow module Prkacb, Scn2b, Cntn1,Pten and Ndfip2 were found present as hub genes in theK9 network; Dlgap1 was found in the B7 and B8 networks;and Camk1g was found repeated in the B7 network. Notably,many of these hub genes were in the list of top 20 meanKME values in other networks, but their p-values were notsignificant, for example, Dlg3, Mapre1, Dpp6, Stxbp1, Impact andMapk1.
DISCUSSION
In this research, we explored the idea that recent mathematicalmodeling approaches have the potential to fully utilize the geneinteraction information present in microarray data and to helpidentify useful new candidate genes and their networks. Inthis respect, we investigated the use of co-expression networksusing WGCNA for the first time in the analysis of ASLI
microarray gene expression data. The data represented youngrats that were learning unimpaired and aged rats that werepredominantly learning impaired. This allowed us to identifya set of network modules and ASLI candidate hub genes.These modules and candidate hub genes are repeatable acrossindependent datasets. The implications of major findings arediscussed below.
Co-Expression to Co-Functionality—Fromthe Perspective of ModulesOne useful property of a co-expression network is module. Ina module the expression patterns of the genes are mutuallycorrelated (Langfelder and Horvath, 2008). The focus onco-expression modules, each consisting of possibly hundredsof genes with common co-expression across samples, allowsfor a biologically motivated reduction of data while alsoalleviating the problem of multiple comparisons (Levineet al., 2013). Further, just as correlated genes tend tohave similar biological functions, on a larger scale, modulestend to contain genes with similar biological functions (Leeet al., 2004).The results obtained in this research and thefollow up network analysis support these hypotheses. Forexample, the use of WGCNA reduced R7 data into a fewbiologically meaningful co-expression modules. The followup GO analysis and literature search results were persuasiveenough to indicate that each module gene set likely servea distinct major biological function, thus, pointing to thewidely held notion of ‘‘co-expression to co-functionality’’.It is important to note that the networks and modulesconstructed from R7 microarray data were based on the geneexpression patterns alone (i.e., there was no prior knowledgeof the genes’ function at the time of network construction).Once the networks were divided into modules and theirmodule-wise GO functional analysis was performed, it wasindeed observed that each module pointed to a broad butdistinct category of biological function, and genes in each module
TABLE 6 | Significant ASLI candidate hub genes from the yellow “learning and memory” module and their repeatability in independent datasets.
Gene symbol Number of co-expression in R7 network Hub gene repeated in study t-test Known learning gene
Uddin and Singh Gene Networks in Learning Impairment
shared similar subcategories of functions all converging to thebroad functional category of the module (Table 3, Figure 4).Particularly, the genes in the yellow module showed significantenrichment in GO functions and pathways related to learningand memory formation in the brain. This is expected asthe young and aged rats used in the original research weretested for their memory performances where the experimentalyoung animals displayed clear learning unimpairment andthe majority of the aged animals demonstrated learningimpairment. The inclusion of various controls, including theaged animals that demonstrated learning unimpairment, servedas controls e.g., for stress, physical ability as well as forfactors that may contribute to learning irrespective of age.It is likely that the learning unimpaired aged rats mightalso display sign of learning impairment as they progresstowards further aging. Although, the other modules are enrichedwith functions not directly related to learning and memory,they are critical for normal neuronal processes such ascommunication, growth, development and maintenance. Forexample, genes in the brown module are significantly enrichedin functions contributing to the various cellular processes andcommunication, the green module genes in developmentalprocesses, and the red module genes in oligodendrocytedevelopment.
Thus, alteration of these modules’ normal module-wisefunctions at old age through altered gene expression, asobserved in the datasets, has the potential to affect normalfunctioning of learning and memory formation process.Preservation of these modules were not only validated acrossnetworks created from independent datasets, but also the genemembers of these modules demonstrated significant modulemembership (module overlap) across the independent networks(Figures 6–8).
Gene co-expression analysis studies in multiples species,tissues and platforms have shown that co-expressed genes tendto be functionally related (Williams and Bowles, 2004; Obayashiet al., 2008; Oldham et al., 2008). In order to investigate,whether observed clusters or modules of co-expressed genes areof functional significance, Lee and Sonnhammer (2003) observedthat genes involved in the same biochemical pathways tendto be clustered together in a number of eukaryotic genomes.By a heuristic generalization known as ‘‘guilt by association’’,it has been computationally established that functionallyrelated genes are organized into co-expression networks, inpractice assisting functional annotation of uncharacterized genes(Michalak, 2008). For example, physically interacting proteinsin yeast were found to be encoded by co-expressed genes(Ge et al., 2001; Wuchty et al., 2006). These observationslikely have inspired the development of co-expression networkanalysis methods. Gene network modeling using co-expressionapproaches provide insight into cellular activity as genes thatare co-expressed often share common functions (Piro et al.,2011). Such networks have been widely used to study manydiseases and phenotypes because of their ease of use andtheir ability to provide more biologically meaningful results(Gargalovic et al., 2006; Chen et al., 2008; Min et al., 2012;Zhou et al., 2014; Holtman et al., 2015; Maschietto et al.,
2015; Rickabaugh et al., 2015; Spiers et al., 2015; Ye and Liu,2015).
Microarray data captures functional relationship amonggenes that can provide biologically relevant information. Intraditional microarray data analysis, however, these relationshipsremain essentially unexplored. Thus, a modular approach to genefunction through WGCNA provides a sensible way to extractsuch functional information from large microarray datasetsin a biologically meaningful way. Particularly, this analysishas shown that specific learning associated functional genemodules can be identified through co-expression networkmodeling where genes in the module show significantenrichment in learning and synaptic plasticity related GOfunctions.
Gene Co-Expression toCo-Functionality—From the Perspective ofHub Genes: New Insight into the MolecularMechanisms of Learning and MemoryFormationHub genes play a central role in the structure of co-expressionnetworks as they are often relevant to the function of regulatorynetworks. The ability to efficiently transit cellular signals withinand between co-expressed clusters is facilitated by ‘‘hubs’’,which are connected to a large number of nodes (Gaiteriet al., 2014). Analysis of the yeast protein-protein interactionnetwork revealed that highly connected nodes are more likelyto be essential for survival (Jeong et al., 2000; Carter et al.,2004; Han et al., 2004). The co-expression networks of theyellow ‘‘learning and memory’’ module (Figure 8) display atight interrelationship of a large number of nodes with somehub genes. What is most interesting is that the co-expressionof these hubs and nodes, as demonstrated in this networkanalysis, is not a random aggregation of some genes. Literaturereview suggests that the correlated expression pattern of thehub genes in the yellow networks (Figure 8A) may in fact behighly coordinated, and inside the young rats’ hippocampusthey may be serving a common purpose. The combined effectof the functions of the hub genes that are co-expressingtogether in individual modules may in fact contribute to theco-functionality of the whole module. The purpose could beto maintain the functional integrity of the normal processof learning and memory formation mechanisms, which aredisrupted in the aging brain. Indeed, the side-by-side comparison(Figure 8) of the yellow module networks between young andaged rats demonstrates a clear difference in expression patterns.The majority of the genes in the aged yellow network showlower expression compared to the young. In addition, thecomparative analysis demonstrates differential co-expression formany genes between the two networks. These genes displaymore co-expression interaction than others and the number ofinteraction varies between the young and the aged networks.For example, the gene Dlg3 has 63 co-expression connectionswith other genes in the young network while only one in theaged. Similarly, Dpp6 has only two co-expression connectionswith other genes in the young network while 68 in the
Frontiers in Systems Neuroscience | www.frontiersin.org 14 October 2017 | Volume 11 | Article 75
Uddin and Singh Gene Networks in Learning Impairment
aged (Table 6). Since, such genes with many co-expressionconnections with other genes in a network often play a roleas hubs; we have short listed 19 of these genes as candidateASLI hub genes from both the young and aged yellow modulenetworks. These genes include Camk1g, Cdk5r1, Cntn1, Dlg3,Dlgap1, Dpp6, Eif5, Gabrg1, Impact, Kcnab2, Mapk1, Mapre1,Ndfip2, Ppp2r2c, Prkacb, Pten, Rasgrp1, Scn2b and Stxbp1(Table 4). The results show that some of these hub genesare already known as key learning and memory genes andhave well established roles in memory functions. While forothers, information is emerging indicating their direct orindirect role in learning and memory. Below we summarizewhat is already known from the literature about the molecularmechanisms of learning and memory formation and how thecandidate ASLI hub genes from this research fit into that bigpicture.
Role of Camk1g, Dlg3, Dlgap1, Dpp6, Kcnab2,Mapk1 and Stxbp1 in CREB Related PathwaysSeveral major signaling pathways seem to modulate synapticplasticity mechanisms in the brain and have been implicatedin learning and memory formation processes (Sweatt, 2001;Nguyen and Woo, 2003; Ye and Carew, 2010; Baudry et al.,2015). Some of the major pathways relevant to this studyinclude the PKA, CaMKs, MAPK and PI3K/Akt pathways thathave been implicated in LTP formation. LTP is a synapticplasticity mechanism and a cellular correlates thought to underlielearning and memory. Following external stimulation, a setof crucial upstream events are necessary for their activation,which include NMDA receptors and the resulting calciuminflux.
Calcium-dependent phosphorylation of CREB is primarilycaused by PKA, CaMK and MAP kinase, which leads toprolonged CREB phosphorylation. CREB in turn contributes tothe transcription of a set of immediate early genes implicated inlearning and memory formation. CREB is thought to mediatelong-lasting changes in brain function. For example, CREB hasbeen implicated in spatial learning, behavioral sensitization,long-term memory of odorant-conditioned behavior, andlong-term synaptic plasticity (Thomas and Huganir, 2004;Alberini, 2009; Chen et al., 2010; Sweatt, 2010). The ASLIcandidate hub genes that are important in the CREB relatedpathways include Camk1g, Dlg3, Dlgap1, Dpp6, Kcnab2, Mapk1and Stxbp1. For example, Stxbp1 plays a role in releasingof neurotransmitters via regulation of syntaxin (Kurps andde Wit, 2012) and may serve to transfer of signal throughthe synapse. Dlg3, also known as synapse-associated protein102 (SAP102), is a scaffolding protein highly enriched inthe postsynaptic density (PSD), and plays an essential rolein synaptic organization and plasticity (Elias and Nicoll,2007). Dlg3 interacts directly or indirectly with major typesof glutamate receptors. It binds directly to N-methyl-d-aspartate receptors (NMDARs), anchors receptors at synapses,and facilitates transduction of NMDAR signals (Wei et al.,2015).
CaMKs, particularly CaMKII has been shown to be directlyactivated by calcium influx through the NMDA receptor. CaMKs
play a significant role in learning and memory formationthrough the activation of CREB signaling (Sweatt, 2001; Bito andTakemoto-Kimura, 2003; Thomas and Huganir, 2004; Baudryet al., 2015). It is very likely that Camk1g, which has not beenreported before in relation to memory impairment, may functionin a similar manner. It is likely that down-regulation of Camk1gin the aged rats may in fact contribute to ASLI in those animalsthrough the CaMK pathway to modulate CREB phosphorylation.
Camk1g co-expression with other learning genes such asMapk1, Kcnab2 and Dpp6, functioning in the MAPK pathwayor in various ion channels indicate a potential co-functioningof these genes towards learning and memory formation. Somemay involve a feed-back loop type activation/mechanism. Forexample, during the early phase of LTP at postsynaptic terminalsof CA1 hippocampal neurons, calcium entering through α-amino-3-hydroxy-5-methyl-4-isoxazolepropionic acid (AMPA)and NMDA receptors activates CaMKII, which phosphorylatesKv channels and increases neuronal excitability (Sweatt, 2001).Similarly, Mapk1, stimulated by elevated levels of cAMPas a result of calcium entry and subsequent activationof adenylyl cyclase-1, phosphorylates the A-type potassiumchannel (Kv1.4 and Kv4.2) resulting in increased depolarization,allowing influx of Ca2+ through the NMDA and voltage-gated Ca2+ channels, which results in increased cAMPlevels in the hippocampus in mice. The increase in Ca2+
and cAMP induces the MAPK pathway. Thus, the inducedpathway activates additional pools of MAPK1, some ofwhich can further increase phosphorylation of Kv1.4 andKv4.2, whereas others may phosphorylate nuclear targets.Voltage-gated potassium (Kv) channels play important rolesin regulating the excitability of neurons and other excitablecells. Subthreshold activating, rapidly inactivating, A-type K+
currents are non-uniformly expressed in the primary apicaldendrites of rat hippocampal CA1 pyramidal neurons, withdensity increasing with distance from the soma (Hoffman et al.,1997). These changes correlate with impaired spatial memoryand context discrimination (Morozov et al., 2003). Note thatthe ASLI candidate gene Kcnab2 encodes one of the betasubunits of the Kv channels (Kv1.1 to Kv1.8) and this subunitis found as a component of almost all potassium channelcomplexes containing Kv1α subunits (McKeown et al., 2008).Deletion of Kcnab2 in mice leads to deficits in associativelearning and memory and loss of this gene function likelycontributes to the cognitive and neurological impairmentsin humans (Voglis and Tavernarakis, 2006; Perkowski andMurphy, 2011). The role of Mapk1 through MAPK (ERK)signaling is not only documented in LTP, but also in spatiallearning (Blum et al., 1999; Selcher et al., 2001; Sweatt,2001; Thomas and Huganir, 2004). DPP6 may take partby regulating the A-type K+ current gradient, ultimatelycontributing to synaptic integration and dendritic excitability(Nadal et al., 2003; Wolf et al., 2014). The action potentialfiring and dendritic excitability must be balanced by inhibitionin hippocampal neuron. This is likely achieved by Gabrg1(Costa et al., 2002; Cui et al., 2008) and a number of otherGABA receptors that demonstrated co-expression in the yellowmodule.
Frontiers in Systems Neuroscience | www.frontiersin.org 15 October 2017 | Volume 11 | Article 75
Uddin and Singh Gene Networks in Learning Impairment
Dendritic integration of synaptic inputs is fundamentalto information processing in neurons of diverse function,serving as a link between synaptic molecular pathways andhigher-order network function (Sun et al., 2011). Dendriticion channels play a critical role in regulating such informationprocessing and are targets for modulation during synapticplasticity (Shah et al., 2010). Normal experience-dependentchanges in the excitability of dendrites (dendritic plasticity),involving the down-regulation of A-type K+ currents bydown-regulation of Dpp6 (observed here), may representa mechanism by which neurons store recent experiencein individual dendritic branches (Makara et al., 2009).Down-regulation of Kcnab2 may contribute to the reduction ofA-type potassium channel currents through reduced availabilityof Kv1.4. Future studies are required to investigate the effect ofDpp6 and Kcnab2 in synaptic development and spatial memoryformation.
Role of Prkacb in the PKA PathwayPrkacb, a new ASLI candidate in the PKA pathway, onceactivated by a variety of upstream signals, including calcium,can phosphorylate and regulate a variety of downstreamsignaling cascades linked to regulation of transcriptionand translation (Baudry et al., 2015). It can phosphorylateAMPA and NMDA receptors and regulate their functions.PKA plays a major role in long-term changes in synapticstrength in the brain (Nguyen and Woo, 2003) and hasbeen well known for its critical role in learning andmemory formation (Waltereit and Weller, 2003). There aredirect genetic evidence that the Prkacb isoform is requiredfor long-term depression, long-term potentiation anddepotentiation in the hippocampus (Qi et al., 1996; Howeet al., 2002).
Role of Ndfip2, Pten and Rasgrp1 in the PI3K/Aktand Related PathwayAnother pathway that is making itself relevant in this bigpicture is the PI3K/Akt pathway. A set of genes involved hereinclude the ASLI candidate genes Ndfip2, Pten and Rasgrp1.Ndfip2 and Pten were down-regulated in the aged comparedto the young (effect size = −0.38, p-value = 0.22 and effectsize = −0.37, p-value of 0.01, respectively). In the brain,tyrosine kinase receptor TrkA is phosphorylated on the plasmamembrane by the binding of another growth factor NGF,which later activates three major signaling pathways: the PI3 kinase pathway leading to activation of Akt kinase, theras pathway leading to MAP kinases, and the PLC pathwayleading to release of intracellular Ca2+ and activation of PKC(Purves et al., 2004). Ndfip2 affect tyrosine kinase signalingpathway through Nedd4 ligases (Cristillo et al., 2003), whichassociate with EGF receptor and Pten (Blair and Harvey, 2012;Sperow et al., 2012). Based on literature information it canbe hypothesized that Ndfip2 may modulate the EGF signalingcascade (Mund and Pelham, 2010); it is possible that Ndfip2might be working in the same fashion as NGF in the brainto influence not only Akt kinase pathway through Akt, butalso other pathways such ras, MAPK, and PLC. In fact, EGF
and NGF share the same Raf → MEK → MAPK pathwayto promote distinct outcomes (Vaudry et al., 2002). However,EGF and NGF likely work differently and on different receptortyrosine kinases (Lee et al., 2002). Therefore, the role ofNdfip2 in learning and memory can be investigated in a futureexperiment.
MAPKs are normally inactive in neurons but becomeactivated when they are phosphorylated by other kinases.In fact, MAPKs are part of a kinase cascade in whichone protein kinase phosphorylates and activates the nextprotein kinase in the cascade (Purves et al., 2004). Theextracellular signals that trigger these kinase cascades areoften extracellular growth factors that bind to receptortyrosine kinases that, in turn, activate monomeric G-proteinssuch as Ras. Rasgrp1, once activated by Ca2+/calmodulinand diacylglycerol (DAG), facilitates the exchange of GDPfor GTP and may trigger downstream Mapk1 signaling(Stone, 2006). Once activated, MAPKs can phosphorylatetranscription factors, proteins that regulate gene expression,and may contribute to long-term memory formation(Adams and Sweatt, 2002; Sharma et al., 2003). Indeed,Rasgrp1 may be a novel link between molecules activatedin behavioral paradigms such as phospholipase C and thewell-known Ras–MAPK pathway (Buckley and Caldwell,2004).
Although, Pten is known to play a direct role in regulatinghippocampal synaptic plasticity, the precise mechanismsunderlying Pten modulation of synaptic plasticity suchas LTP and LTD are not fully known. Recent studiessuggest its involvement in postsynaptic mechanism asPTEN inhibition promotes AMPA receptor trafficking tosynapses leading to a persistent increase in excitatory synapticstrength in adult hippocampal slices (Moult et al., 2010).On the other hand, enhanced PTEN lipid phosphataseactivity has been reported to depress excitatory synaptictransmission, which in turn is required for NMDA receptor-dependent LTD (Jurado et al., 2010). In light of thisresearch, Pten is an excellent candidate to study further forit potential involvement in ASLI and the mechanisms inplay.
Role of Cntn1, Mapre1 and Ppp2r2c in Learning andMemoryCo-expression of genes like Cntn1, Mapre1, etc., which haveknown functions in neuronal structure, indicates that thesegenes play an essential role in learning and memory alongwith other genes discussed above. For example, Mapre1 iswell known to regulate microtubule dynamics (Tirnauer et al.,2002). It plays a crucial role in ADNP function along withother molecules including Dlg4 and offer protection againstcognitive deficiencies in mice (Oz et al., 2014). Cntn1 isnecessary for myelin sheath formation by oligodendrocytes andprovides critical signal in axon-glia communication (Ranscht,1988; Çolakog lu et al., 2014). Ppp2r2c, another new ASLIcandidate gene, forms a part of PP2A (protein phosphatase 2A)enzyme complex, which catalyzes a broad range of substrates(Xu et al., 2006). Ppp2r2c has been suggested to have a role in
Frontiers in Systems Neuroscience | www.frontiersin.org 16 October 2017 | Volume 11 | Article 75
Uddin and Singh Gene Networks in Learning Impairment
synaptic plasticity and hence learning and memory (Backx et al.,2010).
SUMMARY
Taken together, this research has identified a set of candidatehub genes that all co-express together in a single gene networkmodule. These genes are known to participate in multipledifferent cellular signaling pathways such as PKA, MapK andCamK as discussed above. Overall, reversible phosphorylation ofproteins by kinase and phosphatase enzymes constitutes somemajor forms of signaling (Backx et al., 2010). These differentsignaling cascades converge on a common set of mechanisms:(1) post-translational protein modifications; (2) translationalregulation; and (3) regulation of gene expression (Purveset al., 2004; Sweatt, 2010; Baudry et al., 2015). Ultimately,these mechanisms are linked to a few of the commonevents responsible for LTP such as increased number ofpostsynaptic receptors, and increased dendritic spines. In fact,these mechanisms are not isolated; rather, multiple cross-talkbetween the signaling pathways exist, which suggests thatdepending on the conditions, various form of LTP or LTD canbe triggered with different features (Middei et al., 2014; Baudryet al., 2015). Thus, the signaling pathways are involved in themechanism of synaptic plasticity, which in turn is the molecularmechanism for learning and memory (Sweatt, 2001; Barco et al.,2006; Chen et al., 2010). Thus, co-expression of the hub genesalong with other genes in the yellow module seems to beleading to a common function in the hippocampus in the brain,which in this case is ASLI. Results from the meta-analysis forthese genes strengthen this conclusion (Supplementary FiguresS11–S25). The combined meta-analysis results for these hubgenes show that they were expressed at a very low level in thebrain with comparatively lower standardized mean differencesbetween young and aged, and thus failed to appear towardsthe top in the differentially expressed aging or learning genelist (Supplementary Tables S1, S2 in Uddin and Singh, 2013).Down-regulation of the majority of the hub genes in the agedrats (Figure 8B) may play a critical role in the spatial learningimpairment in the Morris water maze protocol. Interestingly,many of the hub genes’ individual expression patterns followwhat is reported in the literature in respect to their potentialrole in aging associated learning and memory impairment,for example Camk1g, Dlg3, Dpp6, Mapk1, Mapre1, Ndfip2,Ppp2r2c, Pten, Prkacb and Rasgrp1. Some other hub genessuch as Cdk5r1, Cntn1, Impact, Kcnab2, Scn2b and Stxbp1 mayhave more indirect role. The main function of this secondcategory of genes may involve contributing to the regulationof normal neuronal structure and functions, dysregulation ofwhich become vulnerable at old age, and thus may indirectlycontribute to the overall instability of the memory formationmechanism.
In this research, the findings of a specific ‘‘learningand memory’’ module and the associated key hubgenes with their known role in learning and memoryformation offer a promising insight and a plausiblelogical expansion to our existing knowledge about the
molecular correlates of the mechanisms underlying memoryformation, synaptic plasticity and age-associated learningimpairment.
Differential Expression vs. DifferentialCo-Expression vs. Differential ConnectivityDifferential co-expression refers to changes in gene-genecorrelations between two sets of phenotypically distinctsamples (de la Fuente, 2010). Changes in gene-genecorrelation may occur in the absence of differential expression,meaning that a gene may undergo changes in regulatorypattern that would be undetected by traditional differentialexpression analysis (Gaiteri et al., 2014). The fact that thealtered regulatory patterns observed within tissues acrossphenotypic states in manners that are reflected in alteredco-expression networks has been shown in aging mice(Southworth et al., 2009), across corticolimbic regions inmajor depression (Gaiteri et al., 2010) and between miRNA’sin Alzheimer’s disease (Bhattacharyya and Bandyopadhyay,2013).
What becomes apparent is that the differential expressionand differential co-expression may point to distinct cellularmechanisms involved in ASLI, which may be working indifferent ways in the cell. For example, our differential expressionmeta-analysis has identified a large number of genes showingsignificantly altered expression in the aged rats comparedto young rats (Supplementary Tables S1, S2 in Uddin andSingh, 2013). These genes include many immediate early(e.g., Arc) or late phase genes (during gene expression) aswell as other genes contributing to aging and ASLI. Majorfunctions disrupted by these genes include cell viability,axonogenesis, quantity and synthesis of IP3 and formation ofcells.
On the other hand differential co-expression analysispresented here identified a set of modules each with distinctfunctions. In addition, it has identified a set of candidateASLI hub genes in one of those modules. From the knownfunction of these hub genes as explained above, it isevident that many of these genes function as kinases andphosphatases in the neuronal information flow process, startingfrom the synaptic junctions/synapses to the nucleus toactivate various transcription factors. Though scattered indifferent networks, meta-analysis has also identified few hubgenes functioning as kinases or in ion channels. Thus thehub genes may be triggering one or more mechanismsthat activate other key factors in a number of pathways,which set the stage for the expression of several immediateearly or late phase genes, which again most likely activatethe expression of majority of the differentially expressedgenes. Learning in the young animals most likely inducessuch mechanisms that synchronously regulate transcription ofmultiple genes, and may potentially generate co-expressionrelationships.
Another important observation to note is that all thelearning related genes identified in the differential expressionand pathway analyses (and genes they generally interact with)
Frontiers in Systems Neuroscience | www.frontiersin.org 17 October 2017 | Volume 11 | Article 75
Uddin and Singh Gene Networks in Learning Impairment
are scattered in different networks and pathways (Appendix6.3.1 to Appendix 6.4.4 in Uddin, 2015). In contrast, thecurrent differential co-expression analysis identified manyknown learning genes (or genes that appear to be contributing tolearning and memory functioning) that are highly concentratedand co-expressed in the yellow ‘‘learning and memory’’module.
Interestingly, the candidate ASLI hub genes are expressedat a comparatively lower level, with small differences inexpression (e.g., effect size) between young and aged samples.For example, the Prkacb hub gene was not known to be alearning gene (Supplementary Tables S3, S4 in Uddin andSingh, 2013). Like Prkacb, most of the hub genes failed toshow significant effect size or differential expression valuesand remained undetected in the meta-analysis (SupplementaryTables S1, S2 in Uddin and Singh, 2013). This fact highlightsthe importance of alternate analysis like WGCNA to identifygenes that are not detected using the traditional methods. Similarobservations have been demonstrated in past studies (Rhinnet al., 2012). For example, the alpha synuclein gene variant‘‘aSynL’’, containing a long 3′sUTR, was identified as the mostdifferentially coexpressed gene in several Parkinson’s diseasedatasets. However, aSynL was not highly differentially expressedand thus would have likely been overlooked by traditionalmicroarray analysis (Gaiteri et al., 2014). Thus, through theidentification of modules and hubs, differential co-expressionanalysis can be used to prioritize specific phenotype-relatedimportant molecules.
Another very interesting property of co-expression networksis the network connectivity. Our findings (SupplementaryFigure S26) support the newly emerging hypothesis (Oldhamet al., 2006; Miller et al., 2008) that differential connectivityis different from differential expression. During the networkconstruction process, I selected genes with high connectivityand filtered out all low connectivity genes (SupplementaryTable S2). The observation is that the resulting networkmodules represent a set of highly connected genes as hubsthat were virtually absent in the differentially expressed topgene list (in Uddin and Singh, 2013) and vice versa. In fact,it has been reported that gene-gene correlations in diseasecan occur with or without changes in expression (Hudsonet al., 2009). In addition, differentially expressed genes insome complex psychiatric diseases can have low connectivity,which reside on the periphery of co-expression networks forneuropsychiatric disorders such as depression, schizophreniaand bipolar disorder (Gaiteri and Sibille, 2011; Gaiteri et al.,2014).
FUTURE DIRECTIONS
The candidate ASLI genes (including hub genes) and genenetworks identified in this research become excellent candidatesfor further investigations. Particularly, the hub genes canprovide a different perspective on gene regulation as they canserve as excellent targets to examine the biological significanceof a network module. They could be targeted to see notonly a perturbation effect of altered regulation on network
module structure and function, but for therapeutic use as well.Co-expression modules are not in fact completely modular asthere are often correlations among the members of differentmodules (Gaiteri et al., 2014). Therefore, any perturbation effectwill likely extend outside of a module and will need to be studied.Since, differential co-expression is likely related to alteredgene regulation, experiments involving ChIP, or ChIP-seq ofpotential transcription factors, can be designed to capturerelated gene regulatory mechanisms after any perturbation.Epigenetic mechanism are also intimately involved during thegene expression process in learning and memory formation(Levenson and Sweatt, 2005, 2006; Gräff and Mansuy, 2008;Franklin and Mansuy, 2010; Sweatt, 2010). So, changes inchromatin structure, methylation and acetylation pattern, as wellas miRNA population changes should also be investigated.
For the purpose of future investigation, the candidateASLI hub genes could be grouped into three categories:(1) Hub genes whose role in learning (including spatiallearning) is more transparent than others (i.e., gene withwell-established roles in memory, for example, Camk1g, Dlg3,Mapk1, Ppp2r2c and Prkacb); (2) Hub genes (e.g., Cdk5r1,Cntn1, Scn2b, Stxbp1, Eif5 and Gabrg1) where there isnot enough information in the literature to support whichdirection their expression pattern contributes to the ASLIphenotype; and (3) Hub genes where information is emergingindicating their direct or indirect role in learning andmemory (e.g., Pten, Kcnab2, Mapre1, Ndfip1, Rasgrp1 andDpp6).
One way to learn the specific effects of hub genes is throughknockout experiments. This is because the hub genes are likelyto act as drivers of the disease status due to their key positionsin the gene networks (Allen et al., 2012). It is known thattransmission of signal through scale-free cellular networks isunlikely to be affected by random node deletion; rather itis especially vulnerable to targeted hub attack (Albert et al.,2000). This observation is supported by examples from multiplemolecular and brain networks in which hub targeting leads tocrucial functional impairment (Stam et al., 2007). Practically, hubgenes have been the specific focus for investigations into manydisease-correlated modules (Miller et al., 2008; Ray et al., 2008;Torkamani et al., 2010; Voineagu et al., 2011; Maschietto et al.,2015; Ye and Liu, 2015). Analysis of hub genes has been shown tobe a promising approach in identifying key genes in many otherphenotypic conditions (Kendall et al., 2005; Mani et al., 2008;Slavov and Dawson, 2009; Nibbe et al., 2010; Zhou et al., 2014;Holtman et al., 2015; Rickabaugh et al., 2015; Spiers et al., 2015).Such genes are often of biological interest because of their criticalinvolvement in regulatory pathways or sub-networks and thesegenes often incur a substantial effect on the pathways as a whole.The candidate ASLI hub genes identified in this research mayvery likely present a snapshot of what is going on inside braincells during the memory formation process.
CONCLUSION
Despite significant research in the past, ASLI genes and networksremain largely unclear and were the main focus of this article.
Frontiers in Systems Neuroscience | www.frontiersin.org 18 October 2017 | Volume 11 | Article 75
Uddin and Singh Gene Networks in Learning Impairment
The major goal of this research was to identify genes and genenetworks in ASLI in rats from multiple independent but relatedgene expression datasets.
In order to overcome some limitations in traditional meta-and pathway analysis, we explored the option of using amathematical modeling approach that could better utilize theinformation captured in microarray data. We chose to useWGCNA and applied it on a set of R7 exploratory datasetscontaining young rats that were learning unimpaired and agedrats that were predominantly learning impaired. This analysesidentified a set of gene network modules. To our satisfaction,WGCNA offered a way of prioritizing the molecules solelybased on data and without any knowledge of their functions(i.e., by grouping genes into co-expressing network modules).This finding was confirmed by the follow up GO analysiswhich showed that each module is highly enriched with genesfunctioning in some broad but distinct GO functional categoriesor biological pathways. Further, these modules show significantrepeatability in independent young and aged validation datasets.Interestingly, this analysis identified a single learning andmemory related module and within the module a set of uniquehub genes related to ASLI. Majority of the candidate ASLIhub genes from this module remained undetected in ourprevious meta- and differential expression analysis. Some ofthese hub genes also show significant repeatability in networksgenerated from independent validation datasets. These hubgenes are highly co-expressed with other genes in the ‘‘learningand memory’’ module. In network comparison between youngand aged, these genes not only show differential expressionbut also differential co-expression and differential connectivity.These likely explain the spatial learning impairment thatwas observed in the aged rats compared to the young. Theknown function of these hub genes indicate that they playkey roles in critical pathways relating to synaptic plasticityand memory formation. Collectively, they provide a deeperunderstanding of the mechanisms that may be involved.
These candidate ASLI hub genes seem highly promising toinvestigate further to understand the regulatory networks inASLI.
Co-expression network analysis as applied in this researchshows how to transform large-scale gene expression microarraydata involving spatial learning impairment in rats into severaltestable hypotheses related to ASLI. This type of analysis cancomplement traditional analysis of microarray data and can helpbetter understand how genes interact with each other, how theyare regulated, and what target genes they may affect in orderto elucidate the mechanisms behind complex phenotype such asaging and ASLI.
AUTHOR CONTRIBUTIONS
RU and SMS conceived and designed the experiments;contributed materials and analysis tools, and wrote this article.RU performed the experiments and analyzed the data.
FUNDING
This research was financially supported by the Department ofBiology, Western University, Canada and a discovery grantto SMS from the National Science and Engineering ResearchCouncil of Canada (R2258).
ACKNOWLEDGMENTS
This research was completed by RU as part of his Ph.D. thesis(Uddin, 2015) under the supervision of SMS.
SUPPLEMENTARY MATERIAL
The Supplementary Material for this article can be foundonline at: https://www.frontiersin.org/articles/10.3389/fnsys.2017.00075/full#supplementary-material
REFERENCES
Adams, J. P., and Sweatt, J. D. (2002). Molecular psychology: roles for the ERKMAP kinase cascade in memory. Annu. Rev. Pharmacol. Toxicol. 42, 135–163.doi: 10.1146/annurev.pharmtox.42.082701.145401
Alberini, C. M. (2009). Transcription factors in long-term memory andsynaptic plasticity. Physiol. Rev. 89, 121–145. doi: 10.1152/physrev.00017.2008
Albert, R., Jeong, H., and Barabasi, A. L. (2000). Error and attack tolerance ofcomplex networks. Nature 406, 378–382. doi: 10.1038/35019019
Allen, J. D., Xie, Y., Chen, M., Girard, L., and Xiao, G. (2012). Comparing statisticalmethods for constructing large scale gene networks. PLoS One 7:e29348.doi: 10.1371/journal.pone.0029348
Angelo, M., Plattner, F., and Giese, K. P. (2006). Cyclin-dependent kinase5 in synaptic plasticity, learning and memory. J. Neurochem. 99, 353–370.doi: 10.1111/j.1471-4159.2006.04040.x
Backx, L., Vermeesch, J., Pijkels, E., de Ravel, T., Seuntjens, E., and VanEsch, H. (2010). PPP2R2C, a gene disrupted in autosomal dominant intellectualdisability. Eur. J. Med. Genet. 53, 239–243. doi: 10.1016/j.ejmg.2010.06.006
Barco, A., Bailey, C. H., and Kandel, E. R. (2006). Common molecular mechanismsin explicit and implicit memory. J. Neurochem. 97, 1520–1533. doi: 10.1111/j.1471-4159.2006.03870.x
Baudry, M., Zhu, G., Liu, Y., Wang, Y., Briz, V., and Bi, X. (2015). Multiple cellularcascades participate in long-term potentiation and in hippocampus-dependentlearning. Brain Res. 1621, 73–81. doi: 10.1016/j.brainres.2014.11.033
Baum, L., Haerian, B. S., Ng, H. K., Wong, V. C., Ng, P. W., Lui, C. H., et al. (2014).Case-control association study of polymorphisms in the voltage-gated sodiumchannel genes SCN1A, SCN2A, SCN3A, SCN1B, and SCN2B and epilepsy.Hum. Genet. 133, 651–659. doi: 10.1007/s00439-013-1405-1
Bhattacharyya, M., and Bandyopadhyay, S. (2013). Studying the differentialco-expression of microRNAs reveals significant role of white matter inearly Alzheimer’s progression. Mol. Biosyst. 9, 457–466. doi: 10.1039/c2mb25434d
Bito, H., and Takemoto-Kimura, S. (2003). Ca2+/CREB/CBP-dependent generegulation: a shared mechanism critical in long-term synaptic plasticityand neuronal survival. Cell Calcium 34, 425–430. doi: 10.1016/s0143-4160(03)00140-4
Blair, P. J., and Harvey, J. (2012). PTEN: a new player controlling structural andfunctional synaptic plasticity. J. Physiol. 590:1017. doi: 10.1113/jphysiol.2012.227868
Blalock, E. M., Chen, K. C., Sharrow, K., Herman, J. P., Porter, N. M., Foster, T. C.,et al. (2003). Gene microarrays in hippocampal aging: statistical profilingidentifies novel processes correlated with cognitive impairment. J. Neurosci. 23,3807–3819.
Frontiers in Systems Neuroscience | www.frontiersin.org 19 October 2017 | Volume 11 | Article 75
Uddin and Singh Gene Networks in Learning Impairment
Blum, S., Moore, A. N., Adams, F., and Dash, P. K. (1999). A mitogen-activatedprotein kinase cascade in the CA1/CA2 subfield of the dorsal hippocampus isessential for long-term spatial memory. J. Neurosci. 19, 3535–3544.
Bolstad, B. M., Irizarry, R. A., Astrand, M., and Speed, T. P. (2003). A comparisonof normalization methods for high density oligonucleotide array data basedon variance and bias. Bioinformatics 19, 185–193. doi: 10.1093/bioinformatics/19.2.185
Buckley, C. T., and Caldwell, K. K. (2004). Fear conditioning is associated withaltered integration of PLC and ERK signaling in the hippocampus. Pharmacol.Biochem. Behav. 79, 633–640. doi: 10.1016/j.pbb.2004.09.013
Burger, C., Lopez, M. C., Baker, H. V., Mandel, R. J., and Muzyczka, N. (2008).Genome-wide analysis of aging and learning-related genes in the hippocampaldentate gyrus. Neurobiol. Learn. Mem. 89, 379–396. doi: 10.1016/j.nlm.2007.11.006
Burger, C., Löpez, M. C., Feller, J. A., Baker, H. V., Muzyczka, N., and Mandel, R. J.(2007). Changes in transcription within the CA1 field of the hippocampusare associated with age-related spatial learning impairments. Neurobiol. Learn.Mem. 87, 21–41. doi: 10.1016/j.nlm.2006.05.003
Burgess, N. (2002). The hippocampus, space, and viewpoints in episodic memory.Q. J. Exp. Psychol. A 55, 1057–1080. doi: 10.1080/02724980244000224
Carter, S. L., Brechbühler, C. M., Griffin, M., and Bond, A. T. (2004).Gene co-expression network topology provides a framework formolecular characterization of cellular state. Bioinformatics 20, 2242–2250.doi: 10.1093/bioinformatics/bth234
Chen, Y., Zhu, J., Lum, P. Y., Yang, X., Pinto, S., MacNeil, D. J., et al. (2008).Variations in DNA elucidate molecular networks that cause disease. Nature452, 429–435. doi: 10.1038/nature06757
Chen, G., Zou, X., Watanabe, H., van Deursen, J. M., and Shen, J. (2010).CREB binding protein is required for both short-term and long-term memoryformation. J. Neurosci. 30, 13066–13077. doi: 10.1523/JNEUROSCI.2378-10.2010
Çolakoglu, G., Bergstrom-Tyrberg, U., Berglund, E. O., and Ranscht, B. (2014).Contactin-1 regulates myelination and nodal/paranodal domain organizationin the central nervous system. Proc. Natl. Acad. Sci. U S A 111, E394–E403.doi: 10.1073/pnas.1313769110
Costa, R. M., Federov, N. B., Kogan, J. H., Murphy, G. G., Stern, J., Ohno, M.,et al. (2002). Mechanism for the learning deficits in a mouse model ofneurofibromatosis type 1. Nature 415, 526–530. doi: 10.1038/nature711
Cristillo, A. D., Nie, L., Macri, M. J., and Bierer, B. E. (2003). Cloning andcharacterization of N4WBP5A, an inducible, cyclosporine-sensitive, Nedd4-binding protein in human T lymphocytes. J. Biol. Chem. 278, 34587–34597.doi: 10.1074/jbc.M304723200
Cui, Y., Costa, R. M., Murphy, G. G., Elgersma, Y., Zhu, Y., Gutmann, D. H., et al.(2008). Neurofibromin regulation of ERK signaling modulates GABA releaseand learning. Cell 135, 549–560. doi: 10.1016/j.cell.2008.09.060
de Jong, S., Fuller, T. F., Janson, E., Strengman, E., Horvath, S., Kas, M. J.,et al. (2010). Gene expression profiling in C57BL/6J and A/J mouse inbredstrains reveals gene networks specific for brain regions independent of geneticbackground. BMC Genomics 11:20. doi: 10.1186/1471-2164-11-20
de la Fuente, A. (2010). From ‘differential expression’ to ‘differentialnetworking’—identification of dysfunctional regulatory networks in diseases.Trends Genet. 26, 326–333. doi: 10.1016/j.tig.2010.05.001
Elias, G. M., Elias, L. A., Apostolides, P. F., Kriegstein, A. R., and Nicoll, R. A.(2008). Differential trafficking of AMPA and NMDA receptors by SAP102 andPSD-95 underlies synapse development. Proc. Natl. Acad. Sci. U S A 105,20953–20958. doi: 10.1073/pnas.0811025106
Elias, G. M., and Nicoll, R. A. (2007). Synaptic trafficking of glutamate receptorsby MAGUK scaffolding proteins. Trends Cell Biol. 17, 343–352. doi: 10.1016/j.tcb.2007.07.005
Fontenot, M., and Konopka, G. (2014). Molecular networks and the evolutionof human cognitive specializations. Curr. Opin. Genet. Dev. 29, 52–59.doi: 10.1016/j.gde.2014.08.012
Franklin, T. B., and Mansuy, I. M. (2010). The prevalence of epigeneticmechanisms in the regulation of cognitive functions and behaviour. Curr. Opin.Neurobiol. 20, 441–449. doi: 10.1016/j.conb.2010.04.007
Fresno, C., and Fernández, E. A. (2013). RDAVIDWebService: aversatile R interface to DAVID. Bioinformatics 29, 2810–2811.doi: 10.1093/bioinformatics/btt487
Friedman, N., Linial, M., Nachman, I., and Pe’er, D. (2000). Using Bayesiannetworks to analyze expression data. J. Comput. Biol. 7, 601–620.doi: 10.1089/106652700750050961
Fuller, T. F., Ghazalpour, A., Aten, J. E., Drake, T. A., Lusis, A. J., and Horvath, S.(2007). Weighted gene coexpression network analysis strategies appliedto mouse weight. Mamm. Genome 18, 463–472. doi: 10.1007/s00335-007-9043-3
Gaiteri, C., Ding, Y., French, B., Tseng, G. C., and Sibille, E. (2014).Beyond modules and hubs: the potential of gene coexpression networks forinvestigating molecular mechanisms of complex brain disorders. Genes BrainBehav. 13, 13–24. doi: 10.1111/gbb.12106
Gaiteri, C., Guilloux, J. P., Lewis, D. A., and Sibille, E. (2010). Alteredgene synchrony suggests a combined hormone-mediated dysregulatedstate in major depression. PLoS One 5:e9970. doi: 10.1371/journal.pone.0009970
Gaiteri, C., and Sibille, E. (2011). Differentially expressed genes in majordepression reside on the periphery of resilient gene coexpression networks.Front. Neurosci. 5:95. doi: 10.3389/fnins.2011.00095
Gargalovic, P. S., Imura, M., Zhang, B., Gharavi, N. M., Clark, M. J., Pagnon, J.,et al. (2006). Identification of inflammatory gene modules based on variationsof human endothelial cell responses to oxidized lipids. Proc. Natl. Acad. Sci.U S A 103, 12741–12746. doi: 10.1073/pnas.0605457103
Gautier, L., Cope, L., Bolstad, B. M., and Irizarry, R. A. (2004). Affy—analysisof Affymetrix GeneChip data at the probe level. Bioinformatics 20, 307–315.doi: 10.1093/bioinformatics/btg405
Ge, H., Liu, Z., Church, G. M., and Vidal, M. (2001). Correlation betweentranscriptome and interactome mapping data from Saccharomyces cerevisiae.Nat. Genet. 29, 482–486. doi: 10.1038/ng776
Glorioso, C., Oh, S., Douillard, G. G., and Sibille, E. (2011). Brain molecularaging, promotion of neurological disease and modulation by Sirtuin5 longevitygene polymorphism. Neurobiol. Dis. 41, 279–290. doi: 10.1016/j.nbd.2010.09.016
Gräff, J., and Mansuy, I. M. (2008). Epigenetic codes in cognition and behaviour.Behav. Brain Res. 192, 70–87. doi: 10.1016/j.bbr.2008.01.021
Han, J. D., Bertin, N., Hao, T., Goldberg, D. S., Berriz, G. F., Zhang, L. V., et al.(2004). Evidence for dynamically organized modularity in the yeast protein-protein interaction network. Nature 430, 88–93. doi: 10.1038/nature02555
Hoffman, D. A., Magee, J. C., Colbert, C. M., and Johnston, D. (1997). K+ channelregulation of signal propagation in dendrites of hippocampal pyramidalneurons. Nature 387, 869–875. doi: 10.1038/43119
Holtman, I. R., Raj, D. D., Miller, J. A., Schaafsma, W., Yin, Z., Brouwer, N.,et al. (2015). Induction of a common microglia gene expression signature byaging and neurodegenerative conditions: a co-expression meta-analysis. ActaNeuropathol. Commun. 3:31. doi: 10.1186/s40478-015-0203-5
Horvath, S. (2011). Weighted Network Analysis: Applications in Genomics andSystems Biology. New York, NY: Springer-Verlag.
Hosack, D. A., Dennis, G. Jr., Sherman, B. T., Lane, H. C., and Lempicki, R. A.(2003). Identifying biological themes within lists of genes with EASE. GenomeBiol. 4:R70. doi: 10.1186/gb-2003-4-10-r70
Howe, D. G., Wiley, J. C., and McKnight, G. S. (2002). Molecular and behavioraleffects of a null mutation in all PKAC β isoforms. Mol. Cell. Neurosci. 20,515–524. doi: 10.1006/mcne.2002.1119
Huang, D. W., Sherman, B. T., and Lempicki, R. A. (2009a). Bioinformaticsenrichment tools: paths toward the comprehensive functional analysis of largegene lists. Nucleic Acids Res. 37, 1–13. doi: 10.1093/nar/gkn923
Huang, D. W., Sherman, B. T., and Lempicki, R. A. (2009b). Systematic andintegrative analysis of large gene lists using DAVID bioinformatics resources.Nat. Protoc. 4, 44–57. doi: 10.1038/nprot.2008.211
Huang, D. W., Sherman, B. T., Tan, Q., Kir, J., Liu, D., Bryant, D., et al. (2007).DAVID bioinformatics resources: expanded annotation database and novelalgorithms to better extract biology from large gene lists. Nucleic Acids Res. 35,W169–W175. doi: 10.1093/nar/gkm415
Hudson, N. J., Reverter, A., and Dalrymple, B. P. (2009). A differential wiringanalysis of expression data correctly identifies the gene containing thecausal mutation. PLoS Comput. Biol. 5:e1000382. doi: 10.1371/journal.pcbi.1000382
Ideker, T., and Bandyopadhyay, S. (2010). ‘‘Integrative systems biology,’’ Nat.Genet. 42. [Poster].
Frontiers in Systems Neuroscience | www.frontiersin.org 20 October 2017 | Volume 11 | Article 75
Uddin and Singh Gene Networks in Learning Impairment
Jeong, H., Tombor, B., Albert, R., Oltvai, Z. N., and Barabasi, A. L. (2000).The large-scale organization of metabolic networks. Nature 407, 651–654.doi: 10.1038/35036627
Jurado, S., Benoist, M., Lario, A., Knafo, S., Petrok, C. N., and Esteban, J. A.(2010). PTEN is recruited to the postsynaptic terminal for NMDA receptor-dependent long-term depression. EMBO J. 29, 2827–2840. doi: 10.1038/emboj.2010.160
Kadish, I., Thibault, O., Blalock, E. M., Chen, K. C., Gant, J. C., Porter, N. M.,et al. (2009). Hippocampal and cognitive aging across the lifespan: abioenergetic shift precedes and increased cholesterol trafficking parallelsmemory impairment. J. Neurosci. 29, 1805–1816. doi: 10.1523/JNEUROSCI.4599-08.2009
Kendall, S. D., Linardic, C. M., Adam, S. J., and Counter, C. M. (2005). A networkof genetic events sufficient to convert normal human cells to a tumorigenicstate. Cancer Res. 65, 9824–9828. doi: 10.1158/0008-5472.can-05-1543
Kim, M. J., Yun, H. S., Hong, E. H., Lee, S. J., Baek, J. H., Lee, C. W., et al.(2013). Depletion of end-binding protein 1 (EB1) promotes apoptosis of humannon-small-cell lung cancer cells via reactive oxygen species and Bax-mediatedmitochondrial dysfunction. Cancer Lett. 339, 15–24. doi: 10.1016/j.canlet.2013.07.027
Kurps, J., and de Wit, H. (2012). The role of Munc18–1 and its orthologs inmodulation of cortical F-actin in chromaffin cells. J. Mol. Neurosci. 48, 339–346.doi: 10.1007/s12031-012-9775-8
Langfelder, P., and Horvath, S. (2008). WGCNA: an R package for weightedcorrelation network analysis. BMC Bioinformatics 9:559. doi: 10.1186/1471-2105-9-559
Langfelder, P., Luo, R., Oldham, M. C., and Horvath, S. (2011). Is mynetwork module preserved and reproducible? PLoS Comput. Biol. 7:e1001057.doi: 10.1371/journal.pcbi.1001057
Lee, H. K., Hsu, A. K., Sajdak, J., Qin, J., and Pavlidis, P. (2004). Coexpressionanalysis of human genes across many microarray data sets. Genome Res. 14,1085–1094. doi: 10.1101/gr.1910904
Lee, F. S., Rajagopal, R., and Chao, M. V. (2002). Distinctive features ofTrk neurotrophin receptor transactivation by G protein-coupled receptors.Cytokine Growth Factor Rev. 13, 11–17. doi: 10.1016/s1359-6101(01)00024-7
Lee, J. M., and Sonnhammer, E. L. (2003). Genomic gene clustering analysis ofpathways in eukaryotes. Genome Res. 13, 875–882. doi: 10.1101/gr.737703
Levenson, J. M., and Sweatt, J. D. (2005). Epigenetic mechanisms in memoryformation. Nat. Rev. Neurosci. 6, 108–118. doi: 10.1038/nrn1604
Levenson, J. M., and Sweatt, J. D. (2006). Epigenetic mechanisms: a commontheme in vertebrate and invertebrate memory formation. Cell. Mol. Life Sci. 63,1009–1016. doi: 10.1007/s00018-006-6026-6
Levine, A. J., Miller, J. A., Shapshak, P., Gelman, B., Singer, E. J., Hinkin, C. H.,et al. (2013). Systems analysis of human brain gene expression: mechanismsfor HIV-associated neurocognitive impairment and common pathways withAlzheimer’s disease. BMCMed. Genomics 6:4. doi: 10.1186/1755-8794-6-4
Maehama, T., and Dixon, J. E. (1998). The tumor suppressor, PTEN/MMAC1,dephosphorylates the lipid second messenger, phosphatidylinositol 3,4,5-trisphosphate. J. Biol. Chem. 273, 13375–13378. doi: 10.1074/jbc.273.22.13375
Makara, J. K., Losonczy, A., Wen, Q., and Magee, J. C. (2009). Experience-dependent compartmentalized dendritic plasticity in rat hippocampalCA1 pyramidal neurons. Nat. Neurosci. 12, 1485–1487. doi: 10.1038/nn.2428
Mani, K. M., Lefebvre, C., Wang, K., Lim, W. K., Basso, K., Dalla-Favera, R.,et al. (2008). A systems biology approach to prediction of oncogenes andmolecular perturbation targets in B-cell lymphomas. Mol. Syst. Biol. 4:169.doi: 10.1038/msb.2008.2
Margolin, A. A., Nemenman, I., Basso, K., Wiggins, C., Stolovitzky, G., DallaFavera, R., et al. (2006). ARACNE: an algorithm for the reconstruction of generegulatory networks in a mammalian cellular context. BMCBioinformatics 7:S7.doi: 10.1186/1471-2105-7-s1-s7
Maschietto, M., Tahira, A. C., Puga, R., Lima, L., Mariani, D., Paulsen Bda, S., et al.(2015). Co-expression network of neural-differentiation genes shows specificpattern in schizophrenia. BMC Med. Genomics 8:23. doi: 10.1186/s12920-015-0098-9
Mason, M. J., Fan, G., Plath, K., Zhou, Q., and Horvath, S. (2009). Signed weightedgene co-expression network analysis of transcriptional regulation in murineembryonic stem cells. BMC Genomics 10:327. doi: 10.1186/1471-2164-10-327
McKeown, L., Swanton, L., Robinson, P., and Jones, O. T. (2008). Surfaceexpression and distribution of voltage-gated potassium channels in neurons(Review). Mol. Membr. Biol. 25, 332–343. doi: 10.1080/09687680801992470
Michalak, P. (2008). Coexpression, coregulation and cofunctionality ofneighboring genes in eukaryotic genomes. Genomics 91, 243–248.doi: 10.1016/j.ygeno.2007.11.002
Middei, S., Ammassari-Teule, M., and Marie, H. (2014). Synaptic plasticity underlearning challenge. Neurobiol. Learn. Mem. 115, 108–115. doi: 10.1016/j.nlm.2014.08.001
Miller, J. A., Horvath, S., and Geschwind, D. H. (2010). Divergence of human andmouse brain transcriptome highlights Alzheimer disease pathways. Proc. Natl.Acad. Sci. U S A 107, 12698–12703. doi: 10.1073/pnas.0914257107
Miller, J. A., Oldham, M. C., and Geschwind, D. H. (2008). A systems level analysisof transcriptional changes in Alzheimer’s disease and normal aging. J. Neurosci.28, 1410–1420. doi: 10.1523/JNEUROSCI.4098-07.2008
Min, J. L., Nicholson, G., Halgrimsdottir, I., Almstrup, K., Petri, A., Barrett, A.,et al. (2012). Coexpression network analysis in abdominal and glutealadipose tissue reveals regulatory genetic loci for metabolic syndrome andrelated phenotypes. PLoS Genet. 8:e1002505. doi: 10.1371/journal.pgen.1002505
Morozov, A., Muzzio, I. A., Bourtchouladze, R., Van-Strien, N., Lapidus, K.,Yin, D., et al. (2003). Rap1 couples cAMP signaling to a distinct pool ofp42/44MAPK regulating excitability, synaptic plasticity, learning and memory.Neuron 39, 309–325. doi: 10.1016/s0896-6273(03)00404-5
Morris, R. G., Garrud, P., Rawlins, J. N., and O’Keefe, J. (1982). Placenavigation impaired in rats with hippocampal lesions. Nature 297, 681–683.doi: 10.1038/297681a0
Moult, P. R., Cross, A., Santos, S. D., Carvalho, A. L., Lindsay, Y., Connolly, C. N.,et al. (2010). Leptin regulates AMPA receptor trafficking via PTEN inhibition.J. Neurosci. 30, 4088–4101. doi: 10.1523/JNEUROSCI.3614-09.2010
Mund, T., and Pelham, H. R. (2010). Regulation of PTEN/Akt and MAP kinasesignaling pathways by the ubiquitin ligase activators Ndfip1 and Ndfip2. Proc.Natl. Acad. Sci. U S A 107, 11429–11434. doi: 10.1073/pnas.0911714107
Nadal, M. S., Ozaita, A., Amarillo, Y., Vega-Saenz de Miera, E., Ma, Y., Mo, W.,et al. (2003). The CD26-related dipeptidyl aminopeptidase-like protein DPPXis a critical component of neuronal A-type K+ channels. Neuron 37, 449–461.doi: 10.1016/s0896-6273(02)01185-6
Nguyen, P. V., and Woo, N. H. (2003). Regulation of hippocampal synapticplasticity by cyclic AMP-dependent protein kinases. Prog. Neurobiol. 71,401–437. doi: 10.1016/j.pneurobio.2003.12.003
Nibbe, R. K., Koyutürk, M., and Chance, M. R. (2010). An integrative -omicsapproach to identify functional sub-networks in human colorectal cancer. PLoSComput. Biol. 6:e1000639. doi: 10.1371/journal.pcbi.1000639
Obayashi, T., Hayashi, S., Shibaoka, M., Saeki, M., Ohta, H., and Kinoshita, K.(2008). COXPRESdb: a database of coexpressed gene networks in mammals.Nucleic Acids Res. 36, D77–D82. doi: 10.1093/nar/gkm840
Oldham, M. C., Horvath, S., and Geschwind, D. H. (2006). Conservation andevolution of gene coexpression networks in human and chimpanzee brains.Proc. Natl. Acad. Sci. U S A 103, 17973–17978. doi: 10.1073/pnas.0605938103
Oldham, M. C., Konopka, G., Iwamoto, K., Langfelder, P., Kato, T., Horvath, S.,et al. (2008). Functional organization of the transcriptome in human brain. Nat.Neurosci. 11, 1271–1282. doi: 10.1038/nn.2207
Opgen-Rhein, R., and Strimmer, K. (2007). From correlation to causationnetworks: a simple approximate learning algorithm and its applicationto high-dimensional plant gene expression data. BMC Syst. Biol. 1:37.doi: 10.1186/1752-0509-1-37
Oz, S., Kapitansky, O., Ivashco-Pachima, Y., Malishkevich, A., Giladi, E.,Skalka, N., et al. (2014). The NAP motif of activity-dependent neuroprotectiveprotein (ADNP) regulates dendritic spines through microtubule end bindingproteins. Mol. Psychiatry 19, 1115–1124. doi: 10.1038/mp.2014.97
Peleg, S., Sananbenesi, F., Zovoilis, A., Burkhardt, S., Bahari-Javan, S., Agis-Balboa, R. C., et al. (2010). Altered histone acetylation is associatedwith age-dependent memory impairment in mice. Science 328, 753–756.doi: 10.1126/science.1186088
Perkowski, J. J., and Murphy, G. G. (2011). Deletion of the mouse homologof KCNAB2, a gene linked to monosomy 1p36, results in associativememory impairments and amygdala hyperexcitability. J. Neurosci. 31, 46–54.doi: 10.1523/JNEUROSCI.2634-10.2011
Frontiers in Systems Neuroscience | www.frontiersin.org 21 October 2017 | Volume 11 | Article 75
Uddin and Singh Gene Networks in Learning Impairment
Pirker, S., Schwarzer, C., Wieselthaler, A., Sieghart, W., and Sperk, G. (2000).GABAA receptors: immunocytochemical distribution of 13 subunits in theadult rat brain. Neuroscience 101, 815–850. doi: 10.1016/s0306-4522(00)00442-5
Piro, R. M., Ala, U., Molineris, I., Grassi, E., Bracco, C., Perego, G. P., et al.(2011). An atlas of tissue-specific conserved coexpression for functionalannotation and disease gene prediction. Eur. J. Hum. Genet. 19, 1173–1180.doi: 10.1038/ejhg.2011.96
Plaisier, C. L., Horvath, S., Huertas-Vazquez, A., Cruz-Bautista, I., Herrera, M. F.,Tusie-Luna, T., et al. (2009). A systems genetics approach implicatesUSF1, FADS3, and other causal candidate genes for familial combinedhyperlipidemia. PLoS Genet. 5:e1000642. doi: 10.1371/journal.pgen.1000642
Purves, D., Augustine, G. J., Fitzpatrick, D., Hall, W. C., LaMantia, A.,McNamara, J. O., et al. (2004). Neuroscience. Sunderland, MA: SinauerAssociates, Inc.
Qi, M., Zhuo, M., Skålhegg, B. S., Brandon, E. P., Kandel, E. R., McKnight, G. S.,et al. (1996). Impaired hippocampal plasticity in mice lacking the Cβ1 catalyticsubunit of cAMP-dependent protein kinase. Proc. Natl. Acad. Sci. U S A 93,1571–1576. doi: 10.1073/pnas.93.4.1571
Ranscht, B. (1988). Sequence of contactin, a 130-kD glycoprotein concentrated inareas of interneuronal contact, defines a new member of the immunoglobulinsupergene family in the nervous system. J. Cell Biol. 107, 1561–1573.doi: 10.1083/jcb.107.4.1561
Ray, M., Ruan, J., and Zhang, W. (2008). Variations in the transcriptome ofAlzheimer’s disease reveal molecular networks involved in cardiovasculardiseases. Genome Biol. 9:R148. doi: 10.1186/gb-2008-9-10-r148
Rhinn, H., Qiang, L., Yamashita, T., Rhee, D., Zolin, A., Vanti, W.,et al. (2012). Alternative α-synuclein transcript usage as a convergentmechanism in Parkinson’s disease pathology. Nat. Commun. 3:1084.doi: 10.1038/ncomms2032
Rickabaugh, T. M., Baxter, R. M., Sehl, M., Sinsheimer, J. S., Hultin, P. M.,Hultin, L. E., et al. (2015). Acceleration of age-associated methylation patternsin HIV-1-infected adults. PLoS One 10:e0119201. doi: 10.1371/journal.pone.0119201
Rowe, W. B., Blalock, E. M., Chen, K. C., Kadish, I., Wang, D., Barrett, J. E.,et al. (2007). Hippocampal expression analyses reveal selective association ofimmediate-early, neuroenergetic and myelinogenic pathways with cognitiveimpairment in aged rats. J. Neurosci. 27, 3098–3110. doi: 10.1523/JNEUROSCI.4163-06.2007
Selcher, J. C., Nekrasova, T., Paylor, R., Landreth, G. E., and Sweatt, J. D. (2001).Mice lacking the ERK1 isoform of MAP kinase are unimpaired in emotionallearning. Learn. Mem. 8, 11–19. doi: 10.1101/lm.37001
Shah, M. M., Hammond, R. S., and Hoffman, D. A. (2010). Dendritic ion channeltrafficking and plasticity. Trends Neurosci. 33, 307–316. doi: 10.1016/j.tins.2010.03.002
Sharma, S. K., Sherff, C. M., Shobe, J., Bagnall, M. W., Sutton, M. A., andCarew, T. J. (2003). Differential role of mitogen-activated protein kinase inthree distinct phases of memory for sensitization in Aplysia. J. Neurosci. 23,3899–3907.
Shukla, V., Skuntz, S., and Pant, H. C. (2012). Deregulated Cdk5 activity is involvedin inducing Alzheimer’s disease. Arch. Med. Res. 43, 655–662. doi: 10.1016/j.arcmed.2012.10.015
Si, K., Das, K., and Maitra, U. (1996). Characterization of multiple mRNAs thatencode mammalian translation initiation factor 5 (eIF-5). J. Biol. Chem. 271,16934–16938. doi: 10.1074/jbc.271.28.16934
Slavov, N., and Dawson, K. A. (2009). Correlation signature of the macroscopicstates of the gene regulatory network in cancer. Proc. Natl. Acad. Sci. U S A 106,4079–4084. doi: 10.1073/pnas.0810803106
Southworth, L. K., Owen, A. B., and Kim, S. K. (2009). Aging mice show adecreasing correlation of gene expression within genetic modules. PLoS Genet.5:e1000776. doi: 10.1371/journal.pgen.1000776
Sperow, M., Berry, R. B., Bayazitov, I. T., Zhu, G., Baker, S. J., and Zakharenko, S. S.(2012). Phosphatase and tensin homologue (PTEN) regulates synapticplasticity independently of its effect on neuronal morphology and migration.J. Physiol. 590, 777–792. doi: 10.1113/jphysiol.2011.220236
Spiers, H., Hannon, E., Schalkwyk, L. C., Smith, R., Wong, C. C.,O’Donovan, M. C., et al. (2015). Methylomic trajectories across human
Stam, C. J., Jones, B. F., Nolte, G., Breakspear, M., and Scheltens, P. (2007). Small-world networks and functional connectivity in Alzheimer’s disease. Cereb.Cortex 17, 92–99. doi: 10.1093/cercor/bhj127
Stone, J. C. (2006). Regulation of Ras in lymphocytes: get a GRP. Biochem. Soc.Trans. 34, 858–861. doi: 10.1042/bst0340858
Sun, W., Maffie, J. K., Lin, L., Petralia, R. S., Rudy, B., and Hoffman, D. A. (2011).DPP6 establishes the A-type K+ current gradient critical for the regulationof dendritic excitability in CA1 hippocampal neurons. Neuron 71, 1102–1115.doi: 10.1016/j.neuron.2011.08.008
Sweatt, J. D. (2001). The neuronal MAP kinase cascade: a biochemical signalintegration system subserving synaptic plasticity and memory. J. Neurochem.76, 1–10. doi: 10.1046/j.1471-4159.2001.00054.x
Sweatt, J. D. (2010). Neuroscience. Epigenetics and cognitive aging. Science 328,701–702. doi: 10.1126/science.1189968
Thomas, G. M., and Huganir, R. L. (2004). MAPK cascade signalling and synapticplasticity. Nat. Rev. Neurosci. 5, 173–183. doi: 10.1038/nrn1346
Tirnauer, J. S., Grego, S., Salmon, E. D., and Mitchison, T. J. (2002). EB1-microtubule interactions in Xenopus egg extracts: role of EB1 in microtubulestabilization and mechanisms of targeting to microtubules. Mol. Biol. Cell 13,3614–3626. doi: 10.1091/mbc.02-04-0210
Torkamani, A., Dean, B., Schork, N. J., and Thomas, E. A. (2010). Coexpressionnetwork analysis of neural tissue reveals perturbations in developmentalprocesses in schizophrenia. Genome Res. 20, 403–412. doi: 10.1101/gr.101956.109
Uddin, R. (2015). Genes and Gene Networks Related to Age-Associated LearningImpairments. Electronic Thesis and Dissertation Repositiory. Electronic Thesisand Dissertation Repository, 3378. London: Western University. Availableonline at: http://ir.lib.uwo.ca/etd/3378
Uddin, R. K., and Singh, S. M. (2013). Hippocampal gene expression meta-analysisidentifies aging and age-associated spatial learning impairment (ASLI) genesand pathways. PLoS One 8:e69768. doi: 10.1371/journal.pone.0069768
Vaudry, D., Stork, P. J., Lazarovici, P., and Eiden, L. E. (2002). Signaling pathwaysfor PC12 cell differentiation: making the right connections. Science 296,1648–1649. doi: 10.1126/science.1071552
Voglis, G., and Tavernarakis, N. (2006). The role of synaptic ion channelsin synaptic plasticity. EMBO Rep. 7, 1104–1110. doi: 10.1038/sj.embor.7400830
Voineagu, I., Wang, X., Johnston, P., Lowe, J. K., Tian, Y., Horvath, S., et al.(2011). Transcriptomic analysis of autistic brain reveals convergent molecularpathology. Nature 474, 380–384. doi: 10.1038/nature10110
Waltereit, R., and Weller, M. (2003). Signaling from cAMP/PKA to MAPK andsynaptic plasticity. Mol. Neurobiol. 27, 99–106. doi: 10.1385/mn:27:1:99
Wei, Z., Behrman, B., Wu, W. H., and Chen, B. S. (2015). Subunit-specific regulation of N-methyl-D-aspartate (NMDA) receptor trafficking bySAP102 protein splice variants. J. Biol. Chem. 290, 5105–5116. doi: 10.1074/jbc.M114.599969
Williams, E. J., and Bowles, D. J. (2004). Coexpression of neighboring genes in thegenome of Arabidopsis thaliana. Genome Res. 14, 1060–1067. doi: 10.1101/gr.2131104
Wolf, E. J., Rasmusson, A. M., Mitchell, K. S., Logue, M. W., Baldwin, C. T., andMiller, M. W. (2014). A genome-wide association study of clinical symptomsof dissociation in a trauma-exposed sample. Depress. Anxiety 31, 352–360.doi: 10.1002/da.22260
Wuchty, S., Barabási, A. L., and Ferdig, M. T. (2006). Stable evolutionary signalin a yeast protein interaction network. BMC Evol. Biol. 6:8. doi: 10.1186/1471-2148-6-8
XiYang, Y. B., Wang, Y. C., Zhao, Y., Ru, J., Lu, B. T., Zhang, Y. N., et al. (2016).Sodium channel voltage-gated β2 plays a vital role in brain aging associatedwith synaptic plasticity and expression of COX5A and FGF-2. Mol. Neurobiol.53, 955–967. doi: 10.1007/s12035-014-9048-3
Xu, Y., Xing, Y., Chen, Y., Chao, Y., Lin, Z., Fan, E., et al. (2006). Structure of theprotein phosphatase 2A holoenzyme. Cell 127, 1239–1251. doi: 10.1016/j.cell.2006.11.033
Ye, X., and Carew, T. J. (2010). Small G protein signaling in neuronal plasticity andmemory formation: the specific role of ras family proteins. Neuron 68, 340–361.doi: 10.1016/j.neuron.2010.09.013
Frontiers in Systems Neuroscience | www.frontiersin.org 22 October 2017 | Volume 11 | Article 75
Uddin and Singh Gene Networks in Learning Impairment
Ye, H., and Liu, W. (2015). Transcriptional networks implicated in humannonalcoholic fatty liver disease. Mol. Genet. Genomics 290, 1793–1804.doi: 10.1007/s00438-015-1037-3
Zhang, B., and Horvath, S. (2005). A general framework for weightedgene co-expression network analysis. Stat. Appl. Genet. Mol. Biol. 4:17.doi: 10.2202/1544-6115.1128
Zhou, Y., Xu, J., Liu, Y., Li, J., Chang, C., and Xu, C. (2014). Rat hepatocytesweighted gene co-expression network analysis identifies specific modules andhub genes related to liver regeneration after partial hepatectomy. PLoS One9:e94868. doi: 10.1371/journal.pone.0094868
Conflict of Interest Statement: The authors declare that the research wasconducted in the absence of any commercial or financial relationships that couldbe construed as a potential conflict of interest.