26
Generation Technologies in a Carbon-constrained World The Power Conference ‘06 Houston June 29, 2006 Steve Specker President & CEO
| Date post: | 31-Dec-2015 |
| Category: |
Documents |
| Upload: | silas-mcdonald |
| View: | 214 times |
| Download: | 0 times |

Generation Technologies ina Carbon-constrained World
The Power Conference ‘06HoustonJune 29, 2006
Steve SpeckerPresident & CEO
2© 2005 Electric Power Research Institute, Inc. All rights reserved.
Objective
Provide an objective and factual framework for discussing generation technologies and investment decisions in a carbon-constrained world

3© 2005 Electric Power Research Institute, Inc. All rights reserved.
Framework Overview
• Levelized cost of electricity
– Standard EPRI methodology
– 2004 costs and $’s
• Two key uncertainties
– Future “cost” of CO2
– Future price of natural gas
• Two technology portfolios
– 2010 time-period
– 2020 time-period

4© 2005 Electric Power Research Institute, Inc. All rights reserved.
Pulverized Coal in 2010 Time Period
30
40
50
60
70
80
90
100
0 10 20 30 40 50Cost of CO2, $/metric ton
Levelized Cost of Electricity, $/MWh
PC w/o cap

5© 2005 Electric Power Research Institute, Inc. All rights reserved.
Natural Gas Combined Cycle in 2010 Time Period
30
40
50
60
70
80
90
100
0 10 20 30 40 50Cost of CO2, $/metric ton
Levelized Cost of Electricity, $/MWh
NGCC@$8
NGCC@$4
NGCC@$6

6© 2005 Electric Power Research Institute, Inc. All rights reserved.
Comparative Costs of 2010 Generating Options
30
40
50
60
70
80
90
100
0 10 20 30 40 50Cost of CO2, $/metric ton
Levelized Cost of Electricity, $/MWh
NGCC@$6
PC w/o cap
$6/mmbtu will be used as floor price for natural gas

7© 2005 Electric Power Research Institute, Inc. All rights reserved.
Integrated Gasification Combined Cycle in 2010
30
40
50
60
70
80
90
100
0 10 20 30 40 50Cost of CO2, $/metric ton
Levelized Cost of Electricity, $/MWh
PC w/o cap
IGCC w/o cap
NGCC@$6

8© 2005 Electric Power Research Institute, Inc. All rights reserved.
Wind Generation in 2010 Time Period
40
50
60
70
80
90
100
0 10 20 30 40 50Cost of CO2, $/metric ton
Levelized Cost of Electricity, $/MWh
Wind@42%CF
Wind@29%CF
Wind@20%CF
110
9© 2005 Electric Power Research Institute, Inc. All rights reserved.
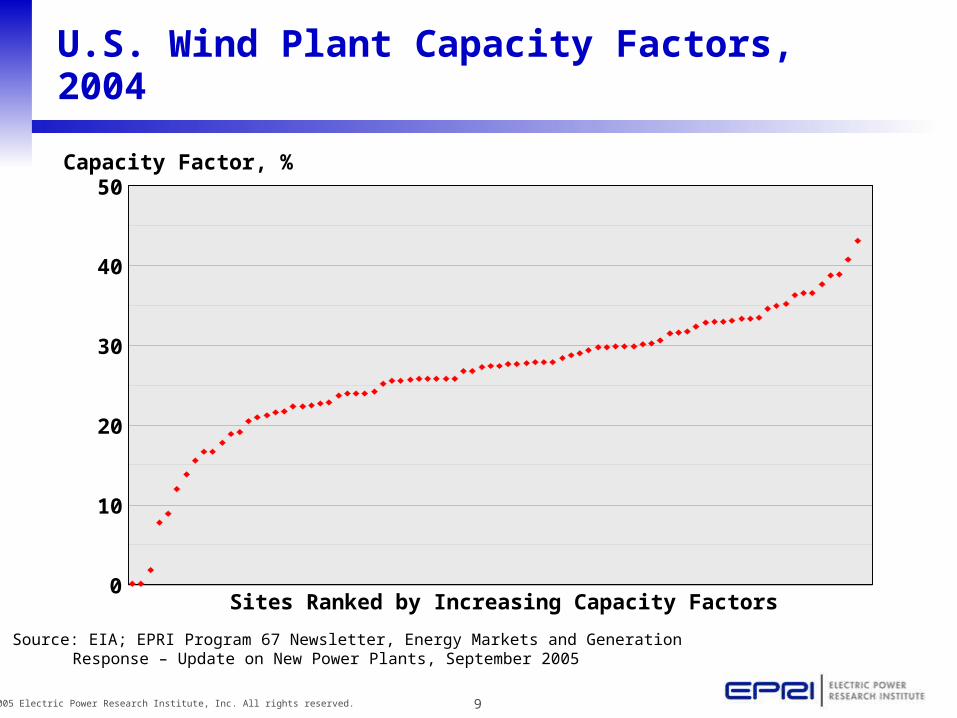
U.S. Wind Plant Capacity Factors, 2004
0
10
20
30
40
50
Sites Ranked by Increasing Capacity Factors
Capacity Factor, %
Source: EIA; EPRI Program 67 Newsletter, Energy Markets and GenerationResponse – Update on New Power Plants, September 2005

10© 2005 Electric Power Research Institute, Inc. All rights reserved.
Wind Generation in 2010 Time Period
40
50
60
70
80
90
100
0 10 20 30 40 50Cost of CO2, $/metric ton
Levelized Cost of Electricity, $/MWh
Wind@29%CF
110
11© 2005 Electric Power Research Institute, Inc. All rights reserved.
30
40
50
60
70
80
90
100
0 10 20 30 40 50Cost of CO2, $/metric ton
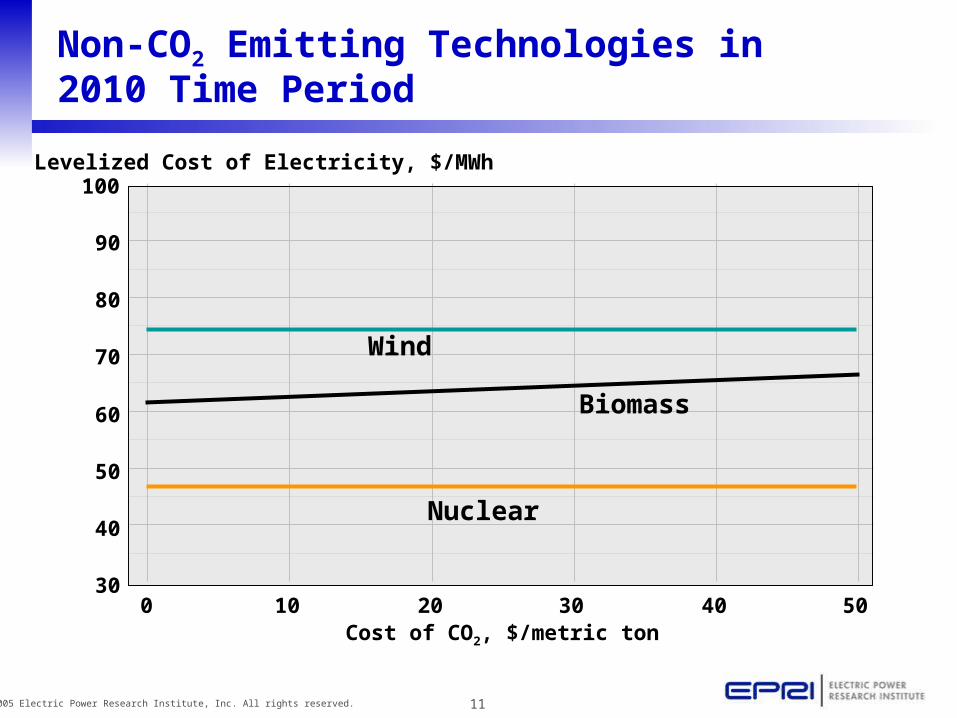
Levelized Cost of Electricity, $/MWh
Wind
Nuclear
Biomass
Non-CO2 Emitting Technologies in 2010 Time Period

12© 2005 Electric Power Research Institute, Inc. All rights reserved.
Comparative Costs of 2010 Generating Options
30
40
50
60
70
80
90
100
0 10 20 30 40 50Cost of CO2, $/metric ton
Levelized Cost of Electricity, $/MWh
Wind@29% CF
Nuclear
PC w/o cap
IGCC w/o cap
BiomassNGCC@$6

13© 2005 Electric Power Research Institute, Inc. All rights reserved.
What’s Possiblein 2020
13© 2005 Electric Power Research Institute, Inc. All rights reserved.
14© 2005 Electric Power Research Institute, Inc. All rights reserved.
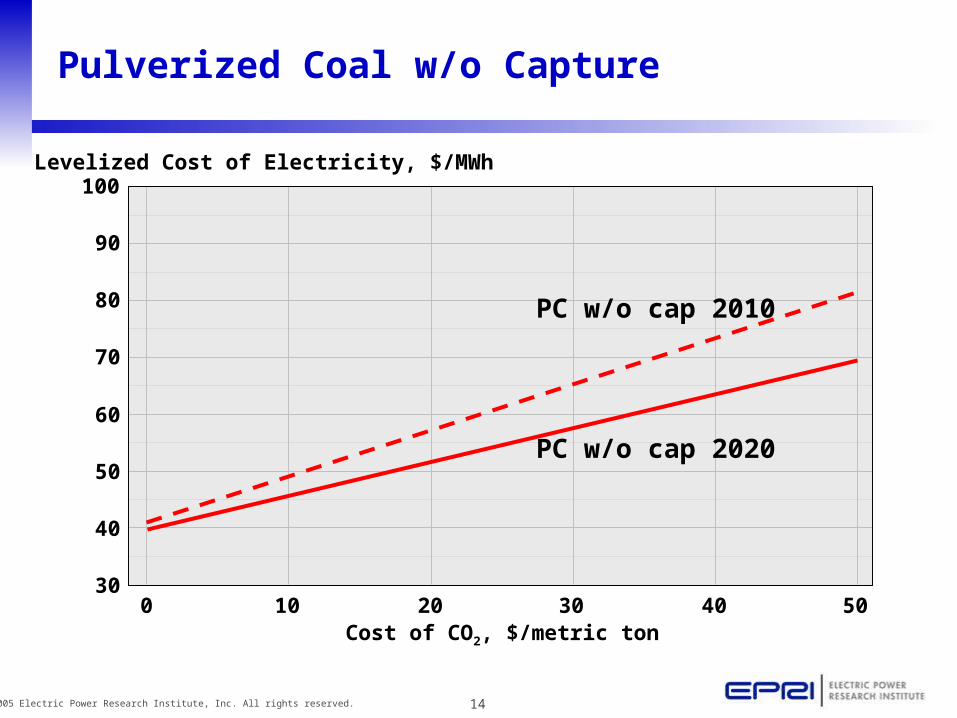
Pulverized Coal w/o Capture
30
40
50
60
70
80
90
100
0 10 20 30 40 50Cost of CO2, $/metric ton
Levelized Cost of Electricity, $/MWh
PC w/o cap 2020
PC w/o cap 2010

15© 2005 Electric Power Research Institute, Inc. All rights reserved.
IGCC w/o Capture
30
40
50
60
70
80
90
100
0 10 20 30 40 50Cost of CO2, $/metric ton
Levelized Cost of Electricity, $/MWh
IGCC w/o cap 2010
IGCC, w/o cap 2020

16© 2005 Electric Power Research Institute, Inc. All rights reserved.
PC with capture/transport/storage
30
40
50
60
70
80
90
100
0 10 20 30 40 50Cost of CO2, $/metric ton
Levelized Cost of Electricity, $/MWh
PC w/o cap 2020
PC w/cap/t/s 2020

17© 2005 Electric Power Research Institute, Inc. All rights reserved.
IGCC with capture/transport/storage
30
40
50
60
70
80
90
100
0 10 20 30 40 50Cost of CO2, $/metric ton
Levelized Cost of Electricity, $/MWh
IGCC, w/o cap 2020
IGCC w/cap/t/s 2020
18© 2005 Electric Power Research Institute, Inc. All rights reserved.
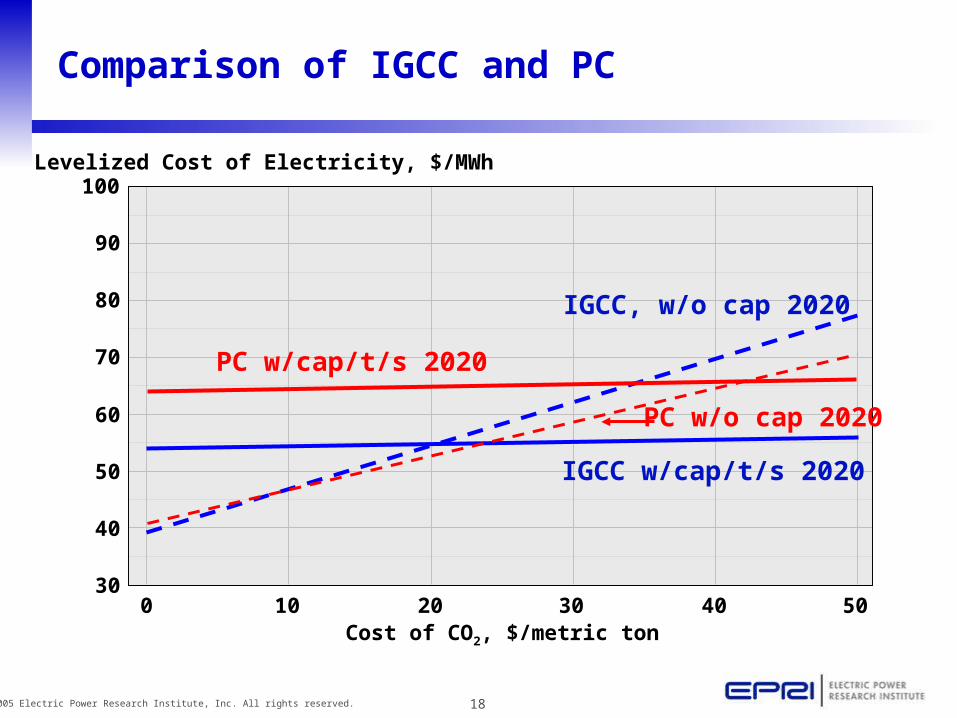
Comparison of IGCC and PC
30
40
50
60
70
80
90
100
0 10 20 30 40 50Cost of CO2, $/metric ton
Levelized Cost of Electricity, $/MWh
IGCC, w/o cap 2020
IGCC w/cap/t/s 2020
PC w/cap/t/s 2020
PC w/o cap 2020

19© 2005 Electric Power Research Institute, Inc. All rights reserved.
Comparison of IGCC and PC (2020)
30
40
50
60
70
80
90
100
0 10 20 30 40 50Cost of CO2, $/metric ton
Levelized Cost of Electricity, $/MWh
IGCC w/o cap
IGCC w/cap
PC with capture
PC w/o capCost Gap
Reducing Cost of PC CO2 capture is a key technology challenge
20© 2005 Electric Power Research Institute, Inc. All rights reserved.
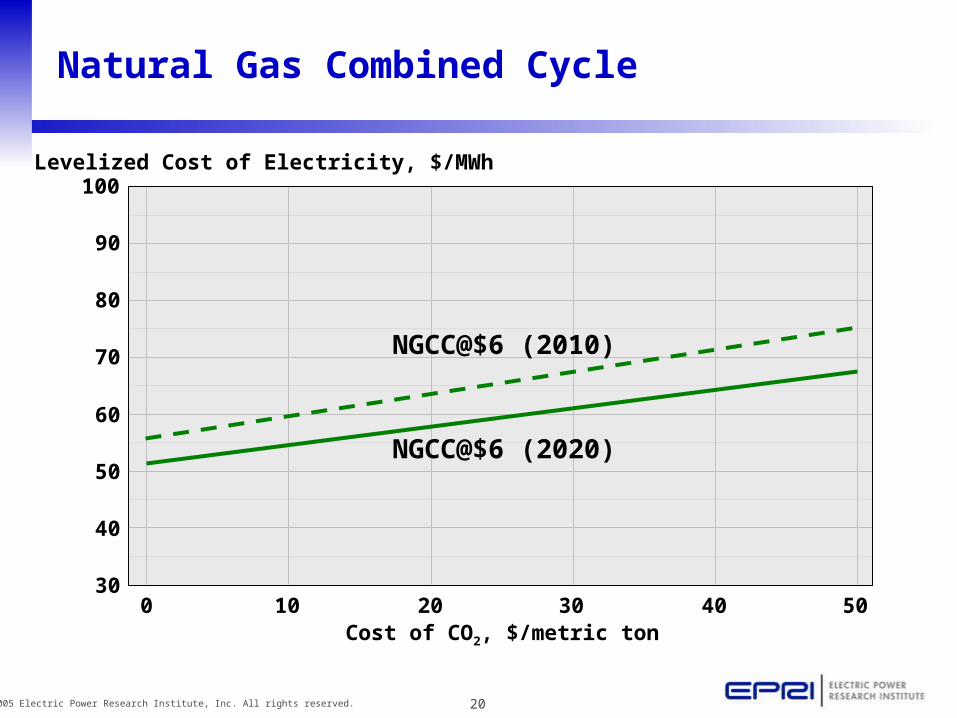
Natural Gas Combined Cycle
30
40
50
60
70
80
90
100
0 10 20 30 40 50Cost of CO2, $/metric ton
Levelized Cost of Electricity, $/MWh
NGCC@$6 (2010)
NGCC@$6 (2020)

21© 2005 Electric Power Research Institute, Inc. All rights reserved.
Wind Generation
30
40
50
60
70
80
90
100
0 10 20 30 40 50Cost of CO2, $/metric ton
Levelized Cost of Electricity, $/MWh
Wind@29% CF in 2020
Wind@29% CF in 2010

22© 2005 Electric Power Research Institute, Inc. All rights reserved.
Biomass
30
40
50
60
70
80
90
100
0 20 30 40 50Cost of CO2, $/metric ton
Levelized Cost of Electricity, $/MWh
Biomass 2010
10
Biomass 2020

23© 2005 Electric Power Research Institute, Inc. All rights reserved.
Comparative Costs in 2020
30
40
50
60
70
80
90
100
0 10 20 30 40 50Cost of CO2, $/metric ton
Levelized Cost of Electricity, $/MWh
Nuclear
Wind Biomass
IGCC w/cap/t/sNGCC@$6
PC w/cap/t/s
24© 2005 Electric Power Research Institute, Inc. All rights reserved.
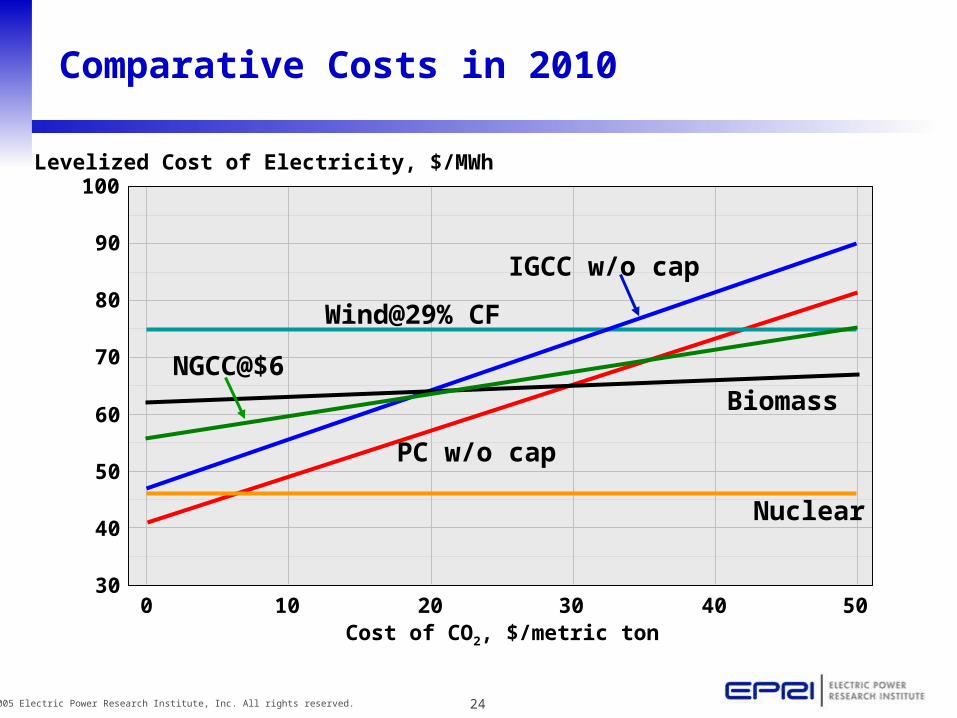
Comparative Costs in 2010
30
40
50
60
70
80
90
100
0 10 20 30 40 50Cost of CO2, $/metric ton
Levelized Cost of Electricity, $/MWh
Wind@29% CF
Nuclear
PC w/o cap
IGCC w/o cap
BiomassNGCC@$6

25© 2005 Electric Power Research Institute, Inc. All rights reserved.
What’s Possible: Comparative Costs in 2020
30
40
50
60
70
80
90
100
0 10 20 30 40 50Cost of CO2, $/metric ton
Levelized Cost of Electricity, $/MWh
Nuclear
Wind Biomass
IGCC w/cap/t/sNGCC@$6
PC w/cap/t/s
An Extraordinary Opportunityto Develop a Low-carbon Portfolio
26© 2005 Electric Power Research Institute, Inc. All rights reserved.
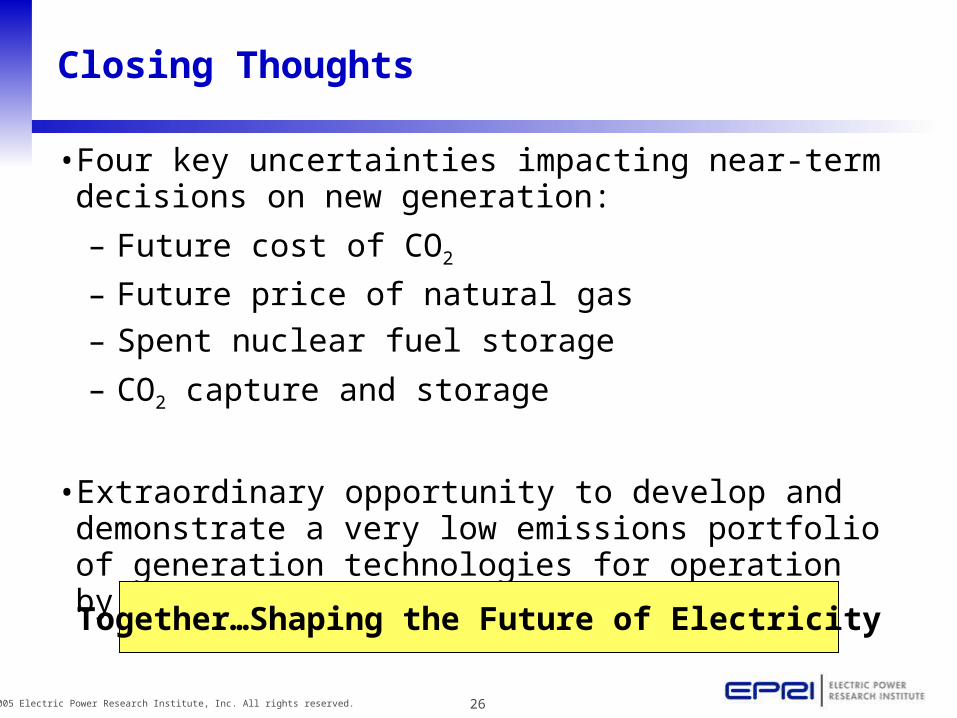
Closing Thoughts
• Four key uncertainties impacting near-term decisions on new generation:
– Future cost of CO2
– Future price of natural gas
– Spent nuclear fuel storage
– CO2 capture and storage
• Extraordinary opportunity to develop and demonstrate a very low emissions portfolio of generation technologies for operation by 2020.
Together…Shaping the Future of Electricity


