Page 1
Mires and Peat, Volume 21 (2018), Article 01, 1–14, http://www.mires-and-peat.net/, ISSN 1819-754X
© 2018 International Mire Conservation Group and International Peatland Society, DOI: 10.19189/MaP.2017.OMB.269
1
Genetic diversity of Dyera polyphylla (Miq.) Steenis populations
used in tropical peatland restoration in Indonesia
H.L. Tata1, A. Muchugi2, R. Kariba2 and M. van Noordwijk3,4
1Forest Research and Development Centre, Bogor, Indonesia 2World Agroforestry Centre (ICRAF), Nairobi, Kenya
3World Agroforestry Centre (ICRAF) Southeast Asia Regional Office, Sindangbarang Jero, Bogor, Indonesia 4 Plant Production Systems, Wageningen University and Research, Wageningen, The Netherlands
_______________________________________________________________________________________
SUMMARY
Dyera polyphylla is a native tree species of peat swamp forests in Southeast Asia. Where it has been used in
peatland restoration, the trees are of uncertain genetic origin. We analysed the genetic diversity of seven
populations of D. polyphylla (9–20 individual trees per population) from both natural forests and plantations
on peatland farms in the Indonesian provinces of Jambi and Central Kalimantan. Using six selected primers,
analysis of amplified fragment length polymorphism (AFLP) indicated that 86.5–96.8 % of loci tested (280 in
total) were polymorphic, with an estimated heterozygosity H ranging from 0.29 to 0.38. The highest genetic
variation was within populations, rather than among them. Cluster analysis based on Nei’s distance matrix
indicated that the sampled D. polyphylla populations from Jambi and Central Kalimantan were genetically
distinct. STRUCTURE analysis indicated that the wild population at Senyerang (Jambi) was the most distinct.
This site and Tumbang Nusa (Central Kalimantan) deserve in situ protection and are recommended as seed
sources for peatland restoration in their respective provinces. In the absence of knowledge about specific traits,
it is important to retain the high genetic diversity of existing wild and planted populations of D. polyphylla
revealed by our work when selecting seed sources for future peat swamp forest rehabilitation programmes.
KEY WORDS: AFLP, agroforestry, Kalimantan, Sumatra, paludiculture ________________________________________________________________________________________________
INTRODUCTION
Peatlands are common on the three main Indonesian
islands of Sumatra, Borneo (Kalimantan) and Papua,
covering a combined area of 14,833,100 ha. This
most recent estimate of peatland area is based on a
meta-analysis of global peatland distribution by the
PEATMAP project (Xu et al. 2018), and is slightly
lower than estimates derived from the official
national peatland map published by the Ministry of
Agriculture of Indonesia in 2011, e.g. 14,905,475 ha
(Ritung et al. 2011). Owing to deforestation, massive
drainage, spontaneous settlements and uncontrolled
fire, the area of pristine peat swamp forest in
Indonesia has been decreasing rapidly. Miettinen et
al. (2016) reported that, in 2015, the area of degraded
peat swamp forest in Sumatra and Kalimantan was
996,050 ha (6.4 % of total study area); while
managed land, particularly industrial plantations and
smallholdings, had increased to 7.8 Mha (about 50 %
of study area). The extensive fires of 2015 caused
further peatland degradation, but also triggered the
creation of a new national agency in charge of
peatland restoration. Peatland restoration is aligned
with the national development agenda, as well as
with global agendas such as the Bonn Challenge, the
Aichi Targets of the Convention on Biological
Diversity (CBD), adaptation and mitigation measures
in the context of climate change, and the sustainable
development goals (SDG). The Government of
Indonesia has set a target of two million ha of
degraded peatland restoration by 2019 (Indonesian
President’s Regulation 1/2016), while the goal of the
Bonn Challenge is to restore 150 million ha of the
world’s deforested and degraded lands by 2020 and
350 million ha by 2030 (Minnemeyer et al. 2011).
Restoration of peatlands requires, first of all, that
ongoing degradation is halted. Where local
communities live in peatland areas, economically
attractive land use that is compatible with undrained
peatland forest conditions is needed (van Noordwijk
et al. 2014). Native tree species are preferred for
restoration and their use has increased (Kettle 2012,
Thomas et al. 2014), because they are adapted to the
conditions on undrained and rewetted sites. However,
lack of clarity on the origin and genetic diversity of
the planting stock used in restoration is a cause of
great concern (Thomas et al. 2014, Lander & Boshier
Page 2
H.L. Tata et al. GENETIC DIVERSITY OF DYERA POLYPHYLLA POPULATIONS IN INDONESIA
Mires and Peat, Volume 21 (2018), Article 01, 1–14, http://www.mires-and-peat.net/, ISSN 1819-754X
© 2018 International Mire Conservation Group and International Peatland Society, DOI: 10.19189/MaP.2017.OMB.269
2
2014). The peatland species Dyera polyphylla (Miq.)
Steenis belongs to the Apocynaceae family and is a
source of latex. Its natural distribution is in the Malay
Peninsula, the east coast of Sumatra and Kalimantan
(Williams 1963, Soepadmo et al. 2002). No data on
genetic differentiation between the Sumatran and
Bornean populations exist, but they may have
separated at the end of the last glaciation 10,000 years
ago, as has been documented for other species (Raes
et al. 2014). D. polyphylla (locally known as
jelutong) produces a light and brightly coloured
timber that can be used for pencils, light construction
and furniture. The latex and resin have economic
value, as they are used in the industrial production of
tubes, pipes and varnish (Boer 1997, Soepadmo et al.
2002). D. polyphylla latex tapped from wild
populations was a relevant part of regional economic
growth in the 1950s and 1960s (Williams 1963). The
upward trend of D. polyphylla latex production in
Indonesia continued into the 21st century. In 1996–
2006, latex production was 600 t per year while the
latest data, for 2011–2012, show latex production
reaching 800 t per year (Tata et al. 2015).
A decline in the density of wild D. polyphylla
populations was recently documented for the
Tanjung Jabung Barat (abbreviated as Tanjabar) and
Tanjung Jabung Timur (abbreviated as Tanjabtim)
districts of Jambi (Tata et al. 2016) on Sumatra’s east
coast, other parts of Jambi (Siregar et al. 2016) and
the Kapuas district of Central Kalimantan (Kalima et
al. 1998). This reduced the supply of latex and
existing trade channels declined. A government
regulation in 2008 which taxed all D. polyphylla
latex, regardless of whether it was sourced from
natural forest or managed stands, led to further
decline of the D. polyphylla latex trade (Tata et al.
2015, 2016). Even so, D. polyphylla has been
promoted as one of the few economically attractive
native tree species for peatland restoration in
Indonesia (Giesen 2015, Tata & Susmianto 2016) and
it may regain its place in restored peatland economies
if the regulation mentioned above is revised and trade
channels are restored. In Tanjabar (Jambi), for
example, D. polyphylla has been planted as part of a
rehabilitation programme for the Bram Itam peatland
forest reserve (Mulia et al. 2014, Tata et al. 2016).
In view of current planting programmes and their
expected expansion, the choice of seed sources needs
attention. As most efforts so far have been at local
scale, relying on locally derived seed sources, the
genetic diversity of currently planted populations
may resemble that in natural populations; but little is
known about possible exchanges of seed between
Sumatra and Kalimantan. No explicit trait-based
selection has been documented for the species.
Allozyme variation in Central Kalimantan
populations of D. polyphylla was reported by
Wahyudiningsih et al. (2014). Beyond allozyme
variation, amplified fragment length polymorphism
(AFLP; Vos et al. 1995) has been used to characterise
the genetic diversity of tree populations at marker
level (Bonin et al. 2007, Muchugi et al. 2008, Mutegi
et al. 2016). Despite its limitations compared with
newer DNA fingerprinting methods (Scotti et al.
2016, Andrews & Luikart 2014, Benesttan et al.
2016), the AFLP method can provide insights into
research questions which require comparisons across
populations.
The research reported here aimed to explore the
genetic variability and population structure of
D. polyphylla in peatland areas along Sumatra’s east
coast (Jambi province) and in Central Kalimantan,
using AFLP markers. We set out to compare diversity
in planted versus natural populations and possible
genetic exchange between Sumatra and Kalimantan.
We expect the results to have implications for current
peatland restoration efforts.
METHODS
Study area
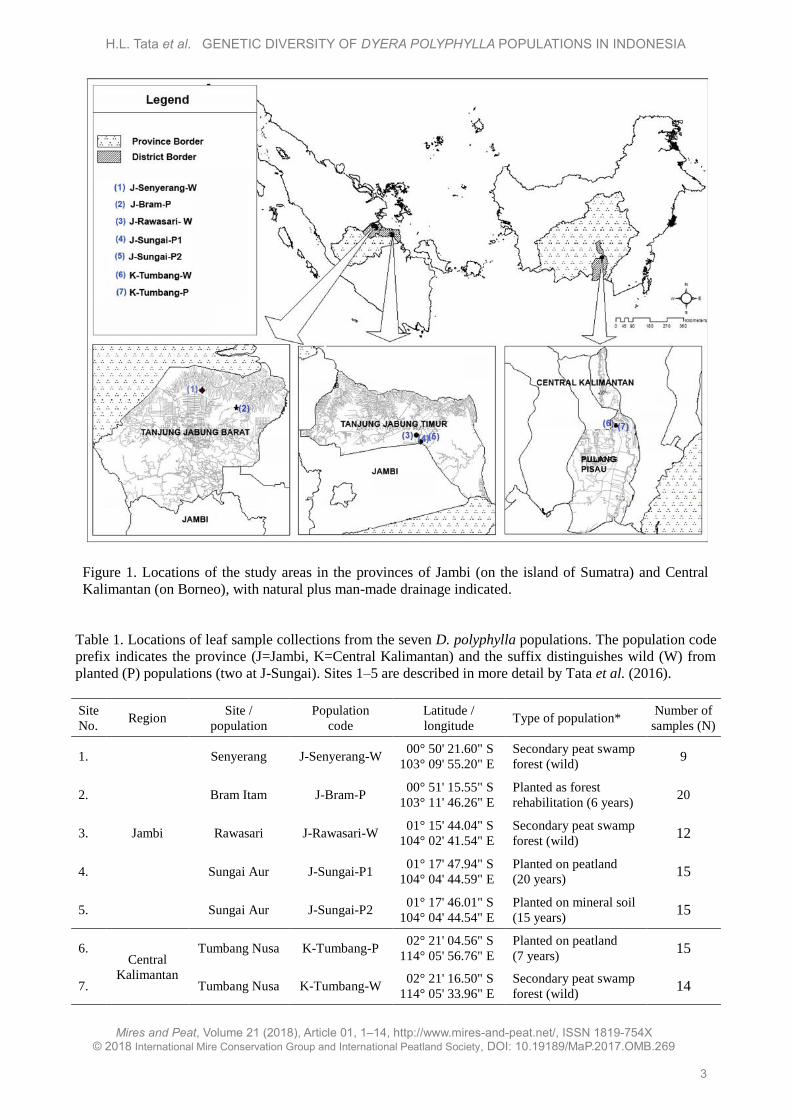
This research was conducted in three districts of two
provinces, e.g. Tanjabar and Tanjabtim districts of
Jambi province, and Pulang Pisau district of Central
Kalimantan province. The seven sites where samples
were collected are shown in Figure 1 and listed in
Table 1.
Procedures
Plant material
Leaf samples were collected from 9–20 individual
trees per population of wild (natural forest) or planted
D. polyphylla trees at seven sites (Table 1). The trees
at each site (population) were chosen randomly with
a minimum distance of 100 m between individuals.
The age of D. polyphylla trees in the planted
populations varied between 6 and 20 years (Table 1).
The stem diameter at breast height (dbh) of the
planted trees sampled ranged from 5 to 33 cm, while
stem dbh for the wild populations ranged from 13 to
61 cm. The planted trees in Jambi and Central
Kalimantan had not been tapped. The wild
populations in Jambi, on the other hand, had been
tapped for commercial use. Only young leaves
without obvious deformities or damage were
collected. Identification of the plant materials was
confirmed by the herbarium of the Forest Research
and Development Centre in Bogor, Indonesia.
Page 3
H.L. Tata et al. GENETIC DIVERSITY OF DYERA POLYPHYLLA POPULATIONS IN INDONESIA
Mires and Peat, Volume 21 (2018), Article 01, 1–14, http://www.mires-and-peat.net/, ISSN 1819-754X
© 2018 International Mire Conservation Group and International Peatland Society, DOI: 10.19189/MaP.2017.OMB.269
3
Figure 1. Locations of the study areas in the provinces of Jambi (on the island of Sumatra) and Central
Kalimantan (on Borneo), with natural plus man-made drainage indicated.
Table 1. Locations of leaf sample collections from the seven D. polyphylla populations. The population code
prefix indicates the province (J=Jambi, K=Central Kalimantan) and the suffix distinguishes wild (W) from
planted (P) populations (two at J-Sungai). Sites 1–5 are described in more detail by Tata et al. (2016).
Site
No. Region
Site /
population
Population
code
Latitude /
longitude Type of population*
Number of
samples (N)
1.
Jambi
Senyerang J-Senyerang-W 00° 50' 21.60" S
103° 09' 55.20" E
Secondary peat swamp
forest (wild) 9
2. Bram Itam J-Bram-P 00° 51' 15.55" S
103° 11' 46.26" E
Planted as forest
rehabilitation (6 years) 20
3. Rawasari J-Rawasari-W 01° 15' 44.04" S
104° 02' 41.54" E
Secondary peat swamp
forest (wild) 12
4. Sungai Aur J-Sungai-P1 01° 17' 47.94" S
104° 04' 44.59" E
Planted on peatland
(20 years) 15
5. Sungai Aur J-Sungai-P2 01° 17' 46.01" S
104° 04' 44.54" E
Planted on mineral soil
(15 years) 15
6. Central
Kalimantan
Tumbang Nusa K-Tumbang-P 02° 21' 04.56" S
114° 05' 56.76" E
Planted on peatland
(7 years) 15
7. Tumbang Nusa K-Tumbang-W 02° 21' 16.50" S
114° 05' 33.96" E
Secondary peat swamp
forest (wild) 14
Page 4
H.L. Tata et al. GENETIC DIVERSITY OF DYERA POLYPHYLLA POPULATIONS IN INDONESIA
Mires and Peat, Volume 21 (2018), Article 01, 1–14, http://www.mires-and-peat.net/, ISSN 1819-754X
© 2018 International Mire Conservation Group and International Peatland Society, DOI: 10.19189/MaP.2017.OMB.269
4
The leaves were collected in the afternoon and
were usually kept fresh overnight before transfer, the
next day, to the Biotechnology Laboratory at Riset
Perkebunan Nusantara (Nusantara Estate Crop
Research Centre) in Bogor. Some leaves that were
collected from remote areas were stored in sealed
envelopes containing silica gel.
DNA extraction
Total genomic DNA was extracted from both fresh
and silica-gel dried leaves following the protocol of
the DNeasy® Plant Handbook by Qiagen® (Hilden,
Germany). When the Qiagen® protocol did not work
properly, Dellaporta’s DNA extraction method
(Dellaporta et al. 1983) was used. The leaves were
cleaned in running tap water and dried using paper
tissues. Leaf material (1 g) was then quickly frozen
with liquid N2 and ground into powder using a mortar
and pestle. Fresh leaves usually produce better-
quality DNA. The quality of genomic DNA was
examined by agarose gel electrophoresis and
spectrophotometry. The DNA concentration was
quantified with a NanoDrop 1000 spectrophotometer
(Thermo Scientific, Wilmington, USA). The
concentration of the DNA stock was 50–100 ng µl-1
in TE (Tris-EDTA, pH 8) buffer.
AFLP analysis
The AFLP reaction was performed following
Invitrogen® protocols for the AFLP analysis system
(California, USA). Each genomic DNA sample
(200 ng) was digested with two restriction enzymes
EcoRI/MseI. Selective amplification was conducted
using 22 combinations of two AFLP primers specific
for EcoRI and MseI primer adaptors on a test panel
of representative D. polyphylla samples. The primer
combinations that gave the most reliable
amplifications and polymorphisms in repeated trials
were chosen for the complete set of sample analyses.
All PCR reactions were performed in the
GeneAmp PCR System 9700 (Applied Biosystem,
CA, USA). The PCR amplification products were
visualised on 6 % polyacrilamide gel using AgNO3
as a loading dye. The electrophoresis was performed
in a Sequi-Gen GT Nucleic Acid Electrophoresis Cell
(Biorad, USA). The pre-electrophoresis was run at
75 watts for 30 minutes (± 2000 V, 100 mA) until the
temperature of the gel reached 50 °C. The
electrophoresis was then continued at 65 watts for
one hour. The presence or absence of bands was
scored manually. The analysis was conducted in the
Common Laboratory of SEAMEO BIOTROP,
Bogor, Indonesia.
Data analysis
The presence or absence of unequivocally scorable
bands was converted into a binary character matrix,
scoring 1 for presence and 0 for absence of a band at
a particular position within the genome. Nei’s
unbiased heterozygosity diversity estimate (Nei
1978) was generated using Tools for Population
Genetic Analysis (TPFGA) version 1.3 software
(Miller 1997). In this analysis, the allele frequencies
are estimated from the frequency of the null allele and
Hardy Weinberg equilibrium is assumed. The genetic
distance (Nei 1978) was derived using GenAlEx
(Genetic Analysis in Excel) 6.5 software (Peakall &
Smouse 2012). Analysis of molecular variance
(AMOVA) (Excoffier et al. 1992) based on
Euclidean distances between individuals as well as
genetic differentiation among populations (FST) was
computed using GenAlEx 6.5 allowing 1000
permutations. The dendogram and Principal
Coordinate Analysis (PCoA) showing clustering of
populations were generated using TFPGA 1.3 and
GenAlex 6.5, respectively. The clustering was
validated by computing 1000 bootstraps. Another
cluster analysis, STRUCTURE (Pritchard et al.
2000), was used to understand the relationship among
populations of 100 individuals and 252 loci. For this
analysis, all runs were performed with a burn-in
period of 50,000 iterations and 50,000 repeats after
burn-in. The algorithm employed by STRUCTURE
HARVESTER was used to determine the number of
K groups that best fitted the dataset and to visualise
the output (Earl & vonHoldt 2012). STRUCTURE
2.3.4 software and STRUCTURE HARVESTER
Web v0.6.94 were used for the analysis.
RESULTS
Marker development and genetic diversity
The 22 primer combinations of EcoRI and MseI that
were tested resulted in six combinations of good
amplification, namely: E-ACC/M-CAA, E-ACC/M-
CAC, E-ACC/M-CTA, E-ACG/M-CAA, E-AGC/M-
CTA and E-AGG/M-CTC. These were used for
selective amplification of the full set of individuals.
A total of 280 polymorphic markers were scored
across the seven populations. Estimates of Nei’s
unbiased genetic diversity (Table 2) showed high
diversity across all seven of the D. polyphylla
populations studied. The percentage of polymorphic
loci ranged from 86.5 to 96.8 % (mean PPL = 92.3 %)
while average heterozygosity ranged from H = 0.29
Page 5
H.L. Tata et al. GENETIC DIVERSITY OF DYERA POLYPHYLLA POPULATIONS IN INDONESIA
Mires and Peat, Volume 21 (2018), Article 01, 1–14, http://www.mires-and-peat.net/, ISSN 1819-754X
© 2018 International Mire Conservation Group and International Peatland Society, DOI: 10.19189/MaP.2017.OMB.269
5
Table 2. Mean diversity estimate (H) of 7 Dyera polyphylla population generated from 280 AFLP markers.
The population codes are explained in Table 1.
to H = 0.38 (mean H = 0.33). There was no indication
that planted populations had reduced genetic
variability. The wild population at J-Senyerang-W
had the highest diversity estimate (H = 0.38), while
another wild population in Jambi (J-Rawasari-W)
had the lowest level of heterozygosity (H = 0.29).
Analysis of molecular variance
An analysis of molecular variance (AMOVA) for the
seven populations of D. polyphylla showed that the
greatest variation was found within populations
(91 %), with only 9 % of the variation among
populations (9 %) (Table 3). This means that genetic
variation is maintained within populations rather than
among populations. Genetic differentiation among
the populations was low (FST = 0.094).
Genetic distance and cluster analysis
The value of pairwise genetic distances of
D. polyphylla is shown in Table 4. The largest
genetic distance (0.251) was found between the
populations at J-Sungai-P1 and J-Senyerang-W,
although both were located in the same province. The
populations at J-Sungai-P2 and J-Rawasari-W had
the lowest genetic distance, suggesting that the wild
population at Rawasari (or a closely related
population) was used as the seed source for the
planted population at J-Sungai-P2.
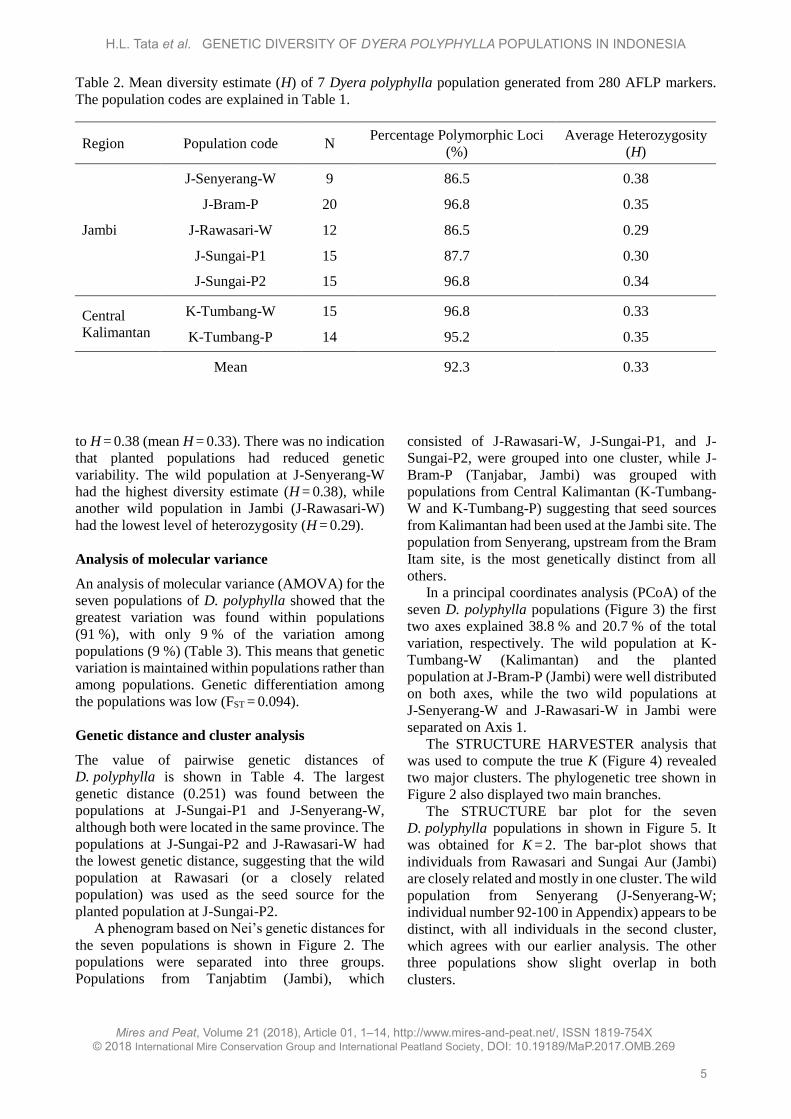
A phenogram based on Nei’s genetic distances for
the seven populations is shown in Figure 2. The
populations were separated into three groups.
Populations from Tanjabtim (Jambi), which
consisted of J-Rawasari-W, J-Sungai-P1, and J-
Sungai-P2, were grouped into one cluster, while J-
Bram-P (Tanjabar, Jambi) was grouped with
populations from Central Kalimantan (K-Tumbang-
W and K-Tumbang-P) suggesting that seed sources
from Kalimantan had been used at the Jambi site. The
population from Senyerang, upstream from the Bram
Itam site, is the most genetically distinct from all
others.
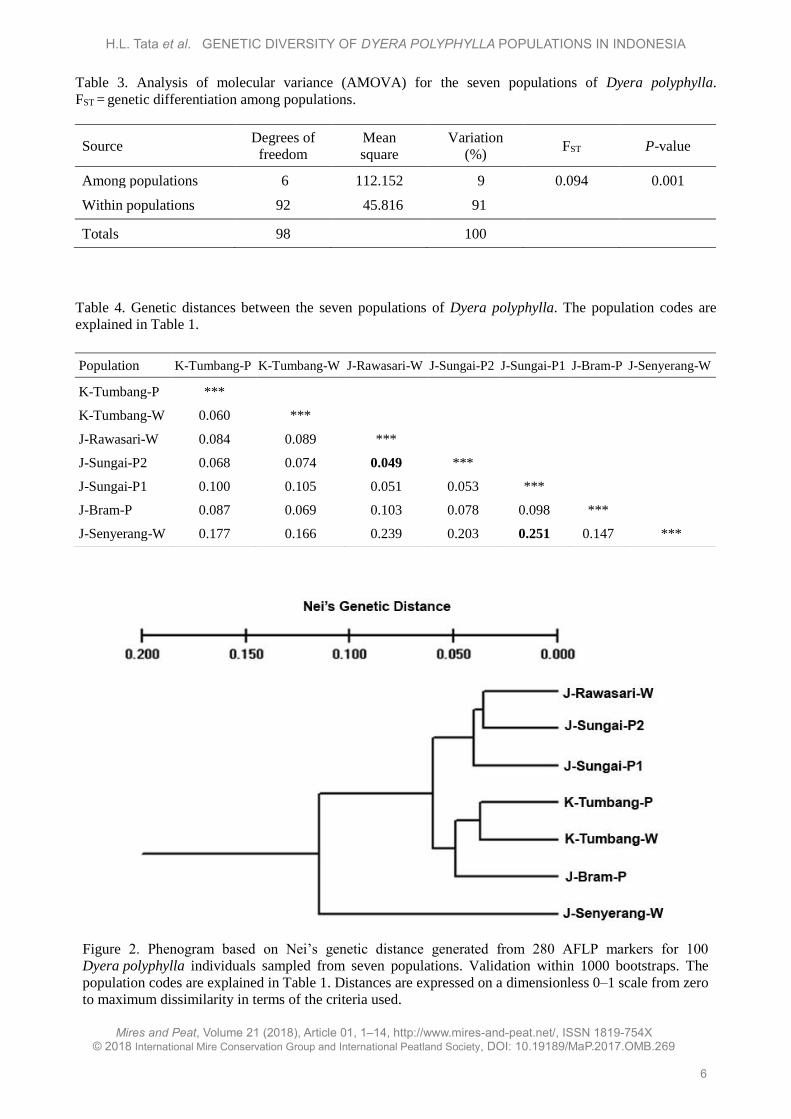
In a principal coordinates analysis (PCoA) of the
seven D. polyphylla populations (Figure 3) the first
two axes explained 38.8 % and 20.7 % of the total
variation, respectively. The wild population at K-
Tumbang-W (Kalimantan) and the planted
population at J-Bram-P (Jambi) were well distributed
on both axes, while the two wild populations at
J-Senyerang-W and J-Rawasari-W in Jambi were
separated on Axis 1.
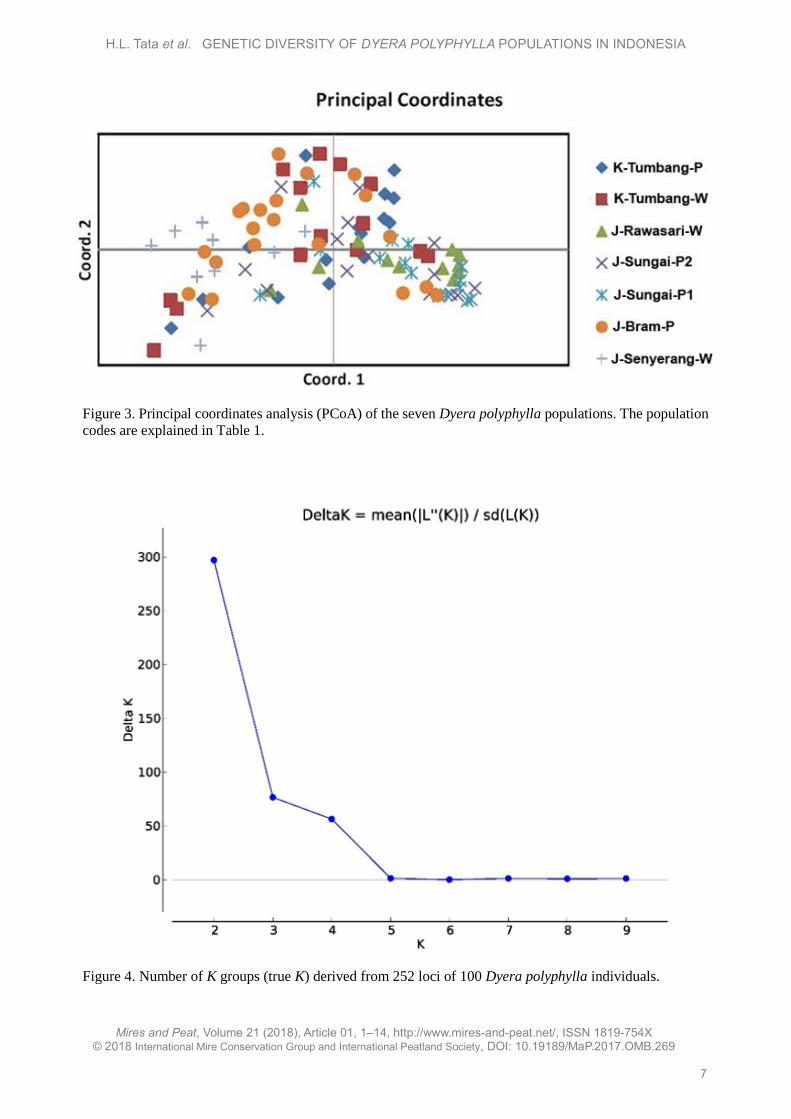
The STRUCTURE HARVESTER analysis that
was used to compute the true K (Figure 4) revealed
two major clusters. The phylogenetic tree shown in
Figure 2 also displayed two main branches.
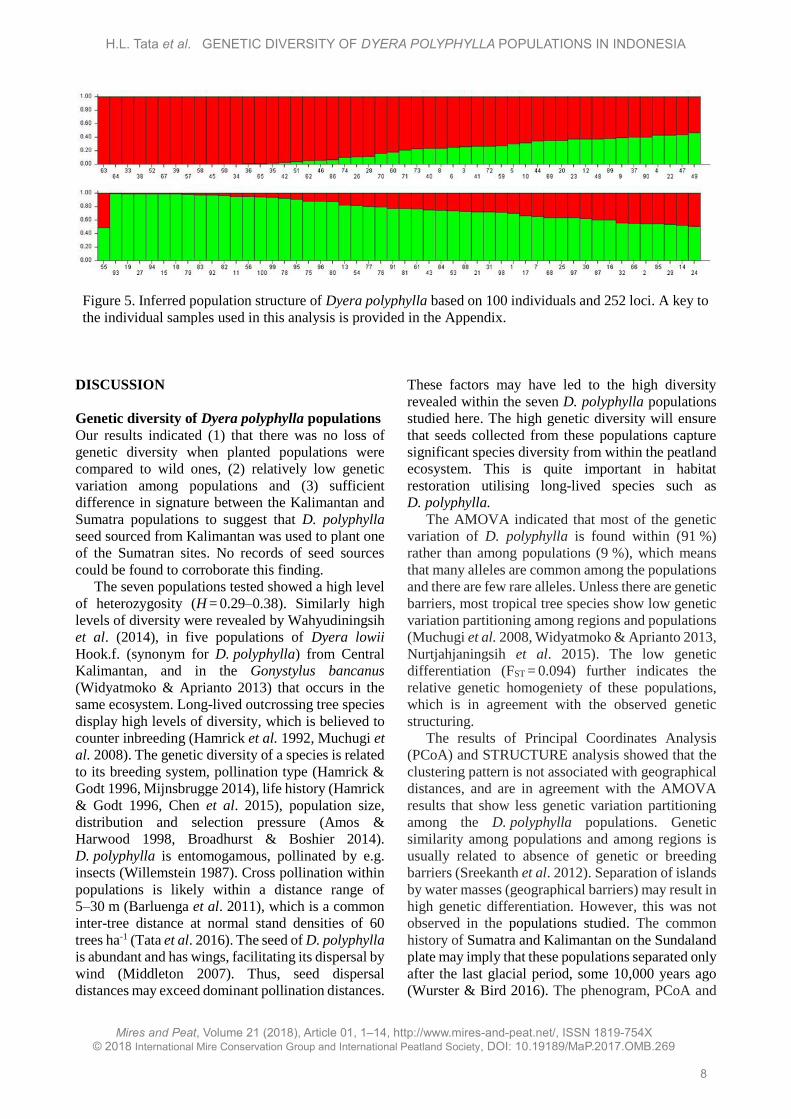
The STRUCTURE bar plot for the seven
D. polyphylla populations in shown in Figure 5. It
was obtained for K = 2. The bar-plot shows that
individuals from Rawasari and Sungai Aur (Jambi)
are closely related and mostly in one cluster. The wild
population from Senyerang (J-Senyerang-W;
individual number 92-100 in Appendix) appears to be
distinct, with all individuals in the second cluster,
which agrees with our earlier analysis. The other
three populations show slight overlap in both
clusters.
Region Population code N Percentage Polymorphic Loci
(%)
Average Heterozygosity
(H)
Jambi
J-Senyerang-W 9 86.5 0.38
J-Bram-P 20 96.8 0.35
J-Rawasari-W 12 86.5 0.29
J-Sungai-P1 15 87.7 0.30
J-Sungai-P2 15 96.8 0.34
Central
Kalimantan
K-Tumbang-W 15 96.8 0.33
K-Tumbang-P 14 95.2 0.35
Mean 92.3 0.33
Page 6
H.L. Tata et al. GENETIC DIVERSITY OF DYERA POLYPHYLLA POPULATIONS IN INDONESIA
Mires and Peat, Volume 21 (2018), Article 01, 1–14, http://www.mires-and-peat.net/, ISSN 1819-754X
© 2018 International Mire Conservation Group and International Peatland Society, DOI: 10.19189/MaP.2017.OMB.269
6
Table 3. Analysis of molecular variance (AMOVA) for the seven populations of Dyera polyphylla.
FST = genetic differentiation among populations.
Table 4. Genetic distances between the seven populations of Dyera polyphylla. The population codes are
explained in Table 1.
Figure 2. Phenogram based on Nei’s genetic distance generated from 280 AFLP markers for 100
Dyera polyphylla individuals sampled from seven populations. Validation within 1000 bootstraps. The
population codes are explained in Table 1. Distances are expressed on a dimensionless 0–1 scale from zero
to maximum dissimilarity in terms of the criteria used.
Source Degrees of
freedom
Mean
square
Variation
(%) FST P-value
Among populations 6 112.152 9 0.094 0.001
Within populations 92 45.816 91
Totals 98 100
Population K-Tumbang-P K-Tumbang-W J-Rawasari-W J-Sungai-P2 J-Sungai-P1 J-Bram-P J-Senyerang-W
K-Tumbang-P ***
K-Tumbang-W 0.060 ***
J-Rawasari-W 0.084 0.089 ***
J-Sungai-P2 0.068 0.074 0.049 ***
J-Sungai-P1 0.100 0.105 0.051 0.053 ***
J-Bram-P 0.087 0.069 0.103 0.078 0.098 ***
J-Senyerang-W 0.177 0.166 0.239 0.203 0.251 0.147 ***
Page 7
H.L. Tata et al. GENETIC DIVERSITY OF DYERA POLYPHYLLA POPULATIONS IN INDONESIA
Mires and Peat, Volume 21 (2018), Article 01, 1–14, http://www.mires-and-peat.net/, ISSN 1819-754X
© 2018 International Mire Conservation Group and International Peatland Society, DOI: 10.19189/MaP.2017.OMB.269
7
Figure 3. Principal coordinates analysis (PCoA) of the seven Dyera polyphylla populations. The population
codes are explained in Table 1.
Figure 4. Number of K groups (true K) derived from 252 loci of 100 Dyera polyphylla individuals.
Page 8
H.L. Tata et al. GENETIC DIVERSITY OF DYERA POLYPHYLLA POPULATIONS IN INDONESIA
Mires and Peat, Volume 21 (2018), Article 01, 1–14, http://www.mires-and-peat.net/, ISSN 1819-754X
© 2018 International Mire Conservation Group and International Peatland Society, DOI: 10.19189/MaP.2017.OMB.269
8
Figure 5. Inferred population structure of Dyera polyphylla based on 100 individuals and 252 loci. A key to
the individual samples used in this analysis is provided in the Appendix.
DISCUSSION
Genetic diversity of Dyera polyphylla populations
Our results indicated (1) that there was no loss of
genetic diversity when planted populations were
compared to wild ones, (2) relatively low genetic
variation among populations and (3) sufficient
difference in signature between the Kalimantan and
Sumatra populations to suggest that D. polyphylla
seed sourced from Kalimantan was used to plant one
of the Sumatran sites. No records of seed sources
could be found to corroborate this finding.
The seven populations tested showed a high level
of heterozygosity (H = 0.29–0.38). Similarly high
levels of diversity were revealed by Wahyudiningsih
et al. (2014), in five populations of Dyera lowii
Hook.f. (synonym for D. polyphylla) from Central
Kalimantan, and in the Gonystylus bancanus
(Widyatmoko & Aprianto 2013) that occurs in the
same ecosystem. Long-lived outcrossing tree species
display high levels of diversity, which is believed to
counter inbreeding (Hamrick et al. 1992, Muchugi et
al. 2008). The genetic diversity of a species is related
to its breeding system, pollination type (Hamrick &
Godt 1996, Mijnsbrugge 2014), life history (Hamrick
& Godt 1996, Chen et al. 2015), population size,
distribution and selection pressure (Amos &
Harwood 1998, Broadhurst & Boshier 2014).
D. polyphylla is entomogamous, pollinated by e.g.
insects (Willemstein 1987). Cross pollination within
populations is likely within a distance range of
5–30 m (Barluenga et al. 2011), which is a common
inter-tree distance at normal stand densities of 60
trees ha-1 (Tata et al. 2016). The seed of D. polyphylla
is abundant and has wings, facilitating its dispersal by
wind (Middleton 2007). Thus, seed dispersal
distances may exceed dominant pollination distances.
These factors may have led to the high diversity
revealed within the seven D. polyphylla populations
studied here. The high genetic diversity will ensure
that seeds collected from these populations capture
significant species diversity from within the peatland
ecosystem. This is quite important in habitat
restoration utilising long-lived species such as
D. polyphylla.
The AMOVA indicated that most of the genetic
variation of D. polyphylla is found within (91 %)
rather than among populations (9 %), which means
that many alleles are common among the populations
and there are few rare alleles. Unless there are genetic
barriers, most tropical tree species show low genetic
variation partitioning among regions and populations
(Muchugi et al. 2008, Widyatmoko & Aprianto 2013,
Nurtjahjaningsih et al. 2015). The low genetic
differentiation (FST = 0.094) further indicates the
relative genetic homogeniety of these populations,
which is in agreement with the observed genetic
structuring.
The results of Principal Coordinates Analysis
(PCoA) and STRUCTURE analysis showed that the
clustering pattern is not associated with geographical
distances, and are in agreement with the AMOVA
results that show less genetic variation partitioning
among the D. polyphylla populations. Genetic
similarity among populations and among regions is
usually related to absence of genetic or breeding
barriers (Sreekanth et al. 2012). Separation of islands
by water masses (geographical barriers) may result in
high genetic differentiation. However, this was not
observed in the populations studied. The common
history of Sumatra and Kalimantan on the Sundaland
plate may imply that these populations separated only
after the last glacial period, some 10,000 years ago
(Wurster & Bird 2016). The phenogram, PCoA and
Page 9
H.L. Tata et al. GENETIC DIVERSITY OF DYERA POLYPHYLLA POPULATIONS IN INDONESIA
Mires and Peat, Volume 21 (2018), Article 01, 1–14, http://www.mires-and-peat.net/, ISSN 1819-754X
© 2018 International Mire Conservation Group and International Peatland Society, DOI: 10.19189/MaP.2017.OMB.269
9
STRUCTURE analysis showed that there is a clear
genetic distinction between the three wild
populations (J-Senyerang-W, J-Rawasari-W, K-
Tumbang-W). STRUCTURE analysis showed that
the J-Senyerang-W population is quite distinct,
implying that there is minimal gene flow from this
population to the other two. The Senyerang
population (in Tanjabar district) was located in the
peat swamp along the Senyerang river, while the two
populations in Tanjabtim district (Rawasari, Sungai)
were found along the larger Batang Hari river. The
habitat of D. polyphylla in Senyerang was a
fragmented secondary peat swamp forest surrounded
by complex agroforests, e.g. mixtures of rubber tree
(Hevea brassiliensis Mull.Arg), coconut (Cocos
nucifera L.), areca-nut (Areca cathecu Burm.f) and
planted D. polyphylla, a plantation forest and
smallholder oil palm plantations. Thus, the situation
may have limited gene flow from the Senyerang
population to the other two. It is important to
establish whether this genetic distinction confers any
adaptational advantage or disavantage to the
J-Senyerang-W population. If there is an advantage,
effort should be devoted to conserving its genetic
identity.
The population of planted D. polyphylla at Bram
Itam (J-Bram-P) resulted from peatland restoration
initiated by the Forest District office of Tanjabar
Jambi in 2005. It is interesting to note the genetic
similarity of trees at Bram Itam (in Jambi) with the
populations at Tumbang Nusa in Central Kalimantan
(K-Tumbang-W and K-Tumbang-P). However, the
PCoA and STRUCTURE clustering indicated that a
few individuals may also have come from Senyerang
(J-Senyerang-W). A remnant peat swamp forest was
still present near the J-Bram-P restoration site in
2005. D. polyphylla seeds from a local seed supplier
were insufficient for the restoration programme and
seed had to be sourced from farther afield. According
to a local forestry official, seedlings used for the
reforestation programme at Bram Itam Peat Forest
Reserve came from various seedling vendors without
knowledge of their origin (Liyanto, Forest District
Agency Tanjung Jabung Barat, Jambi; personal
communication 2014). The seeds or seedlings may
have been collected from Central Kalimantan
province, which is known as a prominent
D. polyphylla seedling source. Tree seed distribution
in Indonesia has been documented by Roshetko et al.
(2008); most of the seed is collected at a limited
number of locations that are not selected for superior
quality of provenances, but rather depend on the
development of trade channel routes. Despite this, the
planted populations assessed here showed high
genetic diversity. Deliberate efforts to retain genetic
diversity are a generic safeguard, whether the
material planted is derived from seed, by vegetative
propagation (Thomas et al. 2014, Zahawi & Holl
2014), or from wildings (Giasoddhin et al. 2014).
Implications for peatland restoration
The rehabilitation of peat swamp forests using native
peatland tree species, also known as paludiculture
(Wichtmann et al. 2016), as well as hydrological
restoration, started some years ago in Indonesia
(Bonn et al. 2016, Saito et al. 2016, Tata &
Susmianto 2016), before the presidential regulation
was launched in 2016. Our study included one site
(J Bram-P) with successful peatland rehabilitation
using D. polyphylla, planted as part of a peat swamp
forest rehabilitation programme in 2005 by the
Tanjabar Forest District office. Although the origin
of the seedlings is unknown, this population has high
genetic diversity (H = 0.35) and PPL = 96.81 %.
Indeed, all of the populations that we studied showed
high genetic diversity, which is an important factor in
determining adaptability and survival of species
facing habitat change and climate change (Ehlers et
al. 2008, Dawson et al. 2011, Loo et al. 2015).
Seeds for peatland restoration programmes should
come from local populations with high genetic
variability (Broadhurst & Boshier 2014, Thomas et
al. 2014). The use of seeds collected from a local
population or close to the restoration site is expected
to prevent any negative impact on intraspecific
hybridisation that results in the suppression of
outbreeding, and to help maintain biotic interaction
with pollinators and pathogens (Broadhurst &
Boshier 2014). The wild D. polyphylla populations in
Senyerang, Rawa Sari and Tumbang Nusa
(J-Senyerang-W, J-Rawasari-W, K-Tumbang-W)
and a planted D. polyphylla population (J-Sungai-P1)
have been used as mother trees and seed sources for
seedlings grown in nurseries in the two provinces.
For peatland restoration in Jambi, it is suggested that
seed from Senyerang (J-Senyerang-W) and Sungai
Aur (J-Sungai-P1) should be used; while for peatland
restoration in Central Kalimantan, seed provenanced
from the wild population at K-Tumbang-W is
suggested because it has a high diversity estimate
(H = 0.35). It has previously been recommended that
the D. polyphylla population in Selat Nusa (Central
Kalimantan), which has high allozyme variability
(He = 0.72), should be conserved (Wahyudiningsih et
al. 2014); this population can also be used as a seed
source for restoration in Central Kalimantan.
Seed from the wild population at Rawa Sari
(J-Rawasari-P) has been used for peatland
rehabilitation in Sumatra. This may lead to loss of
genetic diversity in planted stock because the Rawa
Page 10
H.L. Tata et al. GENETIC DIVERSITY OF DYERA POLYPHYLLA POPULATIONS IN INDONESIA
Mires and Peat, Volume 21 (2018), Article 01, 1–14, http://www.mires-and-peat.net/, ISSN 1819-754X
© 2018 International Mire Conservation Group and International Peatland Society, DOI: 10.19189/MaP.2017.OMB.269
10
Sari population displays only moderate genetic
diversity (H = 0.29). The wild population in Rawasari
is a fragmented secondary forest which is isolated
owing to deforestation and uncontrolled fire in the
surrounding areas. At this location, a strategy to
improve gene flow through agroforestry and creation
of a multifunctional landscape, as at Senyerang
(J-Senyerang-W), is recommended. Various tree
species in agroforestry systems can perform pivotal
functions in conservation (Dawson et al. 2009,
Lander & Boshier 2014).
Maintaining the high genetic diversity of
D. polyphylla is a priority in the conservation and
restoration of tropical peatlands. Considering that
large degraded peatlands in Indonesia need to be
restored, seed supplies should provide as much
genetic diversity as possible. Using seed from small
populations and those with low genetic variability
will reduce genetic diversity (Broadhurst & Boshier
2014, Mijnsbrugge 2014). Therefore, in restoration,
appropriate seed sourcing strategies are necessary.
These may include: (i) composite provenancing, i.e.
collecting a mixture of seeds that attempts to emulate
natural gene-flow dynamics; and (ii) admixture
provenancing, which involves collecting seeds from
large populations only, but from various
environments, and mixing them before sowing or
planting out, which generates new populations with a
variety of genotypes of wide provenance (Broadhurst
& Boshier 2014).
CONCLUSION
Dyera polyphylla populations on peatland in Jambi
and Central Kalimantan provinces showed high
genetic diversity (H = 0.29–0.38). In both provinces,
genetic diversity was as high in planted populations
as in wild ones. Maintaining the genetic entity of the
species in this ecosystem is an important
consideration when establishing new populations. In
peatland restoration, a seed source with high genetic
diversity should be used, because the populations
thus established may act as future seed sources.
ACKNOWLEDGEMENTS
This research was funded by the Forest Trees and
Agroforestry programme of the World Agroforestry
Centre, under the Female PostDoc Research for H.L.T.
initiative. The authors acknowledge Jasnari and Nono
for assistance in collecting leaf samples; along with
Niyyah and Anidah for assistance with laboratory
work. The authors declare no conflict of interest.
REFERENCES
Amos, W. & Harwood, J. (1998) Factors affecting
levels of genetic diversity in natural populations.
Philosophical Transactions of the Royal Society
B, 353, 177–186.
Andrews, K.R. & Luikart, G. (2014) Recent novel
approaches for population genomics data
analysis. Molecular Ecology, 23, 1661–1667.
Barluenga, M., Austerlitz, F., Elzinga, J.A., Teixeira,
S., Goudet, J. & Bernasconi, G. (2011) Fine-scale
spatial genetic structure and gene dispersal in
Silene latifolia. Heredity, 106, 13–24.
Benesttan, L.M., Ferchaud, A.L., Hohenlohe, P.A.,
Garner, B.A., Naylor, G.J.P., Baum, I.B.,
Schwartz, M.K., Kelley, J.L. & Luikart, G. (2016)
Conservation genomics of natural and managed
populations: building a conceptual and practical
framework. Molecular Ecology, 25, 2967–2977.
Boer, E. (1997) Dyera Hook.f. In: Boer, E. & Ella,
A.B. (eds.) Plants Producing Exudates, Volume
18, Plant Resources of Southeast Asia
(PROSEA), Bogor, Indonesia, 65 pp.
Bonin, A., Ehrich, D. & Manel, S. (2007) Statistical
analysis of amplified fragment length
polymorphism data: a toolbox for molecular
ecologists and evolutionists. Molecular Ecology,
16, 3737–3758.
Bonn, A., Alott, T., Evans, M., Joosten, H. &
Stoneman, R. (2016) Peatland restoration and
ecosystem services: an introduction. In: Bonn, A.,
Allott, T., Evans, M., Joosten, H. & Stoneman, R.
(eds.) Peatland Restoration and Ecosystem
Services: Science, Policy and Practice,
Cambridge University Press, 1–18.
Broadhurst, L. & Boshier, D. (2014) Seed
provenance for restoration and management:
conserving evolutionary potential and utility. In:
Bozzano, M., Jalonen, R., Thomas, E., Boshier,
D., Gallo, L., Cavers, S., Bordacs, S., Smith, P. &
Loo, J. (eds.) Genetic Considerations in
Ecosystem Restoration Using Native Tree
Species, State of the World’s Forest Genetic
Resources - Thematic Study, FAO and
Biodiversity International, Rome, Italy, 27–37.
Chen, T., Chen, Q., Luo, Y., Huang, Z.L., Zhang, J.,
Tang, H.R., Pan, D.M. & Wang, X.R. (2015)
Phylogeography of Chinese cherry (Prunus
psedocerasus Lindl) inferred from chloroplast and
nuclear DNA: insights into evolutionary patterns
and demographic history. Plant Biology, 17, 787–
797.
Dawson, I.K., Lengkeek, A., Weber, J.C. &
Jamnadass, R. (2009) Managing genetic variation
in tropical trees: linking knowledge with action in
Page 11
H.L. Tata et al. GENETIC DIVERSITY OF DYERA POLYPHYLLA POPULATIONS IN INDONESIA
Mires and Peat, Volume 21 (2018), Article 01, 1–14, http://www.mires-and-peat.net/, ISSN 1819-754X
© 2018 International Mire Conservation Group and International Peatland Society, DOI: 10.19189/MaP.2017.OMB.269
11
agroforestry ecosystems for improved
conservation and enhanced livelihoods.
Biodiversity Conservation, 18, 969–986.
Dawson, I.K., Vinceti, B., Weber, J.C., Neufeldt, H.,
Russell, J., Lengkeek, A.G., Kalinganire, A.,
Kindt, R., Lillesø, J.C.B., Roshetko, J. &
Jamnadass, R. (2011) Climate change and tree
genetic resource management: maintaining and
enhancing the productivity and value of
smallholder tropical agroforestry landscapes. A
review. Agroforestry Systems, 81, 67–78.
Dellaporta, S.L., Wood, J. & Hicks, J.B. (1983) A
plant DNA minipreparation: Version II. Plant
Moleccular Biology Reporter, 1(4), 19–21.
Earl, D.A. & vonHoldt, B.M. (2012) STRUCTURE
HARVESTER: a website and program for
visualizing STRUCTURE output and
implementing the Evanno method. Conservation
Genetics Resources, 4(2), 359–361.
Ehlers, A., Worm, B. & Reusch, T.B.H. (2008)
Importance of genetic diversity in eelgrass
Zostera marina for its resilience to global
warming. Marine Ecology Progress Series, 355,
1–7.
Excoffier, L., Smouse, P.E. & Quattro, J.M. (1992)
Analysis of molecular variance inferred from
metric distances among DNA haplotypes:
applications to human mitochondria DNA
restriction data. Genetics, 131, 479–491.
Giasoddhin, H., Poormajidian, M.R., Tabari, M., &
Ami, S. (2014) Comparison of saplings character
in the different nursery origin in Hyrcanian forest.
Bulletin of Environment, Pharmacology and Life
Sciences, 3 (Spl Issue III), 79 –81. Online at:
http://www.bepls.com/vol3_spl_III/14.pdf,
accessed 02 Feb 2018.
Giesen, W. (2015) Utilising non-timber forest
products to conserve Indonesia’s peat swamp
forests and reduce carbon emissions. Journal of
Indonesian Natural History, 3(2), 10–19.
Hamrick, J.L. & Godt, M.J.W. (1996) Effects of life
history traits on genetic diversity in plant species.
Philosophical Transactions of the Royal Society
B, 351, 1291–1297.
Hamrick, J.L., Godt, M.J.W. & Sherman-Broyles, L.S.
(1992) Factors influencing levels of genetic
diversity in woody plant species. New Forests, 6,
95–124.
Kalima, T., Setyawati, T., Carman, H. & Anggana
(1998) Beberapa aspek ekologi jelutung (Dyera
polyphylla Hk.f) (Some ecological aspects of
jelutong (Dyera polyphylla Hk.f)). Buletin
Penelitian Hutan, 611, 35–46 (in Bahasa
Indonesia).
Kettle, C.J. (2012) Seedling ecological restoration of
tropical forests: Priority setting under REDD+.
Biodiversity Conservation, 154, 34–41.
Lander, T. & Boshier, D. (2014) Fragmentation,
landscape functionalities and connectivity. In:
Bozzano, M., Jalonen, R., Thomas, E., Boshier,
D., Gallo, L., Cavers, S., Bordacs, S., Smith, P. &
Loo, J. (eds.) Genetic Considerations in
Ecosystem Restoration Using Native Tree
Species, State of the World’s Forest Genetic
Resources - Thematic Study, FAO and
Biodiversity International, Rome, Italy, 52–65.
Loo, J., Fady, B., Dawson, I., Vinceti, B. &
Baldinelli, G. (2015) Forest genetic resources and
climate change. In: FAO (ed.) Coping With Climate
Change: The Roles of Genetic Resources for Food
and Agriculture, FAO, Rome, Italy, 41–53.
Middleton, D.J. (2007) Apocynaceae (subfamilies
Rauvolfioideae and Apocynoideae. In: Flora
Malesianan Series I: Seed Plants Volume 18,
Foundation Flora Malesiana, National Herbarium
Netherlands, 186–190.
Miettinen, J., Shi, C. & Liew, S.C. (2016) Land cover
distribution in the peatlands of Peninsular
Malaysia, Sumatra and Borneo in 2015 with
changes since 1990. Global Ecology and
Conservation, 6, 67–78.
Mijnsbrugge, K.V. (2014) Continuity of local genetic
diversity as an alternative to importing foreign
provenances. In: Bozzano, M., Jalonen, R.,
Thomas, E., Boshier, D., Gallo, L., Cavers, S.,
Bordacs, S., Smith, P. & Loo, J. (eds.) Genetic
Considerations in Ecosystem Restoration Using
Native Tree Species, State of the World’s Forest
Genetic Resources - Thematic Study, FAO and
Biodiversity International, Rome, Italy, 39–46.
Miller, M.P. (1997) Tools for Population Genetic
Analyses (TFPGA) ver.1.3: a Windows Program
for the Analysis of Allozyme and Molecular
Genetic Data. Department of Biological Sciences,
Northern Arizona University, USA, 30 pp. Online at:
http://www.marksgeneticsoftware.net/tfpga.htm
Minnemeyer, S., Laestadius, L., Sizer, N., Saint-
Laurent, C. & Potapov, P. (2011) A World of
Opportunity. Bonn challenge on forests, climate
change and biodiversity 2011, The Global
Partnership on Forest Landscape Restoration,
Washington DC, USA, 5 pp. Online at:
http://www.forestlandscaperestoration.org/sites/d
efault/files/resource/4._bonn_challenge_world_o
f_opportunity_brochure_2011-09.pdf
Muchugi, A., Muluvi, G.M., Kindt, R., Kadu, C.A.C.,
Simons, A.J. & Jamnadass, R.H. (2008) Genetic
structuring of important medicinal species of
Warburgia as revealed by AFLP analysis. Tree
Genetics & Genomes, 4(4), 787–795.
Page 12
H.L. Tata et al. GENETIC DIVERSITY OF DYERA POLYPHYLLA POPULATIONS IN INDONESIA
Mires and Peat, Volume 21 (2018), Article 01, 1–14, http://www.mires-and-peat.net/, ISSN 1819-754X
© 2018 International Mire Conservation Group and International Peatland Society, DOI: 10.19189/MaP.2017.OMB.269
12
Mulia, R., Widayati, A., Suyanto, Agung, P. &
Zulkarnain, M.T. (2014) Low carbon emission
development strategies for Indonesia: simulation
and trade off analysis using the FALLOW model.
Mitigation and Adaptation Strategies for Global
Change, 19(6), 773–788.
Mutegi, S.M., Muchugi, A., Carsan, S., Kariba, R.,
Jamnadass, R., Oballa, P., Brunner, A. & Runo, S.
(2016) Genetic diversity of the African poplar
(Populus ilicifolia) populations in Kenya. Tree
Genetics & Genomes, 12, 66.
Nei, M. (1978) Estimation of average heterozygosity
and genetic distance from a small number of
individuals. Genetics, 89, 583–590.
Nurtjahjaningsih, I.L.G., Haryanti, T., Widyatmoko,
A.Y.P.B.C., Indrioko, S. & Rimbawanto, A.
(2015) Keragaman genetik populasi Calophyllum
inophyllum menggunakan penanda RAPD
(Random Amplification Polymorphism DNA)
(Genetic diversity of Calophyllum inophyllum
populations revealed by RAPD (Random
Amplification Polymorphism DNA) markers).
Jurnal Pemuliaan Tananam Hutan, 9(2), 91–102
(in Bahasa Indonesia).
Peakall, R. & Smouse, P.E. (2012) GenAlEx 6.5:
genetic analysis in Excel. Population genetic
software for teaching and research. Molecular
Ecology Notes, 6, 288–295.
Pritchard, J.K., Stephens, M. & Donnelly, P. (2000)
Inference of population structure using multilocus
genotype data. Genetics, 155, 945–959.
Raes, N., Cannon, C.H., Hijmans, R.J., Piessens, T.,
Saw, L.G., van Welzen, P.C. & Slik, J.F. (2014)
Historical distribution of Sundaland’s
Dipterocarp rainforests at Quaternary glacial
maxima. Proceedings of the National Academy of
Sciences of the United States of America, 111(47),
16790–16795.
Ritung, S., Wahyunto, Nugroho, K., Sukarman,
Hikmatullah, Suparto & Tafakresnanto, C. (2011)
Peta Lahan Gambut Indonesia Skala 1:250.000
(Indonesian Peatland Map at the Scale
1:250,000). Indonesia Center for Agricultural
Land Resources Research and Development,
Ministry of Agriculture, Bogor, Indonesia (in
Bahasa Indonesia).
Roshetko, J.M., Mulawarman & Dianarto, A. (2008)
Tree seed procurement - diffusion pathways in
Wonogiri and Ponorogo, Java. Small-scale
Forestry, 7, 333–352.
Saito, H., Koizumi, A., Gaman, S., Yuda, P., Penyang
& Shibuya, M. (2016) Tropical peatland forestry:
Toward forest restoration and sustainable use of
wood resources in degraded peatland. In: Osaki,
M. & Tsuji, N. (eds.) Tropical Peatland
Ecosystems, Springer, Tokyo, Japan, 513–549.
Scotti, I., González-Martinez, S.C., Budde, K.B. &
Lalagüe, H. (2016) Fifty years of genetic studies:
what to make of the large amount of variation
found within populations? Annals of Forest
Science, 73, 69–75.
Siregar, U.J., Imran, M.F., Hamzah, Siregar, I.Z. &
Finkeldey, R. 2016. Distribution and local
adaptation of two indigenous Jelutong trees
(Dyera costulata and D. lowii) in Jambi,
Indonesia: Implication for allopatric speciation.
Procedia Environmental Sciences, 33, 393–403.
Soepadmo, E., Saw, L.G. & Chung, R.C.K. (eds.)
(2002) Tree Flora of Sabah and Sarawak,
Volume 4. Sabah Forestry Department, Forest
Research Institute Malaysia, Sarawak Forestry
Department, Malaysia, 388 pp.
Sreekanth, P.M., Balasundaran, M., Nazeem, P.A. &
Suma, T.B. (2012) Genetic diversity of nine
natural Tectona grandis L.f. populations of the
Western Ghats in Southern India. Conservation
Genetics, 13, 1409–1419.
Tata, H.L. & Susmianto, A. (2016) Prospek
Paludikultur Ekosistem Gambut Indonesia
(Prospect of Paludiculture in Indonesian
Peatland Ecosystems). Forda Press, Bogor, 71pp.
(in Bahasa Indonesia).
Tata, H.L., Bastoni, Sofiyuddin, M., Mulyoutami, E.,
Perdana, A. & Janudianto (2015) Jelutung Rawa:
Teknik Budidaya dan Prospek Ekonominya
(Swamp Jelutong: Cultivation Technique and
Economic Prospects). World Agroforestry Centre
(ICRAF) Southeast Asia Regional Program,
Bogor, Indonesia, 62 pp. (in Bahasa Indonesia).
Tata, H.L., Van Noordwijk, M., Jasnari, & Widayati,
A. (2016) Domestication of Dyera polyphylla
(Miq.) Steenis in peatland agroforestry systems in
Jambi, Indonesia. Agroforestry Systems, 90, 617–
630.
Thomas, E., Jalonen, R., Loo, J., Boshier, D., Gallo,
L., Cavers, S., Bordacs, S., Smith, P. & Bozzano,
M. (2014) Genetic considerations in ecosystem
restoration using native tree species. Forest
Ecology & Management, 333, 66–75.
van Noordwijk, M., Matthews, R., Agus, F., Farmer,
J., Verchot, L., Hergoualc’h, K., Persch, S., Tata,
H.L., Lusiana, B., Widayati, A. & Dewi, S. (2014)
Mud, muddle and models in the knowledge value-
chain to action on tropical peatland
conservation. Mitigation and Adaptation
Strategies for Global Change, 19(6), 887–905.
Vos, P., Hogers, R., Bleeker, M., Reijans, M., van de
Lee, T., Hornes, M., Friters, A., Pot, J., Paleman,
J., Kuiper, M. & Zabeau, M. (1995) AFLP: a new
technique for DNA fingerprinting. Nucleic Acid
Page 13
H.L. Tata et al. GENETIC DIVERSITY OF DYERA POLYPHYLLA POPULATIONS IN INDONESIA
Mires and Peat, Volume 21 (2018), Article 01, 1–14, http://www.mires-and-peat.net/, ISSN 1819-754X
© 2018 International Mire Conservation Group and International Peatland Society, DOI: 10.19189/MaP.2017.OMB.269
13
Research, 23, 4407–4414.
Wahyudiningsih, T.S., Naiem, M., Indrioko, S. &
Sumardi, I. (2014) Allozyme variation of the
endemic and vulnerable Dyera lowii Hook.f. in
Central Kalimantan: Implications for genetic
resources conservation. Indonesian Journal of
Biotechnology, 19(1), 79–90.
Wichtmann, W., Schröder, C. & Joosten, H. (eds.)
(2016) Paludiculture - Productive Use of Wet
Peatlands. Schweizerbart Science Publishers,
Stuttgart, Germany, 272 pp.
Widyatmoko, A.Y.P.B.C. & Aprianto (2013)
Keragaman genetic Gonystylus bancanus (Miq)
Kurz berdasarkan penanda RAPD (Random
amplified Polymorphic DNA) (Genetic diversity
of Gonystylus bancanus (Miq) Kurz based on
RAPD (Random amplified Polymorphic DNA)
markers. Jurnal Pemuliaan Tanaman Hutan, 7(1),
53–71 (in Bahasa Indonesia).
Willemstein, S.C. (1987) An Evolutionary Basis for
Pollination Ecology. Leiden Botanical Series
Volume 10, E.J. Brill / Leiden University Press,
Leiden, The Netherlands, 425 pp.
Williams, L. (1963) Lacticiferous plants of economic
importance IV Jelutong (Dyera spp.). Economic
Botany, 17(2), 110–126.
Wurster, C.M. & Bird, M.I. (2016) Barriers and
bridges: early human dispersals in equatorial SE
Asia. In: Harff, J., Bailey, G. & Lüth, F. (eds.).
Geology and Archeology: Submerged Landscapes
of the Continental Shelf: An Introduction. Special
Publications 411, Geological Society, London,
235–250.
Xu, J., Morris, P.J., Liu, J. & Holden, J. (2018)
PEATMAP: Refining estimates of global peatland
distribution based on a meta-analysis. Catena,
160, 130–140.
Zahawi, R.A. & Holl, K.D. (2014) Evaluation of
different tree propagation methods in ecological
restoration in the neotropics. In: Bozzano, M.,
Jalonen, R., Thomas, E., Boshier, D., Gallo, L.,
Cavers, S., Bordacs, S., Smith, P. & Loo, J. (eds.)
Genetic Considerations in Ecosystem Restoration
Using Native Tree Species, State of the World’s
Forest Genetic Resources - Thematic Study, FAO
and Biodiversity International, Rome, Italy, 85–
96.
Submitted 02 Feb 2017, revision 05 Dec 2017
Editor: Olivia Bragg
_______________________________________________________________________________________
Author for correspondence:
Dr Hesti Lestari Tata, Forest Research and Development Centre, Jalan Gunung Batu 5, Bogor 16610,
Indonesia. Tel: +62-251-8633234; E-mail: [email protected]
Page 14
H.L. Tata et al. GENETIC DIVERSITY OF DYERA POLYPHYLLA POPULATIONS IN INDONESIA
Mires and Peat, Volume 21 (2018), Article 01, 1–14, http://www.mires-and-peat.net/, ISSN 1819-754X
© 2018 International Mire Conservation Group and International Peatland Society, DOI: 10.19189/MaP.2017.OMB.269
14
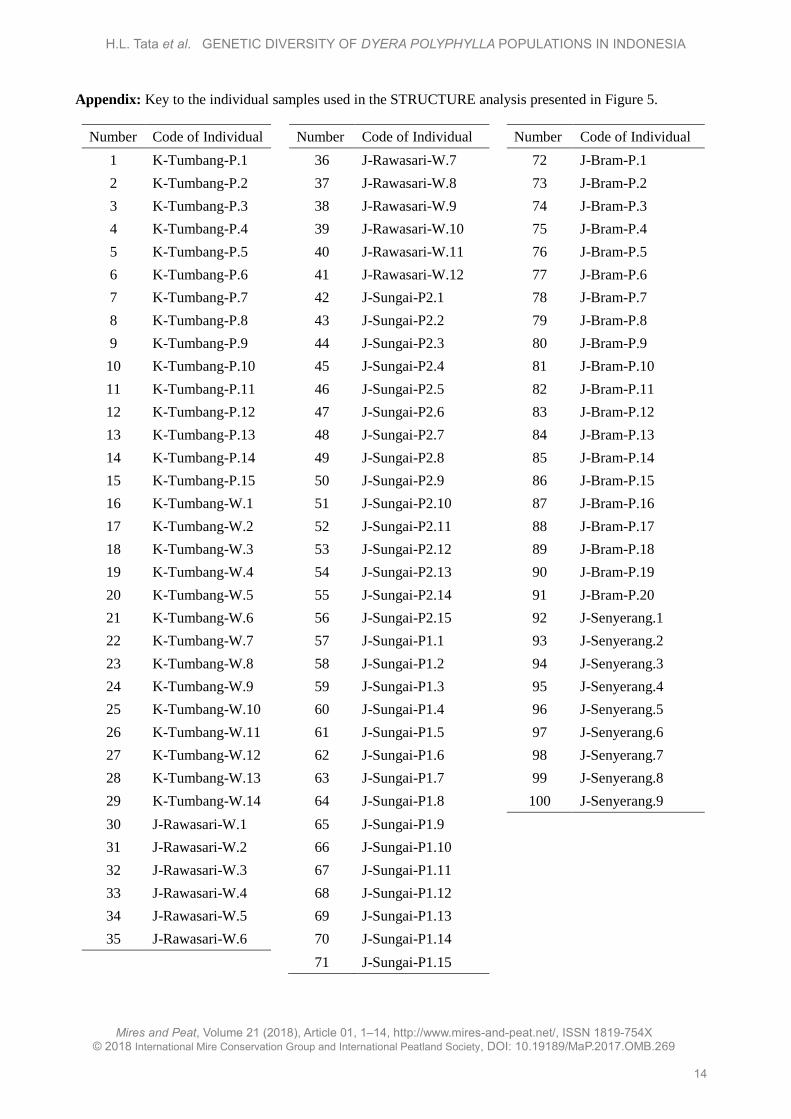
Appendix: Key to the individual samples used in the STRUCTURE analysis presented in Figure 5.
Number Code of Individual Number Code of Individual Number Code of Individual
1 K-Tumbang-P.1 36 J-Rawasari-W.7 72 J-Bram-P.1
2 K-Tumbang-P.2 37 J-Rawasari-W.8 73 J-Bram-P.2
3 K-Tumbang-P.3 38 J-Rawasari-W.9 74 J-Bram-P.3
4 K-Tumbang-P.4 39 J-Rawasari-W.10 75 J-Bram-P.4
5 K-Tumbang-P.5 40 J-Rawasari-W.11 76 J-Bram-P.5
6 K-Tumbang-P.6 41 J-Rawasari-W.12 77 J-Bram-P.6
7 K-Tumbang-P.7 42 J-Sungai-P2.1 78 J-Bram-P.7
8 K-Tumbang-P.8 43 J-Sungai-P2.2 79 J-Bram-P.8
9 K-Tumbang-P.9 44 J-Sungai-P2.3 80 J-Bram-P.9
10 K-Tumbang-P.10 45 J-Sungai-P2.4 81 J-Bram-P.10
11 K-Tumbang-P.11 46 J-Sungai-P2.5 82 J-Bram-P.11
12 K-Tumbang-P.12 47 J-Sungai-P2.6 83 J-Bram-P.12
13 K-Tumbang-P.13 48 J-Sungai-P2.7 84 J-Bram-P.13
14 K-Tumbang-P.14 49 J-Sungai-P2.8 85 J-Bram-P.14
15 K-Tumbang-P.15 50 J-Sungai-P2.9 86 J-Bram-P.15
16 K-Tumbang-W.1 51 J-Sungai-P2.10 87 J-Bram-P.16
17 K-Tumbang-W.2 52 J-Sungai-P2.11 88 J-Bram-P.17
18 K-Tumbang-W.3 53 J-Sungai-P2.12 89 J-Bram-P.18
19 K-Tumbang-W.4 54 J-Sungai-P2.13 90 J-Bram-P.19
20 K-Tumbang-W.5 55 J-Sungai-P2.14 91 J-Bram-P.20
21 K-Tumbang-W.6 56 J-Sungai-P2.15 92 J-Senyerang.1
22 K-Tumbang-W.7 57 J-Sungai-P1.1 93 J-Senyerang.2
23 K-Tumbang-W.8 58 J-Sungai-P1.2 94 J-Senyerang.3
24 K-Tumbang-W.9 59 J-Sungai-P1.3 95 J-Senyerang.4
25 K-Tumbang-W.10 60 J-Sungai-P1.4 96 J-Senyerang.5
26 K-Tumbang-W.11 61 J-Sungai-P1.5 97 J-Senyerang.6
27 K-Tumbang-W.12 62 J-Sungai-P1.6 98 J-Senyerang.7
28 K-Tumbang-W.13 63 J-Sungai-P1.7 99 J-Senyerang.8
29 K-Tumbang-W.14 64 J-Sungai-P1.8 100 J-Senyerang.9
30 J-Rawasari-W.1 65 J-Sungai-P1.9
31 J-Rawasari-W.2 66 J-Sungai-P1.10
32 J-Rawasari-W.3 67 J-Sungai-P1.11
33 J-Rawasari-W.4 68 J-Sungai-P1.12
34 J-Rawasari-W.5 69 J-Sungai-P1.13
35 J-Rawasari-W.6 70 J-Sungai-P1.14
71 J-Sungai-P1.15