Genetic Variability, Heritability, Genetic advance, Genetic advance as Percent Mean and Character Association of Ethiopian Mustard (Brasica carinata A. Braun) Land
races
IJPBCS
Genetic variability, heritability, genetic advance, genetic advance as percent mean and character association of Ethiopian mustard (Brasica carinata A. Braun) land races 1*Fekadu Amsalu, 2Sentayehu Alamerew,1Bulecha Woyessa
1Holetta Agricultural Research Center P. O. Box 2003, Addis Ababa, Ethiopia.Email:[email protected]
2Department of Plant science and Horticulture, Jimma University P. O. Box 307, Jimma, Ethiopia.
Field experiment was conducted to estimate genetic variability, heritability, genetic advance, genetic advance as a percent mean and character association for forty nine genotypes of Ethiopian mustards collected from different agro ecologies. The experiment was carried out in a simple lattice design. The analysis of variance showed that there were significant differences among genotypes for all traits compared. The significant difference indicates the existence of genetic variability among the accessions which is important for improvement. High genotypic and phenotypic coefficients of variations were observed in seed yield per plot, oil yield per plot, and plant height. This shows that selection of these traits based on phenotype may be useful for yield improvement. The highest heritability in broad sense was recorded for thousand seed weight (68.80%) followed by days to flowering (65.91%), stand percent (63.14%), linolenic acid(62.58%), days to maturity (60.43%), plant height (59.63%), palmitic acid (58.19%), linoleic acid (57.46%),oil content (50.33%), oil yield (44.84%), seed yield per plot(42.99%),and primary branches(34.20%). This suggests that large proportion of the total variance was due to the high genotypic and less environmental variance. In the correlation coefficient analysis, seed yield per plot showed positive correlation with oil content, oil yield, plant height and seed yield per plant. In the path analysis, number of primary branches and oil yield showed positive direct effect on seed yield per plot. In this study, seed yield per plot, oil content, oil yield and primary branches were found to be the most important components for the improvement of seed and oil. Therefore more emphasis should be given for highest heritable traits of mustard and to those positively correlated traits to improve these characters using the tested genotypes.
INTRODUCTION Ethiopian mustard (Brasica carinata A. Braun) is believed to be originated in the highlands of the Ethiopian plateau and the adjoining portion of East Africa and the Mediterranean coast (Gomez-Campo and Prakash, 1999). It evolved as a natural cross between B. nigra (BB) (n=8) and B. oleracea (CC) (n=9) and underwent further chromosomal doubling (2n=34; UN, 1935).It is partially amphidiploids. Crop improvement program through plant breeding, as a result, occurs through selection operating on genetic
variability. Selection by plant breeders or by farmers can be intense and has resulted in major improvements.
*Corresponding author: Fekadu Amsalu, Holetta Agricultural Research Center P. O. Box 2003, Addis Ababa, Ethiopia.Email:[email protected]
Genetic Variability, Heritability, Genetic advance, Genetic advance as Percent Mean and Character Association of Ethiopian Mustard (Brasica carinata A. Braun) Land
races
Amsalu et al. 167 However, continued success in plant breeding can only be realized in so far as new variability is available for selection (Copper et al., 2001). Such variability provides adaptability, which is the capacity for genetic change in response to selection (Sigmmonds, 1962). Genetic variability is therefore essential for crop improvement. Therefore the present study was, executed with the objectives of estimating the genetic variability, heritability and genetic advance, genetic advance as a percent mean and estimating the extent of correlation between seed yield and its related traits of Ethiopian mustard traits. MATERIALS AND METHODS Experimental Site The experiment was conducted at Holetta Agricultural Research Center (HARC) in 2013/2014 from June to December 2013. Holetta (West Shewa Zone of Oromia Region) is located at latitude 9
o N and longitude 38
o E,
altitude of 2400 m a.s.l situated 30km West of Addis Ababa. It is one of the representatives of oil seed Brassica growing areas in the central highlands of Ethiopia (Nigussie and Mesfin, 1994). The area has mean annual rainfall of 1059 mm and temperatures of 23
oC (maximum) and 8
oC (minimum). The soil type is
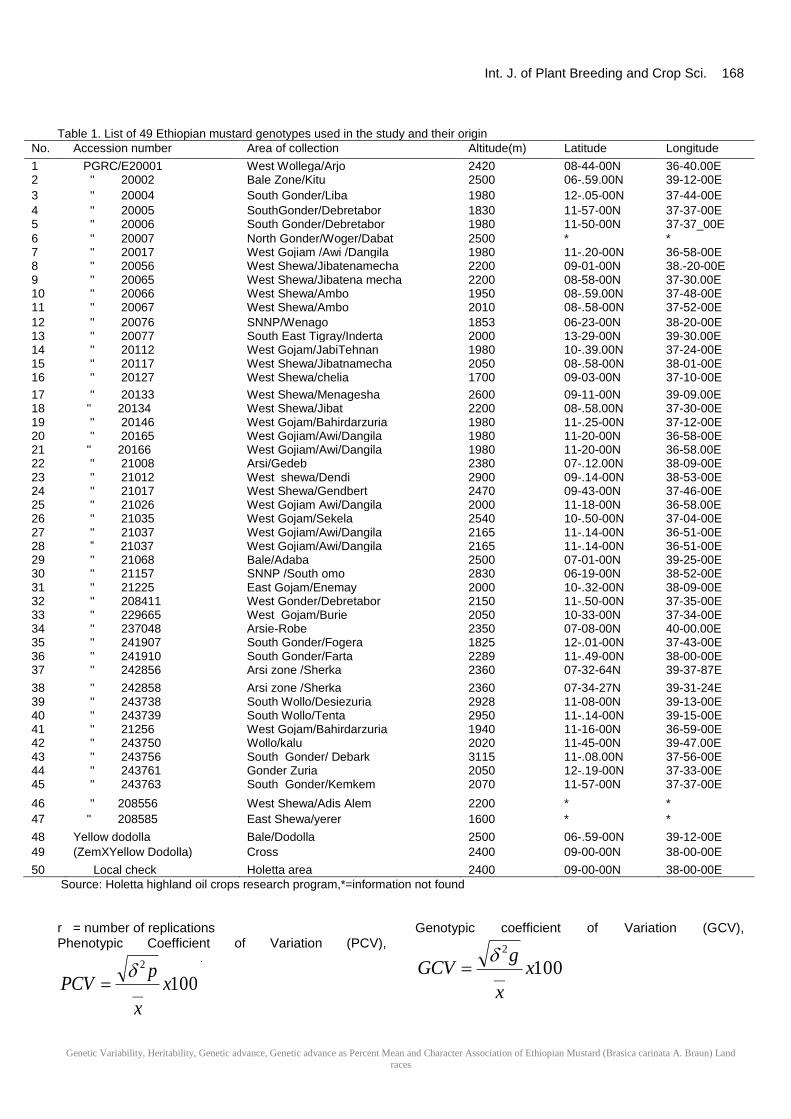
Nitisols with soil ph in the range of 6.0 -7.5(Nigussie and Mesfin, 1994). Description of Test Materials A total of forty-nine mustard land races that include one local check and one standard check were used in this study. The majority of the accessions represent the national collection from different major mustard growing regions of the country and that are maintained at Holetta Agricultural Research center. The accessions were obtained kindly from Holetta agricultural research center of highland oil crops improvement project. The details of the accessions utilized in the experiment are given in Table 1. Experimental Design, Management and Season The experiment was executed from June 2013 to December 2013. The experiment was laid out in simple lattice design 7X7 with two replications. A plot of four central rows each three-meter long and 30Cm spacing between rows were used for data collection. Each replication had seven blocks and each block was represented by seven plots. The path between blocks was 2 meters and the spacing between plots with in sub-blocks was also 0.6 meters. Each entry was manually drilled, a rate of 10 kg/ha and urea and phosphorous fertilizers were applied at the rates of 46/69 kg/ha N/P2O5 respectively following the national recommendations. All other recommended agronomic and cultural practices were carried out following practices described by Adefris (2005).
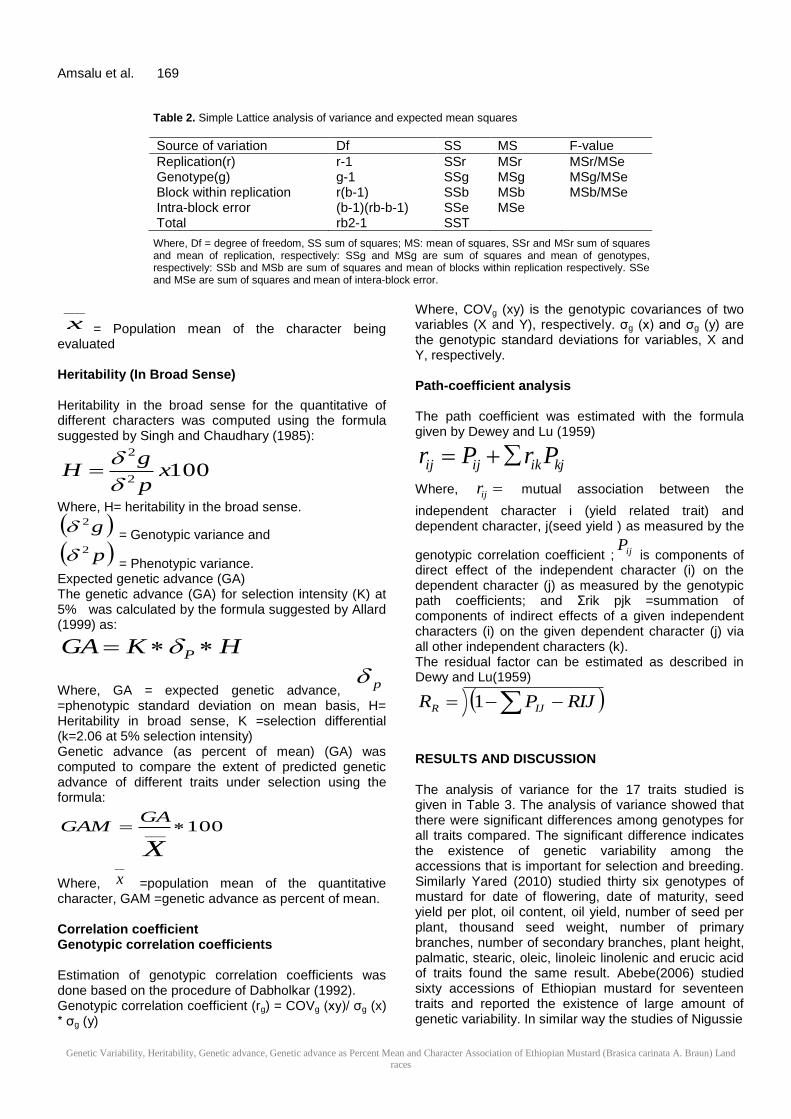
Data Collected The data was collected on plot basis for Days to flowering, Days to maturity, Seed yield per plot, Oil content, thousand seed weight, Oil yield, Stand percent and Oil quality traits. On the other hand the data was also collected on plant basis from five plants randomly selected from the central rows of each plot for Number of Primary branches per plant, Number of Secondary branches per plant, Plant height and Seeds yield per plant on respective plants. Data Analysis Analysis of variance The data collected for traits were subjected to analysis of variance (ANOVA) for simple lattice design. Analysis of variance was done using Proc lattice and Proc GLM procedures of SAS version 9.2, (SAS Institute, 2008). Analysis of variance (Table 2) for the considered traits was done using the model for lattice design as follows:
)()()/()( jeiljlrbrjtiujYil
Where, )( jYil is the observation of the treatment
),,....1( 2kVii , in the block ),...1( kll of the
replication ),...,1( mjj ;
µ is a constant common to all observations; ti is the effect of the treatment i; rj is the effect of the replication j; (b|r) l (j) is the effect of the block l of the replication j;
)( jile is the error associated to the observation
Yil(j), Where eil(j) ~N(0,s) independent. Estimation of phenotypic and genotypic variability The variability present in the population was estimated by simple measures, namely range, mean, standard error, and phenotypic and genotypic variances and coefficients of variations. The phenotypic and genotypic variance and coefficients of variation was also estimated as per the procedure suggested by Burton and De Vane (1953) as follows:
egp 222
r
MSeMSgg
2
Where, g2
=Genotypic variance
P2 = Phenotypic variance
e2 = Environmental (error) variance or Error mean square
MSg= mean sum square due to genotypes
(accessions)
MSe=mean sum square of error (environmental variance)
Genetic Variability, Heritability, Genetic advance, Genetic advance as Percent Mean and Character Association of Ethiopian Mustard (Brasica carinata A. Braun) Land
races
Int. J. of Plant Breeding and Crop Sci. 168
Table 1. List of 49 Ethiopian mustard genotypes used in the study and their origin
No. Accession number Area of collection Altitude(m) Latitude Longitude
50 Local check Holetta area 2400 09-00-00N 38-00-00E
Source: Holetta highland oil crops research program,*=information not found
r = number of replications Phenotypic Coefficient of Variation (PCV),
100__
2
x
x
pPCV
Genotypic coefficient of Variation (GCV),
100__
2
x
x
gGCV
Genetic Variability, Heritability, Genetic advance, Genetic advance as Percent Mean and Character Association of Ethiopian Mustard (Brasica carinata A. Braun) Land
races
Amsalu et al. 169
Table 2. Simple Lattice analysis of variance and expected mean squares
Source of variation Df SS MS F-value
Replication(r) r-1 SSr MSr MSr/MSe Genotype(g) g-1 SSg MSg MSg/MSe Block within replication r(b-1) SSb MSb MSb/MSe Intra-block error (b-1)(rb-b-1) SSe MSe Total rb2-1 SST
Where, Df = degree of freedom, SS sum of squares; MS: mean of squares, SSr and MSr sum of squares and mean of replication, respectively: SSg and MSg are sum of squares and mean of genotypes, respectively: SSb and MSb are sum of squares and mean of blocks within replication respectively. SSe and MSe are sum of squares and mean of intera-block error.
__
x = Population mean of the character being evaluated Heritability (In Broad Sense) Heritability in the broad sense for the quantitative of different characters was computed using the formula suggested by Singh and Chaudhary (1985):
1002
2
xp
gH
Where, H= heritability in the broad sense.
g2 = Genotypic variance and
p2 = Phenotypic variance.
Expected genetic advance (GA) The genetic advance (GA) for selection intensity (K) at 5% was calculated by the formula suggested by Allard (1999) as:
HKGA P
Where, GA = expected genetic advance, p
=phenotypic standard deviation on mean basis, H= Heritability in broad sense, K =selection differential (k=2.06 at 5% selection intensity) Genetic advance (as percent of mean) (GA) was computed to compare the extent of predicted genetic advance of different traits under selection using the formula:
100___
X
GAGAM
Where,
__
x =population mean of the quantitative character, GAM =genetic advance as percent of mean. Correlation coefficient Genotypic correlation coefficients Estimation of genotypic correlation coefficients was done based on the procedure of Dabholkar (1992). Genotypic correlation coefficient (rg) = COVg (xy)/ σg (x) * σg (y)
Where, COVg (xy) is the genotypic covariances of two variables (X and Y), respectively. σg (x) and σg (y) are the genotypic standard deviations for variables, X and Y, respectively. Path-coefficient analysis The path coefficient was estimated with the formula given by Dewey and Lu (1959)
kjikijij PrPr
Where, ijr mutual association between the
independent character i (yield related trait) and dependent character, j(seed yield ) as measured by the
genotypic correlation coefficient ; ijP is components of
direct effect of the independent character (i) on the dependent character (j) as measured by the genotypic path coefficients; and Σrik pjk =summation of components of indirect effects of a given independent characters (i) on the given dependent character (j) via all other independent characters (k). The residual factor can be estimated as described in Dewy and Lu(1959)
RIJPR IJR 1
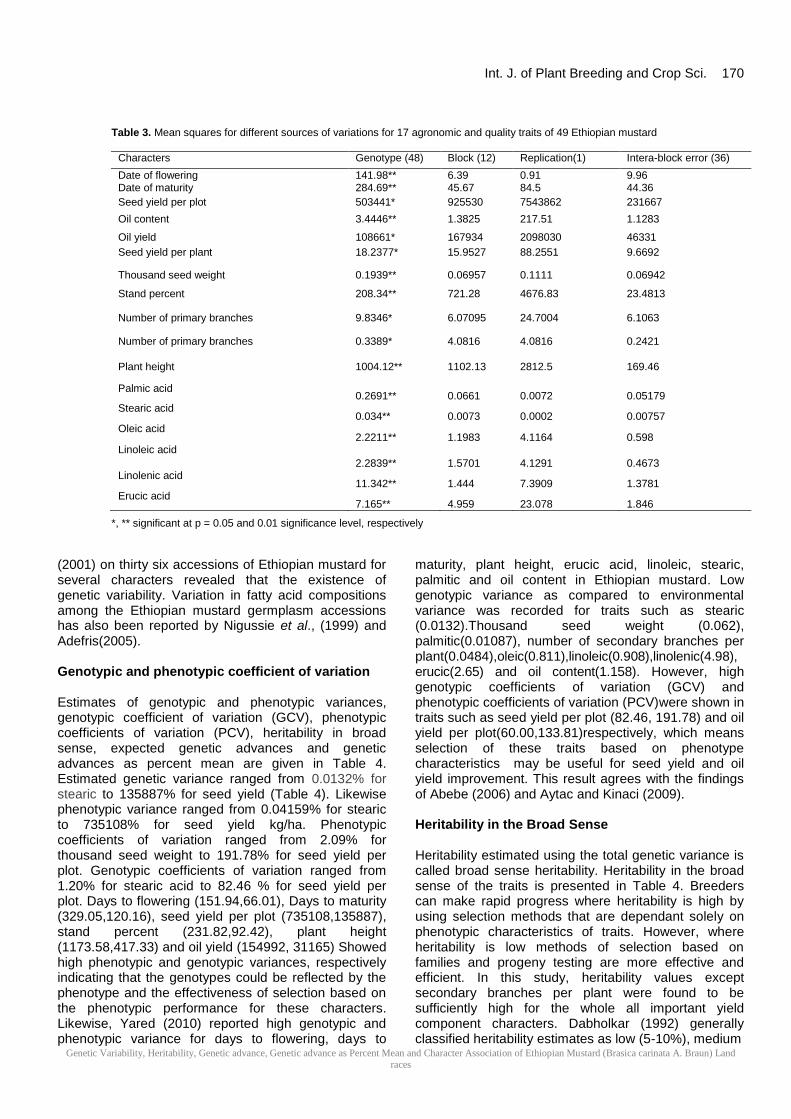
RESULTS AND DISCUSSION The analysis of variance for the 17 traits studied is given in Table 3. The analysis of variance showed that there were significant differences among genotypes for all traits compared. The significant difference indicates the existence of genetic variability among the accessions that is important for selection and breeding. Similarly Yared (2010) studied thirty six genotypes of mustard for date of flowering, date of maturity, seed yield per plot, oil content, oil yield, number of seed per plant, thousand seed weight, number of primary branches, number of secondary branches, plant height, palmatic, stearic, oleic, linoleic linolenic and erucic acid of traits found the same result. Abebe(2006) studied sixty accessions of Ethiopian mustard for seventeen traits and reported the existence of large amount of genetic variability. In similar way the studies of Nigussie
Genetic Variability, Heritability, Genetic advance, Genetic advance as Percent Mean and Character Association of Ethiopian Mustard (Brasica carinata A. Braun) Land
races
Int. J. of Plant Breeding and Crop Sci. 170
Table 3. Mean squares for different sources of variations for 17 agronomic and quality traits of 49 Ethiopian mustard
Number of primary branches 9.8346* 6.07095 24.7004 6.1063
Number of primary branches 0.3389* 4.0816 4.0816 0.2421
Plant height 1004.12** 1102.13 2812.5 169.46
Palmic acid 0.2691** 0.0661 0.0072 0.05179
Stearic acid 0.034** 0.0073 0.0002 0.00757
Oleic acid 2.2211** 1.1983 4.1164 0.598
Linoleic acid
2.2839** 1.5701 4.1291 0.4673 Linolenic acid
11.342** 1.444 7.3909 1.3781 Erucic acid
7.165** 4.959 23.078 1.846
*, ** significant at p = 0.05 and 0.01 significance level, respectively
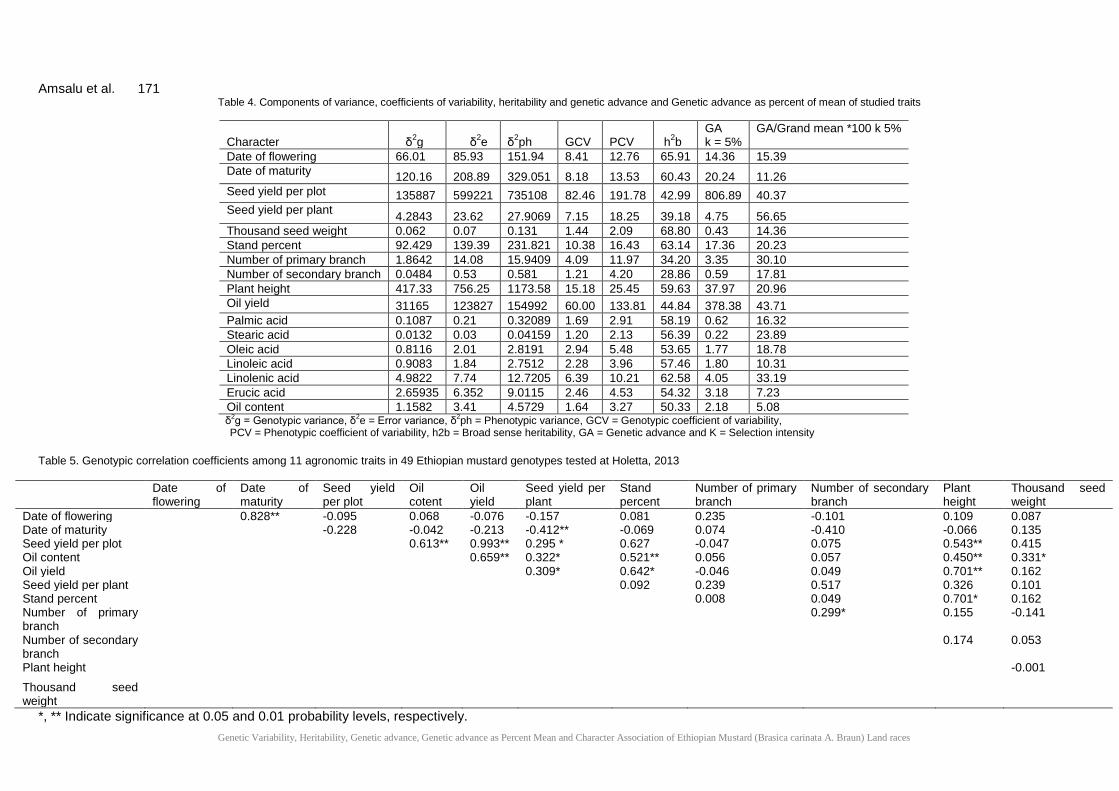
(2001) on thirty six accessions of Ethiopian mustard for several characters revealed that the existence of genetic variability. Variation in fatty acid compositions among the Ethiopian mustard germplasm accessions has also been reported by Nigussie et al., (1999) and Adefris(2005). Genotypic and phenotypic coefficient of variation Estimates of genotypic and phenotypic variances, genotypic coefficient of variation (GCV), phenotypic coefficients of variation (PCV), heritability in broad sense, expected genetic advances and genetic advances as percent mean are given in Table 4. Estimated genetic variance ranged from 0.0132% for stearic to 135887% for seed yield (Table 4). Likewise phenotypic variance ranged from 0.04159% for stearic to 735108% for seed yield kg/ha. Phenotypic coefficients of variation ranged from 2.09% for thousand seed weight to 191.78% for seed yield per plot. Genotypic coefficients of variation ranged from 1.20% for stearic acid to 82.46 % for seed yield per plot. Days to flowering (151.94,66.01), Days to maturity (329.05,120.16), seed yield per plot (735108,135887), stand percent (231.82,92.42), plant height (1173.58,417.33) and oil yield (154992, 31165) Showed high phenotypic and genotypic variances, respectively indicating that the genotypes could be reflected by the phenotype and the effectiveness of selection based on the phenotypic performance for these characters. Likewise, Yared (2010) reported high genotypic and phenotypic variance for days to flowering, days to
maturity, plant height, erucic acid, linoleic, stearic, palmitic and oil content in Ethiopian mustard. Low genotypic variance as compared to environmental variance was recorded for traits such as stearic (0.0132).Thousand seed weight (0.062), palmitic(0.01087), number of secondary branches per plant(0.0484),oleic(0.811),linoleic(0.908),linolenic(4.98),erucic(2.65) and oil content(1.158). However, high genotypic coefficients of variation (GCV) and phenotypic coefficients of variation (PCV)were shown in traits such as seed yield per plot (82.46, 191.78) and oil yield per plot(60.00,133.81)respectively, which means selection of these traits based on phenotype characteristics may be useful for seed yield and oil yield improvement. This result agrees with the findings of Abebe (2006) and Aytac and Kinaci (2009). Heritability in the Broad Sense Heritability estimated using the total genetic variance is called broad sense heritability. Heritability in the broad sense of the traits is presented in Table 4. Breeders can make rapid progress where heritability is high by using selection methods that are dependant solely on phenotypic characteristics of traits. However, where heritability is low methods of selection based on families and progeny testing are more effective and efficient. In this study, heritability values except secondary branches per plant were found to be sufficiently high for the whole all important yield component characters. Dabholkar (1992) generally classified heritability estimates as low (5-10%), medium
Genetic Variability, Heritability, Genetic advance, Genetic advance as Percent Mean and Character Association of Ethiopian Mustard (Brasica carinata A. Braun) Land races
Amsalu et al. 171
Table 4. Components of variance, coefficients of variability, heritability and genetic advance and Genetic advance as percent of mean of studied traits
Character
δ
2g
δ
2e
δ
2ph
GCV
PCV
h
2b
GA k = 5%
GA/Grand mean *100 k 5%
Date of flowering 66.01 85.93 151.94 8.41 12.76 65.91 14.36 15.39
Date of maturity 120.16 208.89 329.051 8.18 13.53 60.43 20.24 11.26
2ph = Phenotypic variance, GCV = Genotypic coefficient of variability,
PCV = Phenotypic coefficient of variability, h2b = Broad sense heritability, GA = Genetic advance and K = Selection intensity
Table 5. Genotypic correlation coefficients among 11 agronomic traits in 49 Ethiopian mustard genotypes tested at Holetta, 2013
Date of flowering
Date of maturity
Seed yield per plot
Oil cotent
Oil yield
Seed yield per plant
Stand percent
Number of primary branch
Number of secondary branch
Plant height
Thousand seed weight
Date of flowering 0.828** -0.095 0.068 -0.076 -0.157 0.081 0.235 -0.101 0.109 0.087 Date of maturity -0.228 -0.042 -0.213 -0.412** -0.069 0.074 -0.410 -0.066 0.135 Seed yield per plot 0.613** 0.993** 0.295 * 0.627 -0.047 0.075 0.543** 0.415 Oil content 0.659** 0.322* 0.521** 0.056 0.057 0.450** 0.331* Oil yield 0.309* 0.642* -0.046 0.049 0.701** 0.162 Seed yield per plant 0.092 0.239 0.517 0.326 0.101 Stand percent 0.008 0.049 0.701* 0.162 Number of primary branch
0.299* 0.155 -0.141
Number of secondary branch
0.174 0.053
Plant height -0.001
Thousand seed weight
*, ** Indicate significance at 0.05 and 0.01 probability levels, respectively.
Genetic Variability, Heritability, Genetic advance, Genetic advance as Percent Mean and Character Association of Ethiopian Mustard (Brasica carinata A. Braun) Land
races
Int. J. of Plant Breeding and Crop Sci. 172
(10-30%) and high (30-60%). Based on this classification, thousand seed weight (68.80%), days to flowering (65.91%), stand percent (63.14%), linolenic (62.58%), days to maturity (60.43%), plant height (59.63%), palmitic (58.19%), linoleic (57.46%), stearic (56.39%), erucic acid content (54.32%), oleic (53.65%),oil content (50.53%), oil yield (44.84%), seed yield per plot(42.99%) and number of primary branches per plants (34.20%) exhibited high heritability estimates. Almost all studied traits except secondary branches per plant showed the highest percent broad sense heritability character. From all studied traits thousand seed weight was found to be the most heritable trait in the genotype, with heritability of 68.80 %, followed by days to maturity (65.91%) and stand percent (63.14%).This phenomenon indicates that selection for these traits in the genotype would be most effective for the expression of these traits in the succeeding generations. Therefore, good improvement can be made if some of these traits are considered as selection criteria in future breeding program. Similar findings had been reported by Yared (2010) for thousand seed weight, date of flowering, date of maturity, plant height, palmatic, lenoleic and stearic oil content of seeds. High heritability value for thousand seed weight, date to flowering, days to maturity plant height, linoleic, erucic acid, stearic and palmatic acid content of seeds recorded in the current study was also recorded by Yared (2010) and Abebe (2006). According to Singh (1993), if the heritability of a character is high, selection for such character is fairly easy as selected character will be transmitted to its progeny. This is because there would be a close correspondence between genotype and phenotype due to a relatively similar contribution of the environment to the genotype. In this study of traits in broad sense heritability only secondary branches per plant trait (28.86%) exhibit medium heritability estimates. Genetic advance Concerning the genetic advance at 5% intensity the highest genetic gain was predicted for seed yield per plot (806.89kg/ha) followed by seed oil yield (378.38kg/ha) and while the lowest genetic advance was predicted for stearic (0.22%). Genetic advance as a percent mean ranged from 5.08% for oil content to 56.65% for seed yield per plant (Table 4). Within this range, a relatively high genetic advance as a percent mean was observed for seed yield per plant (56.65%) and oil yield (43.71%) followed by seed yield per plot (40.37%). On the other side high genetic advance with high heritability was shown for seed yield per plot and seed oil yield which may be because of the presence of both additive and non-additive gene action (Liang et al., 1972).Traits having medium heritability along with high genetic advance could be improved using breeding procedure such as pedigree method. On the other hand, the lowest genetic gain as percent of means was observed for oil content (5.08 %) next to erucic acid
(7.23%). Low genetic advance as percent means observations in this study indicates that characters probably were under environmental influence than the genotypic expression and that selection based on these traits would be ineffective. Character Associations Improvement for a target character can be achieved by indirect selection using other characters that are more heritable and easy to select. This selection strategy requests understanding of the interrelationship of the characters among themselves and with the target character.
Correlation of Seed Yield with other Traits
Genotypic correlation coefficients of the agronomic traits are presented in Table 5. Seed yield per plot showed highly significant and positive correlation with oil content (0.613),oil yield (0.993), plant height (0.543) seed yield per plants (0.295), Taking into account seed yield per plant, oil content, oil yield and plant height as selection parameter will be an effective way to increase seed, oil content and oil yield. This result is in agreement with the findings of Abebe (2006), Aytac and Kinac(2009) and Jeromela et al. (2007) who reported positive correlation of seed yield per plot with oil yield per plot and seed yield per plant. Seed yield of plot also showed positive associations between the stand percent and thousand seed weight. Days to maturity showed significant positive correlation between number of primary branches (0.074) and thousand seed weight (0.135), while highly significant but negative correlation was found with seed yield per plant (-0.412) and negative correlation with seed yield per plot (-0.228), oil content (-0.042), oil yield (-0.213), stand percent(-0.069), number of secondary branches per plant (-0.410) and plant height(-0.066). Hence making simultaneous increase for these characters with yield per plot is difficult. From these results, we may extract that indirect selection for earliness for days to maturity; shortness of plant height will be worthwhile in improvement of the seed and oil yield. Result of positive correlation of days to flowering with days to maturity as well as negative correlation of these two traits with seed yield per plant and oil yield are in agreement with the result of Abebe (2006) and Yared(2010). Association of plant height with seed yield per plot (0.543), oil content percent (0.450), oil yield (0.701), stand percent (0.711) was significant and positive, while its association with date of maturity (-0.066) was found negative. Number of primary branches per plant showed positive correlation with number of secondary branches per plant (0.299). Seed yield per plant showed positive correlation with stand percent (0.092), primary branches (0.239), secondary branches (0.517), plant height (0.326) and thousand seed weight (0.101).
Genetic Variability, Heritability, Genetic advance, Genetic advance as Percent Mean and Character Association of Ethiopian Mustard (Brasica carinata A. Braun) Land
races
Amsalu et al. 173
Table 6. Genotypic correlation coefficients among 10 agronomic and 7 quality characters in 49 Ethiopian mustard genotypes studied at Holetta , 2013/2014 cropping season
*, ** significant at p < 0.05 and p < 0.01 significance level respectively
Genotypic correlation coefficients between agronomic and quality traits
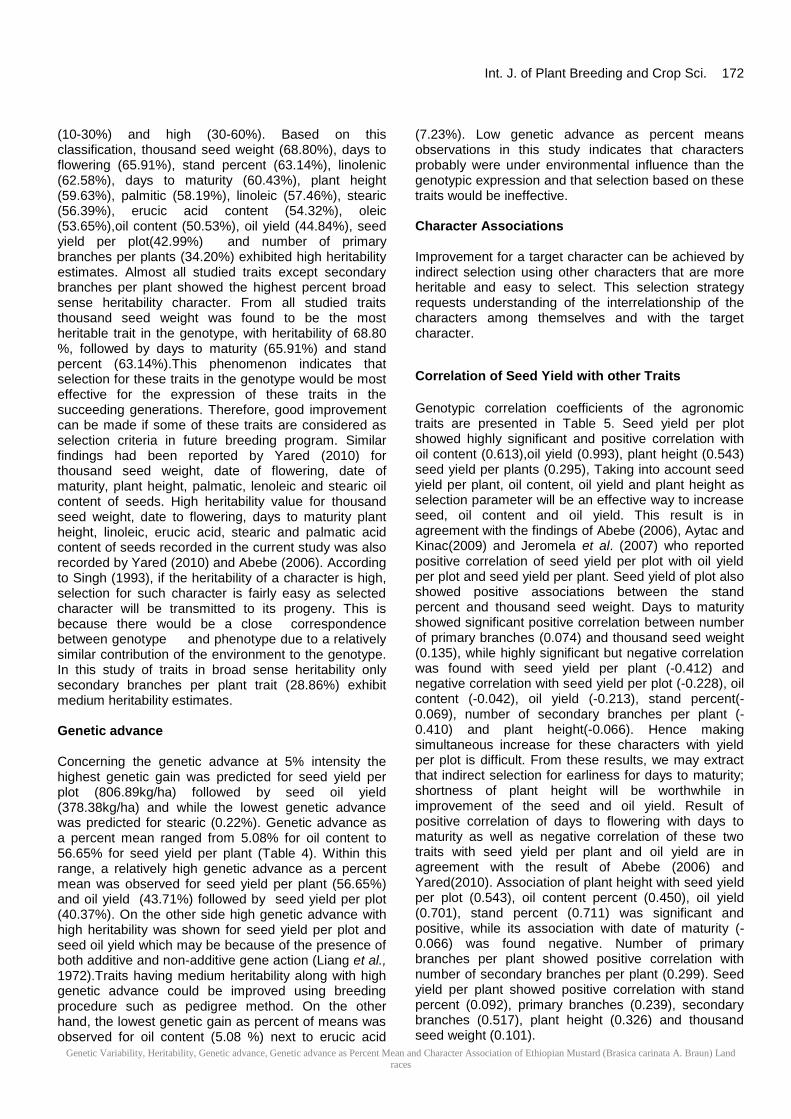
Genotypic correlation coefficients between agronomic and quality traits are presented in Table 6. Correlation of palmitic acid to days to flowering (-0.155), date of maturity (-0.187), seed yield (-0.040), oil yield (-0.080), stand percent (-0.050) and thousand seed weight (-0.161) was negative. However palmitic acid showed significant positive correlation with number of primary branches (0.285) and secondary branches (0.275) and positive correlation with plant height (0.094). The result of the current study also showed a highly significant and positive association of oil content with seed yield per plot (0.613) and oil yield per plot (0.659) stand percent (0.521), plant height (0.450) and thousand seed weight (0.331). Oleic acid showed a positive and highly significant association with date of flowering(0.517) and days to maturity(0.581) where as it showed a negative correlation with seed yield per plot (-0.044) , oil yield per plot (-0.028), seed yield per plants(-0.261) and thousand seed yield (-0.123).Positive association of oil content with number of primary branches, secondary branches and date of flowering was recorded. On the other hand, negative correlation of erucic acid was observed between seed yield per plot (-0.031), oil yield (-0.068), stand percent (-0.051), primary branches (-0.038) and thousand seed weight (-0.125).
Genotypic correlation coefficients among quality traits
Genotypic correlation coefficients among quality traits are presented in Table 7. A highly significant but negative correlations were observed between oleic acid and linoleic(-0.468),linolenic(-0.716) and erucic acid (-0.760).Since for edible purpose oleic acid is considered as preferred fatty acid increased level of the three linoleic, linolenic and erucic acid is not nutritionally desirable. This relationship had practical advantage towards selecting high oleic, but low linoleic, linolenic and erucic acid containing genotypes which is in agreement with Islam (2009), Patel et al. (2003), Sia et al. (2004), Nigussie (2001); Adefris (2005) and Tsege et al. (2004) who found similar results., However Khan et al.(2008) reported the opposite. Highly significant positive correlation was found between palmitic (0.302), linoleic (0.430)and erucic acid content (0.517), where as negative association was observed between palmitic and oleic acid (-0.015), which indicates that some sort of compromise may be needed in order to increase palmitic acid for edible purposes for which Islam (2009) reported the opposite. Erucic acid showed negative correlation with oil content (-0.200) though it was insignificant which implies increasing oil content, favors the oil for edible purpose in terms of erucic and oleic acid content. Likewise, highly significant negative correlation was found between linolenic and oil content (-0.104). There was also highly negative correlation
Genetic Variability, Heritability, Genetic advance, Genetic advance as Percent Mean and Character Association of Ethiopian Mustard (Brasica carinata A. Braun) Land races
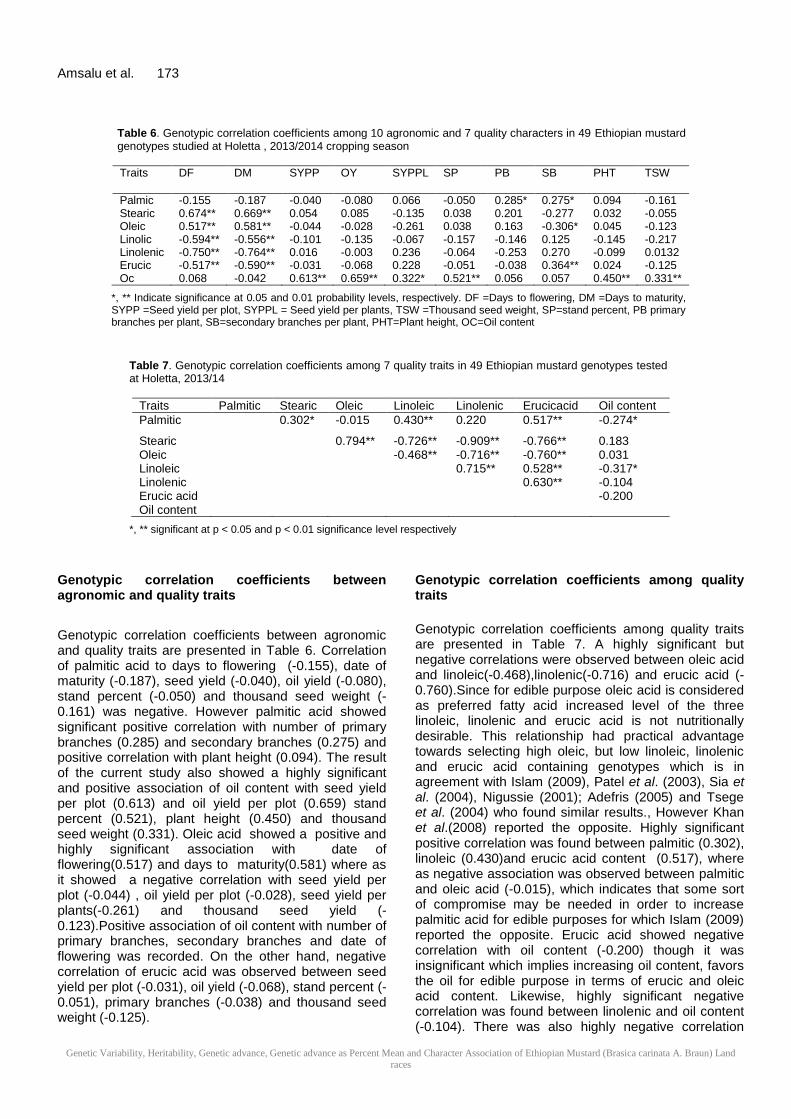
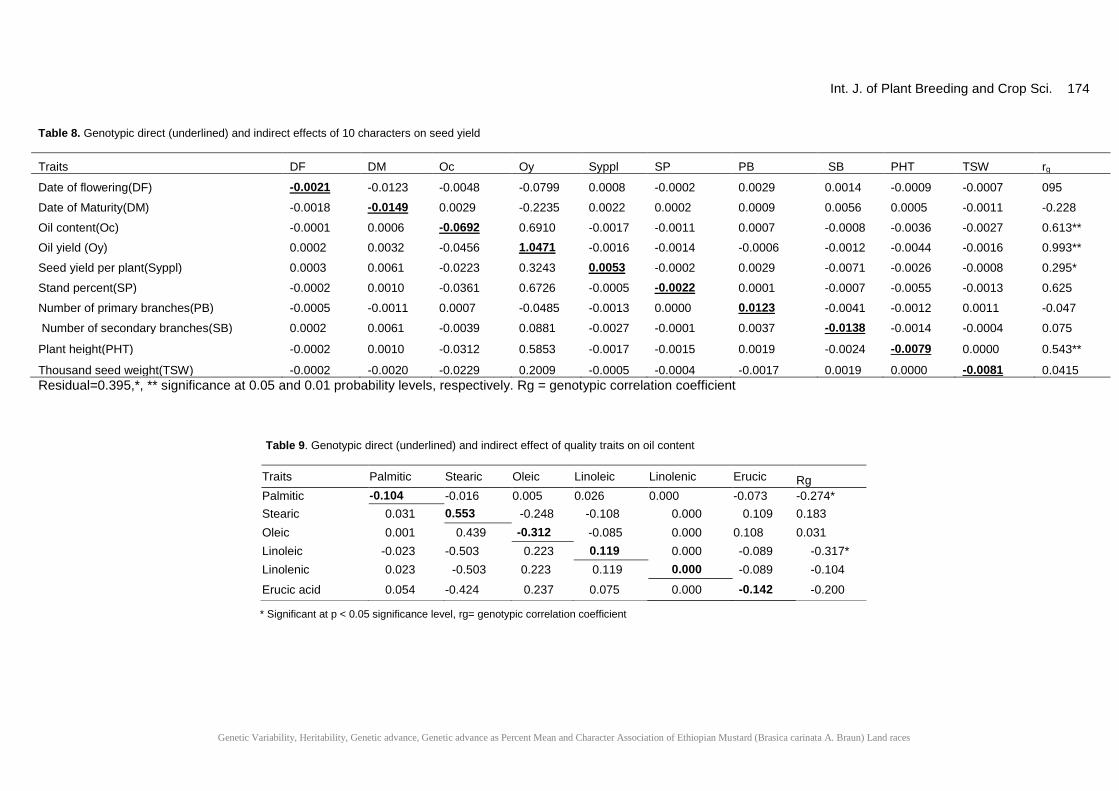
Int. J. of Plant Breeding and Crop Sci. 174 Table 8. Genotypic direct (underlined) and indirect effects of 10 characters on seed yield
Traits DF DM Oc Oy Syppl SP PB SB PHT TSW rg
Date of flowering(DF) -0.0021 -0.0123 -0.0048 -0.0799 0.0008 -0.0002 0.0029 0.0014 -0.0009 -0.0007 095
Date of Maturity(DM) -0.0018 -0.0149 0.0029 -0.2235 0.0022 0.0002 0.0009 0.0056 0.0005 -0.0011 -0.228
* Significant at p < 0.05 significance level, rg= genotypic correlation coefficient
Genetic Variability, Heritability, Genetic advance, Genetic advance as Percent Mean and Character Association of Ethiopian Mustard (Brasica carinata A. Braun) Land
races
Amsalu et al. 175 between oleic linoleic (-0.468) and linolenic acid (-0.716), which is in agreement with the findings of Adefris (2005) and Kumar and Tsunda (1980), respectively. The traits association which contradicted with the previous findings might have been as a result of synchronized selection applied on the traits concerned. Path Coefficient Analysis Path coefficient analysis provides more effective means of separating direct and indirect factors, permitting a critical examination of the specific forces acting to produce a given correlation and measuring the relative importance of the causal factors. Therefore, path coefficient analysis was carried out to partition correlation coefficients into direct and indirect effects as described by (Giriraji and Vijayakumar, 1974). Path coefficient analysis for seed yield per plot Here, for path analysis, seed yield per plot was considered as a dependent trait (Table8). Seed yield per plants (0.0053), number of primary branches per plant (0.0123) and oil yield per plot (1.0471) showed positive direct effect on seed yield per plot. From these traits, seed yield per plant and oil yield per plot also showed a positive and significant correlation with seed yield per plot. Therefore, considering of seed yield per plants, number of primary branches and oil yield per plot as selection criteria will be advantageous in studied that aimed at improving seed yield. This result is consistent with findings of Singh and Singh (1997), Dilek (2008) and Yared(2010). Days to maturity showed a negative direct effect (-0.0149) on seed yield per plot. On the other hand, days to flowering had a negative direct effect (-0.0021) on seed yield per plot which had also been negatively correlated with seed yield per plot. This implies consideration days to maturity in breeding programs for achieving earliness in days to flowering. Seed yield per plant revealed a positive direct effect (0.0053) on seed yield per plot that indicates the indirect effect through oil yield per plot was positive. Direct effect of 1000-seed weight on seed yield per plot was negative (-0.0081), which indicates selection of this trait may be ineffective in improving the seed yield per plot. However, its effect via yield of seeds per plant and oil yield per plot is help full. Moreover, seed yield per plant, numbers of primary branches per plant and oil yield were considered as yield components. The residual that represent other factors affecting seed yield but not included in this study was also considered. Based on genotypic path coefficient analysis, the highest and favorable direct effect was exerted on seed yield by oil yield per plot (1.0471), followed by number of primary branches per plot (0.0123) and seed yield per plants (0.0053). From these traits only oil yield per plot was also correlated strongly and positively with seed yield per plot. Hence, this character could be considered in the improvement of seed yield per plot.
Whereas days to flowering (-0.0021), days to maturity (-0.0149), oil content (-0.0692), number of secondary branches per plant (-0.0138), plant height (-0.0079) and thousand seed weight (-0.0081) had negative direct influence. Traits like, days to flowering, days to maturity, primary branches per plant exhibited a negative genotypic correlation with seed yield. Similar results were reported by Nigussie (1990) for plant height and number of primary branches. Path coefficient analysis for oil content As dependent trait such as oil content and independent traits such as palmitic, stearic, oleic, linoleic, linolenic and erucic acids were considered in the analysis and the Genotypic direct and indirect effect of quality traits on oil content are presented in Table 9. Stearic (0.553) and linoliec (0.119) had positive direct effect on oil content, while their correlation with oil content was positive for stearic and significantly negative for linoleic. On the other hand, palmitic (-0.104), oleic (-0.312) and erucic (-0.142) showed negative direct effect, while there was also negative correlation of palmatic and erucic acid of these traits with oil content, which indicates efforts in increasing these traits for the improvement of the oil of Ethiopian mustard genotypes may be at the expense of oil content. In this analysis, in general, erucic acid was found the most important component in the improvement of edibility of Ethiopian mustard seed oil. CONCLUSION In this study, 49 Ethiopian mustard genotypes acquired from diverse zones/regions of Ethiopia were evaluated in simple lattice design with two replications at Holetta Agricultural Research Center, West Shewa zone, with the objectives of estimating the genetic variability, heritability, genetic advance, genetic advance as percent mean and estimating the extent of genetic correlation and path analysis among the studied traits. The analysis of variance showed the presence of highly significant differences among the tested genotypes for all of characters considered, indicating the existence of variability among the tested genotypes for these characters. High phenotypic coefficient of variation (PCV) was recorded for seed yield per plot, oil yield and plant height. But low PCV was detected for thousand seed weight, stearic and palmatic acid. Generally, the magnitudes of phenotypic coefficient of variation (PCV) and genotypic coefficient of variation (GCV) were high for seed yield per plot and oil yield. Heritability in broad sense estimates were high for thousand seed weight, days to flowering, stand percent, linolenic, days to maturity, plant height, palmatic, linoleic, stearic, erucic acid and oleic . Likewise, the heritability values for secondary branches were also medium. Genetic advance as percent of the mean (GAM) was high for seed yield per plants, and where as the rest shows low GAM below 50%. Seed yield per plot showed
Genetic Variability, Heritability, Genetic advance, Genetic advance as Percent Mean and Character Association of Ethiopian Mustard (Brasica carinata A. Braun) Land
races
Int. J. of Plant Breeding and Crop Sci. 176
significant positive correlation with oil yield, plant height, seed yield per plants, which indicates that taking in to account seed yield per plant, oil yield and plant height as selection criteria will be an effective way to increase seed and oil yield. Traits associations and path analyses in this study have revealed that considering of seed yield per plant, oil content, oil yield and plant height as selection criteria will be effective in improvement of seed and oil of Ethiopian mustard genotypes. Palmitic, oleic and erucic acid showed negative direct effect on oil content which shows improvement in increasing these traits may be at the expense of the oil content. The positive correlation of oil content with oil yield which is also expressed by its direct effect indicates that breeding strategies which focus on raising the percentage of oil content in seeds will be worthwhile. It is also suggested that further work on crossing and pedigree selection among the genotypes studied is needed in order to get the desired level of oleic, linoleic, linolenic and erucic acid for both food and non-food industry, while improving other seed yield component traits. Further similar study on variability of metric characters using biotechnological tools would also help in substantiating the result obtained. ACKNOWLEDGMENT The first author acknowledges Jimma University of College of agriculture and Veterinary Medicine and Embassy of Netherland in Ethiopia for their sponsoring fund to conduct field experiment. REFERENCES
Abebe D (2006). Genetic Variability and Association
Among Seed Yield and Yield Related Traits in Ethiopian mustard (Brassica carinata A. Braun) at Kulumsa, Arsi. An M.Sc. Thesis Presented to the School of Graduate Studies of Alemaya University. 75
Adefris T (2005). Diversity Study Based on Quality Traits and RAPD Markers and Investigation of Heterosis in Ethiopian Mustard. Ph.D. diss. Georg-August Univ. of Göttingen, Germany. 161p.
Allard RW (1999). Principles of plant breeding. 2th ed.
New York, John Wiley & Sons, 254 p. ISBN 978-0-471-02309-8.
Aytaç Z, Kınac G (2009). Genetic variability and association studies of some quantitative characters in winter rapeseed(Brassica napus L.). African Journal of Biotechnology, 8 (15): 3547-3554
Burton GW, de Vane EH. (1953). Estimating heritability in tall fescue(Festuca arundinacea) from replicated clonal material. Agron. J. 45: 478-481
Copper HDC, Spillane H. Hogkin. (2001). Broadening the Genetic bases of crop production. FAO, IPGRI.
Dabholkar AR (1992). Elements of biometrical genetics. Concept Publishing Company, New Delhi, India.431p.
Dewey DR, KH (1959). A correlation and path coefficient analysis of components of crested wheat grass seed production. J. Agron. 51:515-518
Dilek B (2008). The Correlation and Path Analysis of Yield and Yield Components of Different Winter Rapeseed (Brassica napus ssp.oleifera L.) Cultivars.Res. J. Agric. and Bio. Sci. 4(2): 120-125
Giriraji K, Vijayakumar S (1974). Path coefficient analysis of yield attributes in mung bean. Ind J. Genet. 34: 27-30
Gomez-Campo CS Prakash. (1999). Origin and domestication of the Brassica. 33-58. In: Gomez-Campo C (ed.). Biology of Brassica Coenospecies. Elsevier, Amsterdam.
Islam MSL, Rahman MS Alam.(2009). Correlation and path coefficient analysis in fat and fatty acids of rapeseed and mustard. Bangladesh J. Agril. Res. 34(2): 247-253
Jeromela AMR, Marinkovic A, Mijic M, Jankulovska Z. Zdunic. (2007). Interrelationship between oil Yield and Other Quantitative Traits in Rapeseed (Brassica napus L.). J. Central Eur. Agric. 8(2): 165-170
Khan S, Farhatullah H, Iftikhar, Khalil, M Iqbal, M. Yasir Khan A Naushad. (2008). Genetic
Kumar PR, Tsunoda S (1980) :235-283. Variation in Oil Content and Fatty acid Composition among seeds from the Cruciferae. In: S. Tsunoda, K. Hinata, and C. Gómez –Campo (eds.). Brassica crops and wild allies biology and breeding. Japan Sci. Soci. Press.
Liang GHCR, Reddy AD Dayton (1972). Heterosis, inbreedign depression and heritability estimates in a systematic series of grain sorghum genotypes. Crop Sci. 12(4):409-411
Alemayehu N (2001). Germplasm diversity and Genetics of Quality and Agronomic Traits in Ethiopian Mustard (Brassica carinata A. Braun). Ph.D. Thesis, George-August University of GÖttingen, Germany
Nigussie AH Becker, Gebeyehu G 1999. Genetic variability in Ethiopian mustard (Brassica carinata A. Braun) for quality characteristics. 10
th International
Rapeseed Congress, Canberra, Australia. Nigussie A, Mesfin A. (1994). Relative importance of
some managmnet factors in seed and oil yields of Ethiopian mustasrd (Brasica carinata Braun.) and Rapeseed (Brasica napus L.). Ethiop. J. Agric. Sci. 14: 27-36
Nigussie A (1990). Yield and yield components of Ethiopian mustard and rapeseed as affected by some agronomic practices. An M.Sc Thesis Presented to the School of Graduate Studies of Alemaya University. 112
Patel KMKP, Prajapati CJ, Patel, Patel NP (2003). Variability and correlation studies for fatty acids in Indian mustard. Brassica 5(3-4): 72-74
SAS Institute INC, (2002-2008). SAS STAT, users guide, 9 2, Cary N.C., SAS INC
Sia PB, Singh JN, Sachan RK Pattnaik (2004). Correlation
Genetic Variability, Heritability, Genetic advance, Genetic advance as Percent Mean and Character Association of Ethiopian Mustard (Brasica carinata A. Braun) Land
races
Amsalu et al. 177
among quality traits in Environment and Ecology, 22(2) : 316-318
Sigmmonds NW (1962). Variability in crop plants, its use and conservation. Biological reviews, 37: 422-465
Singh BD. (1993). Plant breeding principles and methods. Kalyani Publishers, Ludhiana, New Delhi.
Singh M, Singh G (1997). Correlation and path analysis in Indian mustard (Brassica juncea L.) under mid hills of Sikkim. J. Hill. Res. India 10(1): 10-12
Tsege GT, Labuschagne MT, Hugo A (2004). Genetic relationships among Ethiopian mustard genotypes based on oil content and fatty acid composition. African J Biotech. 4: 1256-1268
U.N. (1935). Genome analysis in Brassica with special reference to the experimental formation ofB. napus and peculiar mode of fertilization. Jpn. J. Bot. 9: 389-452
Yared S (2010). Genetic diversity and Relationship among Association among Ethiopian mustard (Brassica carinata A. Braun) genotypes based on their agronomic and quality Traits in at Holetta Agricultural research, An M.Sc. Thesis Presented to the School of Graduate Studies of Jima University. 75
Accepted 19 December, 2016. Citation: Amsalu F, Sentayehu A, Bulecha W (2017). Genetic Variability, Heritability, Genetic advance, Genetic advance as Percent Mean and Character Association of Ethiopian Mustard (Brasica carinata A. Braun) Land races. International Journal of Plant Breeding and Crop Science, 4(1): 166-177.