Although all possible care has been taken in the preparation of this publication,Synoptics Limited accepts no liability for any inaccuracies that may be found.
Synoptics Limited reserves the right to make changes without notice both to thispublication and to the product that it describes.
No part of this publication may be reproduced, stored in a retrieval system ortransmitted in any form or by any means electronic, mechanical, photocopying,recording or otherwise without the prior permission of the copyright owner.
This chapter contains detailed instructions for using GeneTools for Gel analysis. It begins by describing how you can load sample files and images into GeneTools. It then showsyou how to detect, place and edit tracks on the image, and then detect, place and editpeaks on the tracks.
This is followed by instructions for calibrating and determining the molecular weightsand quantities represented by peaks on the gels, including how you can use libraries ofmolecular weight/quantity standards.
The chapter continues by showing you how to display a window comparing the profileson different tracks, including how to compare the profiles of tracks on different gels.
The next section describes how to use GeneTools to match the peaks (bands) ondifferent tracks to a standard track or to match the track profiles themselves.
The final section in the chapter tells you how to print and export result reports.
How to create and work with secure sample files
File formats
GeneTools stores data in a secure file format – a SynGene Gel document or .sgd file.These files are also created by compatible acquisition programs, such as GeneSnap.
The secure file format ensures that your data cannot be tampered with, and that yourresults are both traceable and reproducible in keeping with Good Laboratory Practice.
Secure sample files may be:
● analyzed files that have been previously saved in GeneTools – these will contain (fora gel) information about track positions, peaks, assigned standards, results formolecular weights, quantities and peak matching, and so on.
● unanalyzed files that have been saved in an acquisition program, but have not yetbeen loaded into and saved in GeneTools.
GeneTools User Manual 1-1
Opening a secure sample file below shows you how to open both unanalyzed andanalyzed secure sample files.
However, you can also load other image files created by non-secure sources (such asTiff images generated by a scanner) into GeneTools for analysis. When you do this,GeneTools copies the original image and saves it in a secure file – any changes you then make to the original image will have no effect on the image in the secure file. Fulldetails are given in Creating a new secure sample file, page 1-11.
Opening a secure sample file
To open a secure sample file:
1 Choose Open from the File menu to display a standard Windows Opendialog box:
2 Use the dialog box to select the required secure sample file.
3 Press Open.
1-2 GeneTools User Manual
Using GeneTools for Gel analysis
What happens next depends on whether you are opening an analyzed or unanalyzedsecure sample, and in the latter case on whether you have set Auto import methods in the Configuration dialog box.
● If you are opening an analyzed secure sample file:
● The sample will be opened in a Gel window with all tracks and peaks displayedas they were when the file was last saved. All previously analyzed results will beshown in the Results tables.
● If you are opening an unanalyzed secure sample file and you have selected Autoimport methods in the Configuration dialog box:
● The Import method dialog box will open so that you can choose which settingsto import – see Opening or creating a secure sample file with automatic import,page 1-16, for further details.
GeneTools User Manual 1-3
How to create and work with secure sample files
● If you are opening an unanalyzed secure sample file with Auto import methodsdeselected:
● The Sample properties dialog box will open with the image loaded:
The controls shown on the General page in the Sample properties dialog box dependon the type of sample (in the picture shown above, the sample is an ethidium bromidestained DNA gel).
To set the sample properties:
1 If required, select a different Analysis type from the drop-down list box – the default Analysis type is set to Gel when GeneTools is first installed, but youcan change this using Configuration in the Extras menu (see page 8-139).
2 Click on one of the direction radio buttons to set the Electrophoresisdirection (the default is Down).
1-4 GeneTools User Manual
Using GeneTools for Gel analysis
3 GeneTools detects the Image type automatically, so you shouldn’t need tochange this setting. However, if you wish to change the setting:
a Click on the Fluorescence radio button for a fluorescence image (brightbands on a dark background).
b Click on the Absorption radio button for an absorption image (dark bandson a bright background).
4 The red rectangle on the image preview defines the area of interest – the area analyzed when GeneTools performs an automatic track location. If required(for example, if you are working with a multi-layer sample), you can define agrid of independent areas of interest.
Note Each area of interest is (nearly) independent of all the other areas of interest defined onthe gel. Molecular weight/quantity standard tracks must be assigned separately withineach area, and matching is carried out between the tracks in the same area and notwith any tracks in other areas. Separate quantity calibrations can be used for each area,though quantity calibrations can be shared between areas. A single set of integrationparameters is used for all areas, but molecular weight calibration, quantity calibrationand matching parameters can be chosen independently for each area of interest. Trackscan be located, adjusted and locked independently within each area of interest. Rf startand end lines can be adjusted independently for each area of interest. The Results andGraphics panes show details for the selected area of interest only.
To define a grid of independent areas of interest on the gel image:
a Enter the number of Columns in the grid.
b Enter the number of Rows in the grid.
(Leave the numbers of Columns and Rows set to 1 if you just want a singlearea of interest.)
GeneTools User Manual 1-5
How to create and work with secure sample files
As you enter the numbers, a grid of red rectangles appears on the image. Forexample:
If required, as in this example, you can adjust the shape and position of theareas of interest – see the following steps.
1-6 GeneTools User Manual
Using GeneTools for Gel analysis
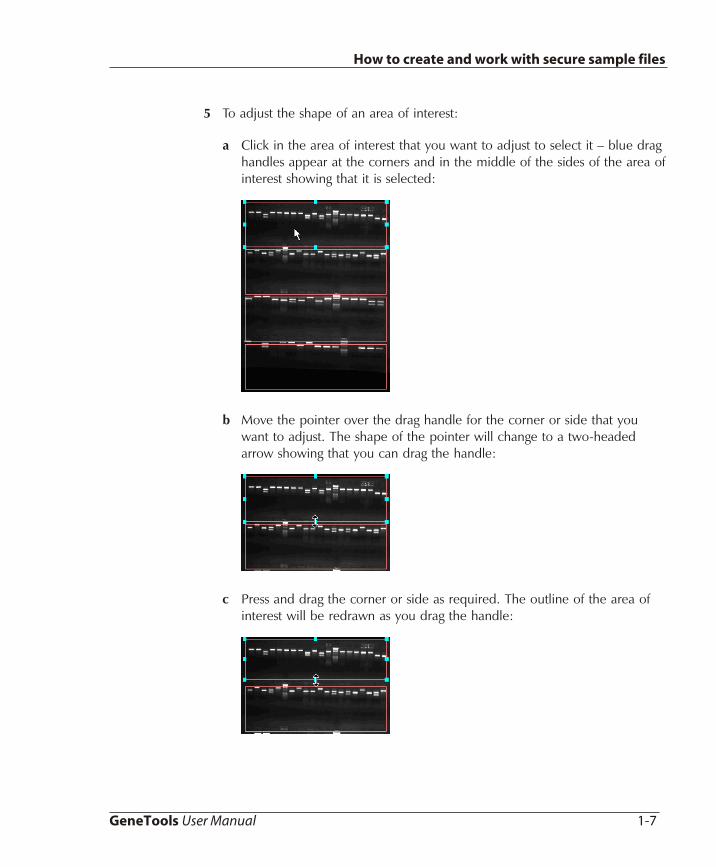
5 To adjust the shape of an area of interest:
a Click in the area of interest that you want to adjust to select it – blue draghandles appear at the corners and in the middle of the sides of the area of interest showing that it is selected:
b Move the pointer over the drag handle for the corner or side that youwant to adjust. The shape of the pointer will change to a two-headedarrow showing that you can drag the handle:
c Press and drag the corner or side as required. The outline of the area ofinterest will be redrawn as you drag the handle:
GeneTools User Manual 1-7
How to create and work with secure sample files
d When the corner or side is in the required position, release the mousebutton:
6 To move an area of interest:
a Move the pointer over the area of interest you want to move:
b Press and drag the area of interest. The area of interest will becomeselected, the pointer will change to a four-headed arrow and the outlineof the area of interest will be redrawn to show its new position as youdrag it:
c When the area of interest is in the required position, release the mousebutton:
1-8 GeneTools User Manual
Using GeneTools for Gel analysis
7 The next step is to choose between automatic and manual track detection.
Note Automatic track detection is the recommended way of working with GeneTools – youcan use Configuration in the Extras menu (see page 8-139) to set GeneTools to detectthe tracks automatically by default.
To choose automatic track detection for an area of interest (you can choosethe setting separately for each area of interest):
a Click in the area of interest to select it (this step is unnecessary if there isonly one area of interest).
b Press Locate tracks automatically.
Note Generally, this is all you have to do as in nearly all cases the GeneTools automatic tracklocation will be able to locate the tracks on the gel correctly and position track markersover them accurately without further assistance. However, very occasionally you mayhave a gel that causes problems, and the following step allows you to help out the track detection software by giving an indication of the number of tracks. You will only needto use this step if the fully automatic track detection has failed.
c If automatic track location has failed to identify the tracks correctly:
i Check Hint.
ii Enter the approximate number of tracks in the area of interest.
To choose manually how many tracks you want to place in each area ofinterest on the gel:
a Click in the area of interest to select it (this step is unnecessary if there isonly one area of interest.)
b Press the Create radio button to enable the tracks for manual positioningspin box.
c Enter the number of tracks you want to place in that area of interest. Thetracks will be placed at default positions and you will need to positionthem manually later.
GeneTools User Manual 1-9
How to create and work with secure sample files
Note The Leave the tracks unchanged radio button is only enabled when the Sampleproperties dialog box is displayed for an existing analyzed sample (see the entry forSample properties in the File (Gel) section in the Menus chapter (page 8-28)).
8 Click on the Analysis notes tab and enter any notes you want to save withthe secure sample file.
(The other two pages give information saved with the file in the acquisitionprogram – see the entry for Sample properties in the File (Gel) section in theMenus chapter (page 8-28) for details.)
9 Press OK to close the dialog box and display the sample in a Gel window.
If you have set automatic track location, the tracks will be shown on the image andlocked. If you have also set automatic peak location, the peaks will be marked on thetracks.
Note The recommended way of working with GeneTools is to use automatic peak location –use Configuration in the Extras menu (see page 8-139) to set GeneTools to locatepeaks automatically.
If you have not set automatic track location, and have specified a number of tracks, thetracks will be unlocked ready for you to position them accurately on the image – seeHow to place, position and work with tracks, page 1-22, for details.
Once you have opened an unanalyzed file, you should save it in order to save thetrack, peak and other settings – see Saving a secure sample file, page 1-20, for details.
1-10 GeneTools User Manual
Using GeneTools for Gel analysis
Creating a new secure sample file
To create a new secure sample file (for example, from a .tif or .bmp image file):
1 Choose New (Import) from the File menu to display a standard WindowsOpen dialog box:
2 Choose the type of image file from the Files of type drop-down list box.
3 Use the Look in drop-down list box to select the folder containing the imagefile.
4 Click on the file in the list box to select it – the name of the file will appear in the File name box.
5 Press Open to close the dialog box.
What happens next depends on whether you have selected Auto import methods inthe Configuration dialog box:
● If you have selected Auto import methods in the Configuration dialog box, theImport method dialog box will open so that you can choose which settings toimport – see Opening or creating a secure sample file with automatic import,page 1-16, for further details.
● If Auto import methods is not selected, the Sample properties dialog box will open so that you can set the type of image and make other settings – see the picture onpage 1-4 and the instructions following it.
GeneTools User Manual 1-11
How to create and work with secure sample files
Using the Browser
As an alternative to using the Open command to open an existing secure sample file(see Steps 1–3 in Opening a secure sample file page 1-2) or the New (Import)command to create a new secure sample file (for example, from a non-secure .tif or.bmp image file – see the previous section), you can use the GeneTools built-in Browser to preview and open image files.
To open an existing secure sample file or create a new secure sample file using theBrowser:
1 Choose Browse from the File menu to display the Browser:
Note The picture shows the Browser in a non-maximized window; it can also be maximizedto fill the document area covering any Image windows or minimized to an icon.
2 Use the left-hand pane in the Browser in exactly the same way as you use the left-hand pane in Windows Explorer to select the folder containing therequired image.
The right-hand pane in the Browser will show a preview of all the images inthe selected folder.
1-12 GeneTools User Manual
Using GeneTools for Gel analysis
3 Double-click on the image that you want to open.
What happens next depends on whether you are opening an analyzed or unanalyzedsecure sample or creating a new secure sample file.
If you are opening an analyzed secure sample file:
● The sample will be opened in a Gel window with all tracks and peaks displayed asthey were when the file was last saved. All previously analyzed results will be shownin the Results tables.
If you are opening an unanalyzed secure sample file or creating a new secure samplefile:
● If you have selected Auto import methods in the Configuration dialog box, theImport method dialog box will open so that you can choose which settings toimport – see Opening or creating a secure sample file with automatic import,page 1-16, for further details.
● If Auto import methods is deselected, the Sample properties dialog box will openso that you can set the type of image and make other settings – see the picture onpage 1-4 and the instructions following it.
Acquiring an image to create a secure sample file
GeneTools allows you to acquire an image from a Twain source, such as a scanner or adigital camera, and create a secure sample file from it.
To select a Twain source so that you can Acquire an image from it:
1 Choose Select Source (Twain) from the File menu to display the SelectSource dialog box:
2 Click on the required source to select it.
GeneTools User Manual 1-13
How to create and work with secure sample files
3 Press Select to confirm the selection and close the dialog box.
To acquire an image from the selected Twain source and create a secure sample file:
1 Choose Acquire (Twain) from the File menu.
A dialog box will be displayed for the selected source so that you can selectacquisition options and acquire the image.
2 Use the dialog box to acquire the image.
What happens next depends on whether you have selected Auto import methods inthe Configuration dialog box:
● If you have selected Auto import methods in the Configuration dialog box, theImport method dialog box will open so that you can choose which settings toimport – see Opening or creating a secure sample file with automatic import,page 1-16, for further details.
● If Auto import methods is not selected, the Sample properties dialog box will open so that you can set the type of image and make other settings – see the picture onpage 1-4 and the instructions following it.
Importing settings from existing secure Gel sample files
Automatically importing settings
To set the program to import settings automatically from an existing secure Gel samplefile:
1 Choose Configuration from the Extras menu to display the General page ofthe Configuration dialog box.
2 Check Auto import methods.
1-14 GeneTools User Manual
Using GeneTools for Gel analysis
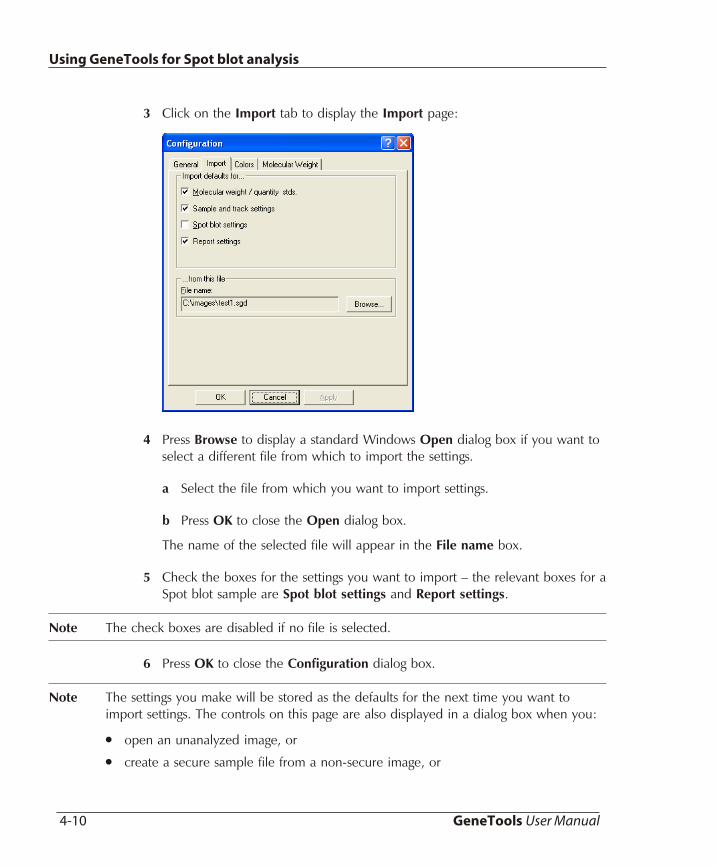
3 Click on the Import tab to display the Import page:
4 Press Browse to display a standard Windows Open dialog box if you want toselect a different file from which to import the settings.
a Select the file from which you want to import settings.
b Press OK to close the Open dialog box.
The name of the selected file will appear in the File name box.
5 Check the boxes for the settings you want to import.
Note The check boxes are disabled if no file is selected.
6 Press OK to close the Configuration dialog box.
GeneTools User Manual 1-15
How to create and work with secure sample files
Note The settings you make will be stored as the defaults for the next time you want toimport settings. The controls on this page are also displayed in a dialog box when you:
● open an unanalyzed image, or
● create a secure sample file from a non-secure image, or
● choose Import method from the File menu to import the settings from a saved fileto an existing secure sample file in a Gel window.
Changing the settings in any of these places changes the defaults.
Opening or creating a secure sample file with automatic import
If you have automatic import set when you:
● open an unanalyzed secure sample file – see Opening a secure sample file,page 1-2,
● create a new secure sample file – see Creating a new secure sample file, page 1-11,
● acquire an image from a Twain source – see Acquiring an image to create a securesample file, page 1-13,
the Import method dialog box will open:
1-16 GeneTools User Manual
Using GeneTools for Gel analysis
Note If you change your mind about using automatic import, press Cancel to close theImport method dialog box and display the Sample properties dialog box. Thencontinue as if you were opening or creating a secure sample file without automaticimport.
To continue opening or creating a secure sample file with automatic import:
1 Click on the Import tab to display the Import page:
2 Press Browse to display a standard Windows Open dialog box if you want toselect a different file from which to import the settings.
Note The check boxes are disabled if no file is selected.
3 Check or uncheck the boxes if you want to change the settings that areimported.
Note The settings you make will be stored as the defaults for the next time you want toimport settings. You can also set the defaults using the Import page of the Configuration dialog box, or by importing settings to an existing secure sample file bychoosing Import method from the File menu.
4 Press Import to close the Import method dialog box.
GeneTools User Manual 1-17
How to create and work with secure sample files
What happens next depends on whether you have chosen to import Sampleand track settings:
● If you haven’t imported Sample and track settings, the Sampleproperties dialog box will be displayed so that you can set the sampleproperties – see Opening a secure sample file, page 1-2.
● Otherwise (and after you have pressed OK in the Sample propertiesdialog box), a Gel window will open containing the new sample createdfrom the image.
Note If you have set automatic track location and have not imported Sample and tracksettings, the tracks will be locked; otherwise they will be unlocked ready for you toposition them accurately on the image.
You can now use all the program’s analysis procedures to work with the sample.
Note You can always change the automatically imported settings at a later time by choosingSample properties from the File menu to change individual settings (the Sampleproperties dialog box also allows you to add notes about the sample to be saved withit).
See the next section for how to use Import method from the File menu to importsettings from a different secure sample file – this also displays the Import method dialog box but without the page showing the image.
1-18 GeneTools User Manual
Using GeneTools for Gel analysis
Importing settings from a saved sample file
To apply sample and track settings, molecular weight/quantity standards and/or reportsettings from a saved secure sample file to the sample in the selected Gel window:
1 Choose Import method from the File menu to display the Import methoddialog box:
2 Press Browse to display a standard Windows Open dialog box if you want toselect a different file from which to import the settings.
Note The check boxes are disabled if no file is selected.
3 Check Molecular weight stds. to import the molecular weight/quantitystandard tracks and molecular weight/quantity assignments from a savedsample file.
For example, if tracks 1 and 5 in the saved file are molecular weightstandards, any previous molecular weight assignments will be removed fromthe selected sample and tracks 1 and 5 will become molecular weightstandards.
If peaks 3, 5 and 7 in track 1 of the saved file have assigned molecularweights/quantities, peaks 3, 5 and 7 in track 1 of the selected sample will beassigned the same molecular weights/quantities.
GeneTools User Manual 1-19
How to create and work with secure sample files
4 Check Sample and track settings to import the electrophoresis direction,image type, number of tracks and track positions from a saved sample file.
5 Check Report settings to import the report setup from a saved sample file.
Note This dialog box is also displayed if you create a new sample from a non-secure imagewith automatic import set (though it then has an additional page showing the image).You can also set the import methods in the Import page of the Configuration dialogbox. The program displays the same import methods in all these places and changingthe settings in any one of them changes the settings in all of them.
Editing sample properties
To view or edit the settings and notes for a sample:
1 Click in the window containing the sample to select it.
2 Choose Sample properties from the File menu to display the General pageof the Sample properties dialog box – see the entry for Sample properties in the Menus chapter (page 8-28) for details.
Saving a secure sample file
To save a secure sample with a new name:
1 Click in the Gel window containing the sample (or choose it from the list atthe bottom of the Window menu).
1-20 GeneTools User Manual
Using GeneTools for Gel analysis
2 Choose Save as from the File menu to display a standard Windows Save Asdialog box:
3 Use the dialog box to select a folder in which to save the sample.
4 Enter a File name for the sample.
5 Press Save to save the sample in the file.
To save a previously saved secure sample file using the same name:
1 Click in the Gel window containing the sample (or choose it from the list atthe bottom of the Window menu).
2 Choose Save from the File menu. If the secure sample file has not been saved previously, the Save As dialog box will be displayed so that you can enter aname: see above.
GeneTools User Manual 1-21
How to create and work with secure sample files
How to place, position and work with tracks
Overview
To enable the program to analyze the image, you must place and position a set ofrectangles (‘tracks’) over the image to define the positions of the electrophoresis tracks.
Locating the tracks on an image automatically
The default way of working with GeneTools is to allow it to locate the tracks on theimage automatically. This is the recommended way of working, unless you have specific requirements that are not handled appropriately by the automatic detection procedures. See Locating tracks automatically, page 1-24, for more details.
Placing tracks on an image manually
If required, you can place tracks on the image manually. There are several ways ofdoing this:
A You can place tracks on an image when you open an unanalyzed securesample file or when you create a new secure sample file (for example, from a non-secure .tif or .bmp image file) by specifying the number of tracks usingthe Sample properties dialog box, which is automatically displayed as part ofthe procedure. You can also display this dialog box for an existing sample and then change the number of tracks specified there, to replace all the tracks onthe sample with a new set of tracks – see the entry for Sample properties inthe Menus chapter (page 8-28) for details. In any of these cases, the imagewill eventually be displayed in a Gel window, with the tracks unlocked so that you can adjust the position of the tracks accurately.
B You can add new tracks to the image in an existing analyzed secure samplefile or delete or replace one or all of its tracks. See the following for moredetails:
● Placing individual tracks on the sample – page 1-26
● Deleting tracks – page 1-30.
1-22 GeneTools User Manual
Using GeneTools for Gel analysis
Adjusting the position of the tracks on an image
The following sections show you how to adjust the position of the existing tracks on animage in a sample:
● Adjusting the overall position of the tracks on a sample – page 1-30
● Adjusting the track splay – page 1-32
● Moving and tilting a single track – page 1-35
● Adjusting track width – page 1-40
● Adjusting the RF start and end positions – page 1-43.
Other ways to work with tracks
The following sections describe a number of other operations related to working withtracks:
● Locking tracks – page 1-25
● Enabling and disabling tracks – page 1-47
● Adding a description for a track – page 1-47
● Displaying track properties – page 1-49.
GeneTools User Manual 1-23
How to place, position and work with tracks
Locating tracks automatically
To set GeneTools so that it will locate the tracks on a gel image automatically:
1 Choose Configuration from the Extras menu to display the Configurationdialog box:
2 Check Auto locate tracks.
3 Press OK.
Now, when you open an unanalyzed secure sample file, or create a new secure samplefile (for example, from a non-secure .tif or .bmp image file), the tracks will be locatedautomatically, provided you leave the number of tracks set to 0 in the Sampleproperties dialog box.
You can also automatically locate the tracks on an existing gel image in a secure samplefile, by choosing Sample properties from the File menu to display the Sampleproperties dialog box and setting the number of tracks to 0. However, the followingprocedure is rather quicker.
1-24 GeneTools User Manual
Using GeneTools for Gel analysis
To locate the tracks on an existing gel image automatically:
1 Select the Gel window.
2 If there is more than one area of interest on the gel, click in the one in which you want to locate the tracks to select it (tracks in other areas of interest willnot be affected).
3 Lock the tracks if they are not already locked (see the next section).
4 Choose Locate tracks from the Track menu.
Locking tracks
The tracks shown on the sample in the Image pane in the Gel window can be eitherlocked or unlocked.
You need to lock the tracks before you can perform any of the functions that requirethe program to analyze the image along the tracks, such as locating the peaks, andassigning and calculating molecular weights and quantities.
To lock the tracks on a sample in the selected Gel window:
1 If there is more than one area of interest on the gel, click in the one in which you want to lock the tracks to select it (tracks in other areas of interest will not be locked).
2 Choose Lock all from the Track menu.
When the tracks are locked, Lock all is checked in the menu and the button is shownas depressed in the toolbar:
GeneTools User Manual 1-25
How to place, position and work with tracks
To unlock the tracks in the selected area of interest on a sample in the selected Gelwindow (tracks in other areas of interest will not be affected):
Choose any of the following track editing commands from the Track menu:
Position All
Splay All
Move/tilt
Width
Rf start position
Rf end position.
Placing individual tracks on a sample
You can place tracks on a sample using:
● a menu command
● by double-clicking
● by dragging out the track.
Each of these is described below.
1-26 GeneTools User Manual
Using GeneTools for Gel analysis
Inserting a track with a menu command
To place a track on a sample using a menu command:
1 Click in the Gel window containing the sample to select it.
2 If there is more than one area of interest, click in the one in which you wantto add the track.
3 Unlock the tracks if they are locked.
4 Click in the track to the right of the space into which you want to insert thenew track:
5 Choose Insert from the Track menu.
Provided there is enough space for the track (including inter-track space), the new trackwill be inserted. The new track will have the same size and shape as the selected track:
GeneTools User Manual 1-27
How to place, position and work with tracks
As in the example, you may need to adjust the position or the width of the track after it has been inserted – see Moving and tilting a single track, page 1-35, for details.
Inserting a track by double-clicking
To place a track on a sample by double-clicking:
1 Click in the Gel window containing the sample to select it.
2 If there is more than one area of interest, click in the one in which you wantto add the track.
3 Choose:
Move/tilt
Or
Width
from the Track menu.
4 Click on a track with the size and shape required for the new track (you canalways change these later).
5 Double-click at the point where you want the track to be.
The inserted track will be centered horizontally at the point you clicked, provided thiswould not cause the new track to overlap existing tracks. If there would be an overlap,the track is not inserted.
You may need to adjust the position or the width of the track after it has been inserted.
Inserting a track by dragging out the track
To place a track on a sample by dragging out the track:
1 Click in the Gel window containing the sample to select it.
1-28 GeneTools User Manual
Using GeneTools for Gel analysis
2 If there is more than one area of interest, click in the one in which you wantto add the track.
3 If Width individual is unchecked in the Track menu, choose it to setindividual width mode.
4 Move the pointer to the position where you want to place one of the cornersof the track (it doesn’t matter which corner):
5 Press and drag out to the opposite corner (a rectangle will be drawn on theimage as you are dragging to show the position of the track):
GeneTools User Manual 1-29
How to place, position and work with tracks
6 Release to place the track on the sample:
As in this example, you may need to adjust the tilt of the track after it has beeninserted.
Deleting tracks
To delete a track from a sample:
1 Click in the Gel window containing the sample to select it.
2 Click in the track in the Image pane to select it.
3 Unlock the tracks if they are locked.
4 Choose Delete from the Track menu or the menu displayed when youright-click in the Image pane, or press c.
Adjusting the overall position of the tracks on a sample
To adjust the overall positioning of all the tracks (in the selected area of interest) on asample together (see Adjusting the track splay (page 1-32) for adjusting both the overallposition and the amount of track splay):
1 Click in the Gel window containing the sample to select it.
2 If there is more than one area of interest, click in the one in which you wantto adjust the tracks.
1-30 GeneTools User Manual
Using GeneTools for Gel analysis
3 Choose Position all from the Track menu.
The tracks will be unlocked and drag boxes will appear at the outer corners of the two outside tracks:
4 Move the pointer over the drag box at the first corner that you want to move. The pointer will change to a four-way arrow:
5 Press and drag the corner box to its new position.
The outlines of the tracks’ new positions will be shown as you drag:
GeneTools User Manual 1-31
How to place, position and work with tracks
6 Drop the corner box in its new position:
7 Repeat Steps 4–6 for the diagonally opposite corner if required.
Adjusting the track splay
This topic describes how to adjust the amount by which the tracks (in the selected areaof interest) on a sample are splayed apart. You can also adjust the overall position of the tracks at the same time, but see Adjusting the overall position of the tracks on a sample(page 1-30) if you want to adjust the overall position of the tracks without changing theamount of track splay.
To adjust the amount by which the tracks in an area of interest on a sample are splayed apart:
1 Click in the Gel window containing the sample to select it.
2 If there is more than one area of interest, click in the one in which you wantto adjust the tracks.
3 Choose Splay all from the Track menu.
1-32 GeneTools User Manual
Using GeneTools for Gel analysis
The tracks will be unlocked and drag boxes will appear at the outer corners of the two outside tracks:
4 Move the pointer over the drag box at the first corner that you want to move. The pointer will change to a four-way arrow:
GeneTools User Manual 1-33
How to place, position and work with tracks
5 Press and drag the corner box to its new position.
The outlines of the tracks’ new positions will be shown as you drag:
Note When you start to drag the box, the Rf start line (or end line if you are dragging a boxat the end of the tracks) will snap to the drag boxes at the start (or end) of the tracksand any bends in the line will be removed. The start (or end if you are dragging a boxat the end of the tracks) of all the tracks will then snap to the new Rf line and movewith it as you drag it. If you want to adjust the position of the Rf lines, you should do so when you have finished adjusting the splay (and overall position) of the tracks (seeAdjusting the Rf start and end lines, page 1-43.
6 Drop the corner box in its new position:
7 Repeat Steps 4–6 for the other corners if required.
1-34 GeneTools User Manual
Using GeneTools for Gel analysis
Moving and tilting a single track
The first three steps in moving, tilting or bending a track are the same.
To move, tilt or bend a track, first:
1 If there is more than one area of interest in the image, click in the onecontaining the track you want to adjust.
2 Choose Move/tilt from the Track menu. The tracks will be unlocked.
3 Click in the track that you want to adjust to select it. The track will behighlighted and will have a drag box at each end.
You can now move, tilt or bend the track.
Moving a track
To move an individual track on a sample:
4 Perform Steps 1-3 as above.
5 Move the pointer to a point anywhere within the track (not on the dragboxes):
GeneTools User Manual 1-35
How to place, position and work with tracks
6 Press and drag the track to its new position:
7 Drop the track in its new position:
1-36 GeneTools User Manual
Using GeneTools for Gel analysis
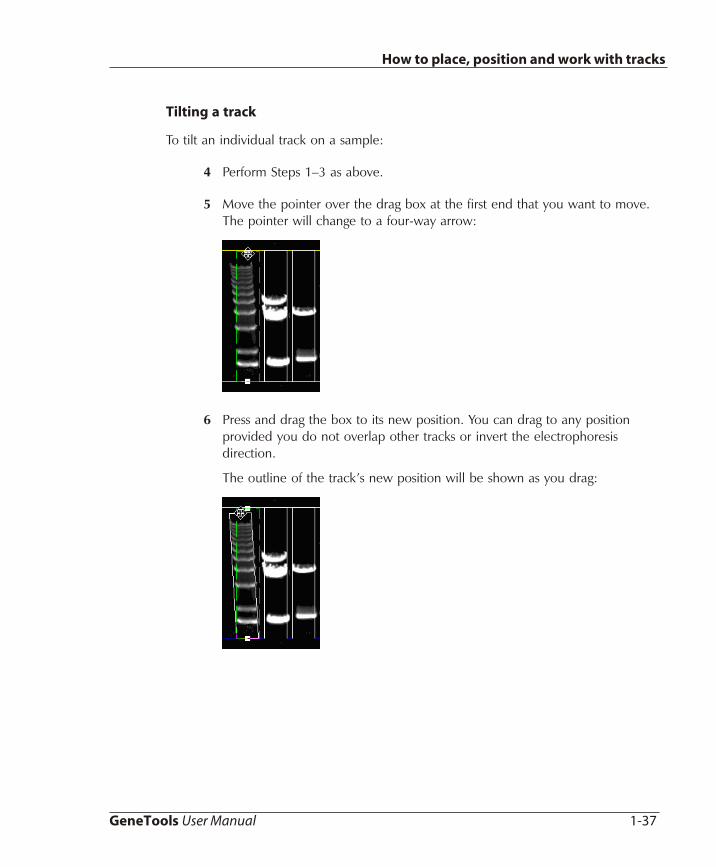
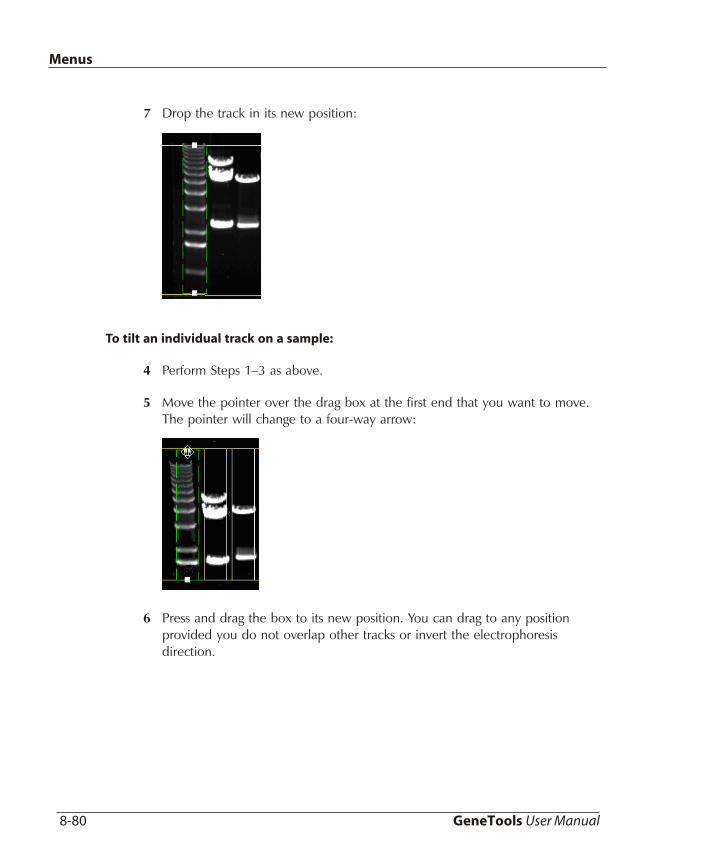
Tilting a track
To tilt an individual track on a sample:
4 Perform Steps 1–3 as above.
5 Move the pointer over the drag box at the first end that you want to move.The pointer will change to a four-way arrow:
6 Press and drag the box to its new position. You can drag to any positionprovided you do not overlap other tracks or invert the electrophoresisdirection.
The outline of the track’s new position will be shown as you drag:
GeneTools User Manual 1-37
How to place, position and work with tracks
7 Drop the track in its new position:
8 Repeat Steps 5–7 for the other end of the track if required.
Bending a track
To bend an individual track on a sample:
4 Perform Steps 1–3 as above.
5 Double-click at the point on the track where you want to bend it. A new drag box will appear at that point:
1-38 GeneTools User Manual
Using GeneTools for Gel analysis
When you place the pointer over the drag box, it turns into a four-way arrow:
6 Press and drag the drag box. You can drag to any position provided you donot overlap other tracks or invert the electrophoresis direction.
The outline of the track’s new shape will be shown as you drag:
GeneTools User Manual 1-39
How to place, position and work with tracks
7 Drop the drag box in its new position:
8 Repeat Steps 5–7 if you want to put any other bends in the track.
To remove a bend in an individual track on a sample:
4 Perform Steps 1–3 as above. Drag boxes will appear at the ends of the trackand at any bend points.
5 Double-click on the drag box at the apex of the bend that you want toremove.
Adjusting track width
You can adjust the width of an individual track or the width of all tracks (in the selected area of interest) at the same time.
To adjust the width of all tracks (in the selected area of interest) at the same time:
1 Click in the Gel window containing the sample to select it.
If there is more than one area of interest, click in the one in which you wantto adjust the tracks.
1-40 GeneTools User Manual
Using GeneTools for Gel analysis
2 If Width individual is checked in the Track menu, choose it to leaveindividual width mode.
Note When you adjust the widths of all tracks at the same time, all tracks (in the selectedarea of interest) are set to the width of the track that you are using to adjust the trackwidth.
To adjust the width of individual tracks:
1 Click in the Gel window containing the sample to select it.
If there is more than one area of interest, click in the one in which you wantto adjust the tracks.
2 If Width individual is unchecked in the Track menu, choose it to setindividual width mode.
The following instructions apply whether you are adjusting the width of a single track or of all tracks.
To adjust track width on a sample:
1 Click in the Gel window containing the sample to select it.
If there is more than one area of interest, click in the one in which you wantto adjust the tracks.
2 Choose Width from the Track menu. The tracks will be unlocked.
3 Click in the track that you want to adjust to select it (any track if you areadjusting them all). The track will be highlighted and will have a drag box oneach corner:
GeneTools User Manual 1-41
How to place, position and work with tracks
4 Move the pointer over one of the drag boxes (it doesn’t matter which):
5 Press and drag at right angles to the electrophoresis direction (for example,sideways if the electrophoresis direction is up or down). As you are dragging,the new outline of the track(s) will be shown:
6 Release to set the new track width:
1-42 GeneTools User Manual
Using GeneTools for Gel analysis
Adjusting the Rf start and end lines
When you compare profiles, the profiles (which may be taken from different securesample files) are plotted on an Rf scale from 0 to 1 taken between the Rf start and endlines.
You can adjust the position of the Rf lines in the electrophoresis direction, the angle ofthe lines across the electrophoresis direction, or add bends to the lines.
The first two steps in all these procedures are the same.
Notes The Rf start position and Rf end position commands are permanently disabled forHigh Throughput Gel samples.
Adjusting the overall position or splay of the tracks on the sample also adjusts theposition of the Rf lines, so you should make any adjustments to the track position andsplay before adjusting the Rf lines.
To adjust the Rf start or end position (in the selected area of interest) on a sample:
1 Click in the Gel window containing the sample to select it.
If there is more than one area of interest, click in the one in which you wantto adjust the Rf lines.
2 Choose Rf start position from the Track menu
or
Choose Rf end position from the Track menu.
GeneTools User Manual 1-43
How to place, position and work with tracks
The tracks will be unlocked and two drag boxes will appear on the appropriate Rf line(the examples show the Rf end line, but the procedures are identical for both):
You can now either just move the whole line along the electrophoresis direction, adjustthe angle of the line or add bends to the line.
To move an Rf line without changing its angle:
3 Follow Steps 1–2 above.
4 Move the pointer over the line, but not over either of the drag boxes. Thepointer will change to a two-way arrow.
5 Press and drag the line to its new position.
The line’s new position will be shown as you drag.
1-44 GeneTools User Manual
Using GeneTools for Gel analysis
6 Drop the line in its new position.
To adjust the angle of an Rf line:
3 Follow Steps 1-2 above.
4 Move the pointer over one of the drag boxes. The pointer will change to afour-way arrow:
5 Press and drag the box to change the angle of the line.
As you drag, the line’s new position will be shown on the sample (the linepivots about the other drag box):
GeneTools User Manual 1-45
How to place, position and work with tracks
6 Drop the line in its new position:
To add a bend to an Rf line:
3 Follow Steps 1–2 above.
4 Move the pointer to the point on the sample where you want the apex of the bend:
5 Double-click. The bend will be added to the line with a new drag box at itsapex:
6 If you want to adjust the position of the bend, place the pointer over the drag box. The pointer will change to a four-way arrow and you can drag the boxto a new position.
7 Repeat Steps 4–6 for any other bends you want to add.
1-46 GeneTools User Manual
Using GeneTools for Gel analysis
To remove a bend from an Rf line:
3 Follow Steps 1–2 above.
4 Double-click on the drag box at the apex of the bend.
Enabling and disabling tracks
You can choose to exclude the results for individual tracks from printed reports by‘disabling’ them.
To disable a track:
1 Lock the tracks if they are not already locked – all the tracks on the samplemust be locked, not just those in the area of interest containing the track youwant to disable.
2 Click on the track in the Image or Track label pane to select it.
3 Choose Disable from the Track menu or the pop-up menu displayed whenyou right-click in the Track label pane.
When a track is disabled, the label in the Track label pane, the profile in the Profilepane and values in the Peak value pane are grayed.
To enable a disabled track:
1 Lock the tracks if they are not already locked – all the tracks on the samplemust be locked, not just those in the area of interest containing the track youwant to enable.
2 Click on the track in the Image or Track label pane to select it.
3 Choose Enable from the Track menu or the pop-up menu displayed whenyou right-click in the Track label pane.
Adding a description for a track
To add a description for a track:
1 Lock the tracks if they are not already locked – all the tracks on the samplemust be locked, not just those in the area of interest containing the track forwhich you want to add a description.
GeneTools User Manual 1-47
How to place, position and work with tracks
2 Click on the track in the Image or Track label pane to select it.
3 Choose Description from the Track menu or the pop-up menu displayedwhen you right click in the Track label pane to display the Track descriptiondialog box:
4 Type the description in the edit box.
5 Press OK to confirm the description and close the dialog box.
The description will be shown in the track description pane in the Gel window –“Solution XF9” in the following example:
The description will also be shown with the results for individual tracks if they areincluded in Gel reports.
1-48 GeneTools User Manual
Using GeneTools for Gel analysis
Displaying track properties
To display information about a track in a Gel window or the Profile comparisonwindow:
1 Click on the track to select it either
in the Image or Track label pane of a Gel window,
or
in the left-hand pane of the Profile comparison window.
2 Choose Properties from the Track or Profile menu to display the Trackproperties dialog box:
● Tracks are numbered left to right (electrophoresis direction up or down),top to bottom (electrophoresis direction left) or bottom to top(electrophoresis direction right).
● The Intensity range boxes show the minimum and maximum signals along the length of the track. The signal is the sum of the (spatially filtered) pixelvalues (after baseline corrections) across the width of the track divided bythe width of the track.
● The Width box shows the width of the track in pixels.
● The Position boxes show the start and end of the track.
GeneTools User Manual 1-49
How to place, position and work with tracks
● The start is given as the number of pixels between the start of thetrack and the Rf start line (a positive position means that the Rf startline crosses the track).
● The end is given as the number of pixels between the start of thetrack and the end of the track.
● The Status box shows whether the track is enabled or disabled.
3 Click on the Peaks tab to display a table of information about the peaks inthe track:
1-50 GeneTools User Manual
Using GeneTools for Gel analysis
How to set the background correction for tracks
Setting the integration parameters
Note The same set of integration parameters is used for all areas of interest on the sample.
To set the parameters used for profile generation and automatic peak location:
1 Choose Integration parameters from the Edit menu to display theIntegration parameters dialog box:
2 Choose how to draw the baseline from which the signal is measured to givethe profile. The signal is the sum of the (spatially filtered) pixel values acrossthe width of the track.
You can use:
● None – no baseline correction● Track borders● Lowest slope
GeneTools User Manual 1-51
How to set the background correction for tracks
● Track borders & slope – a combination of the last two: the signal iscorrected for the track borders and then the lowest slope correction isused
● Rolling disk.
(See the Baseline correction subsections after these instructions (page 1-53) for details.)
3 If you have chosen to use Rolling disk background correction, enter or editthe radius of the disk to be used. Some experimentation may be required tofind the best size of disk to use for each image – press Apply to see the effect of the correction without closing the dialog box.
4 Choose whether to use a baseline offset or not. See Baseline correction afterthese instructions for details.
5 Specify the Minimum peak width in image pixels for a peak to be detected.
6 Specify the Minimum peak height in image pixels that a peak must have if itis to be detected.
7 Specify the Minimum peak volume as a percentage of the total quantity onthe track that a peak must have if it is to be detected.
8 Check All peaks same width to make the detected peaks all have the samewidth, and enter the required width in the associated edit box.
9 Specify the width of the Savitsky-Golay filter used in integrating the image –the greater the width the greater the smoothing effect of the filter. SeeSavitsky-Golay filter (page 1-56) for examples.
1-52 GeneTools User Manual
Using GeneTools for Gel analysis
10 Click on the Detection filter tab to display the Detection filter page so thatyou can choose a filter for filtering color images:
11 Choose the required filter from the drop-down list box.
12 Press Apply to see the effect of any changes without closing the dialog box;press OK to save the new settings and close the dialog box.
Baseline correction – track borders
For track borders baseline correction the signal is calculated relative to the signal at theborders.
Baseline correction – lowest slope
To understand how this method works, consider the following example, which goesthrough the process as if you had to do it by hand (naturally all this is done
GeneTools User Manual 1-53
How to set the background correction for tracks
automatically by the program – all you would see is the profile in the first picturechange into the profile in the last picture):
To find the first segment of the baseline, the program starts at one end of the profileand draws imaginary lines from the start point to all other points on the profile. Thefollowing example just shows three of these lines:
The program then chooses the line of lowest slope. This is the shortest line in thisexample as the other lines have larger (less negative) slopes (lines to all other points onthe profile have even larger slopes).
To find the second segment of the baseline, the program moves to the end of the firstsegment and again draws imaginary lines from there to the remaining points on theprofile. Again the following example only draws three of these lines:
The program again chooses the line of lowest slope (the shortest line again in thisexample) and repeats this process until it gets to the other end of the profile:
1-54 GeneTools User Manual
Using GeneTools for Gel analysis
The corrected signal is then measured as the height above this baseline:
Baseline correction – rolling disk
For this method the program first calculates the position of the line formed by thecenter of a disk with the set radius rolled along below the profile. The baseline is thenone radius length above this line, and the corrected signal is measured as the heightabove this baseline.
Baseline correction – offset
Choose whether to use a baseline offset or not. The baseline offset moves the baselineup to the lowest point in the profile.
For example:
with baseline offset becomes
GeneTools User Manual 1-55
How to set the background correction for tracks
Savitsky-Golay filter
The pictures below are examples of the effects of different degrees of spatial filtering.
No filter Filter width = 11 Filter width = 17
Setting or changing a manual baseline
To set a manual baseline for a track’s profile:
1 Click on the track in the Image pane to select it.
2 Choose Edit manual baseline from the Track menu or the context menudisplayed when you right-click in the Image or Profile pane.
The baseline will be displayed with circular drag handles at its ends and in the color selected (using Configuration in the Extras menu – see page 8-143) forthe manual baseline.
1-56 GeneTools User Manual
Using GeneTools for Gel analysis
3 If required, double-click on the baseline to add additional drag handles sothat you can bend the line (any peak markers and boundaries will beremoved from the profile):
4 To reshape the baseline:
a Position the pointer over the drag handle you want to move. The pointerwill change to a four-way arrow.
GeneTools User Manual 1-57
How to set the background correction for tracks
b Drag the handle to reshape the baseline.
c Drop the handle in its new position.
1-58 GeneTools User Manual
Using GeneTools for Gel analysis
Note You cannot drag a handle above the profile line. While you are dragging a handle, thenew baseline may be drawn above the profile, but when you release the mouse buttonit will be reshaped so that it always lies below it.
For example, when you release the mouse button,
Deleting a manual baseline
To delete a manual baseline for a track:
1 Click on the track in the Image pane to select it.
2 Right-click in the Image pane (or Profile pane) to display a context menu.
3 Choose Delete manual baseline.
How to locate and edit peaks on a track
In order to calculate the molecular weights or quantities for a track, the program mustbe able to identify the peaks and peak bounds in the profile. You can do this:
● automatically – this is the default and is the recommended way of working unlessyou have some specific need to use one of the other methods,
● semi-automatically, or
● manually.
GeneTools User Manual 1-59
How to locate and edit peaks on a track
will become
Each of these is described separately in the first three subsections.
After peaks have been located/added you can edit them at any time. See the followingfor details:
● Selecting peaks – page 1-64
● Deleting peaks – page 1-67
● Adjusting the position of a peak – page 1-68
● Adjusting the position of a peak’s bounds – page 1-70.
See also:
● Displaying peak properties – page 1-71.
Locating the peaks on a track automatically
The program uses a number of criteria, such as the minimum height and width, todecide whether the local maxima on a profile should be counted as a peak. You canchange these criteria, together with the method used for background correction, bychoosing Integration parameters from the Edit menu – see Setting the integrationparameters, page 1-51.
You can set the program to detect peaks automatically whenever the track positions arechanged or the background correction method is changed.
To set automatic peak detection On or Off:
1 Choose Configuration from the Extras menu to display the General page ofthe Configuration dialog box.
2 Check Auto locate peaks to turn automatic peak detection on; uncheck it toturn it off – see the entry for Configuration from the Extras menu in theMenus chapter (page 8-139) for details.
Automatic peak detection is the program’s default and the recommended way ofworking.
1-60 GeneTools User Manual
Using GeneTools for Gel analysis
Locating peaks automatically when automatic peak detection is turned off
Even if you have set automatic peak detection off, you can still use automatic peakdetection to locate the peaks either on a selected track or on all tracks.
Note You can only locate peaks when the tracks are locked.
To locate the peaks on an individual track:
1 Click on the track in the Image pane to select it.
2 Choose On selected track from the Peak®Locate submenu.
To locate the peaks on all tracks (in the selected area of interest) automatically:
Choose On all tracks from the Peak®Locate submenu.
Adding a peak semi-automatically
Note You can only add peaks when the tracks are locked.
You can add a peak semi-automatically by specifying its position in the Profile pane orthe Image pane.
To add a peak by specifying its position in the Profile pane:
1 Select the track by clicking on it in the Gel window’s Image pane.
2 In the Profile pane, move the pointer over the position where you want toadd the peak (it may help to magnify the display first):
GeneTools User Manual 1-61
How to locate and edit peaks on a track
3 Double-click:
A peak will be added with bounds set to the neighboring local minima.
4 If necessary, adjust the position of the peak and its bounds – see Adjusting the position of a peak, page 1-68, and Adjusting the position of a peak’s bounds,page 1-70.
To add a peak by specifying its position in the Image pane:
1 Double-click in the Gel window’s Image pane at the position you want toinsert the peak. A peak will be added with bounds set to the neighboringlocal minima.
2 If necessary, adjust the position of the peak and its bounds – see Adjusting the position of a peak (page 1-68) and Adjusting the position of a peak’s bounds,page 1-70.
Notes You cannot add a peak within the bounds of another peak. Double-clicking inside anexisting peak has the effect of deleting the existing peak and placing a new peak at theposition clicked, with the bounds again set to the neighboring local minima.
If the track has been defined as a molecular weight standard and has already hadmolecular weights assigned to the peaks, any assignments to peaks with higher peaknumbers will be reassigned. This will probably affect the molecular weight calculationsfor other tracks. Molecular weight assignments are to the peak number, so when youadd a peak, the peak numbers of all later peaks will be increased by one, so, in effect,all assignments beyond the added peak will be moved back to the previous peak (seeReassigning molecular weights in a standard track, page 1-85, if you want to move theassignments back to the original peaks).
1-62 GeneTools User Manual
Using GeneTools for Gel analysis
Adding a peak manually
Note You can only add peaks when the tracks are locked.
To add a peak manually by specifying the position of its bounds:
1 In the Image pane, click on the track to select it.
2 In the Profile pane, move the pointer over the position where you want toplace the first peak bound (it may help to magnify the display first):
3 Drag to the position you want to place the other peak bound:
GeneTools User Manual 1-63
How to locate and edit peaks on a track
4 Drop the bound in position:
The peak bounds will be added with the peak shown in the position detected by the program.
5 If necessary, adjust the position of the peak and its bounds.
Notes You cannot add a peak within the bounds of another peak. Double-clicking inside anexisting peak has the effect of deleting the existing peak and placing a new peak at theposition clicked, with the bounds again set to the neighboring local minima.
If the track has been defined as a molecular weight standard and has already hadmolecular weights assigned to the peaks, any assignments to peaks with higher peaknumbers will be reassigned. This will probably affect the molecular weight calculationsfor other tracks. Molecular weight assignments are to the peak number, so when youadd a peak, the peak numbers of all later peaks will be increased by one, so, in effect,all assignments beyond the added peak will be moved back to the previous peak (seeReassigning molecular weights/quantities in a standard track, page 1-85, if you want tomove the assignments back to the original peaks).
Selecting peaks
You can select peaks using:
● The Image pane in the Gel window (this allows you to a select a single peak only)
or
● The Profile pane in the Gel window (this allows you to a select a single peak orseveral neighboring peaks).
1-64 GeneTools User Manual
Using GeneTools for Gel analysis
Note You can only select peaks when the tracks are locked.
To select a peak in the Image pane:
1 If peak markers are not already displayed on the tracks, choose Peak markersfrom the View menu – the command is checked in the menu when peakmarkers are displayed.
2 Click near the peak in the track (if the peaks are close together, it may help to magnify the display before trying to select the peak):
The peak and bounds will appear in the Profile pane in the colors chosen (usingConfiguration in the Extras menu – see page 8-143) for selected bounds and peaks:
Note If you right-click, you will select the peak and display a pop-up menu for carrying outoperations on the peak with one action.
The peak whose boundary is closest to the point you clicked will be selected – notethat since the peak markers on the track show the positions of the peaks and not the
GeneTools User Manual 1-65
How to locate and edit peaks on a track
boundaries this does not necessarily mean the peak whose marker is closest to the point you clicked.
Note Selecting the peak also selects the track if it was not already selected.
To select a peak in the Profile pane:
1 In the Gel window’s Image pane, click in the track containing the peak toselect it.
2 In the Profile pane, click on the peak itself, or anywhere within the peakbounds (if the peaks are close together, it may help to magnify the displaybefore trying to select the peak):
or
Note You can right-click on a peak to select it and display a pop-up menu for carrying outoperations on the peak with one action.
When the peak is selected the peak bounds and peak marker will appear in the colorschosen for selected bounds and peaks.
Note If you click outside the bounds of any peak, no peak will be selected and anypreviously selected peak will be deselected.
To select several neighboring peaks:
1 In the Image pane, click in the track containing the peak to select it.
1-66 GeneTools User Manual
Using GeneTools for Gel analysis
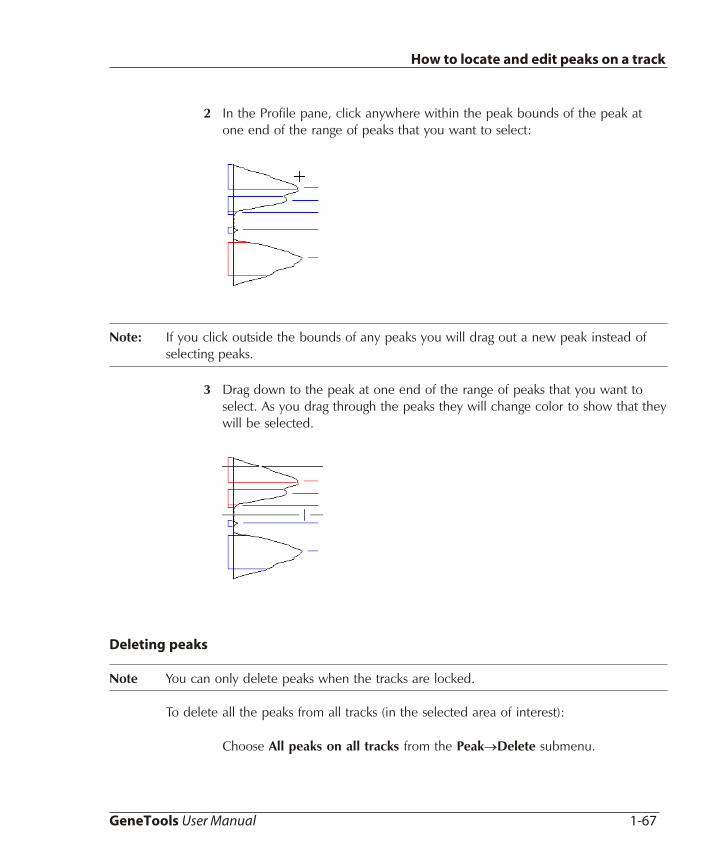
2 In the Profile pane, click anywhere within the peak bounds of the peak atone end of the range of peaks that you want to select:
Note: If you click outside the bounds of any peaks you will drag out a new peak instead ofselecting peaks.
3 Drag down to the peak at one end of the range of peaks that you want toselect. As you drag through the peaks they will change color to show that they will be selected.
Deleting peaks
Note You can only delete peaks when the tracks are locked.
To delete all the peaks from all tracks (in the selected area of interest):
Choose All peaks on all tracks from the Peak®Delete submenu.
GeneTools User Manual 1-67
How to locate and edit peaks on a track
To delete all the peaks from a track:
1 Click in the track from which you want to delete the peaks to select it.
2 Choose All peaks on selected track from the Peak®Delete submenu.
To delete one or more selected peaks from a track:
1 Select the peak(s) that you want to delete.
2 Choose Selected peak(s) from the Peak®Delete submenu.
or, if you used right-click to select the peak, choose Delete from the pop-upmenu.
Note If the track has been defined as a molecular weight standard and has already hadmolecular weights assigned to the peaks, any assignments to peaks with higher peaknumbers will be reassigned and will have an effect on molecular weight calculations forother tracks. Molecular weight assignments are to the peak number, so when you delete a peak, the peak numbers of all later peaks will be reduced by one, so, in effect, allassignments beyond the deleted peak will be moved on to the next peak (seeReassigning molecular weights/quantities in a standard track, page 1-85, if you want tomove the assignments back to the original peaks).
Adjusting the position of a peak
Note You can only move peaks when the tracks are locked.
To adjust the position of a peak:
1 If necessary, adjust the peak bounds – see page 1-70 (you can only adjust thepeak position within the peak bounds).
1-68 GeneTools User Manual
Using GeneTools for Gel analysis
2 In the Profile pane, move the pointer over the peak (it may help to magnifythe display first) – the pointer will change to a double-headed arrow:
3 Drag the peak to the new position:
4 Drop the peak in the new position:
GeneTools User Manual 1-69
How to locate and edit peaks on a track
Note If you have two adjacent peaks with abutting bounds, and move both peaks to thecommon bound, the peaks will be merged into a single peak with the outer boundsfrom the merged peaks. If the track is a molecular weight standard track, this may havean effect on molecular weight assignments – see the notes in Deleting peaks (page 1-67) for more details.
Adjusting the position of a peak’s bounds
Note You can only move peak bounds when the tracks are locked.
To adjust a peak’s bounds:
1 In the Profile pane, move the pointer over the bound you want to move (itmay help to magnify the display first) – the pointer will change to adouble-headed arrow:
2 Drag the bound to its new position:
1-70 GeneTools User Manual
Using GeneTools for Gel analysis
3 Drop the bound in its new position:
Displaying peak properties
To display properties of the selected peak:
1 Choose Properties from the Peak menu to display the Peak properties dialog box:
This dialog box is read-only.
● Peaks are numbered in the electrophoresis direction.
GeneTools User Manual 1-71
How to locate and edit peaks on a track
● The Rf position of the peak is given by:
.
2 Press OK to close the dialog box.
How to determine molecular weights and quantities
There are three main steps in determining the molecular weights and/or quantitiesrepresented by the peaks on a gel:
A Set the molecular weight and/or quantity calibration methods. For details, see:
● Setting the quantity calibration method, next section
● Specifying how molecular weights are calculated from standard tracks,page 1-75.
B Calibrate the sample by assigning molecular weight and/or quantity values toknown peaks on the gel.
For quantities, you do this:
● by assigning quantities to individual peaks on tracks – see Creating quantity calibrations without using standard tracks, page 1-76
and/or
● by defining quantity standard tracks – see Determining molecularweights/quantities using standard tracks, page 1-79.
For molecular weights, you do this:
● by defining molecular weight standard tracks – see Determining molecularweights/quantities using standard tracks, page 1-79.
C Display the results. For details, see:
● Viewing molecular weight and quantity results, page 1-87.
1-72 GeneTools User Manual
Using GeneTools for Gel analysis
Distance along the track from Rf start lineDistance along the track between the Rf start and End lines
Setting the quantity calibration method
To set or view the calibration method and units for quantity determinations:
1 If more than one area of interest has been defined on the sample, click in the area for which you want to set the quantity calibration method – you can setindependent quantity calibration methods for each area of interest.
2 Choose Quantity calibration from the Edit menu to display the Quantitycalibration dialog box:
(You can also display this dialog box by pressing Edit quantity calibration inthe Assign molecular weight/quantity dialog box – see Assigning molecularweights/quantities to a standard track, page 1-79.)
● If there is only one area of interest defined on the sample, or you want toset the calibration for the selected area of interest independently, go toStep 3.
● If more than one area of interest has been defined on the sample and you want to use the calibration defined in one of the other areas for theselected area of interest, go to Step 6.
3 Click on a radio button to decide whether:
● the same calibration curve should be used for All tracks
● Each track should have its own calibration curve.
GeneTools User Manual 1-73
How to determine molecular weights and quantities
4 Choose the shape of calibration curve(s) from the drop-down list box. You can choose:
● Linear through origin (single standard value)
● Linear (multiple standard values)
● Linear through origin (multiple standard values)
● Quadratic
● Quadratic through origin.
Note If you select Linear through origin (single standard value) the calibration curve isdrawn through the origin and the last calibration point you have added – in otherwords, since this is a single point calibration, adding a new calibration point replacesthe previous one. For the other types of curve, the calibration curve is drawn as the best fit for all the (relevant) calibration points – adding a new calibration point contributes to (and does not replace) the calibration from any previous points.
Once you have assigned quantities to peaks, the calibration curve will beshown in the Quantity calibration tab in the Gel window’s Graphics pane –see The quantity calibration graph, page 1-89, for more details.
5 Enter your own quantity units in the Units box.
Go to Step 7.
6 If more than one area of interest has been defined on the sample and youwant to use the calibration defined in one of the other areas for the selectedarea of interest:
a Check Use another track set as standard.
b Choose the area of interest whose calibration you want to use from theTrack set drop-down list box.
7 Press OK to confirm your selections and close the dialog box.
See Creating quantity calibrations without using standard tracks, page 1-76, and Determining molecular weights/quantities using standard tracks, page 1-79, for how tocalibrate a gel for quantity measurements.
1-74 GeneTools User Manual
Using GeneTools for Gel analysis
Specifying how molecular weights are calculated from standard tracks
Note You cannot apply a molecular weight calibration outside its area of interest, or combinemolecular weight calibrations from different areas of interest. If you have defined morethan one area of interest on the sample, you will need to use separate molecular weight standard tracks and create a separate molecular weight calibration for each area. Youwill also need to specify how molecular weights are calculated in each area of interest.
To specify how molecular weights are calculated from standard tracks (in the selectedarea of interest):
1 Choose Molecular weight calibration from the Edit menu to display theMolecular weight calibration dialog box:
(You can also display this dialog box by pressing Edit calibration in the Assign molecular weight/quantity dialog box – see Assigning molecular weights/quantities to a standard track, page 1-79.)
2 Click on a radio button to choose the shape of calibration curve to use forcalculating molecular weights.
● Log-linear fit means the best logarithmic curve fit for all points – the curve may not pass through all the calibration points.
● Log piecewise linear means a logarithmic curve is drawn betweenadjacent points – the curve will pass through all the calibration points butmay not be smooth at those points.
GeneTools User Manual 1-75
How to determine molecular weights and quantities
Once you have assigned molecular weights to peaks, the calibration curve will be shown in the MW Calibration tab in the Gel window’s Graphics pane –see The molecular weight calibration graph, page 1-88, for more details.
3 Click on a radio button to choose whether distance along the track should bemeasured From start of track or From Rf baseline.
4 Choose how to calculate molecular weights on a track if there is more thanone standard track.
In the Propagation box you can choose:
● Use nearest standard, to use the standard track nearest to the track
● Combine all standards, to calculate a molecular weight from all thestandards and then take the average
● Interpolate between standards, to interpolate the calibrations from thetwo adjacent tracks.
5 Press OK to save the new settings and close the dialog box.
See Determining molecular weights/quantities using standard tracks, page 1-79, for howto calibrate a gel for molecular weight measurements.
Creating quantity calibrations without using standard tracks
In order to determine quantities from the tracks on a sample, you must first calibratethe sample by assigning quantities to peaks in the sample to create one or morecalibration curves.
This section describes how to calibrate the quantities on a gel without defining standard tracks; see Determining molecular weights/quantities using standard tracks, page 1-79,for how to create a molecular weight/quantity calibration by defining one or morestandard tracks.
The quantity calibration method determines how the quantities for other peaks arecalculated from the quantities you assign to known peaks – see Setting the quantitycalibration method, page 1-73, for details.
1-76 GeneTools User Manual
Using GeneTools for Gel analysis
Assigning quantities to peaks
Note You can only assign quantities to peaks when the tracks are locked – see Locking tracks,page 1-25).
To assign a quantity to a peak in a track:
1 Select the peak to which you want to assign a quantity.
Note For Linear through origin (single standard value), the calibration uses a single peakassignment (the most recent). For the other types of curve, the calibration curve isdrawn as the best fit for all the (relevant) calibration points – adding a new calibrationpoint contributes to (and does not replace) the calibration from any previous points –see Setting the quantity calibration method, page 1-73, for how to choose the type ofcalibration curve.
2 Choose Assign quantity from the Peak menu (or the pop-up menu displayedwhen you right-click on the peak) to display the Assign calibrated quantitiesdialog box:
Note You can also display this dialog box by pressing Assign quantity to peak in the Manualpage of the Assign molecular weight/quantity dialog box – see Assigning quantities toindividual peaks on a standard track, page 1-83.
● The Peak box is read-only: it shows which peak was selected when youopened the dialog box.
● The Raw volume box is read-only: it shows the uncalibrated volumecalculated from the area of the peak.
GeneTools User Manual 1-77
How to determine molecular weights and quantities
● The Calibrated quantity box shows the quantity calculated using theexisting calibration, if there is one, and 0 if there isn’t.
● The radio buttons are disabled if you have chosen to use a singlecalibration curve for all tracks – see Setting the quantity calibrationmethod, page 1-73.
3 Enter a quantity in the Calibrated quantity box to add a new calibrationpoint to the calibration curve for the selected peak.
4 If you have chosen to use a single calibration curve for all tracks, click on:
● No propagation if you do not want this quantity assignment applied toany other tracks.
● Click on Propagate by peak number to apply this quantity assignment tothe same peak number on all other tracks.
● Click on Propagate by Rf to apply this quantity assignment to peaks withthe same Rf (within the given Tolerance) on all other tracks.
And:
Enter a figure in the Tolerance box to specify how close the Rf of a peakon another track has to be to the Rf of the selected peak for it to beassigned the quantity calibration.
When you have assigned quantities to peaks, the peak markers on the track in theImage pane will have a mark on them to show that they have been assigned a quantity(and/or molecular weight):
1-78 GeneTools User Manual
Using GeneTools for Gel analysis
Determining molecular weights/quantities using standard tracks
You can use molecular weight/quantity standard tracks to calibrate gels to determine the molecular weights and quantities represented by the peaks on other tracks on the gel.Having defined one or more tracks as a molecular weight and/or quantity standard, you then assign molecular weights and/or quantities to peaks in these tracks to createmolecular weight and/or quantity calibration curves.
Note This is the only way to calibrate the molecular weight measurements, but for quantitiesyou can also calibrate the measurements on the gel by assigning known quantities toindividual peaks without defining any quantity standard tracks – see Creating quantitycalibrations without using standard tracks, page 1-76.
Assigning molecular weights/quantities to a standard track
Note If you have defined more than one area of interest on the gel, you will need to useseparate molecular weight standard tracks and create a separate molecular weightcalibration for each area. You cannot apply a molecular weight calibration outside itsarea of interest, or combine molecular weight calibrations from different areas ofinterest. For quantities, however, you can set an independent calibration for each areaof interest or choose to use the quantity calibration from a different area of interest –see Setting the quantity calibration method, page 1-73.
To assign molecular weights and/or quantities to the peaks in a standard track:
1 If you want to assign molecular weights and/or quantities from a molecularweight standard in a molecular weight library, and the library is not currentlyopen, choose Open library from the File menu to open it.
2 Click in the required track to select it.
3 Locate the peaks on the track if they haven’t already been located.
4 If necessary, edit the peaks.
(In particular, if you want to assign a set of molecular weights and/orquantities from a standard, you should remove any spurious peaks to avoidany values being assigned to them from the standard.)
5 Choose MW/quantity standard from the Track menu (or the pop-up menudisplayed by right-clicking in the track label) to define the track as a molecular weight standard.
GeneTools User Manual 1-79
How to determine molecular weights and quantities
The command is checked in the menus and the track is labeled MwS whenthe track has been defined as a molecular weight standard (this will change to QuS if you assign quantities but not molecular weights from a standard orMQS if you assign molecular weights and quantities).
The Assign molecular weight/quantity dialog box will be displayed open atthe From standard page:
Note This section is concerned with using the Assign molecular weight/quantity dialog boxto assign molecular weights and/or quantities to peaks on standard tracks. However, italso allows you to change the way molecular weights and/or quantities are calculatedfrom molecular weight/quantity standard tracks (see Specifying how molecular weightsare calculated from standard tracks, page 1-75, and Setting the quantity calibrationmethod, page 1-73, for details). The Edit standard page also allows you to create oredit a molecular weight standard in a library (see Creating a new molecular weight/quantity standard, page 1-100, and Editing a molecular weight/quantity standard in alibrary, page 1-102).
The Selected peak box is read-only and shows the number of the selected peak (youcan select another peak using the arrow buttons). The Calculated MW box is alsoread-only and will show the molecular weight of the selected peak calculated using anyother molecular weights you have entered and the peak position – it will show 0 if youhave not entered enough data to calculate a molecular weight.
1-80 GeneTools User Manual
Using GeneTools for Gel analysis
Arrow buttons to selectthe track peak
Standards drop-down list
Details of selected standard
The list box shows the contents of the standard selected in the Standards drop-down list box above it. Standards may contain molecular weight assignments, quantityassignments or molecular weight and quantity assignments for each peak (there are noquantity assignments in the standard selected in the example picture).
This dialog box allows you to assign molecular weights and/or quantities from astandard, or, using the Manual page, assign molecular weights and/or quantities toindividual peaks manually (see the following sections for instructions).
Note Molecular weight calculations are more accurate for peaks lying within the range of thecalibration standard, where they are calculated by interpolation, rather than outside,where they are calculated by extrapolation.
When you have assigned molecular weights/quantities to peaks, the peak markers onthe track in the Image pane will have a mark on them to show that they have beenassigned a molecular weight and/or quantity:
Assigning molecular weights/quantities from a molecular weight standard
To assign molecular weights and/or quantities from a molecular weight standard library(see Working with molecular weight libraries, page 1-92, for more information aboutcreating and editing molecular weight libraries):
1 If the Selected peak box does not show the peak corresponding to the firstmolecular weight/quantity in the standard, use the arrow buttons to select that peak.
2 Choose the required standard from the Standards drop-down list.
The list box below the Standards drop-down list will show the peak numberand the molecular weights and/or quantities for the standard.
GeneTools User Manual 1-81
How to determine molecular weights and quantities
3 Press Assign from standard.
Assigning molecular weights to individual peaks on a standard track
To assign molecular weights to individual peaks manually:
1 Click on the Manual tab to display the Manual page:
2 If the Selected peak box does not show the peak to which you want to assign a molecular weight, use the arrow buttons to select it.
3 Enter the molecular weight that you want to assign in the Assigned MW box.
4 Press Assign value to peak.
The Selected peak box will show the next peak, ready for you to assign thenext molecular weight.
5 Repeat Steps 2–4 for any other molecular weights that you want to assign.
1-82 GeneTools User Manual
Using GeneTools for Gel analysis
Assigning quantities to individual peaks on a standard track
To assign quantities to individual peaks on a standard track manually:
1 Click on the Manual tab to display the Manual page:
2 If the Selected peak box does not show the peak to which you want to assign a quantity, use the arrow buttons to select it.
3 Press Assign quantity to peak to display the Assign calibrated quantitiesdialog box so that you can assign a quantity to the selected peak. This dialogbox is also displayed when you assign a quantity to a peak on a non-standardtrack – see Assigning quantities to peaks, page 1-77, for how to use the dialog box.
4 Repeat Steps 2 and 3 for any other peaks.
GeneTools User Manual 1-83
How to determine molecular weights and quantities
Removing molecular weight and quantity assignments from peaks
Note You can only remove molecular weight and quantity assignments when the tracks arelocked.
To remove a single molecular weight assignment from a peak in a standard track:
1 Select the peak for which you want to unassign a molecular weight.
2 Choose Unassign molecular weight from the Peak menu (or, if youright-click to select the peak, choose the same command from the pop-upmenu).
Or
1 Choose Molecular weight from the View menu or click on the MWCalibration tab in the Graphics pane to display molecular weights in the Peak value pane.
2 Right-click on the molecular weight assignment in the Peak value pane toselect it and pop up a menu.
3 Choose Delete from the pop-up menu.
To remove a single quantity assignment from a peak in any track:
1 Select the peak for which you want to remove the quantity assignment.
2 Choose Unassign quantity from the Peak menu (or, if you right-click to select the peak, choose the same command from the pop-up menu).
To remove all molecular weight and quantity assignments from the peaks in a standardtrack:
1 Click in the required track to select it.
2 Choose MW/quantity standard from the Track menu (or the pop-up menudisplayed by right-clicking in the track label) so that the track is no longerdefined as a molecular weight/quantity standard.
3 If required, choose MW/quantity standard again to redefine the track as amolecular weight/quantity standard with different assignments.
1-84 GeneTools User Manual
Using GeneTools for Gel analysis
Note When you assign all the molecular weights from a standard in a molecular weightlibrary, any previous assignments are removed: see Assigning molecularweights/quantities to a standard track (page 1-79) for details.
Reassigning molecular weights/quantities in a standard track
In order to determine molecular weights and quantities on gels, you can define one ormore tracks as molecular weight/quantity standards and assign molecularweights/quantities to peaks in each of those tracks: see Determining molecularweights/quantities using standard tracks (page 1-79) for details.
GeneTools allows you to reassign the assigned molecular weights or quantities to otherpeaks in the track at a later time. This may be necessary, for example, if you add ordelete peaks in the standard track, or if you forget to delete a spurious peak beforeassigning all of the molecular weights/quantities in a molecular weight library standard.
Note For quantities, you can only reassign values assigned from standards – you cannotreassign quantities assigned manually to peaks on standard tracks or to peaks onnon-standard tracks. For these cases you would need to unassign the quantity assignedto the existing peak and then assign it to the new peak.
To reassign molecular weights/quantities in a molecular weight standard track:
1 In the Image pane, click in the required track to select it.
Note You can only reassign molecular weights/quantities when the tracks are locked.
2 In the Gel window’s Graphics pane, click the MW calibration tab to reassignmolecular weights; click the Quantity calibration tab to reassign quantities.
GeneTools User Manual 1-85
How to determine molecular weights and quantities
3 In the Peak value pane, click on the molecular weight/quantity that you wantto reassign to select it:
4 Drag the molecular weight/quantity to its new position.
As you are dragging, you will see two new lines in the pane, the first underthe pointer, the second snapping to the peak that the molecularweight/quantity would be reassigned to if you dropped it:
1-86 GeneTools User Manual
Using GeneTools for Gel analysis
5 Drop the molecular weight/quantity in its new position.
Note 1 As in the example above, the assignments of later peaks will change in line with thereassignment of the selected peak.
Note 2 If the reassignment makes any of the other assignments inconsistent (molecular weightsmust decrease as peak number increases), the other assignments will be removed.
Viewing molecular weight and quantity results
When you have calibrated (an area of interest on) a gel for molecular weights/quantities, (see Determining molecular weights/quantities using standard tracks, page 1-79, andCreating quantity calibrations without using standard tracks, page 1-76) you can view:
● the molecular weight calibration curve in the MW calibration page in the Gelwindow’s Graphics pane – see the next section, The molecular weight calibrationgraph
● the quantity calibration curve in the Quantity calibration page in the Gel window’sGraphics pane – see The quantity calibration graph, page 1-89
● the molecular weights/quantities for the selected track in the Peak value pane whenMolecular weight/Quantities is selected in the View menu – see Viewing molecularweight or quantity results in the Peak value pane, page 1-90
● the molecular weights and quantities in the Results pane – see Viewing molecularweight and/or quantity results in the Results pane, page 1-91
GeneTools User Manual 1-87
How to determine molecular weights and quantities
The molecular weight calibration graph
The molecular weight calibration graph for the selected area of interest on the sample is displayed in the Gel window’s Graphics pane:
You can choose the shape of the calibration curve, how the calibration should bepropagated to other tracks and the origin for distance measurements along the track –see Setting the quantity calibration method, page 1-73, for details.
When a molecular weight standard track is selected in the Image pane, the calibrationpoints are shown on the graph (as in the example).
When you display the molecular weight calibration graph, the Peak value pane displaysmolecular weights for the peaks on the track selected in the Image pane.
You can choose whether to plot the calibration curve using a linear or logarithmic scale– see Configuration (Molecular Weight page) in the Extras menu – page 8-139).
You create the calibration graph by assigning molecular weights to one or more peaks in one or more tracks – see Determining molecular weights/quantities using standard tracks, page 1-79, for details.
1-88 GeneTools User Manual
Using GeneTools for Gel analysis
The quantity calibration graph
The quantity calibration graph for the selected area of interest is displayed in the Gelwindow’s Graphics pane.
You can choose the shape of the calibration curve, how the calibration should bepropagated to other tracks and the quantity units to use – see Setting the quantitycalibration method, page 1-73, for details.
The equation of the line or curve is shown in the Raw volume axis label along with thecorrelation coefficient R, which is a measure of how well the calibration points can befitted by a line or quadratic curve, depending on the selected calibration method (avalue of 1 means a perfect fit). The example shows a quadratic calibration; thecalibration points don’t quite lie on the curve so the R value is slightly less than 1.
The graph shows data points for all the calibration peaks (in the selected region ofinterest), not just the calibration peaks on the selected track. The graph also shows anynon-calibration peaks in the selected track. Calibration data points are marked by ;non-calibration points by . By definition, non-calibration points always lie on thecalibration curve; calibration points may not lie exactly on the calibration curve.
When you display the quantity calibration graph, the Peak value pane displaysquantities for the peaks on the track selected in the Image pane.
GeneTools User Manual 1-89
How to determine molecular weights and quantities
You create the calibration graph by assigning quantities to one or more peaks in one ormore tracks – see Determining molecular weights/quantities using standard tracks,page 1-79, and Creating quantity calibrations without using standard tracks, page 1-76,for details.
Viewing molecular weight or quantity results in the Peak value pane
Once you have calibrated a sample for molecular weights and/or quantities, you canview the results calculated for other peaks in the Peak value pane.
To view the molecular weights or quantities calculated for peaks on a track:
1 Choose Molecular weight or Quantities from the View menu.
2 Click in the track for which you want to view results.
The results for the selected track will be shown in the Peak value pane.
1-90 GeneTools User Manual
Using GeneTools for Gel analysis
Viewing molecular weight and/or quantity results in the Results pane
To view the results for all tracks (in the selected area of interest):
1 Click on the Results for all tracks tab in the Results pane to display a tableincluding results for each peak in each track:
(See Step 2 for how to choose which results to display in the table)
The Number identifies each located peak on the track – the peaks arenumbered in the electrophoresis direction.
2 To choose what details to include in the results, right-click on the Results pane to pop up a menu. The commands on this menu allow you to choosewhether or not to include a column for the corresponding parameter in thetable. The commands are checked in the menu when the columns aredisplayed.
3 To make the Results pane fill the Gel window, right-click on the Results paneto pop up a menu. Choose Maximize pane (or choose the same commandfrom the View menu).
GeneTools User Manual 1-91
How to determine molecular weights and quantities
To view a results table for one track only:
1 Click on the track in the Image pane to select it.
2 Click on the Results for selected track tab to display a table including themolecular weights for each peak:
3 You can maximize the pane and choose what details to display in the sameway as for the Results for all tracks tab.
Note In the Results pane tables, molecular weight and calibrated quantity results are shown in red for peaks that have been assigned a value to show that they are calibration peaks.
Working with molecular weight libraries
A molecular weight library is a collection of molecular weight/quantity standards. Eachstandard lists the molecular weights and/or quantities for a set of peaks. You use thelibrary to calibrate a gel by assigning one of the standards contained in the library toone or more standard tracks in the gel. If you use the same standard solution fordifferent gels, using a molecular weight library saves you entering the molecularweights/quantities individually for each peak in the standard tracks.
When you open GeneTools, the default molecular weight library is openedautomatically – see Setting the default molecular weight library, page 1-98, for how tospecify the default library.
You can open previously saved molecular weight libraries or create new ones. You cancreate as many different molecular weight libraries as you wish, though in manycircumstances you will find that one will be sufficient. However, you can only have onelibrary open at a time – opening a new library closes the currently open one.
1-92 GeneTools User Manual
Using GeneTools for Gel analysis
The Molecular weight library window
Molecular weight libraries can be viewed and edited in the Molecular weight librarywindow:
In this example, the library MwLibrary.mwl contains two standards added by the user(1 Cal test containing quantities only and 10 Cal test containing quantities andmolecular weights) in addition to the molecular weight standards 100bp ladder, 1kbladder, BRL-100bp, BRL-10bp etc, which are supplied with GeneTools.
You can expand or contract the display of each standard in the window to show or hide its list of peak values. For example, the display of 100bp ladder is expanded in thepicture above, but 1kb ladder is contracted.
To expand the display of a standard:
Click on the + to the left of the standard’s name.
GeneTools User Manual 1-93
How to determine molecular weights and quantities
To contract the display of a standard:
Click on the - to the left of the standard’s name.
When you start up the program, the Molecular weight library window is openedautomatically showing the default Molecular weight library (see Setting the defaultmolecular weight library, page 1-98, for how to specify the default library), but you canalso use it to create a new library or to open a previously saved library.
Closing the Molecular weight library window
To close the Molecular weight library window:
1 Click in it or choose it from the Window menu to select it.
2 Choose Close from the File menu.
Clicking on the close button at the top right-hand corner of the Molecular weight library window only minimizes the window.
Creating a new molecular weight library
To create a new molecular weight library:
Choose New library from the File menu.
If the Molecular weight library window is open and you have any unsaved changes, you will be asked if you want to save them before the library is closed. The Molecularweight library window will then be reopened with a new empty library for you to create new molecular weight/quantity standards – see Creating a new molecular weight/quantity standard, page 1-100.
You can associate text with a molecular weight library to document it – see the nextsection.
Once you have created the new standard(s) you can save the new molecular weightlibrary – see Saving a molecular weight library, page 1-96.
1-94 GeneTools User Manual
Using GeneTools for Gel analysis
Setting and viewing properties of a molecular weight library
To set or view properties associated with a molecular weight library:
1 Open the library if it is not already open.
If the library is already open, click in the Molecular weight library window orchoose it from the list at the bottom of the Window menu to select it.
2 Choose Properties from the File menu to display the Library propertiesdialog box:
● The Date created and Date modified boxes are read-only and show thedates on which the library was created and last modified.
● The Author and Name boxes can be edited provided the molecularweight library is unlocked – see Locking and unlocking molecular weightlibraries, page 1-99.
3 Enter text in the Author and Name boxes to document the molecular weightlibrary.
4 Press OK to close the dialog box.
5 Choose Save from the File menu to save the new properties.
GeneTools User Manual 1-95
How to determine molecular weights and quantities
Saving a molecular weight library
To save a molecular weight library with a new name:
1 Click in the Molecular weight library window or choose it from the list at thebottom of the Window menu to select it.
2 Choose Save as from the File menu to display a standard Windows Save Asdialog box:
3 Use the dialog box to select a folder in which to save the molecular weightlibrary.
4 Enter a File name for the molecular weight library.
5 Press Save to save the library in the file.
To save a previously saved molecular weight library using the same name:
1 Click in the Molecular weight library window or choose it from the list at thebottom of the Window menu to select it.
2 Choose Save from the File menu. If the molecular weight library has not been saved previously, the Save As dialog box will be displayed so that you canenter a name: see above.
1-96 GeneTools User Manual
Using GeneTools for Gel analysis
Note Saving a molecular weight library does not set it as your default molecular weightlibrary, so it will not be reopened when you next start up GeneTools. See Setting thedefault molecular weight library, page 1-98, for how to specify the default molecularweight library.
Opening a molecular weight library
To open a molecular weight library:
1 Choose Open library from the File menu to display a standard WindowsOpen dialog box:
2 Use the dialog box to select the required molecular weight library file.
3 Press Open.
The library will be opened in the Molecular weight library window.
Note Opening a molecular weight library does not set it as your default molecular weightlibrary, so it will not be reopened when you next start up GeneTools. See Setting thedefault molecular weight library, page 1-98, for how to specify the default molecularweight library.
GeneTools User Manual 1-97
How to determine molecular weights and quantities
Setting the default molecular weight library
To specify the default molecular weight library:
1 Choose Configuration from the Extras menu to display the Configurationdialog box.
2 Click on the Molecular Weight tab to display the Molecular Weight page:
The File name box shows the path and name of the file containing thedefault molecular weight library, which you can use for assigning standardmolecular weights to standard tracks.
3 Enter the path and name for the new default molecular weight library in theFile name box, or press Browse to display a standard Windows Open dialogbox so that you can choose the new file.
Note You can also click on a radio button in this page of the dialog box to choose whetherthe calibration graph shown in the MW calibration tab in the Graphics pane shouldhave a Linear or Logarithmic scale.
1-98 GeneTools User Manual
Using GeneTools for Gel analysis
Locking and unlocking molecular weight libraries
You can lock molecular weight libraries to prevent them being edited.
To lock a molecular weight library:
1 Open the library if it is not already open.
If the library is already open, click in the Molecular weight library window orchoose it from the list at the bottom of the Window menu to select it.
2 Choose Lock from the File menu.
(The command will become disabled in the menu and Unlock will becomeenabled.)
3 Choose Save from the File menu to save the locked status of the file.
While the library is locked, the commands for editing it in the Edit menu and thepop-up menu displayed when you right-click in the Molecular weight library windoware disabled.
You can protect the library further by setting a password, which will be required tounlock the library – see Setting a password for a molecular weight library, page 1-100.
To unlock a molecular weight library:
1 Open the library if it is not already open.
If the library is already open, click in the Molecular weight library window orchoose it from the list at the bottom of the Window menu to select it.
2 Choose Unlock from the File menu to display the Enter password dialogbox:
GeneTools User Manual 1-99
How to determine molecular weights and quantities
3 Enter the Password (if any) and press OK (see the next section for setting apassword) – just press OK if no password is set.
You will be told if the password is incorrect.
When the library is unlocked, Unlock will become disabled in the menu and Lock willbecome enabled.
Setting a password for a molecular weight library
To set or change the password for a molecular weight library:
1 Open the library if it is not already open.
If the library is already open, click in the Molecular weight library window orchoose it from the list at the bottom of the Window menu to select it.
2 Choose Change password from the File menu to display the Changepassword dialog box:
3 Enter the Old password – the characters will be shown as * for security.
4 Enter the New password – the characters will be shown as * for security.
5 Enter the new password again in the Confirm new box to check that youtyped it correctly.
6 Press OK to set the new password and close the dialog box.
Creating a new molecular weight/quantity standard
You can only create a new molecular weight standard if the library is unlocked – seeLocking and unlocking molecular weight libraries, page 1-99.
To create a new molecular weight/quantity standard in a library:
1 Open the library if it is not already open.
1-100 GeneTools User Manual
Using GeneTools for Gel analysis
If the library is already open, click in the Molecular weight library window orchoose it from the list at the bottom of the Window menu to select it.
2 Choose New standard from the Edit menu (or right-click in the window todisplay a pop-up menu and choose New) to display the New standard dialog box:
Note You can also display this dialog box by pressing New standard on the Edit standardpage of the Assign molecular weight/quantity dialog box.
3 Enter a name for the Standard.
4 Press OK to display the Edit molecular weight standard dialog box:
5 Enter the first Peak number, (ie, 1).
6 Enter its Molecular weight (molecular weights must decrease as peak number increases) and/or Quantity (there is no restriction on the order of quantities).
GeneTools User Manual 1-101
How to determine molecular weights and quantities
7 Press Insert. The peak number and associated molecular weight and/orquantity will appear in the list box at the top of the dialog box.
The Peak number will be increased by 1 ready for you to add the next peak.
8 Repeat Steps 6–7 for the remaining peaks.
9 Press OK to close the dialog box. The new standard will appear in theMolecular weight library window.
Editing a molecular weight/quantity standard in a library
You can only edit a molecular weight standard if the library is unlocked – see Lockingand unlocking molecular weight libraries, page 1-99.
To edit a molecular weight standard in a library:
1 Open the library if it is not already open.
If the library is already open, click in the Molecular weight library window orchoose it from the list at the bottom of the Window menu to select it.
2 Select the standard in the Molecular weight library window by clicking on thestandard’s name or any of the values in its list.
3 Choose Edit standard from the Edit menu (or right-click on the standard’sname or any of the peaks in its list to display a pop-up menu and chooseEdit) to display the Edit molecular weight standard dialog box:
1-102 GeneTools User Manual
Using GeneTools for Gel analysis
Note You can also display this dialog box from the Edit standard page of the Assignmolecular weight/quantity dialog box – select the standard you want to edit in thedrop-down list box and press Edit standard.
The list box shows the peaks and the molecular weights/quantities assigned tothem in the standard.
To change a peak in the standard:
1 Select the peak you want to change by clicking on it in the list of values. Thepeak number, molecular weight and quantity will be shown in the Peaknumber, Molecular weight and Quantity boxes.
2 Change the Peak number and/or Molecular weight and/or Quantity asrequired.
3 Press Change.
To add a new peak to the standard:
1 Enter the Peak number (it must be different from any existing peak numbers).
2 Enter the Molecular weight (molecular weights must decrease as peaknumber increases) and/or Quantity (there is no restriction on the order ofquantities).
3 Press Insert.
To delete a peak from the standard:
1 Select the peak you want to delete by clicking on it in the list of peaks. Thepeak number, molecular weight and quantity will be shown in the Peaknumber, Molecular weight and Quantity boxes.
2 Press Delete.
GeneTools User Manual 1-103
How to determine molecular weights and quantities
Renaming a standard in a molecular weight library
You can only rename a molecular weight standard if the library is unlocked – seeLocking and unlocking molecular weight libraries, page 1-99.
To rename a molecular weight standard in a library:
1 Open the library if it is not already open.
If the library is already open, click in the Molecular weight library window orchoose it from the list at the bottom of the Window menu to select it.
2 Select the standard in the Molecular weight library window by clicking on thestandard’s name.
3 Choose Rename standard from the Edit menu (or right-click on thestandard’s name to display a pop-up menu and choose Rename) to displaythe Rename dialog box:
4 Edit the name in the New name box.
5 Press OK to close the dialog box.
The standard will appear with the new name in the Molecular weight library window.
Deleting a standard from a molecular weight library
You can only delete a molecular weight standard from a library if the library is unlocked – see Locking and unlocking molecular weight libraries, page 1-99.
To delete a molecular weight standard from a library:
1 Open the library if it is not already open.
If the library is already open, click in the Molecular weight library window orchoose it from the list at the bottom of the Window menu to select it.
1-104 GeneTools User Manual
Using GeneTools for Gel analysis
2 Select the standard in the Molecular weight library window by clicking on thestandard’s name.
3 Choose Delete standard from the Edit menu (or right-click on the standard’sname to display a pop-up menu and choose Delete).
How to match peaks on different tracks
Notes The operations described in this section are only available if you have purchased theGeneTools Match software option.
This section shows you how to carry out matches between tracks lying within the samearea of interest. However, you can also carry out matches between tracks using theProfile comparison window (see page 1-117), and in the Profile comparison windowyou can carry out matches between tracks in different areas of interest or even ondifferent gels.
The GeneTools matching software allows you to match:
● Bands: matching is between the peaks that have been detected on the tracks. Alltracks (in the selected area of interest) are matched to the peaks on a selected‘matching standard track’ – see Setting a matching standard, page 1-109.
● Profiles: matching is between the intensity profile of each track against the intensityprofile of each of the other tracks.
See Setting the method and parameters used for matching, page 1-107, for how tochoose which type of matching to use and for how to set the criteria used for matching.
The matching results are updated automatically whenever you carry out an action thatmight change the results.
If required, you can edit band matching (but not profile matching) manually – seeEditing matches, page 1-110.
You can view details of the matching results in the Results pane – see Viewing matchresults, page 1-112.
GeneTools User Manual 1-105
How to match peaks on different tracks
If you choose Peak matching from the View menu or click on the Dendrogram tab inthe Graphics pane:
● The Graphics pane shows the dendrogram – see Dendrogram, page 1-115.
● If you have set Band matching:
● the Peak value pane shows the positions of the peaks in the active matchingstandard.
● if Match lines is selected in the View menu, the Image pane shows lines joiningthe matched peaks (you can use Configuration in the Extras menu to set thecolors of the match lines – see page 8-143):
Note that the match peak selected in the Peak value pane is shown in a different color.
1-106 GeneTools User Manual
Using GeneTools for Gel analysis
Setting the method and parameters used for matching
You can choose different methods of matching and tolerance values for each area ofinterest on the sample.
To set or view the tolerance and method used for matching in the selected area ofinterest:
1 Choose Band matching from the Edit menu to display the Matchingparameters dialog box:
2 In the Matching box:
a In the Type box, select Band or Profile to decide whether to match tracksusing the detected bands (peaks) or the intensity profiles.
GeneTools User Manual 1-107
How to match peaks on different tracks
Note When Profile is selected:
● There is no need to detect the peaks on the tracks (unless you choose to match onthe basis of molecular weights – see Step c).
● There is no need to define a matching standard – see next section.
● The Similarity Coefficient controls in the Matching parameters dialog box aredisabled.
● The Matching comparisons and Matching matrix pages in the Results pane will beblank – see Viewing match results, page 1-112.
b If you selected Band in the Type box, select Dice or Jaccard from theSimilarity Coefficient box to choose how the similarity coefficients shouldbe calculated – see Similarity matrix, page 1-114, for how the similaritycoefficients are defined.
c In the Alignment box, click on a radio button to choose whether matching should be carried out on the basis of:
● Position – distance from start of track
● Rf – relative position between Rf start and end lines on the tracks
● MW – molecular weight calculated using the molecular weightcalibration curve(s) for the tracks (see How to determine molecularweights and quantities, page 1-72).
3 Enter a Tolerance figure to set a limit to the accuracy required whenmatching peaks (this does not have to be a whole number).
Note For Profile matching, the Tolerance must be set to a number less than or equal to 1.
4 In the Dendrogram Drawing box:
a Choose whether to use UPGMA or Neighbor Joining as the linkage rulefor the dendrogram – see The dendrogram, page 6-10, for a description ofthese linkage rules.
b Check or uncheck Include MW standard(s) to choose whether molecularweight standard tracks should be included in the dendrogram.
1-108 GeneTools User Manual
Using GeneTools for Gel analysis
5 Press Apply to see the effect of changing the matching parameters withoutclosing the dialog box; press OK to set the matching parameters and close the dialog box.
Setting a matching standard
If you choose Band as the matching Type for carrying out matches (see previoussection), the bands (peaks) on each track in an area of interest are matched to thebands on a specified matching standard in that area of interest. This section shows youhow to set the matching standard.
Note When you choose Profile as the matching Type, the intensity profile of each track in an area of interest is matched to each of the other tracks in the area of interest withoutreference to any matching standard track. You can select one or more matchingstandards, but they will have no effect on the results for profile matching – this is shown by the fact that none of them will be marked as the active matching standard (see laterin this section).
To make a track a matching standard for the selected area of interest:
1 Click on the track in the Image pane to select it.
2 Choose Matching standard from the Track menu.
Or
1 Right-click on the track’s label in the Track label pane to select it and pop upa menu.
2 Choose Matching standard from the menu.
The track label will show MS* – the MS means it is a matching standard, the * means it is the active matching standard (any previous active matching standard will now showMS to show that it is still a matching standard but no longer the active one).
To make a matching standard the active matching standard:
1 Right-click on the track’s label in the Track label pane to select it and pop upa menu.
2 Choose Active matching standard from the menu.
GeneTools User Manual 1-109
How to match peaks on different tracks
If you choose Matching standard for a matching standard track, the track will no longer be a matching standard. If it was the active matching standard, the matching standard (if any) with the highest track number will become active.
Editing matches
After GeneTools has matched peaks automatically, you may want to reassign, remove oradd matches manually.
Notes You cannot match peaks in different areas of interest.
You cannot edit profile matching results.
To edit peak matches manually:
1 Make sure Peak matching is selected in the View menu (or, equivalently, thatthe Dendrogram page is displayed in the Graphics pane).
Remember, when Peak matching is selected, the Peak value pane shows thepeaks in the active matching standard track, whichever track is selected in the Image pane – see Step 3.
2 Make sure Match lines is selected in the View menu.
1-110 GeneTools User Manual
Using GeneTools for Gel analysis
3 Click on the (matching standard) peak in the Peak value pane that you wantto match to a peak in another track:
If there are any matches for this peak already, they will be shown in theImage pane joined by a line in the color defined for the selected matchingpeak (see page 8-143 for how to set the color using Configuration in theExtras menu).
4 In the Image pane, double-click on the peak (in another track) that you wantto match or unmatch to the peak in the active matching standard that youselected in the previous step:
● If there is already a match between the peak you double-clicked on andany peak in the active matching track, it will be removed.
● Otherwise, if there is already a match between the selected matching peak and any of the other peaks in the track, it will be moved to the peak youdouble-clicked on.
● Otherwise, the selected matching peak will be matched to the peak youdouble-clicked on.
GeneTools User Manual 1-111
How to match peaks on different tracks
Viewing match results
When you have performed a match, the Results pane can show (for the selected area of interest):
● matching comparisons – the results for matching peaks on all (enabled) tracks (this isblank for profile matching)
● a matching matrix – an overview of which peaks on the active matching standard are matched on the other tracks (this is blank for profile matching)
● a similarity matrix – a table showing the correlation between each pair of tracks.
To expand the Results pane to fill the Gel window:
Click in the Results pane and choose Maximize pane from the View menu.
To return the pane to its normal size:
Choose Maximize pane from the View menu again.
Or
Adjust the size of the Gel window.
Matching comparisons
Note The Matching comparisons page shows band matching results – it is blank when profile matching is selected.
The Matching comparisons page in the Results pane shows the results for matchingpeaks on all (enabled) tracks in the selected area of interest.
To choose what details to include in the results, right-click on the Results pane to popup a menu. Apart from the Maximize pane command at the bottom of the menu, the
1-112 GeneTools User Manual
Using GeneTools for Gel analysis
commands on this menu allow you to choose whether or not to include a column forthe corresponding quantity in the table. The commands are checked in the menu when the columns are displayed.
Note The results will not be shown for disabled tracks (all tracks except 4, 5 and 6 have been disabled for the example picture).
Each row in the table corresponds to a peak in the active matching standard, which isidentified by (Reference) in the Table Heading.
For all the other tracks, the results are shown only for any peaks that match tracks in the active matching standard. In the example picture, peaks 1, 2 and 5 in Track 5, matchthe same numbered peaks in the matching standard (Track 4), but in Track 6, whilepeak 4 matches peak 4, peak 2 matches peak 3 in the active matching standard.
Molecular weight and quantity results are shown in red if the corresponding peaks havebeen assigned a molecular weight or a quantity, respectively.
Matching matrix
Note The Matching matrix page shows band matching results – it is blank when profilematching is selected.
The Matching matrix page in the Results pane shows a table identifying which peaks in the tracks in the selected area of interest match the peaks in the active matchingstandard.
Note The results will not be shown for disabled tracks (all tracks except 3, 4 and 6 have been disabled for the example picture).
Each row in the table corresponds to a peak in the active matching standard, which isidentified by red Xs in its column.
GeneTools User Manual 1-113
How to match peaks on different tracks
For all the other tracks, an X shows that there is a peak in the track matching a peak inthe active matching standard. The row containing the X identifies which peak in theactive matching standard is being matched. In the example picture, Track 3 has peaksmatching peaks 1 and 4 in the matching standard.
Note The matching matrix does not identify which peaks in Tracks 3 and 6 are the matchingpeaks (the peak numbers refer to the matching standard) – you can look at theMatching comparisons table to identify the peaks.
Similarity matrix
The Similarity matrix page in the Results pane shows the correlation between each pair of tracks in the selected area of interest.
Note The results will be shown for all tracks in the selected area of interest, including any that are disabled.
The calculation of the similarity coefficients depends on the Type of matching selectedin the Matching parameters dialog box (see Setting the method and parameters usedfor matching, page 1-107):
● Band matching – the Matching parameters dialog box allows you to choosebetween two ways of calculating the similarity coefficient for any pair of tracks Aand B:
● Jaccard:
Number of Matching Peaks Total Number of Peaks – Number of Matching Peaks
● Dice:
2 ´ Number of Matching PeaksTotal Number of Peaks
1-114 GeneTools User Manual
Using GeneTools for Gel analysis
Where the ‘Number of Matching Peaks’ means the ‘number of peaks common to Aand B that match to a common peak on the matching standard’, and the ‘TotalNumber of Peaks’ means ‘the number of peaks on A + the number of peaks on Bincluding both matching and non-matching peaks’.
● Profile matching – the similarity coefficient for any pair of tracks A and B shows thecorrelation between the intensity profiles on the two tracks.
Dendrogram
See page 6-10 for some background information about dendrograms.
When you match tracks on a Gel sample, GeneTools automatically creates adendrogram and displays it in the Gel window’s Graphics pane. The Matchingparameters dialog box (see Setting the method and parameters used for matching,page 1-107) allows you to choose between using UPGMA or Neighbor Joining as thelinkage rule for the dendrogram. The choice of linkage rule determines the methodused to calculate the measure of similarity between clusters of similar tracks and affectsthe way the dendrogram is displayed. For example:
● UPGMA
The UPGMA dendrogram is right-aligned and drawn against a scale, which is shownalong the top of the pane.
GeneTools User Manual 1-115
How to match peaks on different tracks
● Neighbor Joining
The Neighbor-joining dendrogram is not right-aligned and the lengths of theindividual branches are shown on the lines themselves.
If required, you can change the colors used for the Neighbor-joining dendrogramnodes and leaves – see page 8-143 for details.
For the Neighbor-joining dendrogram, you can also choose which node in the treeto display at the root of the dendrogram – see the next section.
If the dendrogram is larger than the Graphics pane, you can increase the size of thepane, scroll the dendrogram to view hidden parts or scale the dendrogram to fit theGraphics pane.
To scale the dendrogram to fit the Graphics pane:
1 Right-click in the dendrogram to display the dendrogram context menu.
2 Choose Scale to fit.
The dendrogram will be scaled to fit the Graphics pane.
Scale to fit is checked in the dendrogram context menu when autoscaling is selected;choose the command again to switch autoscaling off.
If you resize the Graphics pane while Scale to fit is selected, the dendrogram will berescaled so that it still fills the pane.
1-116 GeneTools User Manual
Using GeneTools for Gel analysis
Changing the root in a Neighbor-joining dendrogram
To choose a different node to be the root of the dendrogram:
Click on the node in the dendrogram:
The dendrogram will be redisplayed with the selected node at the root:
Note that this only affects the way the tree is displayed – the correlation values andconnectivity of the tree are unaffected.
How to compare peak profiles
This section describes how to use the Profile comparison window. The Profilecomparison window allows you to compare the profiles of selected tracks, which maybe on different gels. Additionally, if you have purchased the GeneTools Match softwareoption, you can use the Profile comparison window to perform track matchingbetween tracks, which, unlike the matching procedure described in How to match
GeneTools User Manual 1-117
How to compare peak profiles
peaks on different tracks (see page 1-105), may be in the same or different areas ofinterest, or even on different gels.
Note In order to support the matching operations, when the Match software option isenabled, the Profile comparison window has an additional pane and some additionalcommands. However, many of the Profile comparison window operations are the same as when the Match software option is not enabled, so to avoid repetition, unless theyexplicitly say otherwise, the following instructions apply whether the Match softwareoption is enabled or not.
To compare the profiles on different tracks and/or different gels:
1 If you want to compare profiles in any secure sample files that are not already open, open them – you can only compare track profiles for tracks in opensecure sample files.
2 Choose Profile comparison from the View menu. The Profile comparisonwindow will open.
The appearance of the window depends on whether the GeneTools Matchsoftware option is installed:
Match software option not installed
1-118 GeneTools User Manual
Using GeneTools for Gel analysis
Match software option installed
The Track browser pane (the left-hand pane) shows the path and filenames for all the open Gel windows and allows you to select which tracks to include inthe comparison.
The Profiles pane (the right-hand pane for systems without the GeneToolsMatch software option, as in the example; the center pane for systems with it) is used to plot the intensity profiles for the selected tracks.
The third pane is the Match results pane (the right-hand pane for systems with the GeneTools Match software option; absent for systems without it) containsthe similarity matrix and dendrogram tabs showing the matching results.
3 In the Track browser pane, click on the + icon(s) next to the secure samplefile(s) containing the tracks that you want to compare (or double-clickanywhere else in the row)
GeneTools User Manual 1-119
How to compare peak profiles
to display the tracks in the file:
(Click on the - icon or double-click again anywhere else in the row to hidethe tracks in the left-hand pane.)
4 Click on the first track that you want to include in the comparison.
5 Choose Show from the Profile menu (or the context menu displayed if youright-click on the track).
(As an alternative to steps 4 and 5, just double-click on the track.)
Show will be checked in the menu when a profile is shown, a line showingthe color used for drawing the profile will be shown next to the track in theleft-hand pane and the profile will be drawn in the Profiles pane.
(Choosing Show again for the same track, or double-clicking again, removesthe track from the comparison.)
Note To include all of the tracks in the comparison, choose Show all from the Profile menu;to remove all of the tracks from the comparison, choose Hide all from the Profilemenu.
1-120 GeneTools User Manual
Using GeneTools for Gel analysis
6 Repeat Steps 4 and 5 for any other tracks you want to include in thecomparison:
(In the example all the profiles are for tracks on the same gel, but you can use the same procedure to include tracks from different files in the samecomparison if you wish).
The vertical scale shows the image gray level. The default horizontal scale isthe Rf value from 0 (the Rf start position) to 1 (the Rf end position) (seeAdjusting the Rf start and end positions, page 1-43, for how to set these), butif you have assigned molecular weights to a standard track, you can also use(log) molecular weight for the horizontal scale – see the next step.
Note If you have purchased the GeneTools Match software option, the parameter chosen forthe horizontal scale also determines the alignment used when matching tracks in theProfile comparison window – see Matching tracks in the Profile comparison window,page 1-123, for details.
7 To choose whether to use Rf or (log) molecular weight for the horizontal scale for plotting profiles in the Profile comparison window, choose MW or Rffrom the View®Plot mode submenu.
Note If you choose MW and have not yet assigned molecular weights to a standard track, the profile plot will be blank – see Assigning molecular weights/quantities to a standardtrack, page 1-79.
GeneTools User Manual 1-121
How to compare peak profiles
8 If required, select a track and choose Reference from the Profile menu (orthe menu displayed if you right-click on the track) to highlight one of thetracks in a comparison as a reference:
Track 4 in the example is the reference track.
Note If you have purchased the GeneTools Match software option, the reference track willalso be used as the Matching standard track for peak matching comparisons – seeMatching tracks in the Profile comparison window, page 1-123, for details.
If you repeat Step 8 for another track, the new track will become the reference – onlyone track in a comparison can be defined as the reference track.
If the track you define as the reference is not already included in the comparison, it will become shown in the comparison automatically. However, you can then hide it ifrequired (see Step 5) without it losing the status of being the reference – if you show itagain it will still be the reference, provided you have not chosen another track as thereference meanwhile.
You can use Configuration in the Extras menu (see page 8-143) to change the colorsand line styles of profiles in the Profile comparison window.
1-122 GeneTools User Manual
Using GeneTools for Gel analysis
Changing the scale in the Profile comparison window
To increase the horizontal scale in the Profiles pane in the Profile comparison window:
1 If necessary, use the scroll bar to move the point of interest in the profiles tothe middle of the Profiles pane (the scale will be expanded about the centerof the pane).
2 Choose Zoom in from the View menu.
You can only see part of the Rf/MW range when the profile window is zoomed; youcan use the horizontal scroll bar to choose which part of the range to view.
To reduce the horizontal scale in the Profiles pane Profile comparison window:
Choose Zoom out from the View menu.
To remove any magnification from the Profiles pane in the Profile comparison window:
Choose Zoom reset from the View menu.
Matching tracks in the Profile comparison window
Note The operations described in the section are only available if you have purchased theGeneTools Match software option.
This section shows you how to use the Profile comparison window to carry out trackmatching. You can also carry out track matching using a gel window (see How to match peaks on different tracks, page 1-105), and the two methods share many features.However, one difference between the two techniques is that in a Gel window, you canonly match peaks on tracks that lie within the same area of interest, while in the Profile Comparison window you can match tracks lying in different areas of interest, or evenon different gels. On the other hand, if you match peaks in a Gel window, you can getmore detailed results in the form of the matching comparisons table and the similaritymatrix, and you can edit band (peak) matching results manually.
GeneTools User Manual 1-123
How to compare peak profiles
Controlling the way tracks are matched in the Profile comparison window
To control the way tracks are matched in the Profile comparison window:
Choose Parameters from the Matching menu to display the Matchingparameters dialog box:
This dialog box is also used to control matching in Gel windows, and with twoexceptions it is used in exactly the same way. The exceptions are:
● There is no Include Molecular Wt standard(s) checkbox when it is displayed forthe Profile comparison window – see the next section for how to choose whichtracks are included in the matching.
● The Alignment radio buttons are disabled – the setting (Rf or MW) is controlled bythe commands in the View®Plot mode submenu, which also set the horizontal axisof the graphs in the Profiles pane.
See Setting the method and parameters used for matching, page 1-107, for details of the other settings in the Matching parameters dialog box.
1-124 GeneTools User Manual
Using GeneTools for Gel analysis
Selecting which tracks to include in a matching
To choose which tracks to include in a matching in the Profile comparison window:
1 In the Track browser pane, click on the first track that you want to include inthe comparison.
2 Choose Include selected in matching from the Matching menu (or thecontext menu displayed if you right-click on the track).
(Choosing Include selected in matching again for the same track removes the track from the matching.)
Notes To include all of the tracks in the matching, choose Include all from the Matchingmenu; to remove all of the tracks from the matching, choose Exclude all from theMatching menu.
There is no link between ‘showing a track’ in the Profiles pane and including a track inthe matching – tracks can be matched without being shown, and vice versa. The statusof each of the tracks is shown next to the commands in the Profile and Matchingmenus when the track is selected and by the icons in the Track browser pane – forexample:
Tracks 1 and 6 are not shown and not included in the matching; Track 2 is shown butnot included in the matching; Track 3 is shown, included in the matching and is thereference track; Track 4 is shown and included in the matching; and Track 5 is included in the matching but not shown.
GeneTools User Manual 1-125
How to compare peak profiles
Selecting a matching reference track for peak matching
If you choose Band (peak) matching in the Matching parameters dialog box, the peaks detected on all of the tracks included in the matching are matched to the peaks on aselected matching reference track.
To select a matching reference track for peak matching:
Select a track in the Track browser pane and choose Reference from theProfile menu (or the menu displayed if you right-click on the track).
The matching reference track must also be included in the matching (see previoussection) if it is to be used for Band matching – if Band (peak) matching is selected inthe Matching parameters dialog box, you will be reminded if there is no referencetrack selected or if the reference track is not included in the matching.
Matching results in the Profile comparison window
The results of carrying out a matching in the Profile comparison window are shown inthe window’s Results pane at the right-hand side of the window. The pane has twotabs:
● Similarity matrix
1-126 GeneTools User Manual
Using GeneTools for Gel analysis
● Dendrogram
You can work with these results panes in exactly the same way as in the Gel window –see Similarity matrix, page 1-114, and Dendrogram, page 1-115, for details.
How to print and export Gel results
Printing a report showing Gel results
To print a report showing the results for the selected area of interest on a gel:
1 If you have not already done so, enter your laboratory’s name and a headingfor reports in the General page of the Configuration dialog box (seepage 8-139).
2 Click in the Gel window or choose it from the Window menu to select it.
GeneTools User Manual 1-127
How to print and export Gel results
3 Choose Report setup from the File menu to display the Report Setup dialogbox:
Note If the paper selected for the currently selected printer is less than 150 mm in eitherdimension (for example if you are using a video printer), a simplified report containingthe image and some brief identification and image information will be printed. Thesettings in the Report setup dialog box have no effect on the content of this simplifiedreport.
4 Select the check boxes for the items you want to include in the report.
1-128 GeneTools User Manual
Using GeneTools for Gel analysis
5 Click on the Matching tab to display the Matching page in the Report setupdialog box:
6 Select the check boxes for the items you want to include in the report.
7 To preview the report before you print it, choose Print preview from the Filemenu.
8 Choose Print from the File menu (if you are previewing the report, you canalso press Print in the preview window).
Printing reports – Profile comparisons
To print a report showing Profile comparisons:
1 If you have not already done so, enter your laboratory’s name and a headingfor reports in the General page of the Configuration dialog box – see theentry for Configuration in the Extras menu in the Menus chapter (page8-139).
2 Click in the Profile comparison window or choose it from the Window menu to select it.
GeneTools User Manual 1-129
How to print and export Gel results
3 To preview the report before you print it, choose Print preview from the Filemenu.
4 Choose Print from the File menu (if you are previewing the report, you canalso press Print in the preview window).
See the entry for Printer Setup in the Menus chapter, page 8-19, for how to select andset up the printer to use.
Exporting results to Excel
Gel windows
To export results to Excel:
1 Select the results table that you want to export by clicking on its tab in theResults pane – see page 6-14 for information about the tables that can bedisplayed in the Results pane.
2 If you want to change the columns shown in the table, right-click on the table to display the Results context menu and choose the required parameter toadd to or remove from the table.
3 Repeat Step 2 until the required columns are displayed.
4 Choose Export table to Excel.
Unless you have already exported a table to Excel in the current session, Excel will beopened and a new workbook created.
The first sheet in the workbook will be named Image document data and will containthe secure sample’s file name, and data taken from the Information page of theSample properties dialog box.
The second sheet in the workbook will contain the exported table and will be namedappropriately.
If you have already exported a table to Excel in the current session:
● if the results table selected in the Results pane already exists in the workbook, theresults will be updated
1-130 GeneTools User Manual
Using GeneTools for Gel analysis
● otherwise, a new sheet will be added for the new table and named appropriately.
Note 1 GeneTools identifies sheets in the workbook by their names. If you rename a sheet andexport the table again, a new sheet will be added for the table and the original sheetwill not be updated.
Note 2 After you have exported a table to Excel in a session, GeneTools maintains a link to theworkbook it created but does not use the name of the workbook to identify it. Thismeans that you can save the workbook with another name if you wish. However, it also means that once you have exported a table to Excel, you should leave the workbookopen in Excel until after you have closed GeneTools.
Profile comparison window
To export the data points (Rf and height values) to Excel for a track displayed in theProfile comparison window (see Profile comparison window, page 6-18, for moreinformation about the Profile comparison window):
Select a track in the Track browser pane and choose Export to Excel from the Profile menu (or the menu displayed if you right-click on the track).
Note Export to Excel is only enabled for tracks that are currently ‘shown’ in the Profilecomparison window.
The data (one data point for each pixel along the track) will be exported to a newworksheet in Excel, which will be opened if it is not already open.
Saving results in a comma separated values format file
To save results to a comma separated values text file:
1 Select the results table that you want to export by clicking on its tab in theResults pane.
2 If you want to change the columns shown in the table, right-click on the table to display the Results context menu and choose the required parameter toadd to or remove from the table.
3 Repeat Step 2 until the required columns are displayed.
GeneTools User Manual 1-131
How to print and export Gel results
4 Choose Save table to CSV file to display the Save as CSV File dialog box:
This is a standard Windows Save as dialog box.
5 Use the dialog box to select a folder in which to save the CSV file.
6 Enter a File name for the CSV file.
7 Press Save to save the results in the file.
Creating a report in Word
To create a Word document containing a report showing Gel results for the selectedarea of interest:
1 If you have not already done so, enter your laboratory’s name and a headingfor reports in the General page of the Configuration dialog box.
2 Click in the Gel window or choose it from the Window menu to select it.
3 Choose Report setup from the File menu to display the Report setup dialogbox – see page 1-128 for how to use this dialog box.
4 Choose Export to Word from the File menu to open a new Word documentand build the report.
1-132 GeneTools User Manual
Using GeneTools for Gel analysis
A new Word document will be opened and the report created within it.
Copying a picture of an image to the clipboard
To copy a picture of the image in the Image pane in the current window to theclipboard:
Choose Save to clipboard from the File menu.
GeneTools User Manual 1-133
How to print and export Gel results
1-134 GeneTools User Manual
Using GeneTools for Gel analysis
Using GeneTools for HighThroughput Gel analysis
Most operations you will need to carry out for the analysis of High Throughput Gelsamples are also used for Gel samples – see Getting started with High Throughput Gelanalysis in the GeneTools Getting Started manual for full instructions on the operationsspecific to High Throughput Gel samples; see the previous chapter in this manual, Using GeneTools for Gel analysis, for operations common to High Throughput Gel and Gelsamples.
GeneTools User Manual 2-1
2-2 GeneTools User Manual
Using GeneTools for High Throughput Gel analysis
Using GeneTools for Manual bandquantification
See Getting started with Manual band quantification in the GeneTools Getting Startedmanual for full instructions on using GeneTools for Manual band quantification.
GeneTools User Manual 3-1
3-2 GeneTools User Manual
Using GeneTools for Manual band quantification
Using GeneTools for Spot blotanalysis
This chapter contains detailed instructions for using GeneTools for Spot blot analysis.
The chapter begins by describing how you can load sample files and images intoGeneTools. It then shows you how to place spot frames over the spots and change theirsizes and positions – the spot frames are the areas within which GeneTools takesquantity measurements from the spots on the image.
This is followed by instructions for calibrating the results so that you can measurequantities from the spots.
The final section in the chapter describes how to use GeneTools to view, print andexport the results.
How to create and work with secure sample files
See File formats, page 1-1, for a description of the secure file format used byGeneTools.
GeneTools User Manual 4-1
Opening a secure sample file
To open a secure sample file:
1 Choose Open from the File menu to display a standard Windows Opendialog box:
2 Use the dialog box to select the required secure sample file.
3 Press Open.
What happens next depends on whether you are opening an analyzed or unanalyzedsecure sample, and in the latter case on whether you have set Auto import methods in the Configuration dialog box.
● If you are opening an analyzed secure sample file:
● The sample will be opened in a Spot blot/Manual band quantification windowwith all spot frames displayed as they were when the file was last saved. Allpreviously analyzed results will be shown in the Results table.
● If you are opening an unanalyzed secure sample file and you have selected Autoimport methods in the Configuration dialog box:
● The Import method dialog box will open so that you can choose which settingsto import – see Opening or creating a secure sample file with automatic import,page 4-11, for further details.
4-2 GeneTools User Manual
Using GeneTools for Spot blot analysis
● If you are opening an unanalyzed secure sample file:
● The Sample properties dialog box will open with the image loaded:
The controls shown on the General page in the Sample properties dialog box dependon the Analysis type selected.
1 If required, select Spot blot from the Analysis type drop-down list box – thedefault Analysis type is set to Gel when GeneTools is first installed but youcan change this using Configuration in the Extras menu – see page 8-139.
2 Choose the shape of spots (Circle or Rectangle) you want to use from theSpot type drop-down list box.
3 Click on the Fluorescence radio button for a fluorescence image (bright spotson a dark background); click on the Absorption radio button for anabsorption image (dark spots on a bright background).
GeneTools User Manual 4-3
How to create and work with secure sample files
GeneTools detects the Image type automatically, so you shouldn’t need tochange this setting.
4 Do one of:
● Press Locate spots automatically if you want GeneTools to detect thepositions of the spots automatically:
● Check Gridded if you want GeneTools to place a rectangular grid ofspot frames over the spots it detects.
● Uncheck Gridded if you want GeneTools to place spot frames onlywhere it actually found spots.
● Press Create spots for manual positioning to place a rectangular grid ofspot frames in a default position on the image:
● Enter the number of Columns and Rows you want to appear in thegrid.
● Press Leave the spots unchanged if you do not want to put any spotframes on the image yet. You will be able to add spots manually later –see Adding new spot frames, page 4-18.
5 Click on the Analysis notes tab and enter any notes you want to save withthe secure sample file.
The other two pages give information saved with the file in the acquisitionprogram – see the entry for Sample properties in the Menus chapter,page 8-28, for details.
4-4 GeneTools User Manual
Using GeneTools for Spot blot analysis
6 Press OK to close the dialog box and display the sample in a Spotblot/Manual band quantification window:
If you have set Gridded, a grid of spot frames of the chosen shape will be shown onthe image and their positions automatically adjusted within the grid cells to fit over anyspots that are detected – see How to adjust the spot frame positions, page 4-26, forhow to move and resize the frames if necessary.
If you have not set Gridded, spot frames of the chosen shape will be shown on theimage at any detected spots – see How to adjust the spot frame positions, page 4-26,and How to add and remove spot frames, page 4-16.
See also How to adjust the size and shape of spot frames, page 4-21.
GeneTools User Manual 4-5
How to create and work with secure sample files
Creating a new secure sample file
To create a new secure sample file (for example, from a non-secure .tif or .bmp imagefile):
1 Choose New (Import) from the File menu to display a standard WindowsOpen dialog box:
2 Choose the type of image file from the Files of type drop-down list box.
3 Use the Look in drop-down list box to select the folder containing the imagefile.
4 Click on the file in the list box to select it – the name of the file will appear in the File name box.
5 Press Open to close the dialog box.
What happens next depends on whether you have selected Auto import methods inthe Configuration dialog box:
● If you have selected Auto import methods in the Configuration dialog box, theImport method dialog box will open so that you can choose which settings toimport – see Opening or creating a secure sample file with automatic import,page 4-11, for further details.
4-6 GeneTools User Manual
Using GeneTools for Spot blot analysis
If Auto import methods is not selected, the Sample properties dialog box will open so that you can set the type of image and make other settings – see the picture onpage 4-3 and the instructions following it.
Using the Browser
As an alternative to using the Open command to open a secure sample file (seeSteps 1–3 in Opening a secure sample file page 4-2) or the New (Import) command tocreate a new secure sample file (for example, from a non-secure .tif or .bmp image file– see the previous section), you can use the GeneTools Browser to preview and openimage files.
To open an existing secure sample file or to create a new secure sample file using theBrowser:
1 Choose Browse from the File menu to display the Browser:
2 Use the left-hand pane in the Browser to select the folder containing therequired image in exactly the same way as you use the left-hand pane inWindows Explorer.
The right-hand pane in the Browser will show a preview of all the images inthe selected folder.
GeneTools User Manual 4-7
How to create and work with secure sample files
3 Double-click on the image that you want to open.
What happens next depends on whether you are opening an analyzed or unanalyzedsecure sample or creating a new secure sample file.
If you are opening an analyzed secure sample file:
● The sample will be opened in a Spot blot/Manual band quantification window withall spot frames displayed as they were when the file was last saved. All previouslyanalyzed results will be shown in the Results table.
If you are opening an unanalyzed secure sample file or creating a new secure samplefile:
● If you have selected Auto import methods in the Configuration dialog box, theImport method dialog box will open so that you can choose which settings toimport – see Opening or creating a secure sample file with automatic import,page 4-11, for further details.
● If Auto import methods is not selected, the Sample properties dialog box will open so that you can set the type of image and make other settings – see the picture onpage 4-3 and the instructions following it.
Acquiring an image to create a secure sample file
GeneTools allows you to acquire an image from a Twain source, such as a scanner or adigital camera, and create a secure sample file from it.
In order to acquire the image you need to select the Twain source first.
To select a Twain source so that you can acquire an image from it:
1 Choose Select Source (Twain) from the File menu to display the SelectSource dialog box:
4-8 GeneTools User Manual
Using GeneTools for Spot blot analysis
2 Click on the required source to select it.
3 Press Select to confirm the selection and close the dialog box.
To acquire an image from the selected Twain source and create a secure sample file:
1 Choose Acquire (Twain) from the File menu.
A dialog box will be displayed for the selected source so that you can selectacquisition options and acquire the image.
2 Use the dialog box to acquire the image.
Once the image has been acquired:
● If you have selected Auto import methods in the Configuration dialog box, theImport method dialog box will open so that you can choose which settings toimport – see Opening or creating a secure sample file with automatic import,page 4-11, for further details.
● If Auto import methods is not selected, the Sample properties dialog box will open so that you can set the type of image and make other settings – see the picture onpage 4-3 and the instructions following it.
Importing settings from existing secure Spot blot sample files
Automatically importing settings
To set the program to import settings automatically from an existing secure Spot blotsample file
1 Choose Configuration from the Extras menu to display the General page ofthe Configuration dialog box.
2 Check Auto import methods.
GeneTools User Manual 4-9
How to create and work with secure sample files
3 Click on the Import tab to display the Import page:
4 Press Browse to display a standard Windows Open dialog box if you want toselect a different file from which to import the settings.
a Select the file from which you want to import settings.
b Press OK to close the Open dialog box.
The name of the selected file will appear in the File name box.
5 Check the boxes for the settings you want to import – the relevant boxes for a Spot blot sample are Spot blot settings and Report settings.
Note The check boxes are disabled if no file is selected.
6 Press OK to close the Configuration dialog box.
Note The settings you make will be stored as the defaults for the next time you want toimport settings. The controls on this page are also displayed in a dialog box when you:
● open an unanalyzed image, or● create a secure sample file from a non-secure image, or
4-10 GeneTools User Manual
Using GeneTools for Spot blot analysis
● choose Import method from the File menu to import the settings from a saved fileto an existing secure sample file in a Spot blot window.
Changing the settings in any of these places changes the defaults.
Opening or creating a secure sample file with automatic import
If you have automatic import set when you:
● open an unanalyzed secure sample file – see Opening a secure sample file,page 4-2,
● create a new secure sample file – see Creating a new secure sample file, page 4-6,
● acquire an image from a Twain source – see Acquiring an image to create a securesample file, page 4-8,
the Import method dialog box will open:
Note If you change your mind about using automatic import, press Cancel to close theImport method dialog box and display the Sample properties dialog box. Thencontinue as if you were opening or creating a secure sample file without automaticimport.
GeneTools User Manual 4-11
How to create and work with secure sample files
To continue opening or creating a secure sample file with automatic import:
1 Click on the Import tab to display the Import page:
2 Press Browse to display a standard Windows Open dialog box if you want toselect a different file from which to import the settings.
Note The check boxes are disabled if no file is selected.
3 Check or uncheck the boxes if you want to change the settings that areimported – the relevant boxes for a Spot blot sample are Spot blot settingsand Report settings.
Note The choices you make will be stored as the defaults for the next time you want toimport settings. You can also set the defaults using the Import page of the Configuration dialog box, or by importing settings to an existing secure sample file bychoosing Import method from the File menu.
4 Press Import to close the Import method dialog box.
What happens next depends on whether you have chosen to import Spotblot settings:
● If you haven’t imported Spot blot settings, the Sample properties dialogbox will be displayed so that you can set the sample properties – see
4-12 GeneTools User Manual
Using GeneTools for Spot blot analysis
Opening a secure sample file, page 4-2, for details.When you have done that, a Spot blot/Manual band quantificationwindow will open containing the new sample created from the image.
● Otherwise, a Spot blot/Manual band quantification window will openimmediately containing the new sample created from the image with theimported spot frames in position – see later in this chapter for informationabout working with spot frames.
You can now use all the program’s analysis procedures to work with the sample.
Note You can always change the automatically imported settings at a later time by choosingSample properties from the File menu to change individual settings (the Sampleproperties dialog box also allows you to add notes about the sample to be saved withit).
See the next section for how to use Import method from the File menu to importsettings from a different secure sample file – this also displays the Import method dialog box but without the page showing the image).
GeneTools User Manual 4-13
How to create and work with secure sample files
Importing settings from a saved sample file
To apply spot blot and/or report settings from a saved secure sample file to the samplein the selected Spot Blot/Manual Quantification window:
1 Choose Import method from the File menu to display the Import methoddialog box:
2 Press Browse to display a standard Windows Open dialog box if you want toselect a different file from which to import the settings.
Note The check boxes are disabled if no file is selected.
3 Check the boxes for the settings you want to import – the relevant boxes for a Spot blot sample are Spot blot settings and Report settings.
Note This dialog box is also displayed if you create a new sample from a non-secure imagewith automatic import set (though it then has an additional page showing the image).You can also set the import methods in the Import page of the Configuration dialogbox. The program displays the same import methods in all these places and changingthe settings in any one of them changes the settings in all of them.
4-14 GeneTools User Manual
Using GeneTools for Spot blot analysis
Editing sample properties
To view or edit the settings and notes for a sample:
1 Click in the window containing the sample to select it.
2 Choose Sample properties from the File menu to display the General pageof the Sample properties dialog box – see the entry for Sample properties in the Menus chapter (page 8-28) for details.
Saving a secure sample file
To save a secure sample with a new name:
1 Click in the Sample window containing the sample (or choose it from the listat the bottom of the Window menu).
2 Choose Save as from the File menu to display a standard Windows Save Asdialog box:
3 Use the dialog box to select a folder in which to save the sample.
4 Enter a File name for the sample.
5 Press Save to save the sample in the file.
GeneTools User Manual 4-15
How to create and work with secure sample files
To save a previously saved secure sample file using the same name:
1 Click in the Sample window containing the sample (or choose it from the listat the bottom of the Window menu).
2 Choose Save from the File menu. If the secure sample file has not been saved previously, the Save As dialog box will be displayed so that you can enter aname: see above.
How to add and remove spot frames
Adding spot frames automatically
To locate spots automatically on a non-gridded Spot blot image (or to fine-adjust thesize and position of the spot frames on a gridded sample):
1 Choose All spots same size from the Spots menu to choose whether or notto force all the spot frames to have the same size.
2 Choose Locate from the Spots menu to display the Spot Location Tool dialog box:
4-16 GeneTools User Manual
Using GeneTools for Spot blot analysis
The dialog box allows you to set the criteria used for detecting spots:
● The red vertical lines in the Binary threshold control set the lower andupper boundaries of the range of intensities corresponding to spots in theimage – areas in the image within this range will be marked in blue whilethe Spot Location Tool dialog box is open.
● The Area criteria controls set the minimum and maximum size of spots –spot frames will appear on areas in the image satisfying both the Binarythreshold and Area criteria.
3 Set the minimum and maximum areas for spots in the Min Spot Area andMax Spot Area boxes.
4 Press Apply to set the area criteria without closing the dialog box – spotframes will appear on areas in the image satisfying both the Binary thresholdand the new Area criteria.
5 Drag the red boundary markers in the Binary threshold control until thespots, but not the background, in the image are colored blue – as you adjustthe boundaries, the spot frames on the image will show where the spots aredetected.
6 If necessary, repeat Steps 2–5 until the spot frames are accurately positionedon the spots in the image.
Note If All spots same size is not set, the spot frames will be sized optimally for each spot; if it is set, they will all be set to the size of the largest spot.
Note For a gridded sample, this procedure allows fine adjustment of the size and position ofthe existing spot frames, which must substantially overlap the actual spots on the image.
GeneTools User Manual 4-17
How to add and remove spot frames
Adding new spot frames
When the sample is non-gridded (see Step 3 on page 4-4), you can place your ownspot frames on the sample.
Circular frames
(See also Adding a copy of a spot frame, page 4-20.)
To place a circular spot frame on a non-gridded Spot blot sample:
1 If it isn’t already selected, choose Position any spot from the Spots menu tounlock the sample for placing and moving spot frames.
2 If All spots same size is selected in the Spots menu, choose the commandagain to deselect it.
3 If it isn’t already selected, choose Circle from the Spots menu – this willchange the shape of the currently selected frame.
You place the circle by dragging out its bounding rectangle.
4 Move the pointer to where you want to place the top left-hand corner of thebounding rectangle:
5 Press the mouse button and drag to the bottom right-hand corner of thebounding rectangle:
4-18 GeneTools User Manual
Using GeneTools for Spot blot analysis
6 Release the mouse button to place the new spot frame on the sample. Theframe will be drawn as the largest circle possible within the boundingrectangle. It will be drawn in the color for selected spot frames (you can useConfiguration in the Extras menu to set the color – see page 8-143) andlabeled with a number showing the order in which the frame was added.
Rectangular frames
(See also Adding a copy of a spot frame, page 4-20.)
To place a rectangular spot frame on a Spot blot sample:
1 If it isn’t already selected, choose Position any spot from the Spots menu tounlock the sample for placing and moving spot frames.
2 If All spots same size is selected in the Spots menu, choose the commandagain to deselect it.
3 If it isn’t already selected, choose Rectangle from the Spots menu.
4 Move the pointer to where you want to place the top left-hand corner of therectangle:
GeneTools User Manual 4-19
How to add and remove spot frames
5 Press the mouse button and drag to the bottom right-hand corner of therectangle:
6 Release the mouse button to place the new spot frame on the sample. Theframe will be drawn in the color for selected spot frames (you can useConfiguration in the Extras menu (see page 8-143) to set the color) andlabeled with a number showing the order in which the frame was added. Itwill have drag handles at its corners and at the middle of its sides so that youcan adjust its shape – see Adjusting the size and shape of rectangular spotframes, page 4-24.
Adding a copy of a spot frame
To add another frame of the same size as another frame (a default size if it is the firstframe) to a non-gridded sample:
1 If it isn’t already selected, choose Position any spot from the Spots menu tounlock the sample for changing spot frames.
2 Click in the spot frame that you want to copy to select it.
3 Double-click at the point you want to place the center of the new frame.
4-20 GeneTools User Manual
Using GeneTools for Spot blot analysis
A new frame with the same size and shape as the selected frame will be added at thepoint you double-clicked.
See How to adjust the spot frame positions, page 4-26, and How to adjust the size andshape of spot frames, page 4-21, for making further adjustments to the spot frames.
Removing spot frames
To remove a spot frame from a sample:
1 If it isn’t already selected, choose Position any spot from the Spots menu tounlock the sample for changing spot frames.
2 Click in the spot frame to select it.
3 Either:
Choose Delete from the Spots menu.
or
Press c.
After the spot frame has been removed, the numbers or letter/number pairs labeling the remaining frames will be changed so that they are still consecutive.
To remove all the spot frames from a sample:
1 If it isn’t already selected, choose Position any spot from the Spots menu tounlock the sample for changing spot frames.
2 Choose Delete all from the Spots menu.
How to adjust the size and shape of spot frames
Setting the size of all spot frames to the same size and shape
To set all the spot frames to the same size and shape as the selected spot frame:
Choose All spots same size from the Spots menu.
GeneTools User Manual 4-21
How to adjust the size and shape of spot frames
The shape and size of all the spot frames will be adjusted to match the selected spotframe.
While All spots same size is set, if you adjust the size or shape of an individual spotframe, all the spot frames will be adjusted to match them. If All spots same size is setwhen you locate spots automatically, the spot frames placed on the detected spots willall have the same size (see Adding spot frames automatically on page 4-16).
Changing between circular and rectangular spot frames
To make the selected circular frame rectangular or all frames rectangular if All spotssame size is set:
Choose Rectangle from the Spots menu to make a circular frame rectangular.
To make the selected rectangular frame circular or all frames circular if All spots samesize is set:
Choose Circle from the Spots menu to make a rectangular frame circular.
Adjusting the size of circular spot frames
You can adjust the size of circular spot frames using the mouse or a dialog box (apartfrom changing them to rectangular spot frames, you cannot change their shape).
Using the mouse
To adjust the size of one or all of the circular frames:
1 If it isn’t already selected, choose Position any spot from the Spots menu tounlock the sample for resizing spot frames.
Note You could also use Position control points to unlock the sample, but that would onlyallow you to change the size of the spots at the control points – see Adjusting thepositions of all the spot frames in a grid, page 4-26, to find out about control points.
4-22 GeneTools User Manual
Using GeneTools for Spot blot analysis
2 If required, set or unset All spots same size by choosing the command fromthe Spots menu – when All spots same size is set all the frames will beadjusted to the same size and shape; when it is unset, only the selected frame will be adjusted.
3 Click in the frame to select it – if All spots same size is set, you can selectany frame.
Drag handles will appear at the corners and in the middle of the sides of thesquare bounding the frame:
4 Move the pointer over a drag handle – it doesn’t matter which. The pointerwill change to a two-headed arrow showing the direction you can drag thehandle:
5 Drag the handle:
and drop it in its new position.
GeneTools User Manual 4-23
How to adjust the size and shape of spot frames
Using a dialog box
To change the size of one or all the circular frames on a sample:
1 If the sample is locked, choose Lock position from the Spots menu to unlock the sample.
2 Click on the spot frame that you want to adjust to select it – click on anycircular frame if you want to adjust them all.
3 Right-click in the image pane and choose Set radius from the context menudisplayed to display the Set spot radius dialog box:
4 Check Set all spots if you want to change the radius of all the (circular) spotframes; uncheck it if you just want to change the radius of the selected spotframe.
Note The initial Set all spots setting is fixed by the setting of the All spots same sizecommand in the Spots menu. If you change the setting of Set all spots in the dialogbox, All spots same size will be set or unset accordingly when you close it.
5 Use the arrow buttons to set the new radius.
6 Press OK to close the dialog box and set the new radius.
Adjusting the size and shape of rectangular spot frames
To adjust the size and shape of one or all of the rectangular frames:
1 If the sample is locked, choose Lock position from the Spots menu to unlock the sample.
2 If required, set or unset All spots same size by choosing the command fromthe Spots menu – when All spots same size is set all the frames will beadjusted to the same size and shape; when it is unset, only the selected frame will be adjusted.
4-24 GeneTools User Manual
Using GeneTools for Spot blot analysis
3 Click in the frame to select it – if All spots same size is set, you can selectany frame.
Drag handles will appear at the corners and in the middle of the sides of theframe:
4 Move the pointer over the drag handle that you want to adjust. The pointerwill change to a two-headed arrow showing the direction you can drag thehandle:
5 Drag the handle:
and drop it in its new position.
GeneTools User Manual 4-25
How to adjust the size and shape of spot frames
6 Repeat Steps 4 and 5 for any of the other handles you want to adjust.
How to adjust the spot frame positions
You can adjust the position of one frame at a time on any sample, but if the sample isgridded, you can also adjust the position of all the frames together.
Adjusting the position of a single spot frame
To adjust the position of a single spot frame:
1 If Position any spot is not selected already, choose Position any spot fromthe Spots menu to unlock the sample and allow individual spot movement.
2 Click in the frame that you want to move to select it.
3 Drag the frame to its new position (avoid dragging the drag handles).
Adjusting the positions of all the spot frames in a grid
When a sample is gridded (see Step 3 on page 4-4), you can adjust the position of allthe spot frames together.
There are several ways of doing this to achieve different results, but for all of them youwill need to set Position control points.
To unlock the grid for positioning all spot frames together:
If it isn’t already selected, choose Position control points from the Spotsmenu.
To move all of the spot frames in the grid together, you make one or more of theframes a ‘positioning point’.
To make a frame a positioning point:
Double-click in the frame.
4-26 GeneTools User Manual
Using GeneTools for Spot blot analysis
The positioning point will be identified by color (you can use Configuration in theExtras menu to set the color – see page 8-143).
Repeat the process to change the frame back to being a normal frame.
You can define up to three positioning points. If there are already three positioningpoints, you will need to remove one before adding another one. The following sectionsdescribe the effect of using one, two or three positioning points.
Moving the grid of spot frames without changing its shape or orientation
To move the grid of spot frames without changing its shape or orientation:
1 Define a single positioning point by double-clicking in a frame as above (ifthere is more than one positioning point, remove one or two until there isonly one left).
2 Drag the grid by the positioning point.
The whole grid of spot frames will move with the positioning point.
Note If you have moved any individual spot frames, they will be snapped back to their gridpositions as you move the positioning point.
Scaling and rotating the grid of spot frames without changing its shape
For this operation you define one positioning point to act as a fixed point in the gridand then define a second positioning point to drag the frame around the fixed point.
To adjust the pitch and orientation of the grid of spot frames without changing theshape:
1 Remove any existing positioning points by double-clicking on them.
GeneTools User Manual 4-27
How to adjust the spot frame positions
2 Define the first positioning point by double-clicking on the frame that youwant to act as a fixed point:
(The pointer is over the first positioning point in this example.)
3 Define the second positioning point by double-clicking on the frame that youwant to drag:
4 Drag the second positioning point to the required position.
4-28 GeneTools User Manual
Using GeneTools for Spot blot analysis
The grid will be scaled and rotated about the fixed positioning point:
Note that the shape of the grid has not changed – the rows are still at rightangles to the columns.
5 Drop the grid in its new position.
Note If you have moved any individual spot frames, they will be snapped back to their gridpositions as you move the positioning point.
Changing the shape of the grid of spot frames
For this operation you define two fixed positioning points in the grid and then define athird positioning point to drag the frame relative to the fixed points.
To adjust the shape of the grid of spot frames:
1 Remove any existing positioning points by double-clicking on them.
GeneTools User Manual 4-29
How to adjust the spot frame positions
2 Define the first positioning point by double-clicking on the first frame that you want to act as a fixed point:
3 Define the second positioning point by double-clicking on the second framethat you want to act as a fixed point:
4-30 GeneTools User Manual
Using GeneTools for Spot blot analysis
4 Define the third positioning point by double-clicking on the frame that youwant to drag:
5 Drag the third positioning point to the required position.
The grid will be reshaped about the fixed positioning points:
Note If you have moved any individual spot frames, they will be snapped back to their gridpositions as you move the positioning point.
GeneTools User Manual 4-31
How to adjust the spot frame positions
How to lock the spot frames on a sample
To lock the spot frames on a sample:
Choose Lock position from the Spots menu.
Lock position is checked in the Spots menu and the button is shown as depressed inthe toolbar when the frames are locked.
When the spot frames are locked, you cannot adjust their size, shape or position usingthe mouse or, in the case of non-gridded samples, delete them. However, you canchange them between circular and rectangular shapes, set all to the same size as theselected spot frame using All spots same size, and use automatic spot location.
To unlock the spot frames:
Choose Lock position from the Spots menu.
If the sample is gridded, either Position control points or Position any spot willbecome selected, depending on which was selected before the spot frames werelocked. For non-gridded samples, Position any spot will become selected.
The Spot frames are also unlocked if you choose Position control points or Positionany spot from the Spots menu.
How to show or hide identification labels on the spot frames
To show/hide identification labels on the spot frames:
Choose Spot numbers from the View menu.
Spot numbers is checked in the View menu when the labels are shown.
4-32 GeneTools User Manual
Using GeneTools for Spot blot analysis
How to set the quantity calibration method
To set or view the calibration method and units for quantity determination:
1 Choose Quantity calibration from the Edit menu to display the Quantitycalibration dialog box:
2 Choose the shape of calibration curve(s) from the drop-down list box. You can choose from:
● Linear through origin (single standard value)
● Linear (multiple standard values)
● Linear through origin (multiple standard values)
● Quadratic, or
● Quadratic through origin.
3 Enter your own quantity units in the Units box.
4 Press OK to save the new settings and close the dialog box.
Note If you select Linear through origin (single standard value), the calibration curve isdrawn through the origin and the last calibration point you have added – in otherwords, adding a new calibration point replaces the previous one. For the other types ofcurve, the calibration curve is drawn as the best fit for all the (relevant) calibrationpoints – adding a new calibration point contributes to (and does not replace) thecalibration from any previous points.
GeneTools User Manual 4-33
How to set the quantity calibration method
How to assign quantities to spot frames
To assign a quantity to a spot to calibrate quantity measurements from other spots:
1 Click on the spot frame for the spot to which you want to assign a quantity.
2 Choose Assign quantity from the Spots menu to display the Assigncalibrated quantity dialog box:
3 Enter the known quantity for the spot in the Calibrated quantity box.
4 Press OK to close the dialog box and set the calibration.
After you have assigned a quantity to a spot:
● The calibrated spot will be marked with a cross:
● The table on the Spot blot results page in the Spot blot/Manual band quantification window’s Results/Quantity calibration pane will be automatically updated to includethe calibrated quantities (the quantity you assigned will be shown in red).
● The Quantity calibration page in the Spot blot/Manual band quantificationwindow’s Results/Quantity calibration pane will show the calibration points and theselected calibration curve joining them (see page 4-33 for how to select the units
4-34 GeneTools User Manual
Using GeneTools for Spot blot analysis
and shape of calibration curve: the example shows a quadratic calibration curve –the equation of the curve is given in the Raw volume axis label):
How to apply background correction to results
To apply or remove background correction to the raw volume measurements from theimage:
1 Choose Background correction from the Spots menu to display theBackground correction dialog box:
2 Choose None, for no background correction, or Automatic or Manualbackground correction.
3 If you have selected None or Automatic, go to Step 7.
For Manual background correction, you need to specify areas in the imagefrom which the background readings should be taken – each spot result isthen corrected by the reading from the background area nearest to it.Steps 4–6 show you how to define the background areas.
GeneTools User Manual 4-35
How to apply background correction to results
4 With the Background correction dialog box still open, drag out a rectangleon the image in the first background area you want to define:
When you release the mouse button, the background area will be drawn with drag handles to show that it is selected:
5 If required, you can reshape and resize the background area by dragging thedrag handles, move it by dragging the area or remove it by pressing c.
Note These editing operations can be applied to any existing background areas if you click inthem while the Background correction dialog box is open.
4-36 GeneTools User Manual
Using GeneTools for Spot blot analysis
6 Repeat Steps 4 and 5 to define any other background areas you require:
Note GeneTools highlights the spots that will be corrected by the selected background area.In particular, if you move a background area, the highlighting will change accordingly as you move the area.
7 Press OK to close the dialog box and set the background correction method.
How to view Spot blot results
The Spot blot results are shown in the Spot blot results page in the bottom pane of the Spot blot/Manual band quantification window:
GeneTools User Manual 4-37
How to view Spot blot results
To choose what parameters to show in the Results table:
1 Right-click on the table to display the Spot blot results context menu:
2 Click on the required parameter in the list at the top of the menu to add it to or remove it from the Results table.
If the sample is gridded (see page 4-4), you can choose whether to display the results in a one- or two-dimensional table.
To choose whether to display Spot blot results in a one- or two-dimensional table:
1 Click on the Spot blot results tab.
2 Right-click in the table to display the Spot blot/Manual band quantificationwindow Results pane context menu.
3 Choose Table 1D or Table 2D.
The selected command will become checked in the menu.
4-38 GeneTools User Manual
Using GeneTools for Spot blot analysis
In a one-dimensional table, the results for the first row of spots are given first, then thesecond row and so on as in the example above. In a two-dimensional table, there is aseparate row for each row in the grid and a group of columns for each column:
How to define an incidence condition
To define an incidence condition for a Spot blot:
1 Choose Spot incidence parameters to display the Spot incidenceparameters dialog box:
2 Choose the parameter for which you want to set the incidence condition from the Incidence type drop-down list box – you can choose Raw vol, % Totalraw vol, Pixel area or Quantity.
3 Choose the comparison operation to be used from the Incidence value rangedrop-down list box – you can choose Greater than, Less than or Two-valuerange.
GeneTools User Manual 4-39
How to define an incidence condition
If you choose Two-value range, an additional box will appear in the dialogbox so that you can enter two values:
4 Enter the value(s) to be used for the comparison in the Incidence value(Upper Incidence value and Lower Incidence value) box(es).
Or:
a Click in a spot on the image to select it.
b Press Get spot value to transfer the Incidence type value for the selectedspot to the incidence value box.
5 Press Apply to set the incidence condition without closing the Spot incidence parameters dialog box (you will be able to view the effect if the Incidencepage is shown in the Results/Incidence/Calibration Graph pane).
Press OK to set the incidence condition and close the Spot incidenceparameters dialog box.
You can view the incidence matrix in the Incidence page in the Results/Incidence/Calibration Graph pane at the bottom of the Spot blot/Manual band quantificationwindow – see page 6-32.
4-40 GeneTools User Manual
Using GeneTools for Spot blot analysis
How to print and export Spot blot results
Printing Spot blot results
To choose what data to include in a Spot blot sample report:
1 With the Spot blot/Manual band quantification window selected, chooseReport setup from the File menu to display the Report setup dialog box:
Note If the paper selected for the currently selected printer is less than 150 mm in eitherdimension (for example if you are using a video printer), a simplified report containingthe image and some brief identification and image information will be printed. Thesettings in the Report setup dialog box have no effect on the content of this simplifiedreport.
2 Check the boxes for the items you want to include in the report – see theentry for Report setup in the Menus chapter, page 8-20, for details of theoptions.
3 If you are going to include the Results table, choose what columns to includeand whether it should be one- or two-dimensional – see page 4-37 for howto do this.
4 Choose Print Preview from the File menu to preview the report before it isprinted – see the entry for Print preview in the Menus chapter, page 8-26, for details.
GeneTools User Manual 4-41
How to print and export Spot blot results
5 Choose Print from the File menu (or press Print in the Preview window if it is displayed) to display the Print dialog box so that you can select print optionsbefore printing the report – this is a standard Windows dialog box.
6 After selecting any required options, press OK to close the dialog box andprint the report.
Exporting Spot blot results to Excel
To export Spot blot results to Excel:
1 Select the Spot blot results tab in the Spot blot/Manual band quantificationwindow’s lower pane.
2 If you want to change the columns shown in the table, right-click on the table to display the Results context menu and choose the required parameter toadd to or remove from the table.
3 Repeat Step 2 until the required columns are displayed.
4 Choose Export table to Excel from the File menu.
Unless you have already exported a table to Excel in the current session, Excel will beopened and a new workbook created.
The first sheet in the workbook will be named Image document data and will containthe secure sample’s file name, and data taken from the Information page of theSample properties dialog box.
The Spot blot results will be shown on a separate sheet.
If you have already exported a table to Excel in the current session:
● if the results table selected in the Results pane already exists in the workbook, theresults will be updated
● otherwise, a new sheet will be added for the new table and named accordingly.
Note 1 GeneTools identifies sheets in the workbook by their names. If you rename a sheet andexport the table again, a new sheet will be added for the table and the original sheetwill not be updated.
4-42 GeneTools User Manual
Using GeneTools for Spot blot analysis
Note 2 After you have exported a table to Excel in a session, GeneTools maintains a link to theworkbook it created but does not use the name of the workbook to identify it. Thismeans that you can save the workbook with another name if you wish. However, it also means that once you have exported a table to Excel, you should leave the workbookopen in Excel until after you have closed GeneTools.
Saving results in a comma separated values format file
To save results to a comma separated values text file:
1 Select the Spot blot results tab.
2 If you want to change the columns shown in the table, right-click on the table to display the Results context menu and choose the required parameter toadd to or remove from the table.
3 Repeat Step 2 until the required columns are displayed.
4 Choose Save table to CSV file to display the Save as CSV File dialog box:
This is a standard Windows Save As dialog box.
5 Use the dialog box to select a folder in which to save the CSV file.
6 Enter a File name for the CSV file.
GeneTools User Manual 4-43
How to print and export Spot blot results
7 Press Save to save the results in the file.
Copying a picture of an image to the clipboard
To copy a picture of the image in the Image pane in the current window to theclipboard:
Choose Save to clipboard from the File menu.
4-44 GeneTools User Manual
Using GeneTools for Spot blot analysis
Using GeneTools to count colonies
See Getting started with Colony counting section in the GeneTools Getting Startedmanual for full instructions on Using GeneTools to count colonies.
GeneTools User Manual 5-1
5-2 GeneTools User Manual
Using GeneTools to count colonies
Windows
You can display the following document windows in the main GeneTools applicationwindow:
● Sample windows:
● Gel window
● Colony counting window
● Spot blot/Manual band quantification window
● Molecular weight library window
● Profile comparison window.
This chapter describes how you use each of these.
The final sections in the chapter then describe how to use the image controls and theHistogram, which can be used with Gel, Colony counting and Spot blot/Manual bandquantification windows – see page 6-33.
GeneTools User Manual 6-1
Gel windows
When you open a Gel or High Throughput Gel sample it is displayed in a Gel window:
Note The layout of the Gel window depends on the electrophoresis direction. If the direction is horizontal, the Track label pane is to the left of the Image pane and the Profile andResults panes are below the Image pane.
6-2 GeneTools User Manual
Windows
Image pane Track labelpane
Descriptionpane
Peak valuepane
Profilepane
Graphics pane Results pane
Reset brightness
Image brightnessadjustment
ResetcontrastImage contrastadjustment
Resetgamma
Gamma correctionadjustment
Adjusting the panes in a Gel window
To change the size of individual panes in the window:
1 Move the pointer over the pane border: the pointer will change to adouble-headed arrow:
2 Press and drag the border to a new position.
To maximize the Graphics or Results pane so that it fills the Gel window:
1 Click in the pane to select it.
2 Choose Maximize pane from the View menu or the menu displayed whenyou right-click in the pane.
To return the pane to its normal size:
Choose Maximize pane again.
Or
Adjust the size of the Gel window.
Track label pane
The Track label pane shows:
● A number identifying each track
● Whether the track is enabled (black label) or disabled (gray label) – see the entriesfor Enable and Disable on the Track menu in the Menus chapter (page 8-100)
● The label MwS, QuS or MQS if the track is defined as a molecular weight, quantityor molecular weight and quantity standard – see the entry for MW/quantitystandard on the Track menu in the Menus chapter (page 8-94)
● The label MS if the track is defined as a matching (but inactive) standard – see theentry for Matching standard on the Track menu in the Menus chapter (page 8-95).
GeneTools User Manual 6-3
Gel windows
● The label MS* if the track is defined as the active matching standard – see the entryfor Active matching standard on the Track label context menu in the Menuschapter (page 8-149).
Note If there is more than one area of interest, the Track label pane shows these details forthe selected area of interest.
You can right-click in the Track label pane to pop up a menu of commands for workingwith the selected track. All the commands on this menu can also be chosen from theTrack menu apart from the additional Active matching standard command.
Description pane
The Description pane shows a description of the selected track – use Description in the Tracks menu to enter or edit the description (see page 8-100).
Image pane
The Image pane shows the gel or High Throughput Gel image. See Image Controls,page 6-33, for how to adjust the brightness and contrast for monochrome images.
View modes
When the tracks are locked in all areas of interest, you can choose whether the Imagepane should display the original gel image with tracks marked on the image or displaythe tracks in aligned banks (see below for an explanation).
To switch aligned banks of tracks view on or off:
Choose Align banks of tracks from the View menu.
The command is checked in the menu when the Image pane shows banks of tracks.
When the Image pane shows banks of tracks, the image area within each track is cutout and, if it is skewed, transformed so that it is rectangular (see the note following theexample pictures). The cut out tracks within each area of interest are then arranged in a horizontal bank of tracks with the tops aligned. The banks corresponding to the different areas of interest are then arranged one above the other.
6-4 GeneTools User Manual
Windows
For example:
Align banks of tracks off Align banks of tracks on
Note The transformation of the track image to a rectangle is for display purposes only; allanalysis is performed using the original image.
Viewing the tracks in aligned banks is particularly useful for High Throughput Gelsamples and is automatically selected when you lock a High Throughput Gel sample,though you can deselect it if required.
When aligned banks of tracks view is on, the only way to unlock the tracks is usingPosition all in the Track menu or the Position all button. Unlocking the tracks in anyarea of interest switches aligned banks of tracks view off.
Working in the Image pane
You can change the magnification of the image by choosing Zoom in, Zoom out orZoom reset from the View menu or by clicking on the equivalent tools in the Zoomtoolbar.
GeneTools User Manual 6-5
Gel windows
For most gels, you can allow GeneTools to locate the tracks and peaks on the imagecompletely automatically (see the entry for Configuration in the Menus chapter,page 8-139, for how to set GeneTools automatic modes), but you can also edit theresults or carry out these operations manually, or semi-automatically (see the entries forthe commands in the Track and Peak menus in the Menus chapter, pages 8-72 and8-104, for details).
Note You can use automatic peak location but not automatic track location with HighThroughput Gel samples.
You can also choose what information to superimpose on the image (see the entries forthe commands in the View menu in the Menus chapter (page 8-63) for details).
If you right-click near a peak in the Image pane, a menu will pop up with commandsfor working with the selected peak – all the commands can also be chosen from thePeak menu, except for the Edit manual baseline and Delete manual baselinecommands, which can be chosen from the Track menu.
Profile pane
The Profile pane shows the profile measured from the track selected in the Image pane.
Once peaks have been located, it also shows the position of the peaks and peakbounds – see How to locate and edit peaks on a track in the Using GeneTools for Gelanalysis chapter (page 1-59) for more information on working with peaks.
You can right-click on a peak in the Profile pane to pop up a menu of commands forworking with the selected peak – all the commands can also be chosen from the Peakmenu except for the Edit manual baseline and Delete manual baseline commands,which can be chosen from the Track menu.
Peak value pane
The Peak value pane shows:
● Quantities for the peaks in the selected track if Quantities is selected in the Viewmenu.
● Molecular weights for the peaks in the selected track if Molecular weight is selected in the View menu.
● Peak positions for the active matching standard if Peak matching is selected in theView menu.
6-6 GeneTools User Manual
Windows
If a molecular weight standard track is selected when the Peak value pane is showingmolecular weights, only the assigned molecular weights are shown. You can unassign orreassign these molecular weights in the Peak value pane.
Graphics pane
The Graphics pane can show:
● The molecular weight calibration
● The quantity calibration
● The dendrogram.
Each of these is described in more detail later in this section.
Note If there is more than one area of interest, the Graphics pane shows these details for theselected area of interest.
To select the required graphical display:
Click on the tab for the graph (you may have to use the scroll bar if the tabyou want is not visible).
Or
Choose Molecular weight, Quantities or Peak matching from the Viewmenu.
The Graphics pane is linked to some of the other panes in the Gel window:
● Displaying the molecular weight calibration graph displays molecular weights in thePeak value pane. The Image pane will show peaks in molecular weight standardtracks with a short line across the peak marker if they have been assigned amolecular weight.
● Displaying the quantity calibration graph displays quantities in the Peak value paneand in the Image pane shows peaks that have been assigned a volume with a shortline across the peak marker.
● Displaying the dendrogram displays matching comparisons in the Results pane andthe peak values of the active matching standard in the Peak value pane. ProvidedMatch lines is selected in the View menu, the Image pane will show matching linesbetween matching peaks.
GeneTools User Manual 6-7
Gel windows
Note If profile matching is selected in the Matching parameters dialog box (see Setting themethod and parameters used for matching, page 1-107), the matching comparisonspane will be blank and there will be no matching lines between peaks in the Imagepane.
Similarly, displaying matching comparisons or the matching matrix in the Results panedisplays the dendrogram in the Graphics pane.
See Adjusting the panes in a Gel window, page 6-3, for how to maximize the Graphicspane.
The molecular weight calibration graph
The molecular weight calibration graph is displayed in the Gel window’s Graphics pane:
When a molecular weight standard track is selected in the Image pane, the calibrationpoints are shown on the graph.
You can choose the shape of the calibration curve and how the calibration should bepropagated to other tracks – see the entry for Molecular weight calibration in theMenus chapter, page 8-50.
You create the calibration graph by assigning molecular weights to peaks in one or more tracks that you have defined as molecular weight standards – see the entries forMW/quantity standard, page 8-94, and Assign molecular weight in the Menuschapter, page 8-104.
6-8 GeneTools User Manual
Windows
The quantity calibration graph
The quantity calibration graph is displayed in the Gel window’s Graphics pane:
You can choose the shape of the calibration curve, how the calibration should bepropagated to other tracks and the quantity units to use – see the entry for Quantitycalibration in the Menus chapter, page 8-52.
The equation of the line or curve is shown in the Raw volume axis label along with thecorrelation coefficient (R), which is a measure of how well the calibration points can be fitted by a line or quadratic curve, depending on the selected calibration method (avalue of 1 means a perfect fit).
The example shows a quadratic calibration; the calibration points don’t quite lie on thecurve so the R value is slightly less than 1.
The graph shows data points for all the calibration peaks (in the selected region ofinterest), not just the calibration peaks on the selected track. The graph also shows anynon-calibration peaks in the selected track. Calibration data points are marked by ;non-calibration points by . Non-calibration points always lie on the calibration curve;calibration points may not lie exactly on the calibration curve.
When you display the quantity calibration graph, the Peak value pane displaysquantities for the peaks on the track selected in the Image pane.
GeneTools User Manual 6-9
Gel windows
You create the calibration graph by assigning quantities to one or more peaks in one ormore tracks – see the entries for MW/quantity standard, page 8-94, and Assignquantity in the Menus chapter, page 8-110.
The dendrogram
Dendrograms are a graphical technique for displaying track similarity based on matching information. They represent hierarchical relationships using a tree-like structure, wherethe branch lengths represent the similarity between tracks. The shorter the branchlengths, the more similarly matched are the tracks.
Tracks are compared in pairs, starting with the two most similar. These two are thentreated as one and compared to the other tracks. This process is then continued for allthe tracks in the series. There are a number of different ways to calculate dendrogramsdepending on the linkage rule used. In GeneTools you can use the Matchingparameters dialog box (see Setting the method and parameters used for matching,page 1-107) to choose between using either:
● UPGMA
In the Unweighted Pair-Group Method Average the distance between two clusters iscalculated as the arithmetic mean of the distances between all items in the twoclusters.
● Neighbor joining
The ‘neighbor-joining method’ was devised by Saitou and Nei (see TheNeighbor-joining Method: A New Method for Reconstructing Phylogenetic Trees byNaruya Saitou and Masatoshi Nei, in Mol. Biol. Evol. 4 (4) 406-425). Quoting fromthe abstract to this paper:
A new method called the neighbor-joining methods is proposed for reconstructingphylogenetic trees from evolutionary distance data. The principle of this method is to find pairs of operational taxonomic units (OTU’s [=neighbors]) that minimizethe total branch length at each stage of clustering of OTU’s starting with a starliketree. The branch lengths as well as the topology of a parsimonious tree canquickly be obtained using the method.
(See also Molecular phylogenetic analysis by Georg F. Weiller, Marcella A. McClureand Adrian Gibbs in: Molecular Basis of Virus Evolution Eds. A. Gibbs, C. H. Calisherand F. Garcia-Arenal, Cambridge University Press.)
The neighbor-joining method can be used when evolution across the tree isexpected to be non-constant. At each stage of clustering the total branch length is
6-10 GeneTools User Manual
Windows
minimized. The distance between two items is approximately the sum of the branchlengths between them. The trees are not right-aligned and branches can havenegative values.
Dendrogram display
When you match tracks on a Gel sample, GeneTools automatically creates adendrogram and displays it in the Gel window’s Graphics pane (a dendrogram is alsodisplayed in the Profile comparison window if you use it to carry out a matching – seeProfile comparison window, page 6-18). The choice of linkage rule affects the way thedendrogram is displayed (as well as the values calculated). For example:
● UPGMA
The UPGMA dendrogram is right-aligned and drawn against a scale, which is shownalong the top of the pane.
GeneTools User Manual 6-11
Gel windows
● Neighbor joining
The Neighbor-joining dendrogram is not right-aligned and the lengths of theindividual branches are shown on the lines themselves.
If required, you can change the colors used for the Neighbor-joining dendrogram nodes and leaves – see page 8-143 for details.
If the dendrogram is larger than the Graphics pane, you can increase the size of thepane, scroll the dendrogram to view hidden parts or scale the dendrogram to fit theGraphics pane.
To scale the dendrogram to fit the Graphics pane:
1 Right-click in the dendrogram to display the dendrogram context menu.
2 Choose Scale to fit.
The dendrogram will be scaled to fit the Graphics pane:
● Scale to fit is checked in the dendrogram context menu when autoscaling isselected; choose the command again to switch autoscaling off.
● When Scale to fit is selected, if you resize the Graphics pane, the dendrogram willbe rescaled so that it still fills the pane.
6-12 GeneTools User Manual
Windows
For the Neighbor-joining dendrogram you can choose which node in the tree to display at the root of the dendrogram.
To choose a different node to be the root of a Neighbor-joining dendrogram:
Click on the node in the dendrogram:
The dendrogram will be redisplayed with the selected node at the root:
Note that this only affects the way the tree is displayed – the correlation values andconnectivity of the tree are unaffected.
GeneTools User Manual 6-13
Gel windows
Results pane
See Adjusting the panes in a Gel window, page 6-3, for how to maximize the Resultspane.
The Results pane can show:
● the results for the track selected in the Image pane:
See the next section for how to choose what information to include in the table.
● the results for all tracks (in the selected area of interest):
See the next section for how to choose what information to include in the table.
● a table of matching comparisons (for the selected area of interest):
6-14 GeneTools User Manual
Windows
See the next section for how to choose what information to include in the table.
Note The matching comparisons table is blank if there is no active matching standard track. In particular, it is always blank if Profile is selected as the matching type in the Matchingparameters dialog box (see Setting the method and parameters used for matching,page 1-107).
● a matching matrix showing which peaks on the matching standard are matched oneach of the matched tracks (for the selected area of interest):
Note The matching matrix table is blank if there is no active matching standard track. Inparticular, it is always blank if Profile is selected as the matching type in the Matchingparameters dialog box (see Setting the method and parameters used for matching,page 1-107).
● a similarity matrix of matching coefficients showing the correlation between matching peaks on different tracks (for the selected area of interest):
See Similarity matrix, page 1-114, for information about how the matching coefficientsare calculated.
GeneTools User Manual 6-15
Gel windows
● for High Throughput Gels (Madge or E-Gel), a manual matching table allowing youto assign a matching result manually to each of the tracks:
To change the matching result for a track:
1 Click in the track frame to select it.
Note You can change the matching results at any time: the sample can be locked orunlocked, and if unlocked, it can be in any track editing mode.
2 In the numeric keypad, press:
+ to assign a matching result of +1 to the track
- to assign a matching result of 0 to the track
* to assign a matching result of -1 to the track (this is the default).
3 If required, press vto tab to the next track to set its matching result.
Choosing what information to show in results tables
To choose what information to include in the Results for selected track, Results for all tracks and Matching comparisons tables:
1 Click on the tab for the table you want to change.
2 Right-click on the table to pop up a menu.
3 Choose the parameter to add to or remove from the table.
4 Repeat for any other parameters you want to add or remove.
The commands for the parameters included in the table are checked in the menu.
6-16 GeneTools User Manual
Windows
Molecular weight library window
A molecular weight library is a collection of molecular weight/quantity standards. Eachstandard lists the molecular weights and/or quantities for a set of peaks. You use thelibrary to calibrate a gel by assigning one of the standards contained in the library toone or more standard tracks in the gel. If you use the same standard solution fordifferent gels, using a molecular weight library saves you entering the molecularweights/quantities individually for each peak in the standard tracks.
Note You can create as many other molecular weight libraries as you wish (see the entry forNew library in the File menu in the Menus chapter – page 8-13), but you can onlyhave one open at a time – see the entry for Open library in the Menus chapter,page 8-14. When you start up GeneTools, the default molecular weight library isopened automatically – see Setting the default molecular weight library, page 1-98, forhow to specify the default library.
Molecular weight libraries can be viewed and edited in the Molecular weight librarywindow:
GeneTools User Manual 6-17
Molecular weight library window
In this example, the library MwLibrary.mwl contains two standards added by the user(1 Cal test containing quantities only and 10 Cal test containing quantities andmolecular weights) in addition to the molecular weight standards 100bp ladder, 1kbladder, BRL-100bp, BRL-10bp etc, which are supplied with GeneTools.
You can expand or contract the display of each standard in the window to show or hide its list of peak values. For example, the display of 100bp ladder is expanded in thepicture above, but 1kb ladder is contracted.
To expand the display of a standard:
Click on the + to the left of the standard’s name.
To contract the display of a standard:
Click on the - to the left of the standard’s name.
To close the Molecular weight library window:
1 Click in the window or choose it from the list at the bottom of the Windowmenu.
2 Choose Close from the File menu.
Clicking on the close button at the top right-hand corner of the Molecular weight library window only minimizes the window.
See Working with molecular weight libraries, page 1-92, for further details.
Profile comparison window
The Profile comparison window allows you to compare the profiles on different tracks(and different gels) by plotting them on the same axes. Additionally, if you havepurchased the GeneTools Match software option, you can use the Profile comparisonwindow to perform track matching between tracks, which may be in the same ordifferent areas of interest, or even on different gels.
To display the Profile comparison window:
Choose Profile comparison from the View menu.
6-18 GeneTools User Manual
Windows
The Profile comparison window will open. The appearance of the window depends on whether the GeneTools Match software option is installed:
GeneTools Match software option not installed
GeneTools Match software option installed
The Track browser pane (the left-hand pane) shows the path and filenames for all theopen Gel windows and allows you to select which tracks to include in the comparison.
The Profiles pane (the right-hand pane for systems without the GeneTools Matchsoftware option; the center pane for systems with it) is used to plot the intensity profiles for the selected tracks.
GeneTools User Manual 6-19
Profile comparison window
The Match results pane (the right-hand pane for systems with the GeneTools Matchsoftware option; absent for systems without it) contains the similarity matrix anddendrogram tabs showing the matching results.
Viewing tracks
To view the tracks in the secure sample file(s) in the Track browser pane so that you can select them for comparison or matching:
Click on the + icon(s) next to the secure sample file(s) (or double-clickanywhere else in the row):
to show the tracks in the file:
(Click on the - icon or double-click again anywhere else in the row to hidethe tracks in the left-hand pane.)
Selecting tracks for a comparison
To choose which tracks to include in a comparison:
1 In the Track browser pane, click on the first track that you want to include inthe comparison.
6-20 GeneTools User Manual
Windows
2 Choose Show from the Profile menu (or the menu displayed if you right-click on the track).
Or:
Just double-click on the track.
Or, to include all the tracks in a comparison:
Choose Show all from the Profile menu.
Show will be checked in the menu when a profile is shown, a line showing the colorused for drawing the profile will be shown next to the track in the left-hand pane andthe profile will be drawn in the right-hand pane.
(Choosing Show again for the same track, or double-clicking again, removes the trackfrom the comparison; choosing Hide all from the Profile menu removes all tracks fromthe comparison.)
Viewing profiles
After you have selected Show, the corresponding profile will be displayed in the Profiles pane:
(In the example all the profiles are for tracks on the same gel, but you can use the same procedure to include tracks from different files if you wish).
GeneTools User Manual 6-21
Profile comparison window
The profiles in the Profiles pane are drawn in the colors shown by the colored linesnext to the tracks in the Track browser pane. You can use Configuration in the Extrasmenu to define the color for each of the profile lines – see page 8-143.
The vertical scale shows the image gray level. The default horizontal scale is the Rf value from 0, the Rf start position, to 1, the Rf end position (see Adjusting the Rf start and end positions, page 1-43, for how to set these), but if you have assigned molecular weightsto a standard track, you can also use (log) molecular weight for the horizontal scale.
Note If the Band matching option is installed in your system, the parameter chosen for thehorizontal scale also determines the alignment used when matching tracks in the Profile comparison window.
To choose whether to use Rf or (log) molecular weight for the horizontal scale forplotting profiles in the Profile comparison window:
Choose MW or Rf from the View®Plot mode submenu.
Note If you choose MW and have not yet assigned molecular weights to a standard track, the profile plot will be blank – see Assigning molecular weights/quantities to a standardtrack, page 1-79.
You can change the magnification of the horizontal scale in the Profile comparisonwindow by choosing Zoom in, Zoom out or Zoom reset from the View menu, or byclicking on the equivalent tools in the Zoom toolbar. When you have zoomed theProfile comparison window, only part of the Rf/MW range is visible, but you canchoose which part to view using the horizontal scroll bar.
Setting a reference track
Note If the Band matching option is installed in your system, the reference track will also beused as the Matching standard track for peak matching comparisons – see the followingsection for details.
6-22 GeneTools User Manual
Windows
To highlight one of the tracks in the comparison as a reference:
Select the track and choose Reference from the Profile menu (or the menudisplayed if you right-click on the track):
Track 4 in the example is the reference track – it is highlighted in the Track browserpane and (by default) plotted in red in the profiles pane (you can use Configuration inthe Extras menu to define the color used for the reference line – see page 8-143).
If you repeat this operation, the new track will become the reference – only one trackin a comparison can be defined as the reference track.
If the track you define as the reference is not already included in the comparison, it will become shown in the comparison automatically. However, you can remove it from thecomparison if required without it losing the status of being the reference – if you showit again, it will still be the reference, provided you have not chosen another track as the reference meanwhile.
Matching tracks in the Profile comparison window
If you have purchased the GeneTools Match software option, you can match tracks inthe Profile comparison window as well as in Gel windows (see How to match peaks on different tracks, page 1-105, for how to match tracks in Gel windows). The two methods share many features, but one difference between the two techniques is that in a Gelwindow, you can only match peaks on tracks that lie within the same area of interest,while in the Profile Comparison window you can match tracks lying in different areasof interest, or even on different gels. On the other hand, if you match peaks in a Gel
GeneTools User Manual 6-23
Profile comparison window
window, you can get more detailed results in the form of the matching comparisonstable and the similarity matrix, and you can edit matchings manually.
To choose how the matching should be performed:
Choose Parameters from the Matching menu to display the Matchingparameters dialog box – see Parameters, page 8-118, for details.
In particular, you can choose whether to match bands (peaks) or profiles. When youmatch peaks, the detected peaks on each track are matched to the detected peaks on a selected matching reference track, so to carry out band matching, you must detect thepeaks on the tracks and select a reference track (see previous section); neither of thesesteps is required for profile matching.
To choose which tracks to include in a match:
1 In the Track browser pane, click on the first track that you want to include inthe match.
2 To add a single track to the matching:
Choose Include selected in matching from the Matching menu (or thecontext menu displayed if you right-click on the track).
(Choosing Include selected in matching again for the same track removes the track from the matching.)
Or, to include all the tracks in a matching:
Choose Include all from the Matching menu.
(To remove all of the tracks from the matching, choose Exclude all fromthe Matching menu.)
You must include at least three tracks in the matching – the tracks may be selected from the same gel or different gels. If you have chosen to carry out band matching in theMatching parameters dialog box, you must also select a reference track – see previoussection.
6-24 GeneTools User Manual
Windows
Matching results
When you have included at least three tracks in the matching, and selected a reference track if you have chosen to carry out band matching in the Matching parametersdialog box, the matching is carried out automatically and the results displayed in theMatch results pane. The pane has two tabs:
● Similarity matrix
● Dendrogram
You can work with these results panes in exactly the same way as in the Gel window –see The Results pane, page 6-14, and The Dendrogram, page 6-10, for details.
Other Profile comparison window operations
See Printing reports – Profile comparisons, page 1-129, for how to print a reportshowing a Profile comparison.
You can display a dialog box showing the properties of a track by selecting the track inthe left-hand pane of the Profile comparison window and choosing Properties from
GeneTools User Manual 6-25
Profile comparison window
the Profile menu – see page 8-119 for details; see page 8-102 for pictures of the dialog box.
You can export the data points (Rf and height values) to Excel for a track byright-clicking on the track in the left-hand pane of the Profile comparison window topop up a menu and choosing Export To Excel – see page 8-150.
Colony counting window
When you open a Colony counting sample it is opened in a Colony counting window:
For a monochrome image you can use the image controls on the right-hand side of thewindow and the Histogram viewer to control the display of the image – see pages6-33–6-35 for instructions.
GeneTools automatically counts the colonies within an elliptical frame on the image.You can move, reshape and resize the frame as required, and the results will beupdated automatically. You can also define exclude regions on the image where
6-26 GeneTools User Manual
Windows
GeneTools will ignore any colonies. You use the radio buttons in the Define frame boxto select the mode for adjusting the frame or for drawing or adjusting exclude regions.
The controls in the Auto-detection box allow you to set the parameters used by thecolony detection software. You can also choose whether to highlight the areas of theimage detected as colonies using the Show colony shapes check box at the bottomleft-hand corner of the window.
The results are displayed in the results table in the Results box at the left-hand side ofthe Colony counting window. When the sample contains light or dark colonies only (but not both), you can use the Histogram in the Results box to define a boundary between two classes of colonies (light and lighter or dark and darker). When the sample containsboth light and dark colonies, the Histogram is not displayed but the totals for dark andlight colonies are shown separately as Class 1 and Class 2. The colonies of each classare marked separately on the image: dark colonies are marked with circles and lightcolonies with squares:
If you select Add/remove colonies in the Define frame box you can add or removecolonies from the count by double-clicking on the image – the Manual Detection radio buttons will be enabled so that you can choose which class of colonies to add orremove.
See Getting started with Colony counting in the GeneTools Getting Started manual forfull instructions on using GeneTools to count colonies.
GeneTools User Manual 6-27
Colony counting window
Spot blot/Manual band quantification window
When you open a Spot blot or Manual band quantification sample it is displayed in aSpot blot/Manual band quantification window:
The picture shows a gridded Spot blot sample (see Step 3 on page 4-4): the windowcan also show non-gridded Spot blot samples with circular and/or rectangular spotframes (for further details, see chapter 4 – Using GeneTools for Spot blot analysis), andManual band quantification samples with rectangular measurement boxes (for furtherdetails, see Getting started with Manual band quantification in the GeneTools GettingStarted manual).
6-28 GeneTools User Manual
Windows
For a monochrome image you can use the image controls on the right-hand side of thewindow and the Histogram viewer to control the display of the image – see pages6-33–6-35 for instructions.
The Spot blot/Manual band quantification window is split into two parts:
● The Image pane
● The Results/Incidence/Calibration graph pane.
You can adjust the position of the split in the same way as for the Gel window (seepage 6-3).
Image pane
The upper part of the Spot blot/Manual band quantification window shows the Spotblot or Manual band quantification image.
You can change the magnification of the image by choosing Zoom in, Zoom out orZoom reset from the View menu or by clicking on the equivalent tools in the Zoomtoolbar.
For a Spot blot sample, you can use GeneTools to locate a grid of circular spot framesover the spots on the sample, or place individual circular or rectangular frames; for aManual band quantification sample, you can place rectangular or free hand boxes overthe bands.
The spot frames and boxes define the area within which GeneTools measures quantities from the spots or bands. You can move the frames or boxes (see page 4-26) and resizethem (see page 4-21). For Spot blot samples, you can change the shape of the framesfrom circular to rectangular and vice versa.
The spot frames or boxes on the image are identified by labels:
● If a Spot blot sample is gridded, the label consists of a letter identifying the row anda number identifying the column in the grid.
● If the sample is a Manual band quantification sample or a non-gridded Spot blotsample, the label is a number that shows the order in which the spot frames orboxes were added.
You can select a spot frame or box by clicking on it. The selected frame or box isidentified by color (you can use Configuration in the Extras menu to set the color – see page 8-143).
GeneTools User Manual 6-29
Spot blot/Manual band quantification window
For a gridded Spot blot sample, if Position is selected in the Spots menu, you candouble-click on a spot frame to set it as a ‘positioning point’; double-click again tounset it. Positioning points are identified by color (you can use Configuration in theExtras menu to set the color – see page 8-143). When you drag a positioning point,you adjust the position of the other spot frames, not just the selected frames. You canset more than one positioning point – any other positioning points act as fixed anchorsfor the grid when you drag a positioning point. See How to adjust the spot framepositions, page 4-26, for how to move the spot frames on the image.
When you assign a quantity to a spot frame or box to calibrate quantity measurements,the frame or box is marked with a cross:
or
6-30 GeneTools User Manual
Windows
Results/Incidence/Calibration graph pane
Results page
Click on the Spot blot results (or Manual band quantification results) tab to displaythe results page in a Spot blot/Manual band quantification window.
To choose what parameters to show in the Results table:
1 Right-click on the table to display the Spot blot results context menu:
2 Click on the required parameter in the list at the top of the menu to add it to or remove it from the Results table.
If a Spot blot sample is gridded, you can choose whether to display the results in a one- or two-dimensional table (Manual band quantification results and non-gridded Spot blot results are always displayed in a one-dimensional table).
To choose whether to display Spot blot results for a gridded Spot blot sample in a one-or two-dimensional table:
1 Click on the Spot blot results tab.
2 Right-click in the table to display the Spot blot/Manual band quantificationwindow Results pane context menu.
3 Choose Table 1D or Table 2D.
The selected command will become checked in the menu.
In a one-dimensional table, the results for the first row of spots are given first, then thesecond row and so on.
GeneTools User Manual 6-31
Spot blot/Manual band quantification window
Incidence page
Click on the Incidence tab to display the Incidence page in a Spot blot/Manual bandquantification window:
The picture shows the Incidence page for a gridded Spot blot sample (see Step 3 onpage 4-4). For non-gridded Spot blot samples and Manual band quantification samplesthe matrix consists of a single column.
The matrix shows whether each spot or box satisfies an incidence condition definedusing Spot incidence parameters in the Spots menu – see How to define an incidencecondition, page 4-39.
Quantity calibration page
Click on the Quantity calibration tab to display the Quantity calibration page in aSpot blot/Manual band quantification window:
The graph shows the points corresponding to all the spot frames or boxes on the image(not just the calibration points).
6-32 GeneTools User Manual
Windows
You can choose the shape of the calibration curve and the units – see How to set thequantity calibration method, page 4-33.
You create the calibration graph by assigning quantities to one or more spot frames orboxes on the image – see page 4-34.
Image controls
For a monochrome image the image controls on the right-hand side of Sample windows allow you to control the way the image is displayed on the screen and the way it isprinted in reports (see the next section for how to use the Histogram viewer as analternative for changing the way the image is displayed).
Note 1 The settings of the image controls have no effect on the way GeneTools analyzes theimages (for example when it locates tracks and peaks, or measures quantities) –GeneTools always uses the original data for analysis.
Note 2 The image controls do not appear if the window contains a full color image.
To adjust the brightness of the image:
Drag the Image brightness slider control.
To restore the original image brightness:
Press the Reset brightness button.
To adjust the contrast of the image:
Drag the Image contrast slider control.
To restore the original contrast brightness:
Press the Reset contrast button.
To adjust the gamma correction of the image:
Drag the Gamma correction slider control.
GeneTools User Manual 6-33
Image controls
To restore the original gamma correction for the image:
Press the Reset gamma correction button.
Note Gamma correction allows you to adjust the midtones in an image without changing thelightest and darkest tones – it determines the shape of the response curve between theblack and white points, which are fixed by the brightness and contrast settings.
The Histogram viewer
To show or hide the Histogram viewer:
Choose Histogram from the View menu.
The Histogram viewer displays a histogram showing the distribution of intensities in theimage:
The horizontal axis shows the possible intensity values in the image from 0 to themaximum (the example is taken from an 8-bit image so the maximum intensity is 255;the maximum for a 16-bit image would be 65535, and so on).
The Histogram viewer displays two vertical red cursor lines on the histogram. These arethe black and white value cursors – pixels in the image with the intensity value at oroutside the black value cursor will be shown as black on the screen; pixels with theintensity value at or outside the white value cursor will be shown as white on thescreen; pixels with values between the cursors will be shown in tones of grayintermediate between black and white.
Note The exact relationship between the intensity value and the gray tone for pixels withvalues lying between the cursors is determined by the gamma correction value.
6-34 GeneTools User Manual
Windows
To adjust the image display using the Histogram viewer:
1 Move the pointer over the black or white value cursor, depending on whichone you want to move. The pointer will change shape to show that you canmove the cursor:
2 Drag the cursor to its new position:
In this example the black value cursor has been dragged to the lowest intensity valueactually appearing in the image, so pixels with this value will now be shown in blackrather than dark gray – the effect is to increase the contrast without losing anyinformation. In general, you can adjust the position of the cursors to expand thecontrast to show details of interest.
Dragging the black or white value cursor is equivalent to a combination of adjusting thecontrast and brightness sliders – you can see the sliders adjust as you drag a cursor.Similarly, adjusting the contrast or brightness slider is equivalent to a combination ofdragging the black and white value cursors – again you can see the cursors adjust as you drag a slider.
To reset the brightness and contrast:
Double-click in the Histogram viewer.
GeneTools User Manual 6-35
Image controls
6-36 GeneTools User Manual
Windows
Toolbars
GeneTools has a number of toolbars with buttons that provide shortcuts to using menucommands. GeneTools automatically shows and hides the toolbars depending on whattype of window is selected. However, you can also show or hide toolbars manually.
To show or hide a toolbar:
Choose the toolbar’s name from the View®Toolbars submenu.
The command is checked in the menu when the toolbar is shown.
The rest of this chapter summarizes the function of each button.
The Standard toolbar
The Standard toolbar is always displayed.
Open
Press the Open button to open a secure sample file.
Pressing the Open button is equivalent to choosing Open from the File menu.
Save
Press the Save button to save the secure sample file in the selected Samplewindow or molecular weight library in the selected library window.
Pressing the Save button is equivalent to choosing Save from the File menu.
GeneTools User Manual 7-1
Help
Press the context-sensitive Help button to display Help for a menu command,button or window area.
When you press the context-sensitive Help button, the pointer changes to a questionmark. Use this pointer to select a menu command, or click on a button or window area to display the help.
Sample properties
Press the sample properties button to view or edit the settings and notes for asecure sample file.
Pressing the sample properties button is equivalent to choosing Sample properties from the File menu.
Report toolbar
The Report toolbar is displayed when any Sample window or the Profile Comparisonwindow is selected.
Report setup
Press the Report setup button to choose what information to print in Samplereports.
Pressing the Report setup button is equivalent to choosing Report setup from the Filemenu.
Preview
Press the Preview button to preview a report on the contents of the selectedwindow before it is printed.
Pressing the Preview button is equivalent to choosing Preview from the File menu.
7-2 GeneTools User Manual
Toolbars
Print
Press the Print button to print a report on the contents of the selected window.
Pressing the Print button is equivalent to choosing Print from the File menu.
Export table to Excel
Press the Export table to Excel button to export the contents of the selectedResults pane page to Excel.
Pressing the Export table to Excel button is equivalent to choosing Export table to Excelfrom the File menu.
Save table to CSV file
Press the Save table to CSV file button to export the contents of the selectedResults pane page to a comma separated values format file.
Pressing the Save table to CSV file button is equivalent to choosing Save table to CSVfile from the File menu.
Export to Word
Press the Export to Word button to create a report in a Word document.
Pressing the Export to Word button is equivalent to choosing Export to Word from theFile menu.
Save to clipboard
Press the Save to clipboard button to copy a picture of the image in the Imagepane in the current window to the clipboard.
Pressing the Save to clipboard button is equivalent to choosing Save to clipboard fromthe File menu.
GeneTools User Manual 7-3
Report toolbar
Track toolbar
The Track toolbar is displayed when a Gel window is selected (some tools are disabledwhen the window contains a High Throughput Gel sample).
Locate tracks
Press the Locate tracks button to locate the tracks automatically in the selectedarea of interest on the image in the selected Gel window.
Pressing the Locate tracks button is equivalent to choosing Locate tracks from the Trackmenu.
Lock all
Press the Lock all button to lock the tracks on the image (in the selected area ofinterest) in the selected Gel window.
When the tracks are locked, Lock all is checked in the menu and the button is shownas depressed in the toolbar.
You need to lock the tracks before you can perform any of the functions that requirethe program to analyze the image along the tracks, such as locating the peaks, andassigning and calculating molecular weights and quantities
Tracks are unlocked when you choose any of the following tools for editing the tracks:Position All, Splay All, Move/tilt, Width, Rf start and Rf end.
Pressing the Lock all button is equivalent to choosing Lock all from the Track menu.
Position all
Press the Position all button to adjust the horizontal and vertical position of allthe tracks (in the selected area of interest) on the image in the selected Gelwindow.
Pressing the Position all button is equivalent to choosing Position all from the Trackmenu.
7-4 GeneTools User Manual
Toolbars
Splay all
Press the Splay all button to adjust the amount by which the tracks are splayedand the overall position of all the tracks (in the selected area of interest) on theimage in the selected Gel window.
Pressing the Splay all button is equivalent to choosing Splay all from the Track menu.
Move/tilt
Press the Move/tilt button to adjust the position of a single track on the image (in the selected area of interest) in the selected Gel window.
Pressing the Move/tilt button is equivalent to choosing Move/tilt from the Track menu.
Width
Press the Width button to adjust the width of individual tracks, if Widthindividual is selected in the Track menu, or all tracks (in the selected area ofinterest), if Width individual is not selected, on the image in the selected Gel
window.
Pressing the Width button is equivalent to choosing Width from the Track menu.
Rf start position
Press the Rf start position button to adjust the position of the Rf start line (in theselected area of interest) on the image in the selected Gel window.
Pressing the Rf start position button is equivalent to choosing Rf start position from theTrack menu.
Rf end position
Press the Rf end position button to adjust the position of the Rf end line (in theselected area of interest) on the image in the selected Gel window.
Pressing the Rf end position button is equivalent to choosing Rf end position from theTrack menu.
GeneTools User Manual 7-5
Track toolbar
Zoom toolbar
The Zoom toolbar is displayed when any Sample window or the Profile Comparisonwindow is selected.
Zoom in
Press the Zoom in button to increase the magnification of the image in theselected Sample window, or the horizontal scale in the Profile comparisonwindow, whichever is selected.
Pressing the Zoom in button is equivalent to choosing Zoom in from the View menu.
Zoom out
Press the Zoom out button to decrease the magnification of the image in theselected Sample window, or the horizontal scale in the Profile comparisonwindow, whichever is selected.
Pressing the Zoom out button is equivalent to choosing Zoom out from the View menu.
Zoom reset
Press the Zoom reset button to reset the size of the image in the selected Sample window, or the horizontal scale in the Profile comparison window, whichever isselected, to the default.
Pressing the Zoom reset button is equivalent to choosing Zoom reset from the Viewmenu.
7-6 GeneTools User Manual
Toolbars
Calibrations toolbar
The Calibrations toolbar is displayed when a Gel window is selected.
Integration parameters
Press the Integration parameters button to set, view or change the parametersused for analyzing the image.
Pressing the Integration parameters button is equivalent to choosing Integrationparameters from the Edit menu.
Quantity calibration
Press the Quantity calibration button to set, view or change the calibrationmethod and units for quantity determinations (in the selected area of interest).
Pressing the Quantity calibration button is equivalent to choosing Quantity calibrationfrom the Edit menu.
Assign quantity
Press the Assign quantity button to assign a quantity to the selected peak.
Pressing the Assign quantity button is equivalent to choosing Assign quantity from thePeak menu.
Molecular weight calibration
Press the Molecular weight calibration button to specify how molecular weightsshould be calculated from assigned molecular weights on molecular weightstandard tracks (in the selected area of interest).
Pressing the Molecular weight calibration button is equivalent to choosing Molecularweight calibration from the Edit menu.
GeneTools User Manual 7-7
Calibrations toolbar
MW/quantity standard
Press the MW/quantity standard button to define the selected track as amolecular weight standard (for the selected area of interest) if it isn’t one already,and to assign molecular weights to peaks in the track. If the track is already a
molecular weight standard, pressing the MW/quantity standard button removes its status as a molecular weight standard.
Pressing the MW/quantity standard button is equivalent to choosing MW/quantitystandard from the Track menu.
Profile comparison window
Press the Profile comparison window button to open the Profile comparisonwindow.
Pressing the Profile comparison window button is equivalent to choosing Profilecomparison from the View menu when a Gel window is selected.
Database toolbar
Note The Database toolbar is only available if you have purchased the GeneDirectory option.
The Database toolbar is displayed when a Gel window is selected.
Archive gel to database
Press the Archive gel to database button to archive gel data in GeneTools to theconnected GeneDirectory database.
Pressing the Archive gel to database button is equivalent to choosing Archive gel todatabase from the Database menu.
7-8 GeneTools User Manual
Toolbars
Open GeneDirectory
Press the Open GeneDirectory button to open the connected database inGeneDirectory.
Pressing the Open GeneDirectory button is equivalent to choosing OpenGeneDirectory from the Database menu.
Connect to database
Press the Connect to database button to select and connect GeneTools to aGeneDirectory database so that you can archive gene data.
Pressing the Connect to database button is equivalent to choosing Connect to databasefrom the Database menu.
Peak matching toolbar
Note This is only available if you have purchased the GeneTools Match software option.
The Peak Matching toolbar is displayed when a Gel window is selected.
Band matching
Press the Band matching button to specify how peaks should be matchedbetween tracks (in the selected area of interest).
Pressing the Band matching button is equivalent to choosing Band matching from theEdit menu.
GeneTools User Manual 7-9
Peak matching toolbar
Matching standard
Press the Matching standard button to define the selected track as a matchingstandard (for the selected area of interest) if it isn’t one already. If the track isalready a matching standard, pressing the Matching standard button removes its
status as a matching standard.
Pressing the Matching standard button is equivalent to choosing Matching standardfrom the Track menu.
Spot blot toolbar
The Spot blot toolbar is displayed when a Spot blot/Manual band quantification window is selected (some tools are disabled when the window contains a Manual bandquantification sample).
All spots same size
Press the All spots same size button to force all spots or boxes to be the samesize as the selected spot or box.
Pressing the All spots same size button is equivalent to choosing All spots same sizefrom the Spots menu.
Position control points
Press the Position control points button to unlock the spot frames on a griddedSpot blot image so that you can move or reshape the grid using control points.The spot frames are also unlocked so that you can change their size and, in the
case of rectangular spot frames, their shape using the mouse. The button is shown asdepressed when the spot frames are unlocked; press the button again to lock them.
Pressing the Position control points button is equivalent to choosing Position controlpoints from the Spots menu.
7-10 GeneTools User Manual
Toolbars
Locate
Press the Locate button to display the Spot Location Tool dialog box so that youcan set the spot location parameters and locate the positions of the spots on aSpot blot image automatically.
Pressing the Locate button is equivalent to choosing Locate from the Spots menu.
Position any spot
Press the Position any spot button so that you can adjust the position ofindividual spots on a Spot blot or Manual band quantification image.
Pressing the Position any spot button is equivalent to choosing Position any spot fromthe Spots menu.
Background correction
Press the Background correction button to display the Background correctiondialog box so that you can apply or remove background correction to the rawvolume measurements from the image.
Pressing the Background correction button is equivalent to choosing Backgroundcorrection from the Spots menu.
Lock position
Press the Lock position button to lock the sizes and positions of the spot frameson a Spot blot or Manual band quantification image so that they cannot beadjusted with the mouse or deleted. The button is shown as depressed when the
spot frames are locked; press the button again to unlock them.
Pressing the Lock position control points button is equivalent to choosing Lock positionfrom the Spots menu.
Spot incidence parameters
Press the Spot incidence parameters button to display the Spot incidenceparameters dialog box so that you can set the conditions used to define theIncidence matrix.
Pressing the Spot incidence parameters button is equivalent to choosing Spot incidence parameters from the Spots menu.
GeneTools User Manual 7-11
Spot blot toolbar
Circle
Press the Circle button to change the selected rectangular spot frame to becircular.
Pressing the Circle button is equivalent to choosing Circle from the Spots menu.
Rectangle
Press the Rectangle button to change the selected circular spot frame to berectangular.
Pressing the Rectangle button is equivalent to choosing Rectangle from the Spots menu.
Free hand
Press the Free hand button to draw a free hand box over a band on a Manualband quantification sample
Note This command only applies to Manual band quantification samples.
Pressing the Free hand button is equivalent to choosing Free hand from the Spotsmenu.
Quantity calibration parameters
Press the Quantity calibration parameters button to set or view the calibrationmethod and units for quantity determination.
Pressing the Quantity calibration parameters button is equivalent to choosing Quantitycalibration from the Edit menu.
Assign quantity
Press the Assign quantity button to assign a quantity to the selected spot frame.
Pressing the Assign quantity button is equivalent to choosing Assign quantity from theSpots menu.
7-12 GeneTools User Manual
Toolbars
Menus
File (Sample and Profile comparison windows)
GeneTools User Manual 8-1
This section describes all of the commands appearing on the File menu when a Samplewindow or the Profile comparison window is selected; the following section describesthe File menu when a Molecular weight library window is selected (see the Windowschapter (chapter 6) for information about the different types of window).
The picture shows the File menu when a Gel window is selected. Some commands arehidden and some are disabled when other types of Sample window or the Profilecomparison window are selected – the entry for each command says if it is notavailable for all types.
New (Import)
Note This command is disabled when the Profile comparison window is selected.
To create a new secure sample file (for example, from a non-secure .tif or .bmp imagefile):
1 Choose New (Import) from the File menu to display a standard WindowsOpen dialog box:
2 Choose the type of image file from the Files of type drop-down list box.
3 Use the Look in drop-down list box to select the folder containing the imagefile.
4 Click on the file in the list box to select it – the name of the file will appear in the File name box.
8-2 GeneTools User Manual
Menus
5 Press Open to close the dialog box and go on to the next step in theprocedure.
What happens next depends on whether you have set Auto import methodsand you have selected a secure sample file as the source for the settings toimport:
● If you have, the Import method dialog box will open so that you canchoose which settings to import. For further details, see, for example,Opening or creating a secure sample file with automatic import, page 1-16.
● Otherwise, go to Step 6.
6 The Sample properties dialog box will open so that you can set the type ofimage and make other settings:
7 Choose the type of image from the Analysis type box – see Configuration inthe Extras menu (page 8-139) for how to set the default Analysis type.
GeneTools User Manual 8-3
File (Sample and Profile comparison windows)
8 For a Gel sample:
a The Image type is detected automatically, but you can change it if youwant to.
b Click on a radio button to specify the Electrophoresis direction.
c If you just want to work with a single area of interest on the image, leavethe numbers of Columns and Rows set to 1.
If you want to define a grid of several areas of interest on the image, enter the numbers of Columns and Rows in the grid.
d For each of the areas of interest, click in it on the image to select it (draghandles appear at the corners and on the sides of the rectangle definingthe area when it is selected):
i To move the area of interest, drag it on the preview, avoiding the draghandles.
ii To define the size and shape of the area of interest, drag the handles.
iii To choose automatic track detection for the area, press Locate tracksautomatically.
Note In nearly all cases the GeneTools automatic track location will be able to locate thetracks on the gel correctly and position track markers over them accurately withoutfurther assistance, and this is the recommended way of working with GeneTools.However, very occasionally you may have a gel that causes problems, and if automatictrack location fails to identify the tracks correctly, you can redisplay the Sampleproperties dialog box (by repeating this complete procedure or by choosing Sampleproperties from the File menu), and then check Hint and enter the approximatenumber of tracks in the area of interest.
To choose manually how many tracks you want to place in the area ofinterest, press the Create radio button to enable the tracks for manual positioning spin box and enter the number of tracks you want to place in that area of interest. The tracks will be placed at default positionsand you will need to position them manually later.
8-4 GeneTools User Manual
Menus
Note The Leave the tracks unchanged radio button is only enabled when the Sampleproperties dialog box is displayed for an existing analyzed sample (see the entry forSample properties in the File (Gel) section in the Menus chapter (page 8-28)).
For a Colony (pour plate) sample:
The Image type is detected automatically, but you can change it if youwant to – in particular, you will need to set
Light and dark colonies manually if required.
For a Spot blot sample:
a The Image type is detected automatically, but you can change it if youwant to.
b Choose the shape of spot frames to apply from the Spot type box.
c Do one of:
● Press Locate spots automatically if you want GeneTools to detect thepositions of the spots automatically:
● Check Gridded if you want GeneTools to place a grid of spotframes over the spots it detects.
● Uncheck Gridded if you want GeneTools to detect the spotsautomatically and place an individual spot frame over each one.
● Press Create spots for manual positioning to place a rectangular gridof spot frames in a default position on the image:
● Enter the number of Columns and Rows you want to appear in thegrid.
● Press Leave the spots unchanged if you do not want to put any spotframes on the image yet – you will be able to add spots manually later.
For a Manual Band Quantification sample:
The Image type is detected automatically, but you can change it if youwant to.
GeneTools User Manual 8-5
File (Sample and Profile comparison windows)
For a High Throughput Gel sample:
a Select the type of High Throughput Gel analysis you are using from theGel type drop-down list box. You can choose:
● Madge 71.6 degree rotation
● Madge 78.7 degree rotation
● E-Gel 96
b The Image type is detected automatically, but you can change it if youwant to.
c Click on a radio button to specify the Electrophoresis direction.
d If you are opening a 96-well sample, leave the Number of columns andNumber of rows set to 1.
If you are working with a 192-well sample, set the Number of columns to 2 and the Number of rows to 1 if the two sets of tracks are side-by-side;set the Number of rows to 2 and the Number of columns to 1 if the two sets of tracks are one above the other.
Note Areas of interest can overlap with each other.
e For each of the areas of interest (shown by a red box on the image), clickin it on the image to select it (drag handles appear at the corners and onthe sides of the rectangle defining the area when it is selected):
i To move the area of interest, drag it on the preview avoiding the draghandles.
ii To define the size and shape of the area of interest, drag the handles.
Note Each area of interest determines the initial position of a grid of 96 track frames, whichshould be positioned over the corresponding tracks in the gel. However, you will beable to adjust the postion of the track frame grids and individual track frames later inthe Gel window, so it is not essential to adjust the areas of interest with great accuracy.
9 Click on the Analysis notes tab and enter any notes you want to save withthe secure sample file.
8-6 GeneTools User Manual
Menus
See Sample properties in the File menu (page 8-28) for more information on how to use the Sample properties dialog box.
10 Press OK to close the Sample properties dialog box.
For a Gel or High Throughput Gel, a Gel window will open containing the sample. Ifyou have set automatic track location (the recommended way of working withGeneTools), the tracks will be locked; otherwise they will be unlocked ready for you toposition them accurately on the image.
For a colony (pour plate) sample, a Colony counting window will open containing thesample.
For a Spot blot sample, a Spot blot/Manual band quantification window will opencontaining the sample:
● If you chose Gridded and left the Number of columns and Number of Rows set to 0, the spot frames will be placed automatically on the image and the Resultscalculated from them will be shown in the Results pane.
● If you chose Gridded and entered figures for the Number of columns and Number of Rows, the specified grid will appear on the image, but you will need to positionthe rows and columns accurately by hand.
● If you left Gridded unchecked, the individual spots will be located on the imageand spot frames placed on them.
For a Manual band quantification sample, a Spot blot/Manual band quantificationwindow will open containing the sample. There will be no boxes on the image and you will have to place them by hand.
For a High Throughput Gel sample, a Gel window will open containing the sample.There will be a grid of frames in each area of interest. These frames will be unlocked so that you can position them over the tracks on the image.
Note Choose Save as from the File menu to save the new sample as an analyzed securesample file.
GeneTools User Manual 8-7
File (Sample and Profile comparison windows)
Open
You can open the following types of secure sample files:
● analyzed files that have been previously saved in GeneTools – for a Gel, forexample, these will contain information about: track positions; peaks; assignedstandards; molecular weight, quantity and peak matching results; and so on.
● unanalyzed .sgd files that have been saved in the acquisition program, but have notyet been loaded into and saved in GeneTools.
To open a secure sample file:
1 Choose Open from the File menu to display a standard Windows Opendialog box:
2 Use the dialog box to select the required secure sample file.
3 Press Open.
What happens next depends on whether you are opening an analyzed or unanalyzedsecure sample, and in the latter case on whether you have set Auto import methods:
● If you are opening an analyzed secure sample file:
● Depending on the type of sample, the sample will be opened with settings asthey were when the file was last saved, including: for a Gel or High ThroughputGel sample, all track and peak settings and previously analyzed results; for a
8-8 GeneTools User Manual
Menus
Colony counting sample, the frame and other settings; for a Spot blot/Manualband quantification window, all spot frames or boxes and results.
● If you are opening an unanalyzed secure sample file and you have set Auto importmethods and you have selected a secure sample file as the source for the settings to import:
● The Import method dialog box will open so that you can choose which settingsto import. For further details, see, for example, Opening or creating a securesample file with automatic import, page 1-16.
● If you are opening an unanalyzed secure sample file and you have not set Autoimport methods:
● The Sample properties dialog box will open so that you can set the type ofimage and make other settings – see Steps 6–10 in the entry for New (Import) in the File menu (on pages 8-3–8-7) for details.
Browse
To open the Browser, or if it is already open, to select and maximize it:
Choose Browse from the File menu:
GeneTools User Manual 8-9
File (Sample and Profile comparison windows)
Note The picture shows the Browser in a non-maximized window; it is maximized afterselecting Browse.
The Browser allows you to locate, preview and open image files.
You use the Browser’s left-hand pane in exactly the same way as you use the left-handpane in Windows Explorer to select the folder containing the required images.
To open an image from the Browser:
Double-click on the image.
What happens next depends on whether you are opening an analyzed or unanalyzedsecure sample, and in the latter case on whether you have set Auto import methods:
● If you are opening an analyzed secure sample file:
● Depending on the type of sample, the sample will be opened with settings asthey were when the file was last saved, including: for a Gel or High ThroughputGel sample, all track and peak settings and previously analyzed results; for aColony counting sample, the frame and other settings; for a Spot blot/Manualband quantification window, all spot frames or boxes and results.
● If you are opening an unanalyzed secure sample file and you have set Auto importmethods and you have selected a secure sample file as the source for the settings to import:
● The Import method dialog box will open so that you can choose which settingsto import. For further details, see, for example, Opening or creating a securesample file with automatic import, page 1-16.
● If you are opening an unanalyzed secure sample file and you have not set Autoimport methods:
● The Sample properties dialog box will open so that you can set the type ofimage and make other settings – see Steps 6–10 in the entry for New (Import) in the File menu (on pages 8-3–8-7) for details.
8-10 GeneTools User Manual
Menus
Close
To close a secure sample file, the Profile comparison window or a molecular weightlibrary:
Choose Close from the File menu.
If the sample or molecular weight library has any unsaved changes, you will be asked ifyou want to save the file. If you have used New window in the Window menu to open more than one window for a molecular weight library, all of the windows will be closed.
Save
Note This command is disabled when the Profile comparison window is selected.
To save a secure sample file or molecular weight library:
1 Select the Sample window showing the sample or the Molecular weightlibrary window containing the molecular weight library.
2 Choose Save from the File menu.
If the file has been saved before, it will be saved with the same name, otherwise astandard Windows Save as dialog box will be displayed so that you can give the file aname and select a folder to save it in – see Steps 3–5 in the entry for Save as fordetails.
Save as
Note This command is disabled when the Profile comparison window is selected.
To save a secure sample file or molecular weight library with a new name:
1 Select the Gel, Colony counting or Spot blot/Manual band quantificationwindow showing the sample or the Molecular weight library windowcontaining the molecular weight library.
GeneTools User Manual 8-11
File (Sample and Profile comparison windows)
2 Choose Save as from the File menu to display a standard Windows Save asdialog box:
Note The Save as type box will show MW Standard Libraries (*.mwl) if you selected aMolecular weight library window.
3 Use the dialog box to select a folder in which to save the file.
4 Enter a File name for the file.
5 Press Save to save the file.
Select Source (Twain)
To select a Twain source so that you can acquire (see next section) an image from it:
1 Choose Select Source (Twain) from the File menu to display the SelectSource dialog box:
8-12 GeneTools User Manual
Menus
2 Click on the required source to select it.
3 Press Select to confirm the selection and close the dialog box.
Acquire (Twain)
To acquire an image from the selected Twain source (see previous section) and create asecure sample file:
1 Choose Acquire (Twain) from the File menu.
A dialog box will be displayed for the selected source so that you can selectacquisition options and acquire the image.
2 Use the dialog box to acquire the image.
What happens next depends on whether you have set Auto import methods:
If you have set Auto import methods:
● The Import method dialog box will open so that you can choose which settings toimport. For further details, see, for example, Opening or creating a secure sample file with automatic import, page 1-16.
If you have not set Auto import methods:
● The Sample properties dialog box will open so that you can set the type of imageand make other settings – see Steps 6–10 in the entry for New (Import) in the Filemenu (on pages 8-3–8-7) for details.
New library
The New Library command only appears on the File menu for Gel and HighThroughput Gel sample windows.
To create a new molecular weight library:
Choose New library from the File menu.
If the Molecular weight library window is open and you have any unsaved changes, you will be asked if you want to save them before the library is closed. The Molecularweight library window will then be reopened with a new empty library for you to create new molecular weight/quantity standards – see the entry for New standard in the Editmenu, page 8-57.
GeneTools User Manual 8-13
File (Sample and Profile comparison windows)
You can enter some text to document the molecular weight library using Properties inthe File menu.
Once you have created the new standards, you can save the new molecular weightlibrary using Save as in the File menu.
Note You can create as many different molecular weight libraries as you wish, but you canonly have one open at a time.
Open library
The Open Library command only appears on the File menu for Gel and HighThroughput Gel sample windows.
To open a molecular weight library for editing:
1 Choose Open library from the File menu to display a standard WindowsOpen dialog box:
2 Use the dialog box to select the required molecular weight library file.
3 Press Open.
If the Molecular weight library window is already open showing another library, thatlibrary will be closed – if it contains any unsaved changes, you will be asked if you want to save them before the library is closed.
The selected library will be opened in the Molecular weight library window.
8-14 GeneTools User Manual
Menus
Import method
The Import method command does not appear on the File menu for Colony samplewindows or the Profile comparison window.
To apply:
● molecular weight standards (for Gel and High Throughput Gel samples),
● Sample and track settings (for Gel and High Throughput Gel samples),
● Spot blot sample settings (for Spot blot samples),
● Manual band quantification sample settings (for Manual band quantificationsamples),
and/or
● report settings (for all sample types samples)
from a saved secure sample file to the sample in the selected window:
1 Choose Import method from the File menu to display the Import methoddialog box:
2 Press Browse to display a standard Windows Open dialog box so that youcan select a file from which to import settings.
GeneTools User Manual 8-15
File (Sample and Profile comparison windows)
3 Check the boxes for the settings that you want to import.
4 Press Import to import the settings.
Note This dialog box (with an additional page showing the image) is also displayed if youcreate a new sample from an image with automatic import set (see Configuration in the Extras menu, page 8-139, for how to set automatic import). You can also set the import methods in the Import page of the Configuration dialog box. The program displays the same import methods in all these places: changing the settings in any one of themchanges the settings in all of them.
Export table to Excel
The Export table to Excel command does not appear on the File menu for Colonycounting sample windows or the Profile comparison window.
Note This command is disabled when the Profile comparison window is selected.
To export results to Excel:
1 For a Gel window, select the results table that you want to export by clickingon its tab in the Results pane (see The Results pane, page 6-14, forinformation about the tables that can be displayed in the Results pane).
For a Spot blot/Manual band quantification window, select the Results or Incidence table that you want to export by clicking on its tab in theResults/Incidence/Calibration graph pane (see The Results page, page 6-31, orThe Incidence page, page 6-32).
2 If you want to change the columns shown in the table, right-click on the table to display the Results context menu and choose the required parameter toadd to or remove from the table.
3 Repeat Step 2 until the required columns are displayed.
4 Choose Export table to Excel.
Unless you have already exported a table to Excel in the current session, Excel will beopened and a new workbook created.
8-16 GeneTools User Manual
Menus
The first sheet in the workbook will be named Image document data and will containthe secure sample’s file name, and data taken from the Information page of theSample properties dialog box.
The second sheet in the workbook will contain the exported table and will be namedappropriately.
If you have already exported a table to Excel in the current session:
● If the results table selected in the Results pane already exists in the workbook, theresults will be updated.
● Otherwise, a new sheet will be added for the new table and named accordingly.
Note 1 GeneTools identifies sheets in the workbook by their names. If you rename a sheet andexport the table again, a new sheet will be added for the table and the original sheetwill not be updated.
Note 2 After you have exported a table to Excel in a session, GeneTools maintains a link to theworkbook it created but does not use the name of the workbook to identify it. Thismeans that you can save the workbook with another name if you wish. However, it also means that once you have exported a table to Excel, you should leave the workbookopen in Excel until after you have closed GeneTools.
Save table to CSV file
The Save table to CSV file command does not appear on the File menu for Colonycounting sample windows or the Profile comparison window.
To save results to a comma separated values text file:
1 For a Gel window, select the results table that you want to export by clickingon its tab in the Results pane (see The Results pane, page 6-14, forinformation about the tables that can be displayed in the Results pane).
For a Spot blot/Manual band quantification window, select the Results or Incidence table that you want to export by clicking on its tab in theResults/Incidence/Calibration graph pane (see The Results page, page 6-31, orThe Incidence page, page 6-32).
GeneTools User Manual 8-17
File (Sample and Profile comparison windows)
2 If you want to change the columns shown in the table, right-click on the table to display the Results context menu and choose the required parameter toadd to or remove from the table.
3 Repeat Step 2 until the required columns are displayed.
4 Choose Save table to CSV file to display the Save as CSV File dialog box:
This is a standard Windows Save As dialog box.
5 Use the dialog box to select a folder in which to save the CSV file.
6 Enter a File name for the CSV file.
7 Press Save to save the results in the file.
Export to Word
To create a Word document containing a report showing analysis results:
Choose Export to Word from the File menu.
A new Word document will be created and the report created within it.
See the entry for Report setup in the File menu, page 8-20, for how to choose what to include in the report.
8-18 GeneTools User Manual
Menus
Save to clipboard
To copy a picture of the image in the Image pane in the current Sample window or theprofiles in the Profiles pane in the Profile comparison window to the clipboard:
Choose Save to clipboard from the File menu.
Printer setup
To choose a new printer or change the settings for the existing one:
1 Choose Printer setup from the File menu to display the Print Setup dialogbox:
2 To select a different printer, choose it from the Name drop-down list box. The fields below the Name box show properties of the selected printer.
3 Press Properties to display a dialog box allowing you to choose options forthe selected printer.
The options available depend on the printer – see your printer documentation for details.
4 Choose the paper Size and Source to use from the drop-down list boxes.
The options available depend on the printer – see your printer documentation for details.
GeneTools User Manual 8-19
File (Sample and Profile comparison windows)
5 Click on the Landscape or Portrait radio button to choose the paperorientation – the graphic in the Orientation box illustrates the selectedorientation.
6 Press OK to save the settings and close the dialog box.
Report setup
Note This command is disabled when the Profile comparison window is selected.
You can choose what information to include in reports.
Note If the paper selected for the currently selected printer is less than 150 mm in eitherdimension (for example if you are using a video printer), a simplified report containingthe image and some brief identification and image information will be printed. Thesettings in the Report setup dialog box have no effect on the content of this simplifiedreport.
To choose what data to include in a Gel or High Throughput Gel sample report:
1 With the Gel window selected, choose Report setup from the File menu todisplay the Report setup dialog box:
8-20 GeneTools User Manual
Menus
2 In the File details box, check:
● Image to include a picture of the image in the report. The track positionsand peak markers will be shown on the image, whether or not they arechosen for display in the Image pane. The match lines and Rf start andfinish lines will not be shown.
● Capture settings to include in the report the settings used in the camerawhen the image was captured.
● Acquisition notes to include in the report any notes added by the user inthe acquisition program in the camera when the image was captured – see the entry for Sample properties in the File menu, page 8-28, for how toview Acquisition notes.
● Analysis notes to include in the report any notes added by the user inGeneTools – see the entry for Sample properties in the File menu,page 8-28, for how to view and edit Analysis notes.
● Document history to include in the report a record of who has madechanges to the sample file and when.
● Integration settings to include in the report the integration parametersused for profile generation and automatic peak location – see the entry for Integration parameters in the File menu, page 8-45, for details.
3 In the Molecular weight calibrations box, check:
● MW standards to include in the report details of:
● the molecular weight calibration details – see the entry for Molecularweight calibration in the Edit menu, page 8-50, for details.
● the assignment of molecular weights/quantities to peaks in themolecular weight standard tracks – see the entry for MW/quantitystandard in the Track menu, page 8-94, and Assign molecular weightin the Peak menu, page 8-104, for details.
● MW calibration graphs to include in the report the molecular weightcalibration graphs for the molecular weight standard tracks. The molecularweight calibration graph for a track is shown in the MW calibration pageof the Graphics pane when the track is selected – see page 6-7 for details.
GeneTools User Manual 8-21
File (Sample and Profile comparison windows)
4 In the Results per track box, check:
● Raw profiles to include in the report the uncorrected profile for each ofthe enabled tracks. The raw profile shows the base line used to create thecorrected profile as a red line – see the entry for Integration parametersin the File menu, page 8-45, for information about setting baselinecorrection.
● Corrected profiles to include in the report the corrected profile for eachof the enabled tracks. The corrected profile shows the peak positions (bythe peak number) and boundaries. You can also view the corrected profile for the selected track in the Profile pane in the Gel window.
● Peak results table to include in the report a separate table of results foreach of the enabled tracks. You can view the individual table of results forthe selected track on the Results for selected track tab in the Resultspane in the Gel window – see The Results pane, page 6-14, for details.
5 In the Results for all tracks box, check:
● Peak results table to include in the report a table of results for all of theenabled tracks. You can view the combined table of results for all thetracks on the Results for all tracks tab in the Results pane in the Gelwindow – see The Results pane, page 6-14, for details.
6 In the Quantity calibrations box, check:
● Quantity standards to include in the report details of the quantitycalibration method – see the entry for Quantity calibration in the Editmenu, page 8-52, for details.
● Quantity calibration graphs to include quantity calibration graphs in thereport. If you have chosen to calibrate All graphs to a single curve, onlythe single calibration curve will be shown. Otherwise calibration curveswill be shown for all enabled tracks with a defined quantity calibration.The quantity calibration graph for a track is shown on the Quantitycalibration page of the Graphics pane when the track is selected – seepage 6-9 for details.
8-22 GeneTools User Manual
Menus
7 Click on the Matching tab to choose what peak matching data to include inthe report. The Matching page will be displayed:
Check:
● Matching comparison table to include a table showing the results forthose peaks in track order that match the peaks on the active matchingstandard. The table will exclude results for disabled tracks. You can viewthe Matching comparison table on the Matching comparisons page in the Results pane in the Gel window – see The Results pane, page 6-14, fordetails.
● Matching matrix (presence/absence table) to include a table showing the presence or absence of peaks matching the peaks on the active matchingstandard. The table will exclude results for disabled tracks. You can viewthe Matching presence/absence table on the Matching matrix page in theResults pane in the Gel window – see The Results pane, page 6-14, fordetails.
● Matching coefficients table to include a table showing how well pairs oftracks are matched. You can view the Matching coefficients table on theSimilarity matrix page in the Results pane in the Gel window – see TheResults pane, page 6-14, for details.
● Check Dendrogram to include the dendrogram giving a hierarchicalrepresentation of the matching between tracks. The dendrogram is shown
GeneTools User Manual 8-23
File (Sample and Profile comparison windows)
in the Dendrogram page of the Graphics pane – see The dendrogram,page 6-10, for details.
To choose what data to include in a Spot blot or Manual band quantification samplereport:
1 With the Spot blot/Manual band quantification window selected, chooseReport setup from the File menu to display the Report setup dialog box:
2 In the File details box, check:
● Image to include a picture of the image in the report. The spot frames will be shown on the image.
● Capture settings to include in the report the settings used in the camerawhen the image was captured.
● Acquisition notes to include in the report any notes added by the user inthe acquisition program in the camera when the image was captured – see the entry for Sample properties in the File menu, page 8-28, for how toview Acquisition notes.
● Analysis notes to include in the report any notes added by the user inGeneTools – see the entry for Sample properties in the File menu,page 8-28, for how to view and edit Analysis notes.
● Document history to include in the report a record of who has madechanges to the sample file and when.
8-24 GeneTools User Manual
Menus
3 In the Results box, check:
● Results table to include the Spot blot results table in the report. The table will include the columns selected for display on the Spot blot results page in the Spot blot/Manual band quantification window.
● Incidence table to include the incidence matrix in the report.
4 In the Quantity calibrations box, check:
● Quantity standards to include in the report details of the quantitycalibration method – see the entry for Quantity calibration in the Editmenu, page 8-52, for details.
● Quantity calibration graphs to include the quantity calibration graph inthe report. The quantity calibration graph is shown on the Quantitycalibration page in the Spot blot/Manual band quantification window.
To choose what data to include in a Colony counting report:
1 With the Colony counting window selected, choose Report setup from theFile menu to display the Report setup dialog box:
2 In the File details box, check:
● Image to include a picture of the image in the report. The frame, detected colonies, colony shapes (if displayed) and any exclude regions will beshown on the image.
● Capture settings to include in the report the settings used in the camerawhen the image was captured.
GeneTools User Manual 8-25
File (Sample and Profile comparison windows)
● Acquisition notes to include in the report any notes added by the user inthe acquisition program in the camera when the image was captured – see the entry for Sample properties in the File menu, page 8-28, for how toview Acquisition notes.
● Analysis notes to include in the report any notes added by the user inGeneTools – see the entry for Sample properties in the File menu,page 8-28, for how to view and edit Analysis notes.
● Document history to include in the report a record of who has madechanges to the sample file and when.
3 In the Results box, check:
● Measurement settings to include the sensitivity and whether colonyseparation was used.
● Results table to include the colony counting results table in the report.The table will show the colony count and percentage area for each class of colony.
Print preview
To preview a sample results or Profile comparison report before it is printed:
Choose Print preview from the File menu to display the Sample or Profilecomparison window in print preview mode.
A row of buttons at the top of the window allows you to control the way the windowdisplays the preview:
● Press Print to print the report shown in the preview and return the Sample orProfile comparison window to its normal mode.
● Press Next Page if the printout covers more than one page and you want to see thenext page. The button will be grayed if you are viewing the final page.
● Press Prev Page if the printout covers more than one page and you want to go backto an earlier page. The button will be grayed if you are viewing the first page.
8-26 GeneTools User Manual
Menus
● Press Two Page if the printout covers more than one page and you want to view two pages side-by-side at the same time. The button changes to One Page when you are in two page mode so that you can change back to viewing one page at a time.
● Press Zoom In for a magnified view of the previewed page. When you move thepointer over the page in the preview window, it changes to a magnifier and clickingon the page has the same effect as pressing Zoom In, unless the page is already atmaximum magnification, when it displays the page at minimum magnification.
● Press Zoom Out to return to a less magnified view of the previewed page.
● Press Close to return the Sample or Profile comparison window to its normal mode without doing any printing.
Print
To print a report showing results from a Sample window or the contents of the Profilecomparison window:
1 Select the Sample window or Profile comparison window, as required.
2 Choose Print from the File menu to display the Print dialog box so that youcan select print options. This is a standard Windows dialog box.
3 After selecting any required options, press OK to close the dialog box andprint the report.
See the entry for Report setup in the File menu, page 8-20, for how to choose what to print in the report.
Note If the paper selected for the currently selected printer is less than 150 mm in eitherdimension (for example if you are using a video printer), a simplified report containingthe image and some brief identification and image information will be printed. Thesettings in the Report setup dialog box have no effect on the content of this simplifiedreport.
GeneTools User Manual 8-27
File (Sample and Profile comparison windows)
Recently opened files
The File menu lists the names of the most recently used files.
To reopen one of these files (secure sample file or molecular weight library file):
Choose the file’s name from the File menu.
See the entry for Configuration in the Extras menu, page 8-139, for how to choosehow many files to list.
Sample properties
Note This command does not appear on the menu when the Profile comparison window isselected.
To view or edit the settings and notes for a sample:
1 Click in the window containing the sample to select it.
8-28 GeneTools User Manual
Menus
2 Choose Sample properties from the File menu to display the General pageof the Sample properties dialog box:
The controls shown on the General page depend on the type of sample (inthe picture shown above, the sample is an ethidium bromide DNA gel).
3 If required, select a different Analysis type from the drop-down list box – you may need to do this when the dialog box is displayed when you create a new secure sample file, but it is unlikely that you would need to do this at anyother time.
The controls displayed depend on the selected Analysis type – the followingsubsections of Step 3 describe how to work with each of the different analysis types.
GeneTools User Manual 8-29
File (Sample and Profile comparison windows)
Gel analysis (see picture in Step 2):
a Click on the Fluorescence radio button for a fluorescence image (brightbands on a dark background); click on the Absorption radio button for an absorption image (dark bands on a bright background). GeneTools detectsthe Image type automatically, so you shouldn’t need to change this setting.
b Click on one of the direction radio buttons to set the Electrophoresisdirection.
c If you just want to work with a single area of interest on the image, leavethe numbers of Columns and Rows set to 1.
If you want to define a grid of several areas of interest on the image, enter the numbers of Columns and Rows in the grid.
d For each of the areas of interest, click in it on the image to select it (draghandles appear at the corners and on the sides of the rectangle definingthe area when it is selected):
i To move the area of interest, drag it on the preview avoiding the draghandles.
ii To define the size and shape of the area of interest, drag the handles.
iii Do one of:
● To choose automatic track detection for the area, press Locatetracks automatically.
Note In nearly all cases the GeneTools automatic track location will be able to locate thetracks on the gel correctly and position track markers over them accurately withoutfurther assistance, and this is the recommended way of working with GeneTools.However, very occasionally you may have a gel that causes problems, so if automatictrack location fails to identify the tracks correctly, you can give it some help by checking Hint and entering the approximate number of tracks in the area of interest.
● To choose manually how many tracks you want to place in the areaof interest, press the Create radio button to enable the tracks formanual positioning spin box and enter the number of tracks youwant to place in that area of interest. The tracks will be placed atdefault positions and you will need to position them manually later.
8-30 GeneTools User Manual
Menus
● Leave the Leave the tracks unchanged radio button selected if you do not want to change the tracks on the gel either manually orautomatically.
Note Changing other options in the Sample properties dialog box can cause the Leave thetracks unchanged radio button to be deselected and disabled. If this happens, and you really do want to leave the tracks unchanged, press Cancel to close the dialog boxwithout making any changes.
e Go to Step 4 (page 8-37).
Colony (pour plate) analysis
a Click on the Light colonies radio button for an image showing lightcolonies on a dark background; click on the Dark colonies radio buttonfor an image showing dark colonies on a light background; click on Light
GeneTools User Manual 8-31
File (Sample and Profile comparison windows)
and dark colonies for an image showing colonies lighter and darker thanthe background.
The Image type is detected automatically, but you can change it if youwant to – in particular, you will need to set Light and dark coloniesmanually if required.
b Go to Step 4 (page 8-37).
Spot blot analysis
a Choose the shape of spot frame (Circle or Rectangle) that you want to use from the Spot type drop-down list box.
b Click on the Fluorescence radio button for a fluorescence image (brightspots on a dark background); click on the Absorption radio button for an
8-32 GeneTools User Manual
Menus
absorption image (dark spots on a bright background). GeneTools detectsthe Image type automatically, so you shouldn’t need to change this setting.
c Do one of:
● Press Locate spots automatically if you want GeneTools to detect thepositions of the spots automatically:
● Check Gridded if you want GeneTools to place a rectangular grid of spot frames over the spots it detects.
● Uncheck Gridded if you want GeneTools to place spot frames onlywhere it actually found spots.
● Press Create spots for manual positioning to place a rectangular gridof spot frames in a default position on the image:
● Enter the number of Columns and Rows you want to appear in the grid.
● Press Leave the spots unchanged if you do not want to change thearrangement of spot frames on the image.
d Go to Step 4 (page 8-37).
GeneTools User Manual 8-33
File (Sample and Profile comparison windows)
Manual Band Quantification analysis
a Click on the Fluorescence radio button for a fluorescence image (brightspots on a dark background); click on the Absorption radio button for anabsorption image (dark spots on a bright background). GeneTools detectsthe Image type automatically, so you shouldn’t need to change this setting.
b Go to Step 4.
8-34 GeneTools User Manual
Menus
High Throughput Gel
The controls on the General page are different if the Analysis type is HighThroughput Gel:
a Select the type of High Throughput Gel analysis you are using from theGel type drop-down list box. You can choose:
● Madge 71.6 degree rotation
● Madge 78.7 degree rotation
● E-Gel 96
GeneTools User Manual 8-35
File (Sample and Profile comparison windows)
b The Image type is detected automatically, but you can change it if youwant to:
Click on the Fluorescence radio button for a fluorescence image (brightbands on a dark background); click on the Absorption radio button for an absorption image (dark bands on a bright background)
c Click on a radio button to specify the Electrophoresis direction.
d If you are opening a 96-well sample, leave the Number of columns andNumber of rows set to 1.
If you are working with a 192-well sample, set the Number of columns to 2 and the Number of rows to 1 if the two sets of tracks are side-by-side;set the Number of rows to 2 and the Number of columns to 1 if the two sets of tracks are one above the other.
Note Areas of interest can overlap with each other.
e For each of the areas of interest (shown by a red box on the image), clickin it on the image to select it (drag handles appear at the corners and onthe sides of the rectangle defining the area when it is selected):
i To move the area of interest, drag it on the preview avoiding the draghandles.
ii To define the size and shape of the area of interest, drag the handles.
Note Each area of interest determines the initial position of a grid of 96 track frames, whichshould be positioned over the corresponding tracks in the gel. However, you will beable to adjust the postion of the track frame grids and individual track frames later inthe Gel window, so it is not essential to adjust the areas of interest with great accuracy.
f Go to Step 4.
8-36 GeneTools User Manual
Menus
4 Click on the Information tab to view data saved with the image when thesecure sample file was created (either by the acquisition program or by usingthe New (Import) command):
You cannot edit any of the information.
GeneTools User Manual 8-37
File (Sample and Profile comparison windows)
5 Click on the Acquisition notes tab to display notes saved with the image filein the image acquisition program:
You cannot edit the notes.
8-38 GeneTools User Manual
Menus
6 Click on the Analysis notes tab to view or edit notes saved with the securesample file in GeneTools:
7 Press OK to close the dialog box and save any of the changes you have made to the settings.
For a Gel, if you have set automatic track location (the recommended way of workingwith GeneTools), the tracks will be locked; otherwise they will be unlocked ready foryou to position them accurately on the image (see How to place, position and workwith tracks – Overview, page 1-22, for details).
GeneTools User Manual 8-39
File (Sample and Profile comparison windows)
Exit
To exit the program:
Choose Exit from the File menu.
You will be asked if you want to save any open files that have unsaved changes.
File (Molecular weight library window)
Many of the commands appearing on the File menu when a Molecular weight librarywindow is selected also appear on the menu when a Gel window is selected – see therelevant entries in the File (Sample window) section, page 8-1, for details of thesecommands. This section describes the commands that only appear on the File menuwhen a Molecular weight library window is selected.
8-40 GeneTools User Manual
Menus
Unlock
To unlock a molecular weight library (see the next command for locking libraries):
1 If the library is already open, click in the Molecular weight library window orchoose it from the Window menu to select it. Otherwise, choose Openlibrary from the File menu to open the library.
2 Choose Unlock from the File menu to display the Enter password dialogbox:
3 Enter the Password and press OK (just press OK if no password is set).
You will be told if the password is incorrect – see the entry for Changepassword in the File menu, page 8-42, for how to set a password.
When the library is unlocked, Unlock will become disabled in the menu and Lock willbecome enabled.
Lock
To lock a molecular weight library:
1 If the library is already open, click in the Molecular weight library window orchoose it from the Window menu to select it. Otherwise, choose Openlibrary from the File menu to open the library.
2 Choose Lock from the File menu.
(The command will become disabled in the menu and Unlock will becomeenabled.)
3 Choose Save from the File menu to save the locked status of the file.
GeneTools User Manual 8-41
File (Molecular weight library window)
While the library is locked, the commands for editing it in the Edit menu and thepop-up menu displayed when you right-click in the Molecular weight library windoware disabled.
You can protect the library further by setting a password, which you will have to enterin order to unlock the library – see the next command for details.
Change password
To set or change the password for a molecular weight library (see the entry for Unlockin the File menu, page 8-41, for when you will need to enter the password):
1 If the library is already open, click in the Molecular weight library window toselect it.
Otherwise, choose Open library from the File menu to open the library.
2 Choose Change password from the File menu to display the Changepassword dialog box:
3 Enter the Old password – the characters will be shown as * for security.
4 Enter the New password – the characters will be shown as * for security.
5 Enter the new password again in the Confirm new box to check that youtyped it correctly.
6 Press OK to set the new password and close the dialog box.
8-42 GeneTools User Manual
Menus
Properties
To set or view properties associated with a molecular weight library:
1 If the library is already open, click in the Molecular weight library window toselect it or choose it from the list at the bottom of the Window menu.
Otherwise, choose Open library from the File menu to open the library.
2 Choose Properties from the File menu to display the Library propertiesdialog box:
The Date created and Date modified boxes are read-only and show thedates on which the library was created and last modified.
The Author and Name boxes can be edited provided the molecular weightlibrary is unlocked.
3 Enter text in the Author and Name boxes to document the molecular weightlibrary.
4 Press OK to close the dialog box.
5 Choose Save from the File menu to save the properties.
GeneTools User Manual 8-43
File (Molecular weight library window)
Edit (Gel window)
This section describes all of the commands appearing on the Edit menu when a Gelwindow is selected; the following sections describe the Edit menu when other types ofwindow are selected (see the Windows chapter, chapter 6, for information about thedifferent types of window).
Undo, Cut, Copy and Paste are disabled for all types of window.
8-44 GeneTools User Manual
Menus
Integration parameters
Note If you have defined more than one area of interest on the sample, the same integrationparameters will be used for all areas.
To set the parameters used for profile generation and automatic peak location:
1 Choose Integration parameters from the Edit menu to display theIntegration parameters dialog box:
2 Choose how to draw the baseline from which the signal is measured to givethe profile. The signal is the sum of the (spatially filtered) pixel values acrossthe width of the track. You can use:
● None – no baseline correction● Track borders● Lowest slope
GeneTools User Manual 8-45
Edit (Gel window)
● Track borders & slope – a combination of the last two: the signal iscorrected for the track borders and then the lowest slope correction isused
● Rolling disk.
(See the Baseline correction subsections after these instructions for details, and the entry for Edit manual baseline in the Track menu, page 8-90, for how toset a manual baseline.)
3 If you have chosen to use Rolling disk background correction, enter or editthe radius of the disk to be used. Some experimentation may be required tofind the best size of disk to use for each image – press Apply to see the effect of the correction without closing the dialog box.
4 Choose whether to use a baseline offset or not. See Baseline correction afterthese instructions for details.
5 Specify the Minimum peak width (in image pixels) for a peak to be detected.
6 Specify the Minimum peak height (in image pixels) for a peak to bedetected.
7 Specify the Minimum peak volume (as a percentage of the total quantity) onthe track for a peak to be detected.
8 Check All peaks same width to make the detected peaks all have the samewidth, and enter the required width in the associated edit box.
9 Specify the width of the Savitsky-Golay filter used in integrating the image –the greater the width, the greater the smoothing effect of the filter. SeeSavitsky-Golay filter, page 8-50, for examples.
8-46 GeneTools User Manual
Menus
10 Click on the Detection filter tab to display the Detection filter page so thatyou can choose a filter for filtering color images:
11 Choose the required Filter color from the drop-down list box.
12 Press Apply to see the effects of any changes you have made without closingthe dialog box; press OK to save the new settings and close the dialog box.
Baseline correction – track borders
For track borders baseline correction, the signal is calculated relative to the signal at theborders.
GeneTools User Manual 8-47
Edit (Gel window)
Baseline correction – lowest slope
To understand how this method works, consider the following example, which goesthrough the process as if you had to do it by hand – naturally all this is doneautomatically by the program and all you would see is the profile in the first picturechange into the profile in the last picture:
To find the first segment of the baseline, the program starts at one end of the profileand draws imaginary lines from the start point to all other points on the profile. Thefollowing example just shows three of these lines:
The program then chooses the line of lowest slope. This is the shortest line in thisexample as the other lines have larger (less negative) slopes (lines to all other points onthe profile have even larger slopes).
To find the second segment of the baseline, the program moves to the end of the firstsegment and again draws imaginary lines from there to the remaining points on theprofile. Again the following example only draws three of these lines:
8-48 GeneTools User Manual
Menus
The program again chooses the line of lowest slope (the shortest line again in thisexample) and repeats this process until it gets to the other end of the profile:
The corrected signal is then measured as the height above this baseline:
Baseline correction – rolling disk
For this method the program first calculates the position of the line formed by thecenter of a disk with the set radius rolled along below the profile. The baseline is thenone radius length above this line, and the corrected signal is measured as the heightabove this baseline.
Baseline correction – offset
Choose whether to use a baseline offset or not. The baseline offset moves the baselineup to the lowest point in the profile.
For example:
with baseline offset becomes
GeneTools User Manual 8-49
Edit (Gel window)
Savitsky-Golay filter
The pictures below are examples of the effects of different degrees of spatial filtering.
No filter Filter width = 11 Filter width = 17
Molecular weight calibration
Note If you have defined more than one area of interest on the sample, you can choosedifferent molecular weight calibration settings for each area.
To specify how molecular weights are calculated from standard tracks:
1 If there is more than one area of interest on the sample, click in the area onthe sample for which you want to set the molecular weight calibrationsettings.
8-50 GeneTools User Manual
Menus
2 Choose Molecular weight calibration from the Edit menu to display theMolecular weight calibration dialog box:
(You can also display this dialog box by pressing Edit calibration in the Assign molecular weight/quantity dialog box.)
3 Click on a radio button to choose the type of calibration curve to use forcalculating molecular weights for points between peaks on the standard tracks.
● Log-linear fit means the best logarithmic curve fit for all points – the curve may not pass through all the calibration points.
● Log piecewise linear means a logarithmic curve is drawn betweenadjacent points – the curve will pass through all the calibration points butmay not be smooth at those points.
The selected curve will be shown in the MW Calibration tab in the Gelwindow’s Graphics pane – see page 6-8 for details.
4 Click on a radio button to choose whether distance along the track should bemeasured From start of Track or From Rf baseline.
5 Choose how to calculate molecular weights if there is more than one standard track.
You can choose:
● Use nearest standard to use the nearest standard track
● Combine all standards to calculate a molecular weight from all thestandards and then take the average
GeneTools User Manual 8-51
Edit (Gel window)
● Interpolate between standards to interpolate results from the twoadjacent tracks.
6 Press OK to save the new settings and close the dialog box.
7 Repeat Steps 1–6 for the other areas of interest.
Quantity calibration
Note If you have defined more than one area of interest on the sample, you can choosedifferent quantity calibration settings for each area, or choose to use the quantitycalibration in another area of interest.
To set or view the calibration method and units for quantity determinations:
1 If there is more than one area of interest on the sample, click in the area onthe sample for which you want to set the quantity calibration settings.
2 Choose Quantity calibration from the Edit menu to display the Quantitycalibration dialog box:
(You can also display this dialog box by pressing Edit quantity calibration inthe Assign molecular weight/quantity dialog box.)
3 For a sample with more than one area of interest, you can choose to use thequantity calibration defined in another area of interest. If you wish to do so:
a Check Use another track set as standard.
b Select the required Track set from the drop-down list box.
8-52 GeneTools User Manual
Menus
c Go to Step 7.
Otherwise, go to Step 4.
4 Click on a radio button to decide whether:
● the same calibration curve should be used for All tracks
● Each track should have its own calibration curve.
5 Choose the shape of calibration curve(s) from the drop-down list box from
● Linear through origin (single standard value)
● Linear (multiple standard values)
● Linear through origin (multiple standard values)
● Quadratic
● Quadratic through origin.
6 Enter your own quantity units in the Units box.
7 Press OK to save the new settings and close the dialog box.
8 Repeat Steps 1–7 for the other areas of interest.
Note If you select Linear through origin (single standard value) the calibration curve isdrawn through the origin and the last calibration point you have added – in otherwords, adding a new calibration point replaces the previous one. For the other types ofcurve, the calibration curve is drawn as the best fit for all the (relevant) calibrationpoints – adding a new calibration point contributes to (and does not replace) thecalibration from any previous points.
Band matching
Note If you have defined more than one area of interest on the sample, you can choosedifferent matching settings for each area.
To set or view the tolerance and method used for matching:
1 If there is more than one area of interest on the sample, click in the area onthe sample for which you want to set the peak matching settings.
GeneTools User Manual 8-53
Edit (Gel window)
2 Choose Band matching from the Edit menu to display the Matchingparameters dialog box:
Note This dialog box is also displayed when you choose Parameters from the Matchingmenu when the Profile comparison window is selected – the settings you make here for the selected area of interest are independent of any settings you may make for theProfile comparison window or for any other areas of interest.
3 In the Matching box:
a In the Type box, select Band or Profile to decide whether to match tracksusing the detected bands (peaks) or the intensity profiles.
Note When Profile is selected:
● There is no need to detect the peaks on the tracks (unless you choose to match onthe basis of molecular weights – see Step c).
● There is no need to define a matching standard.
● The Similarity Coefficient controls in the Matching parameters dialog box aredisabled.
● The Matching comparisons and Matching matrix pages in the Results pane areblank.
8-54 GeneTools User Manual
Menus
b If you selected Band in the Type box, select Dice or Jaccard from theSimilarity Coefficient box to choose how the similarity coefficients shouldbe calculated – see Similarity matrix, page 1-114, for how the similaritycoefficients are defined.
c In the Alignment box, click on a radio button to choose whether matching should be carried out on the basis of:
● Position – distance from start of track
● Rf – relative position between Rf start and end lines on the tracks
● MW – molecular weight calculated using the molecular weightcalibration curve(s) for the tracks.
4 Enter a Tolerance figure to set a limit to the accuracy required whenmatching peaks (this does not have to be a whole number).
Note For Profile matching, the Tolerance must be set to a number less than or equal to 1.
5 In the Dendrogram Drawing box:
a Choose whether to use UPGMA or Neighbor Joining as the linkage rulefor the dendrogram – see The dendrogram, page 6-10, for a description ofthese linkage rules.
b Check or uncheck Include MW standard(s) to choose whether molecularweight standard tracks should be included in the dendrogram.
6 Press Apply to see the effect of the settings without closing the dialog box;press OK to save the new settings and close the dialog box.
7 If required, repeat Steps 1–6 for the other areas of interest.
GeneTools User Manual 8-55
Edit (Gel window)
Edit (Spot blot/Manual band quantification window)
This section describes the commands appearing on the Edit menu when a Spotblot/Manual band quantification window is selected.
Undo, Cut, Copy and Paste are disabled for all types of window.
Quantity calibration
To set or view the calibration method and units for quantity determination:
1 Choose Quantity calibration from the Edit menu to display the Quantitycalibration dialog box:
2 Choose the shape of calibration curve(s) from the drop-down list box. You can choose:
● Linear through origin (single standard value)
● Linear (multiple standard values)
● Linear through origin (multiple standard values)
● Quadratic, or
● Quadratic through origin.
3 Enter your own quantity units in the Units box.
4 Press OK to save the new settings and close the dialog box.
8-56 GeneTools User Manual
Menus
Note If you select Linear through origin (single standard value) the calibration curve isdrawn through the origin and the last calibration point you have added – in otherwords, adding a new calibration point replaces the previous one. For the other types ofcurve, the calibration curve is drawn as the best fit for all the (relevant) calibrationpoints – adding a new calibration point contributes to (and does not replace) thecalibration from any previous points.
Edit (Colony counting window)
Undo, Cut, Copy and Paste are the only commands appearing on the Edit menu when a Colony counting window is selected. These commands are disabled for all types ofwindow, including the Colony counting window.
Edit (Molecular weight library window)
Undo, Cut, Copy and Paste are disabled for all types of window.
New standard
You can only edit a molecular weight/quantity standard if the library is unlocked – seethe entry for Unlock in the File menu, page 8-41.
To create a new molecular weight/quantity standard in a library:
1 If the library is already open, click in its Molecular weight library window toselect it.
GeneTools User Manual 8-57
Edit (Molecular weight library window)
Otherwise, choose Open library from the File menu to open the library.
2 Click in the Molecular weight library window for the required library to selectit.
3 Choose New standard from the Edit menu (or right-click in the window todisplay a pop-up menu and choose New) to display the New standard dialog box:
Note You can also display this dialog box by pressing New standard on the Edit standardpage of the Assign molecular weight/quantity dialog box – see the entry for Assignmolecular weight in the Peak menu, page 8-104.
4 Enter a name for the Standard.
5 Press OK to display the Edit molecular weight standard dialog box:
6 Enter the first Peak number (ie, 1).
8-58 GeneTools User Manual
Menus
7 Enter its Molecular weight (molecular weights must decrease as peak number increases) and/or Quantity.
8 Press Insert. The peak number and associated molecular weight will appearin the list box at the top of the dialog box.
The Peak number will be increased by one automatically, ready for you toadd the next peak.
9 Repeat Steps 7–8 for the remaining peaks.
10 Press OK to close the dialog box. The new standard will appear in theMolecular weight library window.
Edit standard
You can only edit a molecular weight/quantity standard if the library is unlocked – seethe entry for Unlock in the File menu (page 8-41).
To edit a molecular weight/quantity standard in a library:
1 If the library is already open, click in its Molecular weight library window toselect it.
Otherwise, choose Open library from the File menu to open the library.
2 Select the standard in the Molecular weight library window by clicking on thestandard’s name or any of the peaks in its list.
GeneTools User Manual 8-59
Edit (Molecular weight library window)
3 Choose Edit standard from the Edit menu (or right-click on the standard’sname or any of the peaks in its list to display a pop-up menu and chooseEdit) to display the Edit molecular weight standard dialog box:
The list in the dialog box shows the peaks and the molecular weights assigned to them in the standard.
To add a new peak to the standard:
1 Enter the Peak number (it must be different from any existing peak numbers).
2 Enter the Molecular weight (molecular weights must decrease as peaknumber increases) and/or Quantity.
3 Press Insert.
To change a peak in the standard:
1 Select the peak you want to change by clicking on it in the list of peaks. Thepeak number and molecular weight will be shown in the Peak number andMolecular weight boxes.
2 Change the Peak number and/or Molecular weight and/or Quantity asrequired.
3 Press Change.
8-60 GeneTools User Manual
Menus
To delete a peak from the standard:
1 Select the peak you want to delete by clicking on it in the list of peaks. Thepeak number, molecular weight and quantity will be shown in the Peaknumber, Molecular weight and Quantity boxes.
2 Press Delete.
Delete standard
You can only delete a molecular weight/quantity standard from a library if the library isunlocked – see the entry for Unlock in the File menu (page 8-41).
To delete a molecular weight/quantity standard from a library:
1 If the library is already open, click in its Molecular weight library window toselect it.
Otherwise, choose Open library from the File menu to open the library.
2 Select the standard in the Molecular weight library window by clicking on thestandard’s name.
3 Choose Delete standard from the Edit menu (or right-click on the standard’sname to display a pop-up menu, and choose Delete).
Rename standard
You can only rename a molecular weight/quantity standard if the library is unlocked –see the entry for Unlock in the File menu (page 8-41).
To rename a molecular weight/quantity standard from a library:
1 If the library is already open, click in its Molecular weight library window toselect it.
Otherwise, choose Open library from the File menu to open the library.
2 Select the standard in the Molecular weight library window by clicking on thestandard’s name.
GeneTools User Manual 8-61
Edit (Molecular weight library window)
3 Choose Rename standard from the Edit menu (or right-click on thestandard’s name to display a pop-up menu, and choose Rename) to displaythe Rename dialog box:
4 Edit the name in the New name box.
5 Press OK to close the dialog box.
The standard will appear with the new name in the Molecular weight library window.
Edit (Profile comparison window)
Undo, Cut, Copy and Paste are the only commands appearing on the Edit menu when the Profile comparison window is selected. These commands are disabled for all typesof window, including the Profile comparison window.
8-62 GeneTools User Manual
Menus
View (Gel window)
The picture shows the View menu when a Gel window is selected. Some of thesecommands do not appear on the menu when other types of window are selected – seepages 8-69–8-71 for pictures. The only command that can appear on the View menuthat does not appear when a Gel window is selected is Spot numbers, which appearswhen a Spot blot/Manual band quantification window is selected – see page 8-70 fordetails.
Profile comparison
To open the Profile comparison window if it is not already open, or to select it if it is:
Choose Profile comparison from the View menu.
The Profile comparison window can be used to compare the profiles for differenttracks (which may be on different samples) by plotting them on the same axes.
GeneTools User Manual 8-63
View (Gel window)
See The Profile comparison window in the Windows chapter (page 6-18) for how to usethe Profile comparison window.
Histogram
To show or hide the Histogram viewer:
Choose Histogram from the View menu.
You can use the Histogram to view the distribution of intensities in the image and toadjust the image display – see The Histogram viewer in the Windows chapter (page6-34) for how to use the Histogram viewer.
Zoom in
To increase the magnification of the display of the Image pane in a Sample window, orto increase the horizontal scale of the profiles in the Profile comparison window:
Choose Zoom in from the View menu.
Zoom out
To reduce the magnification of the display of the Image pane in a Sample window, or to decrease the horizontal scale of the profiles in the Profile comparison window:
Choose Zoom out from the View menu.
Zoom reset
To remove any magnification from the display of the Image pane in a Sample window,or the horizontal scale of the profiles in the Profile comparison window:
Choose Zoom reset from the View menu.
8-64 GeneTools User Manual
Menus
Align banks of tracks
When the tracks are locked in all areas of interest, you can choose whether the Imagepane should display the original gel image with tracks marked on the image or displaythe tracks in aligned banks (see View modes, page 6-4, in the Windows chapter for adescription of the different modes).
To switch aligned banks of tracks view on or off:
Choose Align banks of tracks from the View menu.
The command is checked in the menu when the Image pane shows banks of tracks.
Viewing the tracks in aligned banks is particularly useful for High Throughput Gelsamples and is automatically selected when you lock a High Throughput Gel sample,though you can deselect it if required.
When aligned banks of tracks view is on, the only way to unlock the tracks is usingPosition all in the Track menu or the Position all button. Unlocking the tracks in anyarea of interest switches aligned banks of tracks view off.
Display corrected profiles
To choose whether to display corrected profiles (profiles with the backgroundsubtracted) or uncorrected profiles in the Profile pane:
Choose Display corrected profiles from the View menu.
The command is checked in the menu when the display of corrected profiles isswitched on.
Peak markers
To switch the display of peak markers on the tracks in the Image pane on or off:
Choose Peak markers from the View menu.
The command is checked in the menu when the display of peak markers is switchedon.
You can use Configuration in the Extras menu to change the color of the peak markers – see page 8-143.
GeneTools User Manual 8-65
View (Gel window)
Peak bounds
To switch the display of peak bounds on the tracks in the Image pane on or off:
Choose Peak bounds from the View menu.
The command is checked in the menu when the display of peak bounds is switched on.
You can use Configuration in the Extras menu to change the color of the peak bounds– see page 8-143.
Tracks
To switch the display of track markers in the Image pane on or off:
Choose Tracks from the View menu.
The command is checked in the menu when the display of track markers is switchedon.
You can use Configuration in the Extras menu to change the color of the track markers – see page 8-143.
Match lines
To switch the display of match lines on or off:
Choose Match lines from the View menu.
Note Match lines are only displayed if Matching is selected in the View menu.
No match lines are displayed if Profile is selected as the matching Type in theMatching Parameters dialog box – see Band Matching, page 8-53.
The match lines join peaks that have been matched on different tracks in the Imagepane.
The command is checked in the menu when the display of match lines is switched on.
You can use Configuration in the Extras menu to change the color of the match lines – see page 8-143.
8-66 GeneTools User Manual
Menus
Peak numbers only
To display just the peak numbers in the Peak value pane (the Graphics pane will beunaffected):
Choose Peak numbers only from the View menu.
Molecular weight
To display:
● the molecular weight calibration graph in the Graphics pane, and
● molecular weights in the Peak value pane:
Choose Molecular weight from the View menu.
Quantities
To display:
● the quantity calibration graph in the Graphics pane, and
● quantities in the Peak value pane:
Choose Quantities from the View menu.
Matching
To display track matching details:
Choose Matching from the View menu.
The effect is to display:
● the dendrogram in the Graphics pane; and
● when Band is selected as the matching Type in the Matching parameters dialogbox (see Band matching, page 8-53):
● the matching standard track profile overlaid on the selected track profile in theProfile pane
● the peak number and position of the peaks in the matching standard track in thePeak value pane
GeneTools User Manual 8-67
View (Gel window)
● Matching comparisons in the Results pane (if Profile is selected as the matchingType, the Matching comparisons tab is displayed but the table is always blank).
Maximize pane
To maximize the Graph or Results pane so that it fills the Gel window:
1 Click in the pane to select it.
2 Choose Maximize pane from the View menu.
To return the pane to its normal size:
Choose Maximize pane from the View menu again.
Or
Adjust the size of the Gel window.
Toolbars submenu
The contents of the Toolbars submenu depend on the type of window selected. Thepicture shows the submenu when a Gel window is selected – the only toolbar notincluded when a Gel window is selected is the Spot blot toolbar, which is displayedwhen a Spot blot/Manual band quantification window is selected.
To show or hide one of the GeneTools toolbars:
Choose the toolbar from the View®Toolbars submenu.
The toolbar will be checked in the submenu when it is displayed.
See the Toolbars chapter (chapter 7) for more information about working with toolbars.
8-68 GeneTools User Manual
Menus
Toolbar buttons on menus
To show or hide pictures of toolbar buttons next to the equivalent commands in menus:
Choose Toolbar buttons on menus from the View menu.
Status bar
To show or hide the Status bar at the bottom of the main window:
Choose Status bar from the View menu.
The status bar shows hints for using the tool or command under the pointer and avariety of other pieces of information depending on what type of window is selected,and what is selected in the window. For example:
● if you click in the Profile pane in a Gel window, the status bar shows the height ofthe profile at the pointer,
● if you select a spot frame in a Spot blot/Manual band quantification window, thestatus bar shows the spot number.
View (Spot blot/Manual band quantification window)
All of these commands except Spot numbers also appear on the menu when a Gelwindow is selected – see the relevant entries in the View (Gel window) section,page 8-63, for details.
GeneTools User Manual 8-69
View (Spot blot/Manual band quantification window)
Spot numbers
To show/hide identification labels on the spot frames:
Choose Spot numbers from the View menu.
Spot numbers is checked in the View menu when the labels are shown.
View (Colony counting window)
All of these commands also appear on the menu when a Gel window is selected – seethe relevant entries in the View (Gel window) section (page 8-63) for details.
View (Profile comparison window)
All of these commands except those on the Plot mode submenu also appear on themenu when a Gel window is selected – see the relevant entries in the View (Gelwindow) section, page 8-63, for details.
8-70 GeneTools User Manual
Menus
Plot mode submenu
The Plot mode submenu appears in the View menu when a Profile window is selected.
To use Rf as the horizontal axis for track profiles in the Profile comparison window:
Choose Rf from the View®Plot mode submenu.
To use (log) molecular weight as the horizontal axis for track profiles:
Choose MW from the View®Plot mode submenu.
Note If the Match software option is installed in your system, the parameter chosen for thehorizontal scale (Rf or MW) also determines the alignment used when matching tracksin the Profile comparison window.
View (Molecular weight library window)
All of these commands also appear on the menu when a Gel window is selected – seethe relevant entries in the View (Gel window) section (page 8-63) for details.
GeneTools User Manual 8-71
View (Molecular weight library window)
Track
The Track menu is displayed when a Gel window is selected.
Note Some Track menu commands are always disabled when the Gel window contains aHigh Throughput Gel sample; Height individual is always disabled when it contains aGel sample.
8-72 GeneTools User Manual
Menus
Locate tracks
Note The Locate tracks command is permanently disabled for High Throughput Gel samples.
To locate the tracks in the selected area of interest on the image in an existing securesample file automatically:
Choose Locate tracks from the Track menu.
Width individual
To choose whether to adjust the width of all tracks (in the selected area of interest) orjust the selected track when you use Width in the Track menu to adjust track width:
Choose Width individual from the Track menu.
When Width individual is checked in the Track menu, you can use Width in the Trackmenu to adjust the width of the selected track only; when Width individual isunchecked you can use Width in the Track menu to adjust the width of all tracks (inthe selected area of interest) at the same time.
Height individual
Note The Height individual command is selected and permanently disabled for Gel samples.
To choose whether to adjust the height and tilt of all tracks (in the selected area ofinterest) or just the selected track on a High Throughput Gel sample when you useMove/tilt in the Track menu to adjust track height and tilt:
1 Click in the Gel window containing the sample to select it.
2 Choose Height individual from the Track menu.
When Height individual is checked in the Track menu, you can use Move/tilt in theTrack menu to adjust the height and tilt of the selected track only; when Heightindividual is unchecked you can use Move/tilt in the Track menu to adjust the heightand tilt of all tracks (in the selected area of interest) at the same time.
GeneTools User Manual 8-73
Track
Lock all
The tracks shown on the sample in the Image pane in the Gel window can be eitherlocked or unlocked.
You need to lock the tracks before you can perform any of the functions that requirethe program to analyze the image along the tracks, such as locating the peaks, andassigning and calculating molecular weights and quantities.
To lock the tracks (in the selected area of interest) on a sample in the selected Gelwindow:
Choose Lock all from the Tracks menu.
When the tracks (in the selected area of interest) are locked, Lock all is checked in themenu and the button is shown as depressed in the toolbar.
To unlock the tracks (in the selected area of interest) on a sample in the selected Gelwindow:
Choose any of the tools for editing the tracks. These are:
● Position all
● Splay all (not for High Throughput Gels)
● Move/tilt
● Width
● Rf start (not for High Throughput Gels)
● Rf end (not for High Throughput Gels).
Position all
To adjust the overall positioning of all the tracks (in the selected area of interest) on asample together (see Splay all, page 8-76, for adjusting both the overall position andthe amount of track splay):
1 Click in the Gel window containing the sample to select it.
If there is more than one area of interest, click in the one you want tochange.
8-74 GeneTools User Manual
Menus
2 Choose Position all from the Track menu.
The tracks will be unlocked and drag boxes will appear at the outer corners of the two outside tracks.
3 Move the pointer over the drag box at the first corner that you want to move. The pointer will change to a four-way arrow.
4 Press and drag the corner box to its new position.
The outlines of the tracks’ new positions will be shown as you drag.
GeneTools User Manual 8-75
Track
5 Drop the corner box in its new position:
6 Repeat Steps 3–5 for the diagonally opposite corner if required.
Splay all
Note The Splay all command is permanently disabled for High Throughput Gel samples.
This topic describes how to adjust the amount by which the tracks on a sample aresplayed apart.
To adjust the amount by which the tracks (in the selected area of interest) on a sampleare splayed apart (see Position all, page 8-74, for adjusting the overall positioning,without changing the amount of track splay):
1 Click in the Gel window containing the sample to select it.
If there is more than one area of interest, click in the required you want tochange.
2 Choose Splay all from the Track menu.
8-76 GeneTools User Manual
Menus
The tracks will be unlocked and drag boxes will appear at the outer corners of the two outside tracks:
3 Move the pointer over the drag box at the first corner that you want to move. The pointer will change to a four-way arrow:
GeneTools User Manual 8-77
Track
4 Press and drag the corner box to its new position.
The outlines of the tracks’ new positions will be shown as you drag:
5 Drop the corner box in its new position:
6 Repeat Steps 3–5 for the other corners if required.
Move/tilt
The first three steps in moving, tilting or bending a track are the same.
To move, tilt or bend a track, first:
1 Click (in the selected area of interest) in the Gel window containing thesample to select it.
8-78 GeneTools User Manual
Menus
2 Choose Move/tilt from the Track menu. The tracks will be unlocked.
3 Click in the track that you want to adjust to select it. The track will behighlighted and will have a drag box at each end.
You can now move, tilt or bend the track.
To move an individual track on a sample:
4 Perform Steps 1-3 as above.
5 Move the pointer to a point anywhere within the track (not on the dragboxes):
6 Press and drag the track to its new position:
GeneTools User Manual 8-79
Track
7 Drop the track in its new position:
To tilt an individual track on a sample:
4 Perform Steps 1–3 as above.
5 Move the pointer over the drag box at the first end that you want to move.The pointer will change to a four-way arrow:
6 Press and drag the box to its new position. You can drag to any positionprovided you do not overlap other tracks or invert the electrophoresisdirection.
8-80 GeneTools User Manual
Menus
The outline of the track’s new position will be shown as you drag:
7 Drop the track in its new position:
8 Repeat Steps 5–7 for the other end of the track if required.
To bend an individual track on a sample:
4 Perform Steps 1–3 as above.
GeneTools User Manual 8-81
Track
5 Double-click at the point on the track that you want to bend it. A new dragbox will appear at that point:
When you place the pointer over the drag box, it turns into a four-way arrow:
8-82 GeneTools User Manual
Menus
6 Press and drag the box to its new position. You can drag to any positionprovided you do not overlap other tracks or invert the electrophoresisdirection.
The outline of the track’s new shape will be shown as you drag.
7 Drop the drag box in its new position.
GeneTools User Manual 8-83
Track
8 Repeat Steps 5–7 if you want to put any other bends in the track.
To remove a bend in an individual track on a sample:
4 Perform Steps 1–3 as above. Drag boxes will appear at the ends of the trackand at any bend points.
5 Double-click on the drag box at the apex of the bend that you want toremove.
Width
Note You can use Width individual in the Track menu to choose whether to change thewidth of the selected track only or of all tracks (in the selected area of interest) together: the following instructions apply in either case. When you adjust the widths of all tracksat the same time, all tracks are set to the width of the track that you are using to adjustthe track width.
To adjust track width on a sample:
1 Click (in the area of interest) in the Gel window containing the sample toselect it.
2 Choose Width from the Track menu. The tracks will be unlocked.
3 Click in the track that you want to adjust to select it. The track will behighlighted and will have a drag box on each corner:
8-84 GeneTools User Manual
Menus
4 Move the pointer over one of the drag boxes (it doesn’t matter which):
5 Press and drag at right angles to the electrophoresis direction (for example,sideways if the electrophoresis direction is up or down). As you are dragging,the new outline of the track will be shown:
6 Release to set the new track width:
GeneTools User Manual 8-85
Track
Rf start position
and
Rf end position
Note The Rf start position and Rf end position commands are permanently disabled forHigh Throughput Gel samples.
When you compare profiles, the profiles (which may be taken from different securesample files) are plotted on an Rf scale from 0 to 1 taken between the Rf start and endlines.
You can adjust the position of the Rf lines in the electrophoresis direction, the angle ofthe lines across the electrophoresis direction, or add bends to the lines.
The first two steps in all these procedures are the same.
Note Adjusting the overall position or splay of the tracks on the sample also adjusts theposition of the Rf lines, so you should make any adjustments to the track position andsplay before adjusting the Rf lines.
To adjust the Rf start or end position (in an area of interest) on a sample:
1 Click (in the area of interest) in the Gel window containing the sample toselect it.
2 Choose Rf start position from the Track menu
or
Choose Rf end position from the Track menu.
8-86 GeneTools User Manual
Menus
The tracks will be unlocked and two drag boxes will appear on the appropriate Rf line(the examples show the Rf end line, but the procedures are identical for both):
You can now either just move the whole line along the electrophoresis direction, adjustthe angle of the line or add bends to the line.
To move an Rf line without changing its angle:
3 Follow Steps 1–2 above.
4 Move the pointer over the line, but not over either of the drag boxes. Thepointer will change to a two-way arrow.
5 Press and drag the line to its new position.
The line’s new position will be shown as you drag.
GeneTools User Manual 8-87
Track
6 Drop the line in its new position.
To adjust the angle of an Rf line:
3 Follow Steps 1-2 above.
4 Move the pointer over one of the drag boxes. The pointer will change to afour-way arrow:
5 Press and drag the box to change the angle of the line.
As you drag the box, the new position of the line will be shown on thesample (the line pivots about the other drag box):
8-88 GeneTools User Manual
Menus
6 Drop the line in its new position:
To add a bend to an Rf line:
3 Follow Steps 1–2 above.
4 Move the pointer to the point on the sample where you want the apex of the bend:
5 Double-click. The bend will be added to the line with a new drag box at itsapex:
6 If you want to adjust the position of the bend, place the pointer over the drag box. The pointer will change to a four-way arrow and you can drag the boxto a new position.
7 Repeat Steps 4–6 for any other bends you want to add.
GeneTools User Manual 8-89
Track
To remove a bend from an Rf line:
3 Follow Steps 1–2 above.
4 Double-click on the drag box at the apex of the bend.
Invert profile
To invert the peak profile for a track (you would use this for a Zymer gel or a gel thathas tracks with light bands and tracks with dark bands):
1 Click in the track to select it.
2 Choose Invert profile from the Track menu.
Edit manual baseline
To set a manual baseline for a track’s profile:
1 Click on the track in the Image pane to select it.
2 Right-click in the Image pane (or Profile pane) to display a context menu.
8-90 GeneTools User Manual
Menus
3 Choose Edit manual baseline.
The baseline will be displayed with circular drag handles at its ends and in the color selected for the manual baseline (you can use Configuration in theExtras menu to change the color of the manual baseline – see page 8-143).
4 If required, double-click on the baseline to add additional drag handles sothat you can bend the line.
Any peak markers and boundaries will be removed from the profile.
GeneTools User Manual 8-91
Track
5 To reshape the baseline:
a Position the pointer over the drag handle you want to move. The pointerwill change to a four-way arrow.
b Drag the handle to reshape the baseline.
8-92 GeneTools User Manual
Menus
c Drop the handle in its new position.
Note You cannot drag a handle above the profile line. While you are dragging a handle, thenew baseline may be drawn above the profile, but when you release the mouse buttonit will be reshaped so that it always lies below it.
For example, when you release the mouse button,
will become
GeneTools User Manual 8-93
Track
Delete manual baseline
To delete a manual baseline for a track:
1 Click on the track in the Image pane to select it.
2 Right-click in the Image pane (or Profile pane) to display a context menu.
3 Choose Delete manual baseline.
MW/quantity standard
To define a track as a molecular weight and/or quantity standard (for its area of interest) if it is not already defined as a standard, and to assign molecular weights and/orquantities to the peaks:
1 Click in the required track to select it.
2 Locate the peaks on the track if they haven’t already been located.
3 If necessary, edit the peaks.
(In particular, if you want to assign a set of molecular weights from a standard, you should remove any spurious peaks to avoid any standards being assignedto them.)
4 Choose MW/quantity standard from the Track menu (or the pop-up menudisplayed by right-clicking in the track label) to define the track as a molecular weight/quantity standard.
The track will be labeled MwS and the command will be checked in themenus when the track is selected.
5 The Assign molecular weight/quantity dialog box will be displayed open atthe From standard page so that you can assign molecular weights and/orquantities to the peaks in the track.
This dialog box is also displayed when you choose Assign molecular weightfrom the Peak menu – see page 8-104 for details.
To remove the molecular weight/quantity standard track status from a track:
1 Click in the required track to select it.
8-94 GeneTools User Manual
Menus
2 Choose MW/quantity standard from the Track menu (or the pop-up menudisplayed by right-clicking in the track label).
The MwS, QuS or MQS label will be removed from the track and thecommand will be unchecked in the menus when the track is selected.
Matching standard
This operation is only available if you have purchased the GeneTools Match softwareoption.
Note This command is only relevant when the matching Type selected in the Matchingparameters dialog box (See Band matching, page 8-53) is Band; you do not need todefine a matching standard for Profile matching.
When you match peaks on the tracks in an area of interest, they are matched to theactive matching standard track for that area of interest.
To make a track a matching standard (and in the process make it the active matchingstandard for its area of interest):
1 Click on the track in the Image pane to select it.
2 Choose Matching standard from the Track menu.
(Alternatively, right-click on the track’s label in the Track label pane to select it and popup a menu, then choose Matching standard from the menu.)
The track label will show MS* – the MS means it is a matching standard, the * means it is the active matching standard (if there was a previous active matching standard, it willnow show MS to show that it is still a matching standard but no longer the activematching standard).
See the entry for Active matching standard in the Track label context menu,page 8-149, for how to make an existing matching standard the active matchingstandard.
To remove matching standard status from a track:
1 Click on the track in the Image pane to select it.
GeneTools User Manual 8-95
Track
2 Choose Matching standard from the Track menu again.
(You can use the track context menu instead if you wish.)
If the track was the active matching standard, the other matching standard (if any) withthe highest track number will become the active matching standard.
Insert
Before carrying out any of the procedures described in this topic for inserting tracks,you must:
1 Click in the Gel window containing the sample to select it; if there is morethan one area of interest, click in the relevant one.
2 Unlock the tracks if they are locked (choose any of the track editingcommands such as Position all, Move/tilt and so on).
Note In order to place a track on a sample by double-clicking, you must choose Move/Tilt or Width from the Track menu to unlock the tracks.
You can now place a new tracks on a sample by:
● selecting a menu command
● double-clicking
● dragging out the track.
8-96 GeneTools User Manual
Menus
Using a menu command
To place a new track on a sample using a menu command after following Steps 1and 2:
3 Click in the track to the right of the space into which you want to insert thenew track:
4 Choose Insert from the Track menu.
Provided there is enough space for the track (including inter-track space) the new trackwill be inserted. The new track will have the same size and shape as the selected track.
You may need to adjust the position or the width of the track after it has been inserted.
GeneTools User Manual 8-97
Track
Double-clicking
To place a track on a sample by double-clicking after following Steps 1 and 2:
Note In order to place a track on a sample by double-clicking, you must choose Move/Tilt or Width from the Track menu to unlock the tracks at Step 2.
3 Click on a track with the size and shape required for the new track (you canalways change these later).
Note You cannot use a track from a different area of interest as the model for the new track – you must select a track in the same area of interest.
4 Double-click at the point where you want the track to be.
The track will be inserted centered horizontally at the point you clicked provided thiswould not cause the new track to overlap existing tracks. If there would be an overlap,the track is not inserted.
Dragging
To place a track on a sample by dragging out the track after following Steps 1 and 2:
3 If Width individual is unchecked in the Track menu, choose it to setindividual width mode.
4 Move the pointer to the position where you want to place one of the cornersof the track (it doesn’t matter which corner):
8-98 GeneTools User Manual
Menus
5 Press and drag out to the opposite corner (a rectangle will be drawn on theimage as you are dragging, to show the position of the track):
6 Release to place the track on the sample.
Delete
To delete a track from a sample:
1 Click in the track in the Image or Track label pane to select it.
2 Unlock the tracks if they are locked.
3 Choose Delete from the Track menu or press con the keyboard.
GeneTools User Manual 8-99
Track
Enable
To enable a disabled track:
1 Lock the tracks in all the areas of interest in the Gel window.
2 Click on the track in the Image or Track label pane to select it.
3 Choose Enable from the Track menu or the pop-up menu displayed whenyou right-click in the Track label pane.
Disable
To disable a track:
1 Lock the tracks in all the areas of interest in the Gel window.
2 Click on the track in the Image or Track label pane to select it.
3 Choose Disable from the Track menu or the pop-up menu displayed whenyou right-click in the Track label pane.
When a track is disabled, the label in the Track label pane, the profile in the Profilepane and values in the Peak value pane are grayed. Results for disabled tracks do notappear in the Results pane or in printed reports.
Copy to clipboard
To copy a picture of the image lying within the borders of the selected track to theclipboard:
Choose Copy to clipboard from the Track menu or the context menudisplayed when you right click in the Track label pane.
Description
To add a description for a track:
1 Lock the tracks in all the areas of interest in the Gel window.
2 Click on the track in the Image or Track label pane to select it.
8-100 GeneTools User Manual
Menus
3 Choose Description from the Track menu or the pop-up menu displayedwhen you right-click in the Track label pane, to display the Track descriptiondialog box:
4 Type the description in the edit box.
5 Press OK to confirm the description and close the dialog box.
The description will be shown in the track Description pane in the Gel window –“Solution XF9” in the following example:
The description will also be shown with the results for individual tracks if they areincluded in Gel reports.
GeneTools User Manual 8-101
Track
Properties
To display information about a track selected in the Image pane:
1 Click in the Gel window containing the sample to select it.
2 Click in the track in the Image or Track label pane to select it.
3 Choose Properties from the Track menu to display the Track propertiesdialog box:
8-102 GeneTools User Manual
Menus
4 Click on the Peaks tab to display a table of information about the peaks inthe track:
The Track properties dialog box can also be displayed for the track selected in theProfile comparison window by choosing Properties from the Profile menu.
GeneTools User Manual 8-103
Track
Peak
Assign molecular weight
Notes You can only assign molecular weights/quantities when the tracks are locked – see theentry for Lock all in the Track menu (page 8-74).
You will need to define molecular weight/quantity standard tracks and assign molecularweights to them in each area of interest for which you want molecular weight results –the molecular weight calibrations in each area of interest are independent of all theothers (but for quantities, you can use the quantity calibration from a different area ofinterest).
To assign molecular weights and/or quantities to a molecular weight/quantity standardtrack (see the entry for MW/quantity standard in the Track menu (page 8-94) for howto make a track a molecular weight/quantity standard track):
1 If you want to assign a molecular weight/quantity to a single peak, select it inthe Image pane or Profile pane; if you want to assign a series of molecularweights/quantities, select the first (highest molecular weight) peak to whichyou want to assign a molecular weight/quantity. In fact this step is not essential as you can change the selected peak later.
Note When you assign molecular weights/quantities from a molecular weight standard library,the molecular weights/quantities in the standard are assigned to each peak in turn,starting from the selected peak. You should check that each peak in the trackcorresponds to a molecular weight/quantity in the standard, and vice versa – delete anyspurious peaks (see Delete®Selected peak(s) – page 8-113) and add any missing ones(double-click in the profile pane).
8-104 GeneTools User Manual
Menus
2 Choose Assign molecular weight from the Peak menu.
The Assign molecular weight/quantity dialog box will be displayed open atthe From standard page:
The Selected peak box shows the number of the selected peak; you can change itusing the arrow buttons, but not by typing into the box. The Calculated MW box is also read-only and will show the molecular weight of the selected peak calculated using anyother molecular weights you have entered and the peak position – it will show 0 if youhave not entered enough data to calculate a molecular weight.
This dialog box allows you to assign molecular weights and/or quantities from a standard or assign molecular weights and/or quantities to individual peaks manually. It also allows you to edit a molecular weight/quantity standard in a library and change the waymolecular weights and quantities are calculated from molecular weight/quantitystandard tracks.
To assign molecular weights and/or quantities from a molecular weight standard library:
1 If the Selected peak box does not show the peak corresponding to the firstmolecular weight/quantity in the standard, use the arrow buttons to select that peak.
GeneTools User Manual 8-105
Peak
Arrow buttons to selectthe track peak
Standards drop-down list
Details of selected standard
2 Choose the required standard from the Standards drop-down list.
The list box below the Standards drop-down list will show the peak/molecular weights/quantities for the standard.
3 Press Assign from standard.
To assign molecular weights and/or quantities to individual peaks manually:
1 Click on the Manual tab to display the Manual page:
2 If the Selected peak box does not show the peak to which you want to assign a molecular weight or quantity, use the arrow buttons to select it.
3 To assign a molecular weight:
a Enter the molecular weight that you want to assign in the Assigned MWbox.
b Press Assign value to peak.
The Selected peak box will show the next peak ready for you to assignthe next molecular weight.
8-106 GeneTools User Manual
Menus
To assign a quantity:
a Press Assign quantity to peak to display the Assign calibrated quantitiesdialog box.
b This dialog box is also displayed when you choose Assign quantity fromthe Peak menu – see page 8-110 for details.
4 Repeat Steps 2 and 3 for any other molecular weights/quantities that youwant to assign (you must assign at least two molecular weights).
When you press Assign from standard on the From standard page or Assign value topeak or Assign quantity to peak on the Manual page:
● The assigned molecular weight(s)/quantities will appear in the Peak value pane nextto the relevant peak(s) in the Profile pane when Molecular weight/Quantity isselected in the View menu:
GeneTools User Manual 8-107
Peak
● The peak marker on the track in the Image pane will have a short line across it toshow that it has been assigned a molecular weight and/or quantity:
● The MW calibration tab/Quantity calibration tab in the Gel window’s Graphicspane will show (for the selected area of interest) the calibration points and theselected calibration curve joining them (see the next instructions for selecting thetype of calibration curve). For example (see the next command for an exampleshowing the Quantity calibration tab):
Note You can define more than one track in an area of interest as a standard, and assignmolecular weights to each of them (see the next step for choosing how multiplestandard tracks are used to calculate the molecular weights on other tracks).
To specify how molecular weights/quantities are calculated from standard tracks:
Press Edit calibration or Edit quantity calibration in the Assign molecularweight/quantity dialog box to display the Molecular weight calibration orQuantity calibration dialog box.
8-108 GeneTools User Manual
Menus
These dialog boxes are also displayed when you choose Molecular weightcalibration or Quantity calibration from the Edit menu – see page 8-50 and page 8-52 for details.
To edit an existing molecular weight/quantity standard or to create a new one:
Click on the Edit standard tab to display the Edit standard page:
To edit a standard:
a Choose the standard from the drop-down list box.
b Press Edit standard to display the Edit molecular weight standard dialogbox.
This dialog box is also displayed when you choose Edit standard from theEdit menu when a Molecular weight library window is selected – seepage 8-59 for details.
To create a new standard:
Press New standard to display the New standard dialog box.
This dialog box and the Edit molecular weight standard dialog boxfollowing it are also displayed when you choose New standard from the
GeneTools User Manual 8-109
Peak
Edit menu when a Molecular weight library window is selected – seepage 8-57 for details.
Assign quantity
Note You can only assign quantities to peaks when the tracks are locked – see the entry forLock all in the Track menu, page 8-74.
Note The Assign quantity command will be disabled if you have defined more than one area of interest and chosen to base the quantity calibration in the selected area of interest on another area of interest – see the entry for Quantity calibration in the Edit menu,page 8-52, for how to set the quantity calibration method.
Note You can also assign quantities using the Assign molecular weight command – see theprevious command.
To assign a quantity to a peak in a track:
1 Click in the required track in the Image pane in the Gel window to select it.
2 Locate the peaks on the track if they haven’t already been located.
3 Select the peak to which you want to assign a quantity.
4 Choose Assign quantity from the Peak menu (or the pop-up menu displayedwhen you right-click on the peak) to display the Assign calibrated quantitiesdialog box:
8-110 GeneTools User Manual
Menus
The Peak box is read-only: it shows which peak was selected when youopened the dialog box. The Raw quantity box is also read-only: it shows theuncalibrated quantity calculated from the area of the peak. The Calibratedquantity box shows the quantity calculated using the existing calibration ifthere is one, and 0 if there isn’t.
The radio buttons are disabled if you have chosen to use a single calibrationcurve for all tracks – see the entry for Quantity calibration in the Edit menu,page 8-52, for how to set the quantity calibration method.
5 Enter a quantity in the Calibrated quantity for the selected peak to add anew calibration point to the calibration curve.
6 If you have chosen to calibrate Each track to separate curves (see Quantitycalibration in the Edit menu – page 8-52):
Click on No propagation if you do not want this quantity assignmentapplied to any other tracks.
or
Click on Propagate by peak number to apply this quantity assignment tothe same peak number on all other tracks.
or
a Click on Propagate by Rf to apply this quantity assignment to peaks withthe same Rf (within the given tolerance) on all other tracks.
b Enter a figure in the Tolerance box specifying how close the Rf of a peakon another track has to be to the Rf of the selected peak for it to beassigned the quantity calibration.
After you have assigned a quantity to a peak:
● The Quantity calibration tab in the Gel window’s Graphics pane will show (for theselected area of interest) the calibration points and the selected calibration curvejoining them (see Quantity calibration in the Edit menu, page 8-52, for how to
GeneTools User Manual 8-111
Peak
select the type of calibration curve: the example shows a quadratic calibration curve– the equation of the curve is given in the Raw volume axis label):
The horizontal axis shows the raw quantity measured on the gel; the vertical axisshows the calibrated quantity.
● The assigned quantity and the quantities calculated from the calibration curve willappear in the Peak value pane next to the relevant peak(s) in the Profile pane.
Unassign molecular weight
To remove a molecular weight assignment from a peak:
1 Select the peak by clicking on it in the Profile pane or the Image pane.
2 Choose Unassign molecular weight from the Peak menu.
The command is disabled if the selected peak does not have a molecular weightassignment.
Unassign quantity
To remove a quantity assignment from a peak:
1 Select the peak by clicking on it in the Profile pane or the Image pane.
2 Choose Unassign quantity from the Peak menu.
8-112 GeneTools User Manual
Menus
The command is disabled if the selected peak does not have a quantity assignment.
Locate submenu
The commands on the Locate submenu are disabled unless the tracks are locked.
To detect the peaks on the selected track automatically:
Choose On selected track from the Peak®Locate submenu.
To detect the peaks on all tracks (in the selected area of interest) automatically:
Choose On all tracks from the Peak®Locate submenu.
Delete submenu
The commands on the Delete submenu are disabled unless the tracks are locked.
To delete one or more adjacent peaks from the selected track:
1 In the profile pane, move the pointer to a point within the first peak.
2 Drag to the final peak.
3 Choose Selected peak(s) from the Peak®Delete submenu.
To delete all the peaks from the selected track:
Choose All peaks on selected track from the Peak®Delete submenu.
To delete all the peaks from all tracks (in the selected area of interest):
Choose All peaks on all tracks from the Peak®Delete submenu.
GeneTools User Manual 8-113
Peak
Properties
To display a read-only dialog box showing properties of the selected peak:
Choose Properties from the Peak menu:
Profile
The Profile menu appears in the menu bar when the Profile comparison window isselected: see the entry for Profile comparison in the View menu, page 8-63, for howto display the Profile comparison window and Profile comparison window, page 6-18,for more information about the Profile comparison window.
8-114 GeneTools User Manual
Menus
Reference
To select a track in a Profile comparison as the reference track (if the GeneToolsmatching option is installed, the reference track will also be used as the matchingreference for peak matching – see Matching tracks in the Profile comparison window,page 1-123):
1 Select the track by clicking on it in the left-hand pane in the Profilecomparison window.
2 Choose Reference from the Profile menu (or the context menu displayedwhen you right-click in a profile window).
If the track selected as the reference track is shown (see next command), it will beplotted in the selected highlight color in the Profiles pane. (The highlight color is red bydefault, but you can set another color using the Configuration dialog box – see page8-143 for details)
If you repeat the procedure for:
● another track, the new track will become the reference track
● a track that is already the reference track, it will be deselected and there will be noreference track.
Show
To include a track in the Profile comparison window in a comparison if it is notalready included (or to remove it if it is):
1 Select the track by clicking on it in the left-hand pane in the Profilecomparison window.
2 Choose Show from the Profile menu (or the pop-up menu displayed whenyou right-click on a track in the Profile comparison window).
The command is checked in the menu when the selected track is included in thecomparison.
GeneTools User Manual 8-115
Profile
Show all
To include all the tracks in the Profile comparison window in a comparison:
Choose Show all from the Profile menu.
Hide all
To remove all the tracks from a comparison in the Profile comparison window:
Choose Hide all from the Profile menu.
Export to Excel
To export to Excel the data points (Rf and height values) for a profile displayed in theProfile comparison window:
1 Select the track by clicking on it in the left-hand pane in the Profilecomparison window.
2 If the track is not already included in the comparison, choose Show from theProfile menu (or the pop-up menu displayed when you right-click on a trackin the Profile comparison window).
3 Choose Export to Excel from the Profile menu (or the pop-up menudisplayed when you right-click on a track in the Profile comparison window).
Note Export to Excel is only enabled for tracks that are currently shown in the Profilecomparison window.
The data will be exported to a new worksheet in Excel, which will be opened if it is not already open. One data point will be exported for each pixel along the track.
8-116 GeneTools User Manual
Menus
Properties
To display information about a track selected in the Profile comparison window:
1 Click on the track in the left-hand pane of the Profile comparison window to select it.
2 Choose Properties from the Profile menu (or the pop-up menu displayedwhen you right-click on a track in the Profile comparison window) to display the Track properties dialog box.
This dialog box is also displayed when you select Properties from the Trackmenu for a track selected in an Image window – see page 8-102 for details of the information shown in this dialog box.
Matching
Note The commands in the Matching menu are only available if the GeneTools matchingoption is installed.
The menu appears in the menu bar when the Profile comparison window is selected:see the entry for Profile comparison in the View menu, page 8-63, for how to displaythe Profile comparison window; and Profile comparison window, page 6-18, for moreinformation about the Profile comparison window; and Matching tracks in the Profilecomparison window, page 1-123, for detailed instructions on how to carry out matching in the Profile comparison window.
GeneTools User Manual 8-117
Matching
Parameters
To set or view the tolerance and method used for matching in the Profile comparisonwindow:
1 Choose Parameters from the Matching menu to display the Matchingparameters dialog box:
Note This dialog box is also displayed when you choose Band matching from the Edit menuwhen an area of interest is selected in a Gel sample window – the settings you makehere for the Profile comparison window are independent of any settings you may have made for any areas of interest.
2 In the Matching box:
a In the Type box, select Band or Profile to decide whether to match tracksusing the detected bands (peaks) or the intensity profiles.
8-118 GeneTools User Manual
Menus
Note When Profile is selected:
● There is no need to detect the peaks on the tracks (unless you choose to match onthe basis of molecular weights by choosing MW from the View®Plot modesubmenu).
● There is no need to define a matching reference track.
● The Similarity Coefficient controls in the Matching parameters dialog box aredisabled.
b If you selected Band in the Type box, select Dice or Jaccard from theSimilarity Coefficient box to choose how the similarity coefficients shouldbe calculated – see Similarity matrix, page 1-114, for how the similaritycoefficients are defined.
Note The Alignment radio buttons are permanently disabled when you display the dialog box for the Profile comparison window – the setting (Rf or MW) is controlled by thecommands in the View®Plot mode submenu, which also set the horizontal axis of thegraphs in the Profiles pane.
3 Enter a Tolerance figure to set a limit to the accuracy required whenmatching peaks (this does not have to be a whole number).
Note For Profile matching, the Tolerance must be set to a number less than or equal to 1.
4 In the Dendrogram Drawing box choose whether to use UPGMA orNeighbor Joining as the linkage rule for the dendrogram – see Thedendrogram, page 6-10, for a description of these linkage rules.
5 Press Apply to see the effect of the settings without closing the dialog box;press OK to save the new settings and then close the dialog box.
Include all
To include all the tracks in the Profile comparison window in the matching:
Choose Include all from the Matching menu.
GeneTools User Manual 8-119
Matching
Exclude all
To exclude all the tracks in the Profile comparison window from the matching:
Choose Exclude all from the Matching menu.
Include selected in matching
Note This command is only available if the GeneTools matching option is installed.
To include a track in the Profile comparison window in a matching if it is not alreadyincluded (or to remove it if it is):
1 Select the track by clicking on it in the left-hand pane in the Profilecomparison window.
2 Choose Include selected in matching from the Matching menu (or thepop-up menu displayed when you right-click on a track in the Profilecomparison window).
The command is checked in the menu when the selected track is included in thematching.
You must include at least three tracks in the matching to produce matching results.
Note You can choose Include all from the Matching menu to include all tracks in thematching or Exclude all from the Matching menu to remove all tracks from thematching.
See Matching tracks in the Profile comparison window, page 1-123, for detailedinstructions on how to carry out matching in the Profile comparison window.
Database menu
Note The Database menu and toolbar are only available if you have purchased theGeneDirectory option.
8-120 GeneTools User Manual
Menus
Archive gel to database
Note The Archive gel to database command is disabled unless GeneTools is alreadyconnected to a GeneDirectory database (see the entry for Connect to database,page 8-126). However, GeneDirectory does not need to be running for the commandto be available, and if it is running, it does not matter which, if any, database is open.
The Archive gel to database command enables you to transfer gel data from GeneToolsto GeneDirectory. GeneDirectory works with the gel analysis data calculated inGeneTools, so it is important to ensure that this data is as accurate and complete aspossible before transferring it to GeneDirectory. In particular, you should check that theRf start and finish lines are correct and that, where relevant, you have assigned anymolecular weight ladders to enable GeneDirectory to carry out any requirednormalization.
Note Because of the difficulty of maintaining consistency across gels, you are recommendednot to use Rf values alone.
To archive gel data to the connected database:
1 Use GeneTools to analyze the gel as required.
GeneTools User Manual 8-121
Database menu
2 Choose Archive gel to database from the GeneTools Database menu todisplay the Database dialog box:
3 On the Select Tracks page, to select the tracks for which you want to transferdata to the GeneDirectory database:
a Click on a track to select or deselect it – selected tracks are shown by acheck.
b Check or uncheck Include molecular weight standard tracks if you wantto select or deselect any molecular weight standard tracks.
c Press Select all tracks to select all tracks (except molecular weightstandard tracks unless Include molecular weight standard tracks ischecked).
8-122 GeneTools User Manual
Menus
4 Click on the Archive to experiment tab to display the Archive to Experimentpage:
The left-hand pane shows the folders and experiments in the databasestructure – you can open a folder to display any subfolders and experimentsin a folder by clicking on its + icon or hide them by clicking on its - icon.
When you select an experiment in the left-hand pane, the right-hand paneshows the gels it contains. You can open a gel in the right-hand pane todisplay the tracks it contains by clicking on its + icon or hide them by clicking on its - icon.
You use the Archive to experiment page to select the experiment to containthe gel data. You can create a new experiment or export the data to anexisting one. You can also create a new folder to hold the new experiment,and edit the names of folders and experiments.
5 To create a new folder in a folder:
a Click on the parent folder in the left-hand pane to select it.
GeneTools User Manual 8-123
Database menu
b Press New Folder to create the new folder with the default name ‘NewFolder’.
c Click on the ‘New folder’ label to select the folder and click again to select the name text.
d Edit the folder name.
Note Folder names must be unique within folders – you will not be able to create a secondnew folder in a folder until you have edited the name of the first new folder.
6 To create a new experiment in a folder:
a Click on the folder in the left-hand pane to select it.
b Press New Experiment to create the new experiment with the defaultname ‘New experiment’.
c Click on the ‘New experiment’ label to select the experiment and clickagain to select the name text.
d Edit the experiment name.
Note Experiment names must be unique within the database – you will not be able to createa new experiment if the database already contains an experiment called ‘Newexperiment’.
7 To add gel data to an experiment:
a Click on the experiment in the left-hand pane to select it.
b Press Archive to Experiment to add the gel to the experiment – the gelwill appear in the right-hand pane.
8-124 GeneTools User Manual
Menus
Note GeneTools assigns a unique identifier to each gel, so it will be able to detect whetheryou have previously exported data from the current gel to the database. If you have,you will be asked if you want to create a copy of the data, and if you do, the gel willbe labeled accordingly. However, since you can reanalyze the data in GeneToolsbetween exports and select different tracks for each export, the data contained in acopy may not be the same as the data originally exported, or the same as in othercopies.
8 Press Done to close the Database dialog box.
Open GeneDirectory
Note The Open GeneDirectory command is disabled unless GeneTools is already connectedto a GeneDirectory database (see the entry for Connect to database, page 8-121).
To open the connected database in GeneDirectory.
Choose Open GeneDirectory from the GeneTools Database menu.
GeneDirectory will be started up if it is not already running. If GeneDirectory is alreadyrunning with a database open in it, that database will be closed. The connecteddatabase will then be opened in GeneDirectory.
Notes If the connected database is already open in GeneDirectory, choosing OpenGeneDirectory will close it and any open View windows.
Choosing Open GeneDirectory will have no effect if GeneDirectory is already runningand is displaying a dialog box.
GeneTools User Manual 8-125
Database menu
Connect to database
To connect GeneTools to a GeneDirectory database:
1 Choose Connect to database from the GeneTools Database menu to displaya standard Windows Open dialog box:
2 Select the folder holding the database file from the Look in drop-down list.
3 Click on the database file in the file list box to select it.
4 Press Open to connect GeneTools to the database.
The database connection is saved when you close GeneTools, so it will be reconnectedautomatically to the same database when you reopen it.
Note You can only use the Archive gel to database (see page 8-121) and OpenGeneDirectory (see page 8-125) commands if GeneTools is connected to a database.
8-126 GeneTools User Manual
Menus
Spots
Circle
To make the selected rectangular frame circular or all frames circular if All spots samesize is set:
Choose Circle from the Spots menu.
Rectangle
For a Spot blot sample, to make the selected circular frame rectangular or all framesrectangular if All spots same size is set:
Choose Rectangle from the Spots menu.
GeneTools User Manual 8-127
Spots
For a Manual band quantification sample, to place a rectangular box over a band onthe sample:
1 If it isn’t already selected, choose Position any spot from the Spots menu tounlock the sample for changing boxes.
2 If it isn’t already selected, choose Rectangle from the Spots menu
3 Use the mouse to drag out the shape of the box you want to add.
When you release the mouse button the box will be drawn in the color for selectedspot frames (you can use Configuration in the Extras menu to set the color) andlabeled with a number showing the order in which the box was added. Themeasurement taken from the box will be shown in the Manual band quantificationresults table.
See How to adjust the size and shape of spot frames, page 4-21, for how to change theshape of rectangular frames/boxes on the image.
Free hand
Note This command only applies to Manual band quantification samples.
To draw a free hand box over a band on a Manual band quantification sample:
1 If it isn’t already selected, choose Position any spot from the Spots menu tounlock the sample for changing boxes.
2 If it isn’t already selected, choose Free hand from the Spots menu.
8-128 GeneTools User Manual
Menus
3 Move the pointer to the position where you want to start drawing the freehand box:
4 Press the left-hand mouse button, and keeping it pressed, move the mouse to draw the outline of the box:
The outline will be labeled with a number showing the order in which it hasbeen added.
5 When you have completed the outline, release the mouse button. The outline will be closed and drag boxes placed where the outline changes direction:
GeneTools User Manual 8-129
Spots
After it has been added, you can adjust the overall position of the box by dragging apoint inside the box, or reshape it by dragging the handles on its outline.
All spots same size
To set all the spot frames to the same size and shape as the selected spot frame:
Choose All spots same size from the Spots menu.
The shape and size of all the spot frames will be adjusted to match the selected spotframe.
While All spots same size is set, if you adjust the size or shape of an individual spotframe, all the spot frames will be adjusted to match them.
If All spots same size is set when you locate spots automatically, the spot frames placed on the detected spots will all have the same size; if it is not set, the spot frames will besized individually for each spot detected.
Position control points
To unlock the spot frames on a gridded Spot blot image so that you can move orreshape the grid using control points:
Choose Position control points from the Spots menu.
The spot frames are also unlocked so that you can change their size and (in the case ofrectangular spot frames) shape using the mouse.
The command is checked in the menu and the button is shown as depressed when thespot frames are unlocked; choose the command or press the button again to lock them.
See Adjusting the positions of all the spot frames in a grid, page 4-26, for how to usethe control points to adjust the grid.
8-130 GeneTools User Manual
Menus
Locate
To locate spots automatically on a non-gridded Spot blot image or to fine-adjust the size and position of the spot frames on a gridded sample:
1 Choose Locate from the Spots menu to display the Spot Location Tool dialog box:
The dialog box allows you to set the criteria used for detecting spots:
● The Area criteria controls set the minimum and maximum size of spots –spot frames will appear on areas in the image satisfying both the Binarythreshold and Area criteria.
● The red vertical lines in the Binary threshold control set the lower andupper boundaries of the range of intensities corresponding to spots in theimage – areas in the image within this range will be marked in blue whilethe Spot Location Tool dialog box is open.
2 Set the minimum and maximum areas for spots in the Min Spot Area andMax Spot Area boxes.
3 Press Apply to set the area criteria without closing the dialog box – spotframes will appear on areas in the image satisfying both the Binary thresholdand the new Area criteria.
GeneTools User Manual 8-131
Spots
4 Drag the red boundary markers in the Binary threshold control until thespots, but not the background, in the image are colored blue – as you adjustthe boundaries, the spot frames on the image will show where the spots aredetected.
5 If necessary, repeat Steps 2–5 until the spot frames are accurately positionedon the spots in the image.
Notes If All spots same size is not set, the spot frames will be sized optimally for each spot; if it is set, they will all be set to the size of the largest spot.
For a gridded sample, this procedure allows fine adjustment of the size and position ofthe existing spot frames, which must substantially overlap the actual spots on the image.
Position any spot
To unlock the spot frames on a Spot blot or Manual band quantification image so thatyou can adjust their size and position (and the shape of rectangular spots) individually,or delete them all together or individually:
Choose Position any spot from the Spots menu.
When the spot frames are unlocked, the command is checked in the menu and thebutton is shown depressed in the toolbar. To lock the spot frames, choose the command or press the button again.
See How to adjust the spot frame positions, page 4-26, for how to move the spotframes on the image.
8-132 GeneTools User Manual
Menus
Background correction
To apply or remove background correction to the raw volume measurements from theimage:
1 Choose Background correction from the Spots menu to display theBackground correction dialog box:
2 Choose None, for no background correction, or Automatic or Manualbackground correction.
3 If you have selected None or Automatic, press OK to close the dialog boxand set the background correction method.
For Manual background correction, you need to specify areas in the imagefrom which the background readings should be taken – each spot result isthen corrected by the reading from the background area nearest to it. SeeHow to apply background correction to results, page 4-35, for details of howto apply Manual background correction.
Lock position
To lock the spot frames on a sample so that they cannot be moved or resized with themouse or, in the case of non-gridded samples, deleted:
Choose Lock position from the Spots menu.
Lock position is checked in the Spots menu and the button is shown as depressed inthe toolbar when the frames are locked.
When the spot frames are locked, you cannot adjust their size, shape or position usingthe mouse. However, you can change them between circular and rectangular shapes,set all to the same size as the selected spot frame using All spots same size, and useautomatic spot location.
GeneTools User Manual 8-133
Spots
To unlock the spot frames:
Choose Lock position from the Spots menu.
If the sample is gridded, either Position control points or Position any spot willbecome selected, depending on which was selected before the spot frames werelocked. For non-gridded samples, Position any spot will become selected.
The Spot frames are also unlocked if you choose Position control points or Positionany spot from the Spots menu.
Spot incidence parameters
To define an incidence condition for a Spot blot or Manual band quantification sample:
1 Choose Spot incidence parameters to display the Spot incidenceparameters dialog box:
2 Choose the parameter for which you want to set the incidence condition from the Incidence type drop-down list box – you can choose Raw vol, % Totalraw vol, Pixel area or Quantity.
3 Choose the comparison operation to be used from the Incidence value rangedrop-down list box – you can choose Greater than, Less than or Two-valuerange.
8-134 GeneTools User Manual
Menus
If you choose Two-value range, an additional box will appear in the dialogbox so that you can enter two values:
4 Enter the value(s) to be used for the comparison in the Incidence value(Upper incidence value and Lower incidence value) box(es).
Or:
a Click in a spot/box on the image to select it.
b Press Get spot value to transfer the Incidence type value for the selectedspot/box to the incidence value box.
5 Press Apply to set the incidence condition without closing the Spot incidence parameters dialog box (you will be able to view the effect if the Incidencepage is shown in the Results/Incidence/Calibration Graph pane).
Press OK to set the incidence condition and close the Spot incidenceparameters dialog box.
You can view the incidence matrix in the Incidence page in the Results/Incidence/Calibration Graph pane at the bottom of the Spot blot/Manual band quantificationwindow – see page 6-32.
GeneTools User Manual 8-135
Spots
Delete
To remove a spot/box from a non-gridded Spot blot or Manual band quantificationsample:
1 If it isn’t already selected, choose Position any spot from the Spots menu tounlock the sample for changing boxes.
2 Click in the box to select it.
3 Either:
Choose Delete from the Spots menu.
or
Press c.
After the box has been removed, the numbers labeling the remaining spots/boxes willbe changed so that they are still consecutive.
Delete all
To remove all the spots/boxes from a non-gridded Spot blot or Manual bandquantification sample:
1 If it isn’t already selected, choose Position any spot from the Spots menu tounlock the sample for changing boxes.
2 Choose Delete all from the Spots menu.
8-136 GeneTools User Manual
Menus
Assign quantity
To assign a quantity to a spot or box to calibrate quantity measurements from otherspots or boxes:
1 Click on the spot frame or box for the spot or band to which you want toassign a quantity.
2 Choose Assign quantity from the Spots menu to display the Assigncalibrated quantity dialog box:
3 Enter the known quantity for the spot or band in the Calibrated quantitybox.
4 Press OK to close the dialog box and set the calibration.
After you have assigned a quantity to a spot frame or box:
● The calibrated spot or box will be marked with a cross:
GeneTools User Manual 8-137
Spots
or
● The Quantity calibration page in the Spot blot/Manual band quantificationwindow’s Graphics pane will show the calibration points and the selected calibration curve joining them (see the entry for Quantity calibration in the Edit (Spot blot)menu, page 8-56, for how to select the units and shape of calibration curve: theexample shows a quadratic calibration curve – the equation of the curve is given inthe Raw volume axis label):
Unassign quantity
To remove a quantity calibration from a spot frame or box:
1 Click on the spot frame or box from which you want to remove a quantityassignment.
2 Choose Unassign quantity from the Spots menu.
8-138 GeneTools User Manual
Menus
Extras
User name
To enter, view or change the program user’s name, or to delete a user’s name from thelist of users:
1 Choose User name from the Extras menu to display the User name dialogbox:
2 Select a user name from the drop-down list box or enter a new name.
3 To remove the selected user’s name from the list of users, press Remove Userand repeat Step 2; otherwise go on to Step 4.
4 Check Show this dialog when program starts to display the program when it starts up so that you can select the user.
The user name appears in printed reports.
Configuration
To edit or view configuration settings for the program:
Choose Configuration from the Extras menu to display the General page ofthe Configuration dialog box.
GeneTools User Manual 8-139
Extras
On the General page:
● Enter the name of your Laboratory. This will appear at the top of each page inprinted reports.
● Enter a Heading to appear on the top of each page in printed reports.
● Enter the Number of recent files that you want to appear listed on the File menuso that you can open them without using the Open command.
● Choose whether to set the Default analysis type to be Gel, Colony (pour plate),Spot blot, Manual Band Quantification or High Throughput Gel (you can alwaysoverride the default in the Sample properties dialog box if required). This will bethe type selected in the Sample properties dialog box when you:
● open an unanalyzed image (a secure sample file that has been saved in thecapture program but has not yet been saved in GeneTools).
● create a new secure sample file (for example, from a non-secure .tif or .bmpimage file).
● The Display font box shows the font currently selected for presenting data in theGel window’s Track label and Peak value panes. Press Font to display a standardWindows Font dialog box to select another font.
8-140 GeneTools User Manual
Menus
● Auto match peaks is permanently selected in this version of GeneTools – if theGeneTools matching feature is installed, matching is always carried out automaticallywhen appropriate.
● Check Auto locate tracks if you want automatic track detection to be selected bydefault when unanalyzed images are opened.
● Check Auto import methods if you want to import the settings selected on theImport tab from the file selected on the Import tab when you:
● open an unanalyzed image (a secure sample file that has been saved in thecapture program but has not yet been saved in GeneTools).
● create a new secure sample file (for example, from a non-secure .tif or .bmpimage file).
See the instructions for the Import page later in this section for how to choose whatsettings are imported.
Note You can also import methods to an existing secure sample file – see the entry forImport method in the File menu (page 8-15).
● Check Auto locate peaks if you want to automatically detect the peaks on a trackwhen its geometry is changed. This happens, for example, when you change thenumber of tracks (for example when you first assign a number of tracks to a sample)or change a track’s position or width. It is recommended that this option is keptturned on in normal usage.
GeneTools User Manual 8-141
Extras
On the Import page:
When you open an unanalyzed secure sample file or create a new secure sample (forexample, from a non-secure .tif or .bmp image file), you can choose to import settingsautomatically from another sample file – this page allows you to choose which settingsto import and the default file from which to import the settings.
● Press Browse to display a standard Windows Open dialog box so that you can select a file from which to import settings. The File name box shows the currently selected file.
Note The check boxes are disabled if no file is selected.
● Check Molecular weight stds. to import the molecular weight standard tracks andmolecular weight assignments from a saved sample file.
For example, if tracks 1 and 5 in the saved file are molecular weight standards, anyprevious molecular weight assignments will be removed from the selected sampleand tracks 1 and 5 will become molecular weight standards.
If peaks 3, 5 and 7 in track 1 of the saved file have assigned molecular weights,peaks 3, 5 and 7 in track 1 of the selected sample will be assigned the samemolecular weights.
8-142 GeneTools User Manual
Menus
● Check Sample and track settings to import the electrophoresis direction, imagetype, number of tracks and track positions from a saved sample file.
● Check Spot blot settings to import the number, shape and positions of the spotframes from a saved spot blot sample file.
● Check Report settings to import the report setup from a saved sample file.
Note The controls on this dialog box are also displayed with their current settings in thedialog boxes that are displayed (a) when you choose Import method from the Filemenu to import settings from a file to the sample in the currently selected Gel window,and (b) if Auto import methods on the General page is checked, when you open anunanalyzed file or create a new secure sample file (for example, from a non-secure .tifor .bmp image file).
Changing the settings in any of these dialog boxes changes them in all of them.
On the Colors page:
1 Select the program component for which you want to change the color orstyle from the Line type scroll box.
The current color and style setting of the selected component will beillustrated in the Sample box.
GeneTools User Manual 8-143
Extras
2 Press Color to display a dialog box allowing you to select a new color for theselected program component.
3 Choose a new line style for the program component selected in the Line typescroll box from the Style drop-down list box.
You can set the color of the following components in the program using the Colorspage in the Configuration dialog box:
Rf start and end lines in the Image pane
Track pattern (image) the track boundary lines in the Image pane
Selected track pattern (image) the selected track’s boundary lines in theImage pane
Peak assigned as standard peaks in the Image pane used for molecularweight or quantity calibration
Track region area of interest in the Image pane
Select track region selected area of interest in the Image pane
Peak bounds (profile) in the Profile pane
Selected peak bounds (profile) in the Profile pane
Peak markers (image) in the Image pane
Peak bounds (image) in the Image pane
Selected peak (image) in the Image pane
MW graph in the Graphics pane
MW standard markers in the Graphics pane when a molecularweight standard track is selected
Quantity calibration graph in the Graphics pane
Quantity calibration markers in the Graphics pane
Selected peak match line the match line shown in the Image pane forthe match peak selected in the Peak valuepane
Match peak line in the Image pane
Matching profile in the Profile pane
Dendrogram leaf in the Graphics pane
Dendrogram node in the Graphics pane
8-144 GeneTools User Manual
Menus
Spot blot on the Spot blot image
Selected Spot blot on the Spot blot image
Spot blot positioning point on the Spot blot image
Colony frame in the colony counting window
Colony shapes in the colony counting window
Colony class 1 markers in the colony counting window
Colony class 2 markers in the colony counting window
Colony manual markers in the colony counting window
Colony exclude outline in the colony counting window
Colony exclude fill in the colony counting window
Manual baseline in the Profile pane
Profile comparison reference in the Profile comparison window
Profile tracks 1–12 in the Profile comparison window
On the Molecular Weight page:
GeneTools User Manual 8-145
Extras
1 Enter a new path and name in the File name box or press Browse to displaya standard Windows Open dialog box to choose a new default molecularweight library.
2 Click on the Linear or Logarithmic radio button to choose the type of scaleto be used for the calibration graph shown in the MW calibration tab in theGraphics pane.
Save sample defaults
To save the settings you have selected for the selected Sample window as the defaultsto be used for new samples of the same type (fluorescence or absorption):
Choose Save sample defaults from the Extras menu.
See the next command for how to apply the sample defaults to the sample in a Samplewindow. Separate sample defaults are saved for each user.
Load sample defaults
To load your default settings for the type of sample in the selected Sample window (seethe previous command for how to save sample defaults):
Choose Load sample defaults from the Extras menu.
Window
8-146 GeneTools User Manual
Menus
New window
To open a new window with the same contents as the currently selected window:
Choose New window from the Window menu.
You can use New window to create a new Profile comparison window or a newMolecular weight library window.
Cascade
To resize and arrange the open (non-minimized) windows so that they are overlappingwith their title bars visible:
Choose Cascade from the Window menu.
Tile
To resize the open (non-minimized) windows so that they are non-overlapping and fillthe main window space:
Choose Tile from the Window menu.
Arrange icons
To tidy up the icons representing minimized windows:
Choose Arrange Icons from the Window menu.
Windows open in GeneTools
To select one of the open windows:
Choose the window’s name from the list at the bottom of the Window menu.
GeneTools User Manual 8-147
Window
Help
Help topics
To open the contents window for the on-line Help system:
Choose Help topics from the Help menu.
About GeneTools
To display information about the version of GeneTools that you are using:
Choose About GeneTools from the Help menu to display the AboutGeneTools dialog box.
This dialog box also shows the serial number of your copy of the program.
Image pane and Profile context menus
The commands in the menu displayed when you right-click on a peak in the Imagepane or the Profile pane in a Gel window are equivalent to the similarly namedcommands in the Peak menu (Delete is equivalent to Delete®Selected peak(s)) orTrack menu (Properties gives the properties of the selected peak, not the trackproperties) – see the entries in the Peak menu (page 8-104) and Track menu (page8-72) sections for details.
8-148 GeneTools User Manual
Menus
Track label context menu
Apart from Active matching standard, the commands in the menu displayed when you right-click on a label in the Track label pane are equivalent to the similarly namedcommands in the Track menu.
Active matching standard
Notes Active matching standard has no effect if there is only one matching standard track.
This command is only relevant when the matching Type selected in the Matchingparameters dialog box (See Band matching, page 8-53) is Band; you do not need todefine an active matching standard for Profile matching.
To make a matching standard track the active matching standard for the selected area of interest:
1 Right-click on the track’s label in the Track label pane to select it and pop upa menu.
2 Choose Active matching standard from the menu.
The track label will show MS* – the MS means it is a matching standard, the * means it is the active matching standard (the previous active matching standard will now showMS to show that it is still a matching standard but no longer the active matchingstandard).
If you choose Active matching standard again, the other matching standard with thehighest track number is made the active matching standard.
GeneTools User Manual 8-149
Track label context menu
Peak value pane context menu
Delete
To remove a molecular weight assignment from a peak on a molecular weight standardtrack:
1 Choose Molecular weight from the View menu or click on the MWcalibration tab in the Graphics pane.
2 Select the required molecular weight standard track – the molecular weightassignments will be shown in the Peak value pane.
3 Right-click on the molecular weight assignment in the Peak value pane thatyou want to remove to select the peak and display the Peak value panecontext menu.
4 Choose Delete.
Graphics pane context menu
Maximize pane on the menu displayed when you right-click in the Graphics pane isequivalent to the same command in the View menu if the Graphics pane is selected.Scale to fit only appears on the menu if the Dendrogram page is selected in theGraphics pane.
Scale to fit
To scale the dendrogram so that it all fits within the Graphics pane:
1 Right-click on the dendrogram in the Graphics pane to pop up the Graphicspane context menu.
2 Choose Scale to fit.
8-150 GeneTools User Manual
Menus
Save to clipboard
To copy the currently displayed contents of the Graphics pane to the clipboard:
1 Right-click in the Graphics pane to pop up the Graphics pane context menu.
2 Choose Save to clipboard.
The contents of the Graphics pane will be copied as an enhanced metafile.
Gel window Results pane context menu
The Gel window Results pane context menu is displayed when you right-click on theResults pane if it is showing Results for selected track, Results for all tracks orMatching comparisons.
Maximize pane on the Gel window Results pane context menu is equivalent to thesame command in the View menu if the Results pane is selected.
Result table commands
To decide whether or not to include a column for a quantity in a results table:
1 Click on the tab for the table to display it.
2 Right-click in the table to display the Gel window Results pane context menu.
3 Choose the command corresponding to the quantity.
GeneTools User Manual 8-151
Gel window Results pane context menu
4 Repeat for any other quantities.
The commands are checked in the menu when the columns are displayed.
Profile comparison window context menu
The Profile comparison window context menu is displayed when you right-click on atrack in the Track browser pane in the Profile comparison window: all the commandsin the menu are equivalent to the similarly named commands in the Profile orMatching menus.
See Profile comparison window, page 6-18, for more information about the Profilecomparison window.
Spot blot/Manual band quantification window Image panecontext menu
The Spot blot/Manual band quantification window Image pane context menu isdisplayed when you right-click on the image pane in a Spot blot/Manual bandquantification window. Set radius is described below; the other commands in the menu are equivalent to the similarly named commands in the Spots menu.
Set radius
To change the radius of one or all of the spot frames on a Spot blot image:
1 If the sample is locked, choose Lock position from the Spots menu to unlock the sample.
8-152 GeneTools User Manual
Menus
2 Click on the spot frame that you want to adjust to select it – click on anycircular frame if you want to adjust them all.
3 Right-click in the image pane and choose Set radius from the context menudisplayed to display the Set spot radius dialog box:
4 Check Set all spots if you want to change the radius of all the (circular) spotframes; uncheck it if you just want to change the radius of the selected spotframe.
Note The initial Set all spots setting is fixed by the setting of the All spots same sizecommand in the Spots menu. If you change the setting of Set all spots in the dialogbox, All spots same size will be set or unset accordingly when you close it.
5 Use the arrow buttons to set the new radius.
6 Press OK to close the dialog box and set the new radius.
See Adjusting the size of circular spot frames, page 4-22, for how to change the spotradius using the mouse.
GeneTools User Manual 8-153
Spot blot/Manual band quantification window Image pane context menu
Spot blot/Manual band quantification window Results panecontext menu
The Spot blot/Manual band quantification window Results pane context menu isdisplayed when you right-click on the Results pane.
Result table commands
You use the commands at the top of the menu to choose what to display in the resultstable.
To decide whether or not to include a column for a quantity in the results table:
1 Click on the Spot blot results tab.
2 Right-click in the table to display the Spot blot/Manual band quantificationwindow Results pane context menu.
3 Choose the command corresponding to the quantity.
4 Repeat for any other quantities.
The commands are checked in the menu when the columns are displayed.
8-154 GeneTools User Manual
Menus
Table 1D/Table 2D
If the sample is gridded (see Step 3 on page 4-4), you can choose whether to displaythe results in a one- or two-dimensional table.
To choose whether to display Spot blot results in a one- or two-dimensional table:
1 Click on the Spot blot results tab.
2 Right-click in the table to display the Spot blot/Manual band quantificationwindow Results pane context menu.
3 Choose Table 1D or Table 2D.
The selected command will become checked in the menu.
In a one-dimensional table, the results for the first row of spots are given first, then thesecond row and so on.
Note If the sample is non-gridded, the spots are numbered in the order you added the spotsand the results are always displayed in this order in a one-dimensional table – selectingTable 2D has no effect.
Spot blot/Manual band quantification window Quantitycalibration context menu
The Spot blot/Manual band quantification window Quantity calibration page contextmenu is displayed when you right-click on the Quantity calibration page.
Note Maximize pane is permanently disabled in this menu.
Save to clipboard
To copy a picture of the Spot blot/manual band quantification quantity calibration graph to the clipboard:
1 Right click in the Quantity calibration page in the Spot blot/Manual bandquantification window to display a context menu.
GeneTools User Manual 8-155
Spot blot/Manual band quantification window Quantity calibration context menu
2 Choose Save to clipboard.
Molecular weight library context menu
The commands in the menu displayed when you right-click on a standard in aMolecular weight library window are equivalent to the similarly named commands inthe Edit menu (in the Edit menu the command names have ‘Standard’ appended: forexample, New is equivalent to New Standard in the Edit menu).
Colony counting exclude region
The Colony counting exclude region context menu is displayed when you right-click inan exclude region on a colony counting image when the Adjust exclude region(s) radio button is selected in the Define frame box at the top left-hand corner of the Colonycounting window.
To delete one or more existing exclude regions on a Colony counting image:
1 Click on the Adjust exclude region(s) radio button in the Define frame boxat the top left-hand corner of the Colony counting window.
2 Click in the first exclude region that you want to delete. Drag handles willappear on the boundary of the exclude region to show it is selected.
3 SHIFT-click on any other exclude regions that you want to delete.
Note You can also select several exclude regions by dragging a rectangle on the image – anyexclude regions with areas within the rectangle will be selected.
4 Right-click in any of the selected exclude regions to pop up a menu.
5 Choose Delete selected exclude region.
All the selected exclude regions will be deleted.
8-156 GeneTools User Manual
Menus
Index
!
.bmp 1-11, 4-6–4-8, 8-2–8-7
.sgd 1-1–1-2
.tif 1-11, 4-6–4-8, 8-2–8-7
A
About GeneTools 8-148Absorption 8-30, 8-32, 8-34Acquire (Twain) 1-13–1-14, 4-8–4-9, 8-13Acquisition notes 8-38Active matching standard 1-109, 6-4, 8-149Adding peaks 1-61–1-64Adding tracks 1-26–1-30Align banks of tracks 8-65All peaks same width 1-52, 8-46All spots same size 4-21–4-22, 8-127–8-128, 8-130, 8-132
button 7-10All tracks to a single curve 8-53Analysis notes 8-39Analysis type 8-29–8-35Analyzed files 1-1–1-2, 8-8, 8-10Archive gel to database 8-121–8-125
button 7-8Area criteria 8-131Area of interest 1-5–1-134, 8-4, 8-6, 8-36, 8-52Arrange Icons 8-147Assign from standard 1-82, 8-106–8-107Assign molecular weight 8-104–8-110Assign quantity 1-77–1-78, 4-34–4-35, 8-110–8-112, 8-137–8-138
button 7-7, 7-12
GeneTools User Manual Index-1
Assign value to peak 1-82, 8-106–8-107Assigning molecular weights and quantities 1-79–1-83Auto import methods 1-14, 4-9, 8-141Auto locate peaks 1-60, 8-141Auto locate tracks 1-24–1-25, 8-141Auto match peaks 8-141Automatic import 1-16–1-18, 4-11–4-13
Gel analysiscopying a picture of an image to the clipboard 1-133–1-134creating a report in Word 1-132–1-133exporting results to Excel 1-130–1-131printing results 1-127–1-129Sample properties 8-30–8-31saving results to CSV 1-131–1-132
Gel sample filecreating 8-4–8-5, 8-7import settings 1-14–1-20opening 1-2–1-10, 1-12–1-13saving 1-20–1-21