94
VALUATION OF A MIXED-USE PROPERTY Geo Milev Area Sofia Bulgaria PREPARED EXCLUSIVELY FOR B.S.R. SOFIA AD PREPARED BY: JULY 2012

VALUATION OF A MIXED-USE PROPERTY
Geo Milev Area
Sofia
Bulgaria
PREPARED EXCLUSIVELY FOR
B.S.R. SOFIA AD
PREPARED BY:
JULY 2012

Valuation of a Mixed-use Property in Geo Milev Area, Sofia, Bulgaria
B.S.R. Sofia AD Page 2 of 74
EXECUTIVE SUMMARY
GENERAL TOPICS – PROPERTY 1
Type of property Office Development Project
Address 63 Shipchenski Prohod Boulevard
Post code / City Sofia
Region Sofia - City Region
Country Bulgaria
Plot Number Part of Regulated Land Plots - XI square 95в; XII square 95в; the east real part of the former УПИ XV square 95в
Plot size 4,500 m²
TBA of the buildings 37,825 m²
Tenure Freehold
Marketability Good
Suitability for loan and mortgage purposes
Good
Use according to Zoning Plan
Mixed-use development
Special remarks None
OPINION OF VALUE
Purpose of Valuation: accounting statements Special assumptions: none
Market Value excl. purchasers costs
€ 14,833,000
Instruction date 18th
of June 2012
Revaluation reference date 30th
of June 2012
Valuation of a Mixed-use Property in Geo Milev Area, Sofia, Bulgaria
B.S.R. Sofia AD Page 3 of 74
GENERAL TOPICS – PROPERTY 2
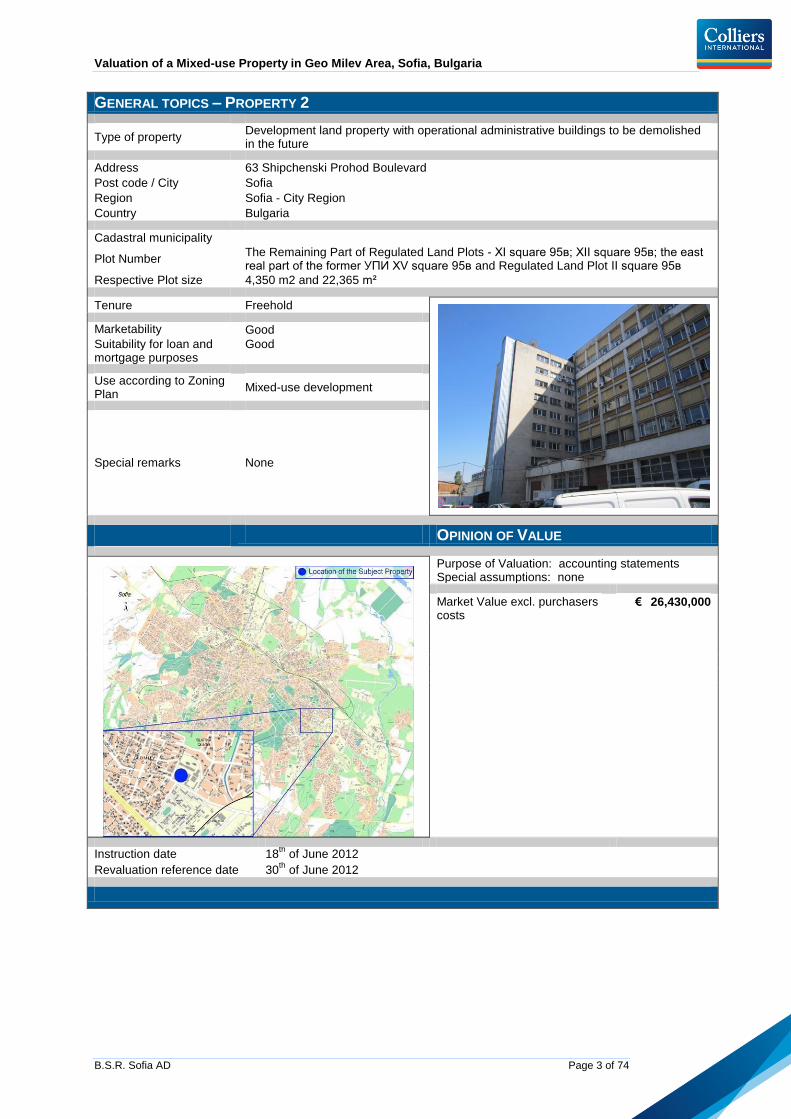
Type of property Development land property with operational administrative buildings to be demolished in the future
Address 63 Shipchenski Prohod Boulevard
Post code / City Sofia
Region Sofia - City Region
Country Bulgaria
Cadastral municipality
Plot Number The Remaining Part of Regulated Land Plots - XI square 95в; XII square 95в; the east real part of the former УПИ XV square 95в and Regulated Land Plot II square 95в
Respective Plot size 4,350 m2 and 22,365 m²
Tenure Freehold
Marketability Good
Suitability for loan and mortgage purposes
Good
Use according to Zoning Plan
Mixed-use development
Special remarks None
OPINION OF VALUE
Purpose of Valuation: accounting statements Special assumptions: none
Market Value excl. purchasers costs
€ 26,430,000
Instruction date 18th
of June 2012
Revaluation reference date 30th
of June 2012
Valuation of a Mixed-use Property in Geo Milev Area, Sofia, Bulgaria
B.S.R. Sofia AD Page 4 of 74
CONTENTS PAGE
STATUS OF VALUER AND CONFLICTS OF INTEREST ...................................................................... 5
COMPLIANCE WITH RICS AND IVS VALUATION STANDARDS ......................................................... 5
LIABILITY AND PUBLICATION .............................................................................................................. 5
GENERAL INFORMATION ...................................................................................................................... 7
BULGARIA MACROECONOMIC COMMENTARY ............................................................................... 11 GENERAL REMARKS ....................................................................................................................... 11 GROSS DOMESTIC PRODUCT .......................................................................................................... 12 INFLATION ...................................................................................................................................... 15 LABOR FORCE INDICATORS ............................................................................................................. 16 BALANCE OF PAYMENTS ................................................................................................................. 18 DEBT INDICATORS .......................................................................................................................... 18 FOREIGN DIRECT INVESTMENT ........................................................................................................ 18 FORECAST ..................................................................................................................................... 20
SOFIA OFFICE PROPERTY MARKET COMMENTARY ...................................................................... 21 GENERAL REMARKS ....................................................................................................................... 21 DEFINITION OF CLASS A, B, AND C OFFICE BUILDINGS .................................................................... 21 SOFIA SUB-MARKETS ..................................................................................................................... 21 EXISTING CLUSTERS WITH OFFICE BUILDINGS ................................................................................. 23 SUPPLY* ........................................................................................................................................ 27 VACANCY** & AVAILABILITY ............................................................................................................ 28 DEMAND ........................................................................................................................................ 29 RENTAL RATES*** .......................................................................................................................... 30 YIELDS .......................................................................................................................................... 31 PROJECTS IN THE PIPE-LINE ........................................................................................................... 32
SOFIA RESIDENTIAL MARKET COMMENTARY ................................................................................ 38 GENERAL REMARKS ....................................................................................................................... 38 SOFIA DISTRICTS ............................................................................................................................ 39 SUPPLY ......................................................................................................................................... 39 DEMAND ........................................................................................................................................ 42 APARTMENT UNITS SALES PRICES .................................................................................................. 42
1.0 LOCATION ................................................................................................................................... 44 1.1 MACRO LOCATION .............................................................................................................. 44 1.2 MICRO LOCATION ............................................................................................................... 44
2.0 SUBJECT PROPERTY ................................................................................................................ 47
3.0 ACCOMMODATION .................................................................................................................... 48
4.0 CONDITION ................................................................................................................................. 48
5.0 LEGAL & PLANNING .................................................................................................................. 49 5.1 OWNERSHIP ....................................................................................................................... 49 5.2 SIZE ................................................................................................................................... 49 5.3 LIENS ................................................................................................................................. 49 5.4 CURRENT ZONING ............................................................................................................... 49 5.5 FUTURE DEVELOPMENT ...................................................................................................... 50
6.0 TENURE DETAILS ...................................................................................................................... 51 6.1 TENANCIES ......................................................................................................................... 51 6.2 NON-RECOVERABLE COSTS ................................................................................................ 51
7.0 SWOT ANALYSIS ........................................................................................................................ 52
8.0 VALUATION ................................................................................................................................. 54 8.1 VALUATION APPROACH ....................................................................................................... 54 8.2 FACTORS AFFECTING VALUE ............................................................................................... 54
9.0 MARKET VALUE ......................................................................................................................... 55
GENERAL ASSUMPTIONS & DEFINITIONS ....................................................................................... 73

Valuation of a Mixed-use Property in Geo Milev Area, Sofia, Bulgaria
B.S.R. Sofia AD Page 5 of 74
Mr. Guy Matarasso Mr. Lazar Geshev B.S.R. Sofia AD 53 Khan Asparuh Street, Sofia 1000 Bulgaria Dear Sirs
MIXED-USE PROPERTY IN SOFIA, BULGARIA
We have considered the above property in order to provide you with our opinion of the Market Value for
financial reporting purposes. We have adopted a valuation date as at 30th
of June 2012.
STATUS OF VALUER AND CONFLICTS OF INTEREST The properties have been valued by suitably qualified surveyors who fall within the requirements as to competence as set out in VS 1.5, 1.6 and 1.7 of the RICS Valuation Standards 8
th Edition (the ‘Red
Book’) issued by the Royal Institution of Chartered Surveyors (the ‘RICS’) and effective 30 March 2012. We confirm that Colliers complies with the requirements of independence, integrity and objectivity under the RICS Valuation Standards 8
th Edition, VS 1.7 and 1.8 and that we have no conflict of interest
in acting on your behalf in this matter. We further would like to state that an open brokerage agreement has been signed in July 2011 between Colliers International EOOD and the Assignor. The latter agreement concerns the leasing of the office premises. This engagement has been discussed with the client who has agreed to proceed with the work on the present assignment.
COMPLIANCE WITH RICS AND IVS VALUATION STANDARDS As per the requirements of RICS Red Book, 8
th edition, VS 1.2, we confirm that the valuations have
been made in accordance with the appropriate sections of the Valuation Statements (‘VS’) contained within the ‘Red Book’ prepared by the ‘RICS’. This is an internationally accepted basis of assessing the value of real estate. The valuation is compliant with both RICS Valuation Standards and the International Valuation Standards, as per RICS Red Book, 8
th edition, VS 1.2
Our General Assumptions and Definitions are presented as an Appendix III to this report.
LIABILITY AND PUBLICATION
This report is private and confidential and for the sole use of BSR Sofia AD. The information contained in this report is privileged and remains intellectual property of Colliers International. It is intended for the use of the individuals and company named in this report and others who have been specifically authorized by Colliers International. Any dissemination, distribution or copying is strictly prohibited without the written consent of Colliers International.
Business Park Sofia Building 7B, Floor 2 1715 Sofia, Bulgaria Tel: (+359 2) 976 9 976 Fax: (+359 2) 976 9 977 www.colliers.com

Valuation of a Mixed-use Property in Geo Milev Area, Sofia, Bulgaria
B.S.R. Sofia AD Page 6 of 74
We do not accept any responsibility to any third party for the whole or any part of its contents. Neither the whole nor any part of this valuation or any reference thereto may be included within any published document, circular or statement or disclosed in any way without our prior written consent to the form and context in which it may appear. In breach of this condition, no responsibility can be accepted to third parties for the comments or advice contained in this report. We trust that this report is satisfactory for your purposes. Yours faithfully,
GEORGI KIROV NEVENA MARINOVA-BOGOEVA, MRICS DIRECTOR, INVESTMENT SERVICES MANAGER, VALUATION AND ADVISORY SERVICES
COLLIERS INTERNATIONAL COLLIERS INTERNATIONAL Dated: 27
th of July 2012

Valuation of a Mixed-use Property in Geo Milev Area, Sofia, Bulgaria
B.S.R. Sofia AD Page 7 of 74
GENERAL INFORMATION
1. CLIENT
B.S.R. Sofia AD 53 Khan Asparuh Street Sofia, Bulgaria Represented by Mr. Gai Mataraso and Mr. Yair Abrahami
2. VALUATION TEAM QUALIFICATIONS
Mr. Georgi Kirov
Director Investment Services and Valuation and Advisory Services Georgi Kirov has an Executive MBA from the University of Chicago Booth. He directly leads the Investment Sales team and has overall responsibility for the Valuations team. He lead and completed the largest real estate transaction for offices in Southeast Europe – the sale of Business Park Sofia, Bulgaria, with transaction volume of US$ 251 million. He is a member of Colliers Southeast European Investment Advisory Group. Key clients include Credit Suisse, Unicredit, BNP Paribas, BSPF, US Embassy, British Commonwealth Office, Tishman International, General Electric, ECE, AIG, etc.
Mrs. Nevena Marinova-Bogoeva, MRICS
Manager, Valuation and Advisory Services Nevena Marinova holds a Master Degree in Real Estate Investments and Finance from Heriot-Watt University in Great Britain. She is a member of the Royal Institution of Chartered Surveyors. Key clients include Rothschild Private Equity, GE Real Estate, Credit Suisse, Hypo Alpe Adria, Erste Group Immorent, etc.
3. ORDER
Colliers International was appointed by B.S.R. Sofia AD, 53 Khan Asparuh Street, Sofia, Bulgaria to perform a valuation of the property in Sofia as per agreement dated 18
th of June 2012. The objective of
the valuation is to determine Market Value as of 30th
June 2012 of the above property for the purpose of financial reporting.
4. MARKET VALUE Our valuation has been carried out in accordance with the definition of Market Value relevant to international property valuations. The definition of Market Value is set by the International Valuation Standards Committee (International Valuation Standards IVS 2011, 9
th ed.) and adopted by the
European Group of Valuers´ Associations (European Valuation Standards EVS 2003) as well as the
Royal Institution of Chartered Surveyors (RICS Valuation Standards 8th ed., VS 3.2). Therein Market
Value is defined as:
"The estimated amount for which an asset or liability should exchange on the valuation date between a willing buyer and a willing seller in an arm’s-length transaction after proper marketing and where the parties had each acted knowledgeably, prudently and without compulsion."
5. ON-SITE INSPECTION Our team inspected the property on the 29
th of June 2012. The pictures enclosed were taken during
the course of the inspection in digital format. The inspection of the subject property for valuation and the immediate vicinity were carried out by random sampling and without claim to completeness. For hidden components, a condition free of defects was assumed.
6. VALUATION DATE 30 June 2012
Valuation of a Mixed-use Property in Geo Milev Area, Sofia, Bulgaria
B.S.R. Sofia AD Page 8 of 74
7. PREVIOUS VALUATIONS Colliers International performed six previous valuations of this property for the same purpose, the latest of which with determination date 31 December 2011.
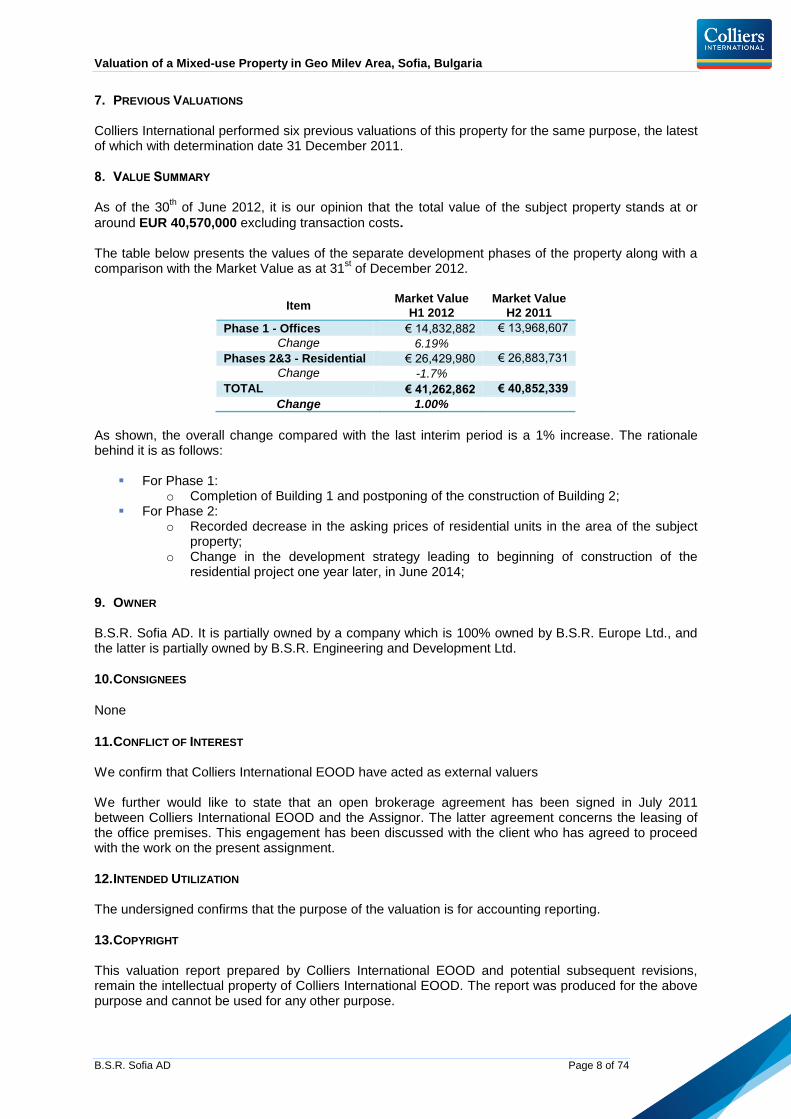
8. VALUE SUMMARY As of the 30
th of June 2012, it is our opinion that the total value of the subject property stands at or
around EUR 40,570,000 excluding transaction costs. The table below presents the values of the separate development phases of the property along with a comparison with the Market Value as at 31
st of December 2012.
Item Market Value
H1 2012
Market Value
H2 2011
Phase 1 - Offices € 14,832,882 € 13,968,607
Change 6.19%
Phases 2&3 - Residential € 26,429,980 € 26,883,731
Change -1.7%
TOTAL € 41,262,862 € 40,852,339
Change 1.00%
As shown, the overall change compared with the last interim period is a 1% increase. The rationale behind it is as follows:
For Phase 1: o Completion of Building 1 and postponing of the construction of Building 2;
For Phase 2: o Recorded decrease in the asking prices of residential units in the area of the subject
property; o Change in the development strategy leading to beginning of construction of the
residential project one year later, in June 2014;
9. OWNER B.S.R. Sofia AD. It is partially owned by a company which is 100% owned by B.S.R. Europe Ltd., and the latter is partially owned by B.S.R. Engineering and Development Ltd.
10. CONSIGNEES
None
11. CONFLICT OF INTEREST We confirm that Colliers International EOOD have acted as external valuers We further would like to state that an open brokerage agreement has been signed in July 2011 between Colliers International EOOD and the Assignor. The latter agreement concerns the leasing of the office premises. This engagement has been discussed with the client who has agreed to proceed with the work on the present assignment.
12. INTENDED UTILIZATION The undersigned confirms that the purpose of the valuation is for accounting reporting.
13. COPYRIGHT This valuation report prepared by Colliers International EOOD and potential subsequent revisions, remain the intellectual property of Colliers International EOOD. The report was produced for the above purpose and cannot be used for any other purpose.
Valuation of a Mixed-use Property in Geo Milev Area, Sofia, Bulgaria
B.S.R. Sofia AD Page 9 of 74
14. PRINCIPLES OF VALUATION All statements made by the Valuer in terms of the actual characteristics of the plots and buildings and any improvements have been exclusively taken from documentation provided by the Client, which were assessed for the purposes of the report, and the findings of the local inspection. During the local inspection no measurements were taken, or functional tests carried out on the site. All statements made by the Valuer are based on the findings of the local inspection (visual inspection only). A professional investigation of potential structural damage was not undertaken. It is assumed that without examination there are no features of the soil or subsoil that could possibly affect or compromise the sustainable suitability of the property or the health of residents and users. Not being notified of the opposite, we assumed that there are no factors which might adversely affect the current status and/or future development of the subject property, including archaeological finds, landslides or other abnormal land conditions, structural defects, etc. On the date of valuation, it is assumed, without verification, that all public charges, contributions and fees etc., which may have an impact on the value, have been levied and paid unless specifically outlined in the valuation. The valuation was estimated in EUR, rather than in local currency (Bulgarian lev). We do not foresee any problems arising, since the Bulgarian lev has been pegged to the euro since 1999 at a fixed rate of BGN 1.95583 for EUR 1. No change in this exchange rate is foreseen by the Bulgarian government.
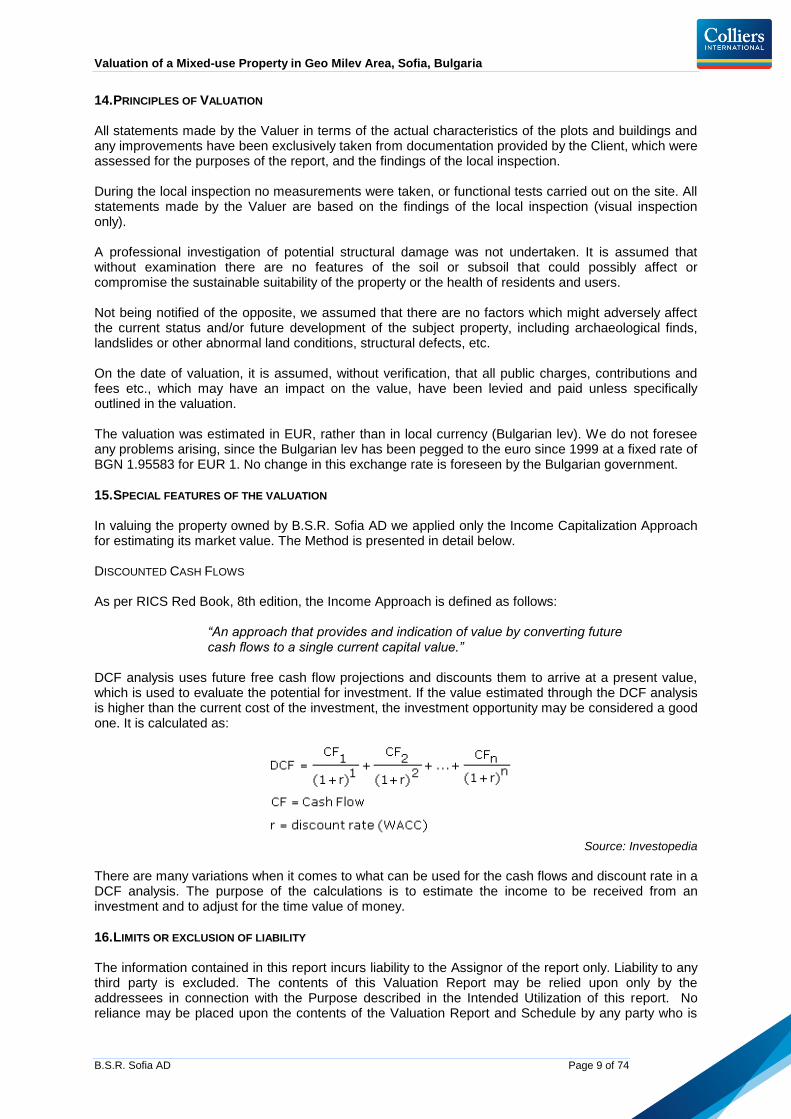
15. SPECIAL FEATURES OF THE VALUATION In valuing the property owned by B.S.R. Sofia AD we applied only the Income Capitalization Approach for estimating its market value. The Method is presented in detail below. DISCOUNTED CASH FLOWS As per RICS Red Book, 8th edition, the Income Approach is defined as follows:
“An approach that provides and indication of value by converting future cash flows to a single current capital value.”
DCF analysis uses future free cash flow projections and discounts them to arrive at a present value, which is used to evaluate the potential for investment. If the value estimated through the DCF analysis is higher than the current cost of the investment, the investment opportunity may be considered a good one. It is calculated as:
Source: Investopedia
There are many variations when it comes to what can be used for the cash flows and discount rate in a DCF analysis. The purpose of the calculations is to estimate the income to be received from an investment and to adjust for the time value of money.
16. LIMITS OR EXCLUSION OF LIABILITY The information contained in this report incurs liability to the Assignor of the report only. Liability to any third party is excluded. The contents of this Valuation Report may be relied upon only by the addressees in connection with the Purpose described in the Intended Utilization of this report. No reliance may be placed upon the contents of the Valuation Report and Schedule by any party who is

Valuation of a Mixed-use Property in Geo Milev Area, Sofia, Bulgaria
B.S.R. Sofia AD Page 10 of 74
not an addressee of this Valuation Report or by an addressee of this Valuation Report for any purpose other than in connection with the Intended Utilization of this Report. Before this Report, or any part thereof, is reproduced or referred to, in any document, circular or statement, and before its contents, or any part thereof, are disclosed orally or otherwise to a third party, the valuer’s written approval as to the form and context of such publication or disclosure must first be obtained. Such publication or disclosure will not be permitted unless, where relevant, it incorporates the Special Assumptions and/or Departures referred to herein. For the avoidance of doubt such approval is required whether or not Colliers International is referred to by name and whether or not the contents of our Report are combined with others. It should be noted that the undersigned has signed an indemnity agreement with the Client limiting the appraiser's liability as per the following in brief: The appraiser has PI insurance for a maximum sum, which is the full extent of insured liability per event and per period. Colliers International is liable towards the Client as per the terms and conditions of its professional indemnity insurance. The Appraiser is obligated to revert to the insurer regarding any claims made against the appraiser regarding professional liability up to the insured sum. If the claims are beyond the insured sum, claims that are a direct result of the information provided by the client will be the full responsibility of the client. The appraiser will bear full responsibility for any acts of gross negligence in preparing the valuation. The information contained herein has been obtained from sources deemed reliable. While every reasonable effort has been made to ensure its accuracy, Colliers International cannot guarantee it. No responsibility is assumed for any future changes in the market trends, occupancy rates, and sales and rental levels. Projections in particular are based on various assumptions and subjective determinations as to which no guarantee or assurance can be given. These assumptions may vary, as market conditions change.
17. CONFIRMATION OF COMPETENCE As per the requirements of the RICS Red Book 8
th ed., VS 1.5, 1.6 and 1.7 we confirm this valuation is
prepared by, or under the supervision of, an appropriately qualified valuer who accepts responsibility for it. The valuers have sufficient local and national knowledge of the particular property market, and the skills and understanding to undertake this valuation competently.
18. DOCUMENTATION The client provided the following documentation as a basis for the valuation:
Copy of Usage Permit for Phase 1 Tenancy Schedules Tenant Contribution and Operating Expenses Budget
For preparing this report we relied upon this documentation provided by the Assignor. On the basis of the provided documents we assumed that the property has good and clear title. We based our calculations on sizes, concept design and tenant schedules provided by the Assignor and their representatives. The valuation is very sensitive to input data, including accurate property information
provided to us. Should they prove incorrect or incomplete, the accurateness of the valuation may be adversely affected. Colliers is not responsible for the information provided by the Assignor which was depended upon when carrying out the valuation.
19. PROPORTION OF FEES PAYABLE BY THE CLIENT
The proportion of the total fees payable by the Client during the preceding year (2011) relative to the total annual fee income of Colliers International EOOD are minimal.

Valuation of a Mixed-use Property in Geo Milev Area, Sofia, Bulgaria
B.S.R. Sofia AD Page 11 of 74
BULGARIA MACROECONOMIC COMMENTARY
GENERAL REMARKS In the context of the general economic slowdown on a global level, Bulgaria has experienced a relatively lower degree of negative impact during 2008. However, 2009 showed clear downward trends in key macroeconomic estimations. All of them indicate a financial and economic slowdown in Bulgaria, which, however occurred with a substantial lag of almost 6 months in comparison to Central and Western Europe. In 2010 the economy of Bulgaria began to expand. Thanks to sound financial discipline and good policy that the government led by the middle of 2010, Bulgaria is entering a stage of recovery from the crisis. The country maintains good macroeconomic stability. While the global economy is going out of its deepest recession, Bulgaria benefited from stronger exports and its economy is ready for a gradual recovery. After initial stabilization of the industries, mainly oriented towards exports of goods and services, as a result of restructuring carried out in many sectors of economy and optimization of business improvement, we have already seen improvement in other sectors such as mining, paper and paperboard production and tobacco products. At the beginning of 2012 Bulgaria’s economy was expanding, but signs of a slowdown were evident. The debt crisis in the Euro zone poses a threat to the recovery of the national economy, which is driven mainly by intensive growth of exports to the EU member states. GDP growth shows an increase by 1.7% in 2011, falling behind the rates projected by the government albeit still higher than in the Euro zone which estimates a 1.5% increase. The deteriorating economic situation in Europe result in problems for Bulgaria and force several international financial institutions to cut their forecasts for the country’s real GDP growth in 2012 which is currently expected at 1.5%. Nevertheless, Bulgaria managed to go through the global economic downturn comparatively better than most countries in the region thanks to the conservative management of public finance. Bulgaria is the only European country that has seen its rating upgraded by Moody’s since the beginning of 2010. In 2012 domestic demand remains weak as people are cutting dramatically on consumer spending while at the same time increasing savings as a reflection of negative economic expectation, fear of a new downturn and the constantly rising unemployment. The European Commission forecasts a gradual recovery in private consumption parallel to a stabilization of the labor market in 2012. In terms of foreign direct investments (FDI), which are vital for Bulgaria’s economy, the situation continues to give grounds for concern as in 2011 FDI inflow was only 15% of its 2007 levels. However, in 2011 the negative trend of the previous three years was reversed and a slight increase in annual FDI inflow was registered since 2007. Meanwhile, the government continues to pursue a policy aiming to tighten public spending in order to ensure a slim budget deficit. Two unpopular reforms should be launched in 2012 – retirement age is to be increased and privatization of unprofitable state-owned companies, such as the national railroad and the post office should begin. A top priority for the government remains better absorption of EU funds on which it relies heavily for infrastructure investments. The positive trend of the GDP that started in 2010 continues in 2011 with an increase of 1.7% but is expected to halt in 2012 as economic growth and industrial production shows a negative forecast. Unemployment is on the rise since 2008 and is expected to increase in 2012 as well. The first quarter of 2012 has an unemployment rate of 12.9 which is the highest since the first quarter of 2004. Foreign direct investments in 2011 show an increase of 11% compared to the previous year ending the negative trend from 2007. The following table and graph summarize the key economic indicators for the period 2006 - 2011 and a forecast for 2012.

Valuation of a Mixed-use Property in Geo Milev Area, Sofia, Bulgaria
B.S.R. Sofia AD Page 12 of 74
Economic Indicators
2006 2007 2008 2009 2010 2011 2012f
Economic Growth (GDP, annual var. in %) 6.4 6.4 6.2 -5.5 0.4 1.7 1.5
Inflation (CPI, annual variation in %, eop) 6.5 12.5 7.8 0.6 4.5 2.8 2.7
Industrial Production (annual var. in %) 6.0 9.6 0.7 -18.3 2.0 5.8 0.9
External Debt (% of GDP) 66.7 78.2 94.2 105.0 108 103 92.0
Current Account Balance (% of GDP) -17.4 -25.3 -23.1 -8.9 -1.4 1.8 1.3
Unemployment rate (% of active population,
eop) 9.1 6.9 6.3 7.6 9.5 10.4 10.7 Source: Focus Economics
Source: Focus Economics
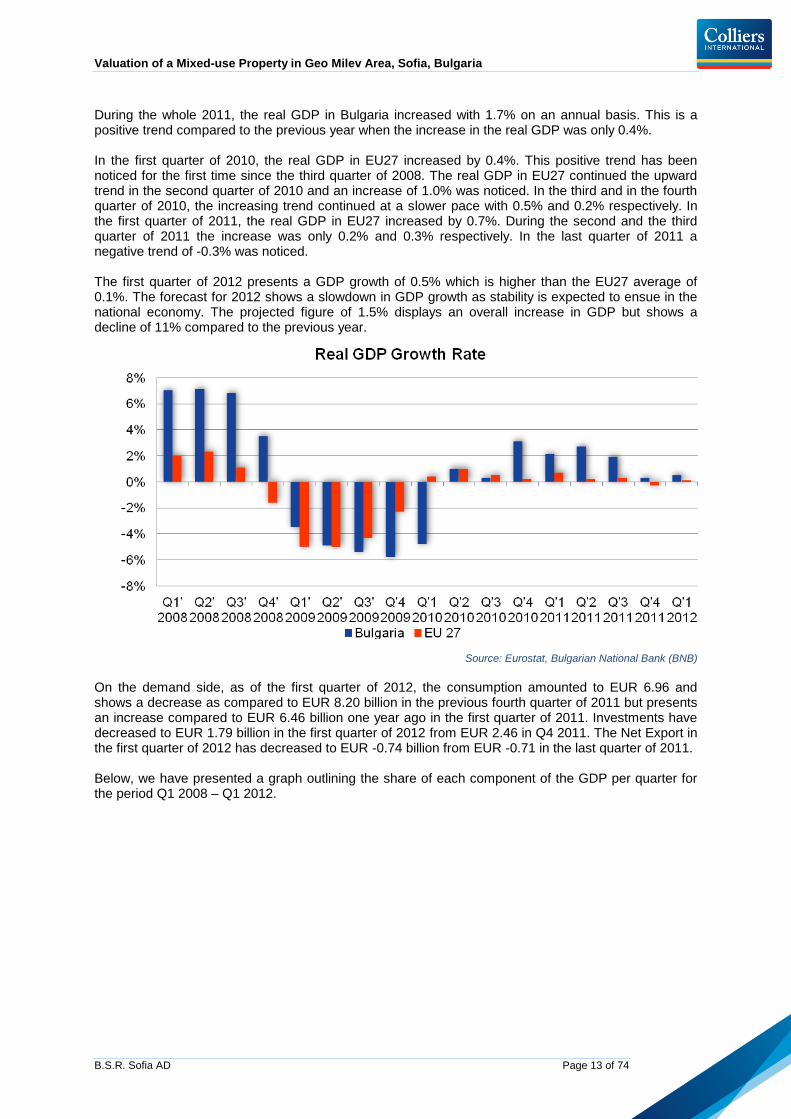
GROSS DOMESTIC PRODUCT The effect of the global market deterioration in Bulgaria became visible with a certain time lag. The slowdown of the economic activity started in the last quarter of 2008, when the GDP growth ceased its acceleration pace and posted a moderate increase of 3.5% on a yearly basis. From January to December 2008 the GDP increased by 6.0% reaching EUR 34.11 billion. Thus, in 2008 Bulgaria commanded one of the highest growth rates within the European Union. In the fourth quarters of 2009, however, the real GDP growth posted a decrease of 3.5%, 4.9%, 5.4% and 5.8% respectively, thus, outlining a negative trend in the macroeconomic climate of Bulgaria for the first time in 12 years. The decrease on an annual basis was primarily caused by the contraction of the corporate investments on the one hand, and a certain decrease in consumption of the population on the other. In the first quarter of 2010, the real GDP in Bulgaria posted a decrease of 4.8%, however in the second quarter of the year an increase of 1.0% was noticed. In the third quarter of 2010, the posted increase was barely 0.3%. In the last quarter of 2010, the real GDP in Bulgaria increased with even 3.1%, almost reaching the level in the fourth quarter of 2008. In the first quarter of 2011, the real GDP in Bulgaria continued its positive trend and a growth of 2.1 % was noticed. The real GDP in Bulgaria increased with even 2.7% in the second quarter of the year. During the third quarter of the year, the noticed increase was 1.9%. In the last quarter of 2011 the positive trend decreased to 0.3% but kept the positive figures.
Valuation of a Mixed-use Property in Geo Milev Area, Sofia, Bulgaria
B.S.R. Sofia AD Page 13 of 74
During the whole 2011, the real GDP in Bulgaria increased with 1.7% on an annual basis. This is a positive trend compared to the previous year when the increase in the real GDP was only 0.4%. In the first quarter of 2010, the real GDP in EU27 increased by 0.4%. This positive trend has been noticed for the first time since the third quarter of 2008. The real GDP in EU27 continued the upward trend in the second quarter of 2010 and an increase of 1.0% was noticed. In the third and in the fourth quarter of 2010, the increasing trend continued at a slower pace with 0.5% and 0.2% respectively. In the first quarter of 2011, the real GDP in EU27 increased by 0.7%. During the second and the third quarter of 2011 the increase was only 0.2% and 0.3% respectively. In the last quarter of 2011 a negative trend of -0.3% was noticed. The first quarter of 2012 presents a GDP growth of 0.5% which is higher than the EU27 average of 0.1%. The forecast for 2012 shows a slowdown in GDP growth as stability is expected to ensue in the national economy. The projected figure of 1.5% displays an overall increase in GDP but shows a decline of 11% compared to the previous year.
Source: Eurostat, Bulgarian National Bank (BNB)
On the demand side, as of the first quarter of 2012, the consumption amounted to EUR 6.96 and shows a decrease as compared to EUR 8.20 billion in the previous fourth quarter of 2011 but presents an increase compared to EUR 6.46 billion one year ago in the first quarter of 2011. Investments have decreased to EUR 1.79 billion in the first quarter of 2012 from EUR 2.46 in Q4 2011. The Net Export in the first quarter of 2012 has decreased to EUR -0.74 billion from EUR -0.71 in the last quarter of 2011. Below, we have presented a graph outlining the share of each component of the GDP per quarter for the period Q1 2008 – Q1 2012.

Valuation of a Mixed-use Property in Geo Milev Area, Sofia, Bulgaria
B.S.R. Sofia AD Page 14 of 74
Source: Bulgarian National Bank (BNB)
On the supply side, the gross value added in current prices (GVA) in Q1 2012 was measured to be EUR 6.8 billion. That shows a decrease compared to the last quarter of 2011 when the GVA was EUR 8.50 billion. Breakdowns of the GVA in Q1 2012 and in the whole previous 2011 are presented below. It is visible from the graphics that the Agriculture and Forestry share has increased in Q1 2012 in comparison to the whole 2011 whilst the other two sectors have decreased.
Source: National Statistic Institute

Valuation of a Mixed-use Property in Geo Milev Area, Sofia, Bulgaria
B.S.R. Sofia AD Page 15 of 74
Source: National Statistic Institute
INFLATION
In 2008 the increase of CPI continued until June when it reached 15.3% on an annual basis. In the second half of 2008 it started to stabilize and in the last two months of 2008 registered a visible decrease. This was largely attributable to the downward trends in the growth of international fuel and commodity prices reflecting global economic activity slowdown. By the end of 2008 the inflation on an annual basis stood at 7.8% (measured according to the national methodology by CPI). By the end of 2009, the inflation rates stood at 0.6%, which was the lowest level for the period from 1998 to 2010. In 2010 the inflation started increasing again and reached 4.5%. In Q1, Q2, Q3 and Q4 2011 the inflation in Bulgaria was 2.2%, 0.7%, -0.7% and 1.0% respectively. The inflation rate on annual basis in Bulgaria for 2011 was 2.8%, down from 4.5% in 2010. In 2012 inflation is expected to mark a slight decrease to 2.7% that will coincide with the European Harmonized Index of Consumer Prices (HICP) which as of April 2012 stands at 2.7%%.
Source: Eurostat, BNB
As visible from the graph above, the main increase in the prices was noted in the period of 2007 to 2008. It is mainly attributable to the increase of foreign direct investments and was further boosted by catching up of price disparities between Bulgaria and the rest of the European Union.
Valuation of a Mixed-use Property in Geo Milev Area, Sofia, Bulgaria
B.S.R. Sofia AD Page 16 of 74
During 2010 and 2011, a considerable increase of the inflation in the European Union was noticed – 2.1% and 3.1 % respectively. The annual inflation (measured by HICP) in April 2012 in the European Union was 2.7% showing a decrease of 0.6% compared to March 2012. A year earlier the rate was 3.3%. In April 2012, the lowest annual rates were observed in Sweden (1.0%), Greece (1.5%), Ireland and Romania (both 1.9%) and the highest in Hungary (5.6%), Estonia (4.3%), the Czech Republic and Poland (both 4.0%)
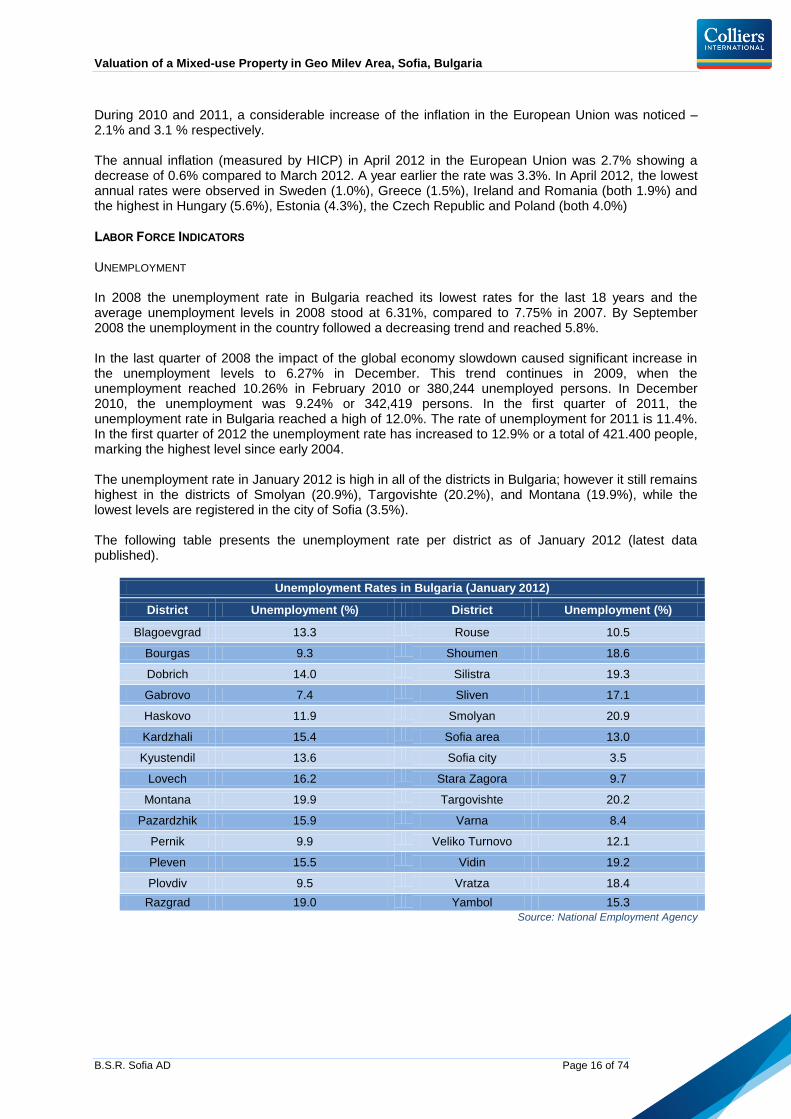
LABOR FORCE INDICATORS UNEMPLOYMENT In 2008 the unemployment rate in Bulgaria reached its lowest rates for the last 18 years and the average unemployment levels in 2008 stood at 6.31%, compared to 7.75% in 2007. By September 2008 the unemployment in the country followed a decreasing trend and reached 5.8%. In the last quarter of 2008 the impact of the global economy slowdown caused significant increase in the unemployment levels to 6.27% in December. This trend continues in 2009, when the unemployment reached 10.26% in February 2010 or 380,244 unemployed persons. In December 2010, the unemployment was 9.24% or 342,419 persons. In the first quarter of 2011, the unemployment rate in Bulgaria reached a high of 12.0%. The rate of unemployment for 2011 is 11.4%. In the first quarter of 2012 the unemployment rate has increased to 12.9% or a total of 421.400 people, marking the highest level since early 2004. The unemployment rate in January 2012 is high in all of the districts in Bulgaria; however it still remains highest in the districts of Smolyan (20.9%), Targovishte (20.2%), and Montana (19.9%), while the lowest levels are registered in the city of Sofia (3.5%). The following table presents the unemployment rate per district as of January 2012 (latest data published).
Unemployment Rates in Bulgaria (January 2012)
District Unemployment (%) District Unemployment (%)
Blagoevgrad 13.3 Rouse 10.5
Bourgas 9.3 Shoumen 18.6
Dobrich 14.0 Silistra 19.3
Gabrovo 7.4 Sliven 17.1
Haskovo 11.9 Smolyan 20.9
Kardzhali 15.4 Sofia area 13.0
Kyustendil 13.6 Sofia city 3.5
Lovech 16.2 Stara Zagora 9.7
Montana 19.9 Targovishte 20.2
Pazardzhik 15.9 Varna 8.4
Pernik 9.9 Veliko Turnovo 12.1
Pleven 15.5 Vidin 19.2
Plovdiv 9.5 Vratza 18.4
Razgrad 19.0 Yambol 15.3
Source: National Employment Agency

Valuation of a Mixed-use Property in Geo Milev Area, Sofia, Bulgaria
B.S.R. Sofia AD Page 17 of 74
AVERAGE SALARY
The average national salary in the first quarter of 2012 is EUR 314, which represents more than 6% increase in comparison to the same period of 2011. The highest average salaries are reported in the Information and communication and Electricity, gas, steam and air conditioning supply sectors, respectively EUR 805 and EUR 750, and the lowest rates are reported in the sectors of Administrative and support service activities industry – EUR 230 and in Accommodation and food services – EUR 232.
Source: National Statistic Institute
EMPLOYMENT BY ECONOMY SECTORS The total number of employed people in Bulgaria in Q1 2012 amounted to 2,104,458. More than half of the Bulgarian population is employed in the services sector, which follows the general trend in the European Union. In the last decade the employment in the industrial and manufacturing sectors shrunk considerably and thus resulted in a redistribution of labor force to other sectors of the economy. In the last five years the financial, banking and real estate sectors, as well as the government, persistently attracted labor force. The impact of the global economic and financial slowdown has been most visible in the employment rate in sectors such as Real estate activities, Construction, Agriculture, forestry and fishing and Other service activities where the employment has decreased by 12%, 7%, 6% and 4% respectively in Q1 2012 compared to the same period of the previous year. An increase is observed in Water supply, sewerage and waste management as well as in Information and communication by 8% and 6% respectively. The graph below presents the employment by Economy sectors as of the first quarter of 2012 compared to the first quarter of 2011.

Valuation of a Mixed-use Property in Geo Milev Area, Sofia, Bulgaria
B.S.R. Sofia AD Page 18 of 74
Source: National Statistic Institute
BALANCE OF PAYMENTS The account balance for 2011 is EUR 0.7 billion (1.8% of GDP), compared to a deficit of EUR -0.5 billion (-1.4% of GDP) in 2010. The main factor for the notable increase was the increase of the export, investments and the current capital account.
DEBT INDICATORS
By the end of 2011 the External Debt exceeded EUR 37.0 billion (102.6% of GDP). Compared to the previous year when the External Debt exceeded EUR 37.8 billion (108.2% of GDP), a decrease of 2.2% is noticed.
FOREIGN DIRECT INVESTMENT
With the global financial market conditions taking down the pressure to costs and to the availability of external liquidity, an increase of approximately 11% in the total FDI for 2011 compared to 2010 has been recorded. The total foreign direct investment by the end of the first quarter of 2012 amounted to EUR 0.24 billion.

Valuation of a Mixed-use Property in Geo Milev Area, Sofia, Bulgaria
B.S.R. Sofia AD Page 19 of 74
Source: BNB
Six countries contributed the most in the inflow of FDI in 2011. The current investor number one in Bulgaria is the Netherlands with EUR 556.5 million FDI in 2011 and EUR 257.1 million in the first quarter of 2012.
Source: BNB
Valuation of a Mixed-use Property in Geo Milev Area, Sofia, Bulgaria
B.S.R. Sofia AD Page 20 of 74
FORECAST Growth in 2012 is expected to slow to 1.5% on the back of weaker domestic and external demand, affected by a crisis-hit and risk-averse Europe. Export volume growth, which has been a major driver of the economy in recent years, will slow considerably in 2012 on account of the expected mild recession in the Eurozone, Bulgaria’s main trading partner. Consumer spending and investment both remain subdued as economic uncertainty persists, unemployment is high and consumers continue to avoid credit usage. However, given the recent long period of weakness, both consumption and investment have the potential to pick up strongly once the uncertainty lifts. The continuing Eurozone debt crisis carries considerable downside risks to the forecast for Bulgaria. In particular, if Eurozone banks' balance sheets are more negatively affected than currently forecasted, then credit provision could stagnate or even fall back, weighing on investment and growth. Bulgaria's banking system is more robust than in some other EU countries. At 12% on paper and 17% in reality (because of the National Bank’s recommendation for the banks not to distribute dividends) the capital adequacy ratio is well over the required EU minimum of 8%. Undershooting the 2011 deficit target, along with having one of the lowest public debt ratios in the EU, helped to keep Bulgaria insulated from the current turmoil on European debt markets and on the right track to fiscal sustainability. Indeed, yields have declined slightly, avoiding additional pressure on an otherwise already tight budget.
Valuation of a Mixed-use Property in Geo Milev Area, Sofia, Bulgaria
B.S.R. Sofia AD Page 21 of 74
SOFIA OFFICE PROPERTY MARKET COMMENTARY The following section presents the trends evident at the office property market in Sofia.
GENERAL REMARKS The total stock of contemporary class A and B office space reached 1,570,242 square meters during the first half of 2012, an increase by approximately 2%. The quality of the supply of office space does not respond adequately to the rising requirements on the demand side from the international companies. The overall office space vacancy on the Sofia market continued to decrease – from 26% in the beginning of 2012 to 23% by the end of June. Most preferred are office projects class A, which meet international standards. The net absorption of contemporary office space during the first half of 2012 was only 30,000 square meters. The demand is driven mainly by international outsourcing companies who are expanding their business in Bulgaria. Total office occupancy reached over 1,307,209 square meters by the first six months of the year. In the first half of 2012, average asking rents remained unchanged across all submarkets.
DEFINITION OF CLASS A, B, AND C OFFICE BUILDINGS For the purposes of comparison, office buildings are classified in three categories according to their location and physical characteristics. It is important to point out that there is no universal definition. Rather, judgments are made based on the particular market with the common notion that Class A is represented by the premium office product available on the subject market. Class B & C buildings are respectively defined in reference to the quality of the existing Class A supply. When defining Class A, B, or C office space, the latter key features associated with the quality of the office space should be used:
HVAC system Suspended ceilings and raised floors Floor to ceiling height minimum 2.70 Flexibility of internal design High category cabling Modern high speed lifts, if applicable Provision of dedicated car parking Reliable telephone and communications equipment Dual power supply and/or power supply system back-up
Thus, Class A buildings could be more precisely defined as office properties with quality criteria being at the upper end of the scale which are also characterized by good accessibility and location within a recognized business area. Class B office buildings reflect an average or typical building for the market based on the above-mentioned criteria. Finally, class C properties meet below-average requirements and represent the office space of lowest quality available on the market.
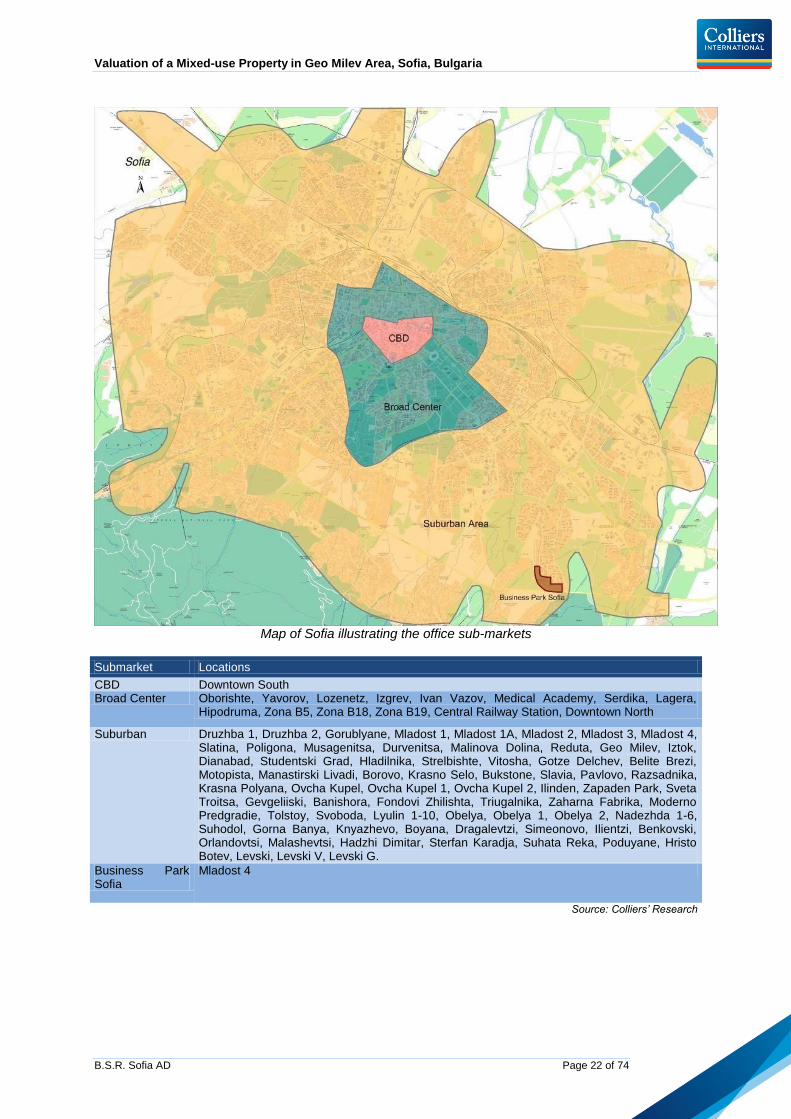
SOFIA SUB-MARKETS The office real estate market in Sofia has undergone a rapid development in the past few years. While several years ago there was no suburban office market, today we can clearly differentiate between the Central Business District (CBD), the Broad Center (BC) and the Suburban office markets. Here it is important to point out that a significant portion of the office supply in Sofia is concentrated in one office complex, namely Business Park Sofia, which is situated in Mladost 4 residential area, bordering the southern arc of the Ring Road of the capital. This is why throughout the present chapter we have explicitly outlined the latter as a separate submarket. A map illustrating the boundaries of the submarkets and a summary table are presented below.
Valuation of a Mixed-use Property in Geo Milev Area, Sofia, Bulgaria
B.S.R. Sofia AD Page 22 of 74
Map of Sofia illustrating the office sub-markets
Submarket Locations
CBD Downtown South Broad Center Oborishte, Yavorov, Lozenetz, Izgrev, Ivan Vazov, Medical Academy, Serdika, Lagera,
Hipodruma, Zona B5, Zona B18, Zona B19, Central Railway Station, Downtown North
Suburban Druzhba 1, Druzhba 2, Gorublyane, Mladost 1, Mladost 1A, Mladost 2, Mladost 3, Mladost 4, Slatina, Poligona, Musagenitsa, Durvenitsa, Malinova Dolina, Reduta, Geo Milev, Iztok, Dianabad, Studentski Grad, Hladilnika, Strelbishte, Vitosha, Gotze Delchev, Belite Brezi, Motopista, Manastirski Livadi, Borovo, Krasno Selo, Bukstone, Slavia, Pavlovo, Razsadnika, Krasna Polyana, Ovcha Kupel, Ovcha Kupel 1, Ovcha Kupel 2, Ilinden, Zapaden Park, Sveta Troitsa, Gevgeliiski, Banishora, Fondovi Zhilishta, Triugalnika, Zaharna Fabrika, Moderno Predgradie, Tolstoy, Svoboda, Lyulin 1-10, Obelya, Obelya 1, Obelya 2, Nadezhda 1-6, Suhodol, Gorna Banya, Knyazhevo, Boyana, Dragalevtzi, Simeonovo, Ilientzi, Benkovski, Orlandovtsi, Malashevtsi, Hadzhi Dimitar, Sterfan Karadja, Suhata Reka, Poduyane, Hristo Botev, Levski, Levski V, Levski G.
Business Park Sofia
Mladost 4
Source: Colliers’ Research
Valuation of a Mixed-use Property in Geo Milev Area, Sofia, Bulgaria
B.S.R. Sofia AD Page 23 of 74
EXISTING CLUSTERS WITH OFFICE BUILDINGS As seen from the map above, the Central Business District (CBD) encompasses the southern part of the city center. This zone has shaped as a preferable office location. The following table summarizes the larger office buildings located within the city center:
Building Location Class TBA (m2) Office Area (m2) Year Built
Perform Business Center CBD A 33,962 15,600 2010
Tri Ushi – Bulgarian Stock Exchange
CBD B 13,000 13,000 2005
Sofia Tower CBD A 10,071 10,071 2007
Bulbank Headquarters CBD A 9,000 9,000 1990s
NCH - Maria Louiza Cente0072 CBD B 7,560 7,560 2006
TZUM CBD A 9,000 6,750 2000
SG Express Bank CBD B 8,350 6,263 2000
Crystal Business Center CBD A 8,000 6,100 2009
Sofia 2000 (PWC) CBD A 6,071 6,071 2002
Landmark Center CBD A 10,017 5,497 2003
The Needle CBD A 5,167 2,500 2011
Source: Colliers’ Research
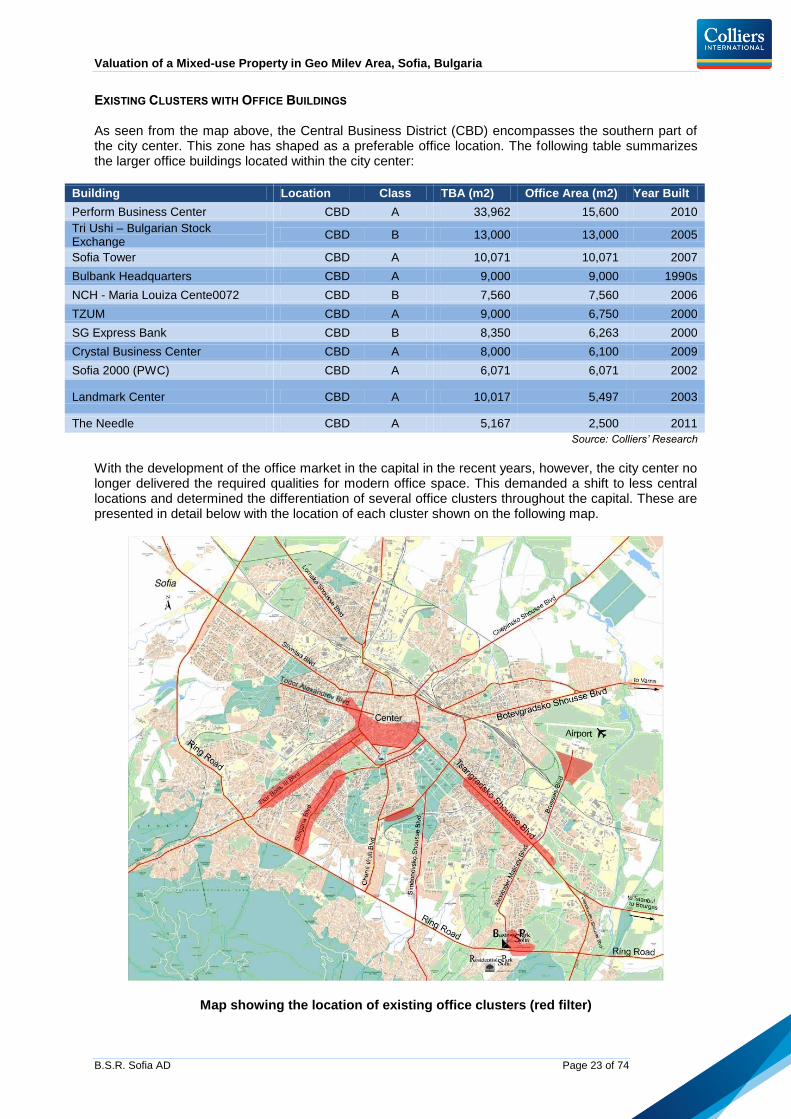
With the development of the office market in the capital in the recent years, however, the city center no longer delivered the required qualities for modern office space. This demanded a shift to less central locations and determined the differentiation of several office clusters throughout the capital. These are presented in detail below with the location of each cluster shown on the following map.
Map showing the location of existing office clusters (red filter)
Valuation of a Mixed-use Property in Geo Milev Area, Sofia, Bulgaria
B.S.R. Sofia AD Page 24 of 74
The process of clustering of office space in certain locations continues to add new destinations. The first clusters were the area around Business Park Sofia together with the office buildings on boulevard Nikola Vaptsarov. Afterwards business districts were formed on Bulgaria Boulevard and Todor Alexandrov. The new office cluster that is shaping up in a major way is Tsarigradsko Shosse, with the area around Sofia Airport Center also aiming for such positioning. Beginning from Business Park Sofia and then from the left, following paragraphs present the major existing office developments in each cluster:
Business Park Sofia The Business Park Sofia has itself shaped the area of Mladost 4 as a preferred office location. The forthcoming development of a metro station in proximity to the park and the widening of the ring road will help sustain the position of BPS.
Building Location TBA (m2) Office Area (m2) Year Built
Building 1A BPS 8,802 5,700 2005
Building 1 BPS 5,550 3,000 2005
Building 2 BPS 5,915 4,969 2003
Building 2A BPS 4,177 3,402 2005
Building 3 BPS 12,938 7,638 2002
Building 4 BPS 5,915 4,187 2002
Building 5 BPS 10,484 6,850 2007
Building 6 BPS 12,995 9,343 2007
Building 7 BPS 6,713 4,698 2006
Building 8 BPS 30,361 18,083 2007
Building 9 BPS 11,974 8,453 2006
Building 10 BPS 14,270 8,580 2005
Building 11 BPS 13,452 6,332 2005
Building 12 BPS 11,075 4,661 2003
Building 13 BPS 12,079 2,362 2002
Building 14 BPS 6,000 5,000 2008
Source: Colliers’ Research
Besides, following the success of BPS, several office buildings were imitated in proximity, either along Al. Malinov Boulevard or across the ring road. The largest are listed below:
Building Location Class TBA (m2) Office Area (m2) Year Built
Sofia Business Center BPS / Ring Road A 23,600 19,800 2008
Kambanite Business Centre BPS / Ring Road A 15,800 15,800 2009
Alfa Business Centre BPS / Ring Road A 15,800 7,800 2009
Matrix Tower BPS / Ring Road A 4,000 4,000 2009
Adora Business Centre BPS / Ring Road A 20,100 10,800 2010
XS Tower BPS / Ring Road A 6,600 5,000 2009
Source: Colliers’ Research
Todor Alexandrov Boulevard Todor Alexandrov Boulevard is among the major boulevards in Sofia. It was redeveloped several years ago and currently takes a great deal of the traffic in the capital. The boulevard begins at the very heart of Sofia – Nezavisimost square (close to the Presidency and the Council of Ministers), and leads to the northwest. According to the Master Plan of Sofia the boulevard is expected to develop as the new business city of the capital, and it is already shaping up as a target location for office developments. There are several existing administrative buildings.
Valuation of a Mixed-use Property in Geo Milev Area, Sofia, Bulgaria
B.S.R. Sofia AD Page 25 of 74
Building Location Class TBA (m2) Office Area
(m2) Year Built
Lukoil / Metropoliten Todor Alexandrov Blvd A 11,200 8,400 2003
Litexco / FEIBank Todor Alexandrov Blvd A 10,400 7,800 2002
Mixed-use Complex Todor Alexandrov Blvd A 4,402 2,308 2004
Todor Aleksandrov 73 Todor Alexandrov Blvd B 1,599 1,599 2007
Anel Todor Alexandrov Blvd A 6,000 1,524 2004
Source: Colliers’ Research
Tsar Boris III Boulevard The cluster on Tzar Boris III Boulevard is a preferable location predominantly for Class B office space. The table below presents the major exiting developments in this part of the capital.
Building Location Class TBA (m2) Office Area (m2) Year Built
SAP Building Tzar Boris III Blvd B 11,008 8,256 2005
Intradings Business Center Tzar Boris III Blvd A 6,496 6,496 2009
Business Centre Andromeda Tzar Boris III Blvd B 6,818 5,218 2008
Prima Business Center Tzar Boris III Blvd B 4,500 3,500 1998
Ivel 2003 Mixed-use Building Tzar Boris III Blvd B 1,800 1,500 2007
Sofia Tower Tzar Boris III Blvd B 4,500 1,350 2007
Source: Colliers’ Research
Bulgaria Boulevard Bulgaria Boulevard is one of the locations to enjoy the greatest interest from investors in terms of both office and residential construction in the capital. The excellent transportation connections as well as the availability of land parcels with adequate size predispose for the development of the area as a natural business location, where some of the key criteria of office tenants are met. The following table presents the stock of existing office buildings in proximity to the subject property along Bulgaria Boulevard:
Building Status TBA (m2) Office Area (m2) Year Built
Belissimo Business Center Existing 16,123 13,000 2006
Bulgaria House Existing 26,100 11,200 2009
City General Existing 13,000 11,000 2008
Abacus Business Center Existing 12,000 10,000 2009
Bulgaria Tower Existing 9,075 7,897 2008
Vitosha Business Center - Standard Existing 8,061 7,500 2003
Astra Complex Existing 8,532 5,735 2008
3 Tops Existing 5,500 5,500 2008
Comfort Residence Existing 16,713 5,345 2007
Bulgaria Center Existing 6,538 5,084 2007
Sinara Existing 4,750 4,750 2007
Azmuth - Hypo Alpe Existing 20,000 4,000 2007
Atanel Atrium Existing 5,300 3,400 2008
Entra Business Center Existing 4,500 3,375 2005
Botonakis Business Center Existing 3,069 3,069 2005
Florimont Expo Existing 4,635 3,000 2009
Enterprise building Existing 2,700 2,100 2000
Festa Complex Existing 13,000 2,300 2007
Vertigo Tower Existing 36,500 14,323 2011
Source: Colliers’ Research
Valuation of a Mixed-use Property in Geo Milev Area, Sofia, Bulgaria
B.S.R. Sofia AD Page 26 of 74
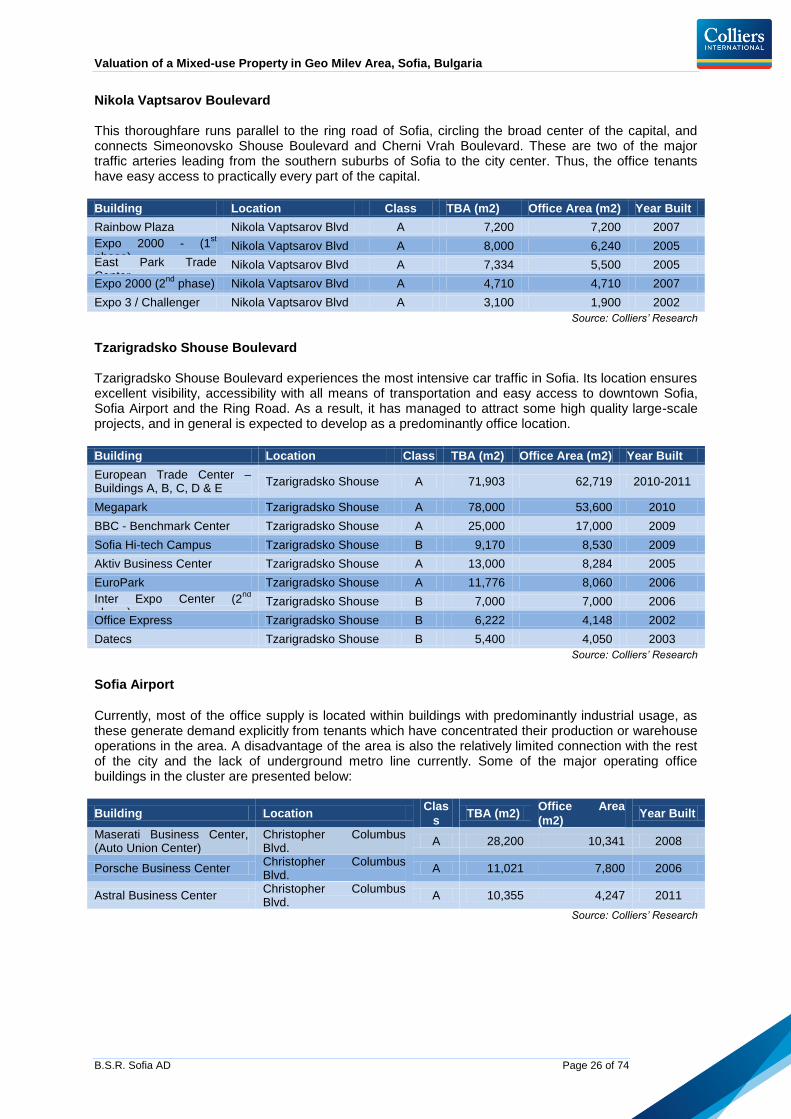
Nikola Vaptsarov Boulevard This thoroughfare runs parallel to the ring road of Sofia, circling the broad center of the capital, and connects Simeonovsko Shouse Boulevard and Cherni Vrah Boulevard. These are two of the major traffic arteries leading from the southern suburbs of Sofia to the city center. Thus, the office tenants have easy access to practically every part of the capital.
Building Location Class TBA (m2) Office Area (m2) Year Built
Rainbow Plaza Nikola Vaptsarov Blvd A 7,200 7,200 2007
Expo 2000 - (1st
phase) Nikola Vaptsarov Blvd A 8,000 6,240 2005
East Park Trade Center
Nikola Vaptsarov Blvd A 7,334 5,500 2005
Expo 2000 (2nd
phase) Nikola Vaptsarov Blvd A 4,710 4,710 2007
Expo 3 / Challenger Nikola Vaptsarov Blvd A 3,100 1,900 2002
Source: Colliers’ Research
Tzarigradsko Shouse Boulevard Tzarigradsko Shouse Boulevard experiences the most intensive car traffic in Sofia. Its location ensures excellent visibility, accessibility with all means of transportation and easy access to downtown Sofia, Sofia Airport and the Ring Road. As a result, it has managed to attract some high quality large-scale projects, and in general is expected to develop as a predominantly office location.
Building Location Class TBA (m2) Office Area (m2) Year Built
European Trade Center – Buildings A, B, C, D & E
Tzarigradsko Shouse A 71,903 62,719 2010-2011
Megapark Tzarigradsko Shouse A 78,000 53,600 2010
BBC - Benchmark Center Tzarigradsko Shouse A 25,000 17,000 2009
Sofia Hi-tech Campus Tzarigradsko Shouse B 9,170 8,530 2009
Aktiv Business Center Tzarigradsko Shouse A 13,000 8,284 2005
EuroPark Tzarigradsko Shouse A 11,776 8,060 2006
Inter Expo Center (2nd
phase)
Tzarigradsko Shouse B 7,000 7,000 2006
Office Express Tzarigradsko Shouse B 6,222 4,148 2002
Datecs Tzarigradsko Shouse B 5,400 4,050 2003
Source: Colliers’ Research
Sofia Airport
Currently, most of the office supply is located within buildings with predominantly industrial usage, as these generate demand explicitly from tenants which have concentrated their production or warehouse operations in the area. A disadvantage of the area is also the relatively limited connection with the rest of the city and the lack of underground metro line currently. Some of the major operating office buildings in the cluster are presented below:
Building Location Clas
s TBA (m2)
Office Area
(m2) Year Built
Maserati Business Center, (Auto Union Center)
Christopher Columbus Blvd.
A 28,200 10,341 2008
Porsche Business Center Christopher Columbus Blvd.
A 11,021 7,800 2006
Astral Business Center Christopher Columbus Blvd.
A 10,355 4,247 2011
Source: Colliers’ Research

Valuation of a Mixed-use Property in Geo Milev Area, Sofia, Bulgaria
B.S.R. Sofia AD Page 27 of 74
SUPPLY* *The “Supply” section comprise existing Class A and B office buildings, no more than 15 years old and with office areas exceeding 1,000 square meters. The inventory of office space in Sofia increased by approximately 2% during the first half of 2012. At present, the total stock of Class A and Class B office premises is estimated at 1,570,242 square meters, although this comprises varying degrees of quality. 13% of the total office stock for rent is located in Sofia’s Central Business District, while 68% of the office supply, or 1,049,369 square meters, are located in the suburban areas of the capital. The Broad Center represents 20%. As mentioned above the total stock of Class A office premises has reached 824,352 square meters. However, following international classification of office space and the requirements of multinational clients, the actual class A office space that meets the requirements is estimated at approximately 310,000 square meters, concentrated in 17 contemporary office projects. The characteristics of these buildings include high construction quality, good location, easy access both by car and public transport, efficient layout, and high-quality systems. This Class A office space represents only 19% of the overall stock on the market. The table below presents the trends in the development of the office submarket in Sofia for the period H2 2008 – H1 2012.
Submarket H2 2008 H1 2009 H2 2009 H1 2010 H2 2010 H1 2011 H2 2011
H1 2012*
CBD 147,954 150,604 154,304 172,917 188,517 188,517 199,770 204,963
Broad Centre 220,486 221,625 241,669 248,086 272,019 291,335 291,335 315,910
Suburban 505,546 592,352 665,565 746,650 857,243 898,228 1,047,535 1,049,396
Total Gross
Area* 873,986 964,581 1,061,538 1,167,653 1,317,779 1,378,080 1,538,640 1,570,242
Source: Colliers’ Research *The total floor space of a building, including unusable space, measured from the outside walls
The following table shows the total stock of contemporary office space for the period H1 2008 to H1 2012:
Source: Colliers’ Research
The most developed area with contemporary office space remains the Suburban area, with a share of 67% of the total market and a slight growth compared to six months ago. On a year-on-year basis the stock in this area has increased with 151,168 square meters. The Suburban stock is mostly concentrated along the main boulevards and traffic arteries in Sofia. This trend is driven by the lack of suitable land plots for large office projects in the CBD and Broad Center area.

Valuation of a Mixed-use Property in Geo Milev Area, Sofia, Bulgaria
B.S.R. Sofia AD Page 28 of 74
Several office buildings were completed during the past year and added their share to the total office stock in Sofia. High-quality premises appeared in the Suburban locations, as well as in the Central Business District. The new suburban projects are located along main traffic routes in Sofia providing excellent accessibility such as Sopharma Towers located on Dragan Tsankov Boulevard, which added 23,000 square meters to the contemporary Class A office space in Sofia. Other developments completed during the second half of 2011 are The Needle in the Central Business District with 2,500 square meters leasable office area; Vertigo and Astral business centers, which combined delivered approximately 20,000 square meters of office space to the market in the suburban area. In order to account for the most recent development of the office property market, below we have presented a table with key data for selected recent office deliveries.
SELECTED CLASS A & B OFFICE BUILDINGS COMPLETED IN H1 2012
Building Name Location Gross Office Area (m2)
TAO Broad Center 1 700
Urban Model Broad Center 6 000
Energy Center Broad Center 8 000
Monterosa Business Point CBD 5 000 Source: Colliers’ Research
Currently, approximately 310,000 square meters of office space is in the active pipeline. 70% of the future supply is located in the suburban areas of the city, and only few of them can be classified as Class A. Compared to the end of 2010 this number has decreased with 150,000 square meters, which is mostly a result of projects being completed. The chart below presents the total amount of class A and B office space under construction as of H2 2011.
Source: Colliers’ Research
Further details on the larger projects currently under development are presented in the Section
Projects in the Pipe-line of the present chapter.
VACANCY** & AVAILABILITY **Vacancy: unoccupied class A and B office space with permission for usage. The overall vacancy in Sofia office market has slightly decreased by 3% to 363,857 square meters. In percentages, the vacancy at the end of 2011 amounted to 25.2% of total, contemporary stock in Sofia and in H1 2012 that percentage is 23%.

Valuation of a Mixed-use Property in Geo Milev Area, Sofia, Bulgaria
B.S.R. Sofia AD Page 29 of 74
The distribution of vacant office space is not spread evenly across the city. The majority of vacant space continues to be concentrated in the suburban part of the capital, where the share of unoccupied space is equal to 263,033 square meters. Vacancy in the Central Business District reached 38, 732 square meters. The absorption of vacant office space will continue, mainly due to the lack of new office supply in the active pipeline. It will be focused on Class A office projects, which meet international standards. The vacancy in the CBD has slightly increased, amounting to 36,374 square meters, mainly due to the completion of new projects. In the Suburban areas, the vacancy level remained unchanged. This is due to the fact that several projects were completed during this period, while at the same time the absorption in the premium Class A office premises increased as well. Absorption of vacant space is expected to continue, mainly concentrated in offices class A. The charts below present the vacancy rates per submarket.
Source: Colliers’ Research
DEMAND The net absorption for the first half of 2012 was 30,000 square meters. To a large extent this demand was driven by international outsourcing companies, which have expanded their business in Bulgaria, such as the American IT company Ingram Micro. Other international companies have also registered interest in Bulgaria as an appropriate destination to outsource activities. These companies have the financial means and the clear belief, that high-quality office premises are needed to support their core business. As a result of the competitive rental prices, more companies could afford to relocate to higher-class office space or location with better accessibility and attractiveness. The Suburban areas along major traffic arteries such as Tsarigradsko Shouse enjoyed strong demand from tenants who appreciate quick access and contemporary office space with European Trade Center and Megapark attracting several new tenants. Clients for office space have become more knowledgeable and selective with regard to real estate leasing and purchases. Companies started to realize the importance of better access, improved working environment, property management services and availability of amenities. The majority of office occupiers prefer to lease office space rather than to buy. Demand for offices both less than 200 square meters in size or more than 2,000 square meters is limited.
Valuation of a Mixed-use Property in Geo Milev Area, Sofia, Bulgaria
B.S.R. Sofia AD Page 30 of 74
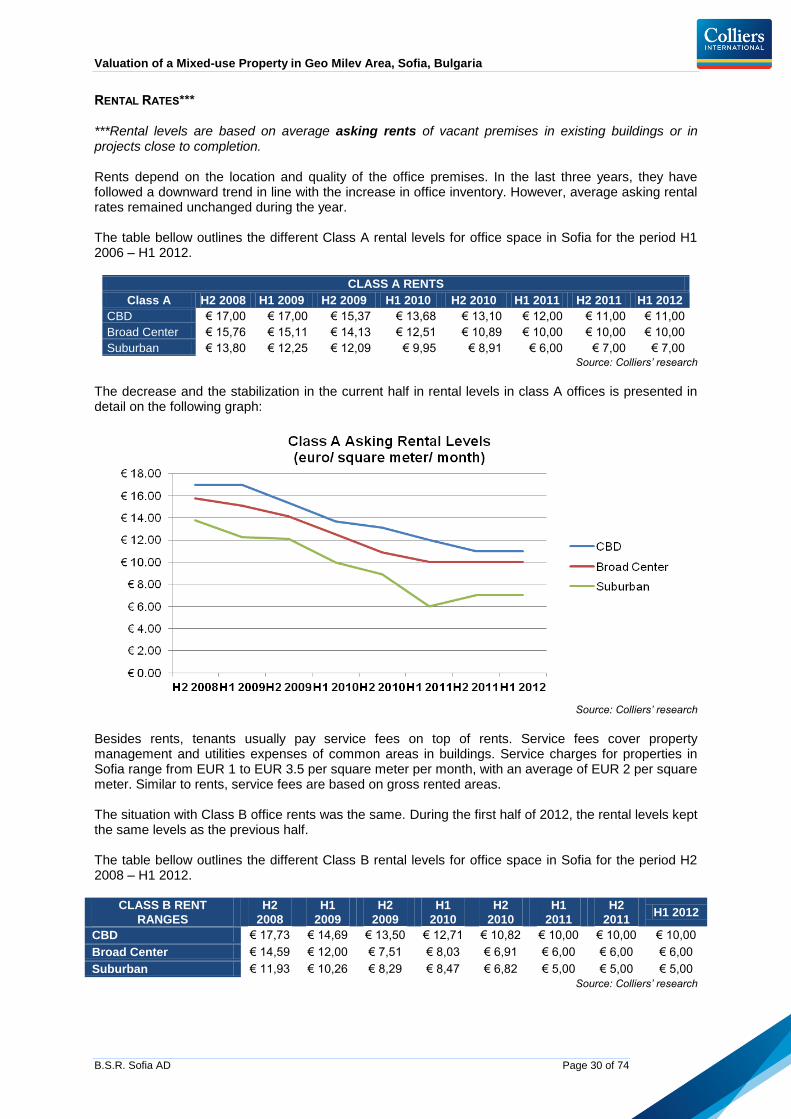
RENTAL RATES*** ***Rental levels are based on average asking rents of vacant premises in existing buildings or in projects close to completion. Rents depend on the location and quality of the office premises. In the last three years, they have followed a downward trend in line with the increase in office inventory. However, average asking rental rates remained unchanged during the year. The table bellow outlines the different Class A rental levels for office space in Sofia for the period H1 2006 – H1 2012.
CLASS A RENTS
Class A H2 2008 H1 2009 H2 2009 H1 2010 H2 2010 H1 2011 H2 2011 H1 2012
CBD € 17,00 € 17,00 € 15,37 € 13,68 € 13,10 € 12,00 € 11,00 € 11,00
Broad Center € 15,76 € 15,11 € 14,13 € 12,51 € 10,89 € 10,00 € 10,00 € 10,00
Suburban € 13,80 € 12,25 € 12,09 € 9,95 € 8,91 € 6,00 € 7,00 € 7,00 Source: Colliers’ research
The decrease and the stabilization in the current half in rental levels in class A offices is presented in detail on the following graph:
Source: Colliers’ research
Besides rents, tenants usually pay service fees on top of rents. Service fees cover property management and utilities expenses of common areas in buildings. Service charges for properties in Sofia range from EUR 1 to EUR 3.5 per square meter per month, with an average of EUR 2 per square meter. Similar to rents, service fees are based on gross rented areas. The situation with Class B office rents was the same. During the first half of 2012, the rental levels kept the same levels as the previous half. The table bellow outlines the different Class B rental levels for office space in Sofia for the period H2 2008 – H1 2012.
CLASS B RENT
RANGES
H2
2008
H1
2009
H2
2009
H1
2010
H2
2010
H1
2011
H2
2011 H1 2012
CBD € 17,73 € 14,69 € 13,50 € 12,71 € 10,82 € 10,00 € 10,00 € 10,00
Broad Center € 14,59 € 12,00 € 7,51 € 8,03 € 6,91 € 6,00 € 6,00 € 6,00
Suburban € 11,93 € 10,26 € 8,29 € 8,47 € 6,82 € 5,00 € 5,00 € 5,00
Source: Colliers’ research

Valuation of a Mixed-use Property in Geo Milev Area, Sofia, Bulgaria
B.S.R. Sofia AD Page 31 of 74
The decrease and the stabilization in the current half in rental levels in class B offices is presented in detail on the following graph:
Source: Colliers’ research
It should be mentioned that the gross area described above is different from the gross floor area of these buildings. The reason for that is that the gross floor area includes the total area on each floor plate to the outer edge of the building while the net area used to calculate the rent includes inner columns and only half of the outer walls.
YIELDS The investment market in Bulgaria remains quite fragmented, with limited number of transactions. The following table presents the development in prime yields for office properties since 2005.
Property Developer Buyer Timing GLA
(m2)
TBA
(m2)
Gross
Initial
Yield
Soravia Business Centre Soravia Landmark Q1 2005 6,500 10,000 7.75%
B1 in BPS Lindner Blue House Q2 2005 3,659 5,347 n/a
Business Park Sofia Lindner Gramercy Q4 2006 115,123 187,000 7.6%
Challenger Building PCI Automotive Blue House Q2/3 2005
2,934 9.2%
Sofia Tower ITIT; Aviv GE; Quinlan Private Q1 2006 8,500 10,000 8.8%
Porsche Center Orchid Developments
Landmark Q1 2007 8,000 8,500 8.0%
Landmark Portfolio Altima, Thor Biorgolfson
Bridgecorp Q4 2007 92,300 7-8%
Business Park Varna Sistec Africa-Izrael Investment Europe
Q4 2007 63,000 119,000 9.9%
BSR Center BSR Center Atlas Estates Limited Q4 2007 3,472 3,472 8.0%
Avto Union Center Avto Union Holding
Eurohold Q3 2009 10,341 28,165 10%
Source: Colliers’ research
Valuation of a Mixed-use Property in Geo Milev Area, Sofia, Bulgaria
B.S.R. Sofia AD Page 32 of 74
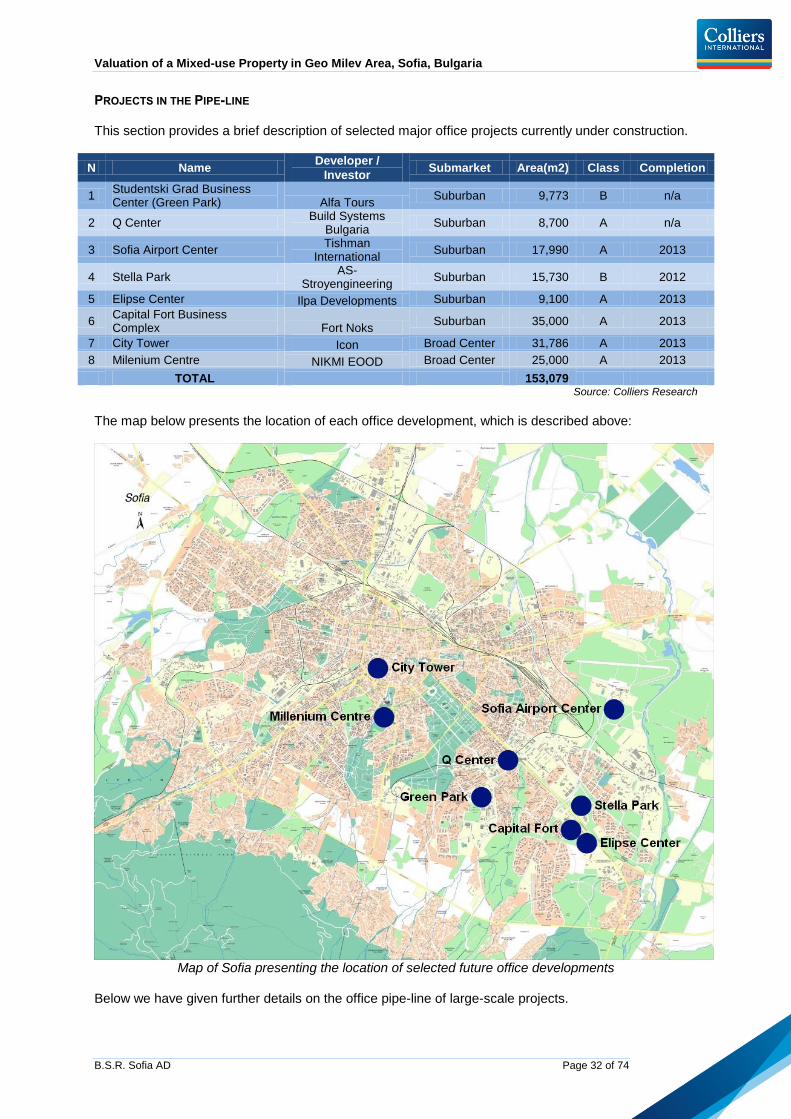
PROJECTS IN THE PIPE-LINE This section provides a brief description of selected major office projects currently under construction.
N Name Developer /
Investor Submarket Area(m2) Class Completion
1 Studentski Grad Business Center (Green Park) Alfa Tours
Suburban 9,773 B n/a
2 Q Center Build Systems
Bulgaria Suburban 8,700 A n/a
3 Sofia Airport Center Tishman
International Suburban 17,990 A 2013
4 Stella Park AS-
Stroyengineering Suburban 15,730 B 2012
5 Elipse Center Ilpa Developments Suburban 9,100 A 2013
6 Capital Fort Business Complex Fort Noks
Suburban 35,000 A 2013
7 City Tower Icon Broad Center 31,786 A 2013
8 Milenium Centre NIKMI EOOD Broad Center 25,000 A 2013
TOTAL 153,079 Source: Colliers Research
The map below presents the location of each office development, which is described above:
Map of Sofia presenting the location of selected future office developments
Below we have given further details on the office pipe-line of large-scale projects.
Valuation of a Mixed-use Property in Geo Milev Area, Sofia, Bulgaria
B.S.R. Sofia AD Page 33 of 74
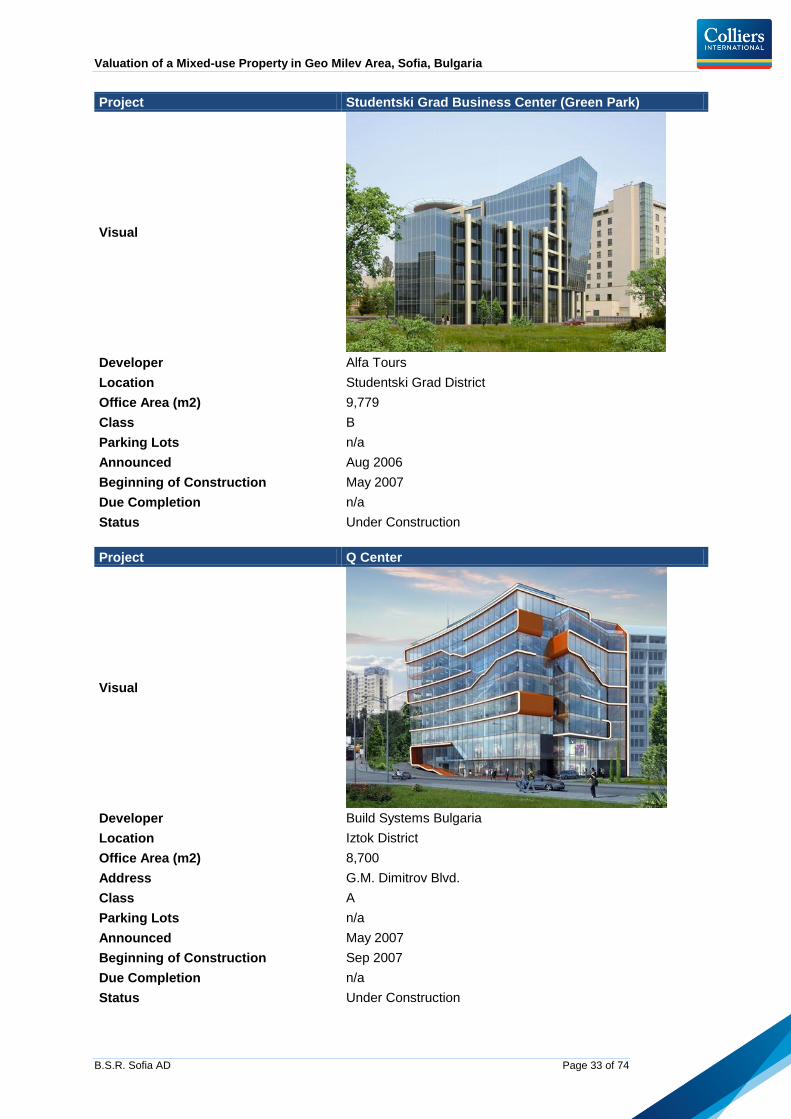
Project Studentski Grad Business Center (Green Park)
Visual
Developer Alfa Tours
Location Studentski Grad District
Office Area (m2) 9,779
Class B
Parking Lots n/a
Announced Aug 2006
Beginning of Construction May 2007
Due Completion n/a
Status Under Construction
Project Q Center
Visual
Developer Build Systems Bulgaria
Location Iztok District
Office Area (m2) 8,700
Address G.M. Dimitrov Blvd.
Class A
Parking Lots n/a
Announced May 2007
Beginning of Construction Sep 2007
Due Completion n/a
Status Under Construction

Valuation of a Mixed-use Property in Geo Milev Area, Sofia, Bulgaria
B.S.R. Sofia AD Page 34 of 74
Project Sofia Airport Center
Visual
Developer Tishman International
Location Sofia Airport
Address Christopher Columbus Blvd
Land Plot Size (m2) 124,835
Total Built-up Area (m2) 165,000
Office Area (m2) 17,990
Class A
Parking Lots 499
Announced Nov 2006
Beginning of Construction Jun 2007
Due Completion 2013
Status Under Construction
Project Stella Park
Visual
Developer AS-Stroyengineering
Address Tsarigradsko shose Blvd
Office Area (m2) 15,730
Class A
Parking Lots 71
Announced Jun 2007
Beginning of Construction Oct 2007
Due Completion Dec 2012

Valuation of a Mixed-use Property in Geo Milev Area, Sofia, Bulgaria
B.S.R. Sofia AD Page 35 of 74
Status Under Construction
Project Elipse Centre
Visual
Developer Ilpa Developments
Location Mladost, 7-mi km
Address Tsarigradsko Shouse Blvd.
Land Plot Size (m2) 3,660
Total Built-up Area (m2) 18,764
Office Area (m2) 9,100
Class A
Parking Lots 165
Announced Jun 2007
Beginning of Construction Aug 2008
Due Completion Officially announced 2013
Status Currently on hold
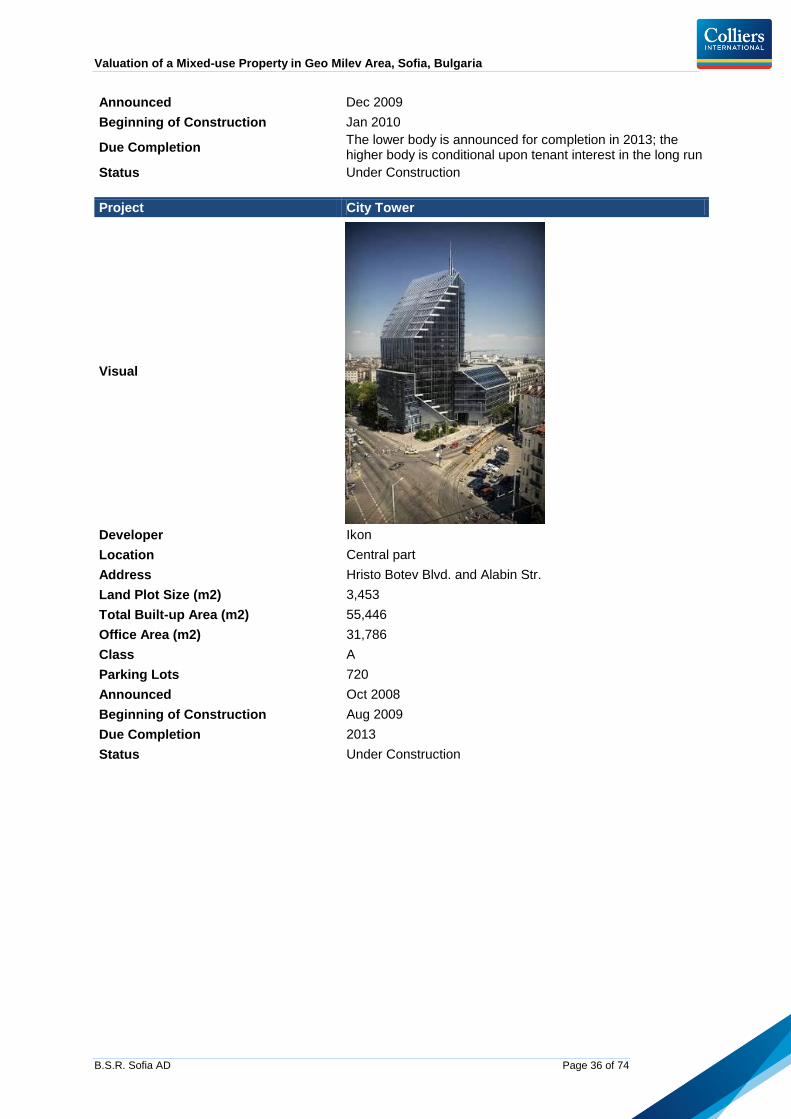
Project Capital Fort Business Complex
Visual
Developer Fort Noks
Location 7th Kilometar
Address Tsarigradsko Shousse Blvd.
Land Plot Size (m2) 17,707
Total Built-up Area (m2) 80,088
Office Area (m2) 42,300
Class A
Parking Lots 720
Valuation of a Mixed-use Property in Geo Milev Area, Sofia, Bulgaria
B.S.R. Sofia AD Page 36 of 74
Announced Dec 2009
Beginning of Construction Jan 2010
Due Completion The lower body is announced for completion in 2013; the higher body is conditional upon tenant interest in the long run
Status Under Construction
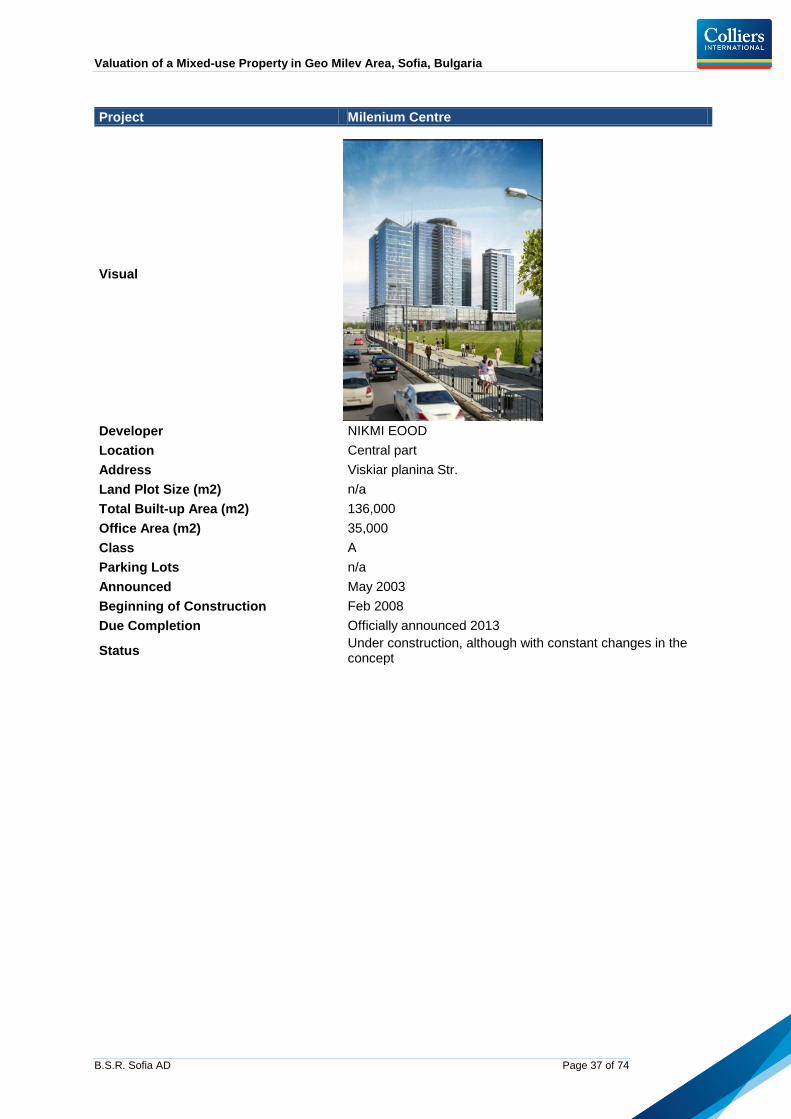
Project City Tower
Visual
Developer Ikon
Location Central part
Address Hristo Botev Blvd. and Alabin Str.
Land Plot Size (m2) 3,453
Total Built-up Area (m2) 55,446
Office Area (m2) 31,786
Class A
Parking Lots 720
Announced Oct 2008
Beginning of Construction Aug 2009
Due Completion 2013
Status Under Construction
Valuation of a Mixed-use Property in Geo Milev Area, Sofia, Bulgaria
B.S.R. Sofia AD Page 37 of 74
Project Milenium Centre
Visual
Developer NIKMI EOOD
Location Central part
Address Viskiar planina Str.
Land Plot Size (m2) n/a
Total Built-up Area (m2) 136,000
Office Area (m2) 35,000
Class A
Parking Lots n/a
Announced May 2003
Beginning of Construction Feb 2008
Due Completion Officially announced 2013
Status Under construction, although with constant changes in the concept

Valuation of a Mixed-use Property in Geo Milev Area, Sofia, Bulgaria
B.S.R. Sofia AD Page 38 of 74
SOFIA RESIDENTIAL MARKET COMMENTARY The following section presents an overview of the residential property market in Sofia. Further in the section we have focused explicitly on Geo Milev residential area, where the subject property is located.
GENERAL REMARKS HISTORIC TRENDS The central part of the city and the oldest housing estates of Sofia were built-up mainly with massive brick blocks of houses with beautiful facades in the typical socialist style and traditions and the majority of them have already become monuments of culture. The housing estates, which were developed later on in time – in the 1970s, were built-up predominantly with panel and monolithic concrete structure blocks. One of the characteristic features of the zones developed by the end of the 1980s is the vast inter-block areas with gardens and parks. A new stage in the construction development of the capital started in the beginning of the 1990s – the so-called “new development”. Due to the fact that in the first years of the period there were no clearly established construction regulations, some parts of the city were over-built with blocks of questionable quality. RECENT DEVELOPMENT The period 2000 – 2008 was marked by an unprecedented market activity in the residential property market in Sofia. Development surged triggered by overall economic upturn, increasing purchasing power and availability of financing. Generally, the first years of the period were defined by development in middle and middle-up residential areas situated mostly along or in proximity to the southern arc of the ring road and near Vitosha Mountain. The continuous positive economic growth triggered demand in the lower market segment as well, which lead to subsequent increase in construction in the rest of the capital. 2008 marked the ending of the vigorous and rather hectic growth of the residential property market and the beginning of a period with a somewhat different pace of development. The financial distress evident on an international level begun to influence the property market in Bulgaria and the development of some projects was put on hold due to lack of financing. Demand also diminished predominantly on account of the unfavorable terms on mortgage lending. Throughout 2009 and 2010, the changing market conditions triggered substantial price decrease and the introduction of diverse payment schemes aiming to facilitated transactions in view of the shrinking demand. 2011, on the other hand, saw stabilization of prices and positive signals from buyers, however, mostly in the middle and middle-up market segments, as well as purchases not dependent on bank financing. At the same time multiple low-quality constructions and stand-alone buildings remain vacant, which puts downward pressure on asking prices. This trend has throughput the first half of 2012. CHOICE OF LOCATION The location of new developments was determined by several main criteria:
Land availability Proximity to public and social infrastructure Proximity to green areas (Vitosha Mountain and/or larger parks) Proximity to diverse amenities Increasing demand based on exogenous factors (e.g. new office developments)
As a general trend, during the last decade the residential market in Sofia went through a transition from supply-dominated to demand-dominated market. This, along with the drastic change in the macroeconomic conditions in Bulgaria and globally, is expected to drive a much more healthy development of the market with only quality projects of reputable developers being constructed and marketed as opposed to the chaotic boom leading the growth of the market until 2007.
Valuation of a Mixed-use Property in Geo Milev Area, Sofia, Bulgaria
B.S.R. Sofia AD Page 39 of 74
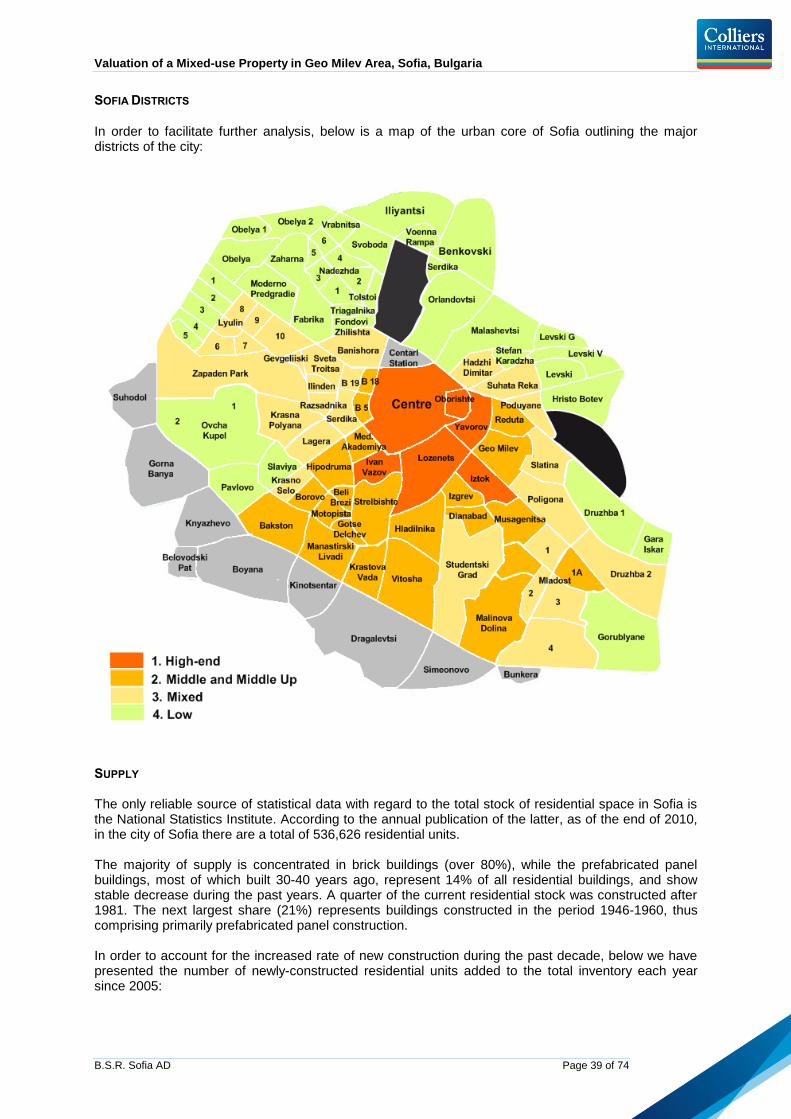
SOFIA DISTRICTS
In order to facilitate further analysis, below is a map of the urban core of Sofia outlining the major districts of the city:
SUPPLY The only reliable source of statistical data with regard to the total stock of residential space in Sofia is the National Statistics Institute. According to the annual publication of the latter, as of the end of 2010, in the city of Sofia there are a total of 536,626 residential units. The majority of supply is concentrated in brick buildings (over 80%), while the prefabricated panel buildings, most of which built 30-40 years ago, represent 14% of all residential buildings, and show stable decrease during the past years. A quarter of the current residential stock was constructed after 1981. The next largest share (21%) represents buildings constructed in the period 1946-1960, thus comprising primarily prefabricated panel construction. In order to account for the increased rate of new construction during the past decade, below we have presented the number of newly-constructed residential units added to the total inventory each year since 2005:
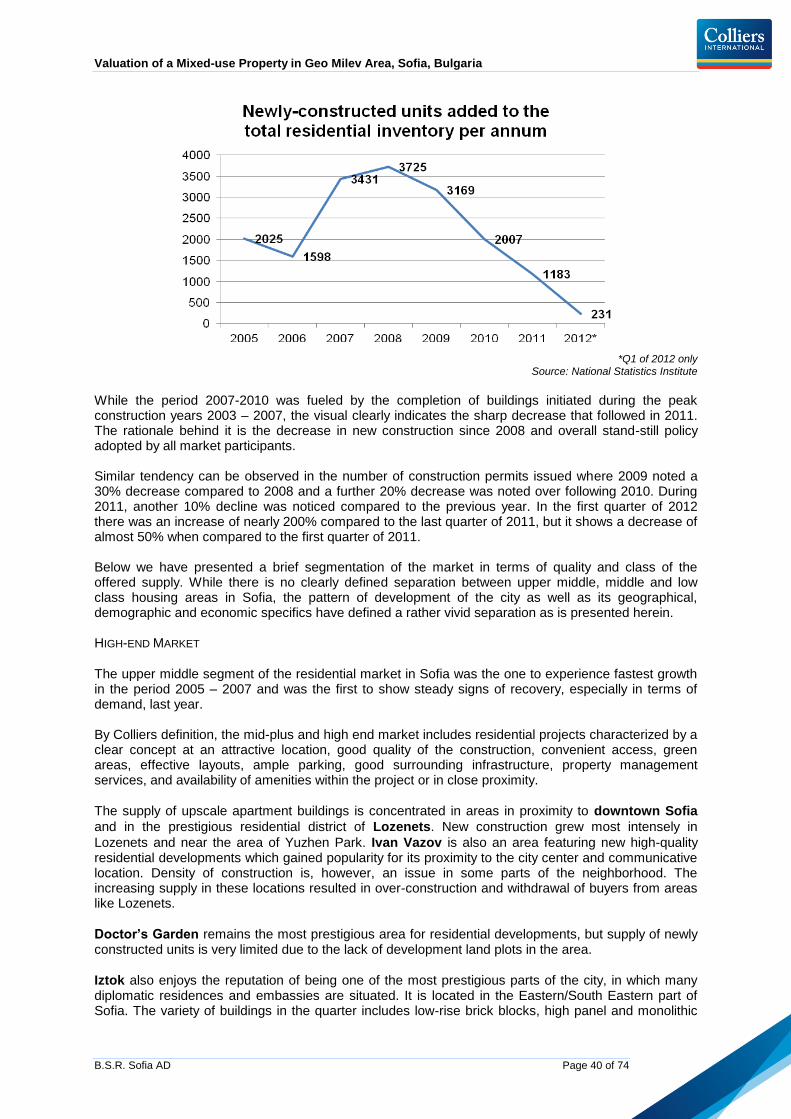
Valuation of a Mixed-use Property in Geo Milev Area, Sofia, Bulgaria
B.S.R. Sofia AD Page 40 of 74
*Q1 of 2012 only
Source: National Statistics Institute
While the period 2007-2010 was fueled by the completion of buildings initiated during the peak construction years 2003 – 2007, the visual clearly indicates the sharp decrease that followed in 2011. The rationale behind it is the decrease in new construction since 2008 and overall stand-still policy adopted by all market participants. Similar tendency can be observed in the number of construction permits issued where 2009 noted a 30% decrease compared to 2008 and a further 20% decrease was noted over following 2010. During 2011, another 10% decline was noticed compared to the previous year. In the first quarter of 2012 there was an increase of nearly 200% compared to the last quarter of 2011, but it shows a decrease of almost 50% when compared to the first quarter of 2011. Below we have presented a brief segmentation of the market in terms of quality and class of the offered supply. While there is no clearly defined separation between upper middle, middle and low class housing areas in Sofia, the pattern of development of the city as well as its geographical, demographic and economic specifics have defined a rather vivid separation as is presented herein. HIGH-END MARKET
The upper middle segment of the residential market in Sofia was the one to experience fastest growth in the period 2005 – 2007 and was the first to show steady signs of recovery, especially in terms of demand, last year. By Colliers definition, the mid-plus and high end market includes residential projects characterized by a clear concept at an attractive location, good quality of the construction, convenient access, green areas, effective layouts, ample parking, good surrounding infrastructure, property management services, and availability of amenities within the project or in close proximity.
The supply of upscale apartment buildings is concentrated in areas in proximity to downtown Sofia
and in the prestigious residential district of Lozenets. New construction grew most intensely in
Lozenets and near the area of Yuzhen Park. Ivan Vazov is also an area featuring new high-quality residential developments which gained popularity for its proximity to the city center and communicative location. Density of construction is, however, an issue in some parts of the neighborhood. The increasing supply in these locations resulted in over-construction and withdrawal of buyers from areas like Lozenets.
Doctor’s Garden remains the most prestigious area for residential developments, but supply of newly constructed units is very limited due to the lack of development land plots in the area.
Iztok also enjoys the reputation of being one of the most prestigious parts of the city, in which many diplomatic residences and embassies are situated. It is located in the Eastern/South Eastern part of Sofia. The variety of buildings in the quarter includes low-rise brick blocks, high panel and monolithic
Valuation of a Mixed-use Property in Geo Milev Area, Sofia, Bulgaria
B.S.R. Sofia AD Page 41 of 74
concrete structure buildings, as well as one-family houses. There are a lot of lawns and vast inter block areas among the buildings. Most of the residences are in good condition, especially given the fact that they are in buildings which were constructed before the 1980s. New brick blocks with modern architecture have been built in recent years. MIDDLE AND MIDDLE-UP CLASS
Typical middle class neighborhoods are characterized by relative proximity to Sofia downtown, good accessibility by car and by public transportation, as well as good social infrastructure in terms of schools, kindergartens, health care facilities and green areas. Among these worth noting are Meditsinska Akademia, Izgrev, Geo Milev, in the broad centre of Sofia; Dianabad, Musagenitsa, Darvenitsa, in the Eastern areas; and Hipodruma, Borovo, Motopista, Bukston, Beli Brezi and Gotse Deltchev in the Southern areas. Besides, much of the new supply of quality residential apartment buildings is concentrated in the southern areas of Sofia: Manastirski Livadi, Krastova Vada, Hladilnika, Strelbishte, Reduta as opposed to previous years when much of the new supply was developed in the city central area. It should be noted that areas such as Manastirski Livadi and Krastova Vada started developing as middle plus residential locations. However, due to intense density of construction and lack of adequate infrastructure they are considered rather as middle class districts. As a result only certain areas within these neighborhoods can be considered as middle-up residential areas. MIXED Many of the residential districts in Sofia offer a mix of low-end panel blocks and quality middle class new construction. Due to diverse factors some of these attracted substantial attention in the past years and are becoming increasingly popular among middle class buyers. In the present analysis we would like to put forward two examples. The first one is that of the cluster bordering Sofia downtown to the west. The latter comprises the neighborhoods of Zona B19, Serdika, Lagera, Krasna Polyana, Razsadnika, Ilinden, Gevgeliyski, Zapaden Park, Sveta Troitsa, and Lagera and Slavia further to the south-west. These areas a continently situated in the broad centre of the capital and offer easy connections with the downtown areas. Besides, with the construction of the underground public transportation network, their accessibility and attractiveness increased substantially. Another example is the neighborhood Mladost in the south-eastern suburbs of Sofia. It is one of the most modern and fast developing quarters of Sofia and ranks second in the list of most populated residential areas with more than 100,000 inhabitants. It was constructed on a total area of 1,678 hectars, which represents 10% of the territory of Sofia. Mladost is divided into 5 districts: 1, 1A, 2, 3 and 4. Mladost is one of the “younger” quarters of the capital and that is the reason why the majority of the buildings in the complex are panel blocks. The massive brick blocks are not numerous and are located mainly in Mladost 1. The construction of the first blocks in the complex started in the 1960s. The quarter has started changing its appearance in the last several years and this process was facilitated by the opening of Business Park Sofia in Mladost 4. On account of the increasing demand and ready availability of land suitable for development, Mladost is one of the areas to experience the highest rate of new construction in the capital. LOW CLASS Most of the districts on the fringe of the urban area of Sofia are considered low class. This is particularly true for northern parts beginning from Druzhba 1 towards Levski, Malashevtsi, Orlandovtsi, Svoboda, Iliyantsi, Nadezhda, Obelya, Lyulin and Ovcha Kupel. Most of these districts border or are part of former industrial hubs and the housing available there is in rather poor condition.
Valuation of a Mixed-use Property in Geo Milev Area, Sofia, Bulgaria
B.S.R. Sofia AD Page 42 of 74
Also, their development was mostly influenced by the necessity of housing for the working force moving to the capital in the 1970s and 1980s. Thus, the residential stock comprises mostly panel blocks. Areas, such as Ovcha Kupel and Nadezhda, are expected to develop further on account of the planned metro diameters and potential move into the segment of mixed-class residential areas in the capital.
DEMAND After years of a supply dominated market, toward the end of 2005 the Sofia market became primarily demand dominated. The stable increase in demand for the period 2005 – 2007 was mainly on account of the improved economic conditions and purchasing power and increased mortgage availability, and to a lesser extent the psychological effect of Bulgaria’s EU accession and the associated expectation of rising prices of real estate. In 2008, however, the increasing uncertainty on international financial markets became evident at the residential market in Sofia. Combined with tightened and more costly financing opportunities this had a somewhat sobering effect on the market. After a difficult 2009, 2010 saw an increase in the dynamics at the residential property market especially in the upper middle segment. 2011 and 2012 confirmed this trend and demand for middle and middle-up units grew stronger. At the same time the middle to low share of the market remains depressed on account of the limited incomes of the buyers target group and the tight financing conditions. The trend toward more diligent buyers has been strengthened recently. The demand is focused on reliable developers with good reputation and solid projects. Buyers are now more inclined to buy fully completed units thus mitigating a perceived risk. Developers have become more flexible with payment terms while banks are more restrictive in their mortgage lending policies. Demand for residential real estate is growing in maturity with increasing segmentation of the market. Buyers of mid-plus and high-end properties have high expectations and requirements and prefer new projects offering attractive standard of living. In the middle segment location and price per square meter remain the leading factors influencing demand. What is more, as most of the residential properties are bought for personal usage, only few units are currently resold. The institutional buyer has all but disappeared from the market, though sporadic bulk buying is observed.
The key driver to buy a new home is the need for more space or the growth of the family members. With the positive signs for improvement of the Bulgarian economy, demand of mid-plus and high-end residential real estate is likely to grow. The diminishing supply on one hand, and the increasing absorption on the other, will gradually bring the market to supply shortage. This should create attractive opportunities for future developers.
APARTMENT UNITS SALES PRICES
HISTORIC TRENDS The development in sales prices is a good reflection of the market dynamics. The residential market in the period 2000-2003 was marked by a moderate upward price trend. In 2004 the price increase was more than 30% and in 2005 and 2006 the increase was approximately 20%. In 2007 prices in Sofia grew 35% on average. 2002 and 2003 saw a significant increase in sales prices and rental levels of residential properties. In 2004, prices increased more than 30%, and in 2005 they increased approximately 20%, whereupon the increase was more substantial in the first half of the year. In 2006 and 2007 the overall upward trend continued, and average sales prices went up by 15% and 35% respectively.
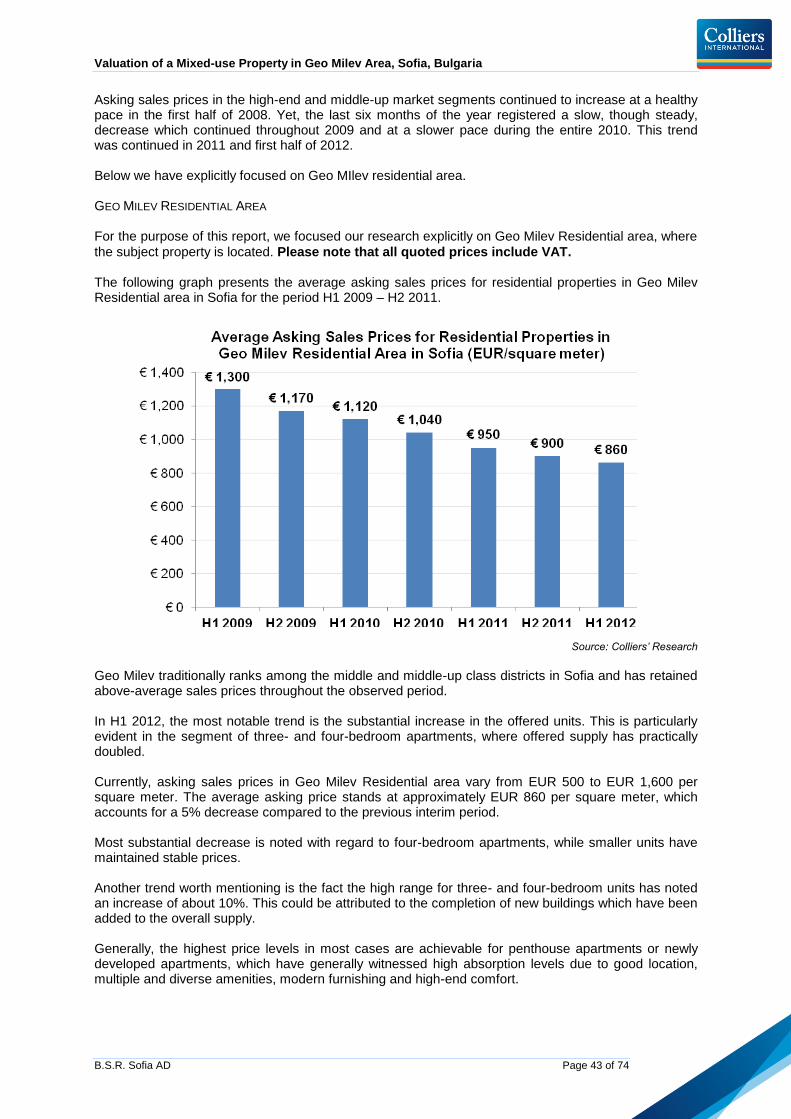
Valuation of a Mixed-use Property in Geo Milev Area, Sofia, Bulgaria
B.S.R. Sofia AD Page 43 of 74
Asking sales prices in the high-end and middle-up market segments continued to increase at a healthy pace in the first half of 2008. Yet, the last six months of the year registered a slow, though steady, decrease which continued throughout 2009 and at a slower pace during the entire 2010. This trend was continued in 2011 and first half of 2012. Below we have explicitly focused on Geo MIlev residential area. GEO MILEV RESIDENTIAL AREA For the purpose of this report, we focused our research explicitly on Geo Milev Residential area, where
the subject property is located. Please note that all quoted prices include VAT. The following graph presents the average asking sales prices for residential properties in Geo Milev Residential area in Sofia for the period H1 2009 – H2 2011.
Source: Colliers’ Research
Geo Milev traditionally ranks among the middle and middle-up class districts in Sofia and has retained above-average sales prices throughout the observed period. In H1 2012, the most notable trend is the substantial increase in the offered units. This is particularly evident in the segment of three- and four-bedroom apartments, where offered supply has practically doubled. Currently, asking sales prices in Geo Milev Residential area vary from EUR 500 to EUR 1,600 per square meter. The average asking price stands at approximately EUR 860 per square meter, which accounts for a 5% decrease compared to the previous interim period. Most substantial decrease is noted with regard to four-bedroom apartments, while smaller units have maintained stable prices. Another trend worth mentioning is the fact the high range for three- and four-bedroom units has noted an increase of about 10%. This could be attributed to the completion of new buildings which have been added to the overall supply. Generally, the highest price levels in most cases are achievable for penthouse apartments or newly developed apartments, which have generally witnessed high absorption levels due to good location, multiple and diverse amenities, modern furnishing and high-end comfort.
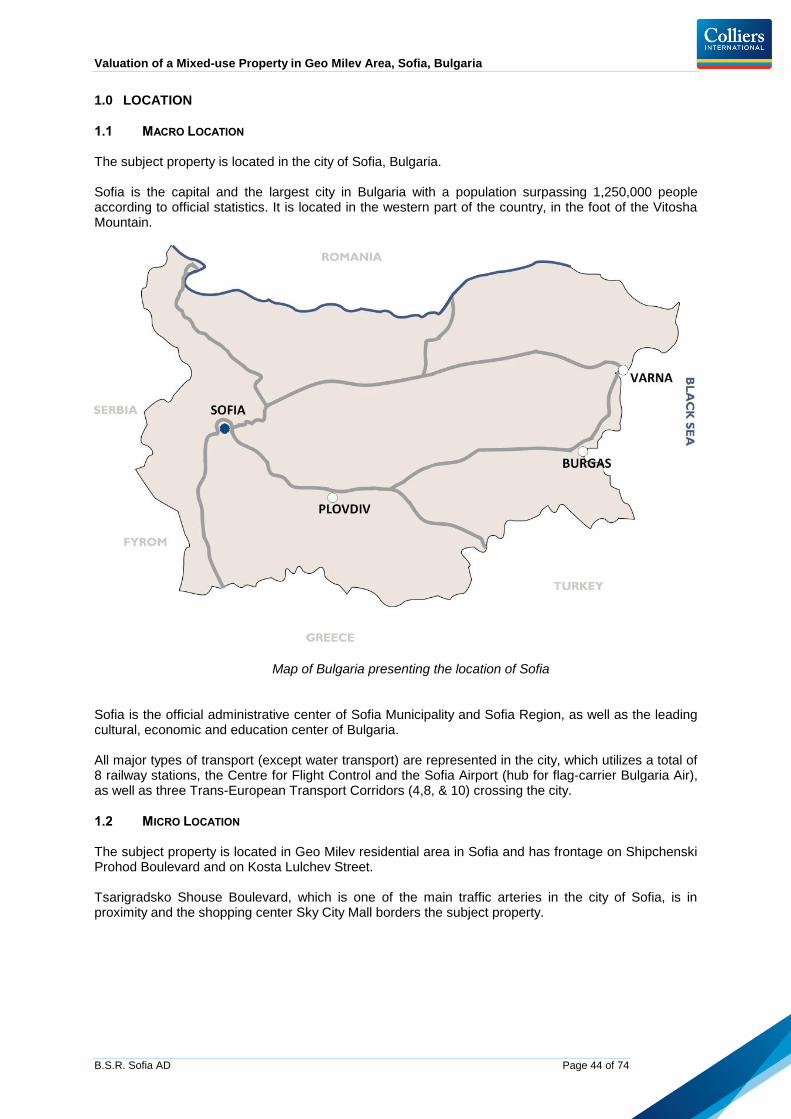
Valuation of a Mixed-use Property in Geo Milev Area, Sofia, Bulgaria
B.S.R. Sofia AD Page 44 of 74
1.0 LOCATION
1.1 MACRO LOCATION The subject property is located in the city of Sofia, Bulgaria.
Sofia is the capital and the largest city in Bulgaria with a population surpassing 1,250,000 people according to official statistics. It is located in the western part of the country, in the foot of the Vitosha Mountain.
Map of Bulgaria presenting the location of Sofia
Sofia is the official administrative center of Sofia Municipality and Sofia Region, as well as the leading cultural, economic and education center of Bulgaria. All major types of transport (except water transport) are represented in the city, which utilizes a total of 8 railway stations, the Centre for Flight Control and the Sofia Airport (hub for flag-carrier Bulgaria Air), as well as three Trans-European Transport Corridors (4,8, & 10) crossing the city.
1.2 MICRO LOCATION The subject property is located in Geo Milev residential area in Sofia and has frontage on Shipchenski Prohod Boulevard and on Kosta Lulchev Street. Tsarigradsko Shouse Boulevard, which is one of the main traffic arteries in the city of Sofia, is in proximity and the shopping center Sky City Mall borders the subject property.
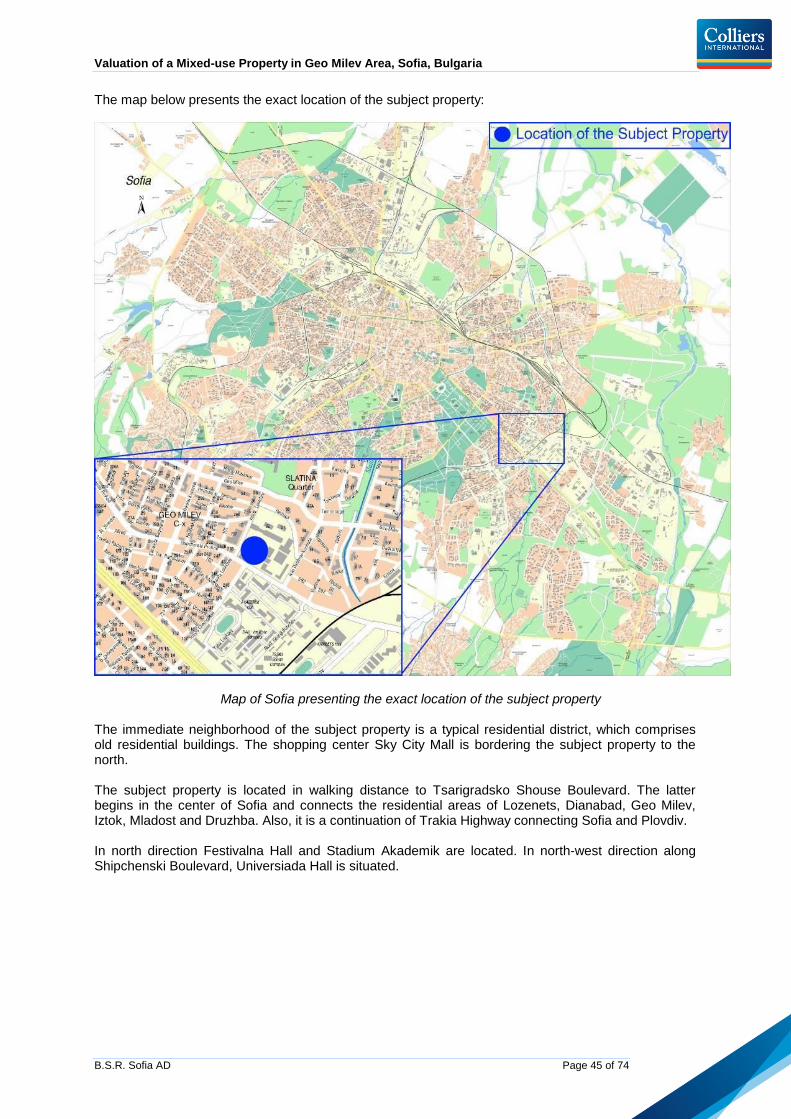
Valuation of a Mixed-use Property in Geo Milev Area, Sofia, Bulgaria
B.S.R. Sofia AD Page 45 of 74
The map below presents the exact location of the subject property:
Map of Sofia presenting the exact location of the subject property The immediate neighborhood of the subject property is a typical residential district, which comprises old residential buildings. The shopping center Sky City Mall is bordering the subject property to the north. The subject property is located in walking distance to Tsarigradsko Shouse Boulevard. The latter begins in the center of Sofia and connects the residential areas of Lozenets, Dianabad, Geo Milev, Iztok, Mladost and Druzhba. Also, it is a continuation of Trakia Highway connecting Sofia and Plovdiv. In north direction Festivalna Hall and Stadium Akademik are located. In north-west direction along Shipchenski Boulevard, Universiada Hall is situated.

Valuation of a Mixed-use Property in Geo Milev Area, Sofia, Bulgaria
B.S.R. Sofia AD Page 46 of 74
The map below presents the area of the property in detail.
Map of the area of the subject property Accessibility by Car The property has excellent accessibility by car because of its frontage on Shipchenski Prohod Boulevard and Kosta Lulchev Street, as well as because of its proximity to Tsarigradsko Shouse Boulevard, which provides access to all parts of the city. Accessibility by Public Transportation
The access to the property by public transportation is very good. Tram line № 20 has stop on Shipchenski Prohod Boulevard in front of the property. Buss lines №1, 3, 5, 6, 11 and 75 have stops in a very close walking distance on Ivan Dimitrov-Kuklata Street. Four private shuttles pass along Shipchenski Prohod Boulevard – № 2, 12, 19 and 21.

Valuation of a Mixed-use Property in Geo Milev Area, Sofia, Bulgaria
B.S.R. Sofia AD Page 47 of 74
2.0 SUBJECT PROPERTY
TYPE OF PROPERTY Multifunctional Project ADDRESS Geo Milev Residential Area, Sofia, Bulgaria OWNER OF THE PROPERTY B.S.R. Sofia AD ZONING Residential and Commercial Construction TBA PHASE 1 37,825 square meters
CONTIGUOUS LAND 4,500 square meters TBA PHASE 2 21,375 square meters
CONTIGUOUS LAND 4,350 square meters TBA PHASE 3 128,000 square meters
CONTIGUOUS LAND 22,365 square meters (there are still existing old administrative buildings generating rental income; the buildings will be demolished for the construction of Phase 3 in 2013)
CURRENT STATUS Usage Permit issued for Phase 1
View of the first building of Phase 1
PHOTOGRAPHS
Photographs of the subject property and its immediate surroundings are presented in Appendix I to this report.

Valuation of a Mixed-use Property in Geo Milev Area, Sofia, Bulgaria
B.S.R. Sofia AD Page 48 of 74
3.0 ACCOMMODATION As per the instructions provided by the Assignor, detailed in the Valuation Approaches and Methodology Section of the present report and for the purposes of the latter, we divided the entire land property as follows: Property 1: Property Type: office project under construction over land plot with size of 4,500 square meters; Current Stage: issued Usage Permit for Building 1 and for the underground parking of Building 2; hard construction of Building 2 to be initiated; Property 2: Property Type: land plot with total size of 26,715 square meters – comprising land property with the old buildings of the former Elektronika Factory on it (22,365 m2) and the unimproved land contiguous to Phase 2 (4,350 m2). Current Stage: The old commercial buildings on-site are offered for rent; the property has concept design for residential complex development.
4.0 CONDITION We have not undertaken a Building Survey as this was outside the scope of our instructions, but noted
during the course of our inspection that the new building appeared to be in excellent condition. Based on our inspection and the due diligence documents provided to us, we consider the newly completed building to be in a reasonable condition consistent with its age. We do not anticipate any extensive maintenance requirements over and above those stated in the technical due diligence report provided. In our valuation we have allowed for non-recoverable costs relating to the repair and maintenance at the property of 1% of the annual rental revenue.

Valuation of a Mixed-use Property in Geo Milev Area, Sofia, Bulgaria
B.S.R. Sofia AD Page 49 of 74
5.0 LEGAL & PLANNING
5.1 OWNERSHIP
The property is 100% owned by B.S.R. Sofia AD. It is partially owned by a company which is 100% owned by B.S.R. Europe Ltd., and the latter is partially owned by B.S.R. Engineering and Development Ltd. The entire land property has a total area of 31,215 square meters and detailed description of each land plot is provided in the following table. The information is entirely based on the ownership documents by the Assignor.
Location Size Property ID Ownership Document
Hristo
Smirnenski
Area, Slatina
Region,
Sofia
22 365 УПИ II кв. 95в Notary Deed N53, Volume III, Reg.N 4480, File N456,
dated 2008
1 022 УПИ XI кв. 95в Notary Deed N53, Volume III, Reg.N 4480, File N456,
dated 2008
6 290 УПИ XII кв. 95в Notary Deed N53, Volume III, Reg.N 4480, File N456,
dated 2008
1 538 The east real part of the former УПИ XV
кв. 95в
Notary Deed N167, Volume III, Reg.N 5622, File N575, dated 2008
Total 31 215
5.2 SIZE According to the provided ownership documents, the subject land property has a total size of 31,215 square meters. The existing old buildings situated on the large plot (with size of 22,365 square meters) have a total built-up and gross leasable area of approximately 30,000 and 25,000 square meters respectively. The buildings will be demolished in 2013 and on the relevant land a residential complex will be developed.
5.3 LIENS According to the provided information there is an existing mortgage on the property establishing rights for the financing institution UniCredit Bank.
5.4 CURRENT ZONING The subject property is currently zoned for mixed-use construction, allowing for both residential and commercial development. The following zoning parameters are applicable to the subject property:
Density – 60% KINT – 3.5 Green Areas – 40%
Based on these construction parameters, the land property can be improved with up to 110,000 square meters of aboveground built-up area. Minimum green area requirements are estimated at 9,365 square meters.
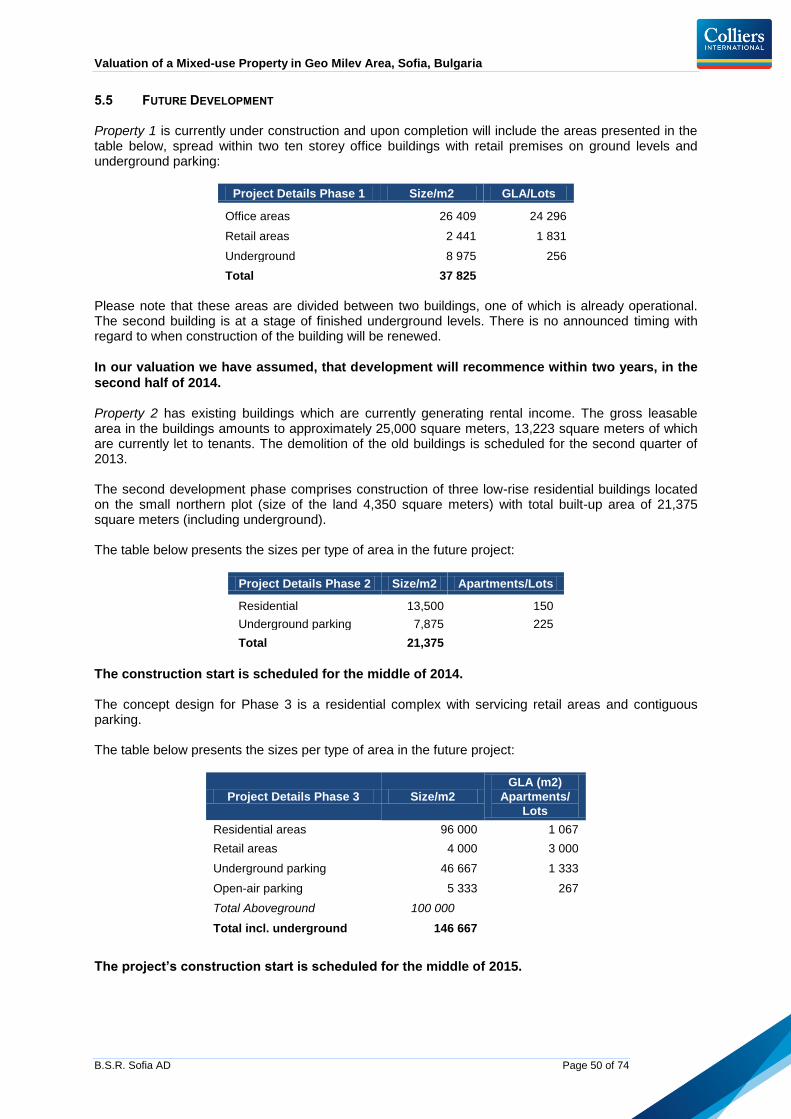
Valuation of a Mixed-use Property in Geo Milev Area, Sofia, Bulgaria
B.S.R. Sofia AD Page 50 of 74
5.5 FUTURE DEVELOPMENT Property 1 is currently under construction and upon completion will include the areas presented in the table below, spread within two ten storey office buildings with retail premises on ground levels and underground parking:
Project Details Phase 1 Size/m2 GLA/Lots
Office areas 26 409 24 296
Retail areas 2 441 1 831
Underground 8 975 256
Total 37 825
Please note that these areas are divided between two buildings, one of which is already operational. The second building is at a stage of finished underground levels. There is no announced timing with regard to when construction of the building will be renewed.
In our valuation we have assumed, that development will recommence within two years, in the
second half of 2014. Property 2 has existing buildings which are currently generating rental income. The gross leasable area in the buildings amounts to approximately 25,000 square meters, 13,223 square meters of which are currently let to tenants. The demolition of the old buildings is scheduled for the second quarter of 2013. The second development phase comprises construction of three low-rise residential buildings located on the small northern plot (size of the land 4,350 square meters) with total built-up area of 21,375 square meters (including underground). The table below presents the sizes per type of area in the future project:
Project Details Phase 2 Size/m2 Apartments/Lots
Residential 13,500 150
Underground parking 7,875 225
Total 21,375
The construction start is scheduled for the middle of 2014. The concept design for Phase 3 is a residential complex with servicing retail areas and contiguous parking. The table below presents the sizes per type of area in the future project:
Project Details Phase 3 Size/m2
GLA (m2)
Apartments/
Lots
Residential areas 96 000 1 067
Retail areas 4 000 3 000
Underground parking 46 667 1 333
Open-air parking 5 333 267
Total Aboveground 100 000
Total incl. underground 146 667
The project’s construction start is scheduled for the middle of 2015.
Valuation of a Mixed-use Property in Geo Milev Area, Sofia, Bulgaria
B.S.R. Sofia AD Page 51 of 74
6.0 TENURE DETAILS
6.1 TENANCIES
We have not been provided with a copy of the leases and we have based the present valuation on a detailed list of the tenants in the old administrative buildings and the newly-completed office properties. OLD ADMINISTRATIVE BUILDINGS As of the time of the present valuation, 13,233 square meters are leased to tenants at an average rent of EUR 3.9 per square per month. Besides, 115 parking lots are subject of lease agreements at an average rent of EUR 27.5 per lot per month. PHASE 1 – BUILDING 1 The newly-completed office building is under active leasing campaign. As of the time of the present valuation, there are two signed lease agreements and one of the tenants has already moved into the building. The latter is renting about 320 square meters for 5 years at a monthly rent of EUR 9.25 in the first year of the lease. The other tenant is renting a total of 1,008 square meters (900 square meters net office space), 6 underground and 17 open-air parking lots. The lease term is 61 months beginning in September 2012 and the average rent for the office space is EUR 7.14 per square meter of total area. The parking lots are rented at EUR 16 per lot per month for the open-air parking lots and at EUR 35 per lot per month for the underground parking.
6.2 NON-RECOVERABLE COSTS
The service charge policy implemented in the leasing of the subject property is open-book. Thus, the owner of the subject property covers the share of the vacant premises in all operating expenses.
As of the time of the present valuation, the operating costs amount to EUR 1 per square meter per month. We have made further assumptions with regard to the rate of these expenses as the building achieves higher occupancy as detailed further below.
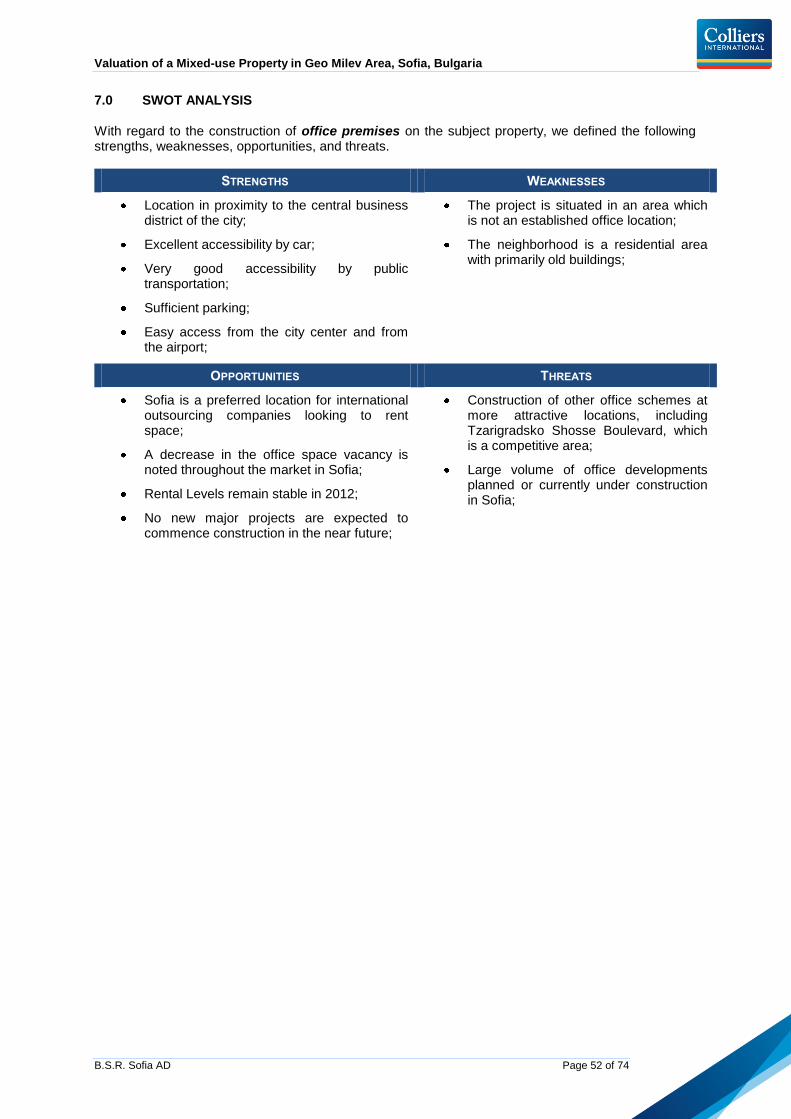
Valuation of a Mixed-use Property in Geo Milev Area, Sofia, Bulgaria
B.S.R. Sofia AD Page 52 of 74
7.0 SWOT ANALYSIS
With regard to the construction of office premises on the subject property, we defined the following strengths, weaknesses, opportunities, and threats.
STRENGTHS WEAKNESSES
Location in proximity to the central business district of the city;
Excellent accessibility by car;
Very good accessibility by public transportation;
Sufficient parking;
Easy access from the city center and from the airport;
The project is situated in an area which is not an established office location;
The neighborhood is a residential area with primarily old buildings;
OPPORTUNITIES THREATS
Sofia is a preferred location for international outsourcing companies looking to rent space;
A decrease in the office space vacancy is noted throughout the market in Sofia;
Rental Levels remain stable in 2012;
No new major projects are expected to commence construction in the near future;
Construction of other office schemes at more attractive locations, including Tzarigradsko Shosse Boulevard, which is a competitive area;
Large volume of office developments planned or currently under construction in Sofia;

Valuation of a Mixed-use Property in Geo Milev Area, Sofia, Bulgaria
B.S.R. Sofia AD Page 53 of 74
With regard to the construction of residential units on the subject property, we defined the following strengths, weaknesses, opportunities, and threats.
STRENGTHS WEAKNESSES
Location in proximity to the city center;
An established residential location;
Excellent accessibility by car;
Very good accessibility by public transportation;
Upon completion the project will offer high-quality residential units;
Sufficient parking;
Part of the project will have frontage on a major boulevard which infers high noise and pollution levels;
Lack of parks and/or green areas in proximity;
The immediate neighborhood comprises old residential buildings, which does not add to the upscale image of the project.
OPPORTUNITIES THREATS
Steady development of the residential property market in Sofia in the last years;
The residential property market in Sofia is expected to be the first one to register growth in demand;
There are no competitive residential projects in proximity;
The property borders Sky City Mall, which ensures most of the basic services and public amenities.
Delay in the economic recovery of Sofia;
Limited income of the population;
A share of the new residential supply is offered at prices lower than current market levels in order to allow developers to cover loan payments;

Valuation of a Mixed-use Property in Geo Milev Area, Sofia, Bulgaria
B.S.R. Sofia AD Page 55 of 74
8.0 VALUATION
8.1 VALUATION APPROACH
In valuing the property owned by BSR Sofia AD we applied the Income Capitalization Approach for
estimating its market value. The Method is presented in detail in the General Information Section. We were instructed to estimate the market value of the properties as follows:
office project under construction situated over a land plot with size of 4,500 square meters; current stage: Completed Building; rough construction of Building two – ground level plate completed;
land property with total size of 26,715 m2, which has a concept design for development of a residential project in two phases.
The final value of property 1 was estimated using the Income Approach only, since construction is in progress. The final value of property 2 was estimated again by applying the Income Approach only, as the old buildings on-site are currently generating rental income.
8.2 FACTORS AFFECTING VALUE
In preparing this valuation we have taken the following factors into account and then applied them according to the specifics of the property. LOCATION The property has good location in Geo Milev District in the city of Sofia, which is a residential quarter, rather than an office location. ACCESSIBILITY We have taken into consideration the accessibility of the property, and more specifically the public infrastructure that provides access to the property. Property 2 has a frontage on Shipchenski Prohod Boulevard, which ensures very good access by car. Property 1 has worse accessibility by car compared to Property 2, as it has frontage on a small asphalt road inside Geo Milev area. FRONTAGE Property 2 has frontage and excellent visibility on Shipchenski Prohod Boulevard. Property 1 has frontage on an asphalt road, but worse access than Property 2. Upon completion the former will be connected with Shipchenski Prohod Boulevard via a new street. AREAS Based on the ownership documents described above, the subject land property has total size of 31,215 square meters. ZONING The land property is zoned for both residential and commercial development based on the applicable construction parameters. EXISTING BUILDINGS ON-SITE Based on the ownership documents described above there are the old existing buildings of the former Elektronika factory on-site. The total built-up area of the buildings is approximately 30,000 square meters.
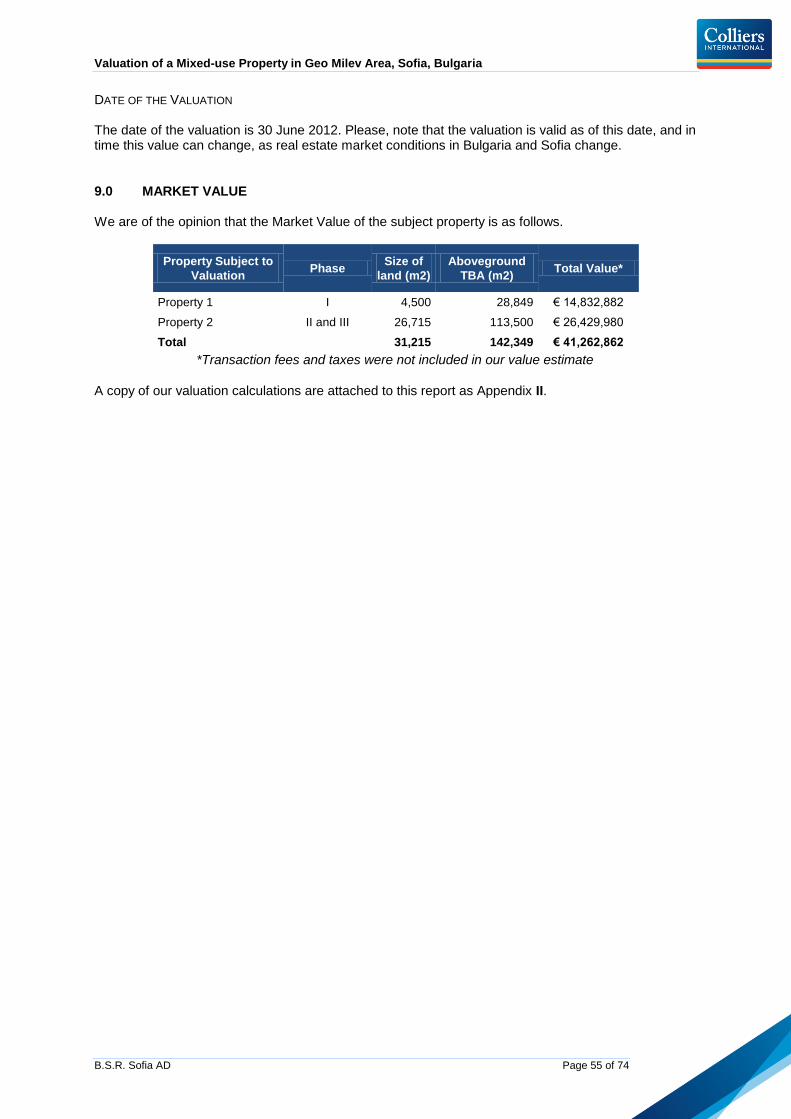
Valuation of a Mixed-use Property in Geo Milev Area, Sofia, Bulgaria
B.S.R. Sofia AD Page 55 of 74
DATE OF THE VALUATION The date of the valuation is 30 June 2012. Please, note that the valuation is valid as of this date, and in time this value can change, as real estate market conditions in Bulgaria and Sofia change.
9.0 MARKET VALUE We are of the opinion that the Market Value of the subject property is as follows.
Property Subject to
Valuation Phase
Size of
land (m2)
Aboveground
TBA (m2) Total Value*
Property 1 I 4,500 28,849 € 14,832,882
Property 2 II and III 26,715 113,500 € 26,429,980
Total
31,215 142,349 € 41,262,862
*Transaction fees and taxes were not included in our value estimate
A copy of our valuation calculations are attached to this report as Appendix II.

Valuation of a Mixed-use Property in Geo Milev Area, Sofia, Bulgaria
B.S.R. Sofia AD Page 56 of 74
APPENDIX I
PHOTOGRAPHS

Valuation of a Mixed-use Property in Geo Milev Area, Sofia, Bulgaria
B.S.R. Sofia AD Page 57 of 74
The section below presents pictures of the status of the subject property and its surroundings as of the last site visit of the property, performed on the 29
th of June 2012:
View of the office space in Building 1 View of the office space in Building 1
View of the underground parking in Building 1 View of the front entrance of Building 1
View of the street towards the office buildings View of the old existing buildings on-site

Valuation of a Mixed-use Property in Geo Milev Area, Sofia, Bulgaria
B.S.R. Sofia AD Page 58 of 74
APPENDIX II
VALUATION
CALCULATIONS

Valuation of a Mixed-use Property in Geo Milev Area, Sofia, Bulgaria
B.S.R. Sofia AD Page 59 of 74
PROPERTY 1 The Value of the property was estimated by the Income Approach (Discounted Cash Flows Method).
Assuming a Discount Rate of 11.28% (with the following structure – Debt 70%, Equity 30%, interest
rate 6%, rate of equity 25%) and a Terminal Capitalization Rate of 7%, we reached the following value of the subject property under the Income Approach:
Market Value EUR 14,832,882* *Transaction fees and taxes were not included in our value estimate
Below we have provided detailed description of the assumptions set out in this report according to the method. VALUATION ASSUMPTIONS
Sizes When defining the size of the office gross leasable area (GLA) we have decreased its TBA with 20% for the common and technical areas and then we have increased the office area size by an add-on factor of 15%. We have estimated that one underground parking space/garage has an average size of 35 square meters, including all access alleys and common areas. The total number of parking spaces (existing and possible for development) is in line with our estimation of the necessary number of parking spaces for the office and retail component. However an additional number of parking lots if needed will be ensured in the future as an open-air parking in proximity to the residential buildings of Phase II. All underground parking spaces are assumed to be offered for rent to the office tenants.
Revenues All office and retail areas, as well as the contiguous underground parking are assumed to be offered for rent. Rental Levels According to the current market trends, we have assumed rental levels as follows:
Office Premises: step rent as follows Year 1 - EUR 7/m2/month Year 2 - EUR 7.5/m2/month Year 3 - EUR 8/m2/month Year 4 onwards – rent indexation
Retail Premises: EUR 9/m2/month Underground Parking: EUR 40/lot/month
Please note that these are net rents, after rent free periods, tenant contribution, and other incentives are accounted for. Occupancy According to the current market trends, we have assumed occupancy levels as follows:
Office Premises Bldg 1: Year 1 – 20%; Year 2 – 55%; Year 3 onwards – 95%; Office Premises Bldg 2: Year 5 – 35%; Year 6 – 75%; Year 7 onwards – 95% Retail Premises: Year 1 – 0%; Year 2 – 45%; Year 3 onwards – 95%; Underground Parking: Year 1 – 10%; Year 2 – 35%; Year 3– 50%; Year 4 – 75%; Year 5
onwards – 100%
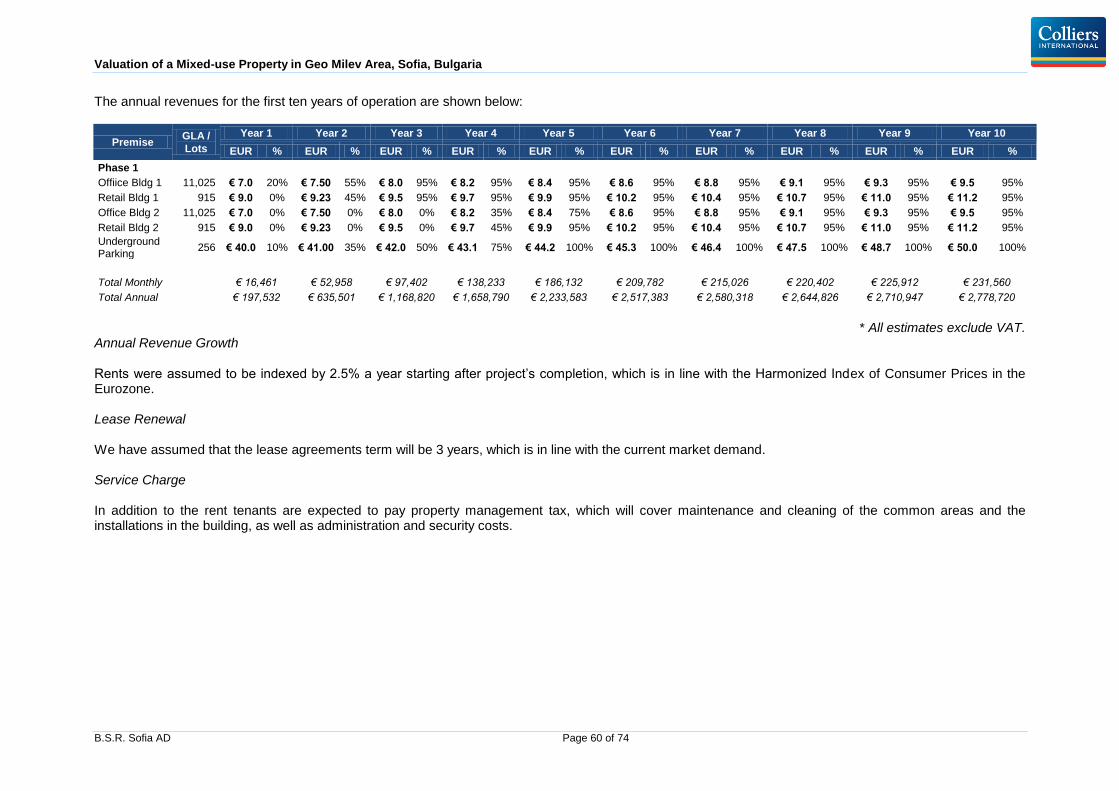
Valuation of a Mixed-use Property in Geo Milev Area, Sofia, Bulgaria
B.S.R. Sofia AD Page 60 of 74
The annual revenues for the first ten years of operation are shown below:
Premise GLA /
Lots
Year 1 Year 2 Year 3 Year 4 Year 5 Year 6 Year 7 Year 8 Year 9 Year 10
EUR % EUR % EUR % EUR % EUR % EUR % EUR % EUR % EUR % EUR %
Phase 1
Offiice Bldg 1 11,025 € 7.0 20% € 7.50 55% € 8.0 95% € 8.2 95% € 8.4 95% € 8.6 95% € 8.8 95% € 9.1 95% € 9.3 95% € 9.5 95%
Retail Bldg 1 915 € 9.0 0% € 9.23 45% € 9.5 95% € 9.7 95% € 9.9 95% € 10.2 95% € 10.4 95% € 10.7 95% € 11.0 95% € 11.2 95%
Office Bldg 2 11,025 € 7.0 0% € 7.50 0% € 8.0 0% € 8.2 35% € 8.4 75% € 8.6 95% € 8.8 95% € 9.1 95% € 9.3 95% € 9.5 95%
Retail Bldg 2 915 € 9.0 0% € 9.23 0% € 9.5 0% € 9.7 45% € 9.9 95% € 10.2 95% € 10.4 95% € 10.7 95% € 11.0 95% € 11.2 95%
Underground Parking
256 € 40.0 10% € 41.00 35% € 42.0 50% € 43.1 75% € 44.2 100% € 45.3 100% € 46.4 100% € 47.5 100% € 48.7 100% € 50.0 100%
Total Monthly
€ 16,461 € 52,958 € 97,402 € 138,233 € 186,132 € 209,782 € 215,026 € 220,402 € 225,912 € 231,560
Total Annual
€ 197,532 € 635,501 € 1,168,820 € 1,658,790 € 2,233,583 € 2,517,383 € 2,580,318 € 2,644,826 € 2,710,947 € 2,778,720
* All estimates exclude VAT.
Annual Revenue Growth Rents were assumed to be indexed by 2.5% a year starting after project’s completion, which is in line with the Harmonized Index of Consumer Prices in the Eurozone. Lease Renewal We have assumed that the lease agreements term will be 3 years, which is in line with the current market demand. Service Charge In addition to the rent tenants are expected to pay property management tax, which will cover maintenance and cleaning of the common areas and the installations in the building, as well as administration and security costs.

Valuation of a Mixed-use Property in Geo Milev Area, Sofia, Bulgaria
B.S.R. Sofia AD Page 61 of 74
Expenses The expenses to be incurred by the project include capital expenditure, as well as soft development costs presented below. Development Expenses The development of the project shall incur the following costs:
Phase/Type of Area Year 1 Year 2 Year 3 Year 4
Share Total Share Total Share Total Share Total
Project Management
€ 30,000
€ 156,003
€ 61,581
€ 0
Marketing 25% € 21,250 25% € 21,250 25% € 21,250 25% € 21,250
Administration and Overhead 25% € 40,500 25% € 40,500 25% € 40,500 25% € 40,500
Legal Fees 25% € 11,250 25% € 11,250 25% € 11,250 25% € 11,250
Consultancy 25% € 11,250 25% € 11,250 25% € 11,250 25% € 11,250
Subtotal
€ 114,250
€ 240,253
€ 145,831
€ 84,250
Contingency
€ 3,428
€ 7,208
€ 4,375
€ 2,528
Total
€ 117,678
€ 247,461
€ 150,206
€ 86,778
*All costs exclude VAT. **The contingency amount shown includes also 5% of all construction costs
The project management in Year 1 has been provided by the Assignor and amounts to EUR 2,500 per month. For the other three years, we have assumed a project management fee at 3% of all construction costs. Marketing expenses were assumed to amount to EUR 85,000 (excl. VAT). This figure was based on current commercial terms of local and international advertising agencies. Marketing expenses will be fees payable for marketing and advertising of the project. Administration and Overhead expenses cover costs for personnel assigned to manage and account for the project during the development period. We have assumed that 3 people would be sufficient for this task, and we have assumed that each of them would be paid an average EUR 1,500 per month, including social security costs. We have also assumed 3% contingency on all capital and development expenditures. Leasing commissions were fixed at 7% of the annual rental revenues and are shown in the cash flow. Capital Expenditure For Building 1, the remaining capital expenditure amounts to EUR 1,940,000. These have been provided by the Assignor and cover 1.7 million euro in tenant contribution plus 240,000 euro in the form of a retention fee for the subcontractor. The fit-out contribution is distributed throughout the three years of active leasing of Building 1 based on the occupancy projections. The construction cost amount for the second office building was estimated to approximately EUR 7,250,000 (excl. VAT). These costs include structural construction, building installations, finishing works, as well as infrastructure and developer’s profit. We have assumed 2% construction cost annual increase. On all costs, we have assumed 3% contingency expenses. In addition to the construction cost, we have assumed a Reserve for Replacement expenditure (shown in the cash flow) amounting to 1% of the annual rental revenues of the project. In order to estimate the WACC amount we assumed that 70% of the project development and all relevant costs will be financed by a bank loan with 6% interest. The rate of equity was assumed at 25%. The interest assumed is in line with the already signed bank agreement for financing.

Valuation of a Mixed-use Property in Geo Milev Area, Sofia, Bulgaria
B.S.R. Sofia AD Page 62 of 74
Operating Expenses The property operates under open-book service charge policy. Thus, each tenant covers their respective share of the property management costs based on the size of the premises they are renting. The owner of the building is assumed to cover the share of the vacant premises. As per the information provided by the Assignor, as of the time of the present valuation, the operating costs of Building 1 amount to EUR 1 per square meter per month. We have assumed that these will grow to EUR 2 per square meter per month as the office buildings reach full occupancy. The service charge deficit, along with all other assumptions, is shown in the cash flow below.
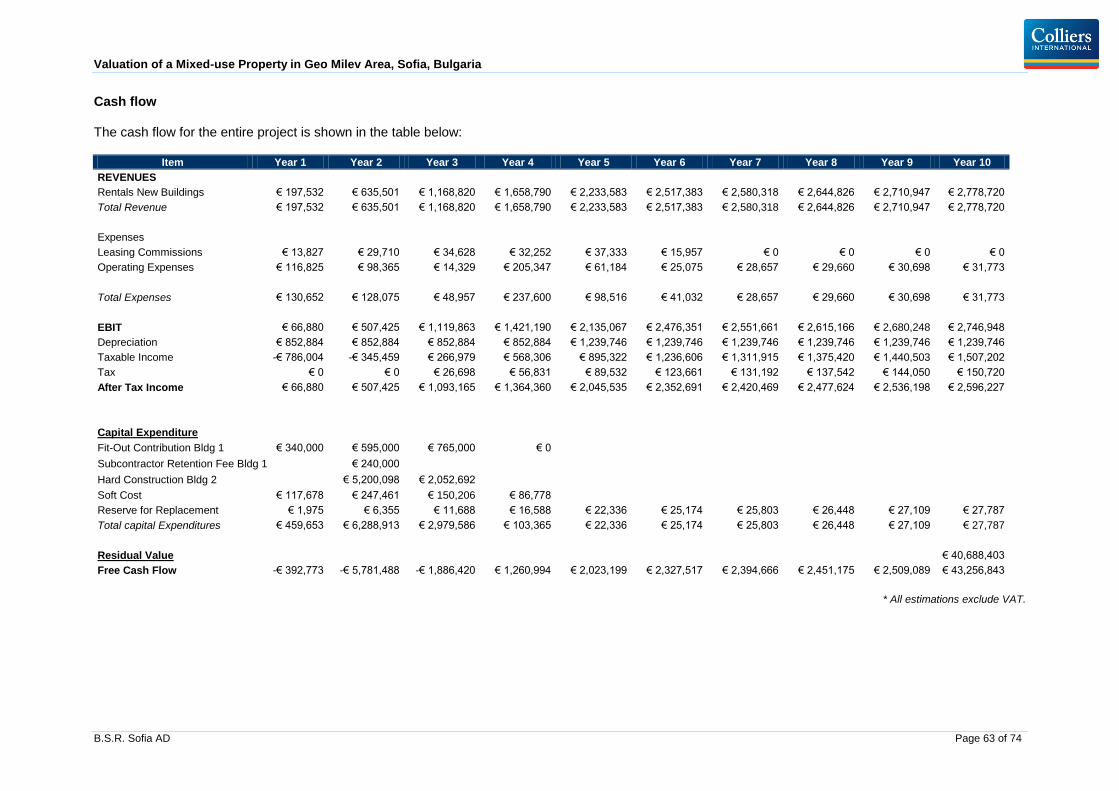
Valuation of a Mixed-use Property in Geo Milev Area, Sofia, Bulgaria
B.S.R. Sofia AD Page 63 of 74
Cash flow The cash flow for the entire project is shown in the table below:
Item Year 1 Year 2 Year 3 Year 4 Year 5 Year 6 Year 7 Year 8 Year 9 Year 10
REVENUES
Rentals New Buildings € 197,532 € 635,501 € 1,168,820 € 1,658,790 € 2,233,583 € 2,517,383 € 2,580,318 € 2,644,826 € 2,710,947 € 2,778,720
Total Revenue € 197,532 € 635,501 € 1,168,820 € 1,658,790 € 2,233,583 € 2,517,383 € 2,580,318 € 2,644,826 € 2,710,947 € 2,778,720
Expenses
Leasing Commissions € 13,827 € 29,710 € 34,628 € 32,252 € 37,333 € 15,957 € 0 € 0 € 0 € 0
Operating Expenses € 116,825 € 98,365 € 14,329 € 205,347 € 61,184 € 25,075 € 28,657 € 29,660 € 30,698 € 31,773
Total Expenses € 130,652 € 128,075 € 48,957 € 237,600 € 98,516 € 41,032 € 28,657 € 29,660 € 30,698 € 31,773
EBIT € 66,880 € 507,425 € 1,119,863 € 1,421,190 € 2,135,067 € 2,476,351 € 2,551,661 € 2,615,166 € 2,680,248 € 2,746,948
Depreciation € 852,884 € 852,884 € 852,884 € 852,884 € 1,239,746 € 1,239,746 € 1,239,746 € 1,239,746 € 1,239,746 € 1,239,746
Taxable Income -€ 786,004 -€ 345,459 € 266,979 € 568,306 € 895,322 € 1,236,606 € 1,311,915 € 1,375,420 € 1,440,503 € 1,507,202
Tax € 0 € 0 € 26,698 € 56,831 € 89,532 € 123,661 € 131,192 € 137,542 € 144,050 € 150,720
After Tax Income € 66,880 € 507,425 € 1,093,165 € 1,364,360 € 2,045,535 € 2,352,691 € 2,420,469 € 2,477,624 € 2,536,198 € 2,596,227
Capital Expenditure
Fit-Out Contribution Bldg 1 € 340,000 € 595,000 € 765,000 € 0
Subcontractor Retention Fee Bldg 1 € 240,000
Hard Construction Bldg 2
€ 5,200,098 € 2,052,692
Soft Cost € 117,678 € 247,461 € 150,206 € 86,778
Reserve for Replacement € 1,975 € 6,355 € 11,688 € 16,588 € 22,336 € 25,174 € 25,803 € 26,448 € 27,109 € 27,787
Total capital Expenditures € 459,653 € 6,288,913 € 2,979,586 € 103,365 € 22,336 € 25,174 € 25,803 € 26,448 € 27,109 € 27,787
Residual Value
€ 40,688,403
Free Cash Flow -€ 392,773 -€ 5,781,488 -€ 1,886,420 € 1,260,994 € 2,023,199 € 2,327,517 € 2,394,666 € 2,451,175 € 2,509,089 € 43,256,843
* All estimations exclude VAT.
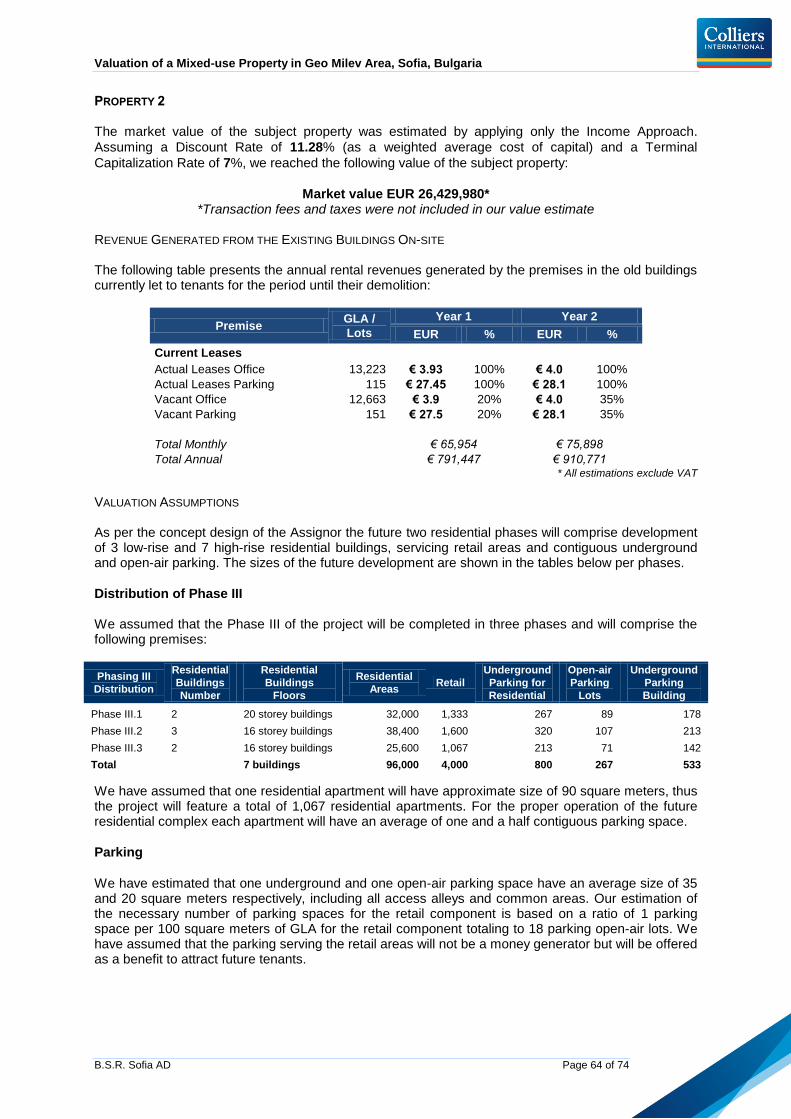
Valuation of a Mixed-use Property in Geo Milev Area, Sofia, Bulgaria
B.S.R. Sofia AD Page 64 of 74
PROPERTY 2 The market value of the subject property was estimated by applying only the Income Approach.
Assuming a Discount Rate of 11.28% (as a weighted average cost of capital) and a Terminal
Capitalization Rate of 7%, we reached the following value of the subject property:
Market value EUR 26,429,980* *Transaction fees and taxes were not included in our value estimate
REVENUE GENERATED FROM THE EXISTING BUILDINGS ON-SITE The following table presents the annual rental revenues generated by the premises in the old buildings currently let to tenants for the period until their demolition:
Premise GLA /
Lots
Year 1 Year 2
EUR % EUR %
Current Leases
Actual Leases Office 13,223 € 3.93 100% € 4.0 100%
Actual Leases Parking 115 € 27.45 100% € 28.1 100%
Vacant Office 12,663 € 3.9 20% € 4.0 35%
Vacant Parking 151 € 27.5 20% € 28.1 35%
Total Monthly
€ 65,954 € 75,898
Total Annual
€ 791,447 € 910,771 * All estimations exclude VAT
VALUATION ASSUMPTIONS As per the concept design of the Assignor the future two residential phases will comprise development of 3 low-rise and 7 high-rise residential buildings, servicing retail areas and contiguous underground and open-air parking. The sizes of the future development are shown in the tables below per phases.
Distribution of Phase III We assumed that the Phase III of the project will be completed in three phases and will comprise the following premises:
Phasing III
Distribution
Residential
Buildings
Number
Residential
Buildings
Floors
Residential
Areas Retail
Underground
Parking for
Residential
Open-air
Parking
Lots
Underground
Parking
Building
Phase III.1 2 20 storey buildings 32,000 1,333 267 89 178
Phase III.2 3 16 storey buildings 38,400 1,600 320 107 213
Phase III.3 2 16 storey buildings 25,600 1,067 213 71 142
Total
7 buildings 96,000 4,000 800 267 533
We have assumed that one residential apartment will have approximate size of 90 square meters, thus the project will feature a total of 1,067 residential apartments. For the proper operation of the future residential complex each apartment will have an average of one and a half contiguous parking space.
Parking
We have estimated that one underground and one open-air parking space have an average size of 35 and 20 square meters respectively, including all access alleys and common areas. Our estimation of the necessary number of parking spaces for the retail component is based on a ratio of 1 parking space per 100 square meters of GLA for the retail component totaling to 18 parking open-air lots. We have assumed that the parking serving the retail areas will not be a money generator but will be offered as a benefit to attract future tenants.
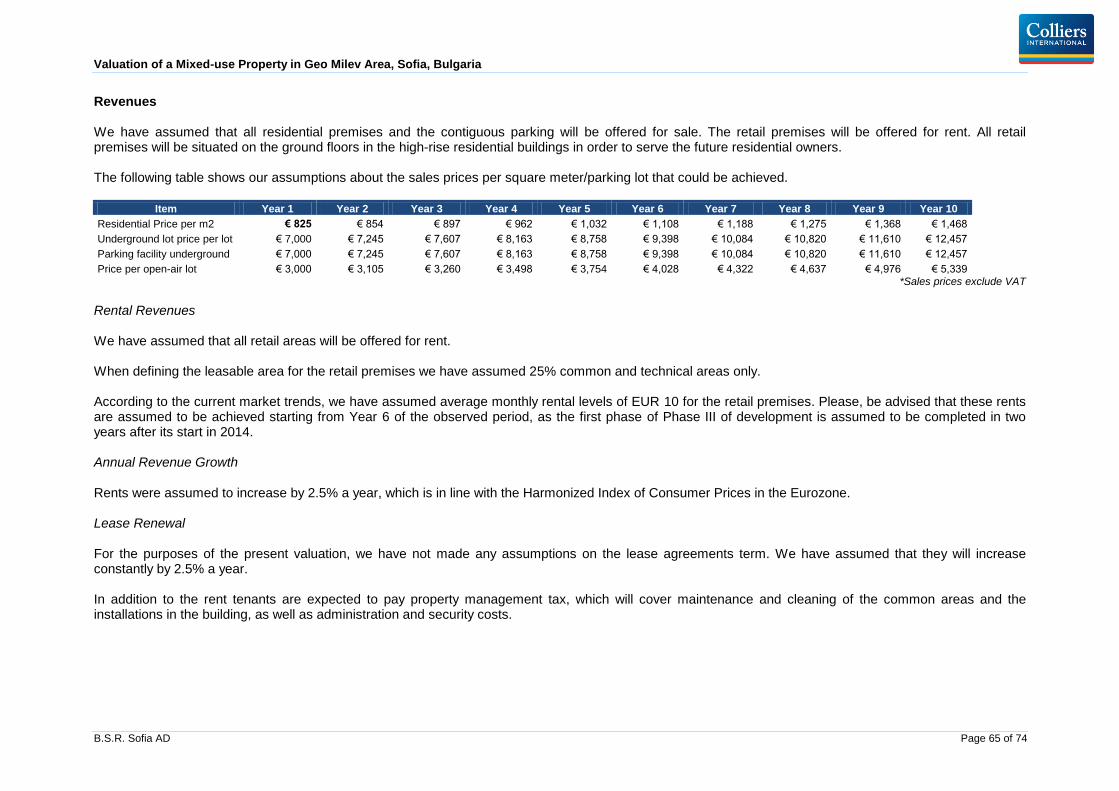
Valuation of a Mixed-use Property in Geo Milev Area, Sofia, Bulgaria
B.S.R. Sofia AD Page 65 of 74
Revenues We have assumed that all residential premises and the contiguous parking will be offered for sale. The retail premises will be offered for rent. All retail premises will be situated on the ground floors in the high-rise residential buildings in order to serve the future residential owners. The following table shows our assumptions about the sales prices per square meter/parking lot that could be achieved.
Item Year 1 Year 2 Year 3 Year 4 Year 5 Year 6 Year 7 Year 8 Year 9 Year 10
Residential Price per m2 € 825 € 854 € 897 € 962 € 1,032 € 1,108 € 1,188 € 1,275 € 1,368 € 1,468
Underground lot price per lot € 7,000 € 7,245 € 7,607 € 8,163 € 8,758 € 9,398 € 10,084 € 10,820 € 11,610 € 12,457
Parking facility underground € 7,000 € 7,245 € 7,607 € 8,163 € 8,758 € 9,398 € 10,084 € 10,820 € 11,610 € 12,457
Price per open-air lot € 3,000 € 3,105 € 3,260 € 3,498 € 3,754 € 4,028 € 4,322 € 4,637 € 4,976 € 5,339 *Sales prices exclude VAT
Rental Revenues We have assumed that all retail areas will be offered for rent. When defining the leasable area for the retail premises we have assumed 25% common and technical areas only. According to the current market trends, we have assumed average monthly rental levels of EUR 10 for the retail premises. Please, be advised that these rents are assumed to be achieved starting from Year 6 of the observed period, as the first phase of Phase III of development is assumed to be completed in two years after its start in 2014. Annual Revenue Growth Rents were assumed to increase by 2.5% a year, which is in line with the Harmonized Index of Consumer Prices in the Eurozone. Lease Renewal For the purposes of the present valuation, we have not made any assumptions on the lease agreements term. We have assumed that they will increase constantly by 2.5% a year. In addition to the rent tenants are expected to pay property management tax, which will cover maintenance and cleaning of the common areas and the installations in the building, as well as administration and security costs.

Valuation of a Mixed-use Property in Geo Milev Area, Sofia, Bulgaria
B.S.R. Sofia AD Page 66 of 74
Expenses The expenses to be incurred by the project include capital expenditure, as well as soft development costs presented below. Development Expenses The development of the project shall incur the following costs:
Phase/Type of Area Year 3 Year 4 Year 5 Year 6 Year 7 Year 8 Year 9 Year 10
Share Total Share Total Share Total Share Total Share Total Share Total Share Total Share Total
Soft Cost Phase II Architecture 100% € 320,625 0% € 0
Project Management 50% € 119,425 50% € 119,425
€ 0 Marketing 15% € 7,500 50% € 25,000 35% € 17,500 Administration and
Overhead 30% € 21,600 40% € 28,800 30% € 21,600 Legal Fees 15% € 3,750 50% € 12,500 35% € 8,750 Consultancy 100% € 25,000 0% € 0 0% € 0 Contingency € 14,937 € 5,572 € 1,436 Subtotal Phase II € 512,837 € 191,296 € 49,286
Soft Cost Phase III
Architecture 33% € 726,000 40% € 880,000 27% € 594,000 0% € 0
Project Management € 116,606 € 470,827 € 428,783 € 425,370 € 272,183 € 36,962 € 0
Marketing 10% € 25,000 15% € 37,500 20% € 50,000 25% € 62,500 25% € 62,500 5% € 12,500 Administration and Overhead 0% € 0 10% € 36,000 20% € 72,000 20% € 72,000 20% € 72,000 20% € 72,000 10% € 36,000
Legal Fees 0% € 0 10% € 10,000 15% € 15,000 20% € 20,000 25% € 25,000 25% € 25,000 5% € 5,000
Consultancy 30% € 30,000 30% € 30,000 30% € 30,000 10% € 10,000 0% € 0 0% € 0 0% € 0
Contingency
€ 26,178
€ 43,555
€ 35,318
€ 17,321
€ 12,950
€ 5,894
€ 1,605
Subtotal Phase III € 898,784 € 1,495,382
€ 1,212,602
€ 594,691
€ 444,633
€ 202,356
€ 55,105
TOTAL
€ 512,837
€ 1,090,080
€ 1,544,667
€ 1,212,602
€ 594,691
€ 444,633
€ 202,356
€ 55,105
*All costs exclude VAT. **The contingency amount shown includes 5% of all construction costs
Based on the specifications of the complex the architecture cost was set at EUR 15 per square meter of the total built-up area. The project management fee amounts to 3% of all construction costs.
Valuation of a Mixed-use Property in Geo Milev Area, Sofia, Bulgaria
B.S.R. Sofia AD Page 67 of 74
Consultancy fees were assumed at a total of EUR 125,000. This figure is based on current commercial terms of institutions providing consulting services. Consultancy fees will be fees payable to advisory firms for providing professional advice in the fields of finance, real estate, etc. Leasing commissions were fixed at 7 of the annual rental revenues and are shown in the cash flow. Sales Commissions were set at 2.5% of the deal value, spread within years, shown in the cash flow below. Legal fees were assumed at EUR 125,000. This figure was based on current commercial terms of institutions providing legal services. Legal fees will be fees payable for preparing lease contracts, as well as contracts with subcontractors for construction, etc. Marketing expenses were assumed to amount to EUR 300,000 (excl. VAT). This figure was based on current commercial terms of local and international advertising agencies. Marketing expenses will be fees payable for marketing and advertising of the project. Administration and Overhead expenses cover costs for personnel assigned to manage and account for the project during the development period. We have assumed that 4 people would be sufficient for this task, and we have assumed that each of them would be paid an average EUR 1,500 per month, including social security costs. We have also assumed 3% contingency on all capital and development expenditures. Capital Expenditure The total rough construction cost amounts to about EUR 66,300,000 (excl. VAT). This cost includes structural construction, building installations, finishing works, as well as infrastructure and landscaping, as well as 3% contingency on all costs. We have assumed 2% construction cost annual increase. In addition to the construction cost, we have assumed a Reserve for Replacement capital expenditure (shown in the cash flow) amounting to 1% of the annual rental revenues of the project. In order to estimate the WACC amount we assumed that 70% of the project development and all relevant costs will be financed by a bank loan with 6% interest. The rate of equity was assumed at 25%. The interest assumed is in line with the already signed bank agreement for financing. Operating Expenses All operating expenses will be covered by the new owners and tenants of each property.

Valuation of a Mixed-use Property in Geo Milev Area, Sofia, Bulgaria
B.S.R. Sofia AD Page 68 of 74
Timing of Construction & Revenues
Phase 2
Type of Areas Area (m2) /
N Garages
Year 3 Year 4 Year 5 Total
Share EUR Share EUR Share EUR EUR
Phase 1 Construction
Underground Parking 3,938 100% € 1,170,593
€ 1,170,593
Residential 6,750 70% € 1,840,657 30% € 804,630
€ 2,645,287
Infrasructure & Landscaping 975
100% € 30,585
€ 30,585
Contingency
3% € 90,337 3% € 25,056
€ 115,394
Total
€ 3,101,587
€ 860,272 € 0 € 0 € 3,961,859
Sales Revenue
Underground Parking 113 0% € 0 40% € 368,949 60% € 593,823 € 962,771
Residential 6,750 0% € 0 40% € 2,597,449 60% € 4,180,595 € 6,778,044
Total
€ 0
€ 2,966,398
€ 4,774,417 € 7,740,815
Phase 2 Construction
Underground Parking 3,938 100% € 1,170,593
€ 1,170,593
Residential 6,750 0% € 0 100% € 2,682,100
€ 2,682,100
Infrasructure & Landscaping 975 0% € 0 100% € 30,585
€ 30,585
Contingency
3% € 35,118 3% € 81,381
€ 116,498
Total
€ 1,205,711
€ 2,794,066 € 0 € 0 € 3,999,777
Sales Revenue
Underground Parking 113
20% € 184,474 80% € 791,764 € 976,238
Residential 6,750
20% € 1,298,725 80% € 5,574,126 € 6,872,851
Total
€ 1,483,199
€ 6,365,890 € 7,849,089

Valuation of a Mixed-use Property in Geo Milev Area, Sofia, Bulgaria
B.S.R. Sofia AD Page 69 of 74
Phase 3
Type of Areas Area (m2) /
N Garages
Year 4 Year 5 Year 6 Year 7 Total
Share EUR Share EUR Share EUR Share EUR EUR
Phase 1 (20 storey buildings) 33% Construction
Underground Parking 9,333 100% € 2,830,234
€ 2,830,234
Parking Bldg / Underground 6,222 50% € 943,411 50% € 962,280
€ 1,905,691
Retail 1,333
100% € 577,283
€ 577,283
Residential 32,000
70% € 9,078,610 30% € 3,968,650
€ 13,047,260
Infrastructure & Landscaping 2,638 0%
100% € 86,107
€ 86,107
Contingency
3% € 113,209 3% € 318,545 3% € 121,643
€ 553,397
Total 48,889
€ 3,886,855
€ 10,936,718 € 0 € 4,176,399 € 0 € 0 € 18,999,973
Sales Revenue
Underground Parking 267
0% € 0 50% € 1,253,042 50% € 1,344,514 € 2,597,556
Parking Bldg / Underground 178
0% € 0 50% € 835,361 50% € 896,343 € 1,731,704
Open-air Parking 89
0% € 0 50% € 179,006 50% € 192,073 € 371,079
Residential 32,000
0% € 0 50% € 17,721,593 50% € 19,015,269 € 36,736,861
Total
€ 0
€ 19,989,002
€ 21,448,199 € 41,437,200
Type of Areas Area (m2) /
N Garages
Year 5 Year 6 Year 7 Year 8 Total
Share EUR Share EUR Share EUR Share EUR EUR
Phase 2 (16 storey buildings) 40% Construction
Underground Parking 11,200 100% € 3,464,207 0% € 0
€ 3,464,207
Parking Bldg / Underground 7,467 50% € 1,154,736 50% € 1,177,830
€ 2,332,566
Retail 1,600
100% € 706,595
€ 706,595
Residential 38,400
50% € 7,937,299 50% € 8,096,045
€ 16,033,345
Infrastructure & Landscaping 3,166
100% € 105,395
€ 105,395
Contingency
3% € 138,568 3% € 294,652 3% € 246,043
€ 679,263
Total 58,667
€ 4,757,510
€ 10,116,376
€ 8,447,484 € 0 € 0 € 23,321,370
Sales Revenue
Underground Parking 320
40% € 1,290,733 60% € 2,077,435 € 3,368,169
Parking Bldg / Underground 213
40% € 860,489 60% € 1,384,957 € 2,245,446
Open-air Parking 107
40% € 184,390 60% € 296,776 € 481,167
Residential 38,400
40% € 18,254,658 60% € 29,380,872 € 47,635,530
Total
€ 0
€ 0
€ 20,590,271
€ 33,140,041 € 53,730,312
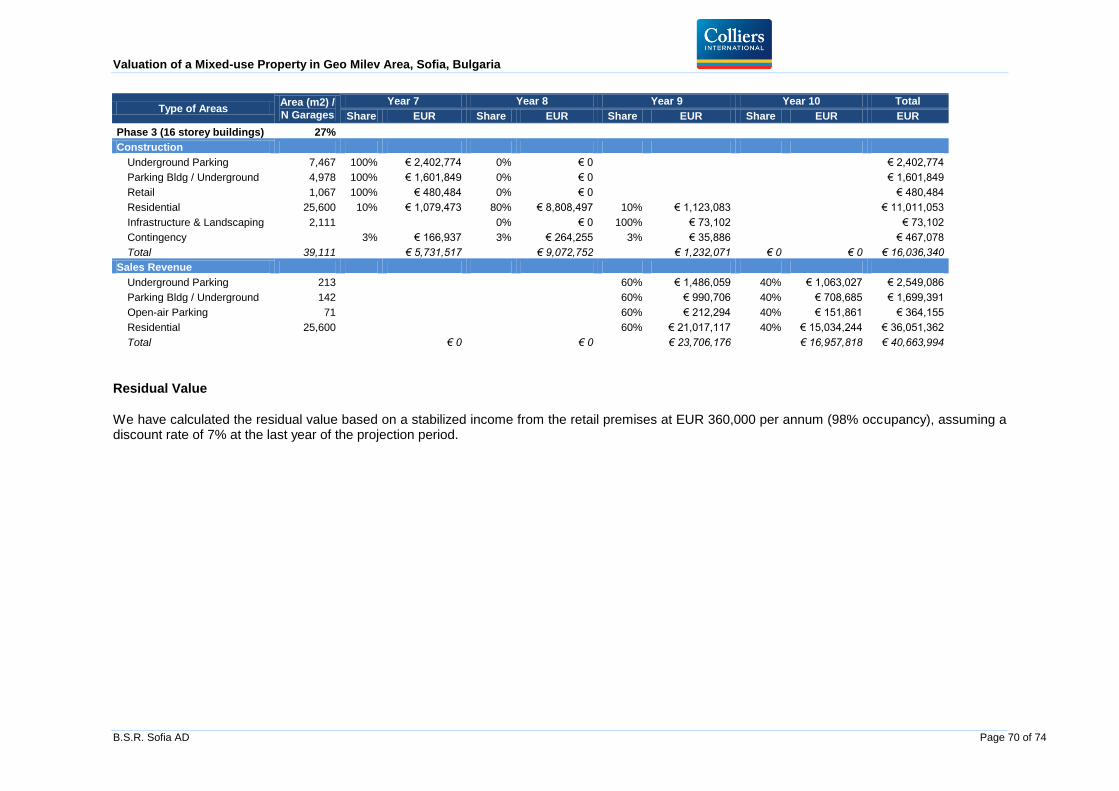
Valuation of a Mixed-use Property in Geo Milev Area, Sofia, Bulgaria
B.S.R. Sofia AD Page 70 of 74
Type of Areas Area (m2) /
N Garages
Year 7 Year 8 Year 9 Year 10 Total
Share EUR Share EUR Share EUR Share EUR EUR
Phase 3 (16 storey buildings) 27% Construction
Underground Parking 7,467 100% € 2,402,774 0% € 0
€ 2,402,774
Parking Bldg / Underground 4,978 100% € 1,601,849 0% € 0
€ 1,601,849
Retail 1,067 100% € 480,484 0% € 0
€ 480,484
Residential 25,600 10% € 1,079,473 80% € 8,808,497 10% € 1,123,083
€ 11,011,053
Infrastructure & Landscaping 2,111
0% € 0 100% € 73,102
€ 73,102
Contingency
3% € 166,937 3% € 264,255 3% € 35,886
€ 467,078
Total 39,111
€ 5,731,517
€ 9,072,752
€ 1,232,071 € 0 € 0 € 16,036,340
Sales Revenue
Underground Parking 213
60% € 1,486,059 40% € 1,063,027 € 2,549,086
Parking Bldg / Underground 142
60% € 990,706 40% € 708,685 € 1,699,391
Open-air Parking 71
60% € 212,294 40% € 151,861 € 364,155
Residential 25,600
60% € 21,017,117 40% € 15,034,244 € 36,051,362
Total
€ 0
€ 0
€ 23,706,176
€ 16,957,818 € 40,663,994
Residual Value
We have calculated the residual value based on a stabilized income from the retail premises at EUR 360,000 per annum (98% occupancy), assuming a discount rate of 7% at the last year of the projection period.
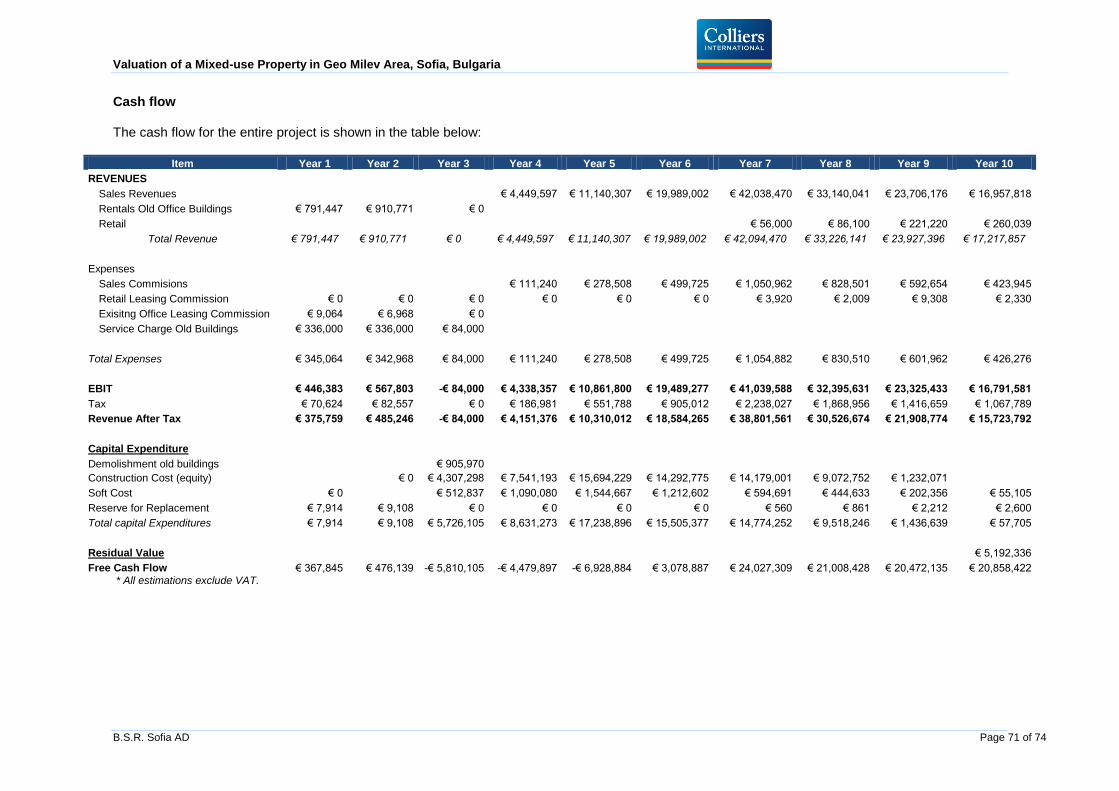
Valuation of a Mixed-use Property in Geo Milev Area, Sofia, Bulgaria
B.S.R. Sofia AD Page 71 of 74
Cash flow The cash flow for the entire project is shown in the table below:
Item Year 1 Year 2 Year 3 Year 4 Year 5 Year 6 Year 7 Year 8 Year 9 Year 10
REVENUES
Sales Revenues
€ 4,449,597 € 11,140,307 € 19,989,002 € 42,038,470 € 33,140,041 € 23,706,176 € 16,957,818
Rentals Old Office Buildings € 791,447 € 910,771 € 0 Retail
€ 56,000 € 86,100 € 221,220 € 260,039
Total Revenue € 791,447 € 910,771 € 0 € 4,449,597 € 11,140,307 € 19,989,002 € 42,094,470 € 33,226,141 € 23,927,396 € 17,217,857
Expenses Sales Commisions
€ 111,240 € 278,508 € 499,725 € 1,050,962 € 828,501 € 592,654 € 423,945
Retail Leasing Commission € 0 € 0 € 0 € 0 € 0 € 0 € 3,920 € 2,009 € 9,308 € 2,330
Exisitng Office Leasing Commission € 9,064 € 6,968 € 0 Service Charge Old Buildings € 336,000 € 336,000 € 84,000
Total Expenses € 345,064 € 342,968 € 84,000 € 111,240 € 278,508 € 499,725 € 1,054,882 € 830,510 € 601,962 € 426,276
EBIT € 446,383 € 567,803 -€ 84,000 € 4,338,357 € 10,861,800 € 19,489,277 € 41,039,588 € 32,395,631 € 23,325,433 € 16,791,581
Tax € 70,624 € 82,557 € 0 € 186,981 € 551,788 € 905,012 € 2,238,027 € 1,868,956 € 1,416,659 € 1,067,789
Revenue After Tax € 375,759 € 485,246 -€ 84,000 € 4,151,376 € 10,310,012 € 18,584,265 € 38,801,561 € 30,526,674 € 21,908,774 € 15,723,792
Capital Expenditure
Demolishment old buildings
€ 905,970 Construction Cost (equity)
€ 0 € 4,307,298 € 7,541,193 € 15,694,229 € 14,292,775 € 14,179,001 € 9,072,752 € 1,232,071
Soft Cost € 0
€ 512,837 € 1,090,080 € 1,544,667 € 1,212,602 € 594,691 € 444,633 € 202,356 € 55,105
Reserve for Replacement € 7,914 € 9,108 € 0 € 0 € 0 € 0 € 560 € 861 € 2,212 € 2,600
Total capital Expenditures € 7,914 € 9,108 € 5,726,105 € 8,631,273 € 17,238,896 € 15,505,377 € 14,774,252 € 9,518,246 € 1,436,639 € 57,705
Residual Value
€ 5,192,336
Free Cash Flow € 367,845 € 476,139 -€ 5,810,105 -€ 4,479,897 -€ 6,928,884 € 3,078,887 € 24,027,309 € 21,008,428 € 20,472,135 € 20,858,422 * All estimations exclude VAT.
Valuation of a Mixed-use Property in Geo Milev Area, Sofia, Bulgaria
B.S.R. Sofia AD Page 72 of 74
APPENDIX III
GENERAL ASSUMPTIONS
AND DEFINITIONS

Valuation of a Mixed-use Property in Geo Milev Area, Sofia, Bulgaria
B.S.R. Sofia AD Page 73 of 74
GENERAL ASSUMPTIONS & DEFINITIONS
The valuation have been prepared by a suitably qualified valuer, as defined by VS 1.5 and 1.6 of the Valuation Standards, on the basis set out below unless any variations have been specifically referred to under the heading “Special Remarks”
Basis of value Basis of value is a statement of the fundamental measurement assumptions of a valuation. In line with the RICS standards, this valuation employs Market Value as a basis of value.
Assumption A supposition taken to be true. It involves facts, conditions or situations affecting the subject of, or approach to, a valuation that by agreement need not be verified by the valuer as part of the valuation process. Typically, an assumption is made where specific investigation by the valuer is not required in order to prove that something is true.
Date of report The date on which the valuer signs the valuation report.
Date of valuation The date on which the opinion of value applies, as agreed with the client. This date may be before, or the same as, the date of report, but it cannot be after that date.
Market Value Market value is assumed to mean the estimated amount for which an asset or liability should exchange on the valuation date between a willing buyer and a willing seller in an arm’s-length transaction after proper marketing and where the parties had each acted knowledgeably, reasonably and without compulsion (IVSC, IVS 1, as cited in RICS Valuation Standards, 8th Edition).
Method of valuation A method of valuation is a procedure or technique used to arrive at the value described by a basis of value (a statement of the fundamental terms upon which a hypothetical exchange is assumed to take place) (RICS Valuation Standards, 8th Edition). Market based valuation approaches include Market (Sales) Comparison Approach, Income Capitalization Approach and Cost Approach. Valuer’s experience and training, local standards, market characteristics, and available data determine which method(s) are used for estimating the market value of the subject property.
Inspection A visit to a property to examine it and obtain relevant information in order to express a professional opinion of its value. Unless explicitly agreed with the client otherwise, the term assumes that the valuer will inspect the property both internally and externally, wherever access is possible.
Real estate Land and all items that are a natural part of the land (e.g. trees, minerals) and that have been attached to the land – such as buildings, site improvements and all permanent building attachments (e.g. mechanical and electrical plant providing services to a building) that are both above and below the ground.
Real property All rights, interest and benefits related to the ownership of real estate, including any negative rights, interests or benefits (i.e. obligations, encumbrances or liabilities) relating to the interest being valued.
Special assumption An assumption that either assumes facts that differ from the actual facts existing at the valuation date, or that would not be made by a typical market participant in a transaction on the valuation date.

Valuation of a Mixed-use Property in Geo Milev Area, Sofia, Bulgaria
B.S.R. Sofia AD Page 74 of 74
Terms of engagement Written confirmation of the condition that either the member proposes or that the member and the client have agreed shall apply to the undertaking and reporting of the valuation.
Third party Any party other than the client that may have an interest in the valuation or its outcome.
Valuation standard A statement of the highest professional standards that are of mandatory application to RICS members when providing written valuations.
My Mall, Limassol Cyprus Fairness Opinion for Related Parties Transaction For Gibor BSR Europe BV and Tiffany Investments Ltd. Determining Date: 30 June 2012

The International Institute of Real Estate Valuation (A.C.) Ltd.
-2 -
Contents
1.1 Our Appointment 3
1.2 Inspection 4
1.3 Information Received 4
2.1 Property Details 5
2.2 Valuation Details 5
2.3 Updated Mall Information 30 June 2012 5
3.1 Market Overview 7
3.2 Retail and Shopping Malls 9
3.3 Transactional Evidence 01
4.1 Planning and Permitting 00
4.2 Tenure 00
4.3 Tenancy and Income 00
4.4 Visitor Traffic 00
4.5 Disposition Costs 00
4.6 Discount Rate 00
4.7 Conclusions 01
4.8 Valuation Under Special Assumption 01
Addenda I-Valuation Calculation as at 31 March 2012 04
Addenda II-Definitions of the Bases of Valuation 05

The International Institute of Real Estate Valuation (A.C.) Ltd.
-3 -
Attention : Eyal Bezalel, CFO 12 August 2012 BSR Europe
Dear Eyal,
1. Terms of instruction, confidentiality and disclosure
1.1 Our Appointment The International Institute of Real Estate Valuation (A.C.) Ltd (herein: THE INSTITUTE) has been instructed by Gibor BSR B.V. to reassess the valuation carried out by the Institute for the determining date 31 March 2012 and provide a fairness opinion as at 30 June 2012 regarding a proposed related parties transaction. The Institute has further been instructed to assess the estimated proceeds from sale subject to the special assumption of a sale within 6 months. We have been instructed to relate to any significant issues which might have impact on the value from our previous valuation (31 March 2012). This valuation is in regard to a put option by Gibor BSR Europe BV of company’s shares in Tiffany Investments Ltd (The SPV holding company of the subject property) equal up to €3 million (subject to the deficit of the 2012 bond repayment at NOV 2012). The option can be exercise till 30 Nov 2012 subject to fulfilment of certain conditions. The purchase will be carried out personally by the controlling shareholders in BSR Europe, Nachshon Kiviti, Eitan Elder and Roy Gil. The purchaser will have a put option between 1st Dec 2012 and 31
st March 2013 for the same consideration plus 10% annual interest subject to fulfilment
of certain conditions. 1
We have not been instructed to provide an opinion regarding Gibor BSR Europe BV rights in the subject properties, but rather to assess the value of the subject property at 30 June 2012 in relation to the full valuation carried out by the undersigned for the determining date of 31 March.
1 Transaction as described by the Client.

The International Institute of Real Estate Valuation (A.C.) Ltd.
-4 -
1.2 Inspection The properties were inspected internally and externally by Opher Barzilay, MRICS and Adina Cooper, MRICS on 19 April 2012.
1.3 Information Received We have received the following document from the Company related to this report: Letter from My Mall Management dated 18 July 2012 with addenda outlining the
changes in the subject property from 31 March 2012 until 30 June 2012. Rental Collection report for 1-6 2012 Mall Visitors report January- June 2012. We have been provided with no further documentation at present and have assumed that we have been informed of any material factors which affect the valuation. We received additional detailed information regarding land registry, planning, letting and other necessary details for the valuation at 31 March 2012.
The International Institute of Real Estate Valuation (A.C.) Ltd.
-5 -
2. Valuation Details
2.1 Property Details From the valuation of 31 March 2012 we note the following details: Site 108,145 sq. m. Built Area 44,655 sq. m. Additional Building Rights 12,550 sq. m. Total GLA 31,522 sq. m. Occupancy 86% NOI €7.08 MLN
2.2 Valuation Details The following are brief details of the valuation as at 31 March 2012: Fair Value €98.4 Million Valuation Methodology Income Approach Value per sq. m. GLA €3,121 Rights Valued Freehold 100% rights
2
Discount Rate 12.5% Net Initial Yield 7.2% Sale Cap Rate 8% Please see addenda I for the detailed calculations
2.3 Updated Mall Information 30 June 2012
Yoram Kedem, General Manager of My Mall sent us a letter describing all the changes that happened in the last 3 months which are expected to affect the cash-flow as valued as of 31.3.2012 These changes comprise four different elements: Termination of leases: 4 shops have left the mall New signed agreements: one kiosk changed tenants, and the new tenant was granted a one year rental concession. Letters of Intent and Pipeline tenants: two vacant shops are expected to be leased in the near future based on current negotiations and letters of intent.
2 Please refer to the description of the company’s rights in the full valuation 31/3/2012

The International Institute of Real Estate Valuation (A.C.) Ltd.
-6 -
Concessions: three new concessions were granted to tenants, which will lower the expected income for a maximum of one year. In accordance with our financial model for the 31 March Valuation, we have assumed that these changes will have a marginal impact on the original income assumptions for the next 2 years. For example, in our valuation model we have assumed that newly vacant shops would probably be leased after 2 years. The same assumption has been applied for new agreements signed and in the last stages of negotiations.
This table outlines the above mentioned changes in relation to the last valuation.
In accordance with the above calculations, we find that the total changes in income in relation to the overall calculation of value in the subject property are marginal.
UNIT COMPANY NAME BRAND Remarks
Expected
revenues from
MLF year1
including CLI+%
in EUR
Expected
revenues from
MLF year 2
including CLI+%
in EUR
LOT and LEGAL TERMINATION
71 RODOTEX ENTERPRISES LTD OXFORD COMPANY -42,729€ -43,584€
124 KAZOUARINO LTD SAM 013 -13,828€ -15,211€
84 METAXAS GROUP OF COMPANIES LTD METAXAS -66,668€ -68,002€
145 CAROB MILL RESTAURANTS LTD LA NOSTRA -48,000€ -48,720€
Total deficit from termination -171,225€ -175,516€
NEW SIGNED LICENSE AGREEMENTS
-
kiosk g MIKAEL TRADING LTD
LEPUS ACCESSORIES
replaces preceding
tenant with same lease
but with connsession -6,000€
Total expected net deficit -6,000€ -€
LOI AND PIP
44 T.B.A. CROCKS
net change of changed
tenant 2,219€ 2,219€
147 PHC FRANCHISED RESTAURANTS PUBLIC LTD PIZZA HUT/ TACO BELL was vacant 36,000€ 48,000€
Total expected surplus 38,219€ 50,219€
SPECIAL terms (concessions)
103-38,000€ -€
160-3,000€ -€
165-3,000€ -€
Total deficit from new special terms (conssesions) -44,000€ -€
Total
Total non Depreciated Net change 4-6/2012 -308,303€ -183,006€ -125,297€ -162,672€ -99,000€
Total Rounded Depreciated Net change 4-6/2013 -260,000€
change from last valuation (31.3.2012) -0.26%
LA MASISON rent per month € 5,926 SPECIAL T/O INSTEAD OF MLF FOR THE 2ND HALF OF 2012 NEW CONCESSION
LE ROUGE rent per month € 3,000 SPECIAL 1000 MLF UNTIL 31 DEC 2012/ 3000 FOR 2013 WAS
1500 till DEC 12
OSE rent per month € 3,000 SPECIAL REDUCED MLF 1500 FOR 2012 / 3000 FOR 2013 WAS 2000 till
DEC 12

The International Institute of Real Estate Valuation (A.C.) Ltd.
-7 -
3. Market Commentary
3.1 Market Overview The Cypriot property market continues to experience uncertainty due to the liquidity problems faced by the banks, which has severely limited real estate lending. Since our valuation of 31 March 2012, Marfin Bank has been nationalized. This event was imminent upon the writing of the valuation and was taken into consideration. During the first half of 2012, domestic real estate sales stood at 2,910 – an increase of 12% on the 2,601 sales in the first half of 2011.
Source: Department of Lands and Surveys The overseas market remains fragile and continues to weaken. The number of sales dropped in all areas during June, falling by 61 (36%) compared with the number sold in June 2011. The area hardest hit was Larnaca, where sales were down 26 (-68%) compared with June last year. Larnaca was followed by Paphos -13 (-33%), Limassol -10 (-26%), Nicosia -7 (-26%) and finally Famagusta -5 (-26%). During the first half of 2012, overseas sales stood at 800 – a decrease of 18% on the 976 sales in the first half of 2011.

The International Institute of Real Estate Valuation (A.C.) Ltd.
-8 -
Source: Department of Lands and Surveys Tighter credit standards were implemented by Cypriot banks during the first quarter of 2012 as a precautionary measure. There are some corrective plans which the government will implement and are expected to boost the property market. An important change will be the altering of the planning zones and the increase in the allowance of building coefficient and at certain areas allowing the construction of buildings up to 30 floors welcoming new mega projects. In addition, new laws regarding the payoff of new bought properties are going to be implemented favouring the buyers and therefore attract a greater number of sales.
The construction of Cyprus new marina at Limassol is progressing well and is expected to be ready to receive yachts in October 2012. With Limassol Marina, Cyprus is destined to become the most exclusive waterfront development in the Mediterranean and one of the finest in the world. With an estimated cost of €350 million, other plans for the marina complex include boutiques, restaurants, cafes, shops and conference space, all with the aim of attracting more high-end tourists to the island and a bigger share of the Mediterranean yachting market. The marina will be expected to be ready by 21st October 2012 and will able to accommodate around 600 craft of various sizes.
In the near future, changes in Local Plans that concern development allowances are expected to take effect. These changes are likely to welcome a greater amount of investments and construction.
Russian backed development plans building the tallest statue in the world named The Kind Angel of the World with a height of 135 meters off the coast of Limassol at Monagrouli.

The International Institute of Real Estate Valuation (A.C.) Ltd.
-9 -
The Olympic Residence includes super luxury apartments, a project of two seafront soaring towers offers impressive architecture and design, 5 star hotel services, super luxury accommodation and sea view will be completed in Limassol, Cyprus.
A detailed description of the Cypriot real estate economics can be found in the full valuation from 31 March 2012.
3.2 Retail and Shopping Malls
Based on discussions with real estate professionals, the Limassol retail market has experienced some contraction due to the failure of several retailers such as Coffee Bean and Orphanides. Local real estate consultants FVAT S.A. reports:
“In the broader area of Nicosia, investment returns for shops and offices fluctuate between 5% and 6%. Market values for shops that are located outside Nicosia centre appear to be lower, but in many areas can be as high as the ones in the centre. Another significant development that is expected to positively affect the retail market is the rapid rise in consumer spending. Furthermore, the market has now seen the entrance of significant brand names, such as Zara, Mango, Max Mara, Gucci, Tommy Hilfiger, Hugo Boss, Luis Vuitton, as well as a continuing influx of Greek retailers. Retail development concentrated in the 4 main cities (Nicosia, Limassol, Larnaca, Paphos). Retailing in Nicosia center remains strong, but traffic congestion and parking problems remain the basic challenge. Demand of decentralized retailing formats remains strong, while demand for decentralized retailing formats has increasingly grown. “
Real Estate firm Danos reports; “Orphanides Shopping Centre in Nicosia after 12 years since the initial operation, the space will be changed both internally and externally as it was presented by Mr. Christos Orphanides the president of the company. The new project will change its name to Nicosia City Mall and will have a new layout consisting of waterfalls, special lighting cafeterias and restaurants.
In addition, K. ATHIENITIS CONTRACTORS DEVELOPERS PUBLIC LTD is in the process of erecting an Organized Compound Trade Centre having its own internal road network on a plot with a surface area of 61.261sq.m. The mall will be developed on the western outskirts of Nicosia, in the parish of Archangelos/ Anthoupoli. It will consist of approximately 20,000 sq.m of internal leasable area. “
The Paphos Mall has yet to be completed, and it is unclear if it will be ready for occupancy in 2013 as originally planned. A detailed description of the Cypriot retail market can be found in the full valuation from 31 March 2012.

The International Institute of Real Estate Valuation (A.C.) Ltd.
-10 -
3.3 Transactional Evidence There is very sparse transactional evidence in the Cyprus real estate market and only one significant transaction regarding a shopping mall. At the end of 2011, Aristo sold a 50% shareholding stake in the Kings Avenue Mall project in central Paphos at a total value of €39.5 million. The purchasers paid the Company a cash consideration of €15 million and have assumed the project’s €24.5 million of bank loans and other liabilities which reflects a gross development value of €79 Million. General Information and Facts: • Size of the building: 103.000 m² • Covered Areas (excluding basements): 41.000 m² • Net Lettable Area (N.L.A.): 28.000 m² • Parking Places: 1.250 (all covered) • No. of shops:100 (approx) The Kings Avenue Mall is scheduled for completion in 2013. It is difficult to assess this data in relation to the subject property as at the time of the sale the Mall was not fully built or let. The purchase price reflects a price of €2,841 per sq. m. NLA. More detailed transactional information can be found in the valuation as at 31 March 2012.

The International Institute of Real Estate Valuation (A.C.) Ltd.
-11 -
4. Valuation Assumptions
4.1 Planning and Permitting We have not been informed of any changes regarding the planning and permitting since we carried out the valuation as at 31 March 2012 and have assumed this in our opinion.
4.2 Tenure We have not been informed of any changes regarding the rights in the subject property since we carried out the valuation as at 31 March 2012 and have assumed this in our opinion.
4.3 Tenancy and Income We assume that the information provided by the mall management regarding changes in income are correct and have assessed them in light of the financial model we prepared for the valuation as at 31 March 2012. Based on information provided by the mall management regarding rent collections, we have assumed that rental collections are consistent with past performance.
4.4 Visitor Traffic Based on mall visitor traffic reports there was a decline of 9% in the number of visitors during Q-2 2012 in comparison to Q-2 2011. The average number of monthly visitors in Q-2 2012 was 221,540.
4.5 Disposition Costs The valuation takes into account standard market cost to vendors of 3% of the terminal value for the disposition of the property to determine the net market value for financial reporting as required by RICS and IVA1.
4.6 Discount Rate We have assessed the adopted discount rate from the valuation as at 31 March 2012. Based on the below analysis carried out by FVAT SA, we outline the following considerations in determining the discount rate:

The International Institute of Real Estate Valuation (A.C.) Ltd.
-12 -
4.7 Conclusions The undersigned concludes that the valuation as at 31 March 2012 reflects Market Value at 30 June 2012, of €98.4 Million (Ninety-eight million four hundred thousand Euro).
4.8 Valuation Under Special Assumption We have been asked to provide an opinion regarding the estimated proceeds from sale subject to the special assumption of a sale within 6 months. Based on an estimated time to market a property of this size, we conclude that the discount for a sale within a six month marketing period would be approximately 25%. Therefore the estimated consideration subject to the special assumption would be €73.8 Million. (Seventy- three million eight hundred thousand Euro).
Shopping Mall Discount Rate Development
Cost of Equity 15,00%
Cost of Debt 7,00%
Corporate Tax Rate 10,00%
After Tax Cost of Debt 6,30%
Industry Capital Structure
Equity 70%
Debt 30%
SAY
WACC 12,39% 12,40%

The International Institute of Real Estate Valuation (A.C.) Ltd.
-13 -
5. Confidentiality and Disclosure
The contents of this Report and appendices are specific to the purpose to which they refer and are for that use only. We hereby explicitly consent to the inclusion of this Report and reference thereto in the Transaction Report that will be filed by BSR Europe with the Tel Aviv Stock Exchange and the Israeli Securities Authority. It is understood that this fairness opinion will be published by the company in its reports to investors and the Israeli Stock exchange. However, in accordance with current practice, no responsibility is accepted to any other party in respect of the whole or any part of their contents. Before this Report, or any part thereof, is reproduced or referred to, in any document, circular or statement, and before its contents, or any part thereof, are disclosed orally for any other purpose, the valuer's written approval as to the form and context of such publication or disclosure must first be obtained. For the avoidance of doubt such approval is required whether or not THE INSTITUTE is referred to by name and whether or not the contents of our report are combined with others. Yours faithfully,
Adina Cooper, MRICS Registered Valuer Scheme Important Note: 1. The opinions detailed above are totally dependent on the adequacy and accuracy of
the information supplied and the assumptions made. It should be noted that should these prove to be incorrect, the accuracy of this opinion will be affected.
2. We have not been advised of the purchase price of the property. If instructed to
undertake a further valuation of the property, we will be required to investigate any recent marketing of the property. Any recent marketing is likely to provide the best evidence as to the current Market Value of the asset and therefore our findings following such an investigation may have a material impact on the Market Value reported. If a purchase price has been agreed we recommend that we are advised of it as soon as possible so we can reconsider our opinion.
3. If any circumstances surrounding this property change between the issue of this
opinion (such as a change in the purchase price) we may need to revise our opinion.

The International Institute of Real Estate Valuation (A.C.) Ltd.
-14 -
Addenda I-Valuation Calculation as at 31 March 2012
Year 1 2 3 4 5 6 7 8 9 10
year's end 31.3.2013 31.3.2014 31.3.2015 31.3.2016 31.3.2017 31.3.2018 31.3.2019 31.3.2020 31.3.2021 31.3.2022
Total income producing occupancy
rate GLA86% 96% 96% 98% 98% 98% 98% 98% 98% 98%
Annual Licence Fee inc. revenues
from non spaced activities and
stepups net of concessions
7,532,103€ 9,203,145 9,761,593 9,964,993 9,964,993 9,964,993 9,964,993 9,964,993 9,964,993 9,964,993
EXPECTED T/O rent ABOVE licence
fee98,000 240,000 475,000 475,000 475,000 475,000 475,000 475,000 475,000 475,000
rent free/tenant turnover loss -120,000 -120,000 -120,000 -120,000 -120,000 -120,000 -120,000 -120,000 -120,000 -120,000
uncollected bills/legal -50,000 -50,000 -50,000 -50,000 -50,000 -50,000 -50,000 -50,000 -50,000 -50,000
Total rent 7,460,103€ 9,273,145 10,066,593 10,269,993 10,269,993 10,269,993 10,269,993 10,269,993 10,269,993 10,269,993
Net management deficit/surplus - - - - - - - - - -
Depreciation/sinking fund 5% of
rent-380,000 -380,000 -380,000 -380,000 -380,000 -380,000 -380,000 -380,000 -380,000 -380,000
NOI 7,080,103€ 8,893,145€ 9,686,593€ 9,889,993€ 9,889,993€ 9,889,993€ 9,889,993€ 9,889,993€ 9,889,993€ 9,889,993€
Sale 123,624,908
Transfer cost -3,708,747
Cash Flow 7,080,103 8,893,145 9,686,593 9,889,993 9,889,993 9,889,993 9,889,993 9,889,993 9,889,993 129,806,154
DCF 6,675,186 7,452,923 7,215,887 6,548,806 5,821,161 5,174,365 4,599,436 4,088,387 3,634,122 42,398,093
discount rate sale cap rate
12.50% 8.00%
Total DCF 93,608,366€
Additional rights 4,800,000€
Fair Value 98,408,366€
The International Institute of Real Estate Valuation (A.C.) Ltd.
-15 -
Addenda II-Definitions of the Bases of Valuation
Market Value3
Valuations based on Market Value (MV) shall adopt the definition, and the conceptual framework, settled by the International Valuation Standards Council.
Market Value is defined as: The estimated amount for which a property should exchange on the date of valuation between a willing buyer and a willing seller in an arm’s-length transaction after proper marketing wherein the parties had each acted knowledgeably, prudently and without compulsion.
IVSC 2007
Conceptual Framework, as published in International Valuation Standard 1 3.2 The term property is used because the focus of these Standards is the valuation of property. Because these Standards encompass financial reporting, the term Asset may be substituted for general application of the definition. Each element of the definition has its own conceptual framework. Valuation standards
3.2.1 ‘The estimated amount…’ Refers to a price expressed in terms of money (normally in the local currency) payable for the property in an arm’s-length market transaction. Market Value is measured as the most probable price reasonably obtainable in the market at the date of valuation in keeping with the Market Value definition. It is the best price reasonably obtainable by the seller and the most advantageous price reasonably obtainable by the buyer. This estimate specifically excludes an estimated price inflated or deflated by special terms or circumstances such as atypical financing, sale and leaseback arrangements, special considerations or concessions granted by anyone associated with the sale, or any element of Special Value.
3.2.2 ‘…a property should exchange …’ Refers to the fact that the value of a property is an estimated amount, rather than a predetermined or actual sale price. It is the price at which the market expects a transaction that meets all other elements of the Market Value definition should be completed on the date of valuation.
3.2.3 ‘…on the date of valuation …’ Requires that the estimated Market Value is time-specific as of a given date. Because markets and market conditions may change, the estimated value may be incorrect or inappropriate at another time. The valuation amount will reflect the actual market state and circumstances as of the effective valuation date, not as of either a past or future date. The definition also assumes simultaneous exchange and completion of the contract for sale without any variation in price that might otherwise be made.
3.2.4 ‘…between a willing buyer ’ Refers to one who is motivated, but not compelled to buy. This buyer is neither over-eager nor determined to buy at any price. This buyer is also one who purchases in accordance with the realities of the current market and with current market expectations, rather than on an imaginary or hypothetical market which cannot be demonstrated or anticipated to exist. The assumed buyer would not pay a higher price than the market requires. The present property owner is included among those who constitute ‘the market’. A valuer must not make unrealistic Assumptions about market conditions or assume a level of Market
3 (As defined in Redbook VS 3.2) RICS VALUATION STANDARDS – GLOBAL AND UK
The International Institute of Real Estate Valuation (A.C.) Ltd.
-16 -
Value above that which is reasonably obtainable.
3.2.5 ‘…a willing seller …’ Is neither an over-eager nor a forced seller prepared to sell at any price, nor one prepared to hold out for a price not considered reasonable in the current market. Valuation standards
The willing seller is motivated to sell the property at market terms for the best price attainable in the (open) market after proper marketing, whatever that price may be. The factual circumstances of the actual property owner are not a part of this consideration because the ‘willing seller’ is a hypothetical owner.
3.2.6 ‘…in an arm’s-length transaction …’ Is one between parties who do not have a particular or special relationship (for example, parent and subsidiary companies or landlord and tenant) which may make the price level uncharacteristic of the market or inflated because of an element of Special Value (see IVS 2, paragraph 3.8). The Market Value transaction is presumed to be between unrelated parties each acting independently.
3.2.7 ‘…after proper marketing …’ Means that the property would be exposed to the market in the most appropriate manner to effect its disposal at the best price reasonably obtainable in accordance with the Market Value definition. The length of exposure time may vary with market conditions, but must be sufficient to allow the property to be brought to the attention of an adequate number of potential purchasers. The exposure period occurs prior to the valuation date.
3.2.8 ‘…wherein the parties had each acted knowledgeably, prudently …’ Presumes that both the willing buyer and the willing seller are reasonably informed about the nature and characteristics of the property, its actual and potential uses, and the state of the market as of the date of valuation. Each is further presumed to act for self-interest with that knowledge and prudently to seek the best price for their respective positions in the transaction. Prudence is assessed by referring to the state of the market at the date of valuation, not with benefit of hindsight at some later date. It is not necessarily imprudent for a seller to sell property in a market with falling prices at a price which is lower than previous market levels. In such cases, as is true for other purchase and sale situations in markets with changing prices, the prudent buyer or seller will act in accordance with the best market information available at the time. 3.2.9 ‘…and without compulsion.’ Establishes that each party is motivated to undertake the transaction, but neither is forced or unduly coerced to complete it. 3.3 Market Value is understood as the value of a property estimated without regard to costs of sale or purchase, and without offset for any associated taxes.
IVSC 2007, IVS 1, paragraphs 3.2 and 3.3
Market Rent
Valuations based on market rent (MR) shall adopt the definition settled by the International Valuation Standards Council.
Market Rent: The estimated amount for which a property, or space within a property, should lease (let) on the date of valuation between a willing lessor and a willing lessee on appropriate lease terms in an arm’s-length transaction after proper marketing wherein the parties had acted knowledgeably, prudently and without compulsion. Whenever Market Rent is provided the ‘appropriate lease terms’ which it reflects should also be stated. IVSC, GN 2, paragraph 3.1.9.1

The International Institute of Real Estate Valuation (A.C.) Ltd.
-17 -
Commentary
4
1. The definition of market rent is the Market Value definition modified by the substitution of a ‘willing lessor’ and ‘willing lessee’ for a ‘willing buyer’ and ‘willing seller’, and an additional assumption that the letting will be on ‘appropriate lease terms’. This definition must be applied in accordance with the conceptual framework of Market Value at VS 3.2, together with the following supplementary commentary.
‘willing lessor and willing lessee’ 1.1 The change in the description of the parties simply reflects the nature of the transaction. The willing lessor is possessed with the same characteristics as the willing seller, and the willing lessee with the same characteristics as the willing buyer, save that the word ‘price’ in the interpretive commentary to Market Value
should be changed to ‘rent’, the word ‘sell’ changed to ‘let’ and the word ‘buy’ changed to ‘lease’.
‘appropriate lease terms’ 1.2 Market rent will vary significantly according to the terms of the assumed lease
contract. The appropriate lease terms will normally reflect current practice in the market in which the property is situated, although for certain purposes unusual terms may need to be stipulated. Matters such as the duration of the lease, the frequency of rent reviews and the responsibilities of the parties for maintenance and outgoings will all impact the market rent. In certain states, statutory factors may either restrict the terms that may be agreed, or influence the impact of terms in the contract. These need to be taken into account where appropriate. 1.3 Valuers must therefore take care to set out clearly the principal lease terms that are assumed when providing market rent. If it is the market norm for lettings to include a payment or concession by one party to the other as an incentive to entern standards into a lease, and this is reflected in the general level of rents agreed, the market rent should also be expressed on this basis. The nature of the incentive assumed must be stated by the valuer, along with the assumed lease terms. Market rent will normally be used to indicate the amount for which a vacant property may be let, or for which a let property may re-let when the existing lease terminates. Market rent is not a suitable basis for settling the amount of rent payable under a rent review
provision in a lease, where the actual definitions and assumptions have to be used.
Fair Value5
Valuations based on fair value shall adopt the definition settled by the International Valuation Standards Council.
Fair Value is: The amount for which an asset could be exchanged, between knowledgeable, willing parties, in an arm’s-length transaction.
IVSC, IVS 2, paragraph 3.2
Valuation standards
Commentary 1. Fair value represents the price that would be reasonably agreed between two
specific parties for the exchange of an asset. Although the parties may be unconnected and negotiating at arm’s length, the asset is not necessarily exposed in the wider market. In addition, the price agreed may be one that reflects the specific advantages (or disadvantages) of ownership to the parties involved rather than the market at large. 2. Examples of fair value would be the price agreed between a landlord and a
4 VS 3 Basis of value RICS VALUATION STANDARDS – GLOBAL AND UK
5 VS 3 Basis of value RICS VALUATION STANDARDS – GLOBAL AND UK
The International Institute of Real Estate Valuation (A.C.) Ltd.
-18 -
tenant for the surrender or extension of a lease, or the price for a transfer of shares in a private company. 3. Fair value is also a measurement basis required or permitted under International
Financial Reporting Standards (IFRS), where its application is subject to specific additional conditions that mean that it is generally equated with Market Value. 4. IVS 2 notes:
6.2 The application of Fair Value under accounting standards is discussed in IVA 1. In accounting standards, Fair Value is normally equated to Market Value. 6.3 Fair Value is a broader concept than Market Value. Although in many cases the price that is fair between two parties will equate to that obtainable in the general market, there will be cases where the assessment of Fair Value will involve taking into account matters that have to be disregarded in the assessment of Market Value. 6.4 A common application of Fair Value is for assessing the price that is fair for the shareholding in a business, where particular synergies between two specific parties may mean that the price that is fair between them is different from the price that might be obtainable in the wider market. In contrast, Market Value requires any element of Special Value, of which Synergistic Value is an example, to be disregarded. 6.5 For other purposes, Fair Value can be distinguished from Market Value. Fair Value requires the assessment of the price that is fair between two specific parties taking into account the respective advantages or disadvantages that each will gain from the transaction.
IVSC 2007, IVS 2, paragraphs 6.2 to 6.5 5. An estimate of fair value for any purpose other than inclusion in a financial statement is likely to use assumptions or criteria that differ from those that would be made in an assessment of the Market Value of the same property. A typical example would be that the fair value might reflect the synergistic value that would arise in an exchange between two specific parties which would not be available on a disposal to the market at large. Such assumptions or criteria should be highlighted by the valuer in the report, along with the fact that the value reported is not the Market Value (also see VS 6.13).
Market Rent
Market Rent as defined in Practice Statement 3.3 of the Red Book. Under PS 3.3 the term "Market Rent"
means 'The estimated amount for which a property, or space within a property, should lease (let) on
the date of valuation between a willing lessor and a willing lessee on appropriate lease terms in an
arm's-length transaction after proper marketing wherein the parties had acted knowledgeably,
prudently and without compulsion.'
The commentary from the Red Book is reproduced below.
"1. The definition of Market Rent is the Market Value (MV) definition modified by the
substitution of a willing lessor and willing lessee for a willing buyer and willing seller, and
an additional Assumption that the letting will be on 'appropriate lease terms'. This

The International Institute of Real Estate Valuation (A.C.) Ltd.
-19 -
definition must be applied in accordance with the interpretive commentary of MV at PS3.2,
together with the following supplementary commentary:
1.1 '…willing lessor and willing lessee…'
The change in the description of the parties simply reflects the nature of the transaction.
The willing lessor is possessed with the same characteristics as the willing seller, and the
willing lessee with the same characteristics as the willing buyer, save that the word 'price' in
the interpretive commentary to MV should be changed to 'rent', the word 'sell' changed to
'let' and the word 'buy' changed to 'lease'.
1.2 '…appropriate lease terms…'
MR will vary significantly according to the terms of the assumed lease contract. The
appropriate lease terms will normally reflect current practice in the market in which the
property is situated, although for certain purposes unusual terms may need to be
stipulated. Matters such as the duration of the lease, the frequency of rent reviews, and the
responsibilities of the parties for maintenance and outgoings, will all impact on MR. In
certain States, statutory factors may either restrict the terms that may be agreed, or
influence the impact of terms in the contract. These need to be taken into account where
appropriate. Valuers must therefore take care to set out clearly the principal lease terms
that are assumed when providing MR.
If it is the market norm for lettings to include a payment or concession by one party to the
other as an incentive to enter into a lease, and this is reflected in the general level of rents
agreed, the MR should also be expressed on this basis. The nature of the incentive assumed
must be stated by the valuer, along with the assumed lease terms.
MR will normally be used to indicate the amount for which a vacant property may be let, or
for which a let property may re-let when the existing lease terminates. Market Rent is not a
suitable basis for settling the amount of rent payable under a rent review provision in a
lease, where the actual definitions and Assumptions have to be used."
Existing Use Value
Existing Use Value as defined in UK Valuation Statement 1.3 of the Red Book and applying the
conceptual framework of Market Value which is reproduced above together with the supplementary
commentary which is included in items 2 – 5 of UK VS 1.3. Under UK VS 1.3, the term "Existing Use
Value" is defined as follows:- " The estimated amount for which a property should exchange on the
date of valuation between a willing buyer and a willing seller in an arm's length transaction, after
proper marketing wherein the parties had acted knowledgeably, prudently and without compulsion,
assuming that the buyer is granted vacant possession of all parts of the property required by the
business and disregarding potential alternative uses and any other characteristics of the property that
would cause its Market Value to differ from that needed to replace the remaining service potential at
least cost".

The International Institute of Real Estate Valuation (A.C.) Ltd.
-20 -
Forced Sales
According to Clause 27 of the IVSC Standards. (Draft June 2010)
“The term “forced sale” is often used in circumstances where a seller is under compulsion to sell and a
proper marketing period is not available. The price that could be obtained in these circumstances will
depend upon the nature of the pressure on the seller and the reasons why proper marketing cannot be
undertaken. It will also reflect the consequences for the seller of failing to sell within the period
available. Unless the nature of and the reason for the constraints on the seller are known, the price
obtainable in a forced sale cannot be realistically estimated. The price that a seller will accept in a
forced sale will reflect its particular circumstances rather than those of the hypothetical willing seller in
the market value definition. The price obtainable in a forced sale has only a coincidental
relationship to market value or any of the other bases defined in this standard. A “forced sale”
is a description of the situation under which the exchange takes place, not a distinct valuation
basis.” (bold added by the undersigned).
According to RICS VS 2.3 “The term “forced sale value” must not be used.


