GEOPHYSICAL WELL-LOG ANALYSIS OF FRACTURED CRYSTALLINE ROCKS AT EAST BULL LAKE, ONTARIO, CANADA By F.L. Paillet and A.E. Hess U.S. GEOLOGICAL SURVEY Water-Resources Investigations Report 86-4052 Denver, Colorado 1986
Transcript
GEOPHYSICAL WELL-LOG ANALYSIS OF FRACTURED CRYSTALLINE
ROCKS AT EAST BULL LAKE, ONTARIO, CANADA
By F.L. Paillet and A.E. Hess
U.S. GEOLOGICAL SURVEY
Water-Resources Investigations Report 86-4052
Denver, Colorado 1986
UNITED STATES DEPARTMENT OF THE INTERIOR
DONALD PAUL HODEL, Secretary
GEOLOGICAL SURVEY
Dallas L. Peck, Director
For additional information write to:
U.S. Geological Survey Water Resources Division Mail Stop 403, Box 25046 Denver Federal Center Denver, CO 80225
Copies of this report can be purchased from:
U.S. Geological Survey Books and Open-File Reports Federal Center, Bldg. 810 Box 25425 Denver, CO 80225 [Telephone: (303) 236-7476]
CONTENTSPage
Introduction 1Description of study site 2Factors affecting logging of boreholes 6
Figure 1. Map showing location of Atomic Energy of Canada Limited f scrystalline-rock research sites 3
2. Map showing location of boreholes at the East Bull Lakeresearch site 4
3. Photograph of surface exposure of gabbro 54. Lithologic section through boreholes EBL-1 and EBL-2 75. Lithologic section through boreholes EBL-2 and EBL-4 86. Core description and composite of geophysical logs for
borehole EBL-1 97. Core description and composite of geophysical logs for
borehole EBL-2 108. Core description and composite of geophysical logs for
borehole EBL-4 119. Crossplot of acoustic transit time versus natural-gamma
activity for borehole EBL-2 1410. Histogram of acoustic transit time and natural-gamma activity
for 50-meter unfractured intervals of the four major lithologies in borehole EBL-2 15
11. Comparison of televiewer logs obtained by U.S. Geological Survey personnel and by Atomic Energy of Canada Limited personnel 17
12. Diagram showing superposition of modes in the composite waveform for a 34-kilohertz source in an 8-centimeter diameter borehole 19
13. Diagrams showing representative acoustic waveforms for each of the major lithologies given in the core description for borehole EBL-2 20
14. Televiewer and acoustic-waveform logs for an intervalin borehole EBL-4 containing a large fracture zone 22
16. Tube-wave amplitude and amplitude-deficit logs calibrated in effective fracture permeability using waveforms given in figure 14 25
17. Tube-wave amplitude-deficit log for borehole EBL-4 2618. Tube-wave amplitude-deficit log for borehole EBL-2 2719. Sparker-source waveform in unfractured rock and at shallow
depths; borehole EBL-4 2920. Change in sparker-source waveform with depth in borehole
EBL-2 showing increase in amplitude and decrease in frequency as hydrostatic head decreases 30
21. Repeat sparker-source amplitude logs computed from sparker- source waveforms showing negligible repeatability of waveforms in deeper fracture zones 31
Table 1. Geophysical logs run in September 1984, boreholes EBL-1,and EBL-4 12
Multiply SI units
meter (m)millimeter (mm)micrometer (ym)centimeter (cm)microsecond per meter (ys/m)kilometer (km)kilometers per second (km/s)
CONVERSION TABLE
By
3.2810.03937
.00000328
3.281
0.6214
To obtain inch-pound units
foot (ft)inch (in.)feet (ft)inch (in.)microseconds per foot (ys/ft)mile (mi)miles per second (m/s)
IV
GEOPHYSICAL WELL-LOG ANALYSIS OF FRACTURED CRYSTALLINE ROCKS AT EAST BULL LAKE, ONTARIO, CANADA
F. L. Paillet and A. E. Hess
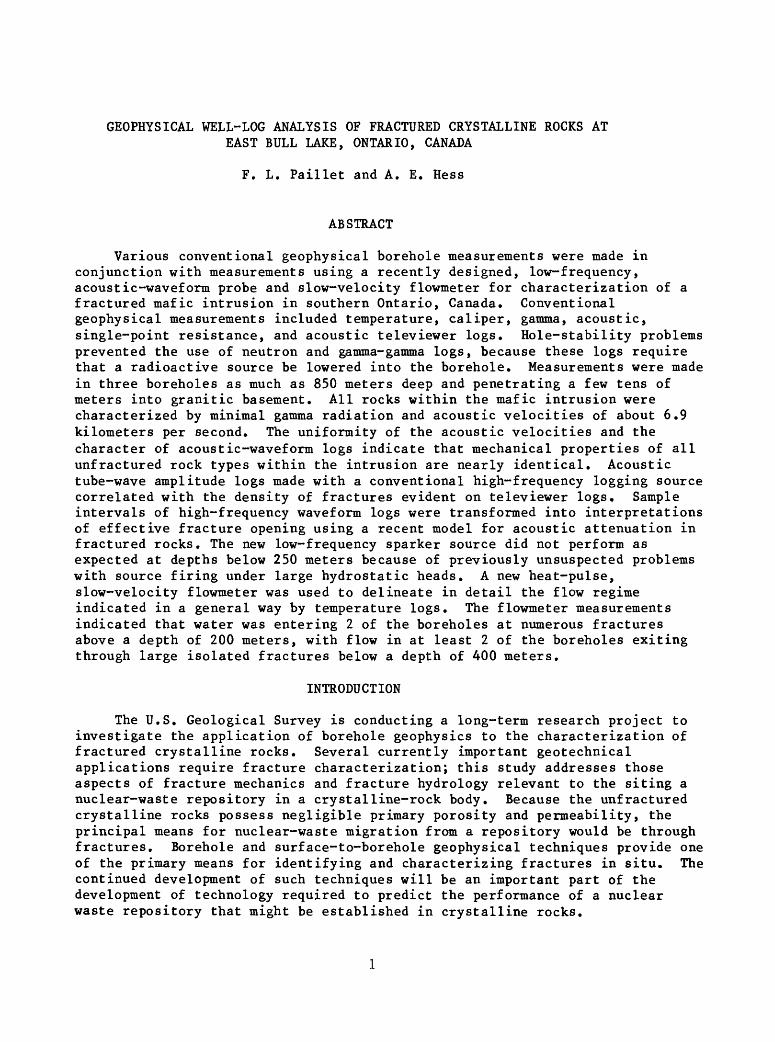
ABSTRACT
Various conventional geophysical borehole measurements were made in conjunction with measurements using a recently designed, low-frequency, acoustic-waveform probe and slow-velocity flowmeter for characterization of a fractured mafic intrusion in southern Ontario, Canada. Conventional geophysical measurements included temperature, caliper, gamma, acoustic, single-point resistance, and acoustic televiewer logs. Hole-stability problems prevented the use of neutron and gamma-gamma logs, because these logs require that a radioactive source be lowered into the borehole. Measurements were made in three boreholes as much as 850 meters deep and penetrating a few tens of meters into granitic basement. All rocks within the mafic intrusion were characterized by minimal gamma radiation and acoustic velocities of about 6.9 kilometers per second. The uniformity of the acoustic velocities and the character of acoustic-waveform logs indicate that mechanical properties of all unfractured rock types within the intrusion are nearly identical. Acoustic tube-wave amplitude logs made with a conventional high-frequency logging source correlated with the density of fractures evident on televiewer logs. Sample intervals of high-frequency waveform logs were transformed into interpretations of effective fracture opening using a recent model for acoustic attenuation in fractured rocks. The new low-frequency sparker source did not perform as expected at depths below 250 meters because of previously unsuspected problems with source firing under large hydrostatic heads. A new heat-pulse, slow-velocity flowmeter was used to delineate in detail the flow regime indicated in a general way by temperature logs. The flowmeter measurements indicated that water was entering 2 of the boreholes at numerous fractures above a depth of 200 meters, with flow in at least 2 of the boreholes exiting through large isolated fractures below a depth of 400 meters.
INTRODUCTION
The U.S. Geological Survey is conducting a long-term research project to investigate the application of borehole geophysics to the characterization of fractured crystalline rocks. Several currently important geotechnical applications require fracture characterization; this study addresses those aspects of fracture mechanics and fracture hydrology relevant to the siting a nuclear-waste repository in a crystalline-rock body. Because the unfractured crystalline rocks possess negligible primary porosity and permeability, the principal means for nuclear-waste migration from a repository would be through fractures. Borehole and surface-to-borehole geophysical techniques provide one of the primary means for identifying and characterizing fractures in situ. The continued development of such techniques will be an important part of the development of technology required to predict the performance of a nuclear waste repository that might be established in crystalline rocks.
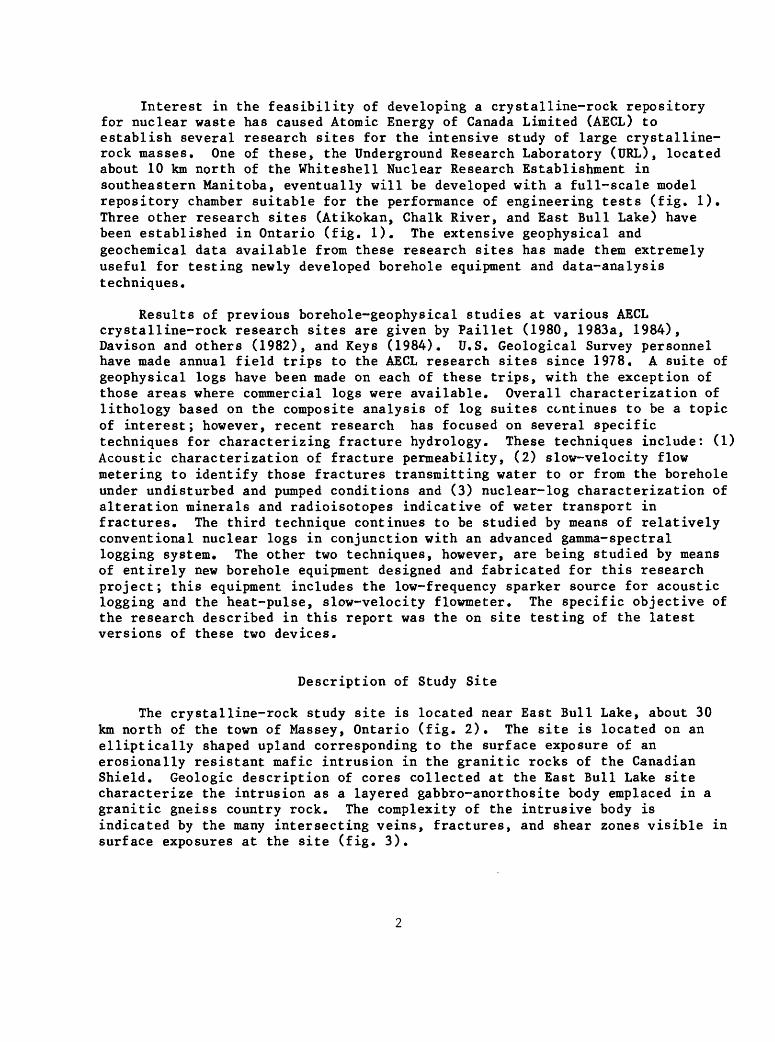
Interest in the feasibility of developing a crystalline-rock repository for nuclear waste has caused Atomic Energy of Canada Limited (AECL) to establish several research sites for the intensive study of large crystalline- rock masses. One of these, the Underground Research Laboratory (URL), located about 10 km north of the Whiteshell Nuclear Research Establishment in southeastern Manitoba, eventually will be developed with a full-scale model repository chamber suitable for the performance of engineering tests (fig. 1). Three other research sites (Atikokan, Chalk River, and East Bull Lake) have been established in Ontario (fig. 1). The extensive geophysical and geochemical data available from these research sites has made them extremely useful for testing newly developed borehole equipment and data-analysis techniques.
Results of previous borehole-geophysical studies at various AECL crystalline-rock research sites are given by Paillet (1980, 1983a, 1984), Davison and others (1982), and Keys (1984). U.S. Geological Survey personnel have made annual field trips to the AECL research sites since 1978. A suite of geophysical logs have been made on each of these trips, with the exception of those areas where commercial logs were available. Overall characterization of lithology based on the composite analysis of log suites continues to be a topic of interest; however, recent research has focused on several specific techniques for characterizing fracture hydrology. These techniques include: (1) Acoustic characterization of fracture permeability, (2) slow-velocity flow metering to identify those fractures transmitting water to or from the borehole under undisturbed and pumped conditions and (3) nuclear-log characterization of alteration minerals and radioisotopes indicative of water transport in fractures. The third technique continues to be studied by means of relatively conventional nuclear logs in conjunction with an advanced gamma-spectral logging system. The other two techniques, however, are being studied by means of entirely new borehole equipment designed and fabricated for this research project; this equipment includes the low-frequency sparker source for acoustic logging and the heat-pulse, slow-velocity flowmeter. The specific objective of the research described in this report was the on site testing of the latest versions of these two devices.
Description of Study Site
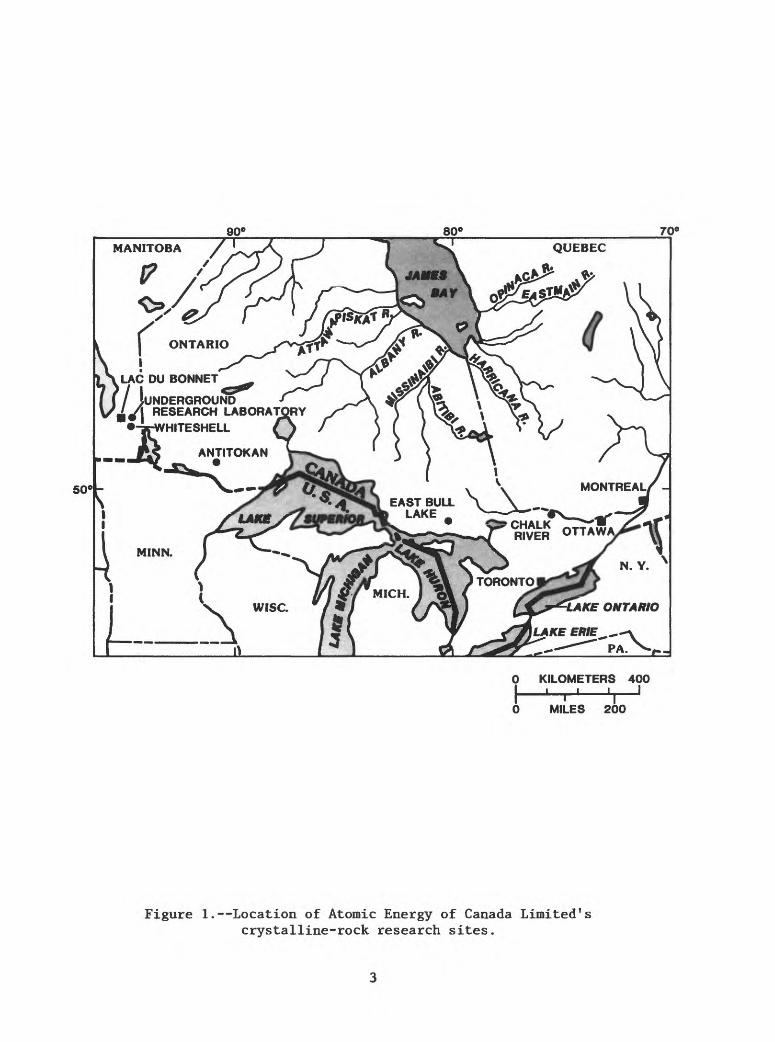
The crystalline-rock study site is located near East Bull Lake, about 30 km north of the town of Massey, Ontario (fig. 2). The site is located on an elliptically shaped upland corresponding to the surface exposure of an erosionally resistant mafic intrusion in the granitic rocks of the Canadian Shield. Geologic description of cores collected at the East Bull Lake site characterize the intrusion as a layered gabbro-anorthosite body emplaced in a granitic gneiss country rock. The complexity of the intrusive body is indicated by the many intersecting veins, fractures, and shear zones visible in surface exposures at the site (fig. 3).
90° 80° 70°
50°-
NDERGROUND | RESEARCH LABORAT
HITESHELL
0 KILOMETERS 400
MILES 200
Figure 1. Location of Atomic Energy of Canada Limited's crystalline-rock research sites.
0 METERS 500 H CONTOUR INTERVAL IS 10 METERS.
DATUM IS SEA LEVEL.
50°
ELLIOT \o/ «SUDBURY LAKE* «MASSEY
46° -
0 KILOMETERS 300I ' I ' I
0 MILES 200
80°
Figure 2. Location of boreholes at the East Bull Lake research site
0 10 20 30 40 CENTIMETERS
Figure 3. Surface exposure of gabbro
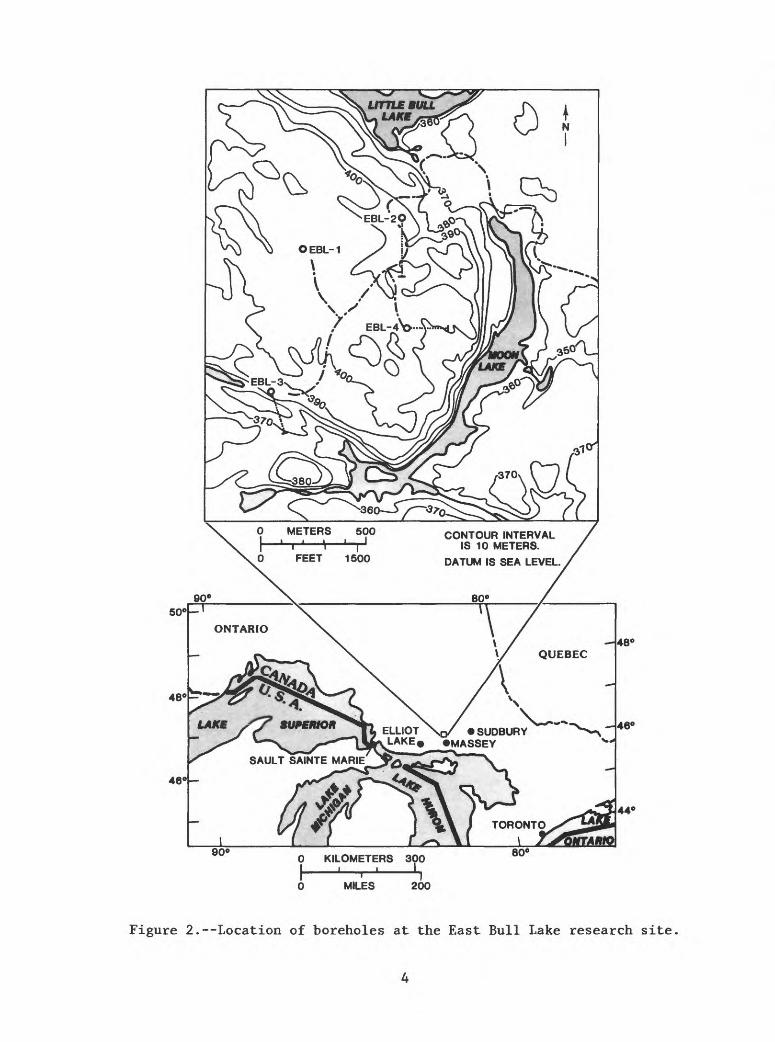
Lithologic sections (figs. 4 and 5) indicate the gross lithology of the mafic intrusion penetrated by four deep boreholes. One of these boreholes, EBL-1, was drilled vertically to penetrate through the entire intrusion into the underlying gneiss. The other three boreholes were drilled at about 15° from the vertical to intersect the subsurface projections of various lineaments and suspected fault zones identified in surface exposures and from aerial surveys. Preliminary descriptions of the fracture distributions and lithologies of the four East Bull Lake core holes are given by Raven and others (1984) and Ejecham and others (1985).
Factors Affecting Logging of Boreholes
Four deep, 8-cm diameter boreholes (EBL-1, EBL-2, EBL-3, and EBL-4) were available for logging at the East Bull Lake site during September 6-19. 1984. Reports of instability in all of the deep boreholes, and especially in borehole EBL-3, resulted in a mutual agreement with AECL personnel that radioactive sources would not be used in any of the boreholes. We also decided that EBL-3 would not be logged at all because of the extensive problems reported by the drillers for this particular borehole. These restrictions severely limited our ability to use nuclear logs to characterize lithologies, but the restrictions had little effect on the proposed objective of field testing the low-frequency sparker source and the heat-pulse, slow-velocity flowmeter. The entire depth of borehole EBL-1 could not be logged because a packer had become stuck in this borehole at a depth of about 650 m preventing access to the lowermost lithologic contact in the borehole.
GEOPHYSICAL LOGS AND COMPOSITE LOG ANALYSIS
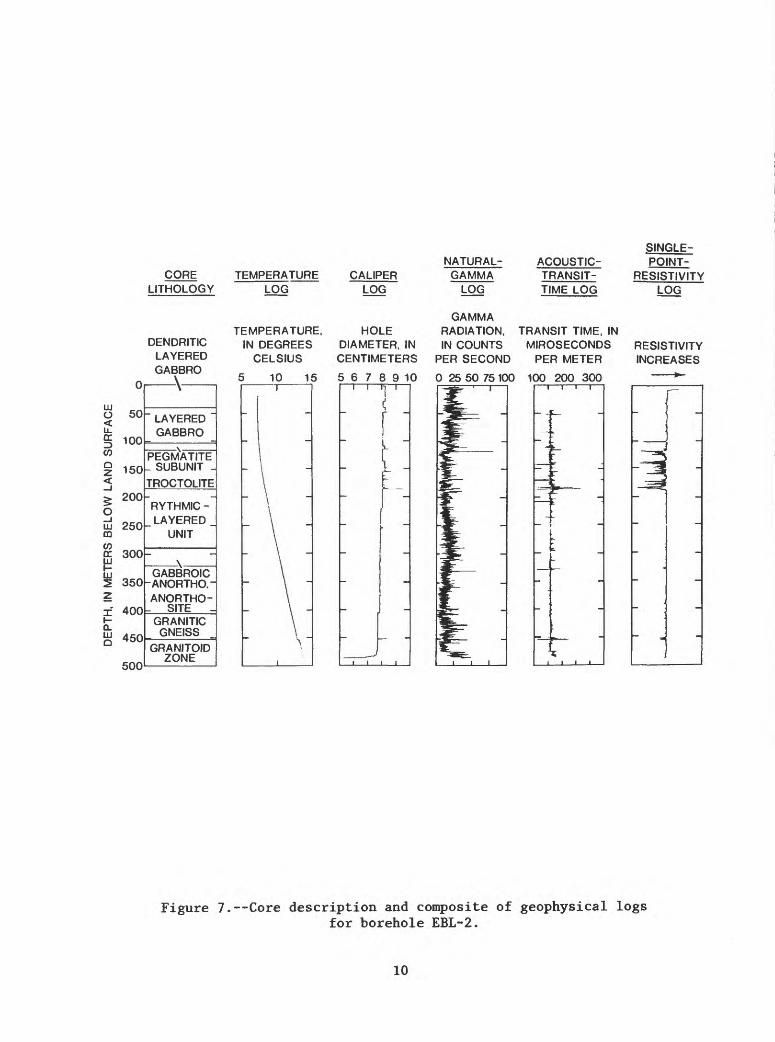
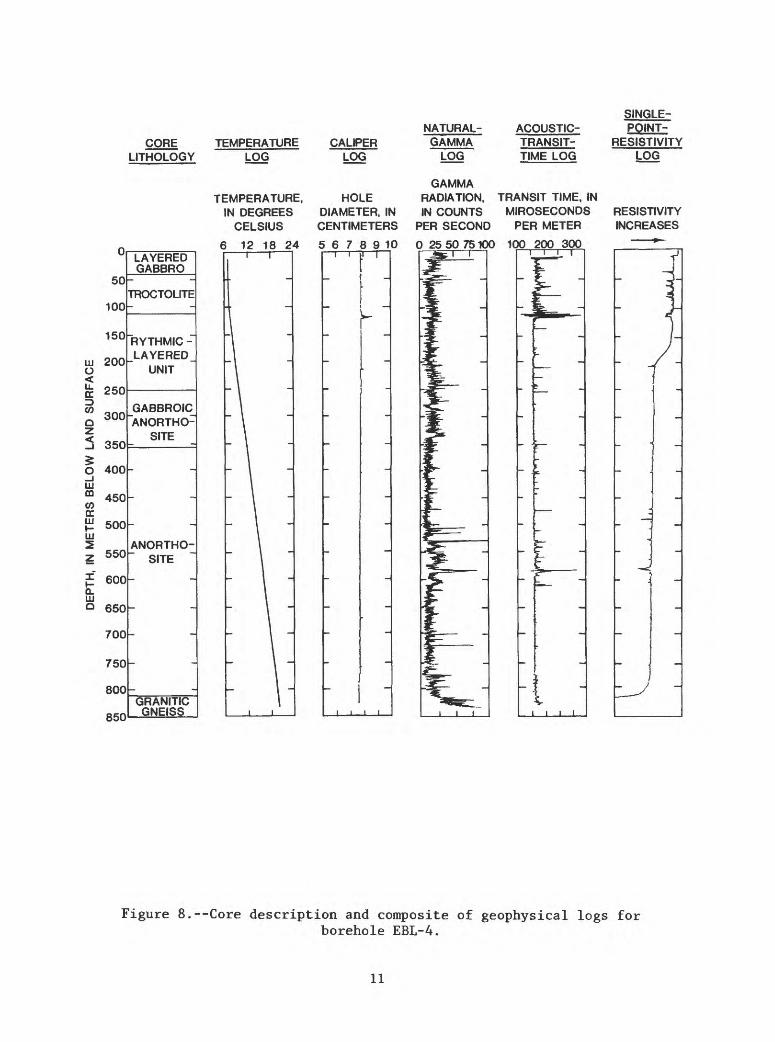
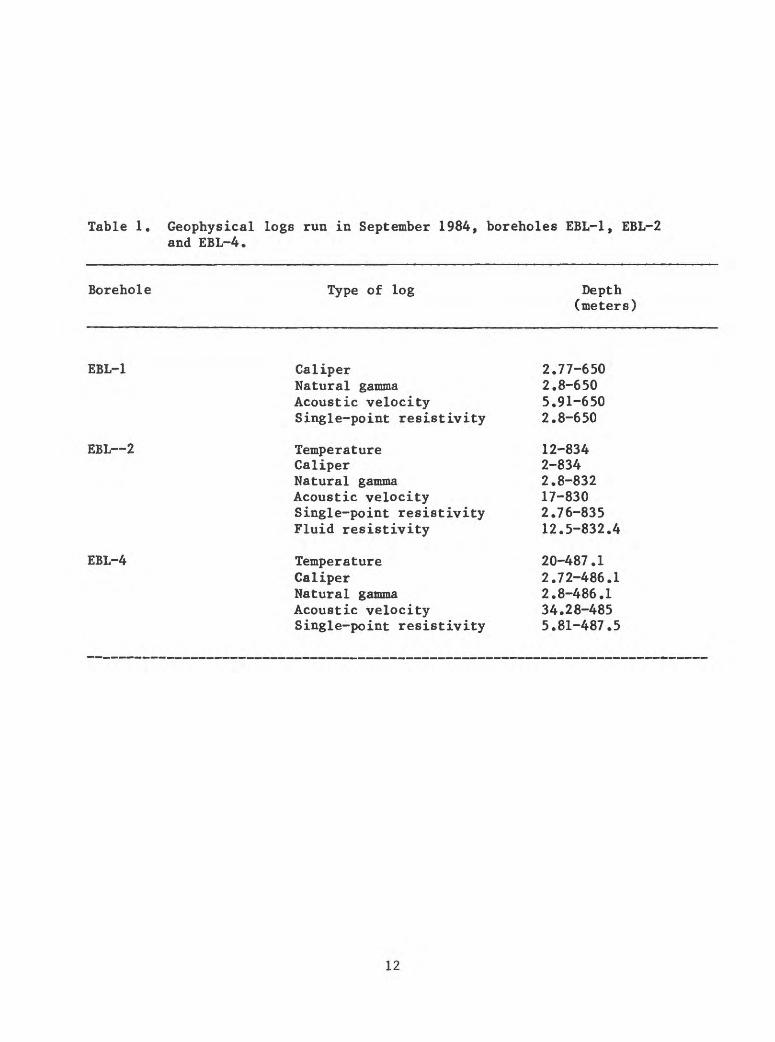
A summary of the geophysical logs run during the 1984 field trip to the East Bull Lake research site is given in table 1. The temperature, caliper, natural-gamma, acoustic-transit-time, and single-point-resistivity logs for the three boreholes logged during this trip are given in figures 6 through 8. Lithologic descriptions given in the figures are based on visual inspection of the core; these descriptions are from Raven and others (1984) and Ejecham and others (1985). Of these logs, only the natural-gamma, acoustic-transit-time, and single-point-resistivity logs have data related to specific rock type. In spite of the expected substantial iron content in the gabbroic intrusion, the single-point resistivity log appears to respond primarily to fractures and to alteration minerals (clays) associated with t'lese fractures. Background resistivity of the unfractured intrusion appears to be uniformly substantial. Apparently no continuous current path is provided by the iron content in the gabbro. Anomalies in the single-point resistivity log were found to always correspond to fractured and altered rock and could be used to identify fracture zones prior to televiewer logging. Many fractures and fracture zones were identified by means of acoustic-transit-time and single-point-resistivity logs, and most of these fractures were verified on televiewer logs.
Of the logs indicated in table 1, only the natural-gamma and acoustic- transit-time logs appear to respond to lithology. Trends in these logs in figures 6 through 8 further indicate that all rock types within the intrusion are characterized by minimal natural-gamma activities and rapid acoustic transit time. Natural-gamma activity appears to remain below 40 (counts per second) throughout the intrusion, except in the vicinity of small pegmatites.
EBL1LAYERED GABBRO
EBL4
RYTHMIC - LAYERED UNIT
900
FEET 1000
Figure 4. Lithologic section through boreholes EBL-1 and EBL-2
EBL2 EBL4
RYTHMIC - LAYERED UNIT
GABBROIC ANORTHOSITE
900
FEET 1000
Figure 5. Lithologic section through boreholes EBL-2 and EBL-4
CORE LITHOLOGY CALIPER LOG
NATURAL- GAMMA LOG
ACOUSTIC- TRANSIT- TIME LOG
SINGLE-POINT- RESISTIVITY
LOG
MASSIVE GABBRO LAYERED GABBRO
DENDRITIC GABBRO
50
100
Uj 150 O
200
Q2 250
300
350
O_iUJ OQ
w ccUJ
uj 400
x- 450
Q.
Q 500
550
600
650
LAYERED _ GABBRO
TROCTOLITE
RYTHMIC -LAYERED
UNIT
- GABBROIC - ANORTHOSITE
ANORTHOSITE
STUCK '
PACKER
HOLE DIAMETER, IN CENTIMETERS
5 6 7 8 9 10\ \ (I I
GAMMARADIATION, TRANSIT TIME, IN IN COUNTS MICROSECONDS
PER SECOND PER METER
25 50 75 100 100 200 300
RESISTIVITY INCREASES
I__I
Figure 6. Core description and composite of geophysical logs forborehole EBL-1.
CORE LITHOLOGY
TEMPERATURE LOG
CALIPER LOG
NATURAL- GAMMA
LOG
ACOUSTIC- TRANSIT- TIME LOG
SINGLE-POINT-
RESISTIVITYLOG
DENDRITIC LAYERED GABBRO
TEMPERATURE, IN DEGREES
CELSIUSf * r\ *. r-
HOLE DIAMETER, IN CENTIMETERS
GAMMA RADIATION, IN COUNTS
PER SECOND
10 15
TRANSIT TIME, INMIROSECONDS
PER METER
7 8 9 10 0 25 50 75 100 100 200 300
RESISTIVITY INCREASES
\j
HI0 50L_§ 100 eo
i 150
^ 200Oid 250CO
eo cc 300
2 350Z
I 400
Q.Hi 450
Ann
\
" LAYERED "
GABBRO.
PEGMATITE _ SUBUNIT _
TROCTOLITE
"RYTHMIC-"LAYERED _
UNIT
\GABBROIC
-ANORTHO.-ANORTHO-
- SITE -GRANITIC
GNEISS
GRANITOID ZONE
i
i -
T
Figure 7. Core description and composite of geophysical logsfor borehole EBL-2.
10
CORE LITHOLOGY
TEMPERATURE LOG
CALIPER LOG
NATURAL- GAMMA
LOG
ACOUSTIC- TRANSIT- TIME LOG
0
50
100
150
UJ 200 O<C 250
"300
z3 350
O 400UJm
TROCTOLITE
CO
UJ2
450
500
550
E 600 Q.UJ0 650
700
750
800
850
LAYERED GABBRO
RYTHMIC -LAYERED
UNIT
GABBROICANORTHO1
SITE
ANORTHO- SITE
GRANITIC GNEISS
TEMPERATURE, HOLEIN DEGREES DIAMETER, IN
CELSIUS CENTIMETERS
6 12 18 24 5 6 7 8 9 10
GAMMARADIATION. TRANSIT TIME, IN IN COUNTS MIROSECONDS
PER SECOND PER METER
0 25 50 75100 100 200 300
RESISTIVITY INCREASES
_|
Figure 8. Core description and composite of geophysical logs forborehole EBL-4.
11
Table 1. Geophysical logs run in September 1984, boreholes EBL-1, EBL-2 and EBL-4.
EBL-4 Temperature 20-487.1Caliper 2.72-486.1Natural gamma 2.8-486.1Acoustic velocity 34.28-485Single-point resistivity 5.81-487.5
12
Acoustic transit time through the unfractured rocks is between 140 and 145 y s/m corresponding to an acoustic velocity of about 6.9 km/s. This is an unusually fast velocity for the transmission of sound through shallow continental rocks. Typical granitic rocks would not transmit sound at such a velocity without a lithostatic confining pressure equivalent to several kilometers of depth. However, the dense gabbroic rocks of the East Bull Lake intrusion should transmit sound at velocities somewhat faster than those through granite from the known correlation of acoustic velocity with bulk density.
The possibility that different rock types within the intrusion given by Raven and others (1984) might be differentiated on the basis of natural-gamma and acoustic-transit-time logs was investigated by crossplotting acoustic transit time versus natural-gamma activity for the entire depth of borehole EBL-2 (fig. 9). No clear tendency of the points to cluster in different parts of the plot occurs, as would expected if different lithologies had distinctly different natural-gamma activities and acoustic velocities. The scatter of points towards faster transit times might be accounted for by fractures, and by associated alteration minerals in the vicinity of fractures. The scatter towards greater natural-gamma activities similarly might be accounted for by the presence of pegmatites, especially in the vicinity of the anorthosite- granitic gneiss contact at the base of the intrusion. Only borehole EBL-1 penetrates more than 50 m into the granitic-gneiss basement, but the lower part of that borehole was unavailable for logging because of a stuck packer at a depth of 650 m. It is possible that a second cluster of points at slightly slower acoustic transit time and substantially greater natural-gamma activity would have appeared if the borehole had been extended some distance into the underlying granitic gneiss.
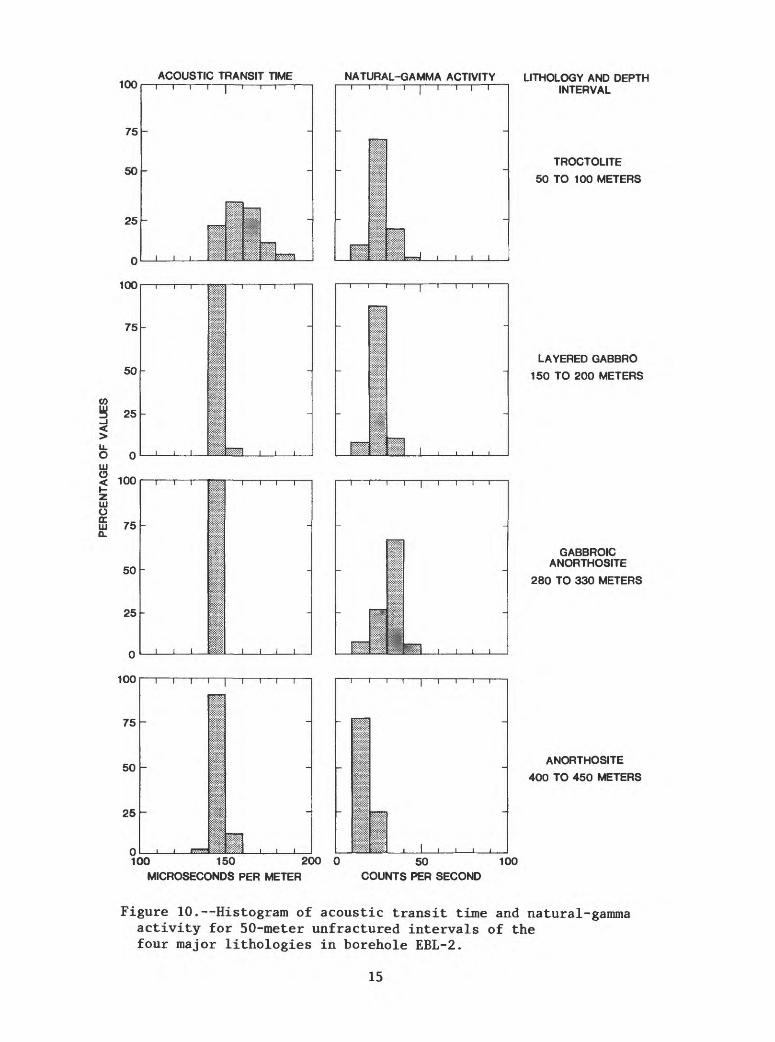
Although the acoustic-transit-time and natural-gamma logs do not seem to distinguish between the lithologies within the intrusion, the validity of the crossplot in figure 9 was investigated by plotting histograms for 50-m intervals of each lithology given by Raven and others (1984) for borehole EBL-2. Intervals for the histogram were selected to be free of major fracture zones and, therefore, to be located away from contacts with other rock types. Histograms are given for troctolite, layered gabbro, gabbroic anorthosite, and anorthosite (fig. 10). The histograms for acoustic transit time indicate values generally within the range of 140 to 150 ys/m for all but the troctolite, where values are within the range of 140 to 170 ys/m. This greater range in values for troctolite may indicate a greater range in mechanical properties for unfractured rock; however, the value range more probably results from variation in the extent of fine macroscopic and microfractures at the relatively shallow depth of the troctolite layer in borehole EBL-2.
The histograms of natural-gamma activity also indicate little difference in natural-gamma activity among the different rock types identified within the intrusion by Raven and others (1984). There is an increase in natural- gamma activity towards the bottom of all three of the boreholes logged (figs. 7 and 8); it is assumed that natural-gamma counts would level off at still greater values if the boreholes had extended farther into the granitic gneiss. It also is assumed that many of the local peaks in natural-gamma activity within the intrusion are associated with pegmatites, although this assumption cannot be verified until a detailed core description has been made
13
100
OoLU W
|Ooz
> 50
20 30 40 50 60 70 80 90 100 110
ACOUSTIC TRANSIT TIME, IN MICROSECONDS PER METER
120
Figure 9. Crossplot of acoustic transit time versus natural-gammaactivity for borehole EBL-2.
14
ACOUSTIC TRANSIT TIME1001 , i , , | , , , r
CO
75
50
25
0
100
75
50
25
u.O 0UJ
S 100
UJ O
£ 75 0.
50
25
NATURAL-GAMMA ACTIVITY LITHOLOGY AND DEPTHINTERVAL~" ' I
i i i i
TROCTOLITE
50 TO 100 METERS
LAYERED GABBRO
150 TO 200 METERS
GABBROIC ANORTHOSITE
280 TO 330 METERS
100
75
50
25
i i i i i i r
0100 150
ANORTHOSITE
400 TO 450 METERS
MICROSECONDS PER METER200 0 50
COUNTS PER SECOND100
Figure 10. Histogram of acoustic transit time and natural-gamma activity for 50-meter unfractured intervals of the four major lithologies in borehole EBL-2.
15
available. The only other apparent difference is the slightly greater natural- gamma activity of the gabbroic anorthosite compared to that of the anorthosite, which possibly is related to a slightly greater potassium-feldspar content in the gabbroic anorthosite.
TEMPERATURE LOGS
Temperature logs were run before all other logs in boreholes EBL-2 and EBL-4. However, borehole EBL-1 had been extensively disturbed by large diameter geophysical probes just prior to our work in that borehole. Because of time constraints, and because a temperature log might not be valid in a borehole so recently disturbed, we decided to eliminate the temperature log on borehole EBL-1. Temperature logs illustrated in figures 6 and 7 generally display a series of small anomalies or changes in slope in the upper fracture zones, and a few anomalies that corresponding to the depths of major fractures, toward the bottom of both boreholes. Because the East Bull Lake research site is located on a relatively high plateau, we assumed that recharge conditions prevail, and that the hydraulic head of water in fractures decreases with depth. Recharge conditions in the upper 50 m of fractured rock were likely to have existed during logging because southern Ontario had been subjected to prolonged and intense rainfall. Therefore, it was assumed that the boreholes EBL-2 and EBL-4 had short circuited the hydraulic-head differences between upper and lower fracture zones by allowing water to flow down the boreholes. This hypothesis cannot be proven on the basis of temperature logs alone, but it provided a logical set assumptions for planning the extensive flow-meter logging to be discussed in subsequent sections of this report.
ACOUSTIC-TELEVIEWER LOGS
The acoustic televiewer is a useful device for fracture characterization, and AECL researchers have become deeply involved in developing their own televiewer capability. Some aspects of current televiewer technology are still dependent on operator experience, especially in setting adjustments to optimize fracture resolution. There is no simple set of universal rules governing these settings, so that the operator varies gain factors and window parameters until the televiewer output appears optimum.
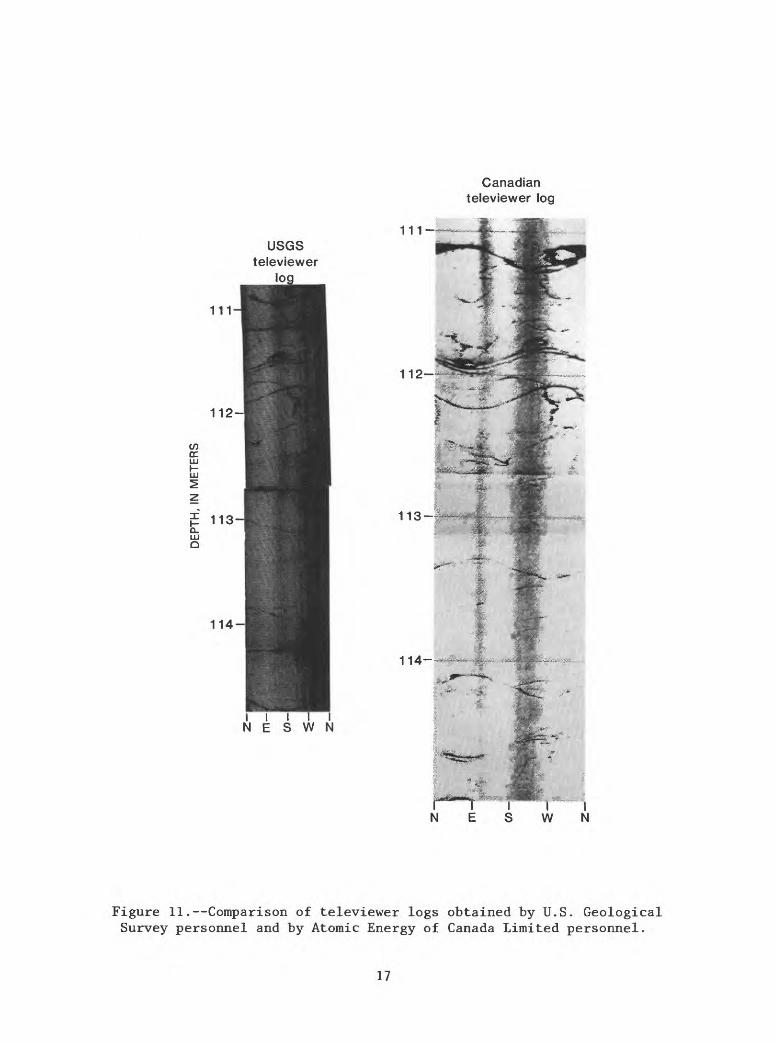
All of the boreholes at the East Bull Lake research site had been independently logged with the AECL televiewer prior to our field trip. Therefore, we were interested in comparing our operator-optimized televiewer logs with those obtained by AECL researchers. A comparison of the two televiewer logs for a representative interval in borehole EBL-4 is given in Figure 11. Both logs show the effects of logging-tool decentralization, producing a variation in quality of log output along the circumference of the borehole. The effect appears more severe for the U.S. Geological Survey log because the glossy photographic film used to print the log produces dark prints when the film is underexposed. Although a difference in scale occurs related to different modes of printing the televiewer logs, the resolution in the two logs is similar. A small but detectable difference in orientation of the televiewer logs also occurs, and is possibly related to a difference in magnetometer calibration.
16
Canadian televiewer log
111-USGS
televiewer
111
l I IN E S W N
112-
113-
114-
N E S W N
Figure 11.--Comparison of televiewer logs obtained by U.S. Geological Survey personnel and by Atomic Energy of Canada Limited personnel.
17
ACOUSTIC-WAVEFORM LOGS
Acoustic waveform logs, in which the complete waveforms produced by a conventional acoustic logging probe are digitally recorded, have become a primary fracture characterization technique in geophysical well logging. Applications of waveform logs to fracture detection and interpretation have been presented by Christensen (1964), Albright and others (1980), Paillet (1980, 1981, and I983b), and Paillet and White (1982). Much of the early work on characterization of fractures using waveform logs assumed that attenuation and reflection of compressional and shear waves were the primary mechanisms for fracture interaction with the acoustic wave train (Christensen, 1964; Albright and others, 1980). Paillet (1980) noted that the amplitude of tube-wave mode was especially sensitive to fracture permeability, and that this attenuation probably could be calibrated in a manner similar to that derived for primary porosity by Rosenbaum (1974). This calculation recently has been made by Mathieu (1984).
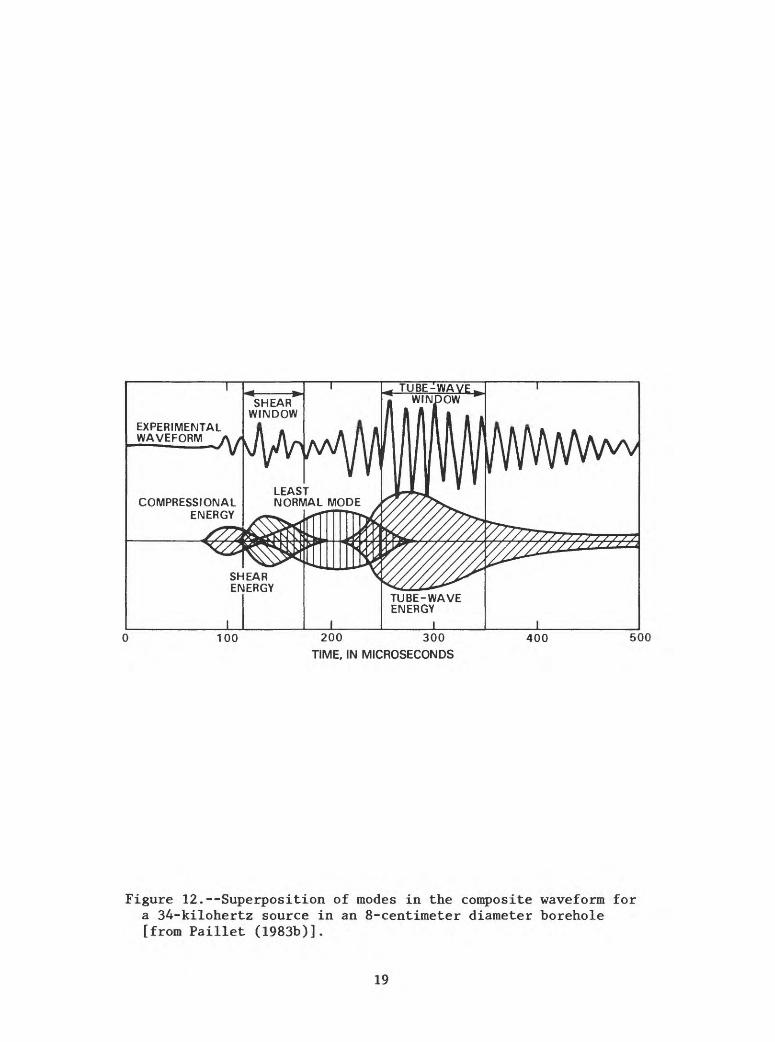
The tube-wave mode in fluid-filled boreholes was first described in detail by Biot (1952). Paillet and White (1982) and Cheng and Toksoz (1981) show that relative excitation of the tube wave is dependent on the width of the annulus between the cylindrical logging tool and the borehole wall. Above a certain frequency that depends on annulus width, the waveforms become dominated by the multiple reflected modes described by Biot (1952). These so-called normal modes or Pseudo-Rayleigh waves do not depend nearly as much on wall permeability as the tube wave and they are greatly affected by small changes in borehole-wall rugosity. Because conventional acoustic logging probes provide source frequencies in the range of from 10 to 30 kHz (kiloHertz), the annulus width must be less than a few centimeters wide to provide significant excitation of the tube-wave mode. If the annulus is kept within this range, then energy superposition in the composite waveform is as illustrated in figure 12 and tube-wave amplitude is easily measured by gating the late arriving part of the waveform.
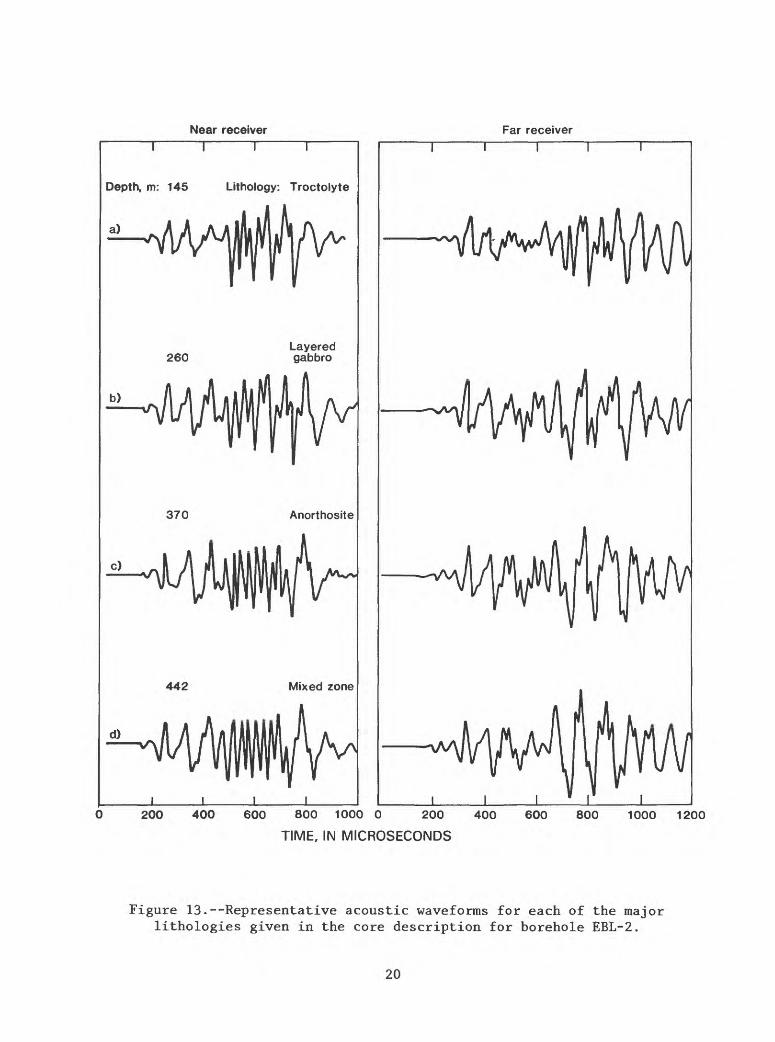
The acoustic-transit-time logs discussed earlier in this report indicated that all rock types within the East Bull Lake intrusion had nearly the same acoustic velocity (6.9 km/s). Acoustic-waveform logs consisting of complete digital waveform records also were obtained; they indicate whether shear velocity and overall waveform character also are constant throughout unfractured intervals within the intrusion. Near- and far-receiver waveforms for representative unfractured zones within each of the four rock types noted on core are illustrated in figure 13. Acoustic velocities determined from the waveform record agree very well with those determined using the acoustic transit-time log. Shear velocity and waveform character also appear very similar throughout unfractured parts of the intrusion. The overall similarity of the shear velocity and waveform character indicate that the mechanical properties (compressional strength, shear modulus, and Poisson ratio) are nearly constant throughout unfractured parts of the intrusion.
18
EXPERIMENTAL WAVEFORM
COMPRESSIONAL ENERGY
100 200 300
TIME, IN MICROSECONDS
400 500
Figure 12. Superposition of modes in the composite waveform for a 34-kilohertz source in an 8-centimeter diameter borehole [from Paillet (1983b)].
19
Near receiver Far receiver
Depth, m: 145 Lithology: Troctolyte
a)
260Layered gabbro
b)
370 Anorthosite
c)
442 Mixed zone
d)
200 400 600 800 1000 0 200
TIME, IN MICROSECONDS
400 600 800 1000 1200
Figure 13.--Representative acoustic waveforms for each of the major lithologies given in the core description for borehole EBL-2.
20
Acoustic-waveform logs were run for the entire depth of boreholes EBL-1, EBL-2, and EBL-4, with the exception of that part of borehole EBL-1 below the stuck packer. An example of the apparent correlation between acoustic- waveform amplitude and fracture permeability as indicated by the acoustic- televiewer log is illustrated in figure 14; the waveforms from a part of borehole EBL-4 containing a major fracture zone at a depth of about 452 m also are illustrated in figure 14. The attenuation of tube-wave energy in the vicinity of the major fracture zone is nearly complete. This fracture zone subsequently was shown to be receiving flow from the upper parts of the borehole under regional recharge conditions. Inspection of waveforms indicated that the tube wave in unfractured intervals was much more regular and repeatable in the far-receiver waveform. This regularity and repetition was attributed to the rapid acoustic velocity in gabbro, which does not allow the tube wave to assume its far-field form by the time it has reached the near receiver. Therefore, far-receiver waveforms were used for most of the waveform-amplitude calculations described in this report.
Calibration of tube-wave amplitude attenuation in terms of effective fracture permeability determined from hydraulic-test data is described by Paillet (1983b). That calibration procedure was based on correlating the average amplitude deficit within a certain depth interval of a borehole with independent measurements of permeability provided by packer-injection tests for the same depth interval. Theoretical estimates of tube-wave attenuation resulting from a single fracture intersecting the borehole recently have been developed by Mathieu (1984). The predicted permeability values are given in effective single fracture aperture using the parallel plate model described by Long (1985) and Snow (1969). An example of the predicted tube-wave attenuation as a function of hydraulically effective fracture width is given in figure 15. Theoretical results in the figure were made under conditions appropriate for the high-frequency logging tool used in this study. Note that the sensitivity of the tube-wave attenuation to fracture width is greatest in the interval from 100 to 500 ym. Within this range of fracture width (equivalent to the range from about 5 to 85 percent amplitude attenuation), a nearly linear relationship exists between permeability or fracture width and amplitude attenuation. Outside of this range of fracture width, the relationship becomes non-linear, and the senstivity to fracture width is very poor. The fracture permeability model used here is described in detail by Mathieu (1984).
Two important aspects of this work should be emphasized. First, an equivalent single-fracture aperture is based on a fracture model consisting of a planar layer of fluid between two semi-infinite rock bodies. Real fractures are much more complex, and probably consist of intersecting channels between two irregular rock faces with many contact points. At low frequencies, a simple relationship exists between permeability, in darcys, and equivalent single-fracture aperture (Long, 1985, Davison, 1980, Snow, 1969). Equivalent single-fracture apertures will be used here as the primary units of permeability for consistency with Davison (1980) and Paillet (1983b). The conversion from single-fracture aperture to conventional porous-medium
21
Televiewer Acoustic waveform log
450
CJ
LLcc.D C/5Q
<
CQ
C/5 DC
LU
QL LLJ Q
460-
470-
200 400 600 800 1000
TIME, IN MICROSECONDS
1200
Figure 14. Televiewer and acoustic-waveform logs for an interval in borehole EBL-4 containing a large fracture zone.
22
permeability units is discussed by Mathieu (1984) and Davison (1980). A second important aspect of this work is that the Mathieu (1984) permeability model is based on amplitude attenuation, whereas the tube-wave amplitude-deficit log described by Paillet (1980, 1983b) is based on the decrease in mean square wave energy in a certain gated window. Details involved in making the conversion are given by Mathieu (1984).
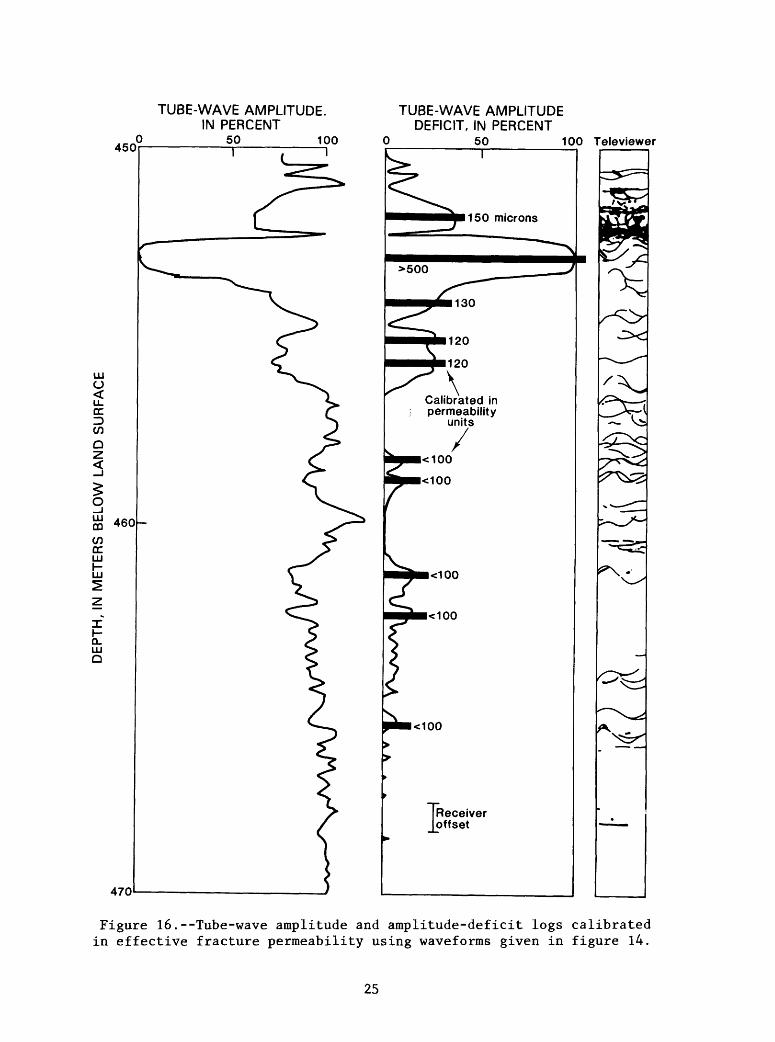
The relationship between tube-wave amplitude attenuation and effective fracture width illustrated in figure 15 was then used to express the tube-wave attenuation evident in figure 14 in terms of the attenuation that would be produced by a single fracture of a given aperture located between the source and receiver. This expression necessarily is an oversimplification because the televiewer log in figure 14 indicates that the source-receiver separation usually spans multiple fracture sets as the logging tool is being pulled through the fracture zone. To translate tube-wave amplitude attenuation into permeability expressed as effective single-fracture aperture, tube-wave amplitude deficits for each waveform were calculated according to the procedure given by Paillet (1983b). The resulting plot of amplitude deficits for the waveform interval in figure 14 is given in figure 16. Because a source-receiver separation of about 1 m occurs in this logging tool, the amplitude-deficit log is considered as a series of discrete delta functions of fracture permeability convolved with a 1-m wide step function. The amplitude- deficit log in figure 16 has, therefore, been deconvolved into a series of discrete delta functions of permeability. The percent amplitude deficits in these delta functions then can be directly related to effective single- fracture permeability according to the trend in figure 15. Using that relationship, many of the amplitude-deficits calibrate to permeabilities of a few hundred micrometers of equivalent single-fracture width.
The large fracture zone near the top of the interval gives an effective fracture permeability well in excess of 500 |im. This fracture zone apparently is so permeable that almost all tube-wave amplitude is attenuated, and the tube-wave amplitude log is not very sensitive to such large permeabilities. This lack of sensitivity is one of the major limitations of the high- frequency, tube-wave logging procedures: the high frequencies do not provide waveforms that can resolve the maximum permeabilities likely to be encountered in the major fracture zones. Much lower logging frequencies are required to achieve this resolution according to the calculations given by Mathieu (1984). This requirement represents the primary motivation behind the current emphasis on development of the low-frequency sparker source for acoustic logging (Paillet, 1984).
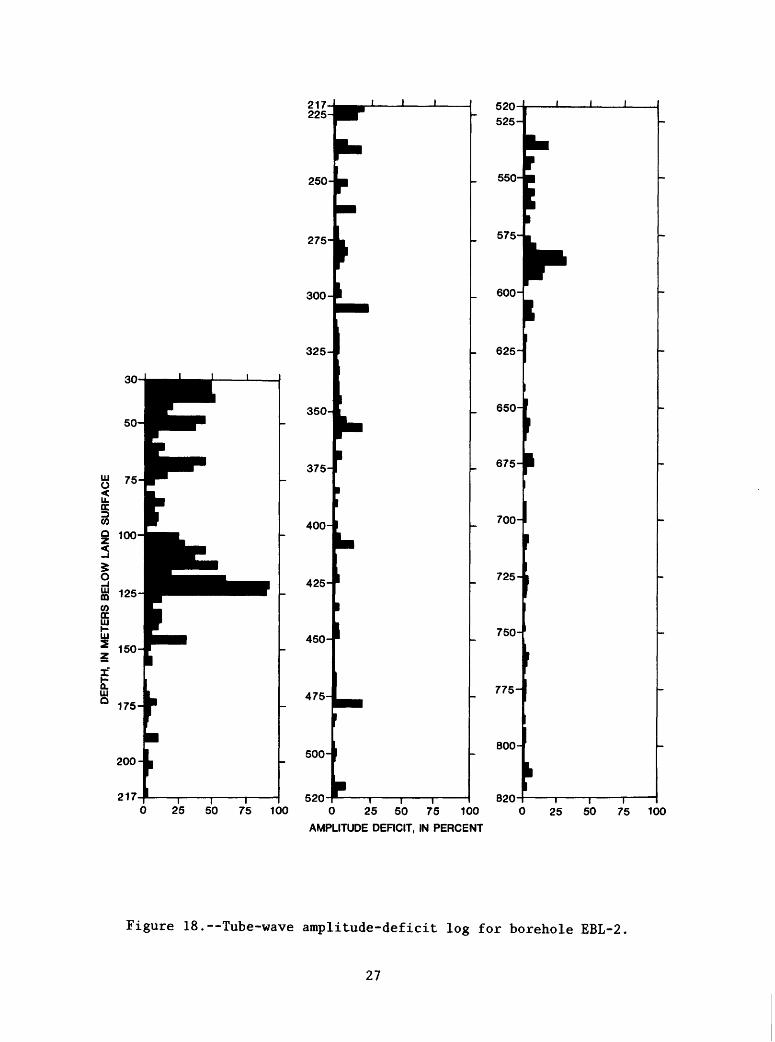
The theoretical relation of tube-wave attenuation to fracture width given in figure 15 cannot be checked until packer tests of fracture permeability are run in the East Bull Lake boreholes. Averaged tube-wave amplitude-deficit logs were run for the full depth range of boreholes EBL-2 and EBL-4. These amplitude-deficit logs are given in figures 17 and 18. All plotted deficits represent averages for 3-m intervals selected to approximately correspond to intervals that might be used in future packer-injection tests. Although no data are available to corroborate the relationship between amplitude deficit and permeability, the peaks in amplitude deficit correspond to the major fracture zones identified on core by Raven and others (1984).
23
100
200 400 600
FRACTURE WIDTH, IN MICROMETERS
800 1000
Figure 15.--Relation of tube-wave amplitude attenuation to effective fracture width.
24
450
TUBE-WAVE AMPLITUDE.IN PERCENT
0 50 100
TUBE-WAVE AMPLITUDEDEFICIT, IN PERCENT
0 50 100 Televiewer
LJU O<LJL OC D C/3
LU CD
C/3 DC LU
LU
I
d. LU Q
460-
470
Calibrated inpermeability
units
Figure 16.--Tube-wave amplitude and amplitude-deficit logs calibrated in effective fracture permeability using waveforms given in figure 14.
187- 200-
375
400
425
450
468
25 50 75 100 0 25
AMPLITUDE DEFICIT, IN PERCENT
50 75 100
Figure 17. Tube-wave amplitude-deficit log for borehole EBL-4,
26
217- 225-
250-
275-
300-
325-
350-
375-
400-
425-
450-
475-
500-
l i
520-
520- 525-
55C
575-
600-
625-
650-
675-
700-
725-
750-
775-
800-
J____I____I
25 50 75 100-I i i 820-
25 50 75 100 0
AMPLITUDE DEFICIT, IN PERCENT
25 50 75 100
Figure 18.--Tube-wave amplitude-deficit log for borehole EBL-2
27
SPARKER-SOURCE WAVEFORMS
Initial field tests of a sparker-source acoustic-logging system at the URL in Manitoba are described by Paillet (1984). The sparker source was found to provide a repeatable signal with a centerband frequency of about 5 kHz in small diameter boreholes. The sparker-source firing system uses a bank of capacitors to discharge across the gap of a conventional automobile spark plug. Firing frequency is kept slow to allow time for capacitor recharge. Source- receiver spacing is increased to provide about the same number of acoustic wavelengths as provided by the high-frequency logging tool.
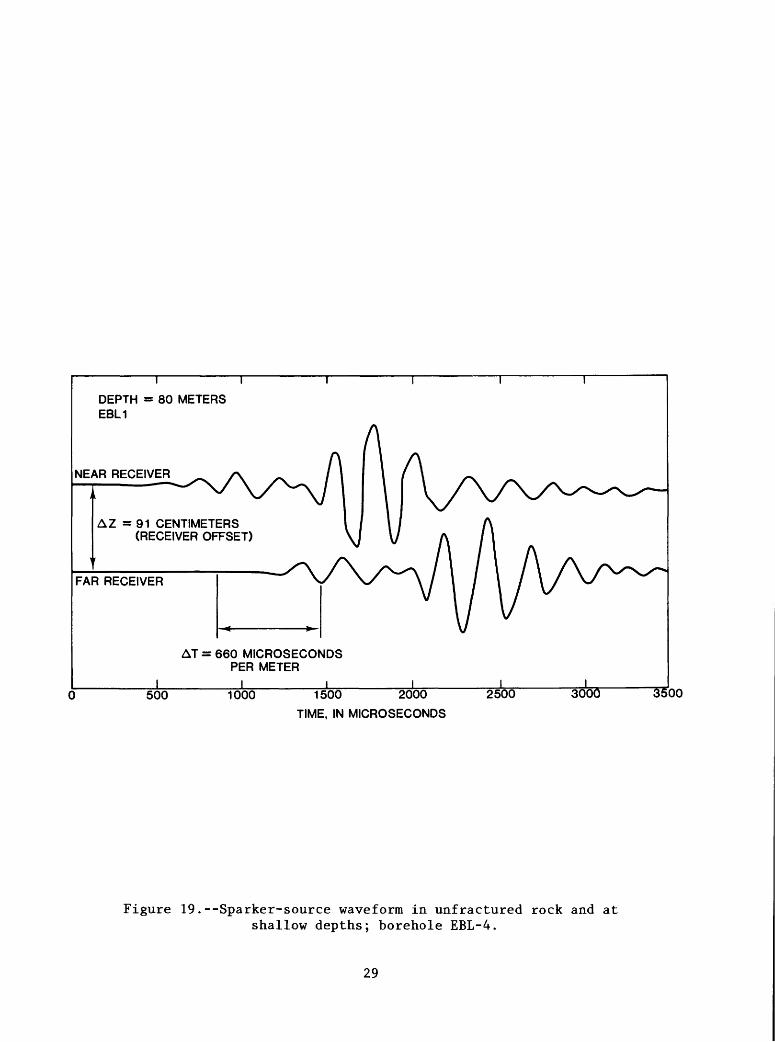
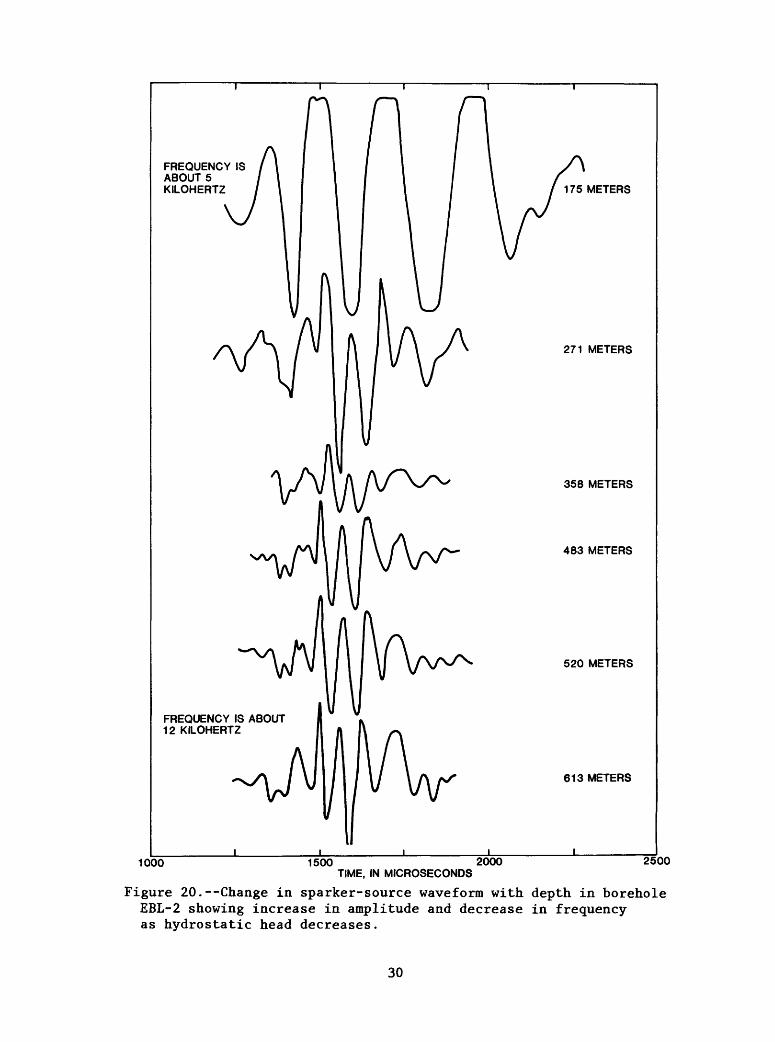
Although the seismic velocities of the mafic rocks at the East Bull Lake site are much faster than the seismic velocities of the granitic rocks at URL, the waveforms obtained with the sparker source at relatively shallow depths in borehole EBL-2 compare very closely with the waveforms obtained in the same diameter boreholes at URL. In both cases, the waveforms are completely dominated by large, low-frequency tube waves (fig. 19). However, it was decided to concentate on the investigation of some of the deeper fracture zones in boreholes EBL-2 and EBL-4 with the sparker source. The character of the sparker-source waveforms changed substantially at depths below 250 m. The amplitude of the waveforms suddenly decreased, then begin to increase slowly with depth. The waveforms at these greater depths had an apparent frequency of about 12 kHz and they appeared highly irregular and nonrepeatable.
The change in sparker-source waveforms with depth in borehole EBL-2 is illustrated in figure 20. All illustrated waveforms correspond to unfractured intervals, and the sequence of waveform types followed exactly the same depth trend in all three boreholes logged. Good low-frequency waveforms were provided by the sparker source at depths above 250 m, whereas the waveform signal contains much higher frequencies and much lower amplitudes at greater depths. The irregularity of the sparker-source-waveform signal at depths below 250 m is indicated by the comparison of repeat sparker-amplitude logs for a fracture zone in borehole EBL-4. The amplitude logs have major fluctuations unrelated to fractures indicated in the televiewer logs, and the trend in sparker amplitude clearly is not repeatable (fig. 21),
The failure of the sparker source to provide good data at depths below 250 m was unexpected. The situation was not fully understood in the field, and much of the data obtained with the sparker source came from the deeper fracture zones. Consideration of the various factors involved in the generation of the sparker signal indicates that capacitor discharge, discharge triggering, and receiver-frequency response probably are not depth dependent. However, the nature of the discharge process involving substantial current and negligible voltage may indicate why the source is not functioning at depths greater than 250 m. The low frequencies observed at shallow depths probably are produced by resonant oscillation of a vapor bubble created by fluid heating after sparker discharge. This vapor bubble may not form when hydrostatic pressures exceed a certain threshold. Such a process would explain the abrupt disappearance of the low-frequency signal below a depth of 250 m in all 3 boreholes. The much more gradual increase in amplitude with depth below 250 m seems to correspond to a gradual increase in tube-wave amplitude with depth previously noted for tube waves generated by conventional magnetostrictive sources (Paillet, 1983b).
28
I
DEPTH = 80 METERS EBL1
NEAR RECEIVER
AZ =91 CENTIMETERS(RECEIVER OFFSET)
FAR RECEIVER
AT = 660 MICROSECONDS PER METER
I i500 1000 1500 2000
TIME, IN MICROSECONDS
2500 3000 3500
Figure 19.--Sparker-source waveform in unfractured rock and at shallow depths; borehole EBL-4.
29
FREQUENCY IS ABOUT 5 KILOHERTZ 175 METERS
271 METERS
358 METERS
483 METERS
520 METERS
FREQUENCY IS ABOUT 12 KILOHERTZ
613 METERS
1000 1500 2000 TIME, IN MICROSECONDS
2500
Figure 20.--Change in sparker-source waveform with depth in borehole EBL-2 showing increase in amplitude and decrease in frequency as hydrostatic head decreases.
30
525
TELEVIEWER LOG
LU
< 530LL5CO D
1 £CO QC LU
LU
535
540,
FIRSTSPARKERRUN
SECONDSPARKERRUN
50 100 150 200 0 50
SPARKER AMPLITUDE
100 150 200
Figure 21.--Repeat sparker-source amplitude logs computed from sparker-source waveforms showing negligible repeatability of waveforms in deeper fracture zones.
31
FLOWMETER MEASUREMENTS
Conventional spinner-type borehole flowmeters function very poorly and inaccurately at slow discharge rates in boreholes. For this reason we have developed a new heat-pulse flowmeter for the measurement of slow velocities in boreholes. A detailed review of the heat-pulse flowmeter development is given by Hess (1983), and a discussion of flowmeter applications to the interpretation of velocities in boreholes at the URL is given by Hess (1984, 1985) and Keys (1984).
This flowmeter measures velocity of water passing through the measurement section of the tool by heating a small volume of water and measuring the time required for that heated volume to travel a few centimeters up or down the borehole. Such travel times can be calibrated in terms of flow velocity or borehole discharge according to the methods given by Hess (1983). One of the primary objectives of the experimental work described in this report was further testing of an improved version of the heat-pulse flowmeter.
Flowmeter tests require substantial time when dischargevelocities are slow because long periods are required for the borehole to return to quiescent conditions between tests. Therefore, it was decided to concentrate flowmeter measurements in boreholes EBL-2 and EBL-4 where temperature logs had given an estimation of where measurements should be made effectively to describe flow conditions. It also was suspected that downward flow might be occurring around the stuck packer in borehole EBL-1, so that the complete flow regime in this borehole could not have been measured even if time had permitted.
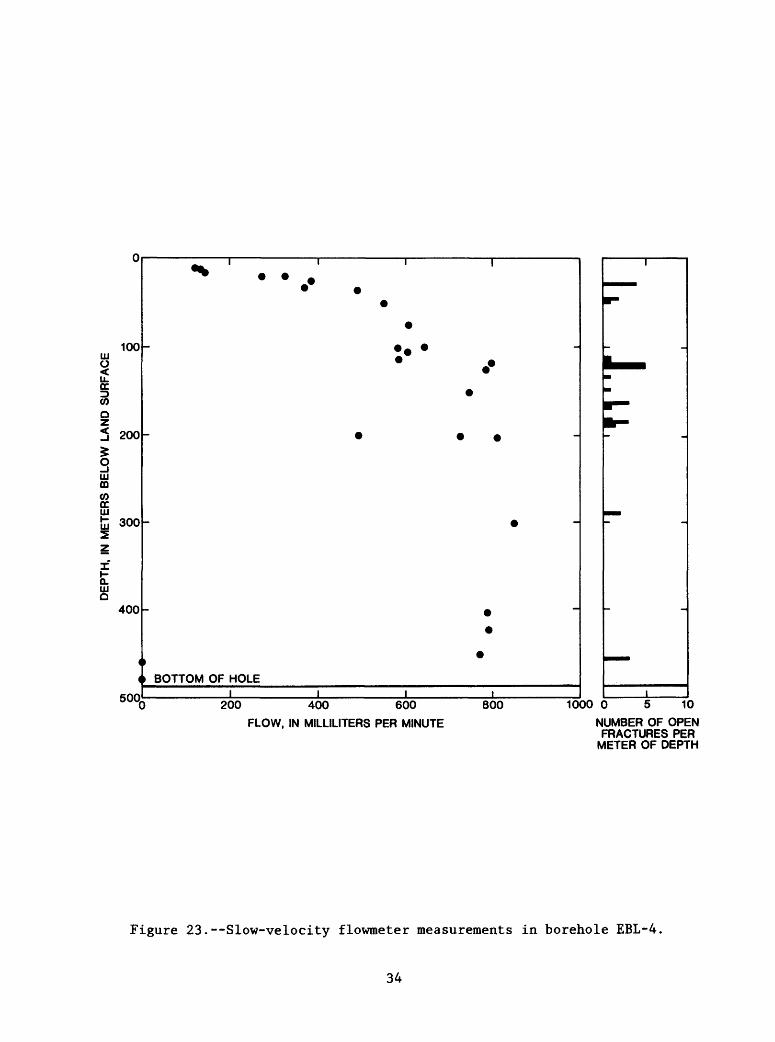
Results of the flowmeter tests in borehole EBL-2 and EBL-4 are shown in figures 22 and 23. Flowmeter measurements indicate that downward recharge is occurring as suspected from the temperature logs. Data in both figures indicate that water is entering the boreholes at multiple points in the upper fracture zones. The data indicate that water is leaving borehole EBR-4 at the largest fractures near the bottom. The greater scatter in the data for borehole EBR-2 and the inconclusive data from deeper in the borehole make it difficult to identify where water is leaving the borehole. There is less scatter in the data for borehole EBL-4 because the flow is somewhat greater in this borehole, and because the measurements were made with a larger diameter (64 mm) flowmeter. The measurements indicate virtually all flow in borehole EBL-4 is exiting at the fracture zone at a depth of about 485 m. The data also indicate that some inflow is occurring above the static water level in the borehole, and, therefore, must be trickling down the inside of the open hole.
The measurements in borehole EBL-2 were made with a smaller diameter flowmeter (44 mm) which performs poorly in the 8-cm diameter boreholes at the East Bull Lake research site. These results indicate that flowmeter performance is best when the flowmeter measurement section fills most of the borehole cross section, which implies that a different flowmeter be used for each diameter borehole. A more effective approach would be to design a borehole-packer system or set of flow concentrators to force most of the flow to pass through the flowmeter measurement section. Such a packer system need not require great rigidity because the system components would sustain minimal stresses at slow-discharge rates. Flowmeter modifications to include such a packing mechanism are now underway.
32
100
200
300
UJo<LL CC
(0
oUJm(0ccUJ
UJ
400
500
600
700
800
900
I T
BOTTOM OF HOLE
200 400 600 FLOW, IN MILLILITERS PER MINUTE
800 0 5 10 NUMBER OF OPEN FRACTURES PER
METER OF DEPTH
Figure 22.--Slow-velocity flowmeter measurements in borehole EBL-2
33
UJoU. CC
8O
OUJmCOcc
Q. UJ O
100
200
300
400
500
BOTTOM OF HOLE
200 400 600
FLOW, IN MILLILITERS PER MINUTE
800 1000 0 10
NUMBER OF OPENFRACTURES PERMETER OF DEPTH
Figure 23.--Slow-velocity flowmeter measurements in borehole EBL-4,
34
SUMMARY
Field tests of various conventional and experimental borehole equipment for the geophysical characterization of fractured crystalline rocks were conducted at the Atomic Energy of Canada Limited 1 s research site at East Bull Lake, Ontario, during September, 1984. Radioactive sources could not be used in the boreholes at these sites because of possibly hazardous borehole conditions, and because the natural radioactivity of the gabbroic rocks penetrated by the boreholes produced gamma logs with very slow count rates. Therefore, geochemical characterization of these rocks on the basis of geophysical logs was nearly impossible. The uniformly rapid acoustic velocity of unfractured rock within the gabbroic intrusion indicated that mechanical properties of unfractured rock in the intrusion were effectively constant, even though core descriptions recognized several different rock types. The similarity of such mechanical properties as compressive strength, shear modulus, and Foisson ratio is confirmed by the similarity in waveform character for unfractured zones of all rock types within the intrusion.
Acoustic-waveform logs were used to construct acoustic-amplitude- deficit logs, which have been shown to be indicative of the distribution of fracture permeability. A representative interval of amplitude-deficit log was expressed in terms of fracture permeability (equivalent single-fracture aperture) by applying the results of a model relating permeability to tube-wave attenuation. Data obtained with the low-frequency sparker source were not very useful because the expected low-frequency response of the sparker source deteriorated substantially at depths below 250 m. This deterioration probably was related to the inability of the spark discharge to produce an oscillatory vapor bubble at relatively large hydrostatic pressures. We have, therefore, undertaken an experimental effort to determine how such factors as discharge energy, spark gap, and electrolyte type relate to the depth dependence of the vapor-bubble oscillation.
Application of the new slow-velocity heat-pulse flowmeter was successful in delineating the flow conditions in one of the East Bull Lake boreholes. Comparison of results obtained with two different flowmeters indicated the important v effect of sensing section diameter on flowmeter resolutions. Flowmeter tests confirmed a hypothesis based on temperature-log data: Water enters the borehole EBR-4 via numerous fractures in the upper 200 m, and exits via large fractures located near the bottom of the borehole. This model is consistent with assumed recharge conditions at the site. Flowmeter tests also indicated that improvement in flowmeter efficiency can be achieved by making the flowmeter measurement section nearly fill the borehole cross section. Because it would be inefficient to have a different diameter flowmeter for each borehole diameter, currently we are developing a flowmeter model with a flow concentrating system to force most borehole flow through the measurement section for a wide range of borehole diameters.
35
REFERENCES
Albright, J. N., Pearson, C. F., and Fehler, M. C., 1980, Transmission of acoustic signals through fractures: Society of Professional Well Log Analysts Annual Logging Symposium, 21st, Lafayette, La., 1980, Transactions, p. R1-R18.
Biot, M. A., 1952, Propagation of elastic waves in a cylindrical borecontaining a fluid: Journal of Applied Physics, v. 23, p. 997-1009.
Cheng, C. H., and Toksoz, M. N., 1981, Elastic wave propagation in a fluid filled borehole and synthetic acoustic logs: Geophysics, v. 46, no. 7, p. 1042-1053.
Christensen, D. M., 1964, A theoretical analysis of wave propagation in fluid filled drilled holes for the interpretation of three dimensional velocity logs: Society of Professional Well Log Analysts Annual Logging Symposium, 5th, Midland, Tex., 1964, Transactions, p. K1-K31.
Davison, C. C., 1980, Physical hydrogeology measurements conducted in boreholes WNl, WN2, and WN4 to assess the local hydraulic conductivity and hydraulic potential of a granitic rock mass WNRE Report of 1978-1979 activities: Atomic Energy of Canada Limited Technical Record TR-26, 158 p.
Davison, C. C., Keys, W. S., and Paillet, F. L., 1982, Use of borehole-geophysical logs and hydrologic tests to characterize crystalline rock for nuclear- waste storage, Whiteshell Nuclear Research Establishment, Manitoba, and Chalk River Nuclear Laboratory, Ontario, Canada: U.S. Department of Energy, issued by the U.S. Department of Commerce, National Technical Information Service, Report ONWI-481, 130 p.
Ejecham, R. B., Sikorsky, R., Kamineni, D. C., and McCrank, G. F., 1985,Subsurface geology of the East Bull Lake research area, Massey, Ontario: Atomic Energy of Canada Limited Technical Record 348, 35 p. [in press].
Hess, A. E., 1983, A heat-pulse flowmeter for measuring low velocities in boreholes: U.S. Geological Survey Open-File Report 82-699, 39 p.
1984, Use of a low-velocity borehole flowmeter in the study ofhydraulic conductivity in fractured rock: NWWA/EPA Conference on Surface and Borehole Geophysics Methods in Ground Water Investigations, San Antonio, Tex., 1984, Proceedings, p. 812-832.
____ 1985, Identifying hydraulically conductive fractures with a slow-velocity heat-pulse borehole flowmeter: Canadian Geotechnical Journal [in press].
Keys, W. S., 1984, A synthesis of borehole geophysical data at the UndergroundResearch Laboratory, Manitoba, Canada: U.S. Department of Energy, issued by the U.S. Department of Commerce, National Technical Information Service, Report BMI/OCRD-15, 43 p.
36
Long, J. C. S., 1980, Vertification and characterization of continuum behavior of fractured rock at the AECL Underground Research Laboratory: U.S. Department of Energy Report BMI/OCRD-17, 239 p.
Mathieu, Frederic, 1984, Application of full waveform logging data to the estimation of reservoir permeability: Cambridge, Massachusetts Institute of Technology, unpublished M.S. thesis, 69 p.
Paillet, F. L., 1980, Acoustic propagation in the vicinity of fractures which intersect a fluid-filled borehole: Society of Professional Well Log Analysts Annual Logging Symposium, 21st, Lafayette, La., 1980, Transactions, p. DD1-DD33.
____ 1981, A comparison of fracture characterization techniques applied tonear vertical fractures in a limestone reservoir: Society of Professional Well Log Analysts Annual Logging Symposium, 22d, Mexico City, Mexico, 1981, Transactions, p. SS1-SS29.
____ 1983a, Frequency and scale effects in the optimization of acoustic waveform logs: Society of Professional Well Log Analysts Logging Symposium, 24th, Calgary, Alberta, Canada, 1983, Transactions, p. U1-U25.
____ 1983b, Acoustic characterization of fracture permeability at ChalkRiver, Ontario: Canadian Geotechnical Journal, v. 20, no. 3, p. 468-476.
____ 1984, Field test of a low-frequency sparker source foracoustic waveform logging: Society of Professional Well Log Analysts Annual Logging Symposium, 25th, New Orleans, La., 1984, Transactions, p. GG1-GG22.
Paillet, F. L., and White, J. E., 1982, Acoustic normal modes in theborehole and their relationship to rock properties: Geophysics, v. 47, no. 8, p. 1215-1228.
Raven, K. G., Smedley, J. A., Sweezey, R. A., and Novakowski, K. S., 1984, Investigations at the East Bull Lake research area Summary of 1983 activities: Pinawa, Manitoba, Atomic Energy of Canada Limited, 91 p.
Rosenbaum, J. H., 1974, Synthetic microseismograms Logging in porous formations: Geophysics, v. 39, no. 1, p. 14-32.
Snow, D. T., 1969, Anisotropic permeability of fractured media: Water Resources Research, v. 5, no. 6, p. 1273-1289.
&U. S. GOVERNMENT PRINTING OFFICE: 19S6--673-079 45,322