UNITED STATES DEPARTMENT OF THE INTEIOR GEOLOGICAL SURVEY Geophysical Well-Log Measurements in Three Drill Holes at Salt Valley, Utah by Jeffrey J. Daniels, Robert J. Kite, and James H. Scott Open-File Report 81-36 1980 This report is preliminary and has not been edited or reviewed for conformity with U.S. Geological Survey standards.
Transcript
UNITED STATES DEPARTMENT OF THE INTEIOR
GEOLOGICAL SURVEY
Geophysical Well-Log Measurements
in Three Drill Holes at Salt Valley, Utah
by
Jeffrey J. Daniels, Robert J. Kite, and James H. Scott
Open-File Report 81-36
1980
This report is preliminary and has not been edited or reviewed
for conformity with U.S. Geological Survey standards.
CONTENTS
Page
Abstract ................................ 1
Introduction .............................. 2
Geophysical well-log response in evaporites. .............. 3
Density. .............................. 5
Resistivity. ............................ 5
Gamma-ray. ............................. 6
Neutron. .............................. 6
Acoustic velocity. ......................... 7
Interpretation of lithologies from borehole geophysical
normal resistivity, and (5) gamma ray. Widely spaced resistivity and conduc
tivity well-log measurements were made in the deep drill hole (DOE No. 3)
Each of these well-log measurements shows the division of the evaporite se
quence into halite and interbed sections. At the present time the most useful
well-logging measurements for determining the individual lithologies in an
evaporite sequence are gamma ray, neutron, density, and acoustic velocity.
The high resistivity contrast between the drilling fluid (0.5 ohm-m) and
salt (10,000 ohm-m) makes it difficult to obtain quantitative measurements of
electrical properties in an evaporite sequence. Tests of widely spaced elec
trode configurations show that the effects of the brine on the resistivity
measurements can be reduced, and the depth of investigation increased, by
increasing the source-receiver electrode spacing. Tests of a single-coil
induction probe show good resolution of the contrasting electrical properties
of the various interbed lithologies.
INTRODUCTION
During the summer and fall of 1978 three holes were drilled by the U.S.
Department of Energy at Salt Valley, Utah, to study the geologic and hydrolog-
ic characteristics of the evaporite sequence in the Permian Paradox Member of
the Hermosa Formation. The approximate depths of these three drill holes are
as follows: (1) DOE Salt Valley No. 1 (SV1) was drilled to a depth of approx
imately 390 m, (2) DOE Salt Valley No. 2 (SV2) was drilled to a depth of ap
proximately 375 m, and (3) DOE Salt Valley No. 3 (SV3) was drilled to a depth
of approximately 1240 m.
Borehole geophysical measurements were made (using U.S. Geological Survey
borehole geophysical equipment and contract equipment) in each drill hole
before casing was set (at the top of the salt), and in the remaining open hole
after the drilling was completed. These measurements were made in order to
better understand the physical properties of the various lithologies associat
ed with the evaporite sequence. Geophysical well-logging information is
necessary to interpret deep-penetration geophysical measurements (such as
hole-to-surface and hole-to-hole electrical measurements) that can be used to
evaluate the geologic viability of a site without extensive drilling.
GEOPHYSICAL WELL-LOG RESPONSE IN EVAPORITES
A general analysis of the well-log response measurements from drill hole
SV3 was given in a previous paper (Daniels and others, 1979) Some of these
data are repeated in this report.
The evaporite sequence at Salt Valley can be divided into three different
stratigraphic regimes as follows: (1) a weathered caprock, (2) halite sec
tions below the caprock, and (3) interbeds of anhydrite, shale, and dolomite
separating the halite sections. Figure 1 illustrates an idealized geologic
section showing typical evaporites in the Paradox basin. This evaporite
sequence is repeated in a cyclic manner as a result of salinity changes in the
basin during deposition. Previous investigators (Tixier and Alger, 1970;
Nurmi, 1978) have described the basic physical properties of an evaporite
sequence. These general properties, summarized in figure 1, appear to apply
to the Salt Valley evaporite sequence.
A geophysical well-log measurement is a function of the physical proper
ties of the rock framework, the fluid in the formation, conditions in the
borehole (fluid and rugosity), the volume of the rock investigated by the
probe, the vertical resolution of the probe (thin-bed resolution), and the
design characteristics of each individual logging probe. Therefore, the
response measured with a geophysical well-logging probe should always be
considered an apparent, rather than a true, physical-property value. The
response characteristics of individual well-logging probes can be summarized
as follows:
ShaleDolomite
Anhydrite
Halite
Potash
Halite
Nodular andLaminatedAnhydrite
SiltyDolomite
Silty,CalcareousDoiomitic, Argillaceous,
Oganic-rich,Black Shale
Relative Salinity Increase
VOOQO Dissolution Surface
(grams/cc) (km/sec) Natural Wafer Density Velocity Radioactivity Content
Halite
Sylvite
Anhydrite
Carnallite
Dolomite
Gypsum
Shale
2.16
1.99
2.96
1.61
2.87
2.32
2.2-2.6
4.4-6.5
4.6-6.5
4.1
4.4-6.5
3.5-6.9
2-3.5
2.3-4.7
Nane
High
None
Low
None
None
High
Very Low
Low
Very Low
High
Low
intermediate
Intermediate - High
Figure'1. Lithology and physical properties of an idealized evaporite se quence in the Paradox basin. The lithologic information is from Hite and Lohman (1973), and the physical property information is from Tixier and Alger (1970).
Density
The density probe consists of a gamma-ray source and one or more gamma-
ray detectors. Gamma rays emitted by the source are scattered by the rock
formation as an inverse function of the electron density of the rocks. The
Compton-scattered gamma radiation that is measured at the gamma-ray detector
on the probe is inversely proportional to the electron density of the rock.
When two detectors are used to measure the scattered gamma radiation, the
effects of the borehole conditions (rugosity and fluid density) on the cali
brated density measurement can be compensated, and the computed density is
approximately equal to the bulk density of the rocks. The apparent bulk
odensity of halite is approximately 2.05 g/cm in the three Salt Valley drill
holes. The density of the interbed and caprock lithologies is a function of
the porosity and grain density of the rocks. Clays and shales have low appar-*\
ent bulk densities (2.2 to 2.6 g/cnr), sandstone has intermediate apparent
obulk densities (2.45 to 2.65 g/cm ), and dolomite has a high apparent bulk
odensity (2.7 to 2.9 g/cnr). Potash minerals (carnallite and sylvite) have
overy low apparent bulk densities (less than 2.0 g/cnr).
Resistivity
Resistivity is a measure of the ease that electrical current passes
through a rock and is a function of porosity, fluid resistivity, and grain
resistivity. Laboratory resistivity measurements show a wide range of resis
tivity values for evaporites. The apparent resistivity of clay is usually
less than 10 ohm-m, shale has a resistivity of less than 50 ohm-m, sandstone
has a resistivity between 50 and 200 ohm-m, and dolomite has a resistivity of
more than 200 ohm-m. The DC resisitivy of consolidated halite is generally
greater than 10,000 ohm-m, which contrasts markedly with the resistivities of
the caprock and interbeds in the Paradox basin. In theory, resistivity should
be an excellent indicator of resistivity contrasts. However, conventional
resistivity probes are not designed to operate in holes drilled through evapo-
rites. The resistivity contrast between the drilling fluid and the salt
formation is approximately 200,000 to 1, resulting in a resistivity response
that is dominated by the low resistivity of the drilling fluid. This response
results in resistivity well-log measurements that lack detail in defining
lithologies within the interbeds, as well as yielding apparent resistivity
values that are several orders of magnitude different from the true resistivi
ty of the salt. Conventional induction-logging tools are also inadequate for
measuring the high resistivities found in an evaporite sequence.
Gamma ray
The gamma-ray probe measures the natural gamma radiation emitted by the
rocks surrounding the borehole. The principal natural gamma-ray emitting
minerals in the evaporite sequence are uranium and potassium-40. Halite has a
nearly zero gamma-ray response, shale has a low to intermediate gamma-ray
response, black shale has an intermediate to high gamma-ray response, and the
potash minerals have very high gamma-ray responses.
Neutron
The neutron well-logging probe consists of a neutron source and a neutron
detector located on the probe approximately 0.5 m from the source. The number
of neutrons counted at the receiver is inversely proportional to the hydrogen
content of the rocks surrounding the borehole, and is primarily a measure of
the amount of water and hydrocarbons contained in the rocks. The neutron
response is high in halite, intermediate in sandstone and dolomite, and low in
carnallite and black shale.
Acoustic velocity
The acoustic-velocity probe consists of an acoustic source and two (or
more) acoustic detectors. The interval transit time of a sonic wave emitted
from the source is measured between two detectors. The inverse of the inter
val transit time ( t) times the distance (in meters) between the two detectors
is the acoustic velocity (m/s). Only the p-wave velocity is usually mea
sured. The acoustic velocity is high for carnallite, anhydrite, and dolomite
(approximately 5000 m/s), intermediate for halite (approximately 4500 m/s),
and low for gypsum and shale (approximately 3000 m/s).
INTERPRETATION OF LITHOLOGIES
FROM BOREHOLE GEOPHYSICAL WELL LOGS AT SALT VALLEY
The complete borehole geophysical well-log measurements for the holes
considered in this study are shown in the appendixes as follows: (1) the logs
for DOE Salt Valley No. 1 (SV1) are in Appendix A, (2) the logs for DOE Salt
Valley No. 2 (SV2) are in Appendix B, and (3) the logs for DOE Salt Valley No.
3 (SV3) are in Appendix C.
The response of the neutron, gamma-ray, density, and acoustic-velocity
well logs in the halite, caprock, and interbed sections of drill hole SV3 is
illustrated in figure 2. Halite is easily distinguished from the interbeds
and caprock at Salt Valley. The high gamma-ray response in the interbeds and
caprock is caused by potassium-rich clays and possibly uranium in the shaley
interbeds, whereas the low neutron response indicates a general increase in
GAMMA
cps/8
0 6
15 23 30
200-
400 H
oo
ui LU & o
600
800
1000-
1200-
Halite
^K /M
nte
rbed
s
Inte
rbed
s
E-J.
Inte
rbed
NE
UTR
ON
cp
s/4
0
150
300
DE
NS
ITY
cyn
/cc
1.6
2
.3
3.0
AC
OU
ST
IC
mlc
ros
ec
/ft
240
140
40
200-
400
600-
800-
1000-
1200-
200-
400 H
600-
800-
1000-
1200-
200
400
60
0-
600
1000-
1200-
4F
igure
2
. G
amm
a ra
y
(GA
MM
A),
neutr
on
(NE
UT
RO
N),
com
pen
sate
d
den
sity
(D
EN
SIT
Y),
an
d acoust
ic-v
elo
cit
y
(AC
OU
STIC
) w
ell
log
s fo
r dri
ll
hole
S
V3.
T
he
inte
rbed,
capro
ck,
and
hali
te
inte
rvals
are
in
dic
at
ed
on
th
e ga
mm
a-ra
y lo
g.
Un
its
are
co
un
ts/s
eco
nd
(c
ps)
fo
r th
e ga
mm
a-ra
y an
d neutr
on lo
gs,
gra
ms/
cubic
centi
mente
r (g
/cm
)
for
the
den
sity
lo
g,
and
mic
rose
co
nd
s/fe
et
(mic
rose
c/f
t)
for
the
acoust
ic
log
.
water in the interbeds and caprock. The density log shows the relatively high
grain densities of the interbeds compared to the halite, whereas the acoustic
log reflects the low p-wave velocity of the caprock and interbeds. The den
sity, neutron, and acoustic log responses reflect the hydration of anhydrite
to gypsum in the caprock.
An experiment using widely spaced electrode arrays was performed in the
test well (SV3) at Salt Valley. Electrode configurations and the resulting
apparent resistivities are shown in figure 3. Increasing the source-receiver
separation increases the apparent resistivity. The widely spaced configura
tions also show more detail than the conventional long-normal resistivity.
This paradox is a result of penetration of current beyond the invaded zone of
the interbeds. If the electrode separation were increased further, the reso
lution of the interbeds would diminish, and the apparent resistivity would
increase as the ratio of salt-to-interbed thickness increased. The intrinsic
resistivity values of the evaporite layers can only be achieved by removing
the effect of the borehole from the apparent resistivity response by detailed
computer modeling.
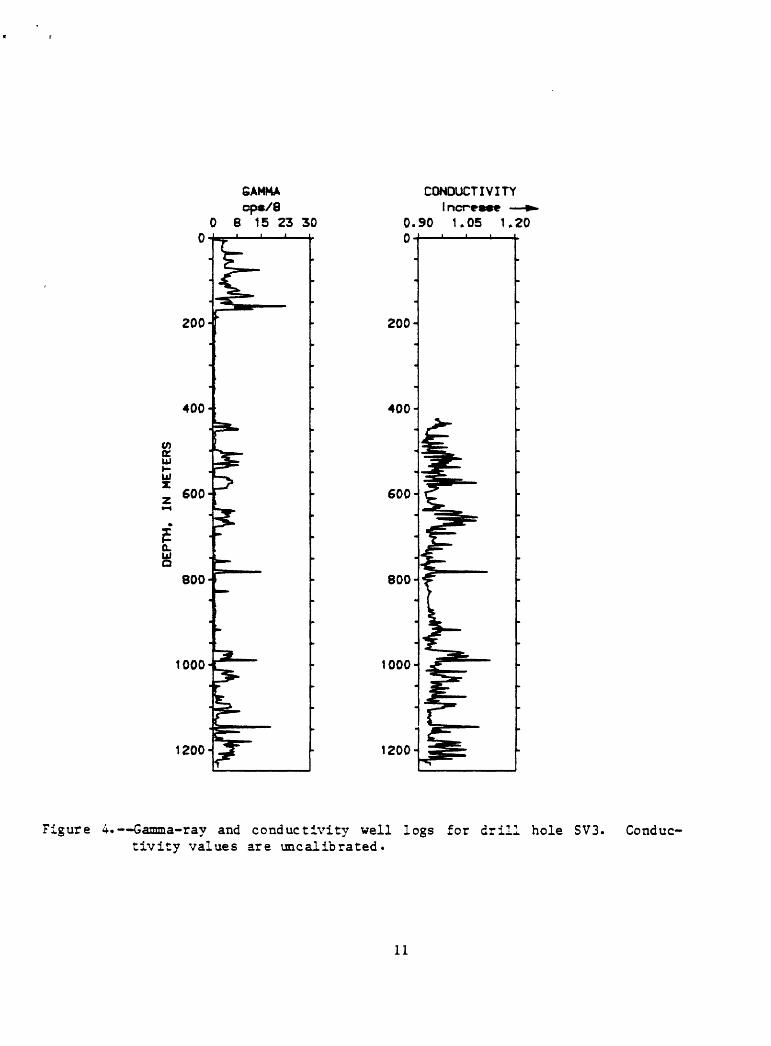
High-frequency electromagnetic methods, such as radar, can be used in dry
holes drilled into evaporites, and could be adapted to work in fluid-filled
holes. More experimental work is needed to determine the usefulness of sub-
radar-frequency electromagnetic measurements in salt environments. Figure 4
shows an uncalibrated experimental conductivity log that was made at Salt
Valley by measuring the in-phase self-inductance of a single coil driven at a
frequency of 1000 Hz. The quadrature component of this inductance signal is
normally used to measure magnetic susceptibility and has been described by
64 In NORMALCT)iR~H& t ^S
0 500 1000
15* SPACINGOOW~W^T0PS
0 500 1000
Sm SPACINGONn BMP t^P*fc
o 500 i ooo
10m SPACINGohm-»»ter«
0 500 1000
200-
400-
600-
eoo
1000
1200
200-
400-
600
eoo
1000
1200
Potential receiver ^
electrode pairs
Current electrodes
4
M. (
M- '
fl'L A
15ml J 10m
'
>
15m
200-
400-
600
eoo
1000
1200
200-
400
600
800
1000
1200
Electrode Spacing
Figure 3. DC-resistivity well-log responses for drill hole SV3. The long normal array (64 in) is the conventional 1.6 m logging array. Spacing for the other arrays are shown in the figure. Plot posi tion for the widely spaced arrays is halfway between the potential electrodes.
10
GAMMA cp*/8
6 15 23 30
200-
400-
enQL UJ>- Ul
Q.
8
600-
800-
1000-
1200-
CONDUCTIVITYIncrease »
0.90 1.05 1.20 0
200-
400-
600-
800-
1000-
1200-
Figure 4. Gamma-ray and conductivity well logs tivity values are uncalibrated.
:or drill hole SV3- Conduc-
11
Scott and others (1976). The usefulness of this conductivity measurement is
not yet fully established, but the measurements correlate with conductivity
changes that would be expected in an evaporite sequence.
Figure 5 illustrates the well-log measurement response for a typical
halite-interbed sequence from the well logs shown in figures 2 and 4. Carnal-
lite can usually be distinguished from shale by its low density. Anhydrite
can be distinguished from halite by its high density and the nearly constant
acoustic velocity of halite. There are sections of the interbeds where multi
ple lithologies make it difficult to distinguish the mineralogic components of
the section. This difficulty is clearly illustrated for depth intervals 1018
to 1025 m and 1030 to 1040 m. The presence of dolomite in shale and sandstone
complicates the interpretation of geophysical well logs in evaporite se
quences. Halite, shale, potash, and anhydrite can be easily identified by
individual well logs as follows:
(1) Anhydrite has a low gamma-ray count, high neutron response, high
acoustic velocity, high density, and low conductivity.
(2) Most black shales have a high gamma-ray response, low neutron re
sponse, intermediate densities, low acoustic velocities, and high
conductivities
(3) Halite has a low gamma-ray count, high neutron response, low density,
low acoustic velocity, and low conductivity.
(4) The potash minerals at Salt Valley are carnallite and sylvite.
Carnallite has an intermediate gamma-ray count, an intermediate
neutron response, low density, high acoustic velocity, and high
12
GAMMA
eps/8
0 6
12 18 24
1020
1040
1060-1
NEUTRON
cp*/4
0 150
300
1020
1040
1060H
1.6
DENSITY
gm/cc
2.3
3.0
1020
1040-*
1060
-j
ACOUSTIC
mlcro*ec/ft
90 83 75 68 60
10
20
10
40
Jill
1
< ^^^
^T""
""^ >
--
j~<
^^ \ > \
A
8 C D
E .
F G H I
J
CO
ND
UC
TIV
ITY
lnc
rea
«e
»
>
0.9
0
1.0
0
1.1
0
1020
10
40
-f
1060-1
A
An
hyd
rite
B
Sh
ale
C S
hal
e, w
ith
Do
lom
ite
and
San
dst
on
e 0
An
hyd
rite
E
Sh
ale
F A
nh
ydri
te
G D
olo
mit
ic S
and
sto
ne,
w
ith
Hal
ite
incl
usio
ns
H
Sh
ale
wit
h A
nh
yd
rite
, S
and
sto
ne,
and
Hal
ite
I H
alit
e
J P
ota
sh
Fig
ure
5. L
itholo
gie
s
corr
esp
on
din
g
to
resp
onse
v
alues
fo
r th
e ga
mm
a-ra
y,
neu
tron,
den
sity
, aco
ust
ic-v
elo
cit
y,
and
co
nd
ucti
vit
y
wel
l lo
gs.
13
conductivity. Sylvite has a high gamma-ray count, high neutron
response, low density, high acoustic velocity, and low conductivity.
COMPUTER-ASSISTED INTERPRETATION
To overcome the ambiguity associated with individual well-log interpreta
tion, several well logs must be simultaneously interpreted. A consistent
interpretation of the well logs can be achieved by interpreting the digital
well-log data. Computer-assisted interpretation of well logs involves the
following procedure: (1) input of digital depth-well log response measure
ment data pairs into the computer, (2) assignment of value ranges of one or
more geophysical well logs for a particular lithology,
and (3) execution of the computer program to assign lithologies to depth
intervals where the well-log measurements are within the specified ranges for
a particular lithology. This interpretation procedure is necessarily subjec
tive; it should be considered to be a preliminary interpretation that should
be refined by visual interpretation of the geophysical well logs. A computer-
assisted interpretation of drill hole SV3 is given in Appendix D. The lithol
ogies shown in Appendix D were interpreted using the well-log response value
ranges given in table 2. The well-log response measurements of the Salt
Valley drill holes were digitized at depth intervals of 0.1524 m. Therefore,
beds whose thickness is less than approximately 0.3048 m cannot be detected.
Beds whose thickness is less than approximately 0.6096 m show no response on
the lithologic well logs in Appendix D. However, the list of interpreted
values, shown in Appendix D, does add information to the interpretation for
thin beds.
14
The caprock lithology is complex, consisting of a heterogenous mixture of
sandstone, shale, dolomite, and gypsum. Vertical and horizontal changes in
the stratigraphy are difficult to define. The complex nature of the caprock
is reflected in the geophysical well-log measurements. The gamma-ray, neu
tron, density, acoustic-velocity, and caliper well logs for the caprock depth
intervals in drill holes SV1, SV2, and SV3 are shown in figures 6, 7, and 8,
respectively. The interpreted lithology based upon the well-log responses is
shown below the geophysical well logs. The lithologic well logs were inter
preted using the well-log response value ranges given in table 2. The comput
er was programmed to assign a specific lithology to all depth intervals that
contained well-log response values in a specified value range. The interpre
tation assumes that the only lithologies present in the section are those that
are listed in the table. Other lithologies may be present but have not been
considered in this interpretation. This interpretation should be considered
as a first approximation of the lithology and not a final interpretation of
the lithology. However, the well-log interpretation does indicate the follow
ing:
(1) The gamma-ray well logs indicate the presence of more shale in drill
hole SV1 than in drill holes SV2 or SV3.
(2) The shale at a depth of 121 m in SV1, 103 m in SV2, and 135 m in SV3
may be a single, correlative, lithologic unit.
(3) The neutron well logs indicate that the caprock in drill hole SVl has
a lower porosity than in drill holes SVl or SV2.
Only the neutron and gamma-ray well logs were used in the interpretation. The
caliper log shows that each of the holes has large changes in borehole
15
NEUTRON ' SV", .CP£/<
C 30C 60C
ACOUSTIC <sv ;m/s*c
200C 4COC 6000
CAP ROCK LITHOLOCVISVI
10-,
!E 20 1*~ I X 1 230-t t. 90 H : i*S&
Ui ! «-*»V'0
£190 HI
Block thole
vXv'SHty dolomltt, jv.'.vi ond flyptum
i : ltliS Sholty dolemlt* (uncontelldottd)
V.v.j Sholty dolomitt (contelldottd)
ill!!!"? | Delomltt
Figure 6. Gamma-ray, neutron, density, acoustic-velocity, and caliper well logs for drill hole SV1. Lithologic interpretation for the caprock in SV1 based upon the information in table 1.
16
ACOUS'JC (SV2)
200C 450C 700C 0-
CALIPERCir
1C 3C 5C
20-
CAP ROCK -JTHOLOCYlSve:
u, -
230-
60-
Block chol*
Gypcum
r*^VAV Silty dolomite,jV/.Vi ond gyptum;':lili= Sholty dolomit«(uneonsolldot«d)
]! " !v! Shol«y dolomit* (contolldottd)
Dolomit*
Figure 7. -Gamma-r ay, neutron, density, acoustic-velocity, and caliper well logs for drill hole SV2. Lithologic interpretation for the caprock in SV2 based upon the information in table 1.
17
00
H-
OQDEPTH. IN
METERS
DEPTH. IN METERS
DEPTH. IN METERS
DEPTH.
IN METERS
S« 2
0 s
. <
m * i
° 5
0
z--
o
m
DEPTH. IN METFRS
o
oo
o»
DEPTH.
IN METFRS
DEPTH.
IN METERS
o
o M
DFPTH. IN METERS
rugosity. These variations in borehole rugosity introduce errors in all of
the logs except the gamma-ray well log. These errors are particularly pro
nounced on the acoustic velocity and density well logs.
Table 1. Well-log response value ranges for
halite-interbed
Lithology
Salt
Shale
Anhydrite
Dolomite
Sandstone
Sandstone
and shale
Carnallite
sequence in drill hole SV3
Gamma ray Neutron
(cps) (cps)
0 to 3 225 to 300
13 to 50 0 to 150
200 to 300
100 to 225
0 to 8 125 to 225
7 to 15 50 to 200
0 to 150
interpreting lithologies in the
Density
(gm/cnr)
2.0 to 2.1
2.2 to 2.6
2.7 to 3.0
2.6 to 3.0
2.45 to 2.7
2.2 to 2.6
1.6 to 2.05
Acoustic
velocity
(microsec/ft)
4500 to 6000
4500 to 6000
3000 to 4500
2000 to 4500
__
19
Table 2. Value ranges used for computer-assisted interpretation of interbed
lithologies
Lithology
Gamma ray
cps/8
Neutron
cps/4
Black shale
Gypsum
Silty dolomite
and gypsum
Dolomite
(consolidated)
Shaley dolomite
(unconsolidated)
Shaley dolomite
(consolidated)
15 to 50
less than 3
3 to 8
3 to 8
7 to 15
7 to 15
0 to 1000
0 to 1000
less than 100
greater than 100
50 to 125
greater than 125
CONCLUSIONS
The lithologies present in an evaporite sequence (halite, anhydrite,
potash, shale, gypsum, sandstone, and dolomite) show physical-property charac
teristics that are easily identifiable on conventional well logs. However,
the evaporite sequence at Salt Valley is lithologically and structurally
complex. More work needs to be done to quantitatively identify the mineralog-
ic components within the complex interbed sequences. This is particularly
true for the caprock; at the present time, interpretation of the caprock
20
lithology is little more than an educated guess. The lithology could be
identified by conducting detailed chemical and petrographic analysis of core
taken from the caprock.
The thin beds in the interbed sequence can be better defined by obtaining
very closely spaced digital geophysical well-log measurements (a sample spac
ing of less than 2 cm). However, quantitative identification of mineralogic
components within the interbed sequence may require the development and appli
cation of new borehole geophysical tools. Some tools that are presently used
(such as acoustic velocity, neutron, and density) have been developed for use
in oil exploration and may be redesigned to give the detailed information
required for the nuclear waste program.
Borehole geophysical probes are needed to measure the large contrast of
electrical properties (dielectric constant and resistivity) that are present
between the individual lithologic components in an evaporite sequence. The
single-coil induction probe that was tested at Salt Valley may be useful in
determining the moisture content of halite. Both dry-hole and wet-hole radar,
and subradar-frequency electromagnetic borehole probes need to be developed.
21
REFERENCES CITED
Daniels, J. J., Scott, J. H., and Kite, R. J., 1979, Analysis of borehole
geophysical data in an evaporite sequence at Salt Valley, Utah: Society
of Professional Well-Log Analyst Twentieth Annual Logging Symposium, June
3-6, 1979, Transactions, 19 p.
Hite, R. J., and Lohman, S. W., 1973, Geologic appraisal of Paradox basin salt
deposits for waste emplacement: U.S. Geological Survey open-file report,
68 p.
Nurmi, R. D., 1978, Use of well logs in evaporite sequences: Society of
Economic Paleontologists and Mineralogists short course 4, Marine evapo-
rites, Transactions, 95 p.
Scott, J. H., Summers, G. C., and Earth, J. J., 1976, A magnetic-suscepti
bility well-logging system for mineral exploration: Society of
Exploration Geophysicists, 46th Annual International Meeting Programs
(Abstract WP-37), Houston, Texas, October 24-28, 1976.
Tixier, M. P., and Alger, R. P., 1970, Log evaluation of nonmetallic mineral
deposits: Geophysics, v. 35, no. 1, p. 124-142.
22
APPENDIX A
Geophysical Well Logs from DOE Salt Valley No. 1 Drill Hole (SVl)
23
ACOUSTIC (SV1)m/eec
2000 4000 6000 0
20 H
40-
60-
80-
UJ2:
5ioo-
180-
200
ACOUSTIC (SV1)m/eec
2000 4000 6000 200
220-
240 H
260-
£280 i- ui 2:
5300-
g]320
340-
360-
380-
400
Figure Al. Acoustic -velocity well log for drill hole SVl. Units are in meters/second (m/sec).
24
64-In NORMAL (SV1)ohm-meters
0 300 0
180
200
64-In NORMAL (SV1)ohm-meters
0 300 200
220-
240
260-
:\
CO Of UJh-UJ
^280.
5300-
°-320iui a
340-
360-
380-
400
Figure A2. Normal resistivity well log (64 in) for drill hole SV1. Units are in ohm-meters*
25
16-in NORMAL (SV1)ohm-meters
0 150
16-In NORMAL (SV1 )ohm-meters
0 150U "
20-
40-
60-
£ 80-
UJ
5ioo-
X
£120- a
140-
160-
180-
?nn-
^[^(^
^uu -
220-
m
240-
260-
0)
£280-
z
5300-
X
£j 320- a
340-
360-
380-
^nn -
/\
(
Figure A3. Normal resistivity log (16 in) for SV1. Units are in ohnrmeters.
26
DENSITY (SV1 )g/cm
1.0 2.0 3.0
DENSITY (SV1)g/cm
1.0 2.0 3.0
UJh-UJ
201
40-
60-
80 H
2100- i i
CL 120 a
140-
160-
180-
2DO-
220-
240-
260-
to a: UJ280UJ
&320
340-
360-
380-
"S ^
«
4
<
4
JM»
r
. satr
P1
Figure A4. Bulk density geophysical well log for drill hole SV1. Units are in grams/centimeter3 (g/cm3 ).
27
CALIPER (SV1)cm
10 30 50
CALIPER (SV1 )cm
10 30 50
0)o:UJi- as
20-
40 ^
60-
801
5ioo -\» i
UJa
140-
160-
180-
200
200
220-
240-
2601
0)£280i-UJX
5300H
&320 a
340-
360-
380-
400
<
Figure A5.~Caliper well log for drill hole SV1. Units are in centimeters (cm).
28
NEUTRON (SV1)cps/4
0 300 600
NEUTRON (SV1)cps/4
0 300 600
LUh- LU3L
20
40-
60-
80-
SlOO-
X
140-
160-
180-
200
200
220
240-
260-
£280-h- ui
5300-
&320-Q
340i
3601
380-
400
i
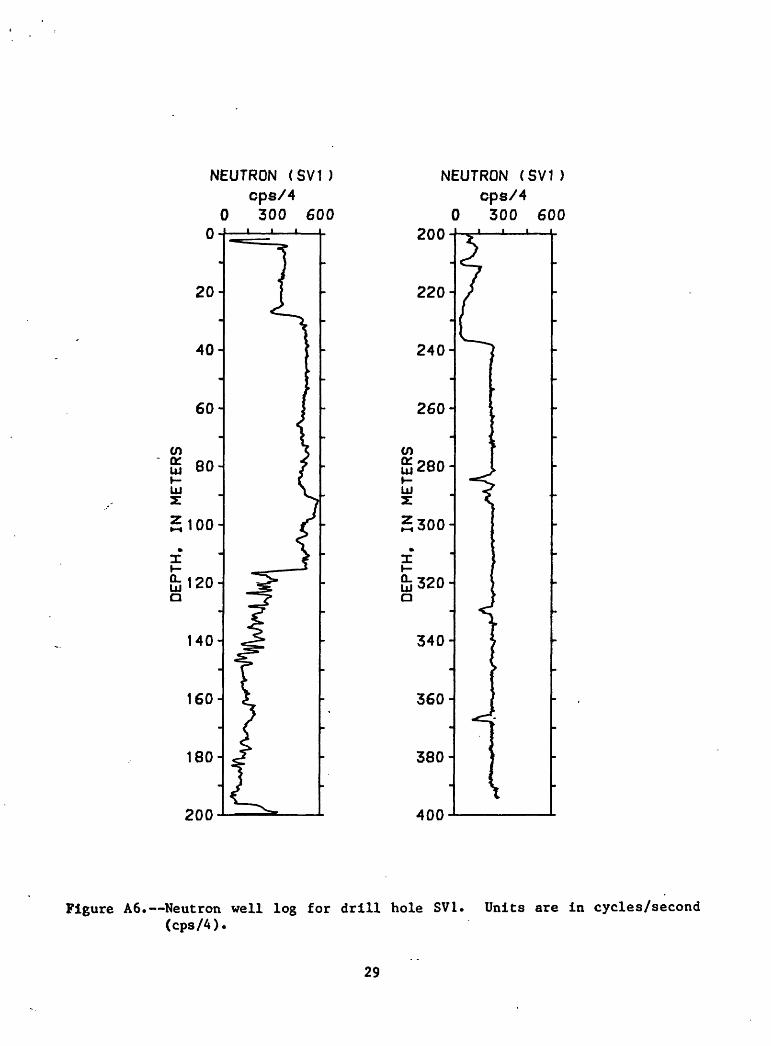
Figure A6. Neutron well log for drill hole SV1. Units are in cycles/second (cps/4).
29
GAMMA RAY (SV1 )cps/8
0 20 40 0
20-
40-
60-
ffi 80-I- UJ2:
&120- a
140-
160-
180-
200
GAMMA RAY (SV1)cps/8
0 20 40 200
220-
240-
260-
£280^o:UJH- UJ
5300-
I
340-
360-
380-
400
Figure A7. Gamma ray well logs for drill hole SV1 cycles/second (cps/8).
Units are in
30
APPENDIX B
Geophysical Well Logs from DOE Salt Valley No. 2 Drill Hole (SV2)
31
ACOUSTIC (SV2)m/sec
2000 4500 7000 0
20
40
60-
£ 80I-UJ
5ioo
fijl20 o
140-
180^
200
ACOUSTIC (SV2)m/sec
2000 4500 7000 200
220-
400
Figure Bl. Acoustic velocity well log for drill hole SV2. Units are in meters/second (m/sec).
32
NEUTRON (SV2)cps/4
0 200 400
NEUTRON (SV2)cps/4
0 200 400
180-
200
£.W -
220-
240-
-
260-
£280-LU
S300-
X
Sj320-Q
340-
360-
380-
4nn .
;
;
i
1-^
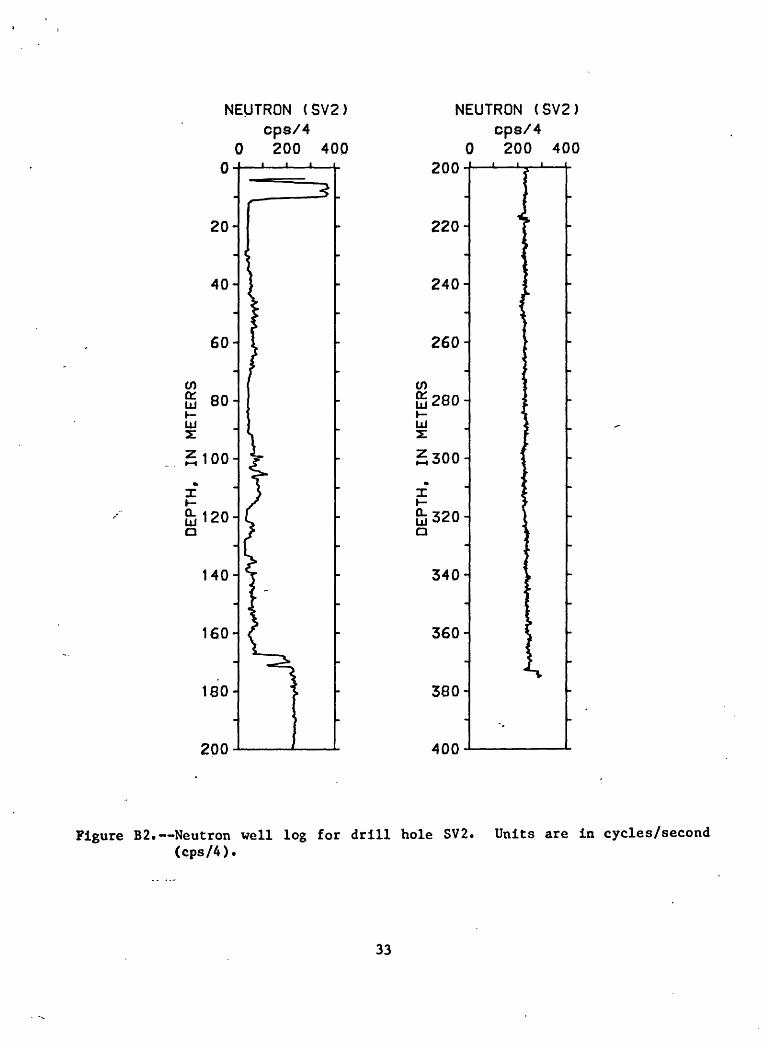
Figure B2. Neutron well log for drill hole SV2. Units are in cycles/second (cps/A).
33
CALIPERcm
10 30 50
CALIPER (SV2)cm
10 30 50
20-
40-
60-
O)
LUI- UJ2:
5ioo-
UJa
140-
160-
180-
200
200
220-
240-
260-
co
i-LU
53001
X
340-
360-
380
400
Figure B3. Caliper well log for drill hole SV2. Units are in centimeters (cm).
34
GAMMA RAY (SV2)cps/8
0 20 40 0
GAMMA RAY (SV2)cps/8
0 20 40 200
160
180H
200
220-1
240 H
260 H
to £280»-UJz
5300-
x
&320 a
340-
360-
380-
400
Figure B4. Gamma ray well log for drill hole SV2. Units are in cycles/second (cps/8).
35
DENSITY (SV2)g/cm
1.0 2.0 3.0 0
180-
200
DENSITY (SV2)g/cm
1.0 2.0 3.0200
220-
240-
260-
£280-
UJs:
5300-
fr, 320 -Ia
340-
360-
380
Figure B5. Density veil log for drill hole SV2. Units are in grams/centi meters (g/cnr).
36
64-In NORMAL (SV2)ohm-meters
0 100 200
6'4-!n NORMAL (SV2)ohm-meters
0 100 200u
20-
40-
60-
g 80-K-UJ
5ioo-
i&120-Q
140-
160-
180-
9nn-
\
i
\
/
^uu -
220-
240-
260-
0)
£280-
z
5300-
i
&320-Q
340-
360-
380-
Af\r\ .
^
-
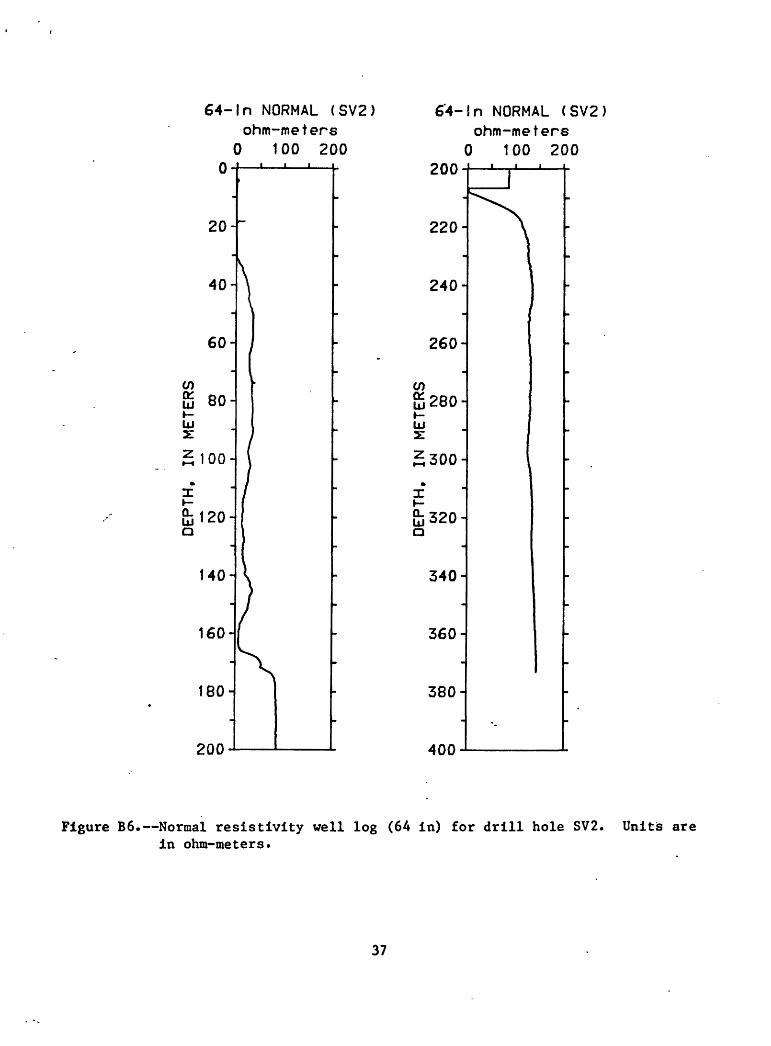
Figure B6. Normal resistivity well log (64 in) for drill hole SV2. Units are in ohm-meters.
37
16-In NORMAL (SV2)ohm-meters
0 50 0
40^
60 -I
a eo Hh-UJ
5ioo-
&120HQ
140-
160-
180-
200
16-In NORMAL (SV2)ohm-meters
0 50 200
220-
240-
260-
£280 t-UJ
300-
&320Q
340-
360-
380-
400
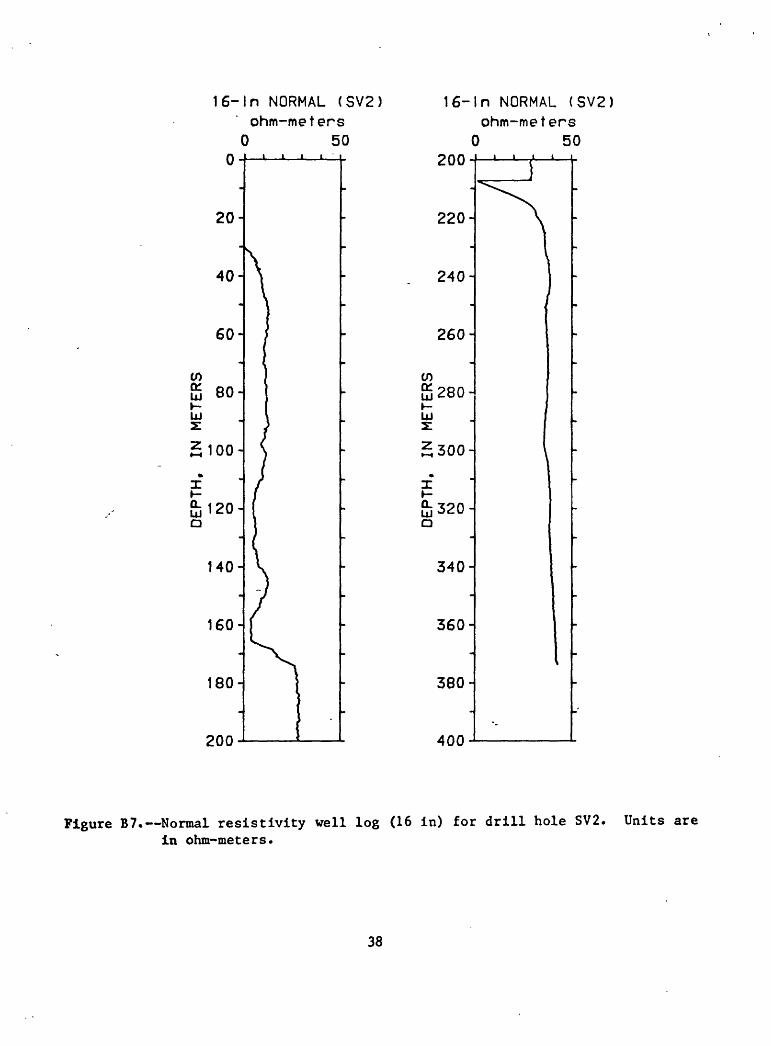
Figure B7.~Normal resistivity well log (16 in) for drill hole SV2. Units are in ohm-meters.
38
APPENDIX C
Geophysical Well Logs from DOE Salt Valley No. 3 Drill Hole (SV3)
39
64
-
0 0
-
50-
100-
co QL
UJ
\-
Ul z t 1
X* \-
&2
00
-
25
0-
300-
n
NO
RM
AL
( SV
3 )
oh
m-m
ete
rs1
00
2
00
1111
>|
m - - - -
64-In NORMAL (S
V3)
ohm-
mete
rs
0 100
200
35
0-
40
0-
co QL
UJ h-
UJ
45
0-
1500-
h- Q.
UJ
Q
550i
600-
64
-In
N
OR
MA
L (S
V3)
ohm-meters
0 100
200
650-
700-
750-
co
ct UJ \- Ul S800-
0.
UJ Q850-
900-
950
H
64-In NORMAL (SV3)
ohm-meters
0 100
200
1000-
1250-
Figure Cl. Normal re
sist
ivit
y we
ll lo
g (64
in)
for
dril
l ho
le SV
3.
Unit
s are
in ohm-meters.
16-
n N
OR
MA
L (S
V3)
16
- n
NO
RM
AL
(SV
3)
16-
n
NO
RM
AL
(SV
3)
16-
n
NO
RM
AL
(o
hm
-me
ters
o
hm
-me
ters
o
hm
-me
ters
ohm
-mete
rsC
0- -
50
- -
100-
co
o: LU i- Ul
Z 1
50-
z.
» i
X
H-
CL LU
20
0- -
25
0-
300-
} 100
20
0
0
\
-
35
0-
r
40
0-
-
CO a:
^4
50
-U
l
z^ £500-
£ -
LU a
55
0-
"
60
0-
:
100
2C
. *
\ y
>0
0
65
0-
-
70
0-
-
QL
\-
LU 5800-
X £
LJ Q8
50
-
-
90
0-
95
0-
100
2CI
V
)0
C P
10
00
-
-
1050-
to QL ^1100-
i i
X ^1
15
0-
Ltl
Q.
-
12
00
-
12
50
-
-
) 100
20
| r < V X
Figu
re C2. Normal re
sist
ivit
y well logs (1
6 in)
for
drill
hole SV3.
Unit
s ar
e in o
hm-m
eter
s.
ACOUSTIC(SV3)
m/ee
c 20
00 40
00 60
00
50-
100-
UJ i- LU
150-
UJ200-
250-
300
ACOUSTIC (SV3)
m/ee
c 20
00 40
00 60
00
350-
400-
a:
1^450
LU I 500
i- Q_
UJ O
550-
600-
ACOUSTIC (S
V3)
m/ee
c 20
00 40
00 60
00
650-
700-
750-
UJ i- UJ Seoo-
0.
UJ a85
0-
900-
950
ACOUSTIC (S
V3)
m/ee
c 20
00 40
00 60
00
1000
-
1250
-
Figure C3.---Acoustic velocity we
ll log
for
dril
l hie
SV3.
Units
are
in
meters/second
(m/s
ec).
CA
LIP
ER
(S
V3)
cm
10
30
5
0
50
-
100-
CO a: UJ4
r-«
150-
UJ2
00H
25
0-
30
0-
CA
LIP
ER
(S
V3
)cm
10
3
0
50
35
0-
40
0-
CO a:450 -
Ul x500-
a. UJ a
55
0-
60
0-
CA
LIP
ER
(S
V3)
cm
10
30
5
0
65
0-
70
0-
75
0-
CO a: UJ i- UJ ge
oo-
a. UJ a8
50
-
90
0-
95
0-
CA
LIP
ER
(S
V3
)cm
10
3
0
50
1000-
1050-
co
a: UJ ^1100-
z » i X UJ a
1200-
1250-
>.I '
- - i^M» : m 1
Fig
ure
C
4.
Cali
per
wel
l lo
g
for
dri
ll
ho
le
SV3.
;U
nit
s ar
e in
ce
nti
met
ers
(cm
)
CO
ND
UC
TIV
ITY
(S
V3
)In
cre
ase
0.9
0
1.0
5
1.2
0
0
50-
LJ
I
LU1
50
-
W2
00
-
250
30
0
i
CO
ND
UC
TIV
ITY
(S
V3
)In
cre
ase
0
.90
1
.05
1.2
0
35
0-
40
0-
01
LJ
I LJ
2E
450 H
£500-
Q.
Ul
Q
55
0-
600-
CONDUCTIVITY (S
V3)
Incre
ase
0
.90
1
.05
1.2
0
650-
70
0-
75
0-
LJ
I
LU 2800-
Q.
LJ
Q850^
90
0-
95
0-
CO
ND
UC
TIV
ITY
(S
V3
)In
cre
ase
0.9
0
1.0
5
1.2
0
1000-
1050-
co QL
LJ
1100-
Q.
LJ
Q
1150-
1200-
1250-
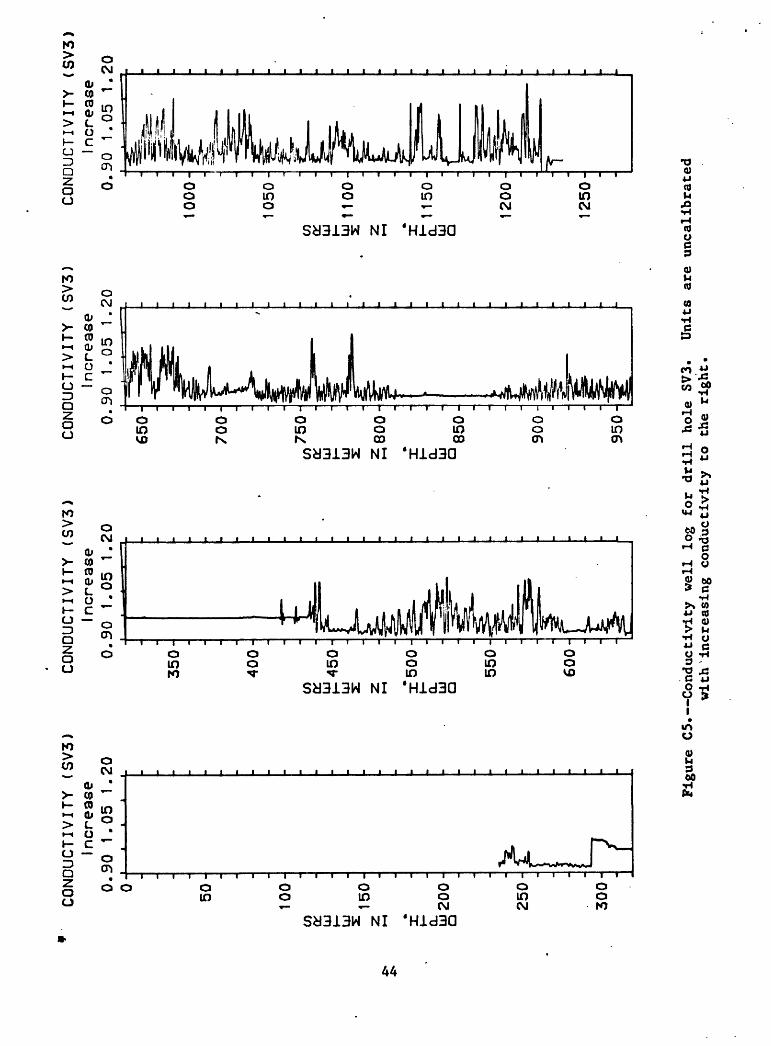
Fig
ure
C5. C
onduct
ivit
y
wel
l lo
g fo
r d
rill
ho
le
SV3.
U
nits
ar
e u
nca
lib
rate
d
wit
h'incr
easi
ng
conduct
ivit
y
to
the
right.
DE
NS
ITY
(S
V3
)g
/cm
1.5
2
.5
3.5
0
50 H
100-I
to ft:
UJ
)-
LU-O
Ln
150-
1
UJ2
00
25
0
300-
^
__
i__
i_
DE
NS
ITY
(S
V3
)g
/cm
1
.5
2.5
3
.5
350 H
400 H
to
ft:
LU »- LU 31
45
0 -\
o_ LU a
550 H
600 H
DE
NS
ITY
(S
V3
)g
/cm
1
.5
2.5
3
.5
650-
^
700 H
to
&. LU I
LU
750 H
80
0 H
o_ LU a8
50
-1
900 H
95
0 H
DE
NS
ITY
(S
V3
)g
/cm
1
.5
2.5
3
.5
1000H
1050H
to C£
LU
1 1
00
-
0_
LU a
1 150-
12
00
-
12
50
-
Fig
ure
C
6. D
ensi
ty
wel
l lo
g
for
dri
ll
hole
SV
3.
Unit
s are
in
g
ram
s/cu
bic
centi
mete
r (g
/ccr)
.
GA
MM
A
RA
Y
(SV
3)
cp
s/8
0 20
40
0
50
H
10
0H
to
o:
u H- LU
150H
Q- uj 2
00 i
250
i
30
0-
GA
MM
A
RA
Y
(SV
3)
cp
s/8
0
20
40
35
0 H
40
0 H
to on
u »-
u4
50
H
£5
00
H»- Q
_ U a
550 H
600 H
GA
MM
A
RA
Y
(SV
3)
cps/
8
0 20
40
65
0 H
700 H
to
a:
LU »-
u 2:
750 H
a.
u
a8
50
H
900 H
950
i
GA
MM
A
RA
Y
(SV
3)
cp
s/8
0
20
40
10
00
H
10
50
to
a:
u1
10
0H
u
a
1200 H
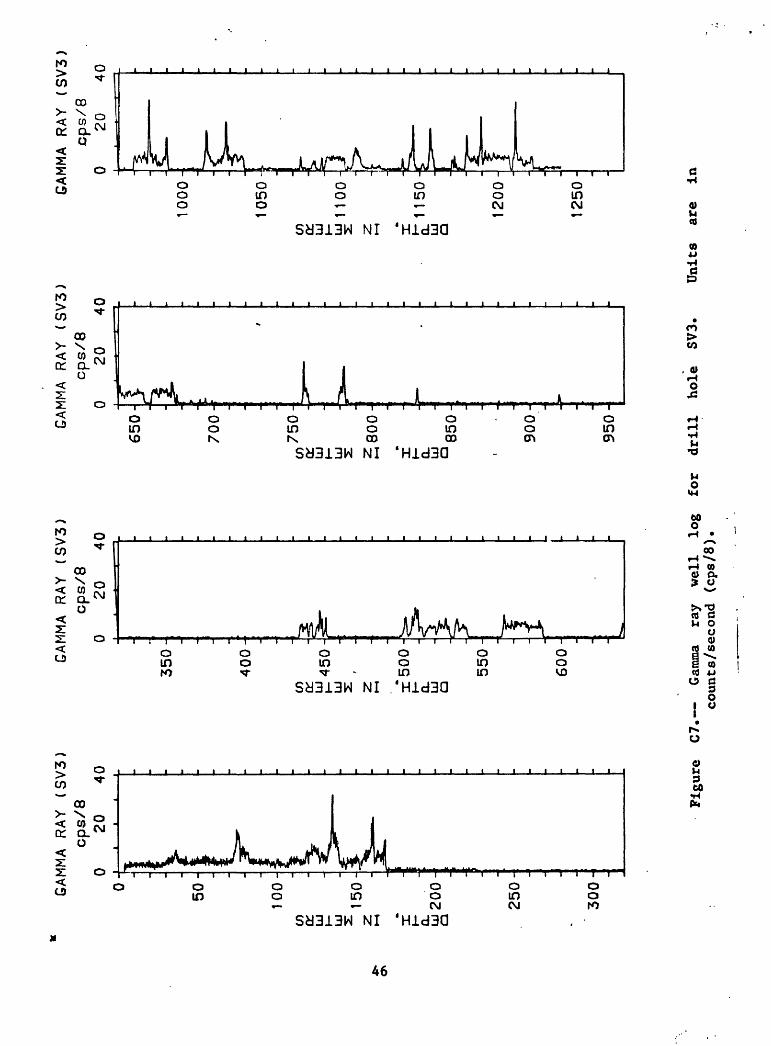
Fig
ure
C
7.
G
anun
a ra
y
wel
l lo
g
for
dri
ll
ho
le
SV3.
U
nit
s are
in
co
unts
/sec
ond
(cps/
8).
NE
UTR
ON
(S
V3
)cps/4
0
150
300
50-
100-
O) o:
LJ LJ150-
&2
00
J
250-
30
0-
_1___I_
__1_
NE
UTR
ON
(S
V3)
cp
s/4
0
150
30
0
35
0-
40
0-
0) a:
£450
LJ £500-
h- Q_
LJ a
55
0-
600-
NE
UTR
ON
(S
V3)
cp
s/4
0
150
300
650-
70
0-
75
0-
O) o:
LJ
H- LJ 58
00
-
Q_
LJ a8
50
-
90
0-
95
0-
NE
UTR
ON
(S
V3
)cp
s/4
0
150
300
12
50
-
Fig
ure
C8
. N
eutr
on
w
ell
log
for
dri
ll
hole
SV
3.
Uni
ts
are
in
counts
/sec
ond
(cps/
4)
i
APPENDIX D
Computer-Assisted Interpretation of Geophysical Well Logs from Drill Hole SV3
1022.41025.71029.41032.11087.81090.41094.31151.61152.41179.41182.41183.91186.11 186.81187.71190.81191.61192.21193.41195.71200.51203.91205.11207.91209.41215.21216. M
Table D3. Depth interval in drill hole 3 chosen by the computer to contain the well log response values in Table 2 that are indicative of . sandstone (dolomitic (?)), and shale.
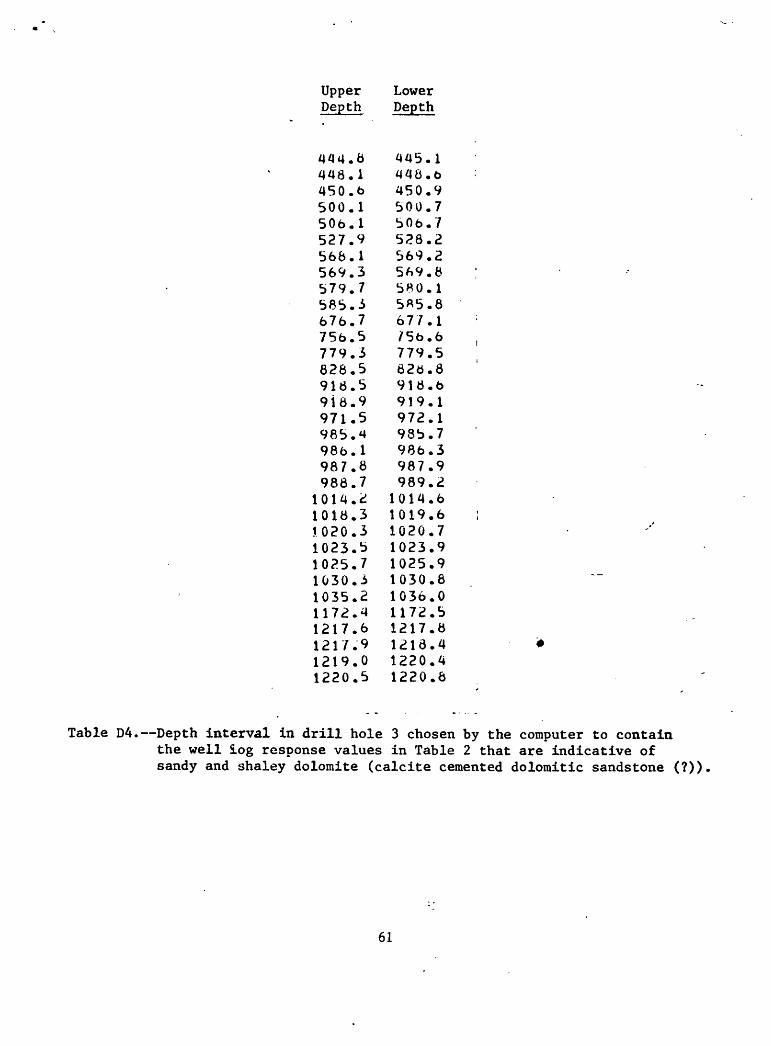
Table D4. Depth interval in drill hole 3 chosen by the computer to contain the well log response values in Table 2 that are indicative of sandy and shaley dolomite (calcite cemented dolomitic sandstone (?))
61
Upper Depth
Lower Depth
444.0449.5496.0880.5981.5991.1
1013.1
444.2450.1500.0680.6981.7991.3
1013.41013.6 1014.0
Table D5. Depth interval in drill hole 3 chosen by the computer to contain the well log response values in Table 2 that are indicative of anhydrite.