Gliding flight in a jackdaw: a wind tunnel study Rosén, Mikael; Hedenström, Anders Published in: Journal of Experimental Biology 2001 Link to publication Citation for published version (APA): Rosén, M., & Hedenström, A. (2001). Gliding flight in a jackdaw: a wind tunnel study. Journal of Experimental Biology, 204(6), 1153-1166. http://jeb.biologists.org/cgi/content/abstract/204/6/1153 Total number of authors: 2 General rights Unless other specific re-use rights are stated the following general rights apply: Copyright and moral rights for the publications made accessible in the public portal are retained by the authors and/or other copyright owners and it is a condition of accessing publications that users recognise and abide by the legal requirements associated with these rights. • Users may download and print one copy of any publication from the public portal for the purpose of private study or research. • You may not further distribute the material or use it for any profit-making activity or commercial gain • You may freely distribute the URL identifying the publication in the public portal Read more about Creative commons licenses: https://creativecommons.org/licenses/ Take down policy If you believe that this document breaches copyright please contact us providing details, and we will remove access to the work immediately and investigate your claim.
Transcript
LUND UNIVERSITY
PO Box 117221 00 Lund+46 46-222 00 00
Gliding flight in a jackdaw: a wind tunnel study
Rosén, Mikael; Hedenström, Anders
Published in:Journal of Experimental Biology
2001
Link to publication
Citation for published version (APA):Rosén, M., & Hedenström, A. (2001). Gliding flight in a jackdaw: a wind tunnel study. Journal of ExperimentalBiology, 204(6), 1153-1166. http://jeb.biologists.org/cgi/content/abstract/204/6/1153
Total number of authors:2
General rightsUnless other specific re-use rights are stated the following general rights apply:Copyright and moral rights for the publications made accessible in the public portal are retained by the authorsand/or other copyright owners and it is a condition of accessing publications that users recognise and abide by thelegal requirements associated with these rights. • Users may download and print one copy of any publication from the public portal for the purpose of private studyor research. • You may not further distribute the material or use it for any profit-making activity or commercial gain • You may freely distribute the URL identifying the publication in the public portal
Read more about Creative commons licenses: https://creativecommons.org/licenses/Take down policyIf you believe that this document breaches copyright please contact us providing details, and we will removeaccess to the work immediately and investigate your claim.
Gliding is a comparatively inexpensive flight mode in whicha bird covers the aerodynamic cost by losing potential energy.However, the bird needs fuel energy to maintain the force onits wings, by pushing them down and forward, to counteractthe force generated by the airflow on the wings and by gravityon the mass. This cost is estimated to be approximately 3–4times the basal metabolic rate (Hedenström, 1993). Potentialenergy can be stored by soaring in updrafts of thermals, bypowered climbing flight prior to gliding descent or by dynamicsoaring in the wind gradient over the sea. Without the use ofrising air, active climbing flight or a vertical wind gradient, agliding bird will inevitably end up on the ground or the seasurface. In a wind tunnel, it is possible to generate updrafts bytilting the air stream, i.e. the tunnel, thereby continuouslyfeeding energy to the gliding bird. In theory and practise, it istherefore possible to have a bird gliding in front of anexperimenter for prolonged periods.
Gliding flight has previously been studied in wind tunnels(Pennycuick, 1968; Tucker and Parrot, 1970; Withers, 1981;
Spedding, 1987; Tucker, 1987; Tucker, 1992; Tucker and Heine,1990), with the use of a motorized glider in Africa (Pennycuick,1971a; Pennycuick, 1971b), by tracking radar (Spaar andBruderer, 1996; Spaar and Bruderer, 1997) and by range finder(Tucker, 1988; Tucker et al., 1998). However, there is still a needfor more studies in which the kinematics is carefully monitoredto be able to test the predictions of existing gliding flight theory.In this study, we have examined the gliding flight performanceof a passerine, the jackdaw Corvus monedula. The aim was todefine the so-called glide super-polar of a jackdaw, which is theenvelope of all possible fixed-wingspan glide polars (minimumsinking rate with respect to forward airspeed) over a range offorward speeds and sinking speeds (Tucker, 1987; Pennycuick,1989). The super-polar is the polar obtained if the bird ischallenged to perform at its minimum possible glide angle in thetunnel when changing wingspan and wing area. A typical featureof gliding flight is that the bird will flex its wings with increasingforward and sinking speed. Tucker (Tucker, 1987) calculatedthat, by reducing their wingspan, birds are able to minimise the
We examined the gliding flight performance of ajackdaw Corvus monedulain a wind tunnel. The jackdawwas able to glide steadily at speeds between 6 and 11 m s−1.The bird changed its wingspan and wing area over thisspeed range, and we measured the so-called glide super-polar, which is the envelope of fixed-wing glide polars overa range of forward speeds and sinking speeds.
The glide super-polar was an inverted U-shape with aminimum sinking speed (Vms) at 7.4 m s−1 and a speed forbest glide (Vbg) at 8.3 m s−1. At the minimum sinking speed,the associated vertical sinking speed was 0.62 m s−1. Therelationship between the ratio of lift to drag (L:D) andairspeed showed an inverted U-shape with a maximum of12.6 at 8.5 m s−1. Wingspan decreased linearly with speedover the whole speed range investigated. The tail wasspread extensively at low and moderate speeds; at speedsbetween 6 and 9 m s−1, the tail area decreased linearly withspeed, and at speeds above 9 m s−1 the tail was fully furled.Reynolds number calculated with the mean chord as thereference length ranged from 38 000 to 76 000 over thespeed range 6–11 m s−1.
Comparisons of the jackdaw flight performance weremade with existing theory of gliding flight. We also re-analysed data on span ratios with respect to speed in twoother bird species previously studied in wind tunnels. Thesedata indicate that an equation for calculating the spanratio, which minimises the sum of induced and profile drag,does not predict the actual span ratios observed in thesebirds. We derive an alternative equation on the basis of theobserved span ratios for calculating wingspan and wingarea with respect to forward speed in gliding birdsfrom information about body mass, maximum wingspan,maximum wing area and maximum coefficient of lift. Thesealternative equations can be used in combination with anymodel of gliding flight where wing area and wingspan areconsidered to calculate sinking rate with respect to forwardspeed.
Accepted 18 December 2000; published on WWW 26 February 2001
1154
total drag. According to this theory, the wingspan should bemaximised at low speeds, and at a certain speed the wingspanshould be reduced with further increases in forward glidingspeed.
We will compare our results with the existing theory forpredicting sink rate with respect to forward speed in glidingflight (Pennycuick, 1975; Tucker, 1987; Pennycuick, 1989).These comparisons can be made only when accounting forthe differences in body mass and morphology. The wingmorphology determines how efficient the bird is at convertingpotential energy to stay aloft and/or glide for long distancesand it also determines how well a bird can take advantage ofrising air using thermal or slope soaring.
Theory of gliding flightAll measurements made on our bird refer to steady gliding
flight. Hence, all the forces acting on the bird are inequilibrium. In the wind tunnel, this is characterised by the birdbeing stationary with respect to the surrounding test section.When this criterion is met and the gliding angle and forwardspeed are known, it is possible to calculate the sinking speedas observed on the bird in the wind tunnel. The followingtheoretical treatment originates from a study by Pennycuick(Pennycuick, 1968), in which he studied a pigeon Columbalivia gliding in a wind tunnel. Additional information can befound in Tucker (Tucker, 1987) and Pennycuick (Pennycuick,1989).
A bird in steady gliding flight moves forward at speed V witha flight path inclined downwards at an angle (θ) relative to thehorizontal (Fig. 1). To overcome the aerodynamic forces, thebird sinks at a rate Vs, i.e. expends potential energy, which isequal to:
Vs = Vsinθ . (1)
The total aerodynamic force, i.e. the resultant of lift and drag,acting on a bird gliding at equilibrium is directed upwards andis equal in magnitude to the bird’s weight, i.e. mass times theacceleration due to gravity (mg). The aerodynamic force hastwo components. The first is drag (D), which is directedbackwards and parallel to the flight path and is expressed as(see Fig. 1):
D = mgsinθ . (2)
The second component is lift (L), which is directed upwardsand perpendicular to the flight path and is given by (seeFig. 1):
L = mgcosθ . (3)
These two force components, lift and drag, depend on thebird’s size, wing morphology and the airspeed. To make thelift and drag independent of size, wing area and speed andcomparable between birds, it is common practice to convertthem into dimensionless force coefficients. The lift coefficient(CL) is derived using the equation:
CL = L/(GρSV2) , (4)
where GρV2 is the dynamic pressure, which is dependent on airdensity (ρ) and the square of speed (V), and S is the liftingsurface of the bird; S refers to wing area including the areaof the body between the wings (Pennycuick, 1989) unlessexplicitly stated otherwise.
The lift coefficient varies with the orientation of the wing(such as angle of attack) and with Reynolds number Re (seebelow for the definition of Re).
Drag components
As indicated above, generation of lift inevitably creates drag.Total drag (D) is usually divided into three components:
M. ROSÉN AND A. HEDENSTRÖM
Sin
king
spe
ed (V
s)
Horizontal line
Airspeed (V)
mg
−mgLift=mgcosθ
θ
θ
Drag=mgsinθ
Fig. 1. Forces and speed components for steady gliding flight in a bird. The glide path is inclined downwards relative to the horizontal at anangle θ. Lift is perpendicular to, and drag is parallel to, the glide path. The weight (mg) is balanced by the resultant of lift and drag. Airspeed(V) is parallel to the glide path, and sinking speed (Vs) is vertical and positive downwards.
1155Gliding flight in a jackdaw
induced drag (Dind), parasite drag (Dpar) and profile drag (Dpro),which are summed:
D = Dind + Dpar + Dpro. (5)
Induced drag arises when the wings and tail produce the liftrequired to support the bird’s weight. Induced drag is alwayspresent when lift is generated because the wing is movingforward and thereby creating an induced downwash. Theinduced drag of the wings can be written as:
where k is the induced drag factor and is a measure of thedeviation of the true lift distribution from an ideal elliptical liftdistribution (k=1) and b is wingspan. Pennycuick (Pennycuick,1975; Pennycuick, 1989) assumed a value of k=1.1–1.2 forreasonably efficient wing designs in real birds. The defaultvalue for k in gliding flight calculations is usually set at 1.1.
By spreading its tail, a bird can generate an additionalaerodynamic force to that of the wings (Hummel, 1992;Tucker, 1992). Thomas (Thomas, 1993) adapted slender liftingsurface theory to account for the aerodynamic forces of a bird’stail. To calculate the induced drag of the tail according to thistheory, the angle of attack of the tail, among other variables,is required, and we did not measure this for the jackdaw. Wehave therefore not included the lift and drag generated by thetail explicitly in our aerodynamic calculations.
Parasite drag arises from the form and friction drag of thebody. It is proportional to the square of forward speed (∝ V2)and to the cross-sectional frontal area of the bird’s body (Sb)at its widest part, excluding the wings. A streamlined bodyminimises the pressure drag component of parasite drag, i.e.the majority of the drag is due to skin friction, as is the casefor some fast-flying birds such as auks, ducks, shorebirds,falcons and swifts. Parasite drag can be written as:
Dpar = GρSbCD,parV2 , (7)
where CD,par is the parasite drag coefficient that accounts forthe skin friction and the form drag of the body. The parasitedrag coefficient is treated as a constant in the model proposedby Pennycuick (Pennycuick, 1989), but a change in theorientation of the body, e.g. body tilt angle with respect tospeed, will affect the drag of the body.
The wings generate profile drag as they move through theair. Profile drag is a function of wing area, i.e. wing length andchord, and of speed:
Dpro = GρV2SCD,pro, (8)
where S is the wing area and CD,pro is the profile dragcoefficient, which is assigned a default value of 0.014 forgliding flight (Pennycuick, 1989). The profile drag coefficientvaries with the lift coefficient and, therefore, with theorientation of the wing, with speed and with Reynolds number,but over the normal speed range of gliding birds CD,pro istreated as a constant (Pennycuick, 1989). It is assumed that thedrag of the bird is the sum of the separate drag components,
but there may be an additional interference drag when joiningthe body and wings. Following others working on glidingflight aerodynamics, we will assume that interference dragis negligible (e.g. Tucker and Heine, 1990). Using the fullalgebraic expressions for the drag components, adding up tototal drag, equation 5 is expanded to:
Variable wingspan
Tucker (Tucker, 1987) showed that, by adjusting wingspanand wing area, a gliding bird could minimise the total drag atdifferent airspeeds. By reducing the wingspan, induced dragwill increase, but this will be balanced by a simultaneousreduction in wing area and the associated profile drag. Thereis an optimum wingspan and area at each speed that minimisesthe total drag and, hence, gives the minimum rate of sinking.The envelope of all such separate glide polars defines the glidesuper-polar. Tucker (Tucker, 1987) derived an iterative methodto calculate glide super-polars by minimising the total drag ofthe bird. Pennycuick (Pennycuick, 1989) simplified Tucker’s(Tucker, 1987) analysis by minimising the sum of induced andprofile drag. From equation 2, it follows that sinθ=D/mg which,substituted into equation 1, yields:
This equation can be expanded using equation 9 for drag D.After rearrangement, equation 10 becomes:
where we have replaced L from equation 9 by mg, which is areasonable approximation at small glide angles θ. When thewing is flexed, the wingspan and wing area are reduced. Let βbe the span ratio, defined as actual wingspan bobs divided bythe maximum wingspan bmax, and let ε be the ratio betweenactual and maximum wing area Smax(sensuPennycuick, 1989).The relationship between ε and β must pass through the point(β,ε)=(1,1) associated with maximum span and area. The fewempirical data available suggest that the slope of therelationship (planform slope δ) between ε and β is 1 (seebelow), and we will therefore assume that ε=β. We thenreplace b and S in equation 11 with βb and βS, respectively,differentiate Vs with respect to β and set the derivative equalto zero. We solve this equation for β which, after rearranging,gives the following expression for the optimal span ratio β̂associated with minimum drag:
where symbols are defined as before. It is anatomicallyimpossible for the wingspan to equal the optimal wingspan
(12)β̂= ,
8km2g2
πρ2b2SCD,proV4
1/3
(11)Vs = + (SCD,pro + SbCD,par) ,2kmg
πρb2V
ρV3
2mg
(10)Vs = .VD
mg
(9)D = + GρSbCD,parV2 + GρV2SCD,pro .2kL2
πρb2V2
(6)Dind = ,2kL2
πρb2V2
1156
when β̂>1. Therefore,β̂ is set to 1 if calculated values aregreater than 1, while the calculated values of β̂ are used whenthey are less than 1. Tucker’s (Tucker, 1987) calculation isaerodynamically a more stringent approach, but the twomethods give similar results for span ratios in gliding birds.
Materials and methodsThe wind tunnel
The wind tunnel used is of a low-turbulence, closed-circuittype and is situated at the Department of Animal Ecology atLund University, Sweden. Here, we will only give a briefdescription of its main features. The reader interested in moredetails about the design and technical data of this wind tunnelshould consult Pennycuick et al. (Pennycuick et al., 1997). Thetest section is octagonal in cross section, 1.20 m wide and1.08 m high. The length of the effective test section isapproximately 1.8 m, of which the first 1.20 m is covered byacrylic walls and the last 0.5 m is open, giving direct access tothe bird. The speed can be varied continuously in the range0–38 m s−1. The speed range used in this study ranged from 4to 16 m s−1. The tunnel can also be tilted continuously fromhorizontal to give 8 ° descent and 6 ° climb angles. In thisstudy, we had the tunnel blocked at a maximum descent angleof 6.37 °. Note that, even though the speed and tilt angle canbe varied continuously, they are read in intervals of 0.1 m s−1
and 0.03 °, respectively, on the wind tunnel monitor.Upstream from the test section we mounted a fine net made
of braided nylon cord, 0.75 mm in diameter, with a squaremesh of 17 mm×17 mm. This net was used throughout theexperimental period to prevent the bird from flying into thecontraction chamber. The net affects the turbulence level in thetest section, as measured by Pennycuick et al. (Pennycuick etal., 1997), which ranges from less than 0.04 % (measured asthe coefficient of variation in horizontal speed) in the centre ofthe test section without a net to 1.21 % with the net installed.
The jackdaw
A second-year female jackdaw Corvus monedulaL. wascaught at Pildamsparken in Malmö, Sweden, on 18 March1999. The jackdaw is a partially migrating species, withresident populations in southern Scandinavia, whilepopulations breeding in northern Sweden, Finland and Russiaare to a large extent migratory. Jackdaws use both flapping andgliding flight when soaring in the wild and are thereforesuitable for studying gliding flight performance.
Food and housing
The jackdaw was kept in an indoor aviary measuring1.5 m×1.5 m×2 m. On the sides of the aviary, Plexiglas wasmounted inside the net walls to prevent the bird from damagingand abrading its feathers. She was allowed 1 week to becomeaccustomed to her new situation and food, which consisted ofmealworms and dried dog food dampened with water.Vitamins and minerals were added to the food on a weeklybasis.
Flight training
The bird was trained to perch on a stick 1 m long to minimisefeather damage and stress. The stick was always used to handlethe bird in the tunnel and to transport it between the aviary andthe test section of the wind tunnel. Hence, no cuffs, jesses orrings were attached to the bird. In total, the flight training lasted1 week before the experiments started. At first, the bird just saton the stick in the test section with only a very low airspeedturned on, to generate the diagnostic sound of the fan. She veryquickly became accustomed to the new situation. The firstflights were performed with the tunnel in the horizontalposition; the bird was gently tossed off the stick at a moderatewind speed (approximately 8 m s−1) and shortly after allowedto land on the stick again. The time between tossing the birdoff the stick and letting it land again was increased in astepwise manner. After a few days, the bird would fly activelyfor 30 min or more without resting. During flight, the bird wasstable and did not appear stressed, as indicated by a closed bill,fully retracted feet and the head retracted towards the body. Awary bird keeps its head erect and stabilised relative to itssurroundings, whereas the body moves up and down, featurestypical of manoeuvring flight. Furthermore, our experience ofstressed birds is that their bill is open and their legs areoutstretched, held in a position similar to that before landing.None of these features was observed in the jackdaw after a fewdays of acclimation and training.
The next step was to tilt the tunnel to offer the bird anopportunity to glide. At the first attempt, she started to glidefor periods of a few seconds without any encouragement fromthe experimenter. This period was then gradually elongatedand lasted close to 1 min when the bird was fully trained. Thebird did not always glide steadily, but started far back in thetunnel test section and glided forward. However, every glidingsequence contained periods of stable gliding in the test section.
Our definition of equilibrium gliding is that the bird remainsstationary (‘freezes’) in the air stream with no movement withrespect to the wind tunnel test section. Whether the bird wasstill or not was judged by eye and by examining filmedsequences captured with a digital video camera. However,since the jackdaw is a fairly large bird, such movement wasclearly visible by eye. We define steady gliding as a sequenceof gliding lasting at least 5 s. The longest steady glidesobserved during an experiment lasted up to 60 s, but theaverage glide duration was near 10 s.
Morphology
Wingspan and wing area were measured as describedby Pennycuick (Pennycuick, 1989). Maximum wingspanmeasured directly on the bird in the hand was 0.595 m.Tracings of the bird’s wing were analysed using a digitizertable, which gave a wing area of 0.0593 m2, including the areaof the body between the wings. These measurements result inan aspect ratio (wingspan squared divided by wing area) forthe fully stretched wing of 5.97. These measurements wereused only when calculating predictions from aerodynamicequations (e.g. Pennycuick, 1975; Pennycuick, 1989; Tucker,
M. ROSÉN AND A. HEDENSTRÖM
1157Gliding flight in a jackdaw
1987). Our conclusions on flight performance are based onthe measurements derived from digital images captured inconnection with every data point (see below). The body frontalarea measured in flight was 0.0036±0.0001 m2 (mean ±S.D.,N=10). The body mass, m, was relatively stable between flightsessions (m=0.1844±0.0037 kg, mean ±S.D., N=66). The bodymass at the beginning of all flight sessions ranged between0.193 and 0.181 kg. To calculate the body mass for each datapoint, we interpolated from a straight line between the startand end mass for every flight session and used the masscorresponding to the time of measurement.
The flight feathers were in good condition throughout theexperimental period. However, a few tail feathers were lost bybreakage in the housing aviary. They were all replaced usingthin insect needles inserted into the shaft of the feather and heldin place with a tiny drop of superglue. It was not possible todiscriminate between broken and intact tail feathers in flight orwhen analysing the images, so we do not believe that this hadany significant effect on the results.
Physical properties
To standardise the airspeed measurements, all airspeedsgiven in this paper refer to equivalent airspeeds (Ve):
where q is dynamic pressure and ρ0 is the value assumed forthe air density at sea level in International StandardAtmosphere (1.225 kg m−3). The true and equivalent airspeedsare only the same if the air density is ρ0. The wind tunnel issituated close to sea level, and the differences will thereforebe small. The air density varied only between 1.20 and1.23 kg m−3 (see Table 1) throughout the experimental period.Furthermore, the variation in air pressure and temperature inthe test section was quite small (Table 1).
Experimental protocol
During the period 30 March to 19 April 1999, the jackdawwas flown experimentally on 10 occasions. The experimentslasted on average approximately 2 h, ranging between 75 minand 3 h. During the experiments, the bird showed no signs offatigue or abnormal stress. If the bird did not want to fly, it wasfree to land on the floor of the test section, which it never did.
To determine the minimum glide angles at different speeds,we set the forward speed to a value between 4 and 16 m s−1 insteps of 0.5 m s−1 and the tilt angle to the maximum 6.37 °. If
the bird were able to glide at all at the set speeds, we tilted thetunnel back towards the horizontal in steps of 0.03 ° to a pointwhere it was not able to glide. We then tilted the tunnel againgradually to determine the exact minimum tilt angle at whichthe bird could just glide steadily. This determined theminimum tilt angle for this particular forward speed and wasentered as an independent observation. The jackdaw was ableto glide at angles up to 6.37 ° between 6 and 11 m s−1. Todetermine the lowest possible forward speed at maximum tiltangle, the tilt angle was pre-set and the forward speed wasaltered. This procedure was repeated six times over the wholespeed range, generating a total of 66 measured points. Datawere collected in a randomised sequence with at least 1.0 m s−1
between tested airspeeds in the same tidal sequence. Frommeasurements of tilt angle and forward airspeed in the tunnel,the associated sinking speed was calculated according toequation 1.
Photography
For every data point, an image was taken of the bird. To dothis, we used a high-speed camera (RedLake MotionScope PCI500) connected to a personal computer (WinNT 4.0) via aframe grabber. The camera was mounted below the testsection, i.e. looking at the bird from below, on the externalmetal frame of the test section. This arrangement ensured thatthe camera was always perpendicular to the direction of theairflow as it moved with the tunnel when we tilted it up anddown. To illuminate the bird, four 500 W light bulbs were used,also mounted on the outside frame of the test section to ensuresimilar light conditions between film sequences. The camerahad a 4 mm lens and was set to grab 125 frames s−1 with theshutter open for 1/1875 s and an aperture of f=11.
When the bird was gliding steadily, a sequence of imageswas collected. From each sequence, we selected a single JPEGimage to represent the performance at this particularcombination of sinking and forward speeds. This approach alsohelped in deciding whether the bird was really gliding steadilyas we captured a sequence. If there were any movements of thebird forwards or backwards within the tunnel, a new sequencewas collected.
To measure the body frontal area, the bird was filmed frombehind while flying actively at 11 m s−1, and 10 JPEG imageswere captured and used for analysis. For maximum wingspan,the bird was filmed from below in horizontal flapping flight at11 m s−1. Five JPEG images were extracted in mid downstroke.We assumed that the wings were stretched fully in middownstroke and used these measurements as a representativevalue of the maximum wingspan for calculations of span ratio,etc.
To analyses the JPEG images, we used MapinfoProfessional, version 4.5, which allows raster images to beimported and registered as maps, facilitating measurements ofdistance and area. On all 66 images, we measured the wingarea, which includes the area between the wings, tail area andwingspan. To convert the image values of wing area andwingspan, we used a reference length from the tip of the tail
(13)Ve = ,2q
ρ0!
Table 1.Physical properties of the air during the experiments
Temperature Air density Pressure(°C) (kg m−3) (hPa)
Mean ±S.D. 18.2±2.07 1.21±0.01 1016±11(N=66)
Maximum 21.7 1.23 1028Minimum 15.9 1.20 997
1158
to the point where the leading edge of the wing meets the body(0.212 m).
The size of the images was 480 pixels×420 pixels, allowinghigh-resolution analysis. Each image was first zoomed so thatpart of a single pixel could be selected as a starting point. Forwing area and tail area measurements, the perimeter of thewing was marked, including the indentations between singlewing feathers. To measure the area of the body between thewings, a line was interpolated from the joint of the wingleading edge to the body on the left side to that on the right,and from the inner tertial on the right to that on the left side,resulting in one measurement for the whole wing area (seePennycuick, 1989). The tail area was calculated as the areabehind the interpolated line between the tips of the innertertiaries and the area covered by the tail feathers, i.e. wing andtail area taken together occupies the whole projected bird apartfrom the neck and head. Wingspan was measured as a straightline between the outermost tips of the longest primaries. Thiswas the case both for gliding flight and for the measurementsof maximum wingspan on the images collected in flappingflight.
The body frontal area was calculated as the area occupiedby the body as viewed from behind, using maximum wingspanas measured on the bird in flapping flight at 11 m s−1 as thereference length.
ResultsFlight behaviour
The jackdaw usually moved longitudinally within the testsection in a cyclic pattern in which it moved backwards andthen accelerated forwards using a series of wing beats eventhough the tunnel was tilted (see Tucker and Heine, 1990).However, the bird did remain in equilibrium gliding flight forseveral seconds, sometimes for up to a minute, and duringsuch episodes we recorded the wing and tail geometry. It wasquite easy to judge when the bird was gliding at equilibriumand when it was not, but we also used the high-speed videocameras to select moments when the bird remainedmotionless with respect to the test section of the tunnel. Thebird appeared to glide more comfortably at certain speeds,e.g. 8.5–10 m s−1, as indicated by the duration and frequencyof equilibrium gliding episodes. We were able to find a lowesttilt angle at which the bird would glide at equilibrium atall speeds between 6 and 11 m s−1; outside this range, themaximum tilt angle of the tunnel prevented steady gliding.The feet were lowered at speeds of 8.0 m s−1 and below,but only at 6 m s−1 were they lowered at an angle ofapproximately 60 ° (measured from the horizontal) with thetoes opened to maximise drag. At 6.5 m s−1, the feet werepartly closed and the tarsi were raised to approximately 45 °,and at 7 m s−1 the toes were fully closed, but still held in aposition below the body. At 8.5 m s−1 and above, the feet werefully retracted and held close to the body. The tail was spreadmaximally at the lowest speed and was fully furled at9.5 m s−1 and above.
Wingspan and wing area at different speeds and angles
By selecting a few variables such as wingspan, wing areaand span ratio, it is possible to describe the most importantproperties of the wing planform in gliding flight.
The wingspan decreased linearly over the whole speedrange, 6–11 m s−1 (b=−0.028V+0.705, N=66, r2=0.79, P<0.01).The span ratio, expressed as the ratio of observed wingspanbobs to maximal wingspan bmax, shows that the wing was onlyclose to being fully stretched at the very lowest gliding speedsin our measurements (Fig. 2). Maximum wingspan duringflapping flight was measured on the bird at 11 m s−1, assumingthat mid downstroke represents the full wingspan (Fig. 3; filledcircles, bmax=0.569±0.008 m, mean ±S.D., N=5). The aspectratio of the maximally stretched wing measured duringflapping flight at 11 m s−1 was 5.62±0.08, mean ±S.D., N=5).Over the gliding flight speed range, the span ratio (bobs/bmax),where bmaxis 0.569 m, decreased linearly over the gliding flightspeed range, 6–11ms−1 (Fig. 2; bobs/bmax=−0.0488V+1.2391,N=66, r2=0.79, P<0.01). The theoretical optimal span ratio (β̂),according to equation 12, is plotted for comparison in Fig. 2with k=1.1 and CD,pro=0.014 and using the wingspan and areameasured on the bird in the hand (Table 2). The theoreticalspan ratio is maximal (β̂=1) up to 12 m s−1, after which it startsto decrease with further increases in airspeed.
Wing area increased with wingspan as measured on the birdin gliding flight (Fig. 3, open circles) and was best describedby a second-degree polynomial. We also measured the wingarea when manually flexing the wing on the bird and drawingsketches of the wing (Fig. 3, filled triangles). There was nosignificant difference between the two methods, indicating thatthe wing can be flexed only along one geometrical trajectory.For the manually flexed wing, the relationship between wingarea and wingspan is described by S=0.0665b2+0.0316b+0.0156 (Fig. 3; r2=0.99, N=15, P<0.001). The maximum wingarea observed in flapping flight at 11 m s−1 was 0.058±0.002 m2
(mean ±S.D.).
M. ROSÉN AND A. HEDENSTRÖM
0.0
0.2
0.4
0.6
0.8
1.0
1.2
4 5 6 7 8 9 10 11 12 13 14 15 16Airspeed (m s -1)
b obs
/bm
ax
Fig. 2. Span ratio (bobs/bmax) of the jackdaw, where bmax is 0.569 m,decreased linearly over the gliding flight speed range(bobs/bmax=−0.0488V+1.239, N=66, r2=0.79, P<0.01). The span ratiofor the jackdaw, predicted from drag-minimising theory, is plottedfor comparison (equation 12; Pennycuick, 1989).
1159Gliding flight in a jackdaw
We also analysed the wing area ratio (ε) with respect towingspan ratio (β) as shown in Fig. 4 for wingspan and areameasured during flight (N=66). The slope δ of this relationshipwas 0.97 (reduced major axis regression, ε=−0.014+0.97β,d.f.=64), which did not differ significantly from unity (95 %confidence interval for the slope is 0.93–1.01).
Tail area at different speeds and glide angles
The tail was spread extensively at low and moderate speeds.At speeds between 6 and 9 m s−1, the tail area (Stail) decreasedlinearly with speed (Fig. 5; Stail=−0.0016V+0.0203, N=42,r2=0.83, P<0.01). However, above 9 m s−1, we assume that thetail is completely folded and, hence, has the same areairrespective of speed (Stail =0.0056±0.0004 m2, mean ±S.D.,N=24). The tail with maximum spread at 6.1 m s−1 (0.0115 m2,N=1) had an area 2.1 times that of the completely folded tail.
Reynolds number
The dimensionless Reynolds number (Re) is the ratiobetween inertial and frictional forces and is an indexaccounting for the general size of the object affected by the air
stream, airspeed and the properties of the fluid. It has effectson the flow pattern around the wings and, hence, also on thecalculations performed of the coefficients of lift and drag (vonMises, 1945). The Reynolds number is defined as:
where V is airspeed, l is a characteristic length of the objectand v is the kinematic viscosity, i.e. the ratio of the viscosityto the density of the air.
As a representative length to calculate Re, we used the meanwing chord (c), i.e. the ratio of wing area to wingspan. Thechord is normally assumed to be constant over a range ofspeeds, which seems to be a good assumption for the jackdawdata (Fig. 6A; c=0.0002V+0.0948, N=66, r2=0.03, P>0.05). Reranges from 38 000 at 6 m s−1 to 76 000 at 11 m s−1 using themean chord measured for each data point (Fig. 6B).
The glide polar
The bird was flown at different speeds while the tiltangle was changed. In this way, we were able to define the
(14)Re= ,Vl
v
0.00
0.01
0.02
0.03
0.04
0.05
0.06
0.0 0.1 0.2 0.3 0.4 0.5 0.6
Wingspan (m)
Win
g ar
ea (
m2 )
Fig. 3. The relationship between wingspanand wing area of the jackdaw. Open circles,values measured for the bird in glidingflight. Filled triangles, values measuredwhen manually flexing the wing of the birdheld in the hand. There was no significantdifference between the two methods,indicating that the wing can be flexed onlyalong one geometrical trajectory. For themanually flexed wing, the function of wingarea (S) with respect to wingspan (b) isdescribed by S=0.0665b2+0.0316b+0.0156(r2=0.99, N=15, P<0.001). Filled circlesrepresent maximum wingspan as measuredfor the bird in horizontal flapping flight at11 m s−1 (b=0.569±0.008 m, mean ±S.D.,N=5).
Table 2.Data required for calculating stall speed and span ratio for three bird species studied in gliding flight in wind tunnels
bmax Smax m Vmin βe at βe atSpecies (m) (m2) (kg) CL,max (m s−1) Vmin 2Vmin
bmax, maximum wingspan; Smax, maximum wing area;m, body mass; CL,max, maximum value of coefficient of lift; Vmin, stall speedcalculated according to equation 18 (see text); βe, span ratio.
1Jackdaw in the present study, see text.2Tucker and Heine, 1990.3Tucker and Parrot, 1970; Tucker, 1987.To obtain βe at 2Vmin for the Harris’ hawk and laggar falcon, we have re-analysed published data.
1160
minimum sinking speed required for steady gliding flightat a given forward speed (Fig. 7). Fitting a polynomialregression equation to the data, the relationship isVs=0.0424V2−0.624V+2.916 (Fig. 7; solid line, N=66,r2=0.91, P<0.002). This function results in a minimumsinking speed (Vms) of 7.4 m s−1, which is the forward speedassociated with the minimum sinking rate, and a speed forbest glide (Vbg) at 8.3 m s−1, which is the speed associatedwith maximum lift:drag ratio. Minimum sinking speed (Vms)corresponds to a sinking speed of 0.62 m s−1. However,Pennycuick (Pennycuick, 1975) suggested that a function ofthe type:
would be the appropriate form of a fixed-wingspan glide polar,where τ and γ represent different variables, such as wingspan,wing area, weight and other physical properties. The regression
calculated for 1/V and V3 with the intercept set to zero resultsin the expression:
which has a Vms at 6.2 m s−1 and a Vbg at 8.2 m s−1. Vms
corresponds here to a sinking speed of 0.61 m s−1. This functionis less curved than the polynomial regression equation,especially in the lower speed range, and has a slightly differentposition (Fig. 7; broken line, N=66, r2=0.85, P<0.01).
We have also tried to fit the theory according to the super-polar for gliding flight performance proposed by Pennycuick(Pennycuick, 1989) to the jackdaw data by changing variablessuch as k, CD,par and CD,pro in combination with our observeddata on wingspan ratio, bmax, S and Sb. However, we hadlimited success, and the best fit was no better than the fitobtained using the fixed-wingspan model (equation 16; Fig. 7).
Gliding flight performance: lift and drag
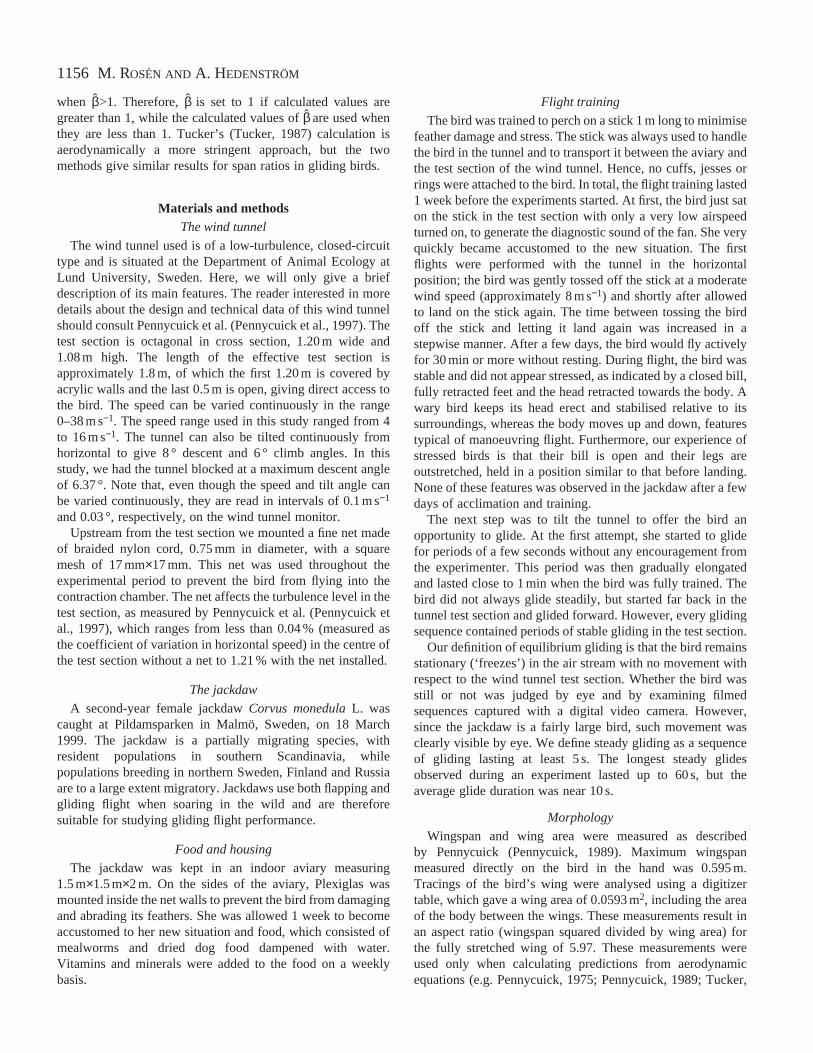
Lift and drag were calculated on the basis of body weightand the angle of the flight path with respect to the horizontal(equations 2 and 3; Fig. 1). The relationship between the ratioof lift to drag (L:D) and airspeed showed an inverted U-shapeand reached a maximum of 12.6 at 8.5 m s−1 (Fig. 8;L:D=−0.611V2+10.43V−31.913, r2=0.67, N=66, P<0.01). The95 % confidence limits for the maximum L:D ratio were 8.42and 8.64 m s−1 for airspeed and 12.05 and 13.16 for the L:Dratio (Bootstrap analysis). To decompose total drag, wecalculated induced drag according to equation 6, with theinduced drag factor (k) set to 1.1, and subtracted it from totaldrag to visualise profile and parasite drag as a single combinedcomponent. Total drag shows a shallow U-shape with respectto speed, while induced drag decreases with speed and thecombined profile and parasite drag increase with speed(Fig. 9).
The lift coefficients were calculated in two different waysusing equation 4: (i) assuming the wing to be the only lift-generating surface according to conventional gliding flighttheory (Fig. 10, solid line), and (ii) including the tail area in
(16)Vs = + 0.00064V3 ,2.83
V
(15)Vs = + γV3 ,τV
M. ROSÉN AND A. HEDENSTRÖM
0.5
0.6
0.7
0.8
0.9
1.0
0.5 0.6 0.7 0.8 0.9 1.0
Wingspan ratio, β
Win
g ar
ea r
atio
, ε
Fig. 4. Wing area ratio (ε=S/Smax) with respect to wingspan ratio(β=bobs/bmax) for a jackdaw in gliding flight (N=66). The reducedmajor axis regression is ε=−0.014+0.97β, with a 95 % confidencelimit for the slope of 0.93–1.01.
0
0.002
0.004
0.006
0.008
0.010
0.012
0.014
4 5 6 7 8 9 10 11 12
Airspeed, V (m s-1)
Tai
l are
a, S
tail
(m2 )
Fig. 5. Tail area Stail with respect to airspeedV for a jackdaw in gliding flight. The tail areadecreased linearly with speed between 6 and 9m s−1 (Stail=−0.0016V+0.0203, N=42, r2=0.83,P<0.01). Above 9 m s−1, the tail is completelyfolded and has the same area irrespective ofspeed (Stail=0.0056±0.0004 m2, mean ±S.D.,N=24).
1161Gliding flight in a jackdaw
the lift-generating surface (Fig. 10, broken line). The jackdawspread its tail extensively at speeds up to 9 m s−1, probably togenerate additional lift. We included the tail area beyond thearea of the completely folded tail in the lift-generating area
when calculating lift coefficients (cf. Fig. 5). This means thatthe tail area at and above 9.5 m s−1, where the tail is completelyfolded, was assigned the value of 0 and at and below 9.0 m s−1
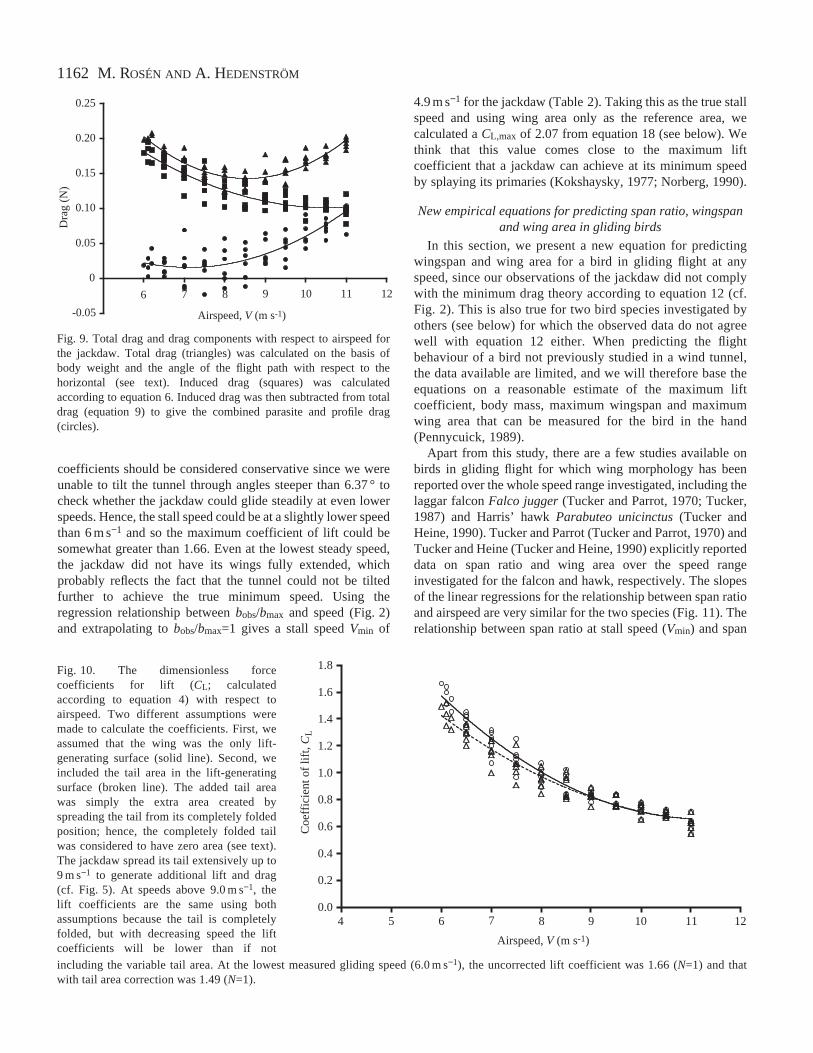
the mean area of the folded tail was subtracted from the totaltail area. At speeds above 9.0 m s−1, the lift coefficients aretherefore the same because the tail is completely folded, butwith decreasing speed the lift coefficients will be lower than ifnot including the variable tail area (Fig. 10). At the lowestmeasured gliding speed (6.0 m s−1), the uncorrected liftcoefficient was 1.66 (N=1) and that with tail area correctionwas 1.49 (N=1). However, our estimates of maximum lift
0.07
0.08
0.09
0.10
0.11
4 5 6 7 8 9 10 11 12
Mea
n ch
ord c
(m
)
A
0
10000
20000
30000
40000
50000
60000
70000
80000
Rey
nold
s nu
mbe
r, R
e
4 5 6 7 8 9 10 11 12
Ai rspeed V (m s-1)
B
Fig. 6. (A) Mean chord c with respect to airspeed Vfor a jackdaw in gliding flight. The ratio of wingarea to wingspan (mean chord) was not affectedby airspeed (c=0.0002V+0.0948, N=66, r2=0.03,P>0.05). (B) Reynolds number Re with respect toairspeed. Re was calculated for the mean chord ofthe wing and ranges from 38 000 at 6 m s−1 to76 000 at 11 m s−1.
Fig. 7. Measured glide super-polar for a jackdaw. Each data pointrepresents the minimum amount of sink (Vs) required for equilibriumgliding at a given forward speed V. The solid line shows the best fitby a polynomial regression: Vs=0.0424V2−0.624V+2.916 (N=66,r2=0.91, P<0.002), where Vs is sinking speed, and has an associatedminimum sinking speed (Vms) of 7.4 m s−1 and a speed for best glide(Vbg) of 8.3 m s−1. If the model proposed by Pennycuick(Pennycuick, 1989) for the calculated fixed-wingspan glide polar isfitted to the data set (broken line), Vms is 6.2 m s−1 and Vbg is8.2 m s−1 (N=66, r2=0.85, P<0.01).
0
0.2
0.4
0.6
0.8
1.0
1.2
1.4
1.65 6 7 8 9 10 11 12
Airspeed, V (m s-1)
Sink
ing
spee
d, Vs
(m s
-1)
Fig. 8. The inverted U-shaped relationship between the ratio of lift todrag (L:D) and airspeed V reached a maximum of 12.6 at 8.5 m s−1
(L:D=−0.611V2+10.43V−31.913, r2=0.67, N=66, P<0.01). The 95 %confidence limits for the maximum are 8.42 and 8.64 m s−1 forairspeed and 12.05 and 13.16 for the L:D ratio (Bootstrap analysis).
0
2
4
6
8
10
12
14
16
5 6 7 8 9 10 11 12
Airspeed, V (m s-1)
L:D
rat
io
1162
coefficients should be considered conservative since we wereunable to tilt the tunnel through angles steeper than 6.37 ° tocheck whether the jackdaw could glide steadily at even lowerspeeds. Hence, the stall speed could be at a slightly lower speedthan 6 m s−1 and so the maximum coefficient of lift could besomewhat greater than 1.66. Even at the lowest steady speed,the jackdaw did not have its wings fully extended, whichprobably reflects the fact that the tunnel could not be tiltedfurther to achieve the true minimum speed. Using theregression relationship between bobs/bmax and speed (Fig. 2)and extrapolating to bobs/bmax=1 gives a stall speed Vmin of
4.9 m s−1 for the jackdaw (Table 2). Taking this as the true stallspeed and using wing area only as the reference area, wecalculated a CL,max of 2.07 from equation 18 (see below). Wethink that this value comes close to the maximum liftcoefficient that a jackdaw can achieve at its minimum speedby splaying its primaries (Kokshaysky, 1977; Norberg, 1990).
New empirical equations for predicting span ratio, wingspanand wing area in gliding birds
In this section, we present a new equation for predictingwingspan and wing area for a bird in gliding flight at anyspeed, since our observations of the jackdaw did not complywith the minimum drag theory according to equation 12 (cf.Fig. 2). This is also true for two bird species investigated byothers (see below) for which the observed data do not agreewell with equation 12 either. When predicting the flightbehaviour of a bird not previously studied in a wind tunnel,the data available are limited, and we will therefore base theequations on a reasonable estimate of the maximum liftcoefficient, body mass, maximum wingspan and maximumwing area that can be measured for the bird in the hand(Pennycuick, 1989).
Apart from this study, there are a few studies available onbirds in gliding flight for which wing morphology has beenreported over the whole speed range investigated, including thelaggar falcon Falco jugger(Tucker and Parrot, 1970; Tucker,1987) and Harris’ hawk Parabuteo unicinctus(Tucker andHeine, 1990). Tucker and Parrot (Tucker and Parrot, 1970) andTucker and Heine (Tucker and Heine, 1990) explicitly reporteddata on span ratio and wing area over the speed rangeinvestigated for the falcon and hawk, respectively. The slopesof the linear regressions for the relationship between span ratioand airspeed are very similar for the two species (Fig. 11). Therelationship between span ratio at stall speed (Vmin) and span
M. ROSÉN AND A. HEDENSTRÖM
-0.05
0
0.05
0.10
0.15
0.20
0.25
9 10 11 12
Airspeed, V (m s-1)
Dra
g (N
)
6 7 8
Fig. 9. Total drag and drag components with respect to airspeed forthe jackdaw. Total drag (triangles) was calculated on the basis ofbody weight and the angle of the flight path with respect to thehorizontal (see text). Induced drag (squares) was calculatedaccording to equation 6. Induced drag was then subtracted from totaldrag (equation 9) to give the combined parasite and profile drag(circles).
Fig. 10. The dimensionless forcecoefficients for lift (CL; calculatedaccording to equation 4) with respect toairspeed. Two different assumptions weremade to calculate the coefficients. First, weassumed that the wing was the only lift-generating surface (solid line). Second, weincluded the tail area in the lift-generatingsurface (broken line). The added tail areawas simply the extra area created byspreading the tail from its completely foldedposition; hence, the completely folded tailwas considered to have zero area (see text).The jackdaw spread its tail extensively up to9 m s−1 to generate additional lift and drag(cf. Fig. 5). At speeds above 9.0 m s−1, thelift coefficients are the same using bothassumptions because the tail is completelyfolded, but with decreasing speed the liftcoefficients will be lower than if notincluding the variable tail area. At the lowest measured gliding speed (6.0 m s−1), the uncorrected lift coefficient was 1.66 (N=1) and thatwith tail area correction was 1.49 (N=1).
0.0
0.2
0.4
0.6
0.8
1.0
1.2
1.4
1.6
1.8
Airspeed, V (m s-1)
Coe
ffic
ient
of l
ift, C
L
4 5 6 7 8 9 10 11 12
1163Gliding flight in a jackdaw
ratio at some multiple of Vmin, for the different birds, is thevariable we will use when predicting span ratio with respect tospeed in gliding birds (Table 2). Span ratio predicted from ourequation will be denoted ‘βe’ (subscript e for empirical) not tobe confused with β̂ predicted from equation 12. We set βe atVmin equal to 1 and calculated that βe at 2Vmin is approximately3/4 for the three species (Table 2). Using this observation andassuming that there is a linear relationship between βe andspeed, we derived the following equation for span ratio as afunction of speed:
The wingspan ratio is maximal (βe=1) at Vmin, i.e. theminimum airspeed at which the bird can produce enough liftfor steady gliding flight. The stall speed is given by:
where the variables are as defined as above (see Table 2).Using the values given in Table 2, one can calculate the actualspan ratio at any speed by using equations 17 and 18. Here, βe
decreases linearly with increasing speed until it reaches aminimum value of 1/3, hence 1/3<βe<1, since there is aminimum possible wingspan ultimately constrained by thediameter of the body. Observed minimum values for spanratios are somewhat higher than 1/3, but Pennycuick(Pennycuick, 1968) reports a minimum span ratio for a pigeon(Columba livia) very close to 1/3. Using equation 17 tocalculate βe, the wingspan can then be calculated as:
b = βebmax , (19)
where bmax is the maximum wingspan measured on the bird.
There is a weak parabolic (cf. Fig. 3; Tucker and Heine,1990) near-linear relationship between wing area andwingspan (Tucker and Parrot, 1970). For simplicity, we willassume a linear relationship between wing area andwingspan. The mean chord (c) of the wing is assumed tostay unchanged with speed (see Fig. 6A), linking wingspanand wing area:
where the variables are as defined as above. By combiningequation 19 and 20, it is possible to calculate the wing area atany speed as:
S= cβebmax. (21)
This approach allows, with information about CL,max, bmax,Smax and m, wing area and wingspan to be calculated at anyforward gliding speed, for any bird. In Fig. 12, we compare thepredictions of the relationship between wing area andwingspan with observed relationships for the falcon, hawkand jackdaw from calculated Vmin to 20 m s−1. The smalldiscrepancy between the observed and predicted values mustbe attributed to the approximations of the relationshipsbetween speed and wing morphology and the assumption thatc is constant.
If we use equation 9 and exchange b and Swith a wingspanand wing area, respectively, that change with speed accordingto equations 17, 19 and 21, we can calculate an alternativegliding flight super-polar based on the actual wingspan andwing areas observed for birds in wind tunnels (as opposed tothe super-polar for which the span ratio is calculated accordingto equation 12). We did this for a bird with the dimensions ofa jackdaw and superimposed the two alternative super-polars
(20)c = = ,S
b
Smax
bmax
(18)Vmin = ,2mg
ρSCL,max!
(17)βe = − .54
V
4Vmin
0
0.5
1.0
Spa
n ra
tio, β
5 10 15 20Airspeed, V (m s-1)
Fig. 11. Observed relationships between span ratio β=bobs/bmax, andairspeed for three birds. Diamonds, Harris’ hawk (Tucker and Heine,1990); triangles, laggar falcon (Tucker and Parrot, 1970); squares,the jackdaw from the present study. The straight lines are regressionlines, which explain between 79 and 98 % of the variation.
Fig. 12. Predicted and observed relationships between wing area andwingspan in three species: Harris’ hawk (diamonds), laggar falcon(triangles) and jackdaw (squares). Symbols are observed values andstraight lines are the predictions from calculated stall speed to20 m s−1 for each bird based on body mass, maximum wingspan,maximum wing area and maximum coefficient of lift (see Table 2).Underlying assumptions are a constant chord, a linear relationshipbetween wing area and wingspan, βe(Vmin)=1 and βe(2Vmin)=3/4,where βe is the span ratio and Vmin is stall speed.
00.020.040.060.080.100.120.140.160.180.20
0 0.2 0.4 0.6 0.8 1.0 1.2
Win
g ar
ea, S
(m
2 )
Wingspan, b (m)
1164
on the jackdaw data (Fig. 13). We compared a glide super-polar calculated from equation 9, using equations 17, 19 and21, with that of the super-polar calculated using equation 12for span ratios minimising induced and profile drag. For bothcurves, we assumed a body drag coefficient CD,par of 0.1(Pennycuick et al., 1996), k=1.1 and CD,pro=0.014. Usingequations 17, 19 and 21, we obtained a better fit to the datathan when using wingspan ratio calculated according toequation 12 (see Fig. 13). We suggest that the default value forCL,max if no information is available for an arbitrary birdspecies should be 1.8 (see Table 2).
DiscussionThe range of speeds for which the jackdaw could glide
steadily in the wind tunnel was 6–11 m s−1, i.e. a rather limitedrange compared with that known to be achieved by birds ofsimilar size (see Pennycuick, 1968). This was due only to thelimitation of angles through which the wind tunnel could betilted. At the lowest speed range, we found a maximum liftcoefficient CL,max of 1.66 or 1.49, depending on whether thetail was included in the lift-generating surface or not. It islikely, however, that the jackdaw is capable of achieving a stillhigher CL since the wings were not fully extended and showedno tendency to stall at the lowest speed measured, perhaps byfurther splaying of the primaries (cf. Kokshaysky, 1977;Norberg, 1990). In the equations for predicting wingspan andwing area, we have assumed a value of CL,max of 2.1 for thejackdaw, which corresponds to a stall speed of 4.9 m s−1. In anycase, our values of CL,max are similar to those found for otherspecies gliding in wind tunnels (see Table 2; Pennycuick,1968; Pennycuick, 1971c; Tucker and Parrot, 1970; Tucker andHeine, 1990).
Tucker (Tucker, 1988) reports lift coefficients of up to 2.2
in free-flying African white-backed vultures Gyps africanus.Tucker (Tucker, 1993) found that, in wings with slotted wing-tips, induced drag can be reduced by vertical spreading of thevortices shed at the wingtip compared with a wing withoutsuch slots. The maximum lift to drag ratio was 12.6±0.55(mean ±95 % confidence interval) at 8.5 m s−1 in the jackdaw,which is near the speed for the best glide ratio, as calculatedfrom the polynomial regression for the data points on theglide super-polar (Vbg=8.3 m s−1, associated with a sinkingspeed of 0.62 m s−1 to give a glide ratio of 13.4:1). Ideally,the maximum lift to drag ratio should be equal to the bestglide ratio, but the discrepancy found here can be attributedto measurement errors and to small variations in body massbetween test sessions. In comparison with the pigeon(Pennycuick, 1968), the jackdaw appears to be better adaptedfor efficient gliding flight. In fact, it shows a maximum liftto drag ratio slightly higher than that of the Harris’ hawk(Tucker and Heine, 1990), but substantially lower than thatof albatrosses (Idrac, 1924; Pennycuick, 1982).
An interesting feature of the jackdaw was the near-linearrelationship between wingspan and speed, such that thewingspan was near maximal only at the lowest speed and thendecreased linearly with increasing speed. This was clearly atvariance with the expected behaviour if the bird were tominimise induced and profile drag (equation 12; Pennycuick,1989). We therefore re-examined previous data published insupport of such a prediction of span ratio in gliding flight(Pennycuick, 1968; Parrot, 1970; Tucker and Parrot, 1970;Tucker, 1987; Tucker and Heine, 1990). For four species forwhich wingspan has been measured with respect to speed,three (pigeon, laggar falcon and Harris’ hawk) showed a near-linear reduction starting at low speeds, similar to that of thejackdaw, while the fourth species (black vulture Coragypsatratus) showed no reduction with increasing speed. For twoof the species, values for span ratios were given explicitly inthe literature, allowing the data to be re-examined (laggarfalcon and Harris’ hawk). The relationships between span ratioat stall speed (Vmin) and span ratio at some multiple of Vmin
were very similar for the different species (Table 2), and thestraight-line regressions in Fig. 11 explain between 79 and98 % of the variation in the three data sets.
We tried, with little success, to modify equation 12 to fit theobserved behaviour assuming that the drag-minimisingconcept is correct, but that the relative magnitudes of thedifferent drag components, induced and profile drag, might bewrong. One explanation is that induced drag has beenoverestimated and that the wings of a bird are capable ofproducing sufficient lift with submaximal wingspan at mostspeeds. Flexing the wings, thereby reducing the wingspan andarea, would then minimise the profile drag at all speeds. Theinduced drag factor (k) is usually set at 1.1 for gliding flight.Raspet (Raspet, 1960) and Cone (Cone, 1962) (cited inPennycuick, 1971b) did suggest that values of k even lowerthan 1 (k=1 is the value for a wing with perfectly elliptical liftdistribution) could be achieved in birds with slotted wings (seealso Tucker, 1995). The derivation of equation 12 assumed that
M. ROSÉN AND A. HEDENSTRÖM
0
0.2
0.4
0.6
0.8
1.0
1.2
1.4
5 6 7 8 9 10 11 12
Airspeed, V (m s-1)
Sink
ing
spee
d, Vs
(m s
-1)
Fig. 13. Maximum performance during forward gliding flight for ajackdaw flying in a windtunnel. The upper curve is the maximumperformance curve calculated according Pennycuick (Pennycuick,1989) and using equation 12 to calculate the wingspan ratio. Thelower curve is calculated according to the same theory, but insteadusing equations 17, 19 and 21 to calculate wingspan and area atdifferent speeds. Parameter valued were k (induced drag factor)=1.1,CD,par (parasite drag coefficient)=0.1 and CD,pro (profile dragcoefficient)=0.014.
1165Gliding flight in a jackdaw
the planform slope (δ) is 1 and, in fact, it was not significantlydifferent from 1 for the jackdaw. The variables in thedenominator of the right-hand side of equation 12 are fairlywell defined and should not have caused the discrepancy. Onechange that would shift the speed downwards where β=1 is thatthe dependence of speed itself should be stronger than V−0.75.Consequently, a stronger dependence on speed could mean thatprofile drag increases more strongly with increasing speed thanis currently believed.
The attempt to fit equation 12 to the observed span reductionin the three bird species with these modifications failed. Wesuggest, therefore, that the model for predicting span ratiosaccording to equation 12 should be rejected with respect to theavailable data. Instead of using equation 12, we propose thatequations 17, 19 and 21 should be used when calculatinggliding flight super-polars in birds, using for example thesoftware supplied by Pennycuick (Pennycuick, 1989). Thisapproach to calculating βe is based on the few studies availablefor which wingspan over a speed range has been measured andexplicitly given in the literature, and it therefore representsan entirely empirical basis for this proposition. It would, ofcourse, be desirable to find an aerodynamic explanation for theobserved linear reduction in wingspan with increasing speedrelated to that proposed by Tucker (Tucker, 1987). Thevariable with the lowest reliability in this model is probablyCL,max, which has been shown to be hard to measure accurately(Tucker and Heine, 1990).
We have also tried to give a simple equation to calculatewing area for a bird given information about its maximumwingspan, mean chord and βe (equation 21). This equationgives predictions reasonably close to the observed values (seeFig. 12), but there are still some small discrepancies that canbe attributed to the small error in the assumed relationshipbetween wing morphology and speed. However, our aim is topropose a set of equations requiring a minimum number ofvariables to give a reasonable prediction that can be used forany species. By measuring a bird’s body mass, maximumwingspan and corresponding wing area according toPennycuick (Pennycuick, 1989), and assuming a value for themaximum coefficient of lift, it is possible to estimate thewingspan and wing area at any speed for a bird. Thesemorphological data can then be used to calculate the super-polar for gliding flight (Fig. 13), for example using theprograms supplied by Pennycuick (Pennycuick, 1989). The useof equations 17, 19 and 21 to estimate wingspan and area,rather than equation 12, gives an improved fit with data for thejackdaw in gliding flight. However, by studying more species,it should be possible to obtain more accurate estimates ofCL,max and of the relationship between βe and speed and,ultimately, also better predictions from a modified flightmodel.
List of symbolsb wingspanbmax maximum wingspan
bobs observed wingspanc wing chordCD,pro profile drag coefficientCD,par parasite drag coefficientCL lift coefficientCL,max maximum lift coefficientD drag forceDind induced drag forceDpar parasite drag forceDpro profile drag forceg acceleration due to gravityk induced drag factorL lift forcel lengthm body massq dynamic pressureRe Reynolds numberS wing areaSb body frontal areaSmax maximum wing areaStail tail areaV speedVbg speed for best glide ratioVe equivalent air speedVmin stall speedVms speed for minimum sinkVs sinking speedβ span ratio (bobs/bmax)β̂ optimal span ratio, minimising total dragβe empirical span ratioδ planform slopeε wing area ratio (S/Smax)γ a parameterν kinematic viscosityπ the ratio of the circumference to the diameter of a
circleθ angleρ air densityρ0 air density at sea level in International Standard
Atmosphere (1.225 kg m−3)τ α parameter
We are grateful to Lennart Blomquist and KennethBengtsson for catching the jackdaw. We are also grateful toColin Pennycuick for constructive comments on an earlierversion of this paper and to Kirsty Park for help with theBootstrap analysis. An anonymous referee provided careful andconstructive criticism that significantly improved the paper.This research was supported by the Swedish Natural ScienceResearch Council and Carl Tryggers Foundation to A.H.
ReferencesHedenström, A. (1993). Migration by soaring or flapping flight in
birds: the relative importance of flight cost and speed. Phil. Trans.R. Soc. Lond. B 342, 353–361.
1166
Hummel, D. (1992). Aerodynamic investigations on tail effects inbirds. Z. Flugwissenschaften Weltraumsfirschung16, 159–168.
Idrac, M. P. (1924). Contributions à l’étude duvol des albatros. C.R.Acad. Sci. Paris179, 28–30.
Kokshaysky, N. V.(1977). Some scale dependent problems in aerialanimal locomotion. In Scale Effects in Animal Locomotion(ed. T.J. Pedley), pp. 421–435. London: Academic Press.
Norberg, U. M. (1990). Vertebrate Flight.Berlin: Springer-Verlag.Parrott, C. G. (1970). Aerodynamics of gliding flight of a black
vulture Coragyps atratus. J. Exp. Biol. 53, 363–374.Pennycuick, C. J.(1968). A wind-tunnel study of gliding flight in
the pigeon Columba livia. J. Exp. Biol.49, 509–526.Pennycuick, C. J.(1971a). Soaring behaviour and performance of
some east African birds, observed from a motor-glider. Ibis 114,178–218.
Pennycuick, C. J.(1971b). Gliding flight of the white-backed vultureGyps africanus. J. Exp. Biol.55, 13–38.
Pennycuick, C. J. (1971c). Gliding flight of the dog-faced batRousettus aegyptiacusin a wind tunnel. J. Exp. Biol.55, 833–845.
Pennycuick, C. J.(1975). Mechanics of flight. In Avian Biology(ed.D. S. Farner and J. R. King), pp. 1–75. New York: Academic Press.
Pennycuick, C. J. (1982). The flight of petrels and albatrosses(Procellariiformes), observed in South Georgia and its vicinity.Phil. Trans. R. Soc. Lond. B300, 75–106.
Pennycuick, C. J. (1989). Bird Flight Performance: A PracticalCalculation Manual. Oxford: Oxford University Press.
Pennycuick, C. J., Alerstam, T. and Hedenström, A.(1997). A newlow-turbulence wind tunnel for bird flight experiments at LundUniversity, Sweden. J. Exp. Biol.200, 1441–1449.
Pennycuick, C. J., Klaassen, M., Kvist, A. and Lindström, Å.(1996). Wing beat frequency and the body drag anomaly: windtunnel observations on a thrush nightingale (Luscinia luscinia) anda teal (Anas crecca). J. Exp. Biol.199, 2757–2765.
Raspet, A.(1960). Biophysics of bird flight. Science 132, 191–200.Spaar, R. and Bruderer, B. (1996). Soaring migration of steppe
eagles Aquila nepalensisin southern Israel: flight behaviourunder various wing and thermal conditions. J. Avian Biol.27,289–301.
Spaar, R. and Bruderer, B. (1997). Optimal flight behaviour ofsoaring migrants: a case study of migrating steppe buzzards, Buteobuteo vulpinus. Behav. Ecol.8, 288–297.
Spedding, G. R.(1987). The wake of a kestrel Falco tinnunculusingliding flight. J. Exp. Biol. 127, 45–57.
Thomas, A. L. R. (1993). On the aerodynamics of birds’ tails. Phil.Trans. R. Soc. Lond. B340, 361–380.
Tucker, V. A. (1987). Gliding birds: the effect of variable wingspan.J. Exp. Biol.133, 33–58.
Tucker, V. A. (1988). Gliding birds: descending flight of the white-backed vulture, Gyps africanus. J. Exp. Biol.140, 325–344.
Tucker, V. A. (1992). Pitching equilibrium, wingspan and tail spanin a gliding Harris’ hawk, Parabuteo unicinctus. J. Exp. Biol.165,21–41.
Tucker, V. A. (1993). Gliding birds: reduction of induced drag bywing tip slots between the primary feathers. J. Exp. Biol.180,285–310.
Tucker, V. A. (1995). Drag reduction by wing tip slots in a glidingHarris’ hawk, Parabuteo unicinctus. J. Exp. Biol.198, 775–781.
Tucker, V. A., Cade, T. J. and Tucker, A. E.(1998). Diving speedsand angles of a gyrfalcon (Falco rusticolus). J. Exp. Biol.201,2061–2070.
Tucker, V. A. and Heine, C.(1990). Aerodynamics of gliding flightin a Harris’ hawk, Parabuteo unicinctus. J. Exp. Biol. 149,469–489.
Tucker, V. A. and Parrot, G. C. (1970). Aerodynamics of glidingflight in a falcon and other birds. J. Exp. Biol.52, 345–367.
von Mises, R.(1945). Theory of Flight. New York: McGraw-Hill.(Dover edition, 1959).
Withers, P. C. (1981). The aerodynamic performance of the wing inred-shouldered hawk Buteo linearisand a possible aeroelastic roleof wing-tip slots. Ibis 123, 239–247.