Global developments in alcohol policies: Progress in implementaon of the WHO global strategy to reduce the harmful use of alcohol since 2010 Background paper developed for the WHO Forum on Alcohol, Drugs and Addicve Behaviours, 26-28 June 2017 Prepared by David Jernigan, Director, Center on Alcohol Markeng and Youth, Department of Health, Behavior and Society, Johns Hopkins Bloomberg School of Public Health and with contribuons from Pamela Trangenstein, Center on Alcohol Mar- keng and Youth, Department of Health, Behavior and Society, Johns Hopkins Bloomberg School of Public Health WHO Forum on alcohol, drugs and addictive behaviours Enhancing public health actions through partnerships and collaboration 26-28 June 2017, WHO headquarters Geneva, Switzerland
Transcript
Global developments in alcohol policies:
Progress in implementation of the
WHO global strategy to reduce the
harmful use of alcohol since 2010
Background paper
developed for the WHO Forum on Alcohol, Drugs and Addictive Behaviours,
26-28 June 2017
Prepared by David Jernigan, Director, Center on Alcohol Marketing and Youth, Department of Health, Behavior and Society,
Johns Hopkins Bloomberg School of Public Health and with contributions from Pamela Trangenstein, Center on Alcohol Mar-
keting and Youth, Department of Health, Behavior and Society, Johns Hopkins Bloomberg School of Public Health
WHO Forum on alcohol, drugs and addictive behaviours
Enhancing public health actions through partnerships and collaboration
26-28 June 2017, WHO headquarters Geneva, Switzerland
Global developments in alcohol policies:
progress in implementation of the WHO global strategy to reduce the harmful use of alcohol since 2010
Background paper1
developed for the WHO Forum on Alcohol, Drugs and Addictive Behaviours,
26-28 June 2017
Prepared by David Jernigan,
Director, Center on Alcohol Marketing and Youth, Department of Health, Behavior and Society, Johns Hopkins Bloomberg School of
Public Health
with contributions from Pamela Trangenstein, Center on Alcohol Marketing and Youth, Department of Health, Behavior and Society,
Johns Hopkins Bloomberg School of Public Health
1 Commissioned by WHO Management of Substance Abuse at the Department of Mental Health and Substance Abuse
i
Table of Contents
Executive Summary ................................................................................................................................................................. v
Brief Interventions and Treatment ................................................................................................................................ 10
Warning and Consumer Information Labels .............................................................................................................. 11
Community Action ................................................................................................................................................................ 12
Conclusions: Breakthroughs, Setbacks and the Way Forward ........................................................................... 12
iii
Figures
Figure 1. Responding countries ..................................................................................................................................................... 2
Figure 2. Development of national written alcohol policies between 2010 and 2015, by WHO Region and percent of countries ................................................................................................................................................................... 3
Figure 3. Implemented a new national public awareness programme(s) on harmful use of alcohol since 2010, by WHO Region and percent of countries ......................................................................................................... 4
Figure 4: Countries reporting additional resources for national alcohol policy implementation since 2010, by World Bank income group ............................................................................................................................................ 4
Figure 5. Changes in levels of excise taxes on alcohol compared to 2010, by survey category increment and number of responses ........................................................................................................................................... 5
Figure 6. Changes in excise taxes on alcohol compared to 2010, by WHO region and percent of countries .................................................................................................................................................................................................. 6
Figure 7. Trends in statutory regulations for marketing since 2010 by Number of Countries ........................ 7
Figure 8. Current level of statutory regulations for new marketing techniques since 2010, by WHO Region and percent of countries .................................................................................................................................................... 8
Figure 9. Blood alcohol concentration limit for the general population ...................................................................... 9
Figure 10: Countries reporting increases in level of screening and brief interventions for hazardous and harmful drinking in primary health care settings since 2010, by World Bank Income Group ............... 10
Figure 11. Mandatory labelling of alcoholic beverages to indicate harm since 2010, by WHO Region and percent of countries ................................................................................................................................................................. 11
Figure 12. Overall scope and intensity of government policies and activities in community action since 2010, by WHO Region and percent of countries ....................................................................................................... 12
iv
Executive Summary
Harmful use of alcohol is one of the four key risk factors underlying what WHO Director-General Dr. Margaret Chan has termed the “slow motion disaster” of non-communicable diseases (Chan 2017). The inclusion of harmful use of alcohol as an indicator under the health goal in the UN 2030 Agenda for Sustainable Development further illustrates the importance of harmful use of alcohol as a development issue.
The WHO strategy to reduce the harmful use of alcohol was endorsed by the World Health Assembly in 2010 (WHO, 2010) with the vision of improving health and social outcomes for individuals, families and communities through considerably reduced morbidity and mortality due to harmful use of alcohol and their ensuing social consequences.
This report assesses progress in implementation of this strategy since 2010, based on responses to a questionnaire sent to WHO global focal points in all WHO Member States in 2016. The report focuses particularly, but not exclusively, on the “best buy” strategies identified in appendix 3 in WHO’s Global action plan for the prevention and control of noncommunicable diseases 2013 – 2020 as the most cost-effective policy options and interventions in reducing alcohol-related harm (WHO, 2013, 2017).
The most commonly implemented “best buy” has been tax increases – 59% of responding countries report a tax increase on alcoholic beverages since 2010. However, only a third of countries adjust those taxes regularly for inflation, and eight countries (five of them in EUR) reported increasing their subsidies for alcohol production.
Comprehensive restrictions on marketing of alcoholic beverages is another “best buy”, but here it is difficult to discern a clear trend since 2010, with some countries reporting more restrictions, some fewer, and many – 24 – indicating no activity before or after 2010. In areas such as alcohol industry sponsorship of events, nearly as many countries have decreased restrictions as have increased them.
Similarly, regarding physical availability, although individual countries have shown that restrictions can significantly reduce alcohol-related harm, including homicides and late-night assaults (Chan 2017), similar numbers of countries reported decreasing regulation as increasing it. Several countries increased their purchase ages for beer, but several more reported no such age limits.
Drink–driving countermeasures have seen significant progress, with 5.48 billion people globally now covered by laws mandating a maximum blood alcohol content (BAC) of 0.05% for drivers, and more than half of countries reporting an increase in the scope or intensity of sobriety checkpoints.
Screening and brief intervention (SBI) shows great promise in identifying drinkers with hazardous and harmful patterns of drinking and reducing the cost of their treatment. While 52% of countries reported an increase in such programs, progress was skewed towards the wealthiest countries. Sixty-five percent of the countries without SBI in primary health care and 92% of countries with no treatment capacity for alcohol use disorders are low or middle-income.
An additional 18 countries have mandated warning labels on alcoholic beverages since 2010, rendering 48% of the world’s population protected by such laws. The number of countries using
v
tax stamps and other methods to tackle informal or illicit alcohol has grown, but most countries reported no change in efforts to address this sector.
Support for community action to address alcohol-related harm increased in 53% of reporting countries, and 16 countries increased this substantially. Across the WHO Regions, there was more support for alcohol-free environments and events, programmes and policies for populations at risk, and efforts to keep youth from drinking.
With the exception of alcohol taxes, progress has been greatest in areas least likely to provoke opposition, and also least likely to yield population-level reductions in the harmful use of alcohol. Many countries still lack a written national alcohol policy, and commonly reported barriers and setbacks include a lack of political commitment or priority, along with a lack of resources.
While the scope and intensity of national efforts to address alcohol-related harm have increased, resources have not, particularly in low- and middle-income countries where alcohol consumption and related harm are likely to be rising most rapidly. Not a single low-income country reported increases in resources devoted to alcohol policy implementation since 2010.
In the absence of significant resources dedicated to these problems at the global or national level, the progress made since 2010 in implementing the global strategy to reduce alcohol-related harm is remarkable. However, the available evidence shows that progress has been skewed towards wealthier countries, with low- and middle-income countries having a tendency to experience increased challenges with alcohol consumption and alcohol control.
The “slow-moving disaster” of harmful use of alcohol will not abate without significant further global and national commitment, investment, and coordinated action to increase regulatory and enforcement capacity in order to assure the health and safety of individuals, families and communities across the globe.
vi
Introduction
Alcohol is responsible for 3.3 million deaths annually worldwide, and is a causal factor in more than 200 disease and injury conditions (World Health Organization 2014). Globally, the level of harm attributable to alcohol use is close to that of tobacco, and affects the young in particular. In all areas of the world except the eastern Mediterranean, harmful use of alcohol is the leading cause of death and disability for males in between the ages of 15 and 24, and for females in this age group in the wealthy countries and the Americas (Gore, Bloem et al. 2011). The inclusion of a target to strengthen the prevention and treatment of substance abuse, including harmful use of alcohol, under the health goal in the UN 2030 Agenda for Sustainable Development illustrates recognition of harmful use of alcohol as a development issue.
WHO’s global strategy to reduce the harmful use of alcohol (hereafter referred to as the global alcohol strategy), endorsed by the World Health Assembly in 2010, laid out ten areas for action by Member States (World Health Organization 2010). WHO’s global action plan for the prevention and control non-communicable diseases 2013 – 2020 (hereafter called the NCD action plan) through its appendix 3 further identified three key areas as “best buys” (effective and cost-effective interventions to reduce alcohol-related harm across the population): regulating commercial and public availability of alcohol; restricting or banning alcohol advertising and promotions; and using pricing policies such as excise tax increases on alcoholic beverages (World Health Organization 2013). The list of “best buys,” or the most cost-effective policy options and interventions in appendix 3, is evolving: further discussion in the World Health Assembly in 2017 has sharpened the focus of the three interventions and added the enactment and enforcement of drink-driving laws and blood alcohol concentration limits via sobriety checkpoints, and the provision of brief psychosocial interventions for persons with hazardous and harmful alcohol use, as well as seven other interventions which are important in supporting implementation of the most cost-effective interventions (World Health Organization 2016, World Health Organization 2017). Framing these interventions are three overarching/enabling actions: implementing the global alcohol strategy; strengthening leadership, commitment and capacity; and increasing awareness and strengthening the knowledge base on the magnitude and nature of problems caused by harmful use of alcohol.
The purpose of this report is to explore progress made, between the years of 2010 and 2015, in implementing the global strategy to reduce the harmful use of alcohol and enacting and implementing alcohol control policies and interventions, with a particular focus on the implementation of the “best buys.” In light of priorities set subsequently through the NCD action plan, the report explores what countries have actually done regarding the “best buys” as well as the overarching actions that provide the context for effective action.
Methods
The methods used to develop this report are similar to those used in prior global status reports on alcohol and health (see e.g., World Health Organization 2014, Appendix IV). Briefly, national counterparts or focal points in all WHO Member States in each region were officially nominated by their respective ministries of health. These national representatives were provided access to an online survey data collection tool - the 2015 Global Questionnaire on Progress in Alcohol Policy - developed by the WHO Secretariat and the steering committee of the Global Information System on Alcohol and Health based on data collection tools used previously to develop the global status reports on alcohol and health. Where online completion was not feasible, a hard copy of the tool was forwarded directly to those who requested it. The questions
1 | P a g e
were divided into ten sections, corresponding with the ten areas of the WHO global alcohol strategy, followed by a summary section requesting important achievements and setbacks, as well as a timeline of major steps or milestones in each country’s efforts to develop policy and action to reduce alcohol-related harm.
A total of 138 out of 194 invited countries responded to the questionnaire, for an overall response rate of 71%. The response rate varied by region, ranging from 55% in the WHO South-East Asia Region to 86% in the WHO Americas and Eastern Mediterranean Regions.
Of the 138 countries that responded to the 2015 Global Questionnaire on Progress in Alcohol Policy, 7 have a total ban on alcohol at the national level, meaning residents of the country are not permitted to drink alcohol. These countries’ data are included when describing activities relating to overarching aims and public awareness; brief interventions and treatment; drink-driving policies and countermeasures; and illicit alcohol. These countries are excluded from reporting on other activities.
Figure 1. Responding countries
Progress on Overarching Actions
Implementation of the global alcohol strategy has been uneven across the world. The good news is that the majority of reporting countries (62%, or 78 countries) reported somewhat (51 countries) or substantially (27 countries) increased scope and intensity of government policies in leadership, awareness and commitment to addressing alcohol-related harm since 2010. Regionally, implementation has been lowest in the Southeast Asian Region (SEAR) and the Eastern Mediterranean Region (EMR), where only one country reported a substantial increase in activities and scope, and highest in the European Region (EUR), where nine countries reported such an increase.
One measure of a nation’s commitment to reducing alcohol-related harm is the presence or absence of a national alcohol policy. These can be either separate documents or part of a broader public health policy, such as substance abuse, non-communicable disease, or mental health. Ideally, these policies will be adequately funded, establish clear leadership and delineate
2 | P a g e
a clear division of responsibility for involved sectors, and specify attainable objectives, strategies, and targets (World Health Organization 2010).
Since 2010, twenty-nine countries (21.0%) moved toward developing a national or general alcohol policy/strategy and 42 (34.1%) enacted a policy/strategy. The most progress occurred in EUR (20 policies enacted) and WPR (10 policies enacted).
However, the patchwork of countries with a national alcohol policy in place or under development reflects the uneven nature of uptake of the global alcohol strategy. As the map below shows, as of 2015 such strategies are most prevalent in EUR and WPR, and least common in EMR and AMR. Overall, 42 of WHO’s Member States developed or revised written national alcohol policies between 2010 and 2015 (34% of reporting countries; see Figure 2). The proportion of countries that developed or revised written national alcohol policies varied across regions from 10% of reporting countries in the WHO Americas Region to 59% of reporting countries in the WHO Western Pacific Region.
Figure 2. Development of national written alcohol policies between 2010 and 2015, by WHO Region and percent of countries
(n=138 countries reporting)
The national alcohol policies developed or revised since 2010 covered approximately 2.51 billion people, with another 922 million people expected to be covered by the policies currently under development. The proportion of the population covered by new or revised written national alcohol policies varies according to region, from 1% of the population in reporting countries in the SEAR to 95% of the population in reporting countries in WPR.
While increasing awareness of alcohol-related harms can build support toward more effective policies (Casswell, Gilmore et al. 1989), awareness campaigns alone have been found to produce little change in behavior (Janssen, Mathijssen et al. 2013). However, one of the aims of the global alcohol strategy was to raise global awareness of the magnitude and nature of health, social and economic problems caused by harmful use of alcohol. Fifty-five countries reported having implemented a new public awareness programme on harmful use of alcohol since 2010, and an additional 20 continued programmes in place prior to that year, as shown in Figure 3 below.
3 | P a g e
Figure 3. Implemented a new national public awareness programme(s) on harmful use of alcohol since 2010, by WHO Region and percent of countries
(n= 134 countries reporting)
Another critical measure of national commitment to reducing alcohol-related harm is the level of resources devoted to national alcohol policy implementation. On this indicator, only 7 countries reported a substantial increase in resources, and the plurality of countries (51) indicated that resources had stayed about the same. In 20 countries, including 9 African countries, resources were largely absent both before and after the passage of the global alcohol strategy. In fact, not a single low-income country reported increased resources devoted to alcohol policy implementation since 2010, and devotion of additional resources rose by income. Figure 4 shows this by grouping the countries by World Bank income group – note that it shows only three “slices” because no low-income countries increased resources during this time.
Figure 4: Countries reporting additional resources for national alcohol policy implementation since 2010, by World Bank income group
Monitoring and surveillance of alcohol consumption and related harm is another important overarching area of activity. For most countries (69 of 128 reporting), there was no change in activity here, with 11 countries reporting no activity either before or after passage of the global alcohol strategy; again, inactivity was most common in low-income countries.
1 3 4
11 6
14 14
4 6 55
3 4
1
7
1
4 20
15 18
2 14
1 5 55
0%
20%
40%
60%
80%
100%
AFR AMR EMR EUR SEAR WPR World
Perc
ent o
f Cou
ntrie
s
Region Yes (n=55)
Programme(s) established prior to 2010 (n=20)
No (n=55)
Programme(s) established prior to 2010, terminated after 2010 and then (re)established(n=4)
4 | P a g e
“Best Buys”: Pricing and Taxation
The global alcohol strategy terms increasing the price of alcohol “one of the most effective interventions to reduce harmful use of alcohol” (World Health Organization 2010). In addition to taxation, price interventions include minimum pricing, regular reviews of alcohol prices with regard to inflation and incomes, and bans on discounting.
Most important among these is increasing taxes, and most countries were active here. Overall, 78 of the reporting countries (62%) increased excise taxes on alcohol somewhat (52) or substantially (25) since 2010.
Figure 5. Changes in levels of excise taxes on alcohol compared to 2010, by survey category increment and number of responses
(n=126 countries reporting)
Tax increases were most common in the WPR (75% of reporting countries) and EUR (73%), and least common in the EMR (30%) and AMR (45%).
52
25
45
2 1 0
10
20
30
40
50
60
70
80
90
Increase (n=78) About the same (n=45) Largely absent both beforeand after 2010 (n=2)
Figure 6. Changes in excise taxes on alcohol compared to 2010, by WHO region and percent of countries
(N=126 countries reporting)
Overall, 5 billion people were covered by alcohol excise tax increases since 2010, representing 76% of the population of the countries that responded to the WHO 2015 Global Questionnaire on Progress in Alcohol Policy. The highest proportion of the population was covered by excise tax increases in AFR and WPR (88%), and the lowest proportion was in AMR (43%).
However, failure to adjust alcohol excise taxes for inflation can undercut their effectiveness, because excise taxes are generally based on the volume of the beverage. Since volume does not change over time, whereas inflation renders currencies less valuable, taxes effectively decline in value for every year with inflation. In contrast to countries reporting tax increases, only 23% of responding countries put in place new policies to adjust alcohol excise taxes for inflation since 2010, bringing the worldwide percentage to 32% of reporting countries with a policy to adjust excise taxes for inflation.
There is growing evidence suggesting that setting a minimum price for alcohol can reduce consumption and problems (Burton, Henn et al. 2017). Ten countries – four in AFR, three in AMR, and three in EUR – reported implementing such a policy since 2010.
Government subsidies for alcohol production can make alcohol less expensive, undercutting the effectiveness of tax systems in reducing harmful use and related harms. Two countries somewhat reduced the level of subsidies to alcohol industries since 2015, while eight countries – five of which were European – increased subsidies. To the extent that these subsidies support exports, they can also undermine the efforts of other countries to reduce alcohol-related harm.
Substantially increased (n=26) Largely absent both before and after 2010 (n=1)
6 | P a g e
“Best Buys”: Marketing Restrictions
With evidence growing that exposure to alcohol marketing is associated with hazardous alcohol consumption among young people (Jernigan, Noel et al. 2016) and that alcohol industry self-regulation of marketing is ineffective (Noel and Babor 2016, Noel, Babor et al. 2016), the need for policies to restrict and reduce alcohol marketing has become clearer.
The Americas region recently issued a technical note on alcohol marketing regulation, which recommends as most effective a complete ban on alcohol marketing, where constitutionally feasible (Pan American Health Organization 2017). However, such a ban exists in few countries: seven countries introduced such a ban since 2010, bringing the total number of countries banning alcohol marketing to 21. Eight countries reported reduced government policies and activities in this area since 2010, while 23 reported increased activity. However, 24 reported no activity before or after 2010. Declining or no activity on alcohol marketing was most common in AFR (11 countries) and AMR (8 countries); increased activity was most common in EUR. Figure 7 summarizes progress made across a range of marketing categories: restriction on content, volume, placement, targeting youth, new marketing channels, as well as sanctions for infringements and level of monitoring of alcohol marketing. Countries received one point for increased activity and lost one point for decreased activity, leading to Figure 7’s summary.
Figure 7. Trends in statutory regulations for marketing since 2010 by Number of Countries
The growth of mobile and Internet-based communications, including social media, has led to rapid innovation in alcohol marketing (Jernigan and Rushman 2014), and there is evidence that this marketing may be reaching young people more effectively than adults (Jernigan, Padon et al. 2017). In this context, it is critical that countries update their regulatory apparatus to be able to monitor and control marketing of alcohol through these channels. However, as shown in Figure 9, when asked specifically whether they had implemented new statutory regulations to address new marketing techniques since 2010, only 19 countries had done so, while 41, including more than half the reporting countries in the African region and 13 countries in the Americas region, reported that such regulation was largely absent both prior to and since 2010.
4 7
80
29
18
0
10
20
30
40
50
60
70
80
90
Substantiallydecreased progress
Decreased progress No progress Increased progress Substantiallyincreased progress
Num
ber o
f Cou
ntrie
s
Level of Progress
7 | P a g e
Figure 8. Current level of statutory regulations for new marketing techniques since 2010, by WHO Region and percent of countries
(n=120 countries reporting)
Alcohol marketers may use sponsorship of events as a way of reaching audiences when they have been statutorily restricted from using other channels (Guy 2016). Restricting or banning promotions connected to events targeting young people is specifically mentioned in the global alcohol strategy, yet progress in this arena was a case of one step forward, one step back: while the majority of countries (72) reported no new restrictions, 13 increased their restrictions somewhat or substantially, but 11 indicated a decrease in regulations since 2010.
“Best Buys”: Availability Restrictions
Regulating the hours and days of sale of alcohol can influence alcohol consumption as well as harm (Task Force on Community Preventive Services 2010). There has been little progress on this front since 2010. Most countries reported no change; 16 reported fewer regulations on hours of sale and 15 reported more; 7 countries report less regulation of days of sale, and 8 reported more. Notable is that 42 countries indicated they had no regulation of days of sale either before or after 2010; this lack of regulation was most common in AFR and EUR. Similarly, 24 countries had no regulation of hours of sale; this was most commonly the case in AFR, EUR and WPR.
Addressing the density or clustering of outlets relative to geography or population is another effective method of reducing alcohol consumption and related harms, at least in wealthy country settings (Campbell, Hahn et al. 2009). Forty countries have no regulation of alcohol outlet density, while most countries reported no change since 2010. Where there were changes, greater and less regulation were spread across the regions: for instance, regarding off-premise outlets, seven countries reported fewer restrictions, while another seven, in every region except SEAR, reported an increase in regulation.
An abundant literature, largely from the USA, supports the effectiveness of a minimum purchase age for alcohol in reducing youth alcohol consumption and adverse consequences (DeJong and Blanchette 2014). Such purchase ages are most common for distilled spirits and least common for beer, so the purchase age for beer – for consumption both on- and off-premise – is a good marker of change. Ten countries increased the purchase age for consumption of beer on-premise since 2010; eight increased it for off-premise consumption. However, 12 countries had no minimum purchase age for beer consumption on-premise or off-premise consumption by 2015.
8 | P a g e
Drink–Driving Countermeasures
Drink-driving countermeasures are a bright spot in this progress report. The global alcohol strategy recommends a blood alcohol concentration (BAC) limit of 0.02 - 0.05% based on robust evidence (Fell and Voas 2006). Since 2010, 13% of reporting countries (16 countries) lowered the national BAC limit for the general population. Among the countries that lowered the BAC limit, all lowered it to a level at or below 0.05%. The largest proportion of countries lowering the general population BAC limit occurred in AMR (22%) and EMR (14%), while no countries decreased the general population BAC limit in SEAR.
By 2015, 85% of persons from reporting countries (5.72 billion persons) were covered by a general BAC limit that was 0.05% or lower. The proportion of population covered by a general BAC limit at or below 0.05% varies across regions from 42% of reporting countries in AMR to 99% of reporting countries in EUR.
Figure 9. Blood alcohol concentration limit for the general population
(n=179 countries reporting)
NOTE: Above figure uses data from the 2012 GSAH for countries that did not report a new BAC level for the general population since 2010.
Like many alcohol policies, the effectiveness of a lower BAC limit for drivers depends on the level of enforcement. Just more than half – 52% – of reporting countries indicated there had been an increase in the scope or intensity of sobriety checkpoints since 2010. These increases were most common in AMR (65% of reporting countries) and EUR (56%), but “substantial” increases were most common in AFR, and least prevalent in EMR and SEAR, where no countries reported a substantial increase.
9 | P a g e
Brief Interventions and Treatment
Alcohol dependence is a disorder that can respond to treatment. However, treatment can be resource-intensive, and it is unlikely that countries will ever be able to “treat their way out” of the problems caused by harmful use of alcohol (Babor 2010) . Nonetheless, provision of treatment is the ethical responsibility of societies that make potentially addictive products such as alcoholic beverages widely available. And a growing body of research on brief interventions has demonstrated the promise these hold for lower cost and effective interventions with many drinkers (O'Donnell, Anderson et al. 2014).
At first glance, this is another area of impressive progress: 52% of reporting countries increased the level of screening and brief interventions for hazardous and harmful drinking in primary care settings since 2010. The largest increases were reported in SEAR (67%), WPR (60%), and EUR (59%). However, closer examination of the data by income group tells a somewhat different story. In the first place, more low- and lower-middle income countries lacked screening and brief intervention before and after 2010 than their higher income counterparts: 65% of countries without screening and brief interventions in primary health care settings and 92% of countries with no capacity to provide treatment for alcohol use disorders were low or lower-middle income. Furthermore, as Figure 10 illustrates, increases in screening and brief intervention were more common among high- (61%) and upper-middle (59%) income countries than in lower-middle (43%) and low-income countries (27%).
Figure 10: Countries reporting increases in level of screening and brief interventions for hazardous and harmful drinking in primary health care settings since 2010, by World Bank Income Group
Increases in the capacity to provide treatment services for alcohol use disorders in the health system were most common in upper-middle and lower-middle income countries, where 69% and 58% of countries respectively reported increased capacity, in contrast with 45% of high-income and only 27% of low-income countries.
27%
43%
59% 61%
0%
10%
20%
30%
40%
50%
60%
70%
Low Lower Middle Upper Middle High
Perc
ent o
f Cou
ntrie
s
World Bank Income Group
10 | P a g e
Warning and Consumer Information Labels
Throughout much of the world, alcoholic beverages lack any kind of consumer information labeling. Ingredients, calorie/energy counts and other nutritional information appear on the labels of many packaged foods and beverages, but alcohol is an exception. In the absence of any consumer information, some countries mandate warnings on alcoholic beverages. Nineteen countries had such labels already in place in 2010, and an additional 18 (15% of reporting countries) have added them since then. However, as the chart shows, such labels are still less common in EUR and WPR than in AMR or AFR. Mandatory alcoholic beverage warning labels introduced since 2010 cover 852 million people, bringing the total population covered to 3.47 billion persons, or 48% of the world’s population.
Figure 11. Mandatory labelling of alcoholic beverages to indicate harm since 2010, by WHO Region and percent of countries
(n=121 countries reporting)
Illicit Alcohol
As of 2012, illicit or informally-produced alcohol accounted for a quarter of global alcohol production (World Health Organization 2014). Illicit alcohol can be of higher strength, and can also contain toxic substances besides alcohol. For these reasons, the global alcohol strategy recommended that Member States improve quality control systems, seek to bring informal alcohol into the formal taxation system, develop enforcement systems such as tax stamps to better identify officially-sanctioned alcoholic beverages, and devise better surveillance systems for informal and illicit alcohol.
The use of tax stamps has grown substantially, with 34 countries reporting their use before 2010, and 16 more introducing them since then. Twenty countries, mostly in EUR and AMR, indicated they had made progress in bringing informal alcohol into the official tax system. However, 16 countries (mostly in AFR and AMR) reported no government activity regarding
5
3 18
AFR
6
6 15
AMR
1 1
8
EMR
4 4
29
EUR
2
3
1
SEAR
2
13
WPR
18 19
84
World
Yes (n=18) Policy established before 2010 (n=19) No (n=84)
11 | P a g e
illicit alcohol before or after 2010, 60 reported no change, and 43 responded they had increased the scope and intensity of government efforts in this area.
Community Action
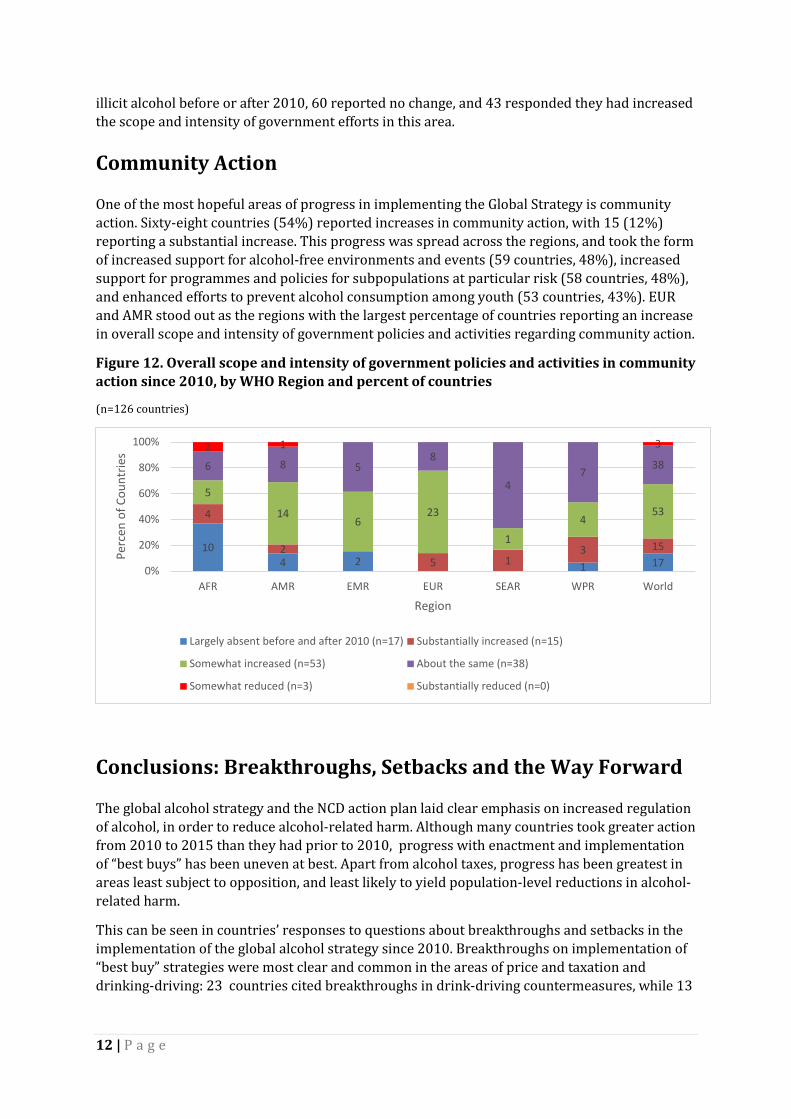
One of the most hopeful areas of progress in implementing the Global Strategy is community action. Sixty-eight countries (54%) reported increases in community action, with 15 (12%) reporting a substantial increase. This progress was spread across the regions, and took the form of increased support for alcohol-free environments and events (59 countries, 48%), increased support for programmes and policies for subpopulations at particular risk (58 countries, 48%), and enhanced efforts to prevent alcohol consumption among youth (53 countries, 43%). EUR and AMR stood out as the regions with the largest percentage of countries reporting an increase in overall scope and intensity of government policies and activities regarding community action.
Figure 12. Overall scope and intensity of government policies and activities in community action since 2010, by WHO Region and percent of countries
(n=126 countries)
Conclusions: Breakthroughs, Setbacks and the Way Forward
The global alcohol strategy and the NCD action plan laid clear emphasis on increased regulation of alcohol, in order to reduce alcohol-related harm. Although many countries took greater action from 2010 to 2015 than they had prior to 2010, progress with enactment and implementation of “best buys” has been uneven at best. Apart from alcohol taxes, progress has been greatest in areas least subject to opposition, and least likely to yield population-level reductions in alcohol-related harm.
This can be seen in countries’ responses to questions about breakthroughs and setbacks in the implementation of the global alcohol strategy since 2010. Breakthroughs on implementation of “best buy” strategies were most clear and common in the areas of price and taxation and drinking-driving: 23 countries cited breakthroughs in drink-driving countermeasures, while 13
10 4 2 1 17
4
2 5 1
3 15
5
14 6
23
1
4 53
6 8 5 8
4 7
38 2 1 3
0%
20%
40%
60%
80%
100%
AFR AMR EMR EUR SEAR WPR World
Perc
en o
f Cou
ntrie
s
Region
Largely absent before and after 2010 (n=17) Substantially increased (n=15)
(13.9%) termed enactment of price policies between 2010 and 2015 as a breakthrough, including new excise taxes, increasing existing excise taxes, and minimum price policies.
Far fewer countries recorded any breakthroughs in restricting alcohol availability. Similarly, there were few breakthroughs in providing greater resources for treatment, restricting marketing, addressing informal or illicit alcohol, and increasing monitoring and surveillance.
Regarding setbacks, relatively few countries (7.5%) mentioned difficulty in terms of enforcement or lack of expertise or guidance (5.0%). More commonly reported challenges included lack of data or monitoring systems (11.3% of countries), cultural dimensions of alcohol use such as stigma or taboos (8.8%), and interference by the alcohol industry (12.5%). As WHO Director-General Dr. Margaret Chan has stated, effective national alcohol policies are “feared and fought by the alcohol industry;” the formulation of such policies is “the sole prerogative of national health officials and regulatory authorities” (Chan 2017).
With alcohol excise taxes being the most frequently-implemented “best buy”, it is clear that there is a need for adequate resources to support effective alcohol control measures in line with guidance provided by the global strategy to reduce the harmful use of alcohol. In fact, lack of resources was the most commonly mentioned setback, with 35 countries (43.8%) reporting this difficulty. Twenty-three countries cited the lack of a national alcohol policy, while another 20 pointed to alcohol’s low political priority as contributing to weak stakeholder involvement and public apathy, and 15 complained of lack of coordination, including the absence of a central coordinating agency.
The global alcohol strategy and the NCD action plan have stimulated greater action at the country level to reduce alcohol-related harm. However, adoption of effective and cost-effective recommendations from both these global agreements has been hindered by a lack of resources at every level. As WHO Director-General Dr. Margaret Chan pointed out in her report Ten Years in Public Health 2007-2017, “alcohol consumption is expanding in precisely those countries that lack the regulatory and enforcement capacities to protect their populations” (Chan 2017). As incomes rise in low- and middle-income countries, both alcohol consumption and alcohol-related problems rise too. However, unlike other significant global health challenges, such as HIV, tobacco and obesity, there have yet to emerge substantial resources to assist countries to take the recommended steps to prevent and reduce alcohol-related harm.
Given the absence of such resources, the progress in implementing the global strategy to reduce the harmful use of alcohol since 2010 is remarkable but insufficient. Greater leadership, commitment and resources are necessary if the vision of the global alcohol strategy – “improved health and social outcomes for individuals, families and communities, with considerably reduced morbidity and mortality due to harmful use of alcohol and their ensuing social consequences” – is to be realized.
13 | P a g e
REFERENCES
Babor, T. (2010). Alcohol: No ordinary commodity. Research and Public Policy. New York, NY, Oxford University Press.
Burton, R., C. Henn, D. Lavoie, R. O'Connor, C. Perkins, K. Sweeney, F. Greaves, B. Ferguson, C. Beynon, A. Belloni, V. Musto, J. Marsden and N. Sheron (2017). "A rapid evidence review of the effectiveness and cost-effectiveness of alcohol control policies: an English perspective." The Lancet 389(10078): 1558-1580.
Campbell, C. A., R. A. Hahn, R. Elder, R. D. Brewer, S. Chattopadhyay, J. Fielding, T. S. Naimi, T. Toomey, B. Briana Lawrence and J. C. Middleton (2009). "The effectiveness of limiting alcohol outlet density as a means of reducing excessive alcohol consumption and alcohol-related harms." American Journal of Preventive Medicine 37(6): 556-559.
Casswell, S., L. Gilmore, V. Maguire and R. Ransom (1989). "Changes in public support for alcohol policies following a community-based campaign." British journal of addiction 84: 515-522.
Chan, M. (2017). "Noncommunicable diseases: the slow motion disaster." Retrieved May 5, 2017, from http://www.who.int/publications/10-year-review/ncd/en/.
DeJong, W. and J. Blanchette (2014). "Case closed: Research evidence on the positive health impact of the age 21 minimum legal drinking age in the United States." Journal of Studies on Alcohol and Drugs 75(Suppl 17): 108-115.
Fell, J. C. and R. B. Voas (2006). "The effectiveness of reducing illegal blood alcohol concentration (BAC) limits for driving: evidence for lowering the limit to. 05 BAC." Journal of safety research 37(3): 233-243.
Gore, F. M., P. J. Bloem, G. C. Patton, J. Ferguson , V. Joseph, C. Coffey, S. M. Sawyer and C. D. Mathers (2011). "Global burden of disease in young people aged 10-24 years: a systematic analysis." Lancet 377(9783): 2093-2102.
Guy, D. (2016). "How to market alcohol where alcohol marketing is banned - Focus." just-drinks.com Retrieved April 29, 2017, from http://www.just-drinks.com/analysis/how-to-market-alcohol-where-alcohol-marketing-is-banned-focus_id119700.aspx.
Janssen, M. M., J. J. P. Mathijssen, M. J. H. van Bon–Martens, H. A. M. van Oers and H. F. L. Garretsen (2013). "Effectiveness of alcohol prevention interventions based on the principles of social marketing: a systematic review." Substance Abuse Treatment, Prevention, and Policy 8: 18-18.
Jernigan, D., J. K. Noel, J. Landon, N. Thornton and T. Lobstein (2016). "Alcohol marketing and youth alcohol consumption: A systematic review of longitudinal studies published since 2008." Addiction 112(Suppl 1): 7-20.
Jernigan, D., A. Padon, C. S. Ross and D. Borzekowski (2017). "Self-Reported Youth and Adult Exposure to Alcohol Marketing in Traditional and Digital Media: Results of a Pilot Survey." Alcoholism: Clinical and Experimental Research 41(3): 618-625.
Jernigan, D. H. and A. E. Rushman (2014). "Measuring youth exposure to alcohol marketing on social networking sites: challenges and prospects." Journal of Public Health Policy 35(1): 91-104.
Noel, J. K. and T. F. Babor (2016). "Does industry self-regulation protect young persons from exposure to alcohol marketing? A review of compliance and complaint studies." Addiction epub ahead of print.
Noel, J. K., T. F. Babor and K. Robaina (2016). "Industry self-regulation of alcohol marketing: A systematic review of content and exposure research." Addiction(epub ahead of print).
O'Donnell, A., P. Anderson, D. Newbury-Birch, B. Schulte, C. Schmidt, J. Reimer and E. Kaner (2014). "The Impact of Brief Alcohol Interventions in Primary Healthcare: A Systematic Review of Reviews." Alcohol and Alcoholism (Oxford, Oxfordshire) 49(1): 66-78.
Pan American Health Organization. (2017). "Background on alcohol marketing regulation and monitoring for the protection of public health." Retrieved April 28, 2017, from
Task Force on Community Preventive Services (2010). "Recommendations on maintaining limits on days and hours of sale of alcoholic beverages to prevent excessive alcohol consumption and related harms." American Journal of Preventive Medicine 39(6): 605-606.
World Health Organization. (2010). "Global strategy to reduce the harmful use of alcohol." Retrieved April 2, 2015, from http://www.who.int/substance_abuse/alcstratenglishfinal.pdf?ua=1.
World Health Organization. (2013). "Global Action Plan for the Prevnetion and Control of Noncommunicable Diseases 2013-2020." Retrieved April 28, 2017, from http://apps.who.int/iris/bitstream/10665/94384/1/9789241506236_eng.pdf?ua=1.
World Health Organization. (2014). "Global Status Report on Alcohol and Health - 2014." Retrieved May 21, 2014, from http://www.who.int/substance_abuse/publications/global_alcohol_report/msb_gsr_2014_1.pdf?ua=1.
World Health Organization. (2016). "Preparation for the third High-level Meeting of the General Assembly on the Prevention and Control of Non-communicable Diseases, to be held in 2018." Provisional agenda item 10.1 Retrieved April 28, 2017, from http://apps.who.int/gb/ebwha/pdf_files/EB140/B140_27-en.pdf?ua=1.
World Health Organization (2017). Preparation for the third High-level Meeting of the General Assembly on the Prevention and Control of Non-communicable Diseases, to be held in 2018: Report by the Secretariat. Geneva, World Health Organization.