1 Dr. Brian Magi Assistant Professor at UNC Charlotte Geography and Earth Sciences Department Presentation at Carolinas Climate Resilience Conference April 29, 2014 Global Environmental Change in the University Classroom Web: geoearth.uncc.edu and brianmagi.uncc.edu
Transcript
1
Dr. Brian Magi
Assistant Professor at UNC Charlotte
Geography and Earth Sciences Department
Presentation at Carolinas Climate Resilience Conference
April 29, 2014
Global Environmental Change in the University Classroom
Web: geoearth.uncc.edu and brianmagi.uncc.edu
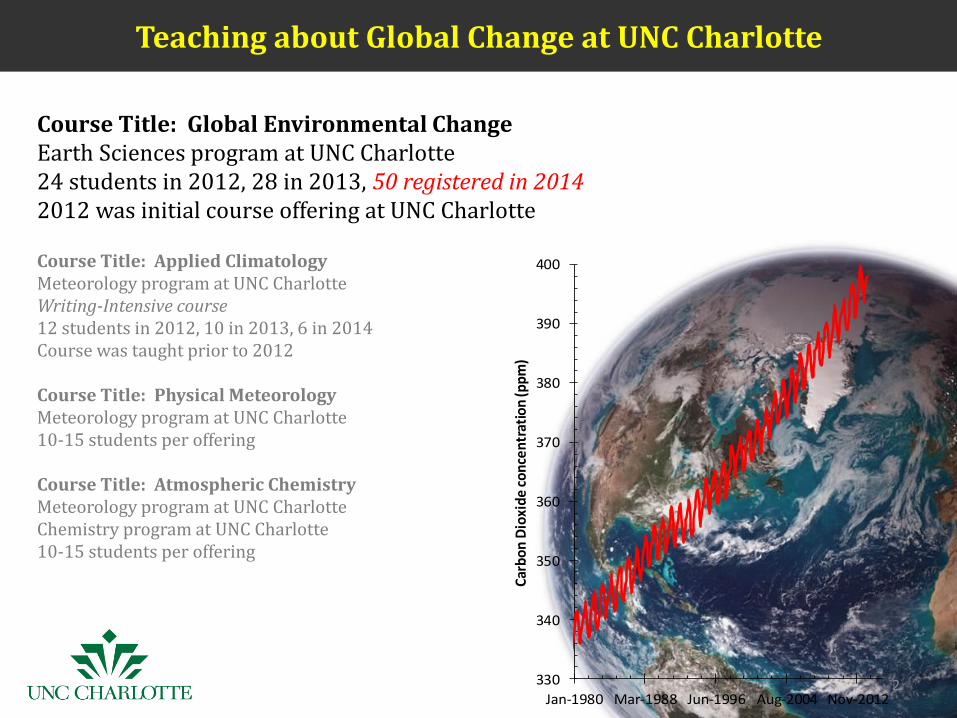
Teaching about Global Change at UNC Charlotte
2 330
340
350
360
370
380
390
400
Jan-1980 Mar-1988 Jun-1996 Aug-2004 Nov-2012
Car
bo
n D
ioxi
de
co
nce
ntr
atio
n (p
pm
)
Course Title: Global Environmental Change Earth Sciences program at UNC Charlotte 24 students in 2012, 28 in 2013, 50 registered in 2014 2012 was initial course offering at UNC Charlotte Course Title: Applied Climatology Meteorology program at UNC Charlotte Writing-Intensive course 12 students in 2012, 10 in 2013, 6 in 2014 Course was taught prior to 2012 Course Title: Physical Meteorology Meteorology program at UNC Charlotte 10-15 students per offering Course Title: Atmospheric Chemistry Meteorology program at UNC Charlotte Chemistry program at UNC Charlotte 10-15 students per offering
Hopeful Perspectives on Climate Change
3
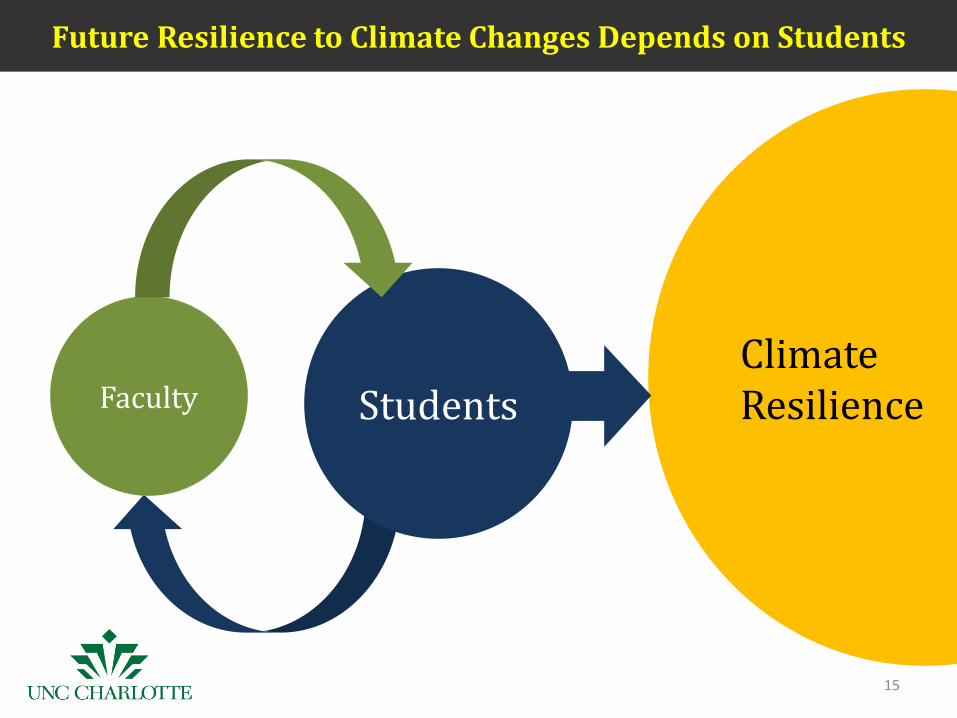
Students Faculty
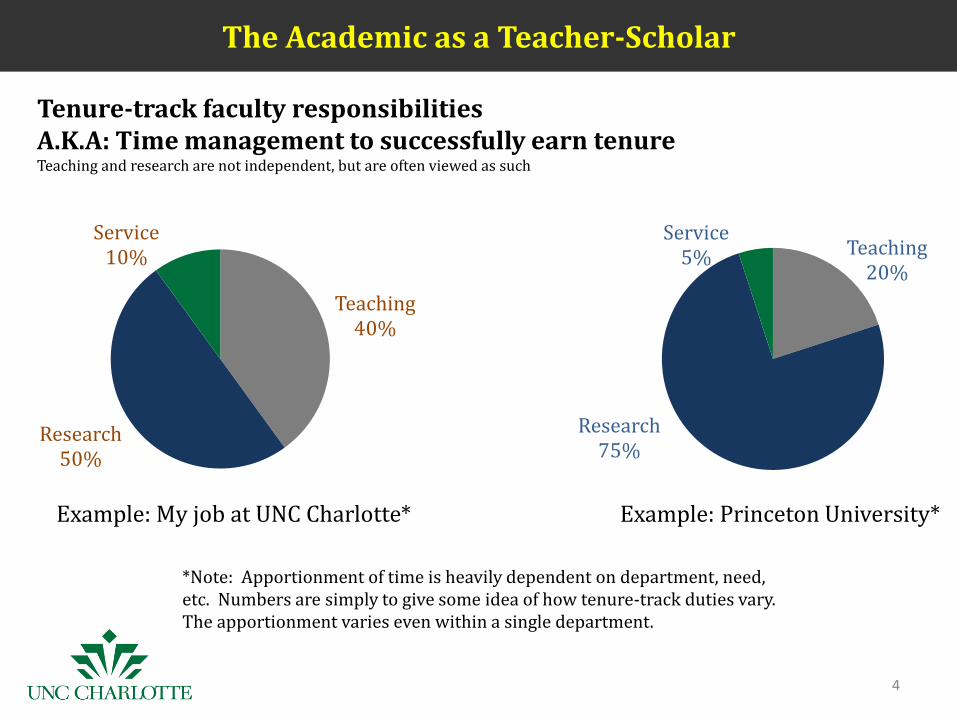
The Academic as a Teacher-Scholar
4
Tenure-track faculty responsibilities A.K.A: Time management to successfully earn tenure Teaching and research are not independent, but are often viewed as such
Teaching 20%
Research 75%
Service 5%
Teaching 40%
Research 50%
Service 10%
Example: My job at UNC Charlotte* Example: Princeton University*
*Note: Apportionment of time is heavily dependent on department, need, etc. Numbers are simply to give some idea of how tenure-track duties vary. The apportionment varies even within a single department.
Fire and the Atmosphere
5
South Africa
Namibia
Botswana
Zambia
Zimbabwe
Mozambique
Map shows fires in August-September
More fires
Fewer fires
The Carbon Cycle
6
Figure and full references to peer-reviewed articles are available from http://www.climatechange2013.org/ full report Chapter 6
Summary How much and how fast carbon cycles between the components of our Earth system
Carbon Dioxide and Temperature Over Past 800,000 Years
8
Carbon dioxide concentration
Temperature
My Research and the Carbon Cycle
9
Global Warming and the Carbon Cycle
10 Figure and full references to peer-reviewed articles are available from http://www.climatechange2013.org/ Summary for Policy Makers Figure 10; Full figure caption on later slide with references to relevant IPCC chapter
2°C corresponds to 1000 GtC (1100 billion tons carbon) total emissions
Infrastructural commitment through about 2050: Add about 136 GtC (150 billion tons carbon)
Cumulative emissions through 2011: 545 GtC (600 billion tons carbon)
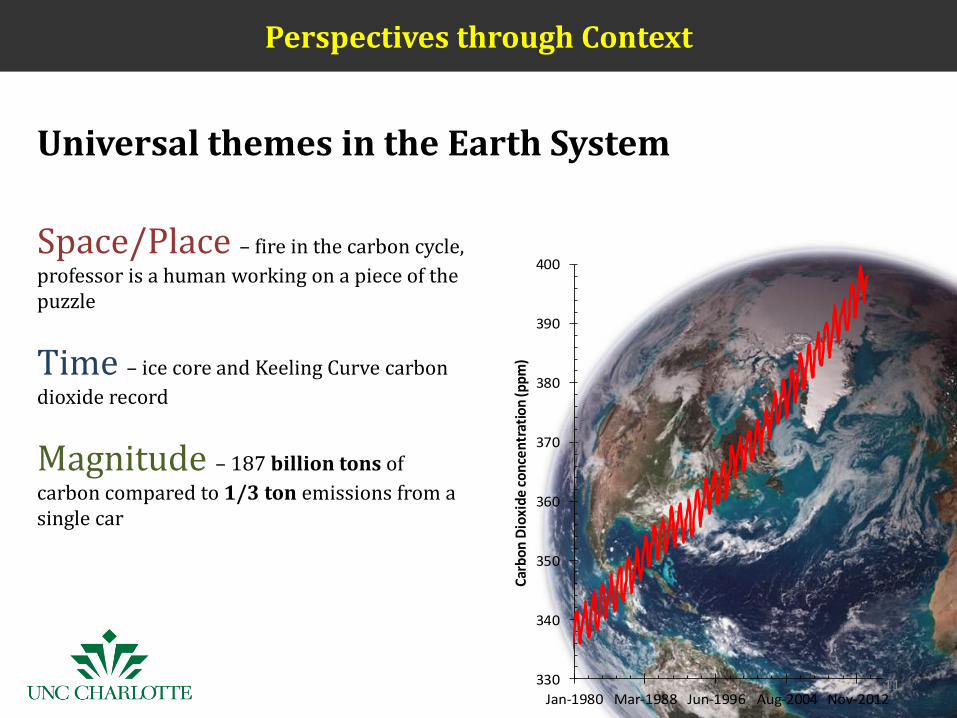
professor is a human working on a piece of the puzzle
Time – ice core and Keeling Curve carbon
dioxide record
Magnitude – 187 billion tons of
carbon compared to 1/3 ton emissions from a single car
Universal themes in the Earth System
Main points Planetary temperature has increased by 0.85 °C or 1.5 °F from 1880 to 2012 Increase refers to the long-term (decadal) trend Short-term (annual) variability is expected and not necessarily indicative of the long-term trend Main questions Is 1.5 °F increase important? Why is temperature increasing?
Figure is from IPCC AR5 WG1 SPM at http://www.climatechange2013.org/
Global Warming: Long-Term Trend and Short-Term Variability
*Phrase is from Dr David Archer, University of Chicago, textbook on Global Warming Figure is from IPCC AR5 WG1 SPM at http://www.climatechange2013.org/
Main point Temperature is increasing nearly everywhere on Earth, but not at the same rate One exception is the South and Southeastern USA. Context: Most UNC Charlotte students are from the South and Southeastern USA.