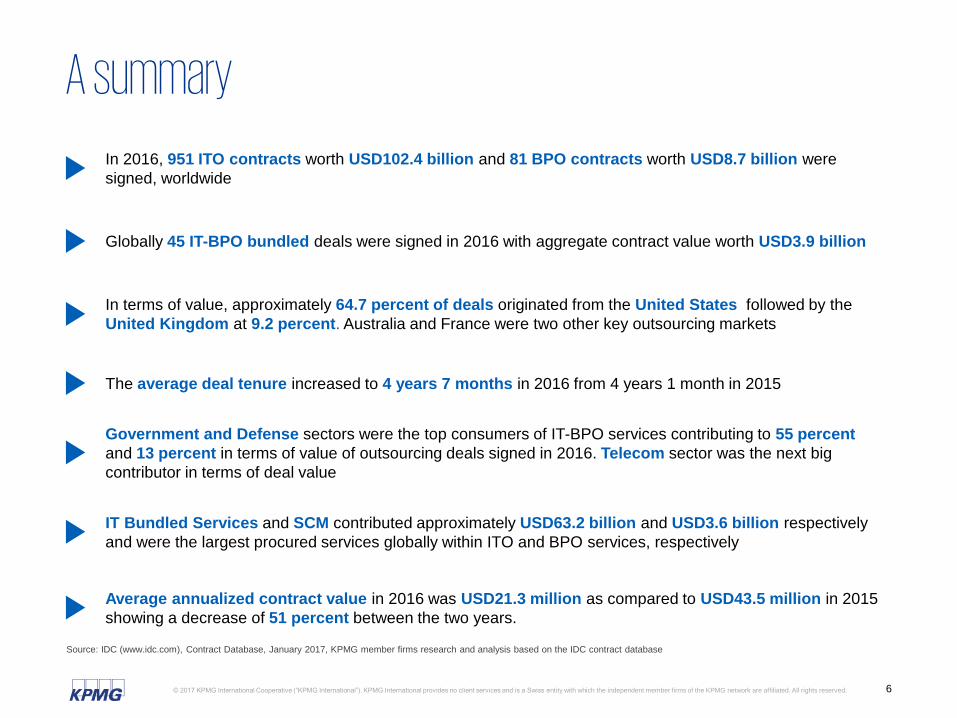
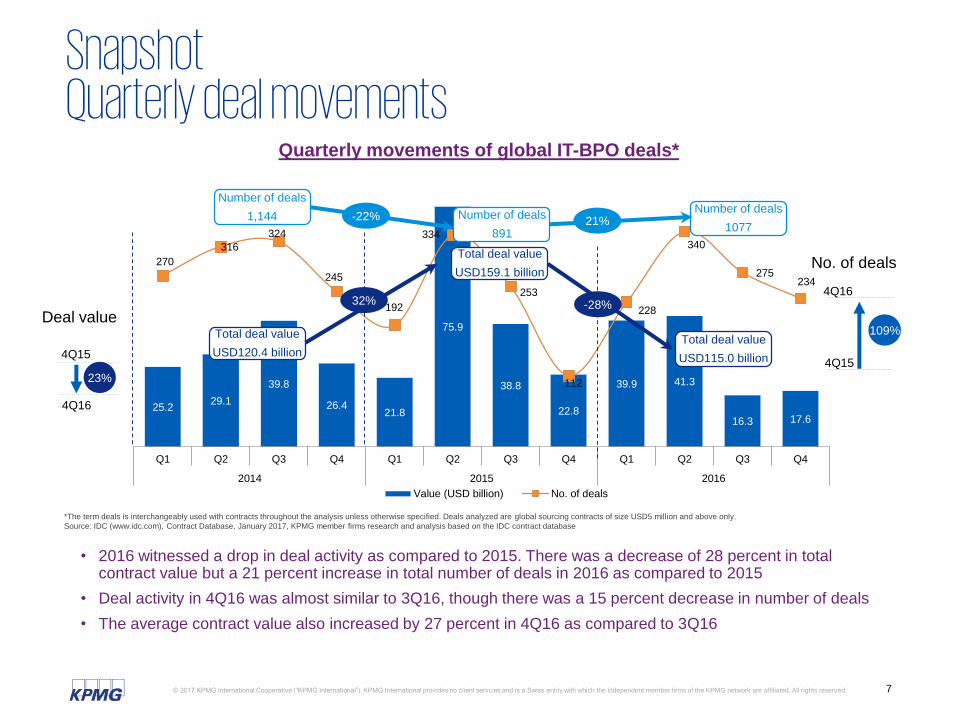
• 2016 witnessed a drop in deal activity as compared to 2015. There was a decrease of 28 percent in total contract value but a 21 percent increase in total number of deals in 2016 as compared to 2015
• Deal activity in 4Q16 was almost similar to 3Q16, though there was a 15 percent decrease in number of deals
• The average contract value also increased by 27 percent in 4Q16 as compared to 3Q16
*The term deals is interchangeably used with contracts throughout the analysis unless otherwise specified. Deals analyzed are global sourcing contracts of size USD5 million and above only.
Source: IDC (www.idc.com), Contract Database, January 2017, KPMG member firms research and analysis based on the IDC contract database
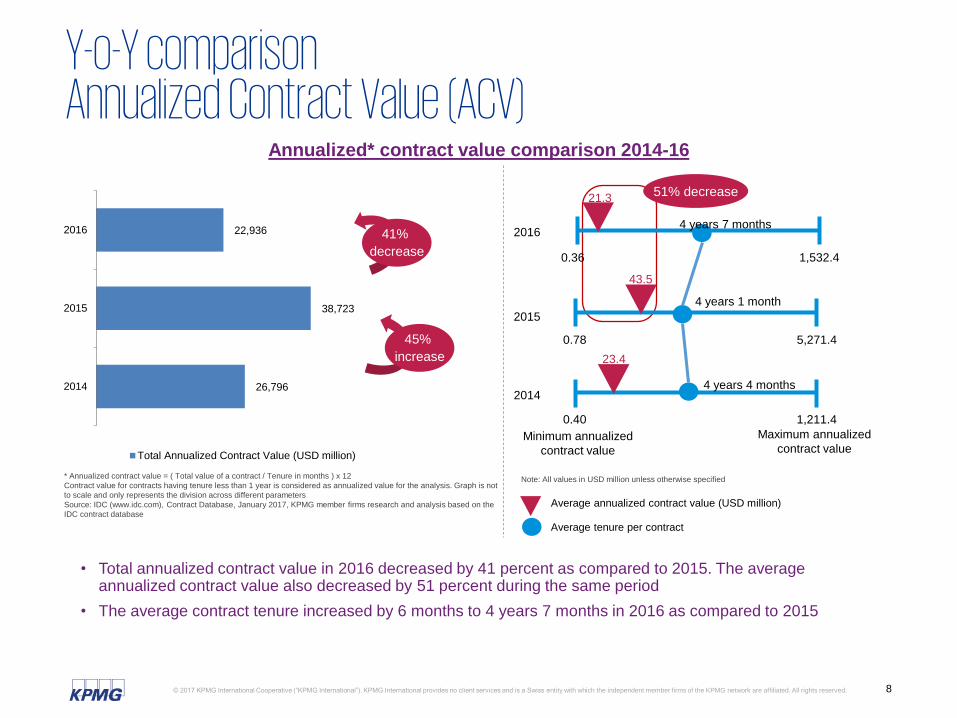
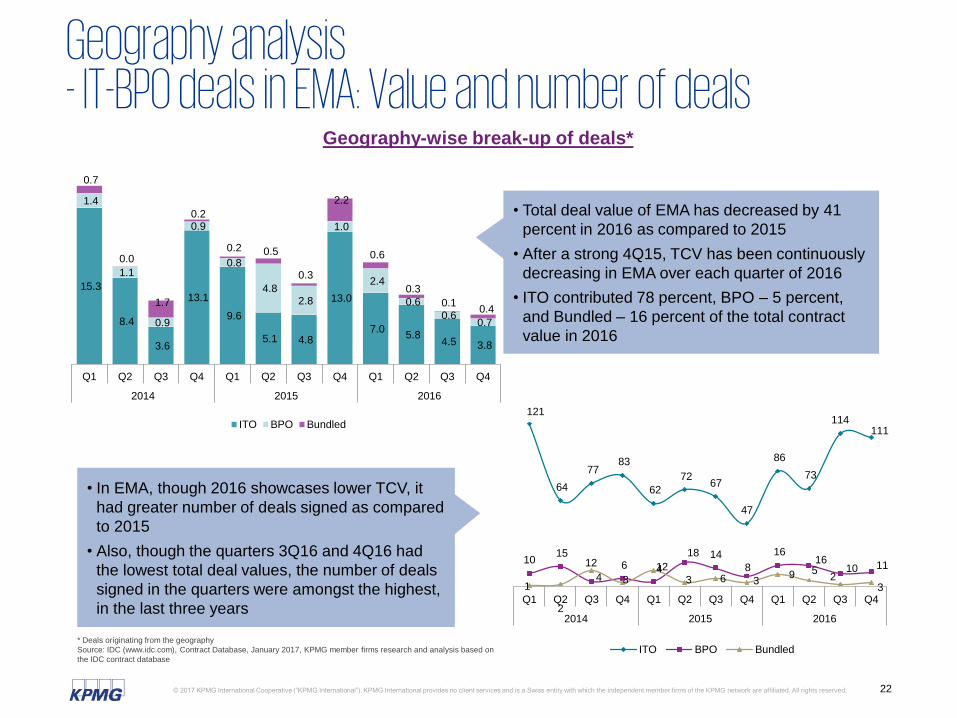
• Total annualized contract value in 2016 decreased by 41 percent as compared to 2015. The average annualized contract value also decreased by 51 percent during the same period
• The average contract tenure increased by 6 months to 4 years 7 months in 2016 as compared to 2015
41%
decrease
26,796
38,723
22,936
- 10,000 20,000 30,000 40,000 50,000
2014
2015
2016
Total Annualized Contract Value (USD million)
45%
increase
Average annualized contract value (USD million)
Average tenure per contract
Note: All values in USD million unless otherwise specified
Minimum annualized
contract value
Maximum annualized
contract value
51% decrease
5,271.4
1,211.4
0.78
0.40
4 years 1 month
43.5
23.4
2015
2014
1,532.40.36
2016
21.3
4 years 7 months
4 years 4 months
* Annualized contract value = ( Total value of a contract / Tenure in months ) x 12
Contract value for contracts having tenure less than 1 year is considered as annualized value for the analysis. Graph is not
to scale and only represents the division across different parameters
Source: IDC (www.idc.com), Contract Database, January 2017, KPMG member firms research and analysis based on the
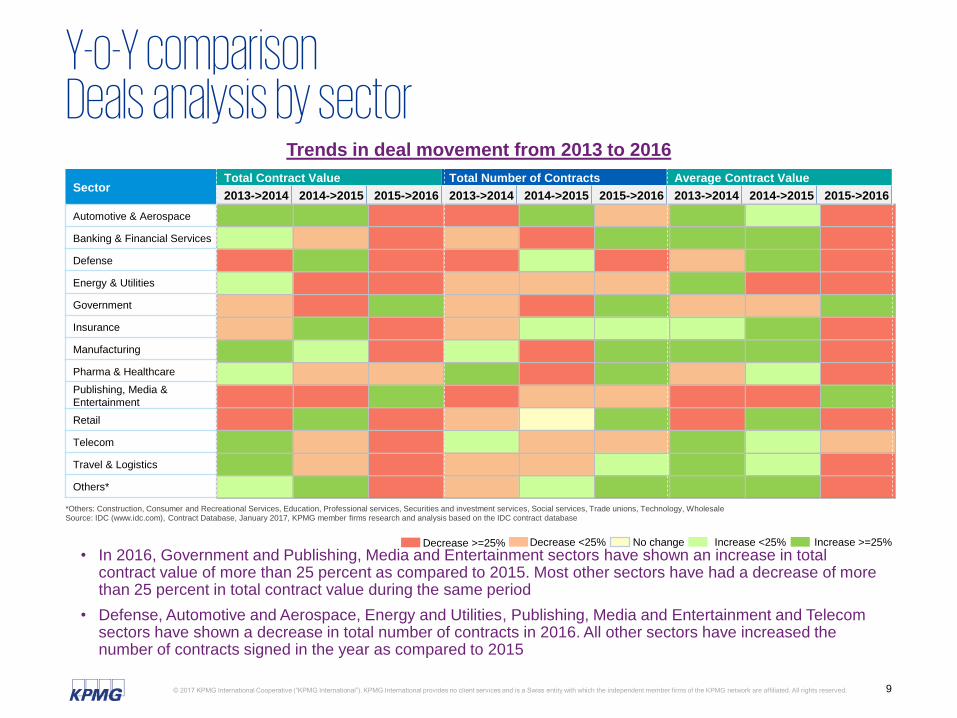
• In 2016, Government and Publishing, Media and Entertainment sectors have shown an increase in total contract value of more than 25 percent as compared to 2015. Most other sectors have had a decrease of more than 25 percent in total contract value during the same period
• Defense, Automotive and Aerospace, Energy and Utilities, Publishing, Media and Entertainment and Telecom sectors have shown a decrease in total number of contracts in 2016. All other sectors have increased the number of contracts signed in the year as compared to 2015
*Others: Construction, Consumer and Recreational Services, Education, Professional services, Securities and investment services, Social services, Trade unions, Technology, WholesaleSource: IDC (www.idc.com), Contract Database, January 2017, KPMG member firms research and analysis based on the IDC contract database
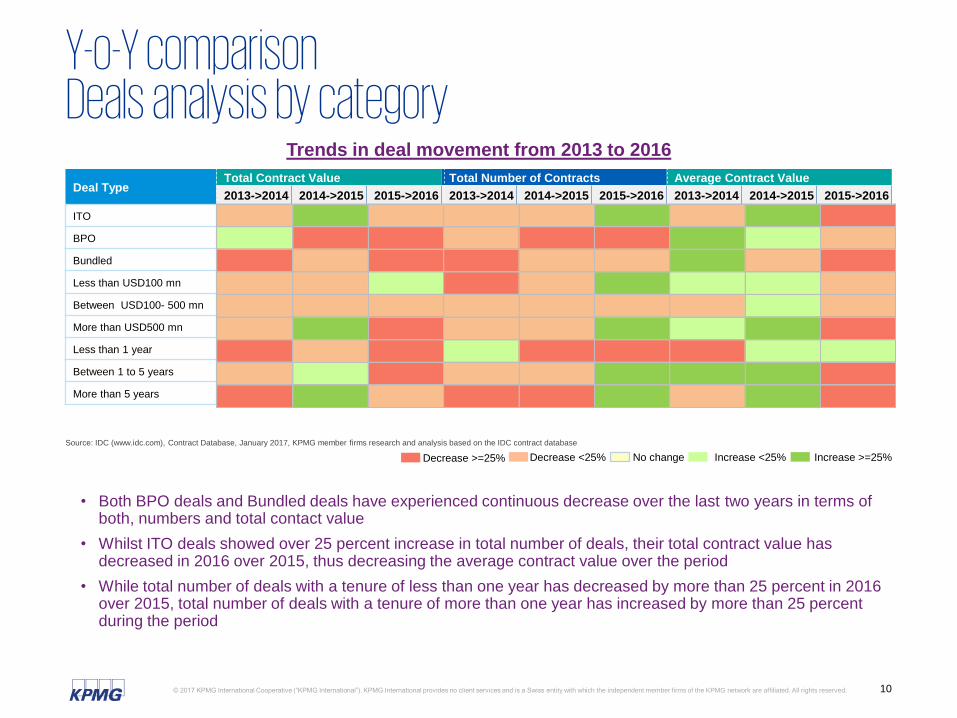
• Both BPO deals and Bundled deals have experienced continuous decrease over the last two years in terms of both, numbers and total contact value
• Whilst ITO deals showed over 25 percent increase in total number of deals, their total contract value has decreased in 2016 over 2015, thus decreasing the average contract value over the period
• While total number of deals with a tenure of less than one year has decreased by more than 25 percent in 2016 over 2015, total number of deals with a tenure of more than one year has increased by more than 25 percent during the period
Source: IDC (www.idc.com), Contract Database, January 2017, KPMG member firms research and analysis based on the IDC contract database
Deal valueIT-BPO deals* signed in 2016 (Total contract value: USD115 billion)
• ITO deals continue to dominate the outsourcing space with a contribution of 89 percent to the total deal value signed in 2016
• AMERICAS continue to be the major outsourcing region contributing 67 percent of the total deal value signed in 2016. EMA and ASPAC contribute 23 percent and 10 percent respectively
• Fixed price contracting model showed dominance, contributing over 67 percent of the deal value in 2016, followed by Hybrid model with contribution of 28 percent of total deal value
ITO102.4
BPO8.7
Bundled3.9
AMERICAS76.7
EMA26.8
ASPAC11.5
Less than USD 100 mn
20.7
Between USD 100- 500 mn, 42.3
More than USD 500 mn, 52.0
Less than 1 year1.1
Between 1 to 5 years, 48.9
More than 5 years, 65.0
Fixed price76.8
Hybrid32.1
Services Region Contract value Tenure Pricing
Time & Material,5.3
Total
contract
value
USD115
billion
0%
10%
20%
30%
40%
50%
60%
70%
80%
90%
100%
#
* Deals analyzed are USD5 million and above only, throughout the analysis. Graph is not to scale and only represents the division across different parameters. Figures may not add up to 100 percent due to rounding off
# Hybrid pricing includes a combination of various pricing mechanisms
Source: IDC (www.idc.com), Contract Database, January 2017, KPMG member firms research and analysis based on the IDC contract database
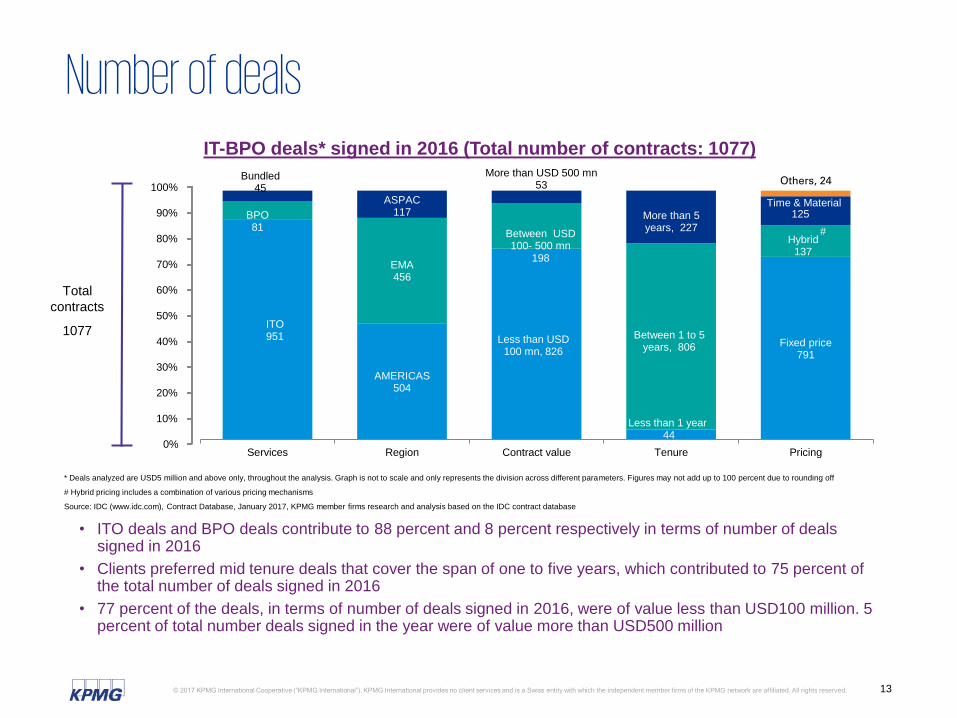
Number of dealsIT-BPO deals* signed in 2016 (Total number of contracts: 1077)
• ITO deals and BPO deals contribute to 88 percent and 8 percent respectively in terms of number of deals signed in 2016
• Clients preferred mid tenure deals that cover the span of one to five years, which contributed to 75 percent of the total number of deals signed in 2016
• 77 percent of the deals, in terms of number of deals signed in 2016, were of value less than USD100 million. 5 percent of total number deals signed in the year were of value more than USD500 million
* Deals analyzed are USD5 million and above only, throughout the analysis. Graph is not to scale and only represents the division across different parameters. Figures may not add up to 100 percent due to rounding off
# Hybrid pricing includes a combination of various pricing mechanisms
Source: IDC (www.idc.com), Contract Database, January 2017, KPMG member firms research and analysis based on the IDC contract database
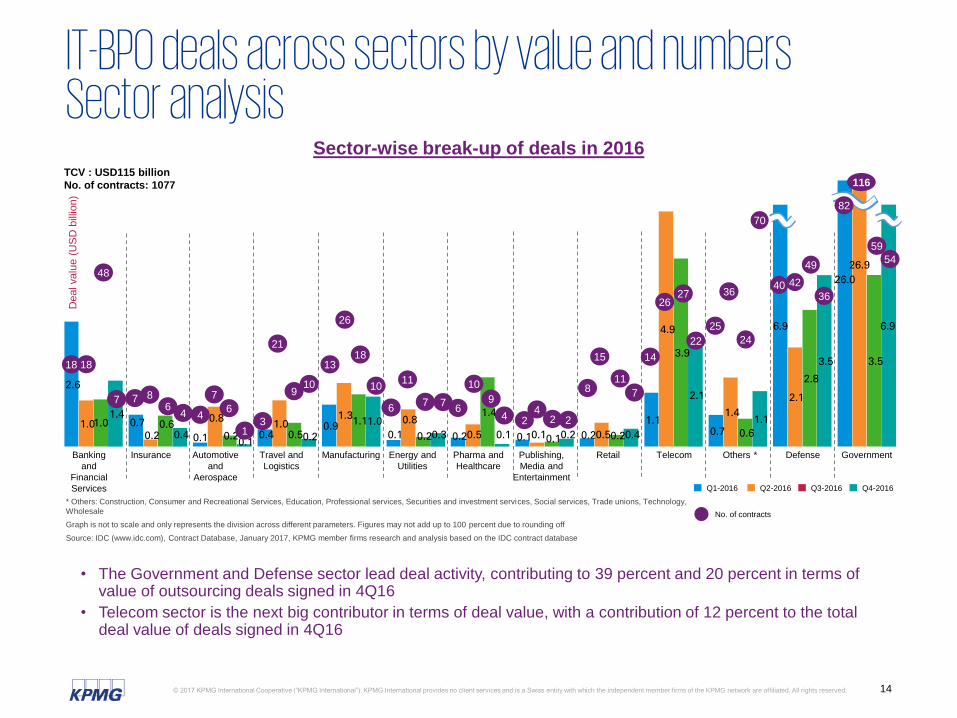
IT-BPO deals across sectors by value and numbers Sector analysis
Sector-wise break-up of deals in 2016
• The Government and Defense sector lead deal activity, contributing to 39 percent and 20 percent in terms of value of outsourcing deals signed in 4Q16
• Telecom sector is the next big contributor in terms of deal value, with a contribution of 12 percent to the total deal value of deals signed in 4Q16
2.6
0.7
0.1 0.4 0.9
0.1 0.2 0.1 0.2
1.1 0.7
6.9
26.0
1.0 0.2
0.8 1.0
1.3 0.8
0.5 0.1 0.5
4.9
1.4
2.1
26.9
1.0 0.6 0.2 0.5
1.1
0.2
1.4
0.1 0.2
3.9
0.6
2.8
3.5
1.4
0.4 0.1 0.2
1.0
0.3 0.1 0.2 0.4
2.1
1.1
3.5
6.9
Banking
and
Financial
Services
Insurance Automotive
and
Aerospace
Travel and
Logistics
Manufacturing Energy and
Utilities
Pharma and
Healthcare
Publishing,
Media and
Entertainment
Retail Telecom Others * Defense Government
Q1-2016 Q2-2016 Q3-2016 Q4-2016
48
18
67
4
1
10
67
2
7
3
13
10
6
8
15
9
18
7 9
2
11
27
7 7
14
24
3640
2
18
8
6
21
26
11 10
4
26
42
36
Deal valu
e (
US
D b
illio
n)
4
22
25
* Others: Construction, Consumer and Recreational Services, Education, Professional services, Securities and investment services, Social services, Trade unions, Technology,
Wholesale
Graph is not to scale and only represents the division across different parameters. Figures may not add up to 100 percent due to rounding off
Source: IDC (www.idc.com), Contract Database, January 2017, KPMG member firms research and analysis based on the IDC contract database
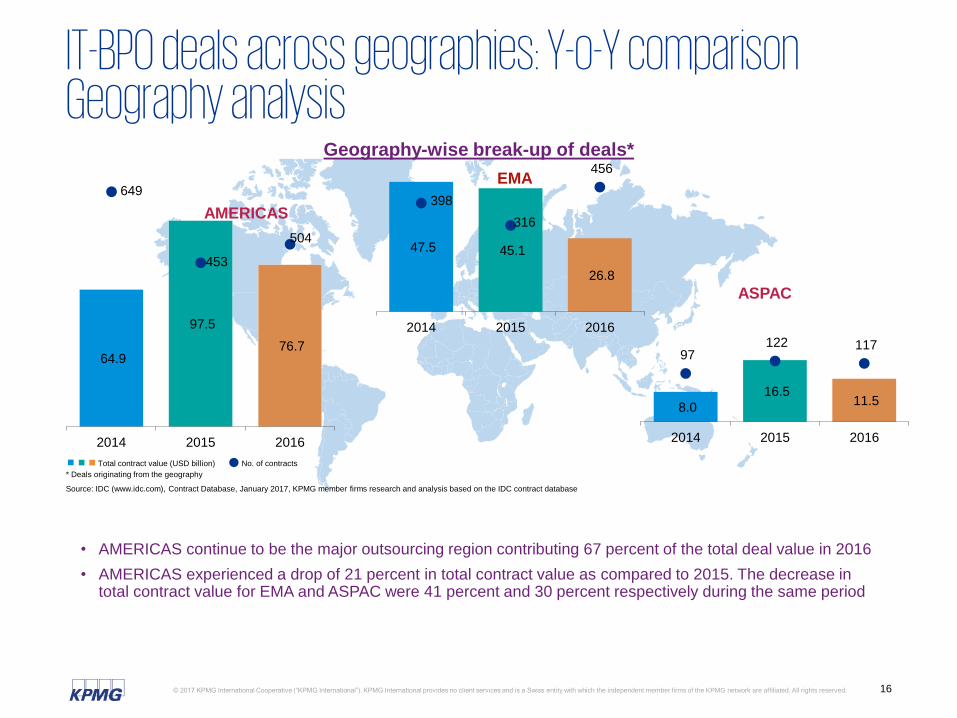
IT-BPO deals across geographies: Y-o-Y comparisonGeography analysis
Geography-wise break-up of deals*
• AMERICAS continue to be the major outsourcing region contributing 67 percent of the total deal value in 2016
• AMERICAS experienced a drop of 21 percent in total contract value as compared to 2015. The decrease in total contract value for EMA and ASPAC were 41 percent and 30 percent respectively during the same period
64.9
97.5
76.7
649
453
504
2014 2015 2016
8.0
16.5 11.5
97 122 117
2014 2015 2016
47.5 45.1
26.8
398
316
456
2014 2015 2016
* Deals originating from the geography
Source: IDC (www.idc.com), Contract Database, January 2017, KPMG member firms research and analysis based on the IDC contract database
EMA
AMERICAS
ASPAC
Total contract value (USD billion) No. of contracts
Geography analysis- IT-BPO deals in AMERICAS: Value and number of deals
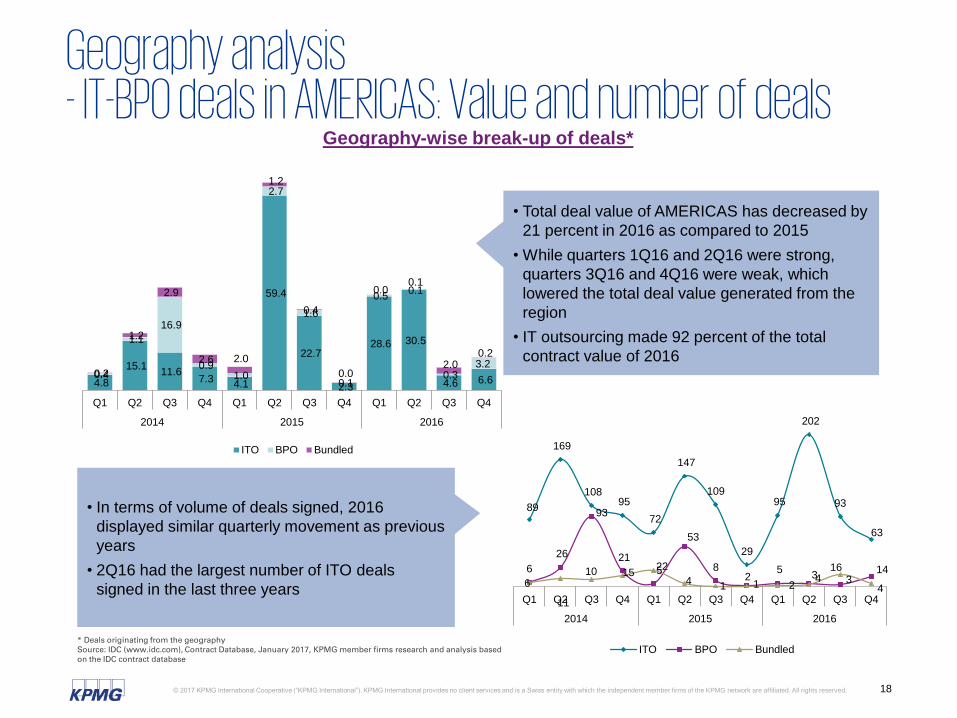
Geography-wise break-up of deals*
• Total deal value of AMERICAS has decreased by
21 percent in 2016 as compared to 2015
• While quarters 1Q16 and 2Q16 were strong,
quarters 3Q16 and 4Q16 were weak, which
lowered the total deal value generated from the
region
• IT outsourcing made 92 percent of the total
contract value of 2016
• In terms of volume of deals signed, 2016
displayed similar quarterly movement as previous
years
• 2Q16 had the largest number of ITO deals
signed in the last three years
4.8
15.1 11.6
7.3 4.1
59.4
22.7
2.3
28.6 30.5
4.6 6.6 0.4
1.1
16.9
0.9 1.0
2.7
1.6
0.1
0.5 0.1
0.3 3.2
0.2
1.2
2.9
2.6 2.0
1.2
0.4
0.0
0.0 0.1
2.0 0.2
Q1 Q2 Q3 Q4 Q1 Q2 Q3 Q4 Q1 Q2 Q3 Q4
2014 2015 2016
ITO BPO Bundled
89
169
108 95
72
147
109
29
95
202
93
63
6
26
93
21
5
53
82
5 4 3
14
6
11
10 15 22
4 1 1 2
3 16
4 Q1 Q2 Q3 Q4 Q1 Q2 Q3 Q4 Q1 Q2 Q3 Q4
2014 2015 2016
ITO BPO Bundled* Deals originating from the geographySource: IDC (www.idc.com), Contract Database, January 2017, KPMG member firms research and analysis based on the IDC contract database
* Others: Consumer and recreational services, Construction, Education, Professional services, Securities and investment services, Technology, Wholesale
Graph is not to scale and only represents the division across different parameters. Figures may not add up to 100 percent due to rounding off
Source: IDC (www.idc.com), Contract Database, January 2017, KPMG member firms research and analysis based on the IDC contract database
Banking
and
Financial
Services
Insurance Automotive
and
Aerospace
Travel and
Logistics
Manufacturing Energy and
Utilities
Pharma
and
Healthcare
Publishing,
Media and
Entertainment
Retail Telecom Others* Defense Government
35
140
14
13
29
13
4
20
9
4
9
13
225222
29
62
16
37
16
8 6
17
36
29
14
7
4
9
22 18
6
9
11
15
24
259
55
201
No. of deals
All figures in USD billion
2014 2015 2016
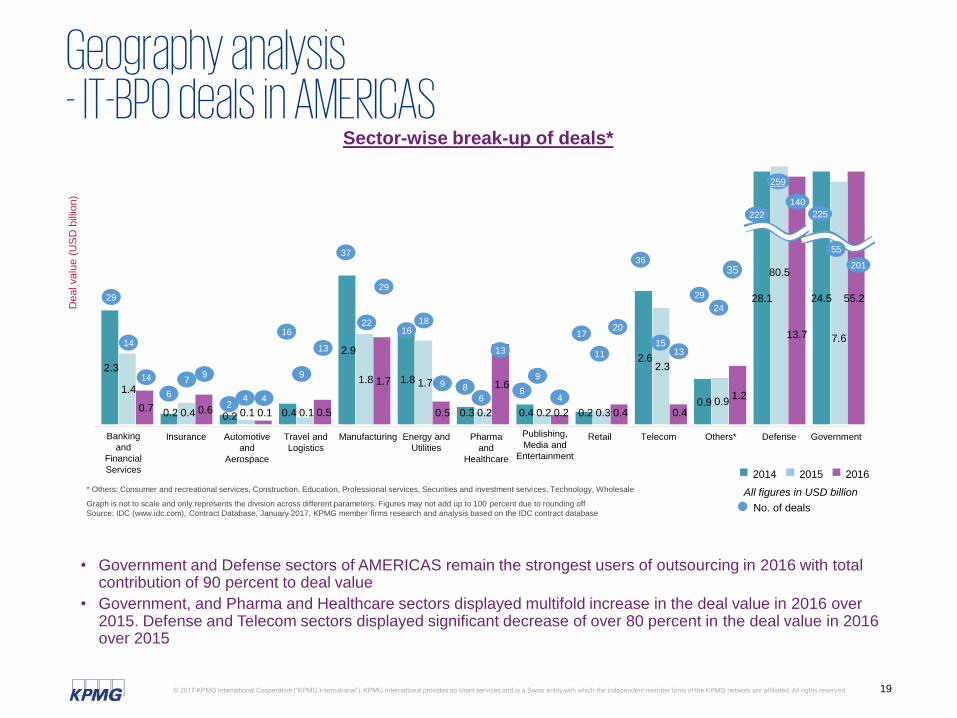
• Government and Defense sectors of AMERICAS remain the strongest users of outsourcing in 2016 with total contribution of 90 percent to deal value
• Government, and Pharma and Healthcare sectors displayed multifold increase in the deal value in 2016 over 2015. Defense and Telecom sectors displayed significant decrease of over 80 percent in the deal value in 2016 over 2015
* Others: Consumer and recreational services, Construction, Education, Professional services, Securities and investment services, Technology, Wholesale
Graph is not to scale and only represents the division across different parameters. Figures may not add up to 100 percent due to rounding off
Source: IDC (www.idc.com), Contract Database, January 2017, KPMG member firms research and analysis based on the IDC contract database
Banking
and
Financial
Services
Insurance Automotive
and
Aerospace
Travel and
Logistics
Manufacturing Energy and
Utilities
Pharma
and
Healthcare
Publishing,
Media and
Entertainment
Retail Telecom Others* Defense Government
No. of deals
All figures in USD billion
2014 2015 2016
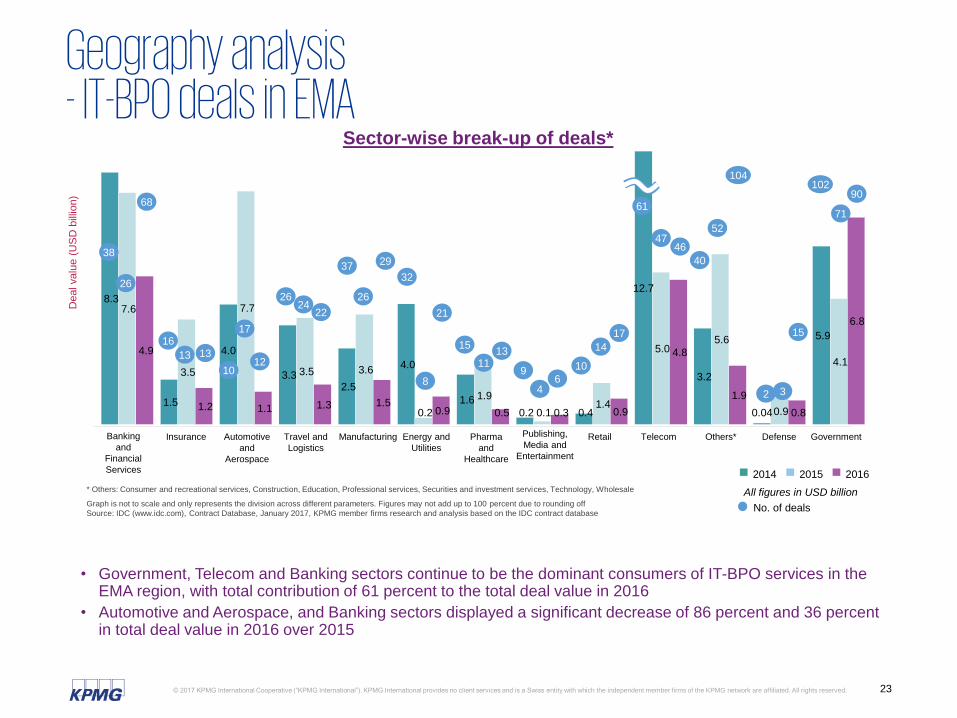
• Government, Telecom and Banking sectors continue to be the dominant consumers of IT-BPO services in the EMA region, with total contribution of 61 percent to the total deal value in 2016
• Automotive and Aerospace, and Banking sectors displayed a significant decrease of 86 percent and 36 percent in total deal value in 2016 over 2015
* Others: Consumer and recreational services, Construction, Education, Professional services, Securities and investment services, Technology, Wholesale
Graph is not to scale and only represents the division across different parameters. Figures may not add up to 100 percent due to rounding off
Source: IDC (www.idc.com), Contract Database, January 2017, KPMG member firms research and analysis based on the IDC contract database
Banking
and
Financial
Services
Insurance Automotive
and
Aerospace
Travel and
Logistics
Manufacturing Energy and
Utilities
Pharma
and
Healthcare
Publishing,
Media and
Entertainment
Retail Telecom Others* Defense Government
No. of deals
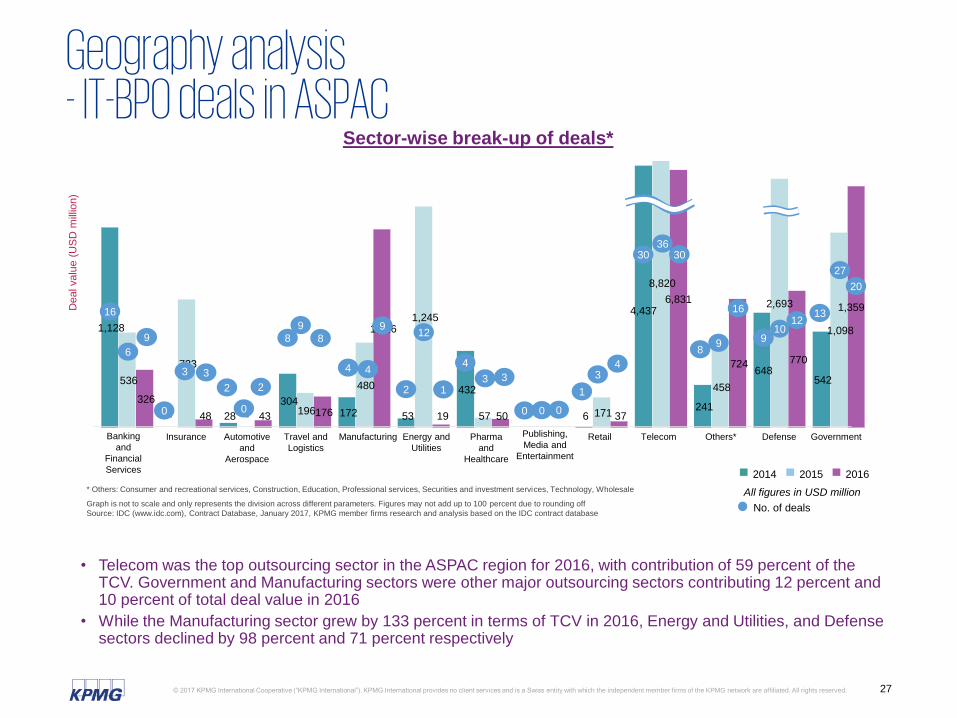
All figures in USD million
2014 2015 2016
• Telecom was the top outsourcing sector in the ASPAC region for 2016, with contribution of 59 percent of the TCV. Government and Manufacturing sectors were other major outsourcing sectors contributing 12 percent and 10 percent of total deal value in 2016
• While the Manufacturing sector grew by 133 percent in terms of TCV in 2016, Energy and Utilities, and Defense sectors declined by 98 percent and 71 percent respectively
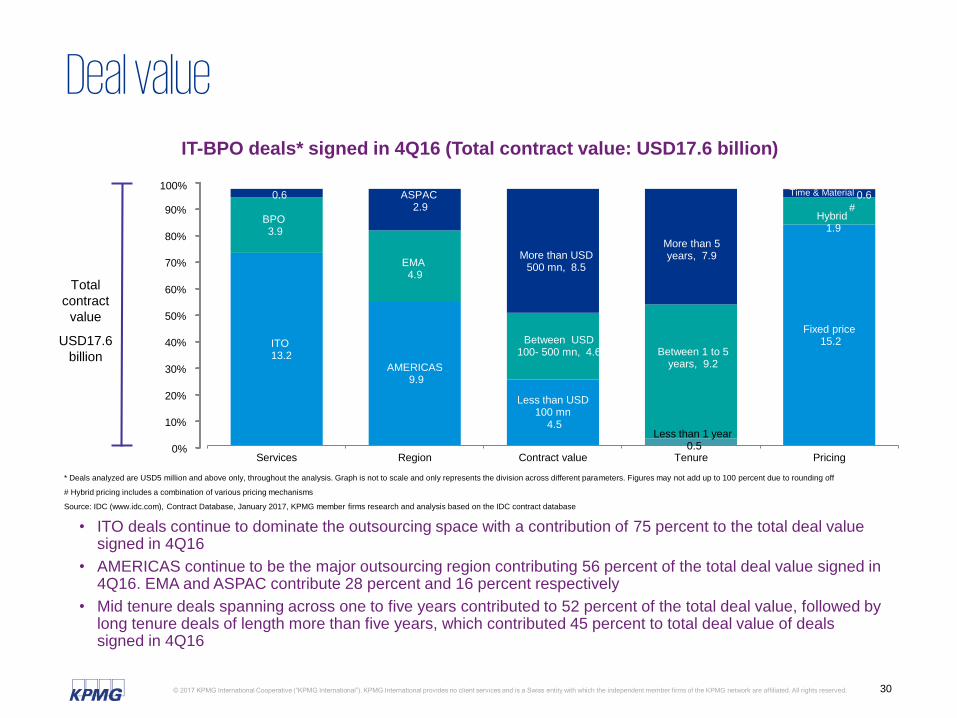
Deal valueIT-BPO deals* signed in 4Q16 (Total contract value: USD17.6 billion)
• ITO deals continue to dominate the outsourcing space with a contribution of 75 percent to the total deal value signed in 4Q16
• AMERICAS continue to be the major outsourcing region contributing 56 percent of the total deal value signed in 4Q16. EMA and ASPAC contribute 28 percent and 16 percent respectively
• Mid tenure deals spanning across one to five years contributed to 52 percent of the total deal value, followed by long tenure deals of length more than five years, which contributed 45 percent to total deal value of deals signed in 4Q16
ITO13.2
BPO3.9
Bundled0.6
AMERICAS9.9
EMA4.9
ASPAC2.9
Less than USD 100 mn
4.5
Between USD 100- 500 mn, 4.6
More than USD 500 mn, 8.5
Less than 1 year0.5
Between 1 to 5 years, 9.2
More than 5 years, 7.9
Fixed price15.2
Hybrid1.9
0.6
Services Region Contract value Tenure Pricing
Time & Material
Total
contract
value
USD17.6
billion
0%
10%
20%
30%
40%
50%
60%
70%
80%
90%
100%
#
* Deals analyzed are USD5 million and above only, throughout the analysis. Graph is not to scale and only represents the division across different parameters. Figures may not add up to 100 percent due to rounding off
# Hybrid pricing includes a combination of various pricing mechanisms
Source: IDC (www.idc.com), Contract Database, January 2017, KPMG member firms research and analysis based on the IDC contract database
Number of dealsIT-BPO deals* signed in 4Q16 (Total number of contracts: 234)
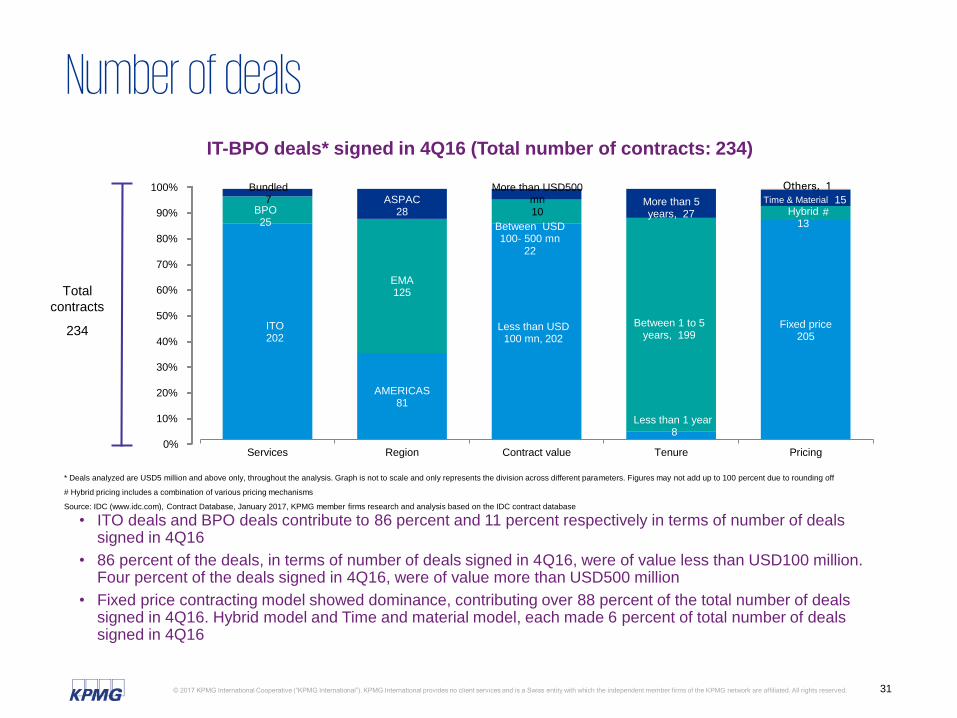
• ITO deals and BPO deals contribute to 86 percent and 11 percent respectively in terms of number of deals signed in 4Q16
• 86 percent of the deals, in terms of number of deals signed in 4Q16, were of value less than USD100 million. Four percent of the deals signed in 4Q16, were of value more than USD500 million
• Fixed price contracting model showed dominance, contributing over 88 percent of the total number of deals signed in 4Q16. Hybrid model and Time and material model, each made 6 percent of total number of deals signed in 4Q16
* Deals analyzed are USD5 million and above only, throughout the analysis. Graph is not to scale and only represents the division across different parameters. Figures may not add up to 100 percent due to rounding off
# Hybrid pricing includes a combination of various pricing mechanisms
Source: IDC (www.idc.com), Contract Database, January 2017, KPMG member firms research and analysis based on the IDC contract database
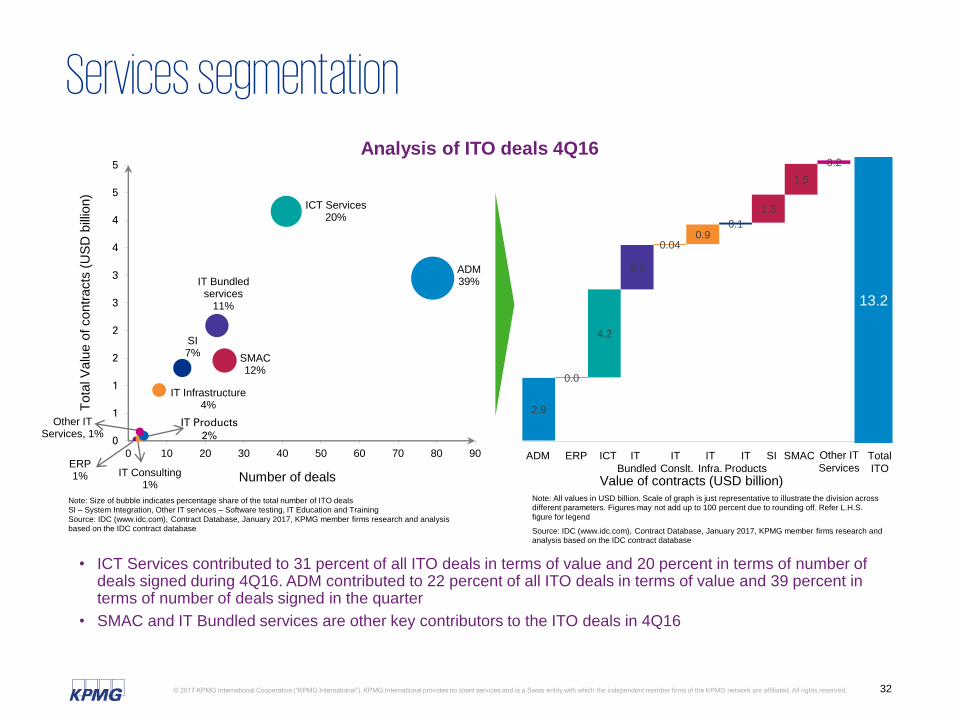
• ICT Services contributed to 31 percent of all ITO deals in terms of value and 20 percent in terms of number of deals signed during 4Q16. ADM contributed to 22 percent of all ITO deals in terms of value and 39 percent in terms of number of deals signed in the quarter
• SMAC and IT Bundled services are other key contributors to the ITO deals in 4Q16
Note: Size of bubble indicates percentage share of the total number of ITO dealsSI – System Integration, Other IT services – Software testing, IT Education and Training
Source: IDC (www.idc.com), Contract Database, January 2017, KPMG member firms research and analysis based on the IDC contract database
Number of deals
Tota
l V
alu
e o
f contr
acts
(U
SD
bill
ion)
Value of contracts (USD billion)
Note: All values in USD billion. Scale of graph is just representative to illustrate the division across different parameters. Figures may not add up to 100 percent due to rounding off. Refer L.H.S.
figure for legend
Source: IDC (www.idc.com), Contract Database, January 2017, KPMG member firms research and analysis based on the IDC contract database
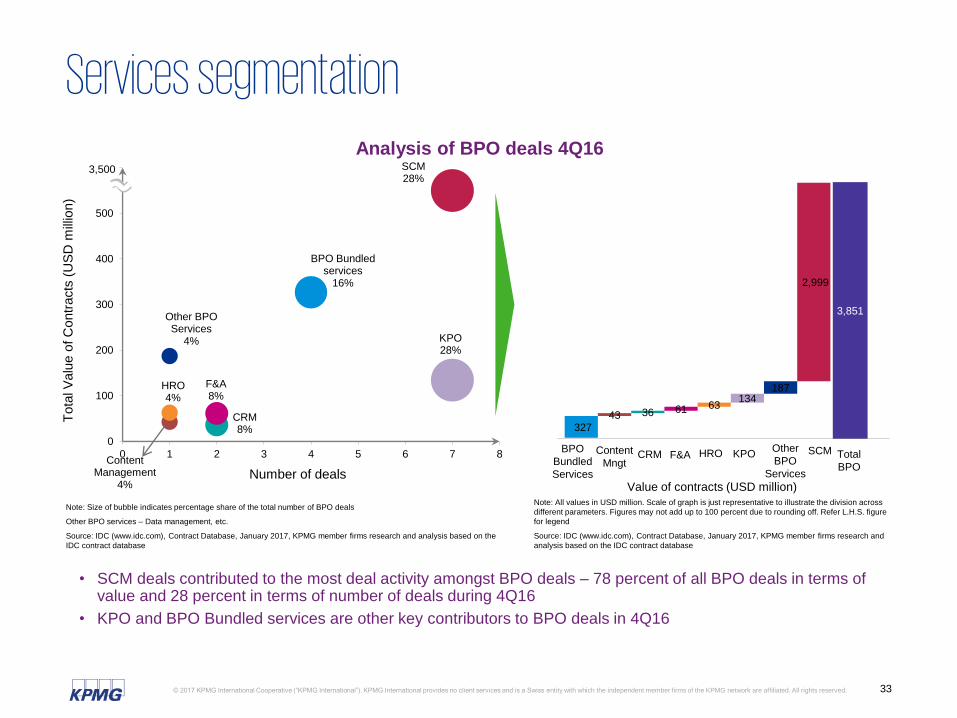
• SCM deals contributed to the most deal activity amongst BPO deals – 78 percent of all BPO deals in terms of value and 28 percent in terms of number of deals during 4Q16
• KPO and BPO Bundled services are other key contributors to BPO deals in 4Q16
Note: Size of bubble indicates percentage share of the total number of BPO deals
Other BPO services – Data management, etc.
Source: IDC (www.idc.com), Contract Database, January 2017, KPMG member firms research and analysis based on the
IDC contract database
BPO Bundled services
16%
Content Management
4%
CRM8%
F&A8%
HRO4%
KPO28%
Other BPO Services
4%
SCM28%
0
100
200
300
400
500
600
0 1 2 3 4 5 6 7 8
Tota
l V
alu
e o
f C
ontr
acts
(U
SD
mill
ion)
Number of deals
327 43 36 61 63
134187
2,999
3,851
BPO
Bundled
Services
CRM Total
BPO
Value of contracts (USD million)
SCM
Note: All values in USD million. Scale of graph is just representative to illustrate the division across
different parameters. Figures may not add up to 100 percent due to rounding off. Refer L.H.S. figure
for legend
Source: IDC (www.idc.com), Contract Database, January 2017, KPMG member firms research and
Global outsourcing industry Outlook• The continued development of process automation and technologies have presented further
opportunities for GBS. This has driven the rise in data and analytical services being embedded in GBS organizations
• Buyers seem cautious about models that include outcome-based pricing while hybrid and fixed pricing models are preferred, contributing to more than 95 percent of the deal value over the last three years. The same trend is most likely to continue in 2017
• Organizations are moving from a traditional silo-based and transactional outsourcing services, to more of a holistic end-to-end approach through bundled deals
• With increasing importance being placed on customer experience, clients are opting for outsourcing not just for cost reduction, but also to avail the value-added services provided by the service providers
• The finance function is more actively engaged in process automation than is the HR function and organizations overall are more active with basic process automation, following by enhanced process automation and cognitive automation
• A reduction in dominance of AMERICAS is observed in the global buyer market for outsourcing services although it continues to be the major outsourcing region contributing 67 percent of the total deal value in 2016. EMA is gaining momentum gradually with ASPAC fast catching up
• Telecom sector is continuously featuring amongst the top contributors to the outsourcing industry for the last three quarters. It is mostly leveraging ICT and SMAC services from service providers and is expected to continue so.
Source: IDC (www.idc.com), Contract Database, January 2017, KPMG member firms research and analysis based on the IDC contract database
The information contained herein is of a general nature and is not intended to address the circumstances of any particular individual or entity. Although we endeavor to provide accurate and timely information, there can be no guarantee that such information is accurate as of the date it is received or that it will continue to be accurate in the future. No one should act on such information without appropriate professional advice after a thorough examination of the particular situation.