29
© 2013 Platts, McGraw Hill Financial. All rights reserved. Global Oil Markets Outlook Vandana Hari, Asia Editorial Director 28 May 2014, Shanghai

© 2013 Platts, McGraw Hill Financial. All rights reserved.
Global Oil Markets Outlook
Vandana Hari, Asia Editorial Director
28 May 2014, Shanghai

2
Enabling the markets to perform with greater
Transparency & Efficiency
Since
Platts – An introduction

New YorkDenver
WashingtonHouston
Buenos Aires
London Moscow
Dubai
Beijing
TokyoShanghai
Hong Kong
Singapore
Evergreen
Boston
Hightstown
Pittsburgh
São Paulo
Lausanne
Platts – An introduction
Cape Town

Houston
ARA (Amsterdam Rotterdam
Antwerp)
Singapore
Platts – An Introduction
Key global crude and oil products benchmarks, including Brent and Dubai Intelligence on oil, petrochemicals, metals, gas & power, agricultural markets
Editorial and market assessments are conducted
with complete Independence & Impartiality

Agenda
5
Oil prices – End to volatility?- What fundamentals and
geopolitics tell us
US shale boom- The impact on global oil flowsso far and going forward
Redefining refining - Sector in a major flux globally

Global Oil Markets: Stable On The Surface
6
Source: Platts Dated Brent assessments

Demand Stabilization Anchoring Crude
7
Source: Platts analysis of quarterly historic and forecast demand from OPEC’s Monthly Oil Market Report (January 2014) and IEA’s Oil Market Report (January 2014)

Global Crude Markets Finely Balanced
8
Source: Platts Dated Brent assessments
Annual Demand Growth = 1 million b/d
New Crude Supplies From US, Iraq, Africa
US Crude Export PolicyMarginal Cost Of Tight Oil
OPEC Coordination?
Easing Iran Sanctions

Oil Markets Find Stable Evolutionary Curve
The mood at Platts 7th Global Crude Oil Summit May 13-14
9
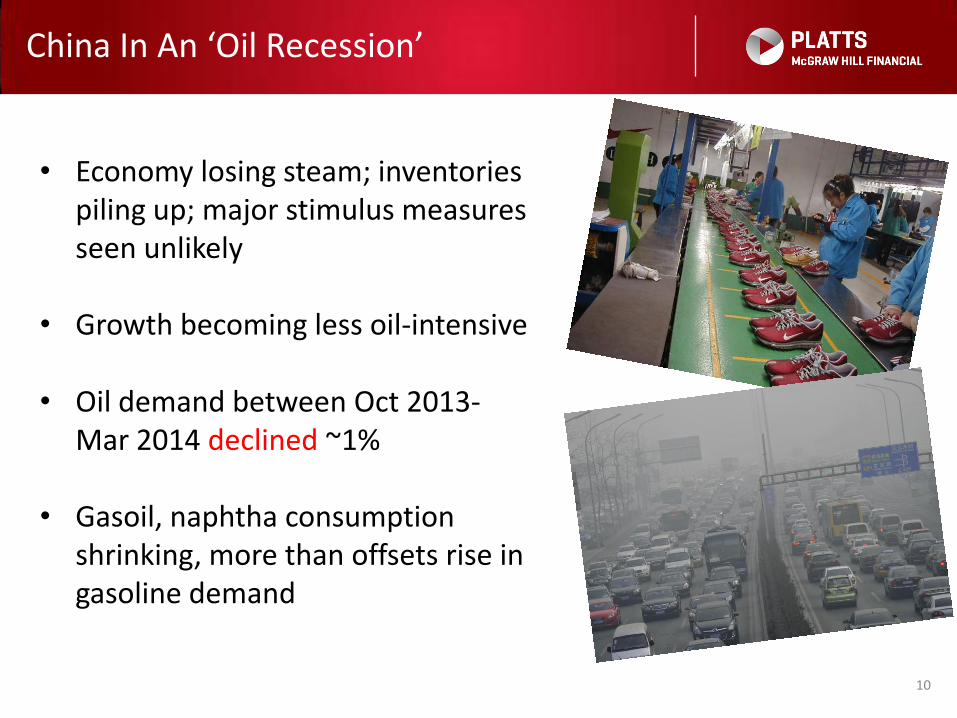
China In An ‘Oil Recession’
10
• Economy losing steam; inventories piling up; major stimulus measures seen unlikely
• Growth becoming less oil-intensive
• Oil demand between Oct 2013-Mar 2014 declined ~1%
• Gasoil, naphtha consumption shrinking, more than offsets rise in gasoline demand

Downside Risks To Global Demand Growth
11
Source: IEA
Demand: IEA projects 1.3 mil b/d growth for 2014 Too optimistic?
CHINA: Oil demand growth slowing down faster than GDP
INDIA: Annual growth in consumption cools to <1%
RUSSIA: Ukraine tensions and sanctions dampen economic outlook
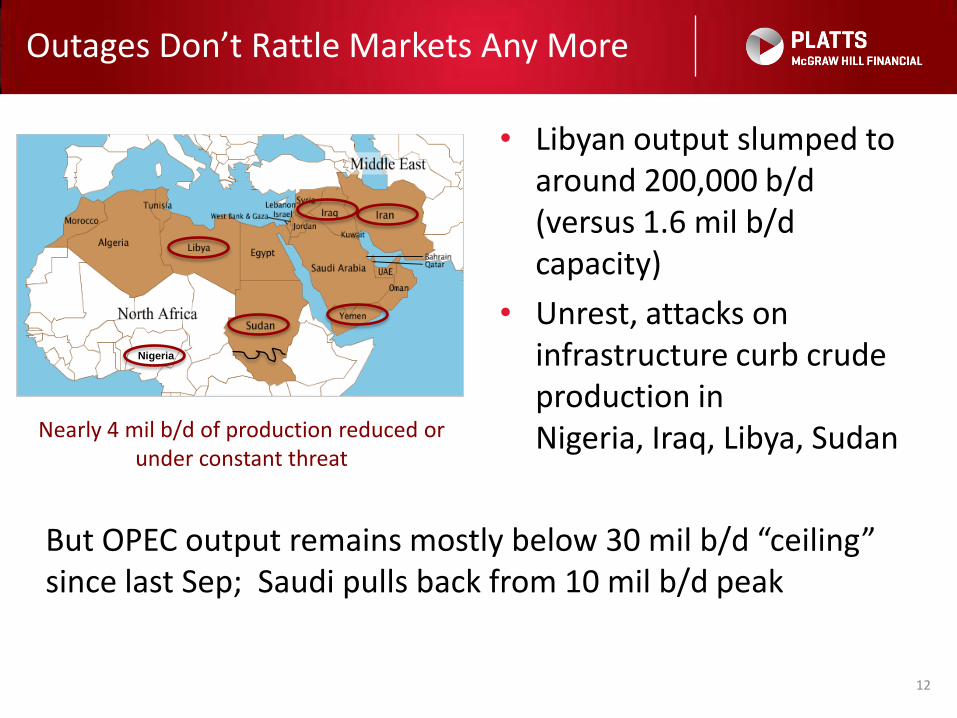
Outages Don’t Rattle Markets Any More
• Libyan output slumped to around 200,000 b/d (versus 1.6 mil b/d capacity)
• Unrest, attacks on infrastructure curb crude production in Nigeria, Iraq, Libya, Sudan
12
Nigeria
Nearly 4 mil b/d of production reduced or under constant threat
But OPEC output remains mostly below 30 mil b/d “ceiling” since last Sep; Saudi pulls back from 10 mil b/d peak

Plenty Of New Supply, Led by N. America
ON THE OPEC FRONT:
• Iran could raise output by ~1 mil b/d within 6 months if sanctions lifted; aims for 5 mil b/d output by 2018
• Iraq production is on a strong ascent – 3.4 mil b/d in Feb, highest since 1979
• Will OPEC be able to respond if there is a supply glut?13
Non-OPEC supply growing at its strongest in decades
Source: IEA

US Shale Bonanza
The Impact On Global Oil Flows So Far And Going Forward

US Tight Oil Boom – Light, Sweet Surplus
15
~ 9.6 mil b/d
• 2020: Nearly half the output will be tight oil• Most tight oil is light/ultra light sweet crude/condensate• Nearly 2 mil b/d of excess light sweet crude foreseen
2019

US Produces More Crude Than It Imports
16Source: EIA
3.5
5.5
7.5
9.5
11.5
2005
Million B/D
Production
Imports

Average Daily US Imports By Supplier
17Source: EIA

Canada, Colombia Boost Exports To US
18
Canada
Colombia
• Imports from Africa – light, sweet grades from Nigeria, Algeria, Angola – down 90% from 2 mil b/d in 2005 to 170,000 b/d in Jan-Apr 2014
• Imports of Canadian crude jumped 70% from 2005 to average 2.7 mil b/d this year
• Imports of Colombian crude doubled from 2005 to 300,000 b/d this year
• US TO ALLOW CRUDE EXPORTS?UNLIKELY!

Surplus To Find Its Way Out As Products
19
New condensate splitters coming on stream – Nearly 475,000 b/d new capacity over the next 2 years (source: Platts Bentek)
New ethane crackers being built – Around 12 mil mt/year of new ethylene capacity planned to come on stream by 2020
Nearly 50% capacity growth in both
Unprecedented boom in US oil, gas infrastructure

US Oil Product Exports Vault Over 3 Mil B/D
20
GASOIL
GASOLINE
LPG, NAPHTHA
0
1
2
3
4
5
2008 2009 2010 2011 2012 2013 2014
Mil B/D
Finished Petroleum Products NGLs Biofuels and blending components
PLANT CONDENSATE

Redefining Refining
Sector In Major Flux Globally

Oil Markets In Three Very Different Worlds
22
Crude: InsularityProducts: Export expansion
Crude: ContractionProducts: Import expansion
Crude and productsMore supply/More demand

Refining Sector Tilts To Overcapacity
23
Japan
Australia
Europe(?)
China
Middle East
India
US
Africa, Latin America (?)

Japan Contracts, But Major “Sinks” in SE Asia
• Japan – 20% reduction in capacity from 2008 peak of 4.9 mil b/d; more cuts likely by 2017
• Major product “sinks” in Southeast Asia:
- Indonesia – About 500-600,000 b/d; could double by 2020
- Australia – About 375,000 b/d; seen rising to 700,000 b/d by 2016
- Vietnam – About 180,000 b/d; could vanish around 2020 if refining capacity rises
24

China Refining Overcapacity
• Downstream additions surpass demand growth
• Some 4 mil b/d excess capacity seen by 2015
• Capacity utilization rates on a slippery slope
• Product exports rising, imports declining
“If China does not rein in excess capacity, refinery utilization rates could drop to 67% by 2020, lower
than the 72-75% in the steel industry now”
– Sinopec Chairman Fu Chengyu (March ‘14)
25

Mideast In Unprecedented Refinery Boom
26
26
Yanbu, 400 kb/d, 2016 (e)
Jizan, 400 kb/d, after
2019 (e)
Duqm, 230 kb/d, 2020 (e)
Fujairah, 200 kb/d, 2020 (e)
Ruwaisexpansion, +417 kb/d, 2015 (e)
Ras Laffan II, 146 kb/d condensate
splitter, 2016
Jubail, 400 kb/d, 2013
(started)
Al Zour, 615 kb/d, by 2021 (e)
Iraq, various, total 700 kb/d 2019 onwards (e)
Soharexpansion, +86 kb/d, 2016 (e)

European Refining Sector On Life-Support
• Europe oil demand remains on a slippery slope
• Around 2.5 mil b/d products demand lost between
2005-2013
• Refiners opt to reduce rates rather than shut down
• Average refinery utilization rates languish around 75%
“1 mil b/d immediate capacity is needed to shut down along with a further 1.5-2.0 mil b/d by the end of 2017 to
restore healthy utilization”
– Marcus Lippold, VP, MOL (April ‘14)
27

Golden Age For US Gulf Coast Refiners
28
-8
-3
2
7
12
17
22
May
-13
Jun
-13
Jul-
13
Au
g-1
3
Sep
-13
Oct
-13
No
v-1
3
De
c-1
3
Jan
-14
Feb
-14
Mar
-14
Ap
r-1
4
May
-14
$/B US Gulf Coast (LLS) ARA (Brent) Italy (Urals) Singapore (Dubai)
Cracking Margins Over The Past Year
Source: Platts and Turner, Mason & Co.


