Page 1
EnSys: Refining Economics Technology ModelingEnSys: Refining Economics Technology Modeling
Global Outlook: Alternative Fuel Scenarios through 2020
Implications for Refining, Hydrogen
Martin Tallett & Daniel DunbarEnSys Energy
www.ensysenergy.com
Haldor Topsoe ConferenceAugust 2006
Page 2
EnSys: Refining Economics Technology ModelingEnSys: Refining Economics Technology Modeling
Summary of Presentation• 2 perspectives on 2020 global oil downstream
– “business as usual”– high price / alternative outlook
• Focus on:– non-conventional & alternative fuels supply– demand reduction
• WORLD model assessments of 2020 outlook:– refining capacity / investments – market prices / differentials– marine bunkers
• Implications
Page 3
EnSys: Refining Economics Technology ModelingEnSys: Refining Economics Technology Modeling
EnSys Activities• Focus:
– Assessing short through long term developments in the global oil refining and supply system
– So as to inform and guide client decisions affecting policy & strategy
• Methods:– Quantitative simulation and projection of the global downstream
• Bottom up WORLD modeling encompassing: – Crudes and non-crudes supply– Refining and crude and product transportation/trade– Product quality and demand– (Potentially) emissions
Page 4
EnSys: Refining Economics Technology ModelingEnSys: Refining Economics Technology Modeling
EnSys Activities• Examples – current & recent projects:
– DOE OSPR assess how US and global refining is likely to change by 2015 and the implications for crude oil requirements under disruptions
– EPA assess the impacts on US and global refining and oil markets of potentially far reaching regulations to reduce emissions from international marine bunker fuels
– European super major, assess the potential for adequacy of announced refining projects and the implications for profitability, especially in Asia
– 2 US majors, assess market and refining implications of major GTL projects
Page 5
EnSys: Refining Economics Technology ModelingEnSys: Refining Economics Technology Modeling
EnSys Activities• Examples – current & recent projects:
– OPEC, assess the factors that have created current refining tightness and the medium term outlook
– Bloomberg, generate daily refining netbacks & margins in several markets
– EIA, re-license WORLD model to improve their ability to undertake short and long term analyses of global developments, policies, issues
– Canadian syncrude producer / super major, assess US and global refining & supply GHG emission impacts of introducing their syncrude
– Additives manufacturer, US and global market price and GHG impacts of making gasoline easier to produce
Page 6
EnSys: Refining Economics Technology ModelingEnSys: Refining Economics Technology Modeling
EnSys Activities• Examples – current & recent projects:
– For ExxonMobil, expert witness on Alaskan crude valuation
– For State of New York, impacts of banning MTBE, requiring ethanol in gasoline
– For water authorities, pending testimony in MTBE liability litigation
Page 7
EnSys: Refining Economics Technology ModelingEnSys: Refining Economics Technology Modeling
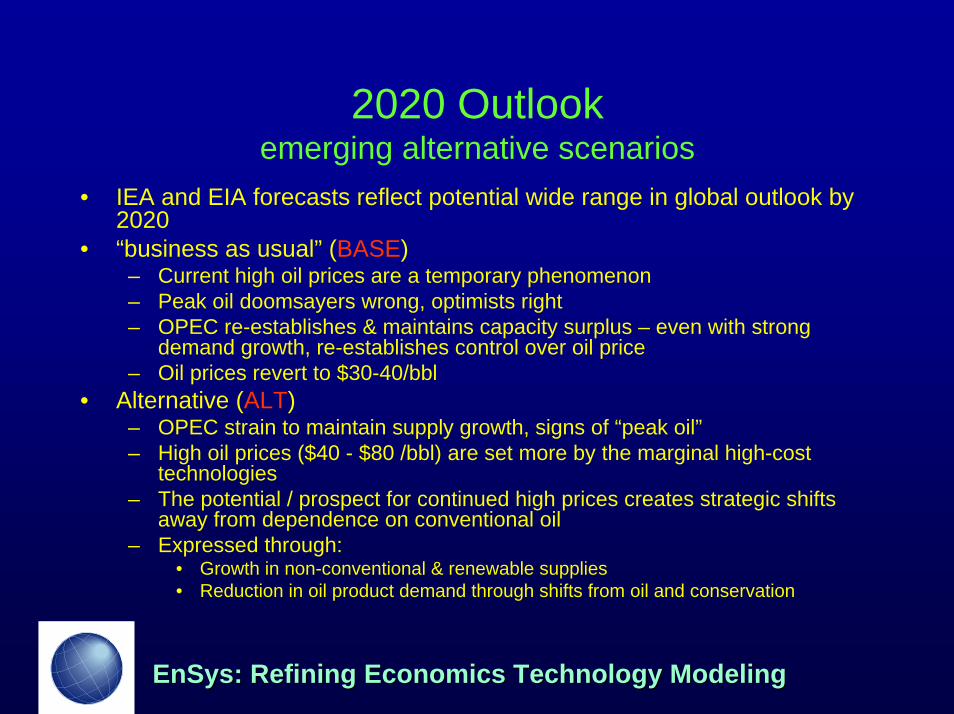
2020 Outlookemerging alternative scenarios
• IEA and EIA forecasts reflect potential wide range in global outlook by 2020
• “business as usual” (BASE)– Current high oil prices are a temporary phenomenon– Peak oil doomsayers wrong, optimists right– OPEC re-establishes & maintains capacity surplus – even with strong
demand growth, re-establishes control over oil price– Oil prices revert to $30-40/bbl
• Alternative (ALT)– OPEC strain to maintain supply growth, signs of “peak oil”– High oil prices ($40 - $80 /bbl) are set more by the marginal high-cost
technologies– The potential / prospect for continued high prices creates strategic shifts
away from dependence on conventional oil– Expressed through:
• Growth in non-conventional & renewable supplies• Reduction in oil product demand through shifts from oil and conservation
Page 8
EnSys: Refining Economics Technology ModelingEnSys: Refining Economics Technology Modeling
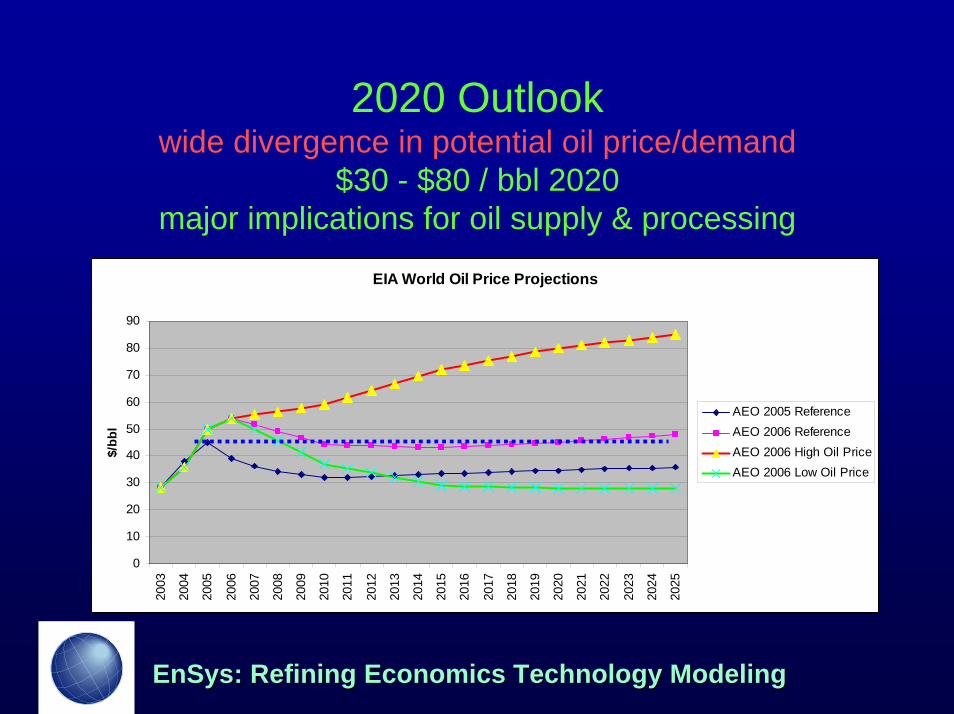
2020 Outlookwide divergence in potential oil price/demand
$30 - $80 / bbl 2020major implications for oil supply & processing
EIA World Oil Price Projections
0
10
20
30
40
50
60
70
80
90
2003
2004
2005
2006
2007
2008
2009
2010
2011
2012
2013
2014
2015
2016
2017
2018
2019
2020
2021
2022
2023
2024
2025
$/bb
l
AEO 2005 ReferenceAEO 2006 ReferenceAEO 2006 High Oil PriceAEO 2006 Low Oil Price
Page 9
EnSys: Refining Economics Technology ModelingEnSys: Refining Economics Technology Modeling
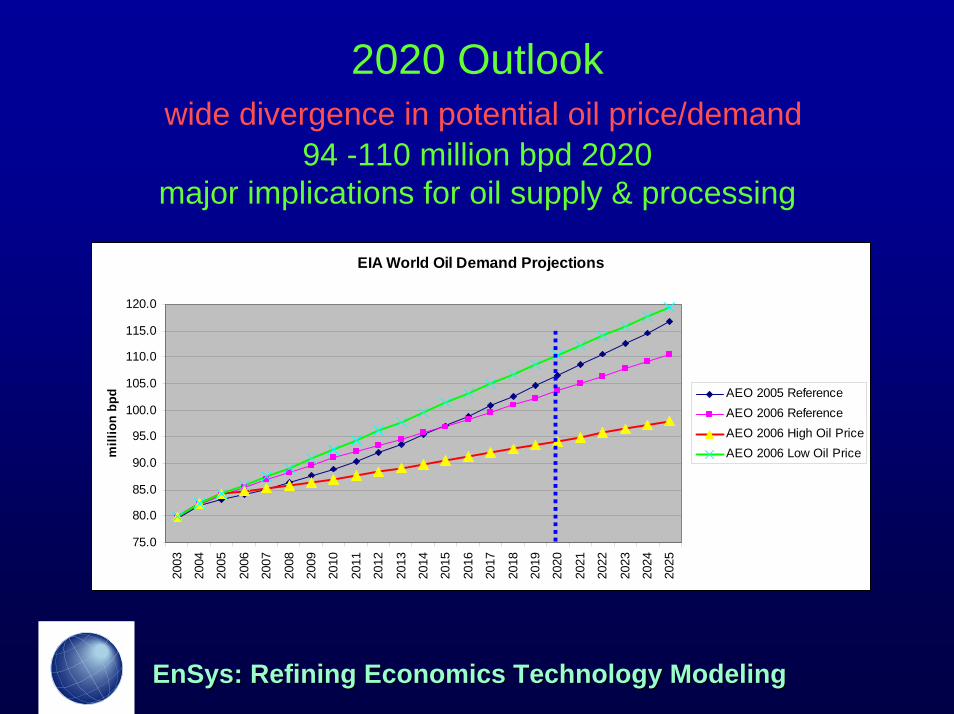
2020 Outlookwide divergence in potential oil price/demand
94 -110 million bpd 2020major implications for oil supply & processing
EIA World Oil Demand Projections
75.0
80.0
85.0
90.0
95.0
100.0
105.0
110.0
115.0
120.0
2003
2004
2005
2006
2007
2008
2009
2010
2011
2012
2013
2014
2015
2016
2017
2018
2019
2020
2021
2022
2023
2024
2025
mill
ion
bpd AEO 2005 Reference
AEO 2006 ReferenceAEO 2006 High Oil PriceAEO 2006 Low Oil Price
Page 10
EnSys: Refining Economics Technology ModelingEnSys: Refining Economics Technology Modeling
2020 Outlookpotential exists for large increases in non-conventional /
alternative fuels
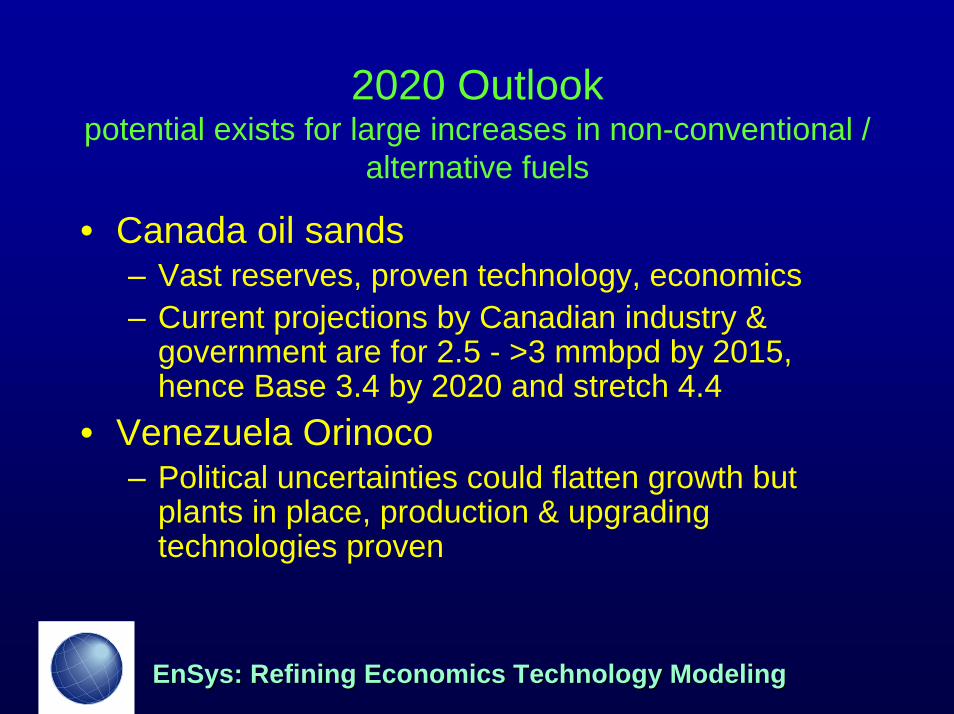
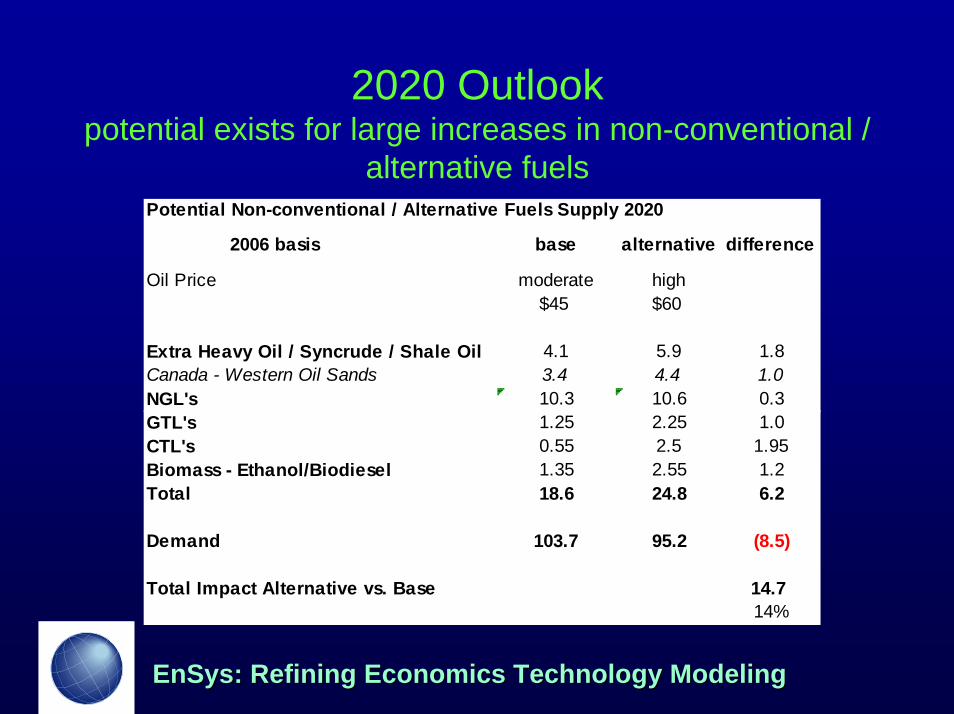
• Canada oil sands– Vast reserves, proven technology, economics – Current projections by Canadian industry &
government are for 2.5 - >3 mmbpd by 2015, hence Base 3.4 by 2020 and stretch 4.4
• Venezuela Orinoco– Political uncertainties could flatten growth but
plants in place, production & upgrading technologies proven
Page 11
EnSys: Refining Economics Technology ModelingEnSys: Refining Economics Technology Modeling
2020 Outlookpotential exists for large increases in non-conventional /
alternative fuels
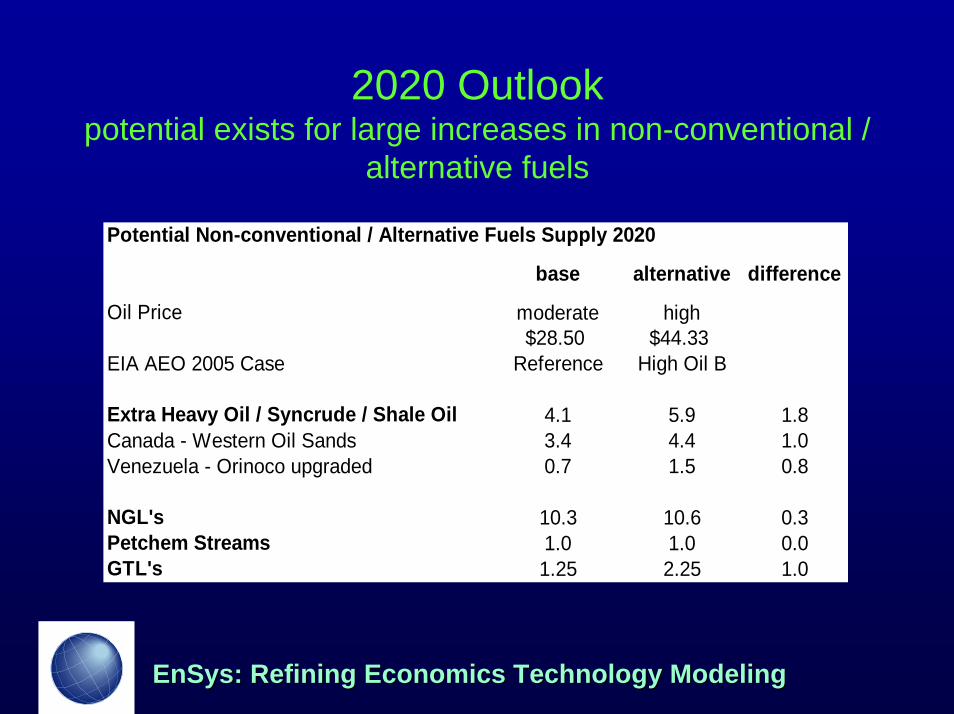
Potential Non-conventional / Alternative Fuels Supply 2020
base alternative difference
Oil Price moderate high$28.50 $44.33
EIA AEO 2005 Case Reference High Oil B
Extra Heavy Oil / Syncrude / Shale Oil 4.1 5.9 1.8Canada - Western Oil Sands 3.4 4.4 1.0Venezuela - Orinoco upgraded 0.7 1.5 0.8
NGL's 10.3 10.6 0.3Petchem Streams 1.0 1.0 0.0GTL's 1.25 2.25 1.0
Page 12
EnSys: Refining Economics Technology ModelingEnSys: Refining Economics Technology Modeling
2020 Outlookpotential exists for large increases in non-conventional /
alternative fuels• NGLs
– Offsetting effects in Alt Case:• Lowered oil production will cut NGL output but • Higher gas production will offset• Net little change projected in Alt case
• Petchem Naphtha demand and returns assumed little impacted
• GTL production substantially higher in Alt case as high oil prices relative to gas raise incentives / accelerate technology progress
Page 13
EnSys: Refining Economics Technology ModelingEnSys: Refining Economics Technology Modeling
2020 Outlookpotential exists for large increases in non-conventional /
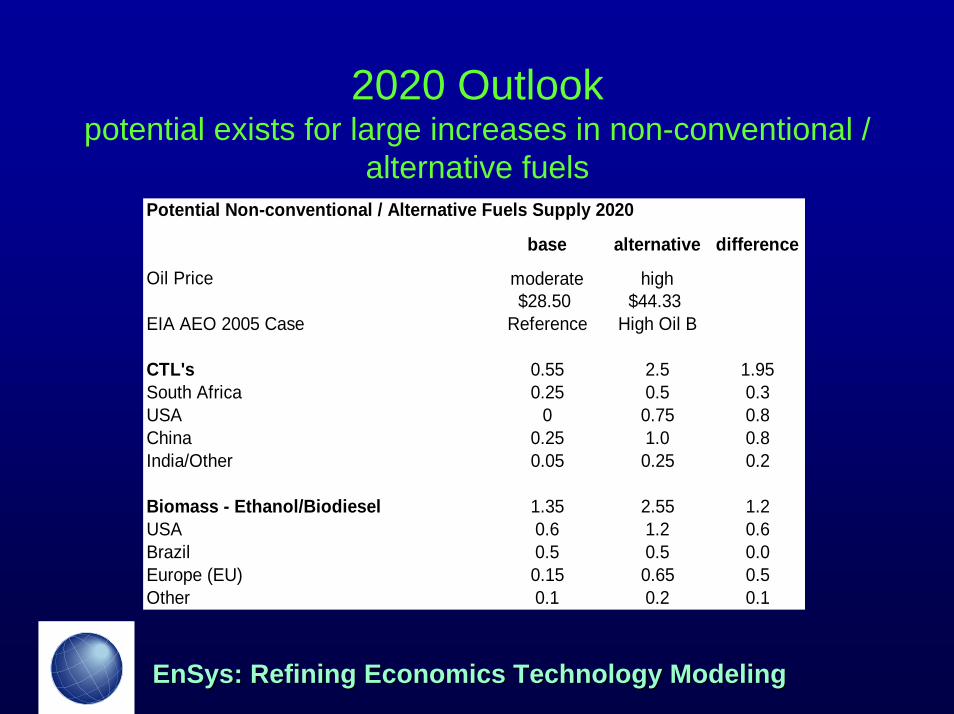
alternative fuels
• CTL’s– Recent EIA outlook indicated potential for
substantial CTL production from large US coal base – and Energy Policy Act contains incentives
– China has large coal reserves, is moving ahead with project (part of strategic diversification) and has announced plans to go to 1 mmbpd plus
– India has large coal reserves and has announced projects
– South Africa potential to expand– Other players already have production
Page 14
EnSys: Refining Economics Technology ModelingEnSys: Refining Economics Technology Modeling
2020 Outlookpotential exists for large increases in non-conventional /
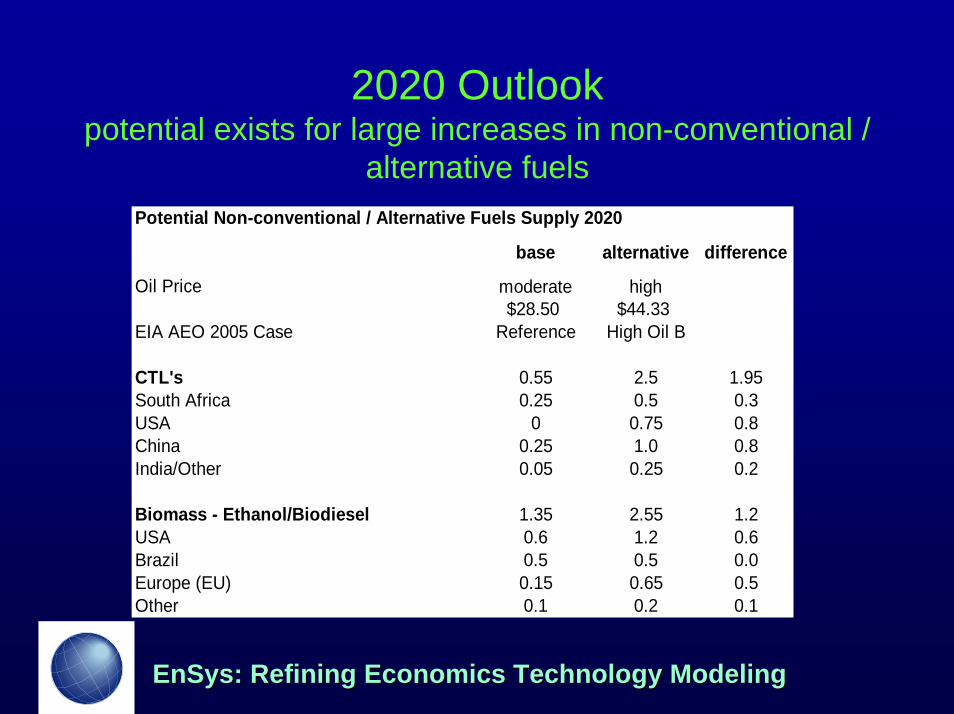
alternative fuelsPotential Non-conventional / Alternative Fuels Supply 2020
base alternative difference
Oil Price moderate high$28.50 $44.33
EIA AEO 2005 Case Reference High Oil B
CTL's 0.55 2.5 1.95South Africa 0.25 0.5 0.3USA 0 0.75 0.8China 0.25 1.0 0.8India/Other 0.05 0.25 0.2
Biomass - Ethanol/Biodiesel 1.35 2.55 1.2USA 0.6 1.2 0.6Brazil 0.5 0.5 0.0Europe (EU) 0.15 0.65 0.5Other 0.1 0.2 0.1
Page 15
EnSys: Refining Economics Technology ModelingEnSys: Refining Economics Technology Modeling
2020 Outlookpotential exists for large increases in non-conventional /
alternative fuels• Biomass
– USA• Energy Policy Act RFS mandates 7.5 bn gal/yr by 2012 and
maintaining ratio to gasoline thereafter• Oak Ridge study has shown potential to produce ethanol from
“cellusosic” wastes equivalent to 10% of US transport fuels by 2020, 20% by 2030
• rapid supply growth, new companies / plants• EnSys 2020 Alt projection equates to around 7% including ethanol from
corn, i.e. around 3.5% each from corn based and cellulosic ethanol– Europe
• EU has announced tentative target of 20% alternative fuels in transport fuels by 2020
• Production already exists in several EU countries and is growingrapidly, emphasis on bio-diesel
• EnSys Base case assumes 2% level by 2020, Alt case 8% level
Page 16
EnSys: Refining Economics Technology ModelingEnSys: Refining Economics Technology Modeling
2020 Outlookpotential exists for large increases in non-conventional /
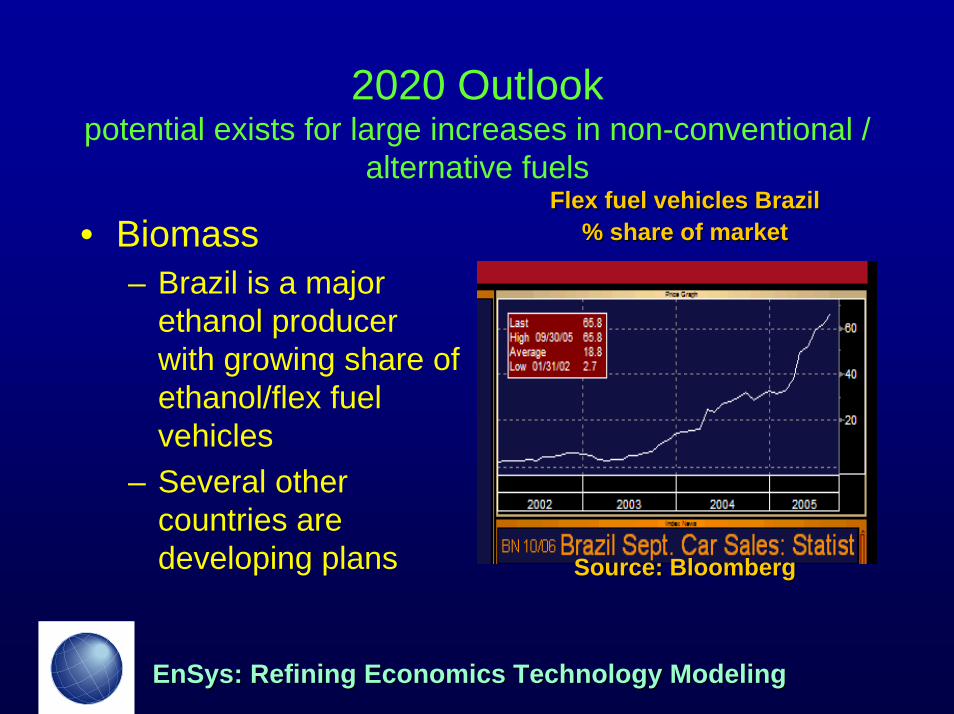
alternative fuelsFlex fuel vehicles BrazilFlex fuel vehicles Brazil
% share of market% share of market• Biomass– Brazil is a major
ethanol producer with growing share of ethanol/flex fuel vehicles
– Several other countries are developing plans Source: BloombergSource: Bloomberg
Page 17
EnSys: Refining Economics Technology ModelingEnSys: Refining Economics Technology Modeling
2020 Outlookpotential exists for large increases in non-conventional /
alternative fuelsPotential Non-conventional / Alternative Fuels Supply 2020
base alternative difference
Oil Price moderate high$28.50 $44.33
EIA AEO 2005 Case Reference High Oil B
CTL's 0.55 2.5 1.95South Africa 0.25 0.5 0.3USA 0 0.75 0.8China 0.25 1.0 0.8India/Other 0.05 0.25 0.2
Biomass - Ethanol/Biodiesel 1.35 2.55 1.2USA 0.6 1.2 0.6Brazil 0.5 0.5 0.0Europe (EU) 0.15 0.65 0.5Other 0.1 0.2 0.1
Page 18
EnSys: Refining Economics Technology ModelingEnSys: Refining Economics Technology Modeling
2020 Outlookpotential exists for large increases in non-conventional /
alternative fuelsPotential Non-conventional / Alternative Fuels Supply 2020
2006 basis base alternative difference
Oil Price moderate high$45 $60
Extra Heavy Oil / Syncrude / Shale Oil 4.1 5.9 1.8Canada - Western Oil Sands 3.4 4.4 1.0NGL's 10.3 10.6 0.3GTL's 1.25 2.25 1.0CTL's 0.55 2.5 1.95Biomass - Ethanol/Biodiesel 1.35 2.55 1.2Total 18.6 24.8 6.2
Demand 103.7 95.2 (8.5)
Total Impact Alternative vs. Base 14.714%
Page 19
EnSys: Refining Economics Technology ModelingEnSys: Refining Economics Technology Modeling
2020 Outlookpotential exists for large increases in non-conventional /
alternative fuels
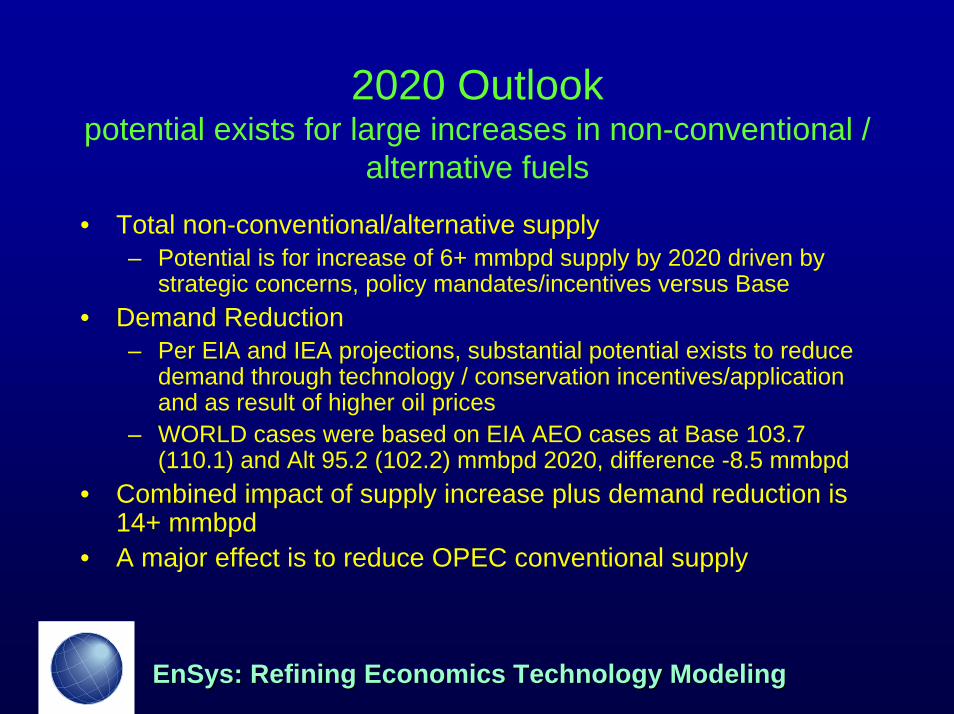
• Total non-conventional/alternative supply– Potential is for increase of 6+ mmbpd supply by 2020 driven by
strategic concerns, policy mandates/incentives versus Base • Demand Reduction
– Per EIA and IEA projections, substantial potential exists to reduce demand through technology / conservation incentives/application and as result of higher oil prices
– WORLD cases were based on EIA AEO cases at Base 103.7 (110.1) and Alt 95.2 (102.2) mmbpd 2020, difference -8.5 mmbpd
• Combined impact of supply increase plus demand reduction is 14+ mmbpd
• A major effect is to reduce OPEC conventional supply
Page 20
EnSys: Refining Economics Technology ModelingEnSys: Refining Economics Technology Modeling
2020 OutlookDemand impact detail
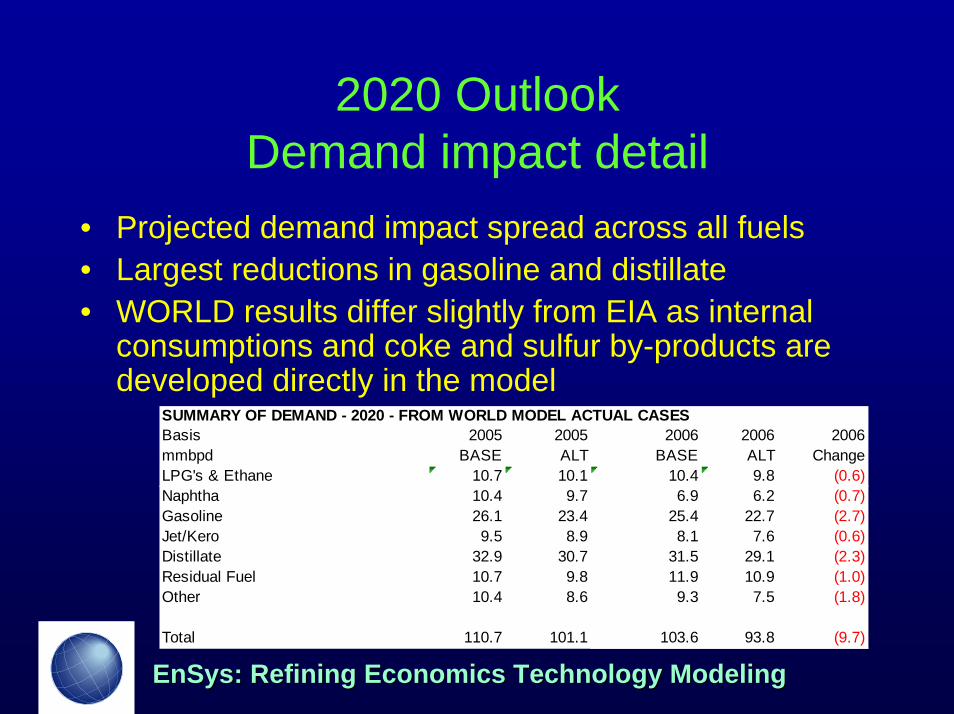
• Projected demand impact spread across all fuels• Largest reductions in gasoline and distillate• WORLD results differ slightly from EIA as internal
consumptions and coke and sulfur by-products are developed directly in the model
SUMMARY OF DEMAND - 2020 - FROM WORLD MODEL ACTUAL CASESBasis 2005 2005 2006 2006 2006mmbpd BASE ALT BASE ALT ChangeLPG's & Ethane 10.7 10.1 10.4 9.8 (0.6)Naphtha 10.4 9.7 6.9 6.2 (0.7)Gasoline 26.1 23.4 25.4 22.7 (2.7)Jet/Kero 9.5 8.9 8.1 7.6 (0.6)Distillate 32.9 30.7 31.5 29.1 (2.3)Residual Fuel 10.7 9.8 11.9 10.9 (1.0)Other 10.4 8.6 9.3 7.5 (1.8)
Total 110.7 101.1 103.6 93.8 (9.7)
Page 21
EnSys: Refining Economics Technology ModelingEnSys: Refining Economics Technology Modeling
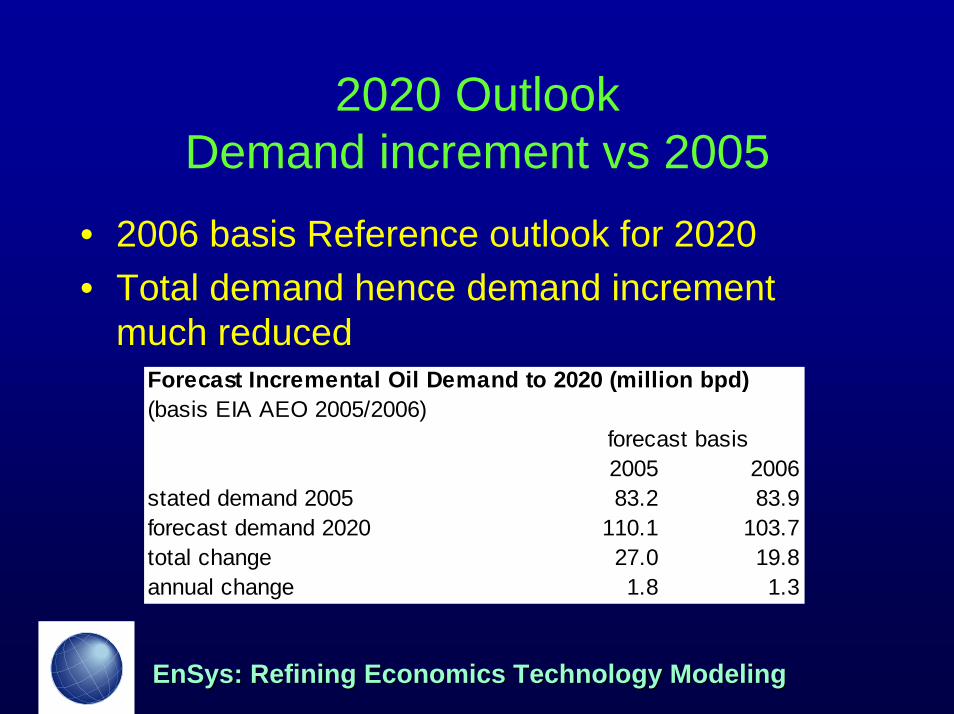
2020 OutlookDemand increment vs 2005
• 2006 basis Reference outlook for 2020• Total demand hence demand increment
much reducedForecast Incremental Oil Demand to 2020 (million bpd)(basis EIA AEO 2005/2006)
2005 2006stated demand 2005 83.2 83.9forecast demand 2020 110.1 103.7total change 27.0 19.8annual change 1.8 1.3
forecast basis
Page 22
EnSys: Refining Economics Technology ModelingEnSys: Refining Economics Technology Modeling
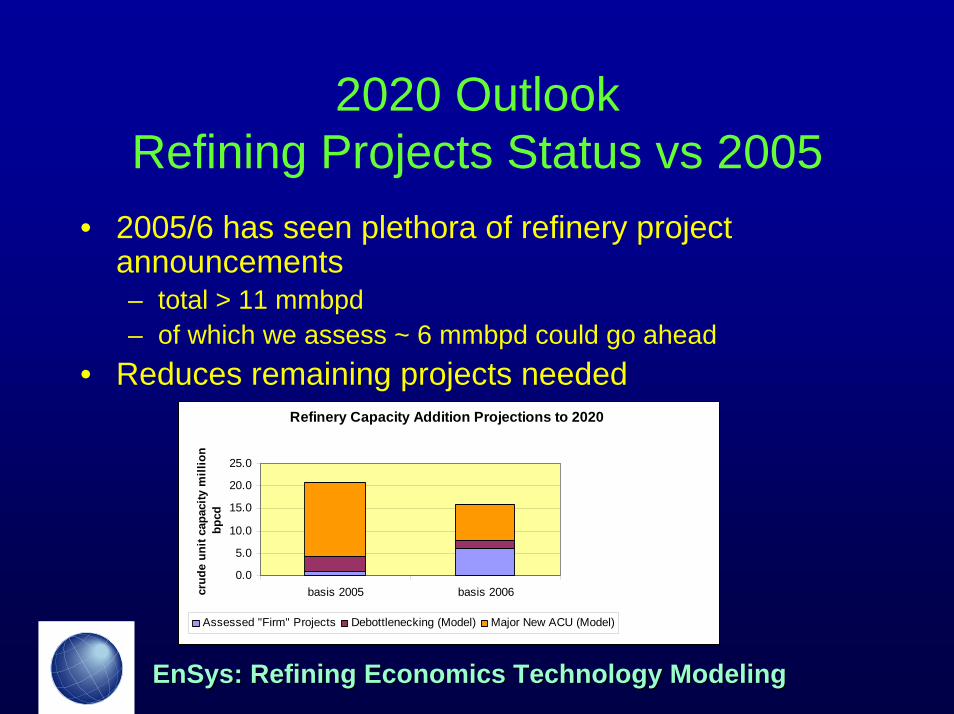
2020 OutlookRefining Projects Status vs 2005
• 2005/6 has seen plethora of refinery project announcements– total > 11 mmbpd– of which we assess ~ 6 mmbpd could go ahead
• Reduces remaining projects neededRefinery Capacity Addition Projections to 2020
0.0
5.0
10.0
15.0
20.0
25.0
basis 2005 basis 2006crud
e un
it ca
paci
ty m
illio
n bp
cd
Assessed "Firm" Projects Debottlenecking (Model) Major New ACU (Model)
Page 23
EnSys: Refining Economics Technology ModelingEnSys: Refining Economics Technology Modeling
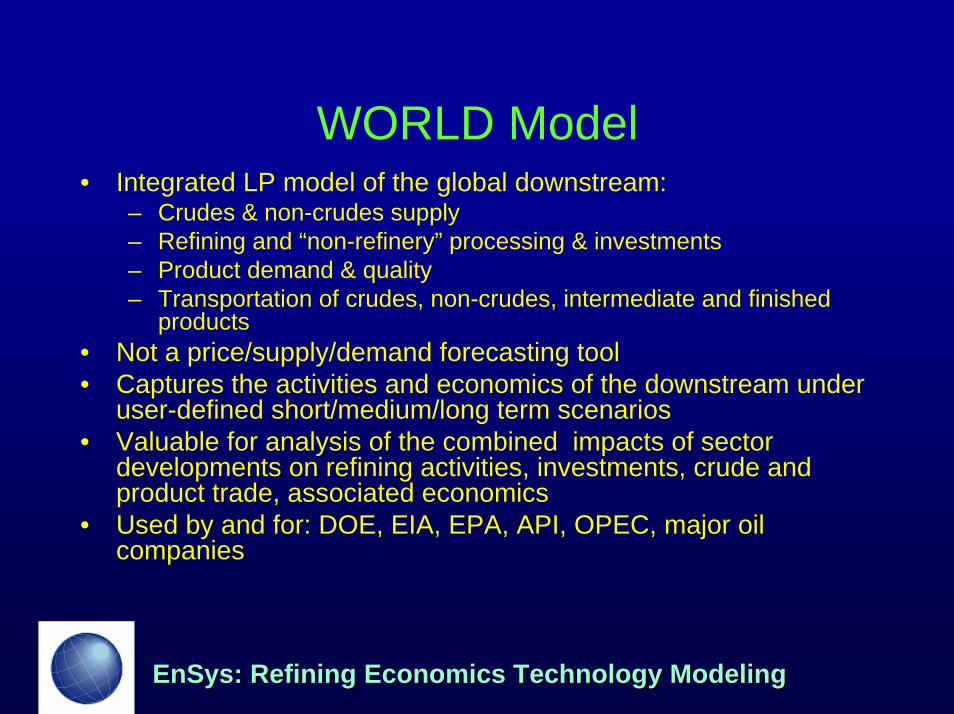
WORLD Model• Integrated LP model of the global downstream:
– Crudes & non-crudes supply– Refining and “non-refinery” processing & investments– Product demand & quality– Transportation of crudes, non-crudes, intermediate and finished
products• Not a price/supply/demand forecasting tool• Captures the activities and economics of the downstream under
user-defined short/medium/long term scenarios• Valuable for analysis of the combined impacts of sector
developments on refining activities, investments, crude and product trade, associated economics
• Used by and for: DOE, EIA, EPA, API, OPEC, major oil companies
Page 24
EnSys: Refining Economics Technology ModelingEnSys: Refining Economics Technology Modeling
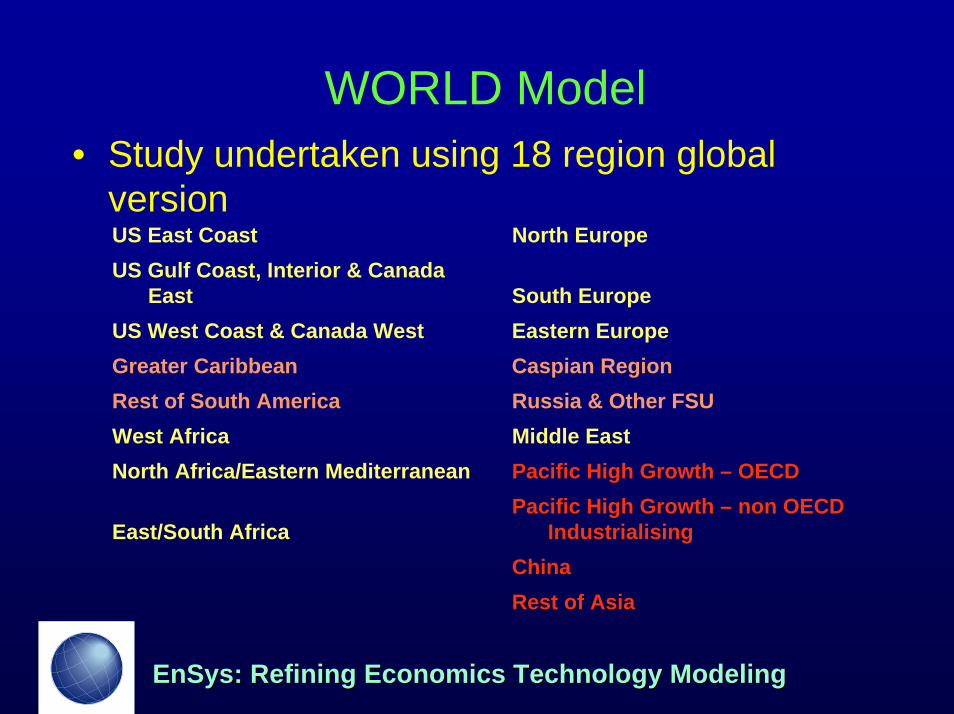
WORLD Model• Study undertaken using 18 region global
versionUS East Coast North Europe US Gulf Coast, Interior & Canada
East South Europe US West Coast & Canada West Eastern Europe Greater Caribbean Caspian RegionRest of South America Russia & Other FSUWest Africa Middle East North Africa/Eastern Mediterranean Pacific High Growth – OECD
East/South Africa Pacific High Growth – non OECD
IndustrialisingChinaRest of Asia
Page 25
EnSys: Refining Economics Technology ModelingEnSys: Refining Economics Technology Modeling
2020 WORLD Results
• US and global:– refinery throughputs, capacity additions &
investments– crudes & products market pricing /
differentials– crude & product trade flows
Page 26
EnSys: Refining Economics Technology ModelingEnSys: Refining Economics Technology Modeling
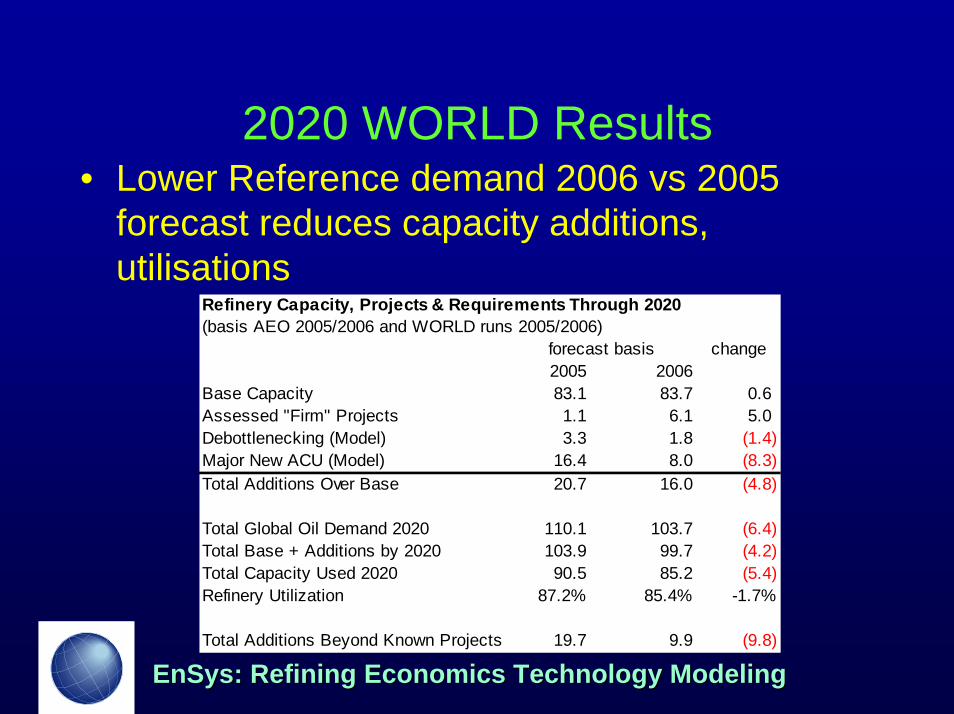
2020 WORLD Results• Lower Reference demand 2006 vs 2005
forecast reduces capacity additions, utilisations
Refinery Capacity, Projects & Requirements Through 2020(basis AEO 2005/2006 and WORLD runs 2005/2006)
change2005 2006
Base Capacity 83.1 83.7 0.6Assessed "Firm" Projects 1.1 6.1 5.0Debottlenecking (Model) 3.3 1.8 (1.4)Major New ACU (Model) 16.4 8.0 (8.3)Total Additions Over Base 20.7 16.0 (4.8)
Total Global Oil Demand 2020 110.1 103.7 (6.4)Total Base + Additions by 2020 103.9 99.7 (4.2)Total Capacity Used 2020 90.5 85.2 (5.4)Refinery Utilization 87.2% 85.4% -1.7%
Total Additions Beyond Known Projects 19.7 9.9 (9.8)
forecast basis
Page 27
EnSys: Refining Economics Technology ModelingEnSys: Refining Economics Technology Modeling
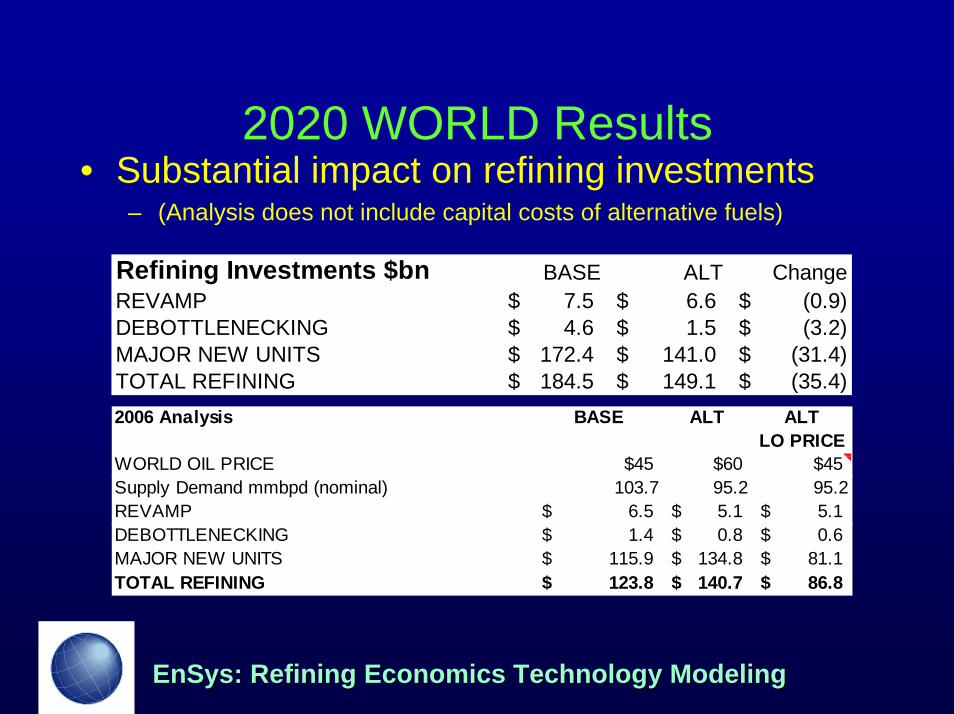
2020 WORLD Results• Substantial impact on refining investments
– (Analysis does not include capital costs of alternative fuels)
Refining Investments $bn BASE ALT ChangeREVAMP 7.5$ 6.6$ (0.9)$ DEBOTTLENECKING 4.6$ 1.5$ (3.2)$ MAJOR NEW UNITS 172.4$ 141.0$ (31.4)$ TOTAL REFINING 184.5$ 149.1$ (35.4)$ 2006 Analysis BASE ALT ALT
LO PRICEWORLD OIL PRICE $45 $60 $45Supply Demand mmbpd (nominal) 103.7 95.2 95.2REVAMP 6.5$ 5.1$ 5.1$ DEBOTTLENECKING 1.4$ 0.8$ 0.6$ MAJOR NEW UNITS 115.9$ 134.8$ 81.1$ TOTAL REFINING 123.8$ 140.7$ 86.8$
Page 28
EnSys: Refining Economics Technology ModelingEnSys: Refining Economics Technology Modeling
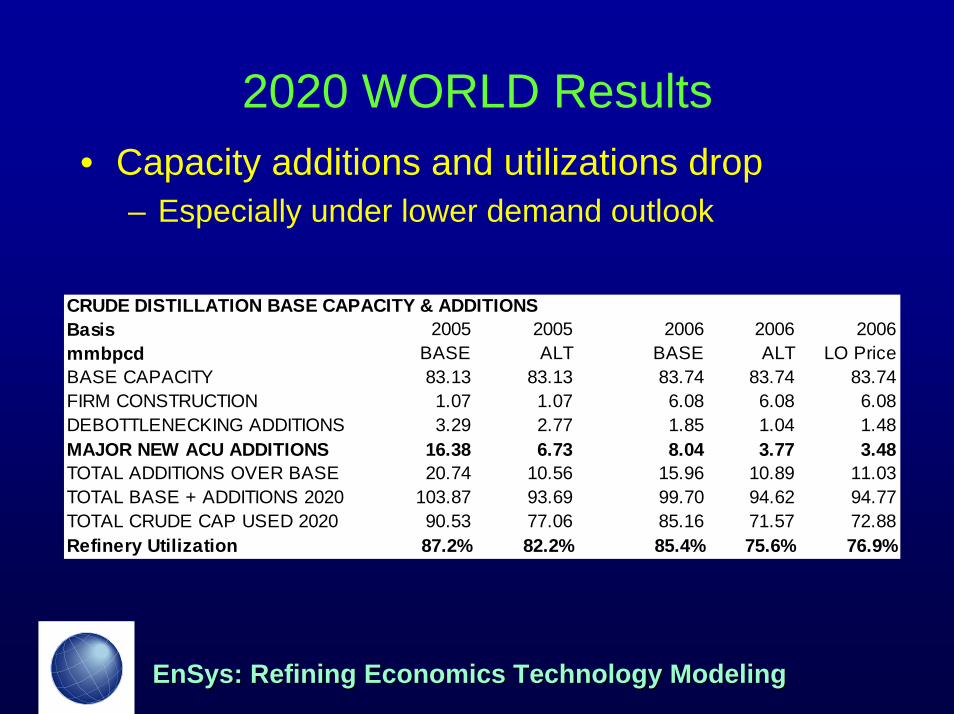
2020 WORLD Results• Capacity additions and utilizations drop
– Especially under lower demand outlook
CRUDE DISTILLATION BASE CAPACITY & ADDITIONSBasis 2005 2005 2006 2006 2006mmbpcd BASE ALT BASE ALT LO PriceBASE CAPACITY 83.13 83.13 83.74 83.74 83.74FIRM CONSTRUCTION 1.07 1.07 6.08 6.08 6.08DEBOTTLENECKING ADDITIONS 3.29 2.77 1.85 1.04 1.48MAJOR NEW ACU ADDITIONS 16.38 6.73 8.04 3.77 3.48TOTAL ADDITIONS OVER BASE 20.74 10.56 15.96 10.89 11.03TOTAL BASE + ADDITIONS 2020 103.87 93.69 99.70 94.62 94.77TOTAL CRUDE CAP USED 2020 90.53 77.06 85.16 71.57 72.88Refinery Utilization 87.2% 82.2% 85.4% 75.6% 76.9%
Page 29
EnSys: Refining Economics Technology ModelingEnSys: Refining Economics Technology Modeling
2020 WORLD Results
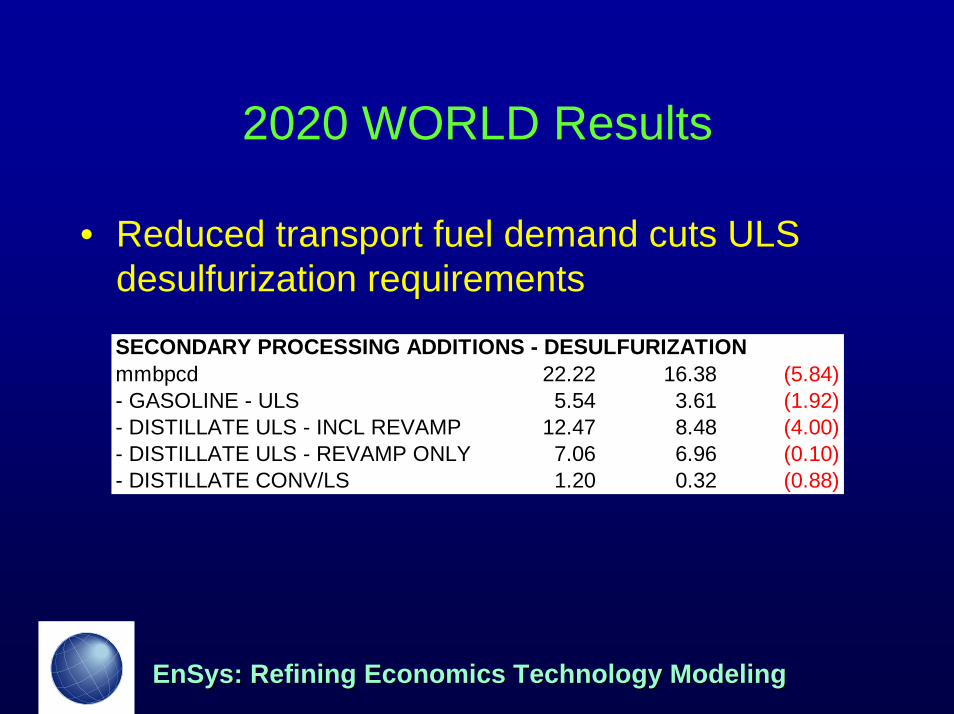
• Reduced transport fuel demand cuts ULS desulfurization requirements
SECONDARY PROCESSING ADDITIONS - DESULFURIZATIONmmbpcd 22.22 16.38 (5.84)- GASOLINE - ULS 5.54 3.61 (1.92)- DISTILLATE ULS - INCL REVAMP 12.47 8.48 (4.00)- DISTILLATE ULS - REVAMP ONLY 7.06 6.96 (0.10)- DISTILLATE CONV/LS 1.20 0.32 (0.88)
Page 30
EnSys: Refining Economics Technology ModelingEnSys: Refining Economics Technology Modeling
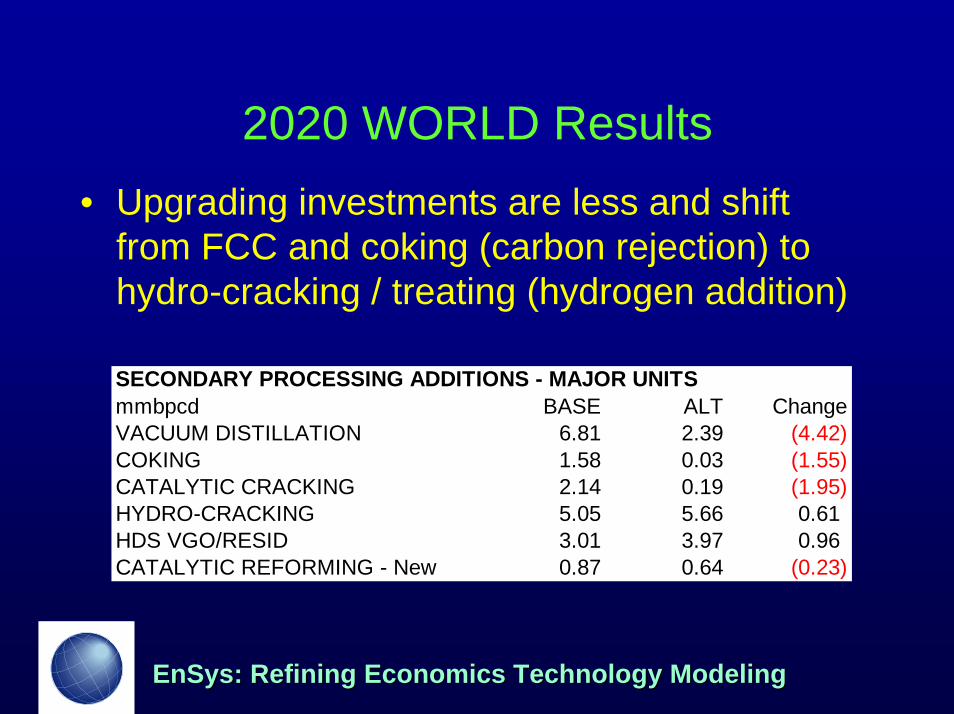
2020 WORLD Results• Upgrading investments are less and shift
from FCC and coking (carbon rejection) to hydro-cracking / treating (hydrogen addition)
SECONDARY PROCESSING ADDITIONS - MAJOR UNITSmmbpcd BASE ALT ChangeVACUUM DISTILLATION 6.81 2.39 (4.42)COKING 1.58 0.03 (1.55)CATALYTIC CRACKING 2.14 0.19 (1.95)HYDRO-CRACKING 5.05 5.66 0.61HDS VGO/RESID 3.01 3.97 0.96CATALYTIC REFORMING - New 0.87 0.64 (0.23)
Page 31
EnSys: Refining Economics Technology ModelingEnSys: Refining Economics Technology Modeling
2020 WORLD Results
• Effect of world oil price level• higher absolute oil price leads refiners to shift
away from carbon rejection:– Raw material is worth more so use less– Approx 35 wt% of coker yield is coke worth only ~
$1/bbl– (natural gas at $6-8/MMBTU in ALT case)– (fact WORLD is volume based may affect results)
Page 32
EnSys: Refining Economics Technology ModelingEnSys: Refining Economics Technology Modeling
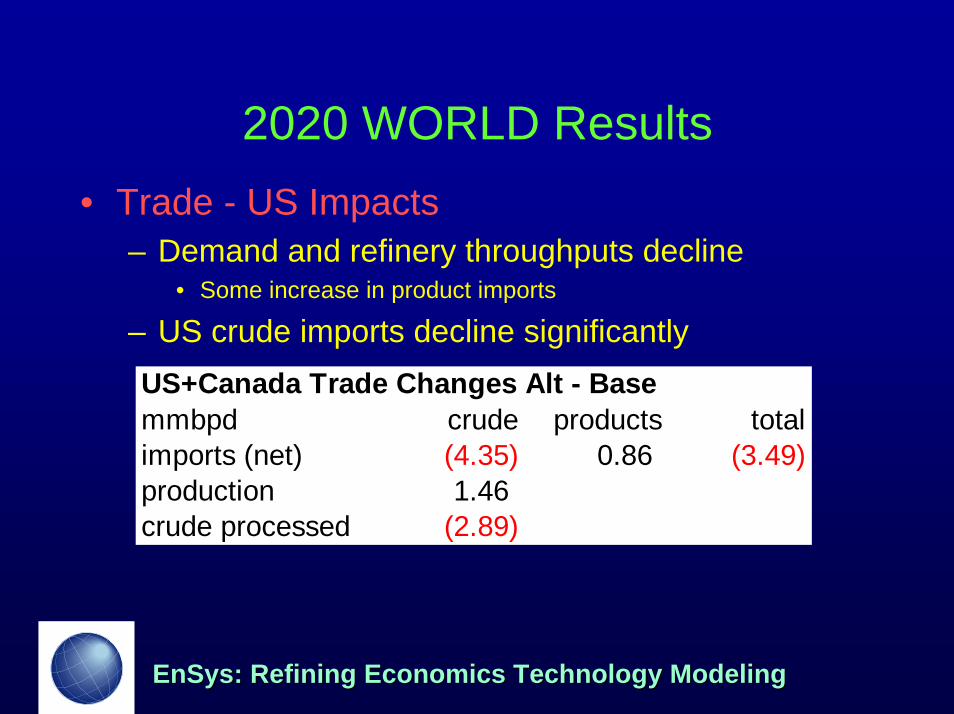
2020 WORLD Results• Trade - US Impacts
– Demand and refinery throughputs decline• Some increase in product imports
– US crude imports decline significantlyUS+Canada Trade Changes Alt - Basemmbpd crude products totalimports (net) (4.35) 0.86 (3.49)production 1.46crude processed (2.89)
Page 33
EnSys: Refining Economics Technology ModelingEnSys: Refining Economics Technology Modeling
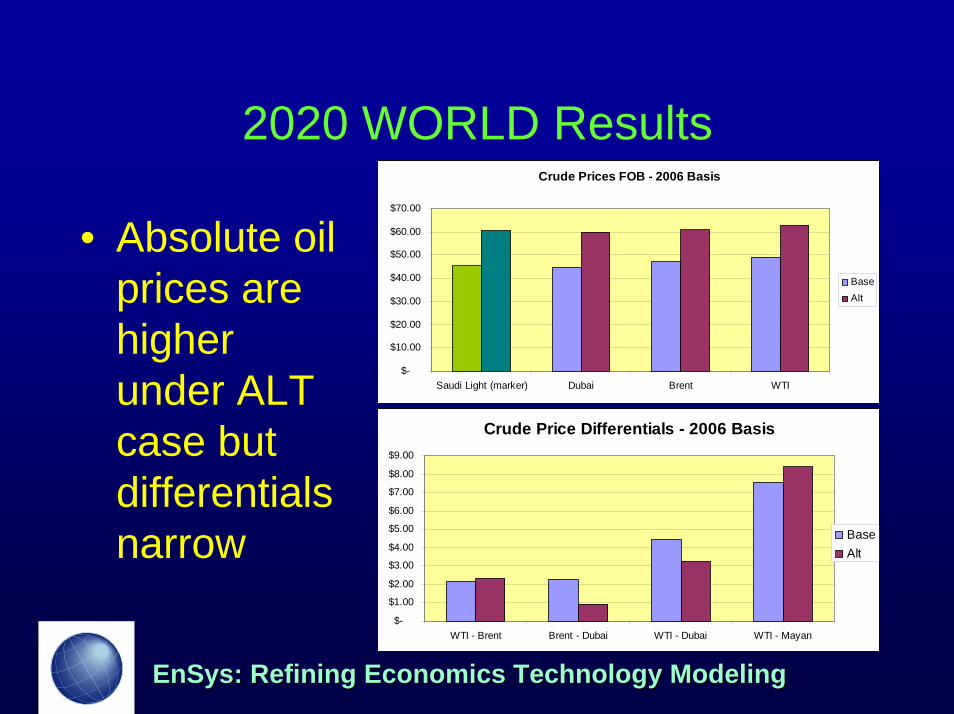
2020 WORLD ResultsCrude Prices FOB - 2006 Basis
$-
$10.00
$20.00
$30.00
$40.00
$50.00
$60.00
$70.00
Saudi Light (marker) Dubai Brent WTI
BaseAlt
• Absolute oil prices are higher under ALT case but differentials narrow
Crude Price Differentials - 2006 Basis
$-
$1.00
$2.00
$3.00
$4.00
$5.00
$6.00
$7.00
$8.00
$9.00
WTI - Brent Brent - Dubai WTI - Dubai WTI - Mayan
BaseAlt
Page 34
EnSys: Refining Economics Technology ModelingEnSys: Refining Economics Technology Modeling
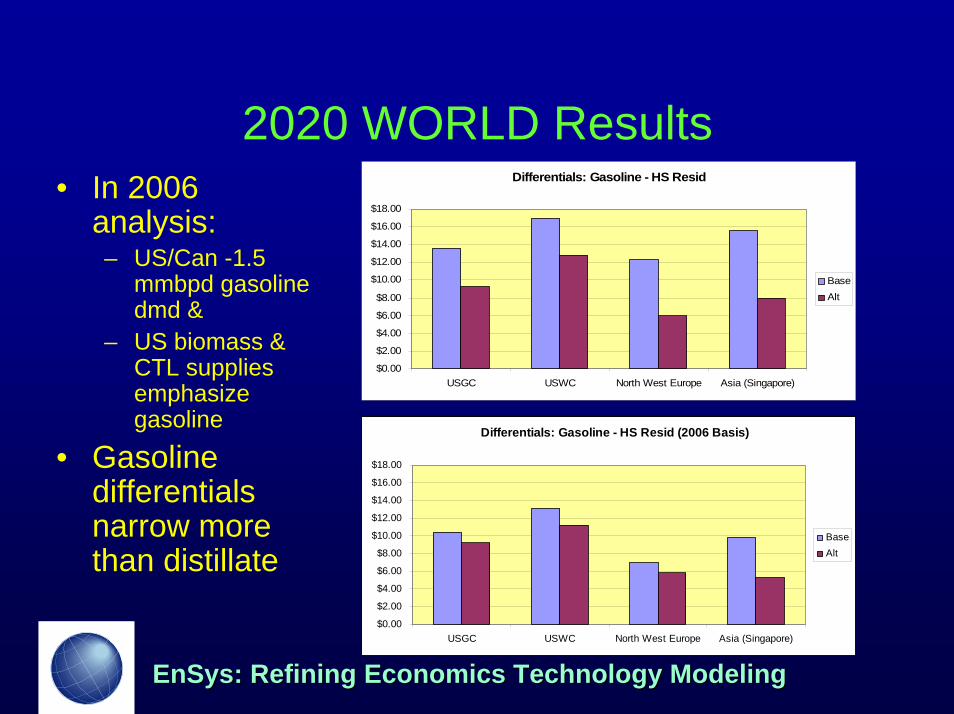
2020 WORLD ResultsDifferentials: Gasoline - HS Resid
$0.00
$2.00
$4.00
$6.00
$8.00
$10.00
$12.00
$14.00
$16.00
$18.00
USGC USWC North West Europe Asia (Singapore)
BaseAlt
• In 2006 analysis:– US/Can -1.5
mmbpd gasoline dmd &
– US biomass & CTL supplies emphasize gasoline
• Gasoline differentials narrow more than distillate
Differentials: Gasoline - HS Resid (2006 Basis)
$0.00
$2.00
$4.00
$6.00
$8.00
$10.00
$12.00
$14.00
$16.00
$18.00
USGC USWC North West Europe Asia (Singapore)
BaseAlt
Page 35
EnSys: Refining Economics Technology ModelingEnSys: Refining Economics Technology Modeling
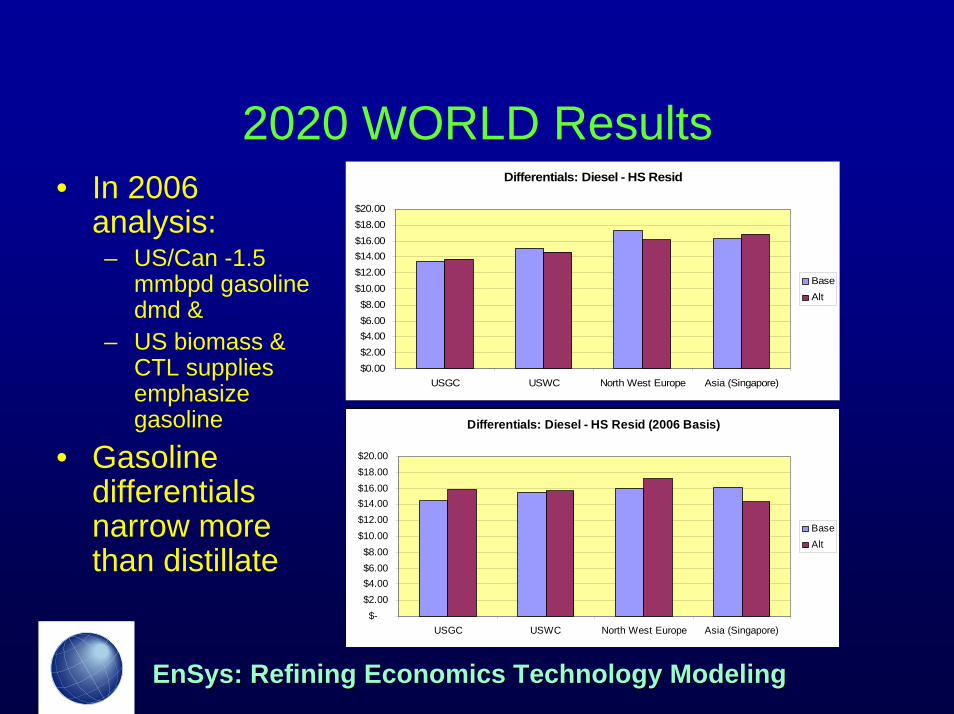
2020 WORLD ResultsDifferentials: Diesel - HS Resid
$0.00$2.00$4.00$6.00$8.00
$10.00$12.00$14.00$16.00$18.00$20.00
USGC USWC North West Europe Asia (Singapore)
BaseAlt
• In 2006 analysis:– US/Can -1.5
mmbpd gasoline dmd &
– US biomass & CTL supplies emphasize gasoline
• Gasoline differentials narrow more than distillate
Differentials: Diesel - HS Resid (2006 Basis)
$-$2.00$4.00$6.00$8.00
$10.00$12.00$14.00$16.00$18.00$20.00
USGC USWC North West Europe Asia (Singapore)
BaseAlt
Page 36
EnSys: Refining Economics Technology ModelingEnSys: Refining Economics Technology Modeling
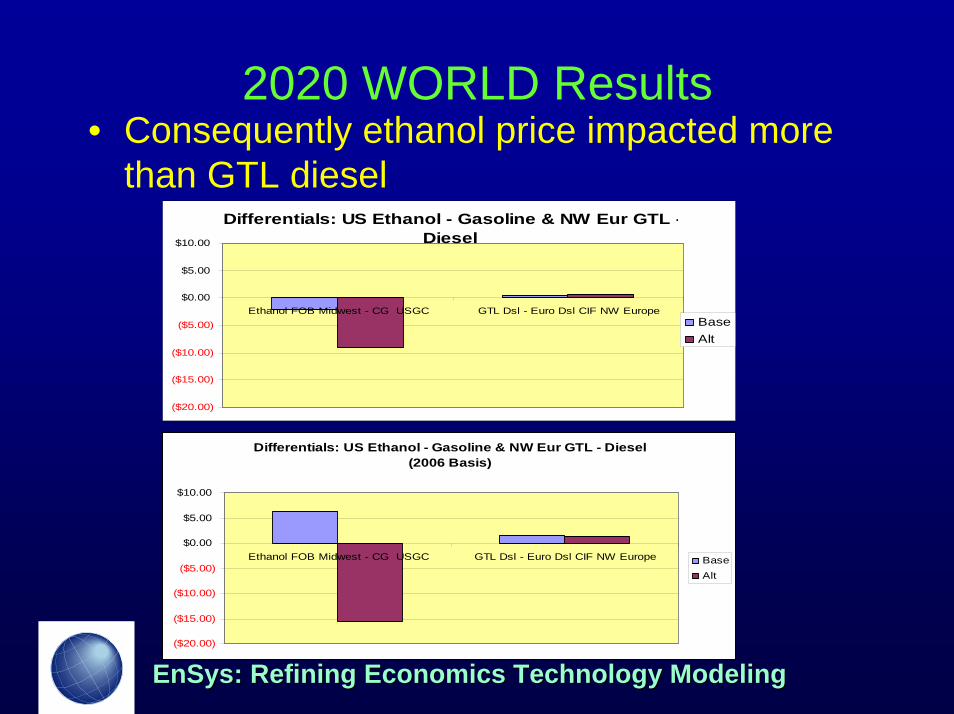
2020 WORLD Results• Consequently ethanol price impacted more
than GTL diesel
Differentials: US Ethanol - Gasoline & NW Eur GTL - Diesel (2006 Basis)
($20.00)
($15.00)
($10.00)
($5.00)
$0.00
$5.00
$10.00
Ethanol FOB Midwest - CG USGC GTL Dsl - Euro Dsl CIF NW Europe BaseAlt
Differentials: US Ethanol - Gasoline & NW Eur GTL -Diesel
($20.00)
($15.00)
($10.00)
($5.00)
$0.00
$5.00
$10.00
Ethanol FOB Midwest - CG USGC GTL Dsl - Euro Dsl CIF NW EuropeBaseAlt
Page 37
EnSys: Refining Economics Technology ModelingEnSys: Refining Economics Technology Modeling
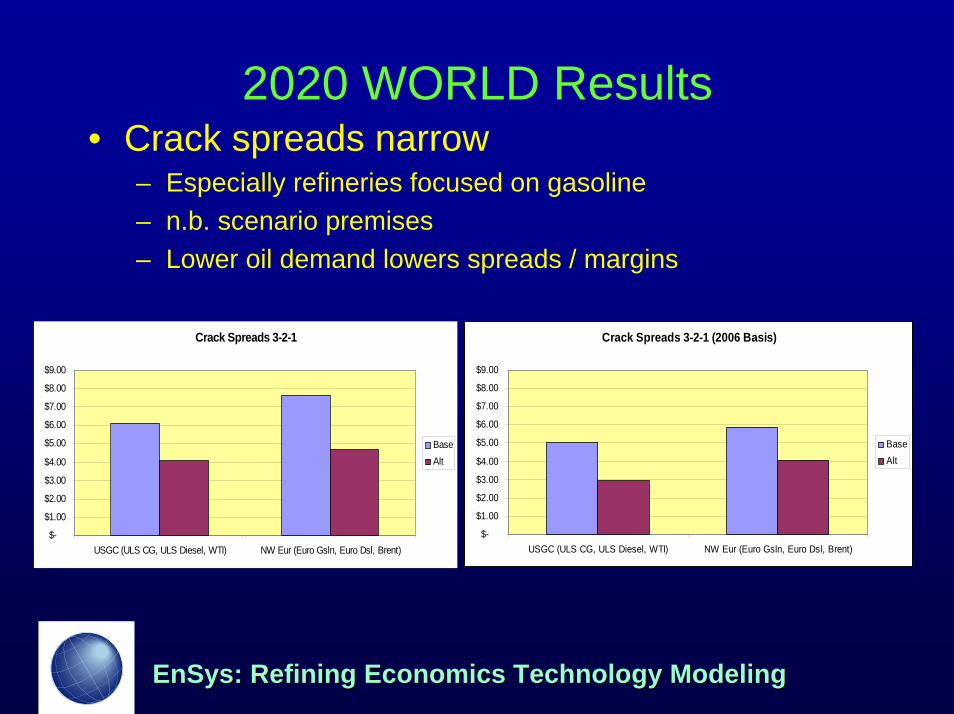
2020 WORLD Results• Crack spreads narrow
– Especially refineries focused on gasoline– n.b. scenario premises– Lower oil demand lowers spreads / margins
Crack Spreads 3-2-1
$-
$1.00
$2.00
$3.00
$4.00
$5.00
$6.00
$7.00
$8.00
$9.00
USGC (ULS CG, ULS Diesel, WTI) NW Eur (Euro Gsln, Euro Dsl, Brent)
BaseAlt
Crack Spreads 3-2-1 (2006 Basis)
$-
$1.00
$2.00
$3.00
$4.00
$5.00
$6.00
$7.00
$8.00
$9.00
USGC (ULS CG, ULS Diesel, WTI) NW Eur (Euro Gsln, Euro Dsl, Brent)
BaseAlt
Page 38
EnSys: Refining Economics Technology ModelingEnSys: Refining Economics Technology Modeling
Marine Bunker Fuels
• Last bastion of limited regulation• Emissions now significant vs other
transport fuels• Prospect for ongoing regulation• EnSys team work indicates bunkers
demand understated
Page 39
EnSys: Refining Economics Technology ModelingEnSys: Refining Economics Technology Modeling
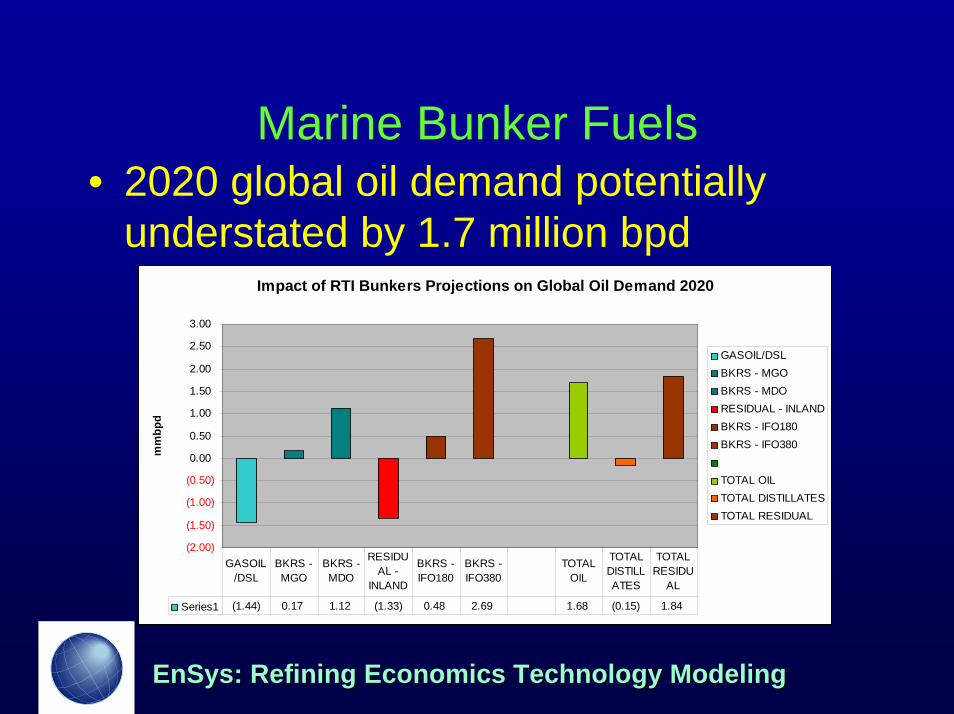
Marine Bunker Fuels• 2020 global oil demand potentially
understated by 1.7 million bpdImpact of RTI Bunkers Projections on Global Oil Demand 2020
(2.00)
(1.50)
(1.00)
(0.50)
0.00
0.50
1.00
1.50
2.00
2.50
3.00
mm
bpd
GASOIL/DSLBKRS - MGOBKRS - MDORESIDUAL - INLANDBKRS - IFO180BKRS - IFO380
TOTAL OIL TOTAL DISTILLATESTOTAL RESIDUAL
Series1 (1.44) 0.17 1.12 (1.33) 0.48 2.69 1.68 (0.15) 1.84
GASOIL/DSL
BKRS - MGO
BKRS - MDO
RESIDUAL -
INLAND
BKRS - IFO180
BKRS - IFO380
TOTAL OIL
TOTAL DISTILLATES
TOTAL RESIDU
AL
Page 40
EnSys: Refining Economics Technology ModelingEnSys: Refining Economics Technology Modeling
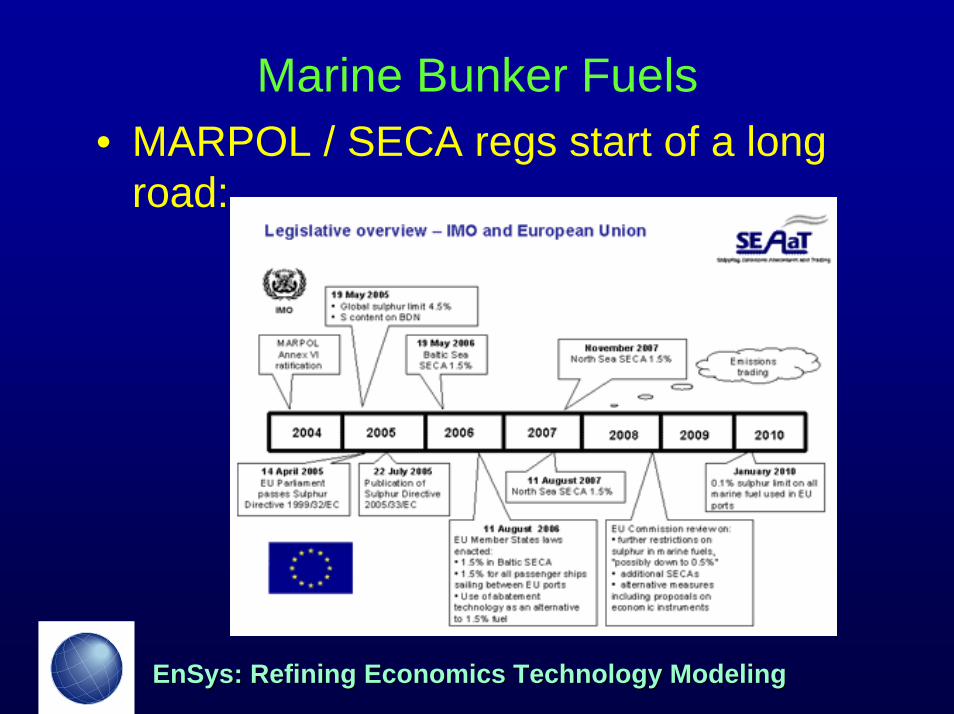
Marine Bunker Fuels• MARPOL / SECA regs start of a long
road:
Page 41
EnSys: Refining Economics Technology ModelingEnSys: Refining Economics Technology Modeling
Marine Bunker Fuels
• Regs are SOx, NOx, (PM)• Issues of compliance methods/mix:
– Fuel HDS – On-board scrubbing– Emissions trading
• Major potential implications for resid HDS requirements
Page 42
EnSys: Refining Economics Technology ModelingEnSys: Refining Economics Technology Modeling
Implications• Market Impacts
– Alternative plus non-conventional fuels impacts (plus conservation) may be “at the margin”
– But bulk of alternative streams are light, clean, take pressure off upgrading plus quality improvement
– Combined impact on global downstream is far reaching
Page 43
EnSys: Refining Economics Technology ModelingEnSys: Refining Economics Technology Modeling
Implications• Supply/Demand Policy
– Fuel shifts need to be monitored– Careful thought given to gasoline / diesel supply /
demand balance when considering alternative / non-conventional fuels supply options:
• Biomass: ethanol vs biodiesel• CTL: high temp process for gasoline products vs low
temp for diesel • Continuing shift to diesel demand (Europe, Asia, US??)
Page 44
EnSys: Refining Economics Technology ModelingEnSys: Refining Economics Technology Modeling
Implications
• Technology– This study assumed improving economics
of alternative fuels (ethanol, CTL etc.) – But fairly static refinery processing
technologies• Established and commercializing technologies• Graded declines in costs
– No radical shifts??
Page 45
EnSys: Refining Economics Technology ModelingEnSys: Refining Economics Technology Modeling
Implications• Hydrogen / hydrogen processes
– Base outlook is H2 consumption in refineries more than doubles by 2020
• 6% p.a. growth rate• 0.57 mmbfoed 2006 to 1.3 mmbfoed 2020
– Alt fuels and global oil demand level have significant impact
– Marine bunkers demand and regulation potential for significant demand
– Thrust is toward H addition & syngas processes:• Hydro-cracking, HDS, CTL etc.
Page 46
EnSys: Refining Economics Technology ModelingEnSys: Refining Economics Technology Modeling
Implications
• Refining / crude / hydrogen– We are in an era when the range of
potential demand is exceptional– And the range of supply options &
technologies– Today is the hey day for refining? –
slackening in 2010-2020?– Interesting times!