50
© 2015 IHS Global Outlook ihs.com IHS The Global Economic Outlook: The “Great Divergence” Nariman Behravesh, Chief Economist, +1 781 301 9101, [email protected] March 2015 ECONOMICS

© 2015 IHS
Global Outlook
ihs.com
IHS
The Global Economic Outlook:
The “Great Divergence”
Nariman Behravesh, Chief Economist, +1 781 301 9101, [email protected]
March 2015
ECONOMICS

© 2015 IHS
The “Great Divergence” and “Back to the Future”
• US growth is accelerating even as growth in other parts of
the world remains weak or decelerates further.
• US consumers are back to being the engines of global
growth.
• US oil production is higher than Saudi Arabia’s.
• The plunge in oil prices is creating winners and losers.
• The world’s central banks are moving in different directions.
• The dollar is rising, while most other currencies are falling.
• Back to the Future: This is very reminiscent of the 1980s
and 1990s.
Global Outlook/ March 2015

© 2015 IHS
Global Overview
• The momentum of the global economy will improve in 2015.
• Global growth accelerated marginally from 2.5% in 2012 to 2.7% in
2014 …
• … Most of that was thanks to the developed economies.
• Better prospects in 2015 will be the result of solid and improving growth
in the US and a slight pickup in the pace of Eurozone and Japanese
economic activity.
• The plunge in oil prices will add 0.4 to 0.6 percentage point to global
growth over the coming year.
• More stimulus by the Bank of Japan, People’s Bank of China and the
European Central bank will also support growth.
• China’s growth will slow further.
• For other large emerging markets, it will be a good news (India), bad
news (Brazil and Russia) story.
Global Outlook/ March 2015

© 2015 IHS
-4
-2
0
2
4
6
8
10
1990 1993 1996 1999 2002 2005 2008 2011 2014 2017 2020
Perc
en
t ch
an
ge
World Advanced countries Emerging markets
Global Outlook/ March 2015
The emerging markets growth premium is the
lowest since the early 2000s
Real GDP

© 2015 IHS
-6
-4
-2
0
2
4
6
1998 2000 2002 2004 2006 2008 2010 2012 2014 2016 2018 2020
Perc
en
t ch
an
ge
United States Eurozone Japan
Global Outlook/ March 2015
Real GDP growth in the United States,
Eurozone and Japan
Real GDP

© 2015 IHS
-12
-8
-4
0
4
8
12
16
1975 1980 1985 1990 1995 2000 2005 2010 2015 2020
Perc
en
t ch
an
ge
Real exports Real GDP
Global Outlook/ March 2015
Growth in world trade volume is gradually picking up
Real GDP and trade

© 2015 IHS
15
20
25
30
35
1980 1985 1990 1995 2000 2005 2010 2015 2020 2025
Perc
en
t o
f w
orl
d G
DP
Global Outlook/ March 2015
After exceptional gains in 1994-2008, the pace of
globalization has slowed
World imports’ share of GDP

© 2015 IHS
Oil and other commodity prices have tumbled in
response to structural excess supply
• Rising production and weak demand growth have left the global oil
market oversupplied, driving down prices.
• In keeping its output target of 30 million barrels per day, OPEC is letting
markets decide the clearing price for oil.
• Since demand is price-inelastic in the short run, market equilibration will
occur mainly through supply adjustments.
• A mismatch between fundamentals and financial market expectations
caused a price rally in February.
• Price volatility will likely remain high.
• As oil production growth slows in the second half of 2015, prices will
begin to recover.
• Other commodity prices have fallen mostly because of weak demand
from and excess capacity in China.
Global Outlook/ March 2015

© 2015 IHS
Global Outlook/ March 2015
Global crude oil price dynamics
Downside
risks
• Sluggish demand growth, especially
from China
• Increasing North American production
• Rising production in Iraq and Libya
• Fight for market share by producers
• Potential rise in Iranian oil exports
Upside
risks
• Accelerating global demand, partly in
response to lower prices
• Heightened geopolitical tensions and
potential supply disruptions (Iraq, Libya,
Nigeria, Venezuela and elsewhere)
• Rising development costs

© 2015 IHS
Global Outlook/ March 2015
US crude oil prices: A big drop – but for how long?
Crude oil and natural gas prices
0
2
4
6
8
10
12
14
0
20
40
60
80
100
120
140
2000 2002 2004 2006 2008 2010 2012 2014 2016 2018 2020
Do
lla
rs/m
illi
on
Btu
Do
lla
rs/b
arr
el
Crude oil, WTI (Left scale) Natural gas, Henry Hub (Right scale)
Source: IHS Energy

© 2015 IHS
Winners and losers from low oil prices
• Winners:
• US consumers are the biggest winners
• European consumers benefit proportionally less because of high gasoline taxes
• Emerging-market consumers will also benefit less because of large fuel subsidies
• Energy-intensive industries, such as agriculture and transportation
• Governments in oil-importing countries with large fuel subsidies
• Losers:
• Oil producers, especially those with high costs
• Major oil exporters, especially those at a ―fiscal break-even point‖ above US$100 per
barrel such as Iran, Russia, Venezuela, Ecuador and Angola
• Net effect:
• In the United States and worldwide, the net effect on consumers and producers is
positive, boosting real GDP growth by roughly 0.5 percentage point in 2015.
• A US$60 drop in oil prices represents a transfer of about US$2 trillion from oil
exporters to oil importers — the latter have a higher marginal propensity to spend
than the former.
Global Outlook/ March 2015

© 2015 IHS
Global Outlook/ March 2015
Industrial materials prices are also falling
Industrial materials prices
0
1
2
3
4
5
6
2002 2004 2006 2008 2010 2012 2014
IHS
weekly
in
dexes,
2002:1
=1
All industrial materials Chemicals Nonferrous metals

© 2015 IHS
US growth will be solid, in the 2.5 to 3.0% range
• The US is doing better than most because the principal driver of growth is
domestic demand.
• Prospects for consumer spending (roughly 70% of GDP) look bright, thanks to
strong jobs growth, improved household finances and lower gasoline prices.
• Arguably, US consumers are the biggest beneficiaries of the ―Great
Divergence.‖
• Even though income distribution and poor wage growth are issues, consumers
are in a good mood.
• Capital spending will also contribute to growth, despite the expected drop in
energy investment because of weak oil prices.
• Net exports will be a potential drag, because of feeble growth overseas and a
strengthening dollar.
• Ironically, weakness in other parts of the world benefits the US by lowering oil
prices and keeping interest rates low.
Global Outlook/ March 2015

© 2015 IHS
Global Outlook/ March 2015
US real GDP growth and the unemployment rate
Real GDP and unemployment
4.0
5.2
6.4
7.6
8.8
10.0
-9
-6
-3
0
3
6
2006 2008 2010 2012 2014 2016
Perc
en
t
An
nu
al
perc
en
t ch
an
ge
Real GDP growth (Left scale) Unemployment rate (Right scale)

© 2015 IHS
Looking forward, US consumer spending will
continue to drive the bulk of economic growth
2.3 2.2 2.4
3.0 2.7 2.8
-1
0
1
2
3
4
2012 2013 2014 2015 2016 2017
Real GDP Consumer spending Fixed investment Housing
Inventories Exports Imports Government
An
nu
ali
zed
perc
en
tag
e c
han
ge
Global Outlook/ March 2015
Contribution to real GDP growth

© 2015 IHS
The drop in gasoline prices means substantial near-term
savings for US households
16
Retail gasoline price and annualized spending on motor fuels
1.0
1.5
2.0
2.5
3.0
3.5
4.0
1.0
1.5
2.0
2.5
3.0
3.5
4.0
2000 2002 2004 2006 2008 2010 2012 2014 2016 2018 2020
Th
ou
san
d d
ollars
/ho
useh
old
Do
llars
/gallo
n
Retail gasoline price Spending on motor fuels per household (Right scale)
Global Outlook/ March 2015

© 2015 IHS
Rising US household net worth encourages
consumption and discourages saving
Household saving rate and net worth
4.5
5.0
5.5
6.0
6.5
7.0
0
3
6
9
12
15
1980 1985 1990 1995 2000 2005 2010 2015 2020
Ra
tio
Pe
rce
nt
of
dis
po
sa
ble
in
co
me
Saving rate (Left scale) Household net worth/disposable income (Right scale)
Global Outlook/ March 2015

© 2015 IHS
US business fixed investment growth is led by
equipment
Real business fixed investment
-30
-20
-10
0
10
20
30
2000 2002 2004 2006 2008 2010 2012 2014 2016 2018
Year-
over-
year
perc
en
t ch
an
ge
Equipment Structures Intellectual products
Global Outlook/ March 2015

© 2015 IHS
0
2
4
6
8
10
12
14
16
18
Info Equip/ GDP IP+SW/GDP * Other Equip/GDP Structures / GDP
In real terms, the share of US capex in knowledge will
accelerate, but not in nominal terms.
0
2
4
6
8
10
12
14
16
18
Real spending (% of GDP) Nominal spending (% of GDP)
* = Intellectual Property + Software
Global Outlook/ March 2015

© 2015 IHS
Contributions from unconventional energy sources will
continue to add to US GDP
Global Outlook/ March 2015
0
50
100
150
200
250
300
350
1996 2001 2006 2011 2016 20210
20
40
60
80
100
120
140
160
180
1996 2001 2006 2011 2016 2021
US imports of petroleum products
(billions of 2009 dollars)
US mining and petroleum structures
(billions of 2009 dollars)

© 2015 IHS
Is the US labor market getting tight enough to
drive wage pressures?
3
4
5
6
7
8
9
10
11
-200
-100
0
100
200
300
400
500
600
2010 2011 2012 2013 2014 2015
Un
em
plo
ym
en
t ra
te (
%)
Nu
mb
er
of
new
jo
bs (
000
s)
Employment growth Unemployment rate
Global Outlook/ March 2015
Job creation and the unemployment rate

© 2015 IHS
-3%
-2%
-1%
0%
1%
2%
3%
4%
5%
2011 2012 2013 2014 2015 2016 2017 2018
Pe
rce
nt
ch
an
ge
., y
/y
All goods and services Excluding food and energy
Here’s what the Fed is watching to identify inflation
Global Outlook/ March 2015
Personal consumption price deflators
This doesn’t count
as deflation
Fed 2% threshold

© 2015 IHS
The European recovery will pick up some steam, and UK
growth will remain robust
• The good news is that the Eurozone was able to eke out positive (albeit
low) growth in 2014, after two years of recession.
• Growth will be better in 2015 thanks to lower oil prices, a weak euro,
reduced fiscal headwinds and accommodative monetary policy.
• Low inflation and (very) gradually improving labor market conditions will
support consumer spending. This is especially true for Germany and
Northern European economies.
• Stronger export growth (thanks to a weaker euro) and growing pent-up
demand boost capital spending.
• As a result, there will likely be an acceleration of Eurozone growth in
2015 to 1.5% (from 0.8% in 2014).
• Meanwhile (much like the US), UK growth will be solid (2.5 to 3.0%).
Global Outlook/ March 2015

© 2015 IHS
-6
-4
-2
0
2
4
6
1990 1993 1996 1999 2002 2005 2008 2011 2014 2017 2020
Perc
en
t ch
an
ge
Global Outlook/ March 2015
The Eurozone economy will slowly recover
Real GDP

© 2015 IHS
Global Outlook/ March 2015
Real GDP growth in Europe’s major economies
-6
-4
-2
0
2
4
6
2006 2007 2008 2009 2010 2011 2012 2013 2014 2015 2016 2017
Perc
en
t ch
an
ge
Germany UK France Italy Spain
Real GDP

© 2015 IHS
2
4
6
8
10
12
14
2005 2007 2009 2011 2013 2015 2017
Perc
en
t o
f la
bo
r fo
rce
France Germany Italy United Kingdom
Global Outlook/ March 2015
European unemployment rates have diverged
Unemployment rate

© 2015 IHS
Japan’s economy will regain weak growth momentum
• In 2014 Japan suffered through its fourth recession in six years.
• The latest downturn can be blamed on the April sales tax hike, which
hurt consumer spending and investment more than expected.
• This has been especially tough for Japanese households, whose
inflation-adjusted wages have fallen about 5% over the past year.
• In response to worsening economic picture, the government of Shinzo
Abe has postponed the next sales tax hike from October 2015 to April
2017; it will likely also provide some temporary stimulus in 2015.
• The Bank of Japan has also embarked on a new round of aggressive
quantitative easing.
• These growth-supportive policies helped growth turn positive in the
fourth quarter of 2014, but for 2015 growth will only be around 1%.
Global Outlook/ March 2015

© 2015 IHS
-7.5
-5.0
-2.5
0.0
2.5
5.0
7.5
1986 1990 1994 1998 2002 2006 2010 2014 2018
Perc
en
t ch
an
ge
Global Outlook/ March 2015
Japan’s economy has limited growth potential
Real GDP

© 2015 IHS
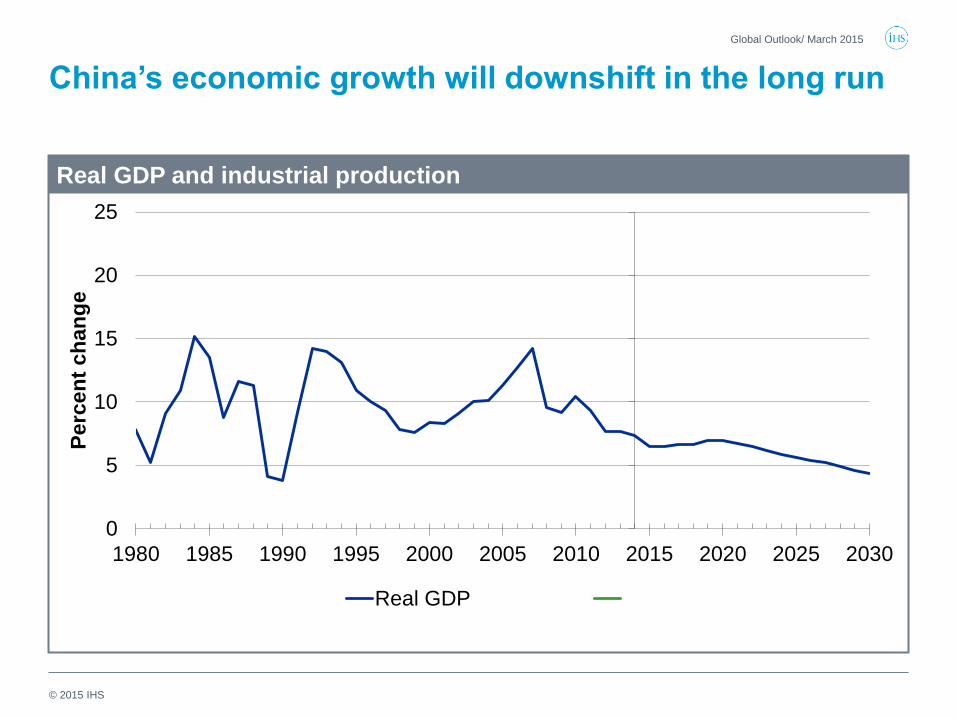
China’s growth rate will decelerate more
• The recent wobbles in the Chinese economy are due mostly to weak
domestic demand (because of the real estate bust).
• Government stimulus has been modest and temporary, resulting in
equally brief upticks in growth.
• The government is trying to balance concerns about weak jobs growth
and social unrest with its desire to tackle the glut of debt and industrial
overcapacity in the Chinese economy.
• In November, the People’s Bank of China cut interest rates for the first
time since 2012; it will likely cut rates again.
• Bottom line: limited support from fiscal and monetary policy will not be
enough to prevent growth from weakening further, from 7.4% in 2014 to
around 6.5% in 2015 through 2017.
• Will the vast (and growing) excess industrial capacity in China continue
to drag down prices in key commodity markets (e.g. steel and
chemicals)
Global Outlook/ March 2015
© 2015 IHS
0
5
10
15
20
25
1980 1985 1990 1995 2000 2005 2010 2015 2020 2025 2030
Perc
en
t ch
an
ge
Real GDP
Global Outlook/ March 2015
China’s economic growth will downshift in the long run
Real GDP and industrial production

© 2015 IHS
0
3
6
9
12
15
18
02 03 04 05 06 07 08 09 10 11 12 13 14*
Tri
llio
n C
NY
Bank loans (LCU and FX) Other financing Entrusted loans
Bank acceptance bills Trust loans
Global Outlook/ March 2015
China’s lending has stabilized at a high level
Source: People’s Bank of China
Lending flows
* IHS forecast

© 2015 IHS
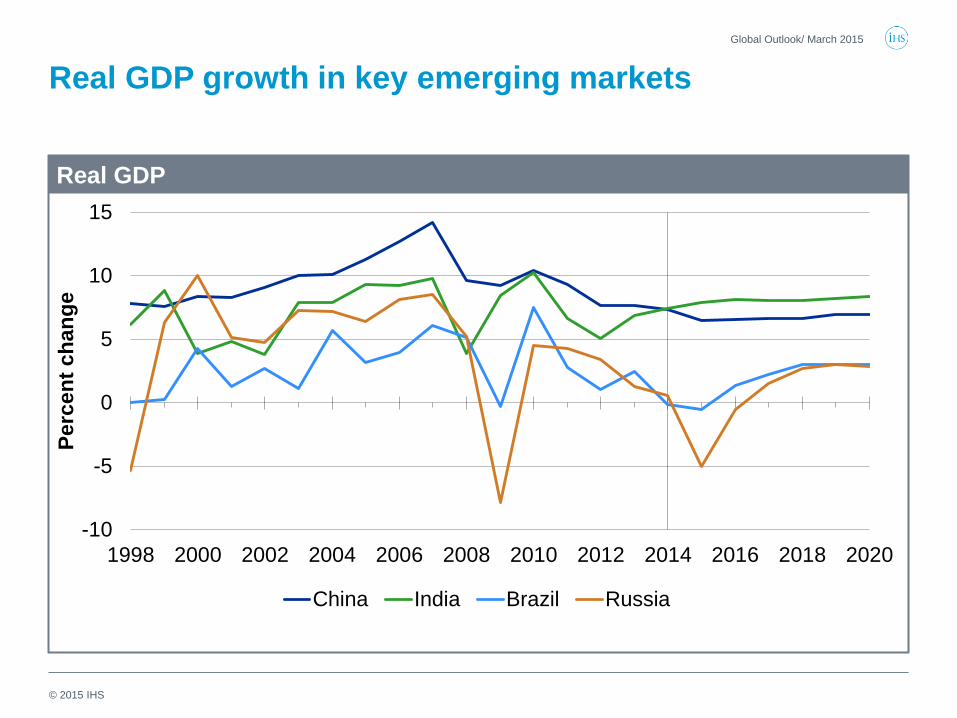
Other large emerging markets:
A good news-bad news story
• Brazil suffered a mild recession in 2014, and 2015 growth is likely to
decline again (by around -0.5%).
• Russia avoided recession in 2014 but will see its economy contract by
around 5% in 2015, because of the triple whammy of sanctions,
plunging oil prices and capital flight.
• Good news: many other emerging markets are likely to see better
growth in 2015 than in 2014, thanks to lower oil prices, a boost in global
liquidity and stronger growth in the US and Europe.
• India’s prospects look particularly promising, and growth could be
stronger than in China, for the next few years.
• Growth is likely to remain strong in Asia and Africa.
• Some countries will do especially well, including Indonesia, Malaysia,
the Philippines, Poland, Peru, Egypt, Kenya and Ethiopia.
Global Outlook/ March 2015

© 2015 IHS
Global Outlook/ March 2015
Why has growth in emerging markets slowed?
Cyclical forces
• Withdrawal of policy stimulus
• Excess capacity after investment booms
• Sluggish export markets
• Increased risk aversion
Structural forces
• Slower labor force growth
• Slower pace of globalization
• Falling commodity prices
• Lack of market reforms
© 2015 IHS
-10
-5
0
5
10
15
1998 2000 2002 2004 2006 2008 2010 2012 2014 2016 2018 2020
Perc
en
t ch
an
ge
China India Brazil Russia
Global Outlook/ March 2015
Real GDP growth in key emerging markets
Real GDP

© 2015 IHS
-1
0
1
2
3
4
5
6
7
NAFTA OtherAmericas
WesternEurope
EmergingEurope
Mideast-N. Africa
Sub-Saharan
Africa
Japan OtherAsia-
Pacific
An
nu
al
perc
en
t ch
an
ge
2013 2014 2015 2016 2017-21
Global Outlook/ March 2015
Asia-Pacific (excluding Japan) and Sub-Saharan Africa
will achieve the fastest growth in real GDP
Real GDP

© 2015 IHS
Inflation will remain a distant threat, while deflationary
worries persist
• With commodity prices low and falling, and global growth anemic, the
risk of inflation rising much above current levels is low.
• The exceptions are emerging markets where sharp drops in exchange
rates will lead to spikes in inflation (e.g. Russia).
• Disinflationary forces are the strongest in the developed world.
• Headline US inflation could briefly go negative, but core consumer
price inflation is likely to remain in the 1 to 2% range.
• Low oil prices will exacerbate deflationary pressures in the Eurozone –
headline CPI inflation was already down to -0.5% in January – but a
lower euro will exert in some upward pressure.
• Inflation in other parts of the world, already fairly low, will probably ease
further because of declining energy and food prices.
Global Outlook/ March 2015

© 2015 IHS
-3
-2
-1
0
1
2
3
4
5
6
2005 2006 2007 2008 2009 2010 2011 2012 2013 2014 2015
% c
han
ge f
rom
a y
ear
earl
ier
United States United Kingdom Eurozone Japan
Global Outlook/ March 2015
Consumer price inflation is subsiding in the advanced
economies
Consumer price index

© 2015 IHS
-2
0
2
4
6
8
10
12
14
NAFTA OtherAmericas
WesternEurope
EmergingEurope
Mideast-N. Africa
Sub-Saharan
Africa
Japan OtherAsia-
Pacific
An
nu
al
perc
en
t ch
an
ge
2013 2014 2015 2016 2017-21
Global Outlook/ March 2015
Consumer price inflation varies by region,
but is not a threat
Consumer price inflation

© 2015 IHS
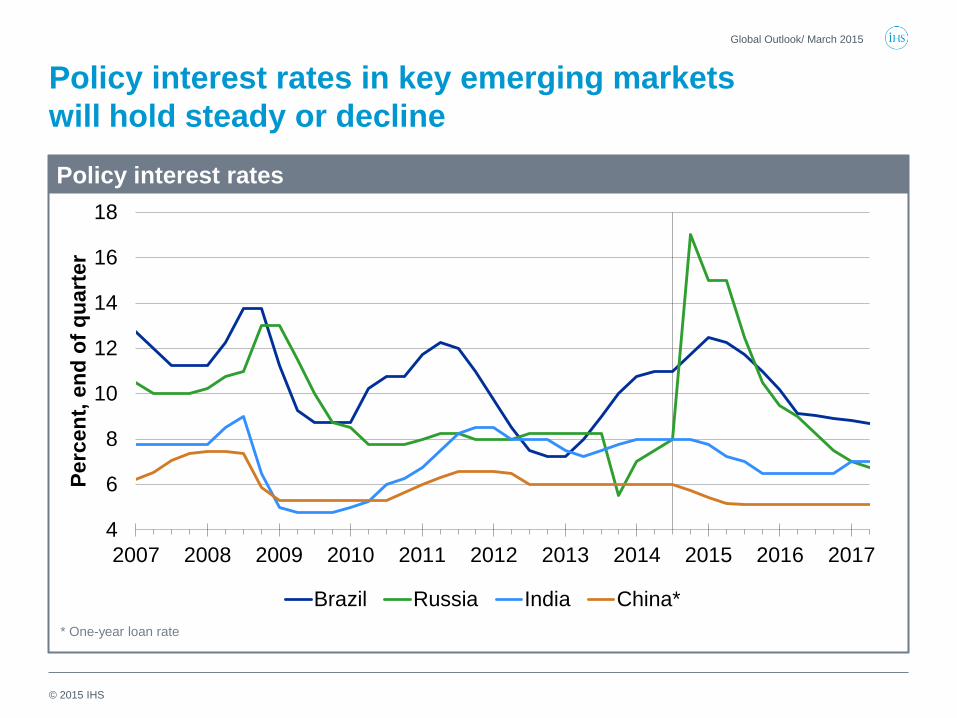
The Fed will likely start raising interest rates, while most
other central banks will be on hold or provide more
stimulus
• Divergent growth prospects mean central banks will go their separate
ways in 2015.
• The Fed is expected to raise rates this year – although weaker inflation
(because of falling oil prices) could delay rate hikes.
• In contrast, the European Central Bank, Bank of Japan and People’s
Bank of China will lower rates (if they can) and/or boost liquidity.
• So far the actions of the BoJ have been the most aggressive, while
those of the ECB and PBoC have been more limited – but more is in
the pipeline.
• In the emerging world, many central banks have already started to
lower rates, or will soon – even those that raised them recently (e.g.
Brazil and Russia).
Global Outlook/ March 2015

© 2015 IHS
0
1
2
3
4
5
6
2007 2008 2009 2010 2011 2012 2013 2014 2015 2016 2017
Perc
en
t, e
nd
of
qu
art
er
United States Eurozone Japan United Kingdom
Global Outlook/ March 2015
The Fed will likely lead the upturn
in policy interest rates
Policy interest rates
© 2015 IHS
4
6
8
10
12
14
16
18
2007 2008 2009 2010 2011 2012 2013 2014 2015 2016 2017
Perc
en
t, e
nd
of
qu
art
er
Brazil Russia India China*
Global Outlook/ March 2015
Policy interest rates in key emerging markets
will hold steady or decline
* One-year loan rate
Policy interest rates

© 2015 IHS
The US dollar will rise against most currencies, while
the euro and yen will fall
• With strong US growth and expectations that the Fed will raise rates
sooner than most, the dollar strengthened in 2014 and will rise further
in 2015.
• Weaker growth in the Eurozone and Japan, as well as expectations of
more stimulus from their central banks, means the euro and yen will fall
further from current levels.
• Much like the US dollar, the British pound will see some upward
pressure.
• Falling oil prices will exert downward pressure on the Canadian dollar.
• Emerging market currencies are likely to continue to slide against the
dollar – the currencies of oil-exporting countries will come under
intense downward pressure, as the Russian rouble already has.
Global Outlook/ March 2015

© 2015 IHS
Global Outlook/ March 2015
The dollar: rising, but still competitive
Real trade-weighted dollar index
0.6
0.8
1.0
1.2
1.4
1.6
1980 1984 1988 1992 1996 2000 2004 2008 2012 2016 2020
Ind
ex,
2009 =
1.0
Major trading partners Other important trading partners

© 2015 IHS
Global Outlook/ March 2015
Exchange rates per US dollar
Quarterly averages
Canadian dollar
Japanese yen
Euro
Chinese renminbi
0.6
0.8
1.0
1.2
1.4
1.6
1.8
1998 2001 2004 2007 2010 2013 20160.5
0.6
0.7
0.8
0.9
1.0
1.1
1.2
1998 2001 2004 2007 2010 2013 2016
4
5
6
7
8
9
1998 2001 2004 2007 2010 2013 2016
60
80
100
120
140
1998 2001 2004 2007 2010 2013 2016

© 2015 IHS
Global Outlook/ March 2015
Many emerging-market currencies have depreciated
and are vulnerable
40
50
60
70
80
90
100
110
Jan-13 May-13 Sep-13 Jan-14 May-14 Sep-14 Jan-15
US
D/lo
cal
cu
rren
cy,
2013:1
=10
0
China India Brazil Russia South Africa
Weekly exchange rate index

© 2015 IHS
-8 -6 -4 -2 0 2 4
China
Russia
Poland
Mexico
India
Indonesia
Brazil
Turkey
South Africa
Current-account balance Fiscal balance
Global Outlook/ March 2015
Vulnerable countries depend on external financing:
Current-account and fiscal balances
Percent of GDP, 2014
External financing

© 2015 IHS
Perennial downside risks will be balanced by some
upside risks
• In the past few years, the global economy has been plagued by a
number of ―curses.‖
• One of the worst has been the deleveraging necessary to reduce high
debt levels, which has resulted in feeble spending by households and
businesses, government austerity and banks’ unwillingness to lend.
• The good news is that this hindrance to growth is easing in many
countries, especially the UK and US.
• Moreover, while geopolitical risks remain high, the impact on oil
markets has – so far – been nonexistent, thanks to rising US oil
production.
• Other potential risks include a relapse in Europe and a hard landing in
China.
Global Outlook/ March 2015

© 2015 IHS
Global Outlook/ March 2015
Risks to the global economy
Risk Signposts
China hard landing • Loan defaults by developers and local governments trigger
a banking crisis and a credit squeeze.
• The property market downturn affects consumer spending.
• The government responds with only limited fiscal stimulus.
Eurozone setback
• Banking problems intensify, reducing credit availability.
• Growth stalls and deflation sets in.
• High unemployment leads to social unrest.
Energy supply shocks • Conflicts in the Middle East and Africa lead to disruptions
in oil production and transportation.
• Oil prices rebound.
• The Russia-Ukraine conflict cuts gas supplies to Europe.
US recovery stalls
• Businesses and households spend more cautiously.
• Recoveries in housing and automotive markets relapse.

© 2015 IHS
Summary
• Lower oil prices, monetary stimulus in Europe and Asia, and solid US
growth will provide the foundations for a pickup in the global economy.
• The US expansion is led by domestic demand, as consumer spending
and residential construction accelerate.
• The Eurozone will gradually recover; contagion from the ongoing Greek
situation will be limited.
• Emerging markets will not regain the peak growth rates of the 2000s.
• The Asia-Pacific region will make the strongest contribution to global
economic growth, although China’s locomotive role is diminishing.
• Risks abound: wars in the Middle East, the Russia-Ukraine conflict,
China’s rising debt and central bank ―exit strategies.‖
Global Outlook/ March 2015

IHS Customer Care:
• Americas: +1 800 IHS CARE (+1 800 447 2273); [email protected]
• Europe, Middle East, and Africa: +44 (0) 1344 328 300; [email protected]
• Asia and the Pacific Rim: +604 291 3600; [email protected]
© 2014 IHS. No portion of this report may be reproduced, reused, or otherwise distributed in any form without prior written consent, with the exception of any internal client distribution as may be permitted in the license agreement between client and IHS.
Content reproduced or redistributed with IHS permission must display IHS legal notices and attributions of authorship. The information contained herein is from sources considered reliable but its accuracy and completeness are not warranted, nor are the
opinions and analyses which are based upon it, and to the extent permitted by law, IHS shall not be liable for any errors or omissions or any loss, damage or expense incurred by reliance on information or any statement contained herein. For more
information, please contact IHS at Customer Care (see phone numbers and email addresses above). All products, company names or other marks appearing in this publication are the trademarks and property of IHS or their respective owners.


