Page 1
© Euromonitor International Ltd 2015. All rights reserved. The material contained in this document is the exclusive property of Euromonitor International Ltd and its licensors and is
provided without any warranties or representations about accuracy or completeness. Any reliance on such material is made at users’ own risk. This document is confidential and for
internal use by Packaging Machinery Manufacturers Institute (PMMI) and its affiliates only. Publication or making available to any third party of all or part of the material contained in this
document (or any data or other material derived from it) without Euromonitor’s express written consent is strictly prohibited. Please refer to the applicable terms and conditions with
Euromonitor.
GLOBAL PACKAGING LANDSCAPE: GROWTH, TRENDS & INNOVATIONS
A custom report compiled by Euromonitor International
for the Packaging Machinery Manufacturers Institute (PMMI)
November 2015
Page 2
INTRODUCTION
EXECUTIVE SUMMARY
REGIONAL ANALYSIS
ASIA PACIFIC
WESTERN EUROPE
NORTH AMERICA
LATIN AMERICA
EASTERN EUROPE
CONCLUSIONS
Page 3
© Euromonitor International Ltd 2015. Applicable terms and conditions of use and the disclaimer at the front of this document apply.
3
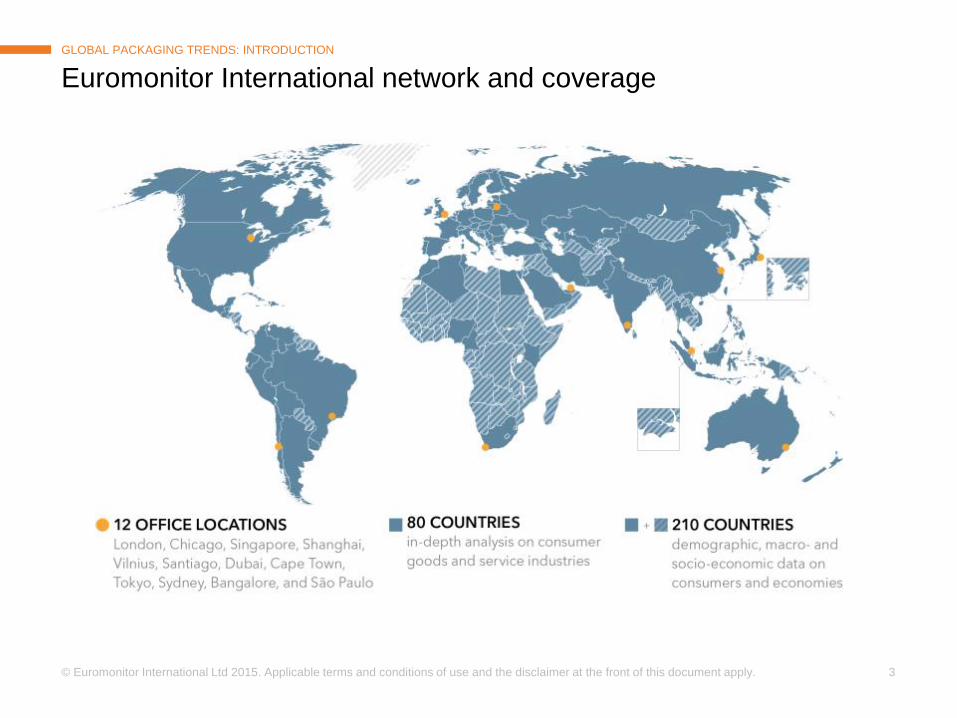
Euromonitor International network and coverage
GLOBAL PACKAGING TRENDS: INTRODUCTION
Page 4
© Euromonitor International Ltd 2015. Applicable terms and conditions of use and the disclaimer at the front of this document apply.
4
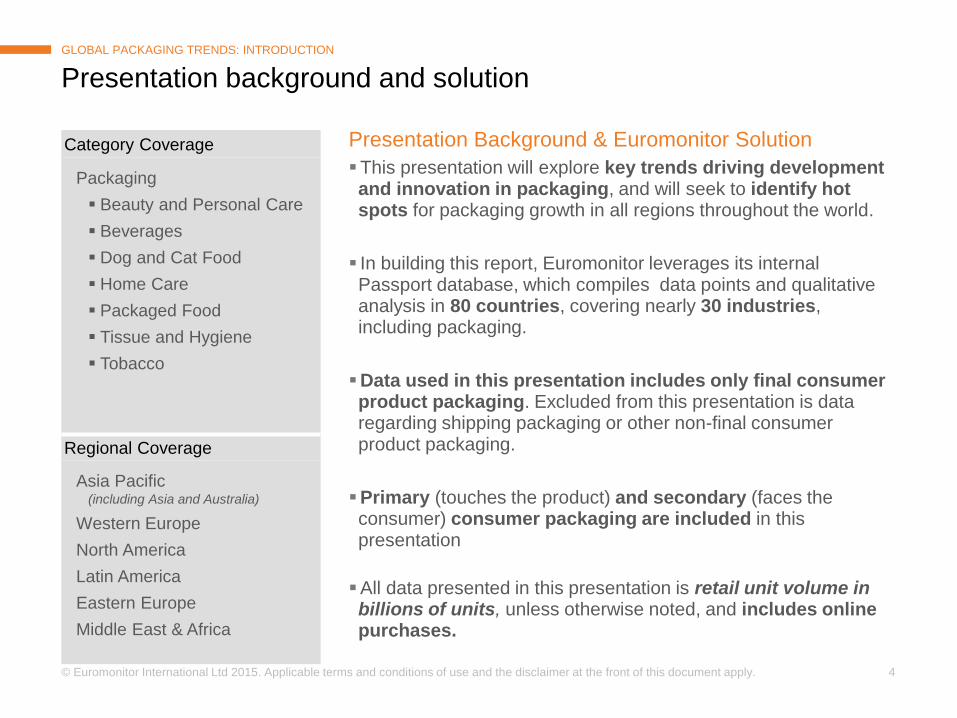
Presentation Background & Euromonitor Solution
This presentation will explore key trends driving development and innovation in packaging, and will seek to identify hot spots for packaging growth in all regions throughout the world.
In building this report, Euromonitor leverages its internal Passport database, which compiles data points and qualitative analysis in 80 countries, covering nearly 30 industries, including packaging.
Data used in this presentation includes only final consumer product packaging. Excluded from this presentation is data regarding shipping packaging or other non-final consumer product packaging.
Primary (touches the product) and secondary (faces the consumer) consumer packaging are included in this presentation
All data presented in this presentation is retail unit volume in billions of units, unless otherwise noted, and includes online purchases.
Presentation background and solution
GLOBAL PACKAGING TRENDS: INTRODUCTION
Category Coverage
Packaging
Beauty and Personal Care
Beverages
Dog and Cat Food
Home Care
Packaged Food
Tissue and Hygiene
Tobacco
Regional Coverage
Asia Pacific (including Asia and Australia)
Western Europe
North America
Latin America
Eastern Europe
Middle East & Africa
Page 5
INTRODUCTION
EXECUTIVE SUMMARY
REGIONAL ANALYSIS
ASIA PACIFIC
WESTERN EUROPE
NORTH AMERICA
LATIN AMERICA
EASTERN EUROPE
CONCLUSIONS
Page 6
© Euromonitor International Ltd 2015. Applicable terms and conditions of use and the disclaimer at the front of this document apply.
6
GLOBAL PACKAGING TRENDS: EXECUTIVE SUMMARY
Reg
ion
P
ac
k T
yp
e
Cate
go
ry
Asia Pacific is the region with the largest potential growth opportunity In terms of pack type, PET bottles show the strongest growth rates, while bottled water leads category potential
+ 186 absolute volume growth
(in billions of units, 2014-2019)
+ 487 absolute volume growth
(in billions of units, 2014-2019)
+ 63 absolute volume growth
(in billions of units, 2014-2019)
Asia Pacific is the region with the largest
packaging growth opportunity
Forecast growth rate of 4.3%
PET bottles is the pack type with the largest
packaging growth opportunity
Forecast growth rate of 4.7%
Bottled water is the category with the largest
packaging growth opportunity
Forecast growth rate of 7.8%
Page 7
© Euromonitor International Ltd 2015. Applicable terms and conditions of use and the disclaimer at the front of this document apply.
7
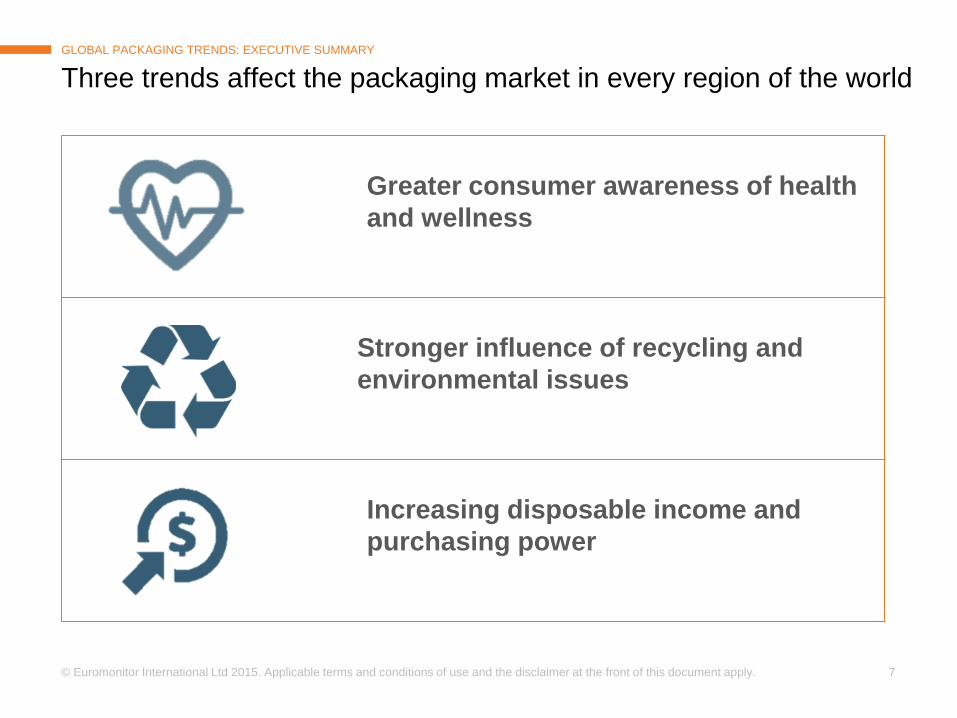
Greater consumer awareness of health
and wellness
Stronger influence of recycling and
environmental issues
Increasing disposable income and
purchasing power
GLOBAL PACKAGING TRENDS: EXECUTIVE SUMMARY
Three trends affect the packaging market in every region of the world
Page 8
© Euromonitor International Ltd 2015. Applicable terms and conditions of use and the disclaimer at the front of this document apply.
8
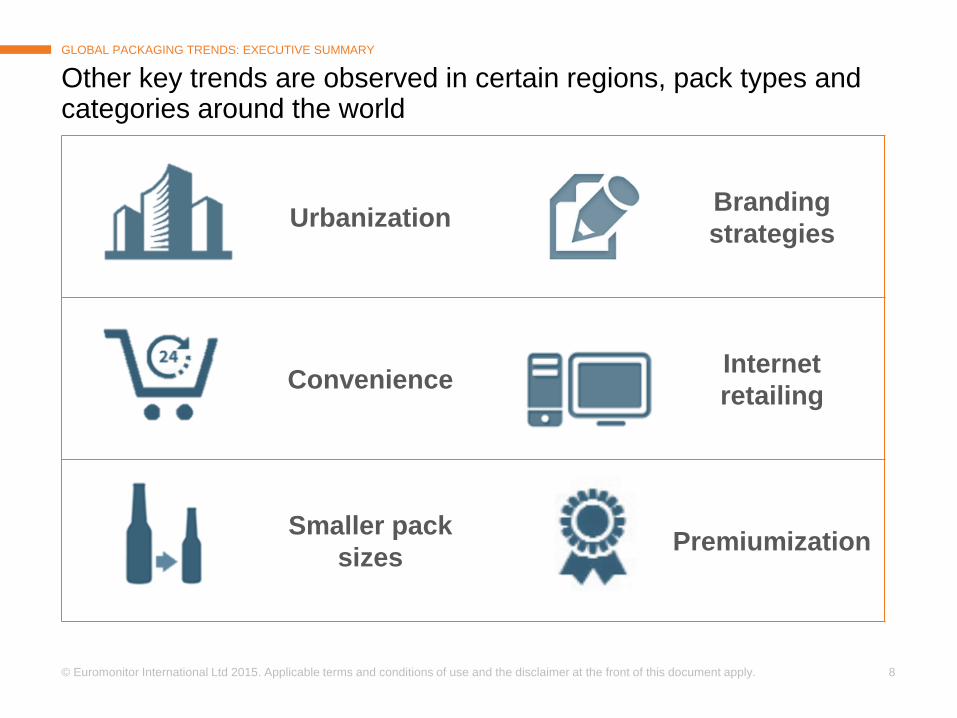
Urbanization Branding
strategies
Convenience Internet
retailing
Smaller pack
sizes Premiumization
GLOBAL PACKAGING TRENDS: EXECUTIVE SUMMARY
Other key trends are observed in certain regions, pack types and categories around the world
Page 9
© Euromonitor International Ltd 2015. Applicable terms and conditions of use and the disclaimer at the front of this document apply.
9
0 200 400 600 800 1000 1200 1400 1600
Flexible Plastic
PET Bottles
Glass Bottles
Folding Cartons
Flexible Aluminium/Paper
Metal Beverage Cans
Thin Wall Plastic Containers
Flexible Paper
Brick Liquid Cartons
HDPE Bottles
Other
Total Volume (in billions of units)
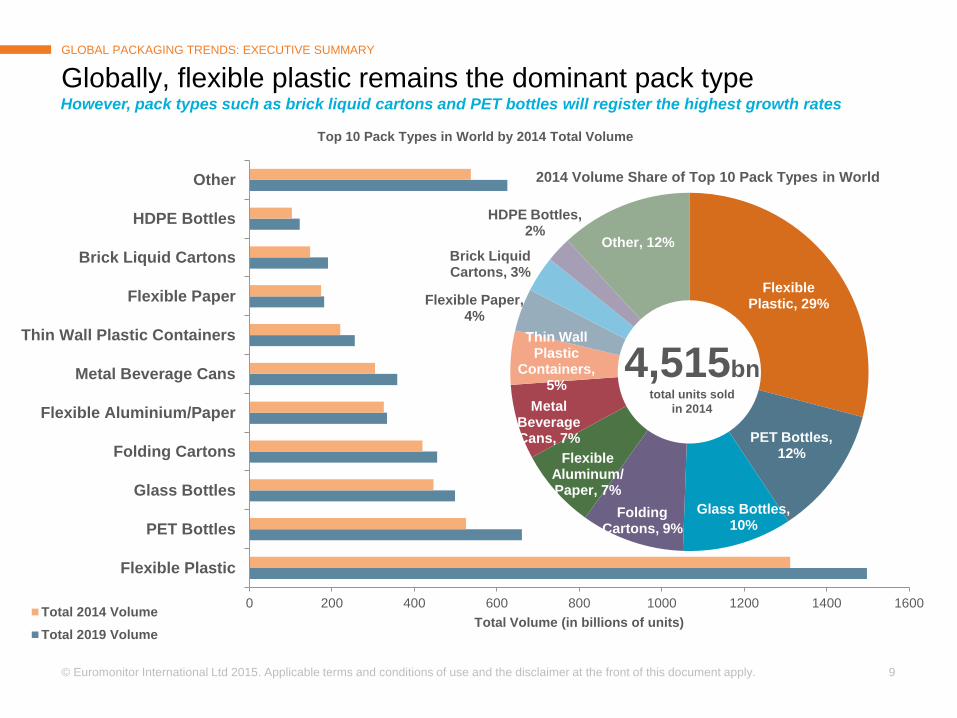
Top 10 Pack Types in World by 2014 Total Volume
Total 2014 Volume
Total 2019 Volume
Flexible Plastic, 29%
PET Bottles, 12%
Glass Bottles, 10%
Folding Cartons, 9%
Flexible Aluminum/ Paper, 7%
Metal Beverage Cans, 7%
Thin Wall Plastic
Containers, 5%
Flexible Paper, 4%
Brick Liquid Cartons, 3%
HDPE Bottles, 2%
Other, 12%
2014 Volume Share of Top 10 Pack Types in World
GLOBAL PACKAGING TRENDS: EXECUTIVE SUMMARY
However, pack types such as brick liquid cartons and PET bottles will register the highest growth rates
Globally, flexible plastic remains the dominant pack type
4,515bn total units sold
in 2014
Page 10
© Euromonitor International Ltd 2015. Applicable terms and conditions of use and the disclaimer at the front of this document apply.
10
Cigarettes
Beer
Bottled Water
Carbonates
Drinking Milk Products
Yogurt and Sour Milk Products
Biscuits Sugar Confectionery
Juice
Baked Goods
0
10
20
30
40
50
60
70
80
90
0.0% 1.0% 2.0% 3.0% 4.0% 5.0% 6.0%
Ab
so
lute
Vo
l. G
row
th 2
014 –
2019
(in
billio
ns)
Forecast Volume CAGR 2014 - 2019
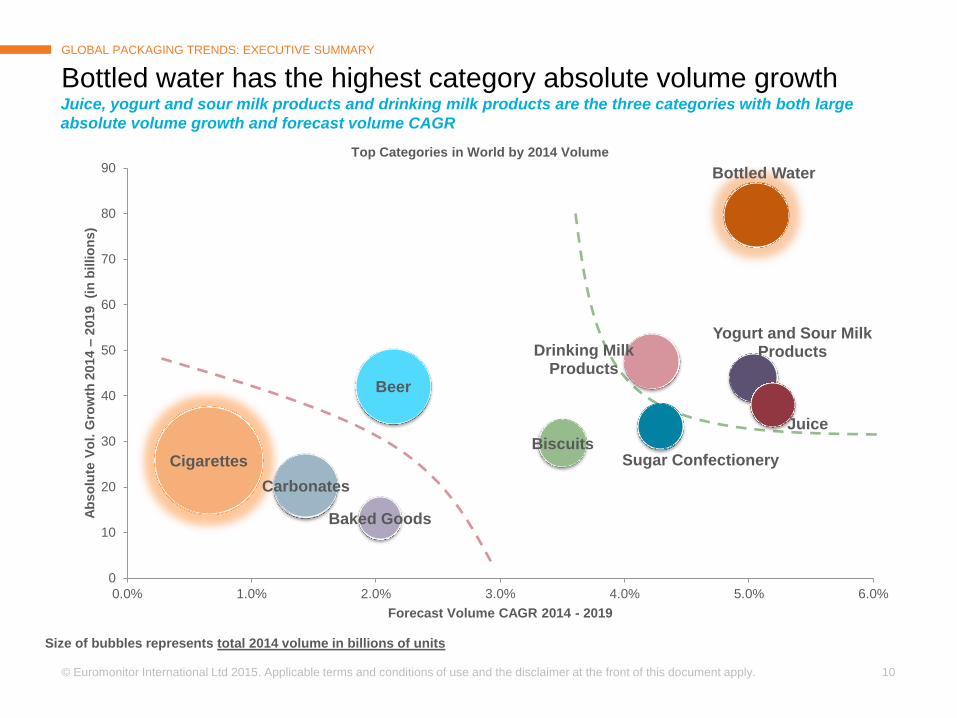
Top Categories in World by 2014 Volume
Juice, yogurt and sour milk products and drinking milk products are the three categories with both large
absolute volume growth and forecast volume CAGR
Bottled water has the highest category absolute volume growth
GLOBAL PACKAGING TRENDS: EXECUTIVE SUMMARY
Size of bubbles represents total 2014 volume in billions of units
Page 11
© Euromonitor International Ltd 2015. Applicable terms and conditions of use and the disclaimer at the front of this document apply.
11
GLOBAL PACKAGING TRENDS: EXECUTIVE SUMMARY
0.4%
2.8%
5.3%
0.5%
1.1%
4.3%
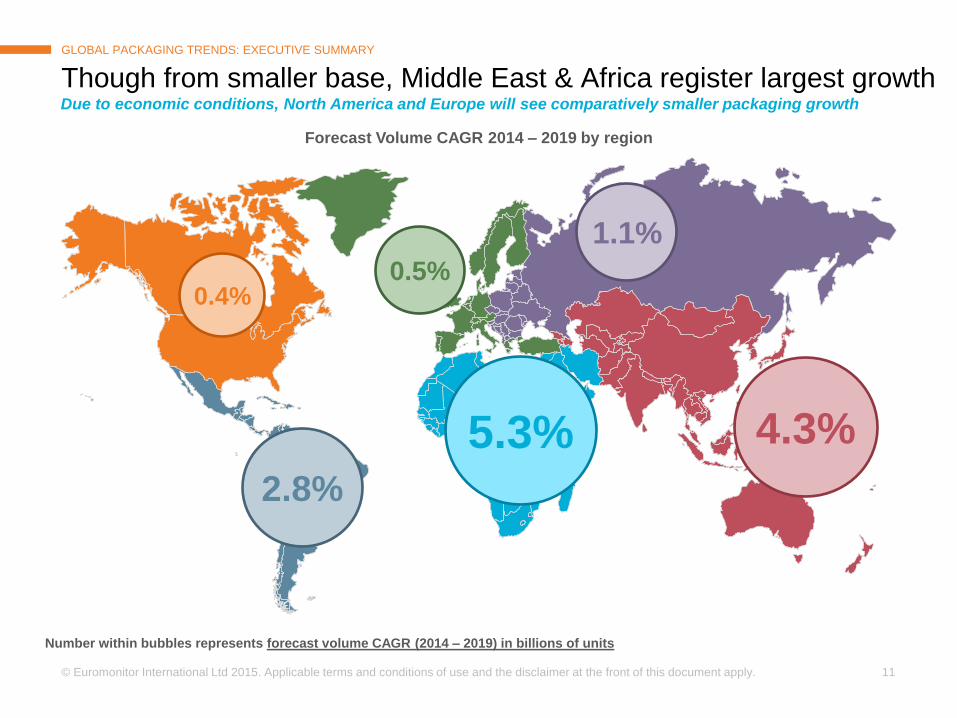
Due to economic conditions, North America and Europe will see comparatively smaller packaging growth
Though from smaller base, Middle East & Africa register largest growth
Forecast Volume CAGR 2014 – 2019 by region
Number within bubbles represents forecast volume CAGR (2014 – 2019) in billions of units
Page 12
© Euromonitor International Ltd 2015. Applicable terms and conditions of use and the disclaimer at the front of this document apply.
12
GLOBAL PACKAGING TRENDS: EXECUTIVE SUMMARY
13
74 48
21
487
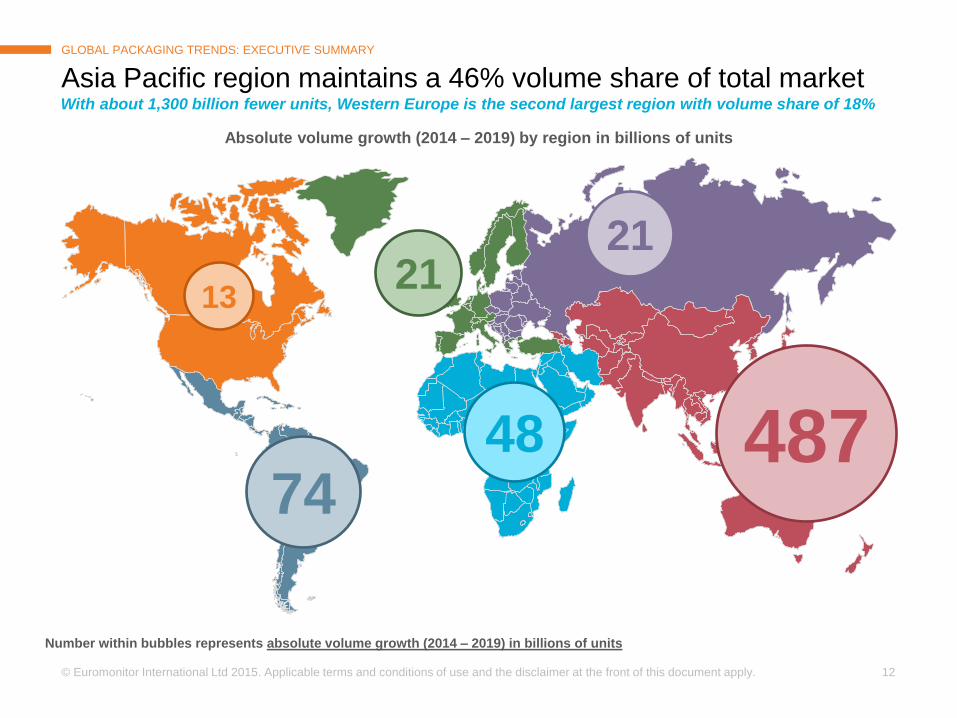
With about 1,300 billion fewer units, Western Europe is the second largest region with volume share of 18%
Asia Pacific region maintains a 46% volume share of total market
Absolute volume growth (2014 – 2019) by region in billions of units
Number within bubbles represents absolute volume growth (2014 – 2019) in billions of units
21
Page 13
© Euromonitor International Ltd 2015. Applicable terms and conditions of use and the disclaimer at the front of this document apply.
13
GLOBAL PACKAGING TRENDS: EXECUTIVE SUMMARY
Asia Pacific will account for 70% of global absolute volume growth in bottled water from 2014 - 2019
Bottled water will see the largest unit growth in three regions
Top Categories of Absolute Volume Growth by Region
+ 55.6
billion units
+ 5.2
billion units
+ 6.2
billion units
+ 11.6
billion units
+ 3.1
billion units
+ 5.8
billion units
Bottled
Water
Bottled
Water
Bottled
Water
Beer
Beer
Carbonates
Latin America Eastern Europe Middle East & Africa
Asia Pacific Western Europe North America
Page 14
INTRODUCTION
EXECUTIVE SUMMARY
REGIONAL ANALYSIS
ASIA PACIFIC
WESTERN EUROPE
NORTH AMERICA
LATIN AMERICA
EASTERN EUROPE
CONCLUSIONS
Page 15
© Euromonitor International Ltd 2015. Applicable terms and conditions of use and the disclaimer at the front of this document apply.
15
Flexible Plastic
34%
PET Bottles
10% Flexible Aluminum/
Paper 10%
Folding Cartons
9%
Glass Bottles
9%
Metal Beverage
Cans 5%
Flexible Paper
5%
Brick Liquid
Cartons 4%
Other 14%
Flexible plastic remains dominant across multiple categories
GLOBAL PACKAGING TRENDS: ASIA PACIFIC
Wide application drives strength of flexible
plastic
However, increasing consumer demand for premium packaging is driving growth in other pack types
PET bottles show aggressive growth rates
Key subcategory
applications of flexible plastic include:
─ Instant noodles ─ Sugar confectionery ─ Biscuits ─ Cigarettes
Key subcategory applications of PET bottles include ─ RTD tea ─ Juice ─ Carbonates
Total 2014 market size 2,091
Total 2019 market size 2,578
Forecast CAGR (2014-2019) 4.3%
Volume in billions of units
Volume share of pack types in Asia Pacific, 2014
2,091bn total units sold
in 2014
Page 16
© Euromonitor International Ltd 2015. Applicable terms and conditions of use and the disclaimer at the front of this document apply.
16
GLOBAL PACKAGING TRENDS: ASIA PACIFIC
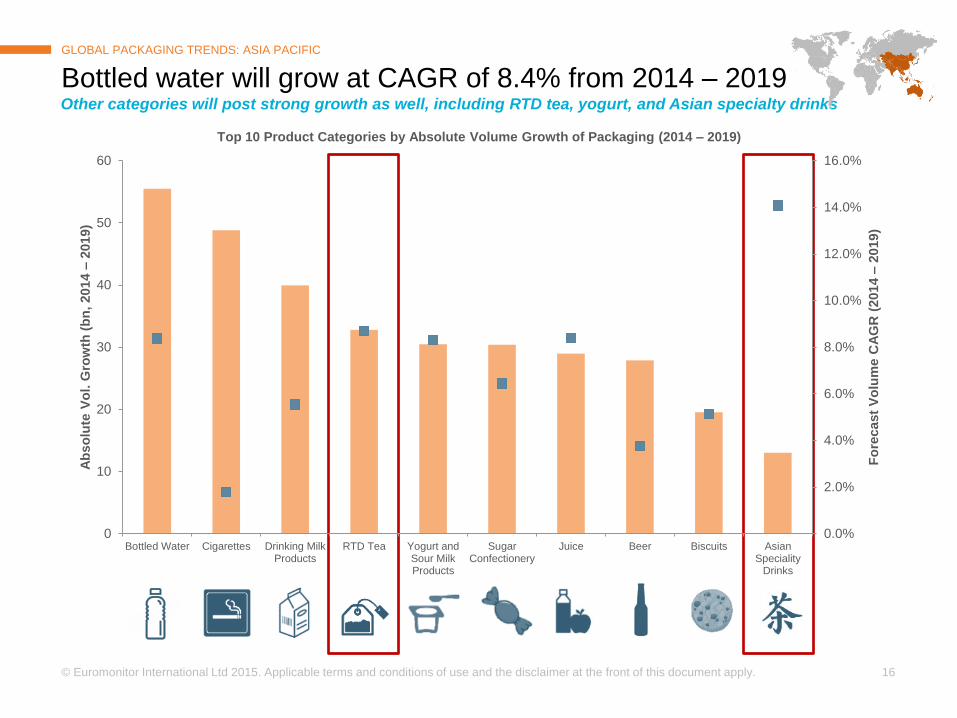
Other categories will post strong growth as well, including RTD tea, yogurt, and Asian specialty drinks
0.0%
2.0%
4.0%
6.0%
8.0%
10.0%
12.0%
14.0%
16.0%
0
10
20
30
40
50
60
Bottled Water Cigarettes Drinking MilkProducts
RTD Tea Yogurt andSour MilkProducts
SugarConfectionery
Juice Beer Biscuits AsianSpeciality
Drinks
Fo
recast
Vo
lum
e C
AG
R (
2014 –
2019)
Ab
so
lute
Vo
l. G
row
th (
bn
, 2014 –
2019)
Top 10 Product Categories by Absolute Volume Growth of Packaging (2014 – 2019)
Bottled water will grow at CAGR of 8.4% from 2014 – 2019
Page 17
© Euromonitor International Ltd 2015. Applicable terms and conditions of use and the disclaimer at the front of this document apply.
17
0%
2%
4%
6%
8%
10%
12%
14%
16%
18%
20%
0
2
4
6
8
10
12
14
16
18
PETBottles
MetalBeverage
Cans
BrickLiquid
Cartons
GlassBottles
Thin WallPlastic
Containers
Aluminium/Plastic
Pouches
Other PackTypes
Fo
recast
Vo
lum
e C
AG
R (
2014 –
2019)
Ab
s.
Vo
l. G
row
th (
billio
ns, 2014 –
2019)
RTD Tea by Pack Type
GLOBAL PACKAGING TRENDS: ASIA PACIFIC
RTD TEA While PET bottles are dominant, other pack types show large forecast growth
$43.8 billion Value sales of RTD tea in
2014*
7.4% Forecast value sales CAGR*
of RTD tea (2014 – 2019)
* In USD, RSP, constant 2014 value
• PET bottles will remain the dominant pack type with a 8.7% forecast CAGR
• Metal beverage can growth will be driven by China, where consumers perceive this pack type to be of higher quality
Page 18
© Euromonitor International Ltd 2015. Applicable terms and conditions of use and the disclaimer at the front of this document apply.
18
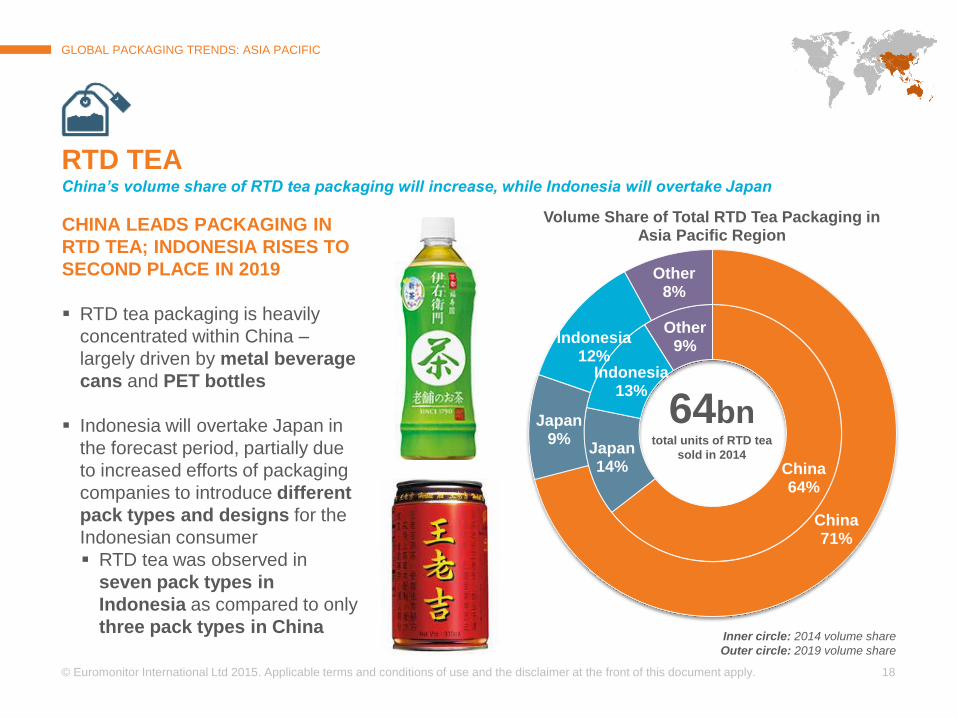
China 64%
Japan 14%
Indonesia 13%
Other 9%
China 71%
Japan 9%
Indonesia 12%
Other 8%
Volume Share of Total RTD Tea Packaging in Asia Pacific Region
GLOBAL PACKAGING TRENDS: ASIA PACIFIC
CHINA LEADS PACKAGING IN
RTD TEA; INDONESIA RISES TO
SECOND PLACE IN 2019
RTD tea packaging is heavily
concentrated within China –
largely driven by metal beverage
cans and PET bottles
Indonesia will overtake Japan in
the forecast period, partially due
to increased efforts of packaging
companies to introduce different
pack types and designs for the
Indonesian consumer
RTD tea was observed in
seven pack types in
Indonesia as compared to only
three pack types in China
RTD TEA China’s volume share of RTD tea packaging will increase, while Indonesia will overtake Japan
Inner circle: 2014 volume share
Outer circle: 2019 volume share
64bn total units of RTD tea
sold in 2014
Page 19
© Euromonitor International Ltd 2015. Applicable terms and conditions of use and the disclaimer at the front of this document apply.
19
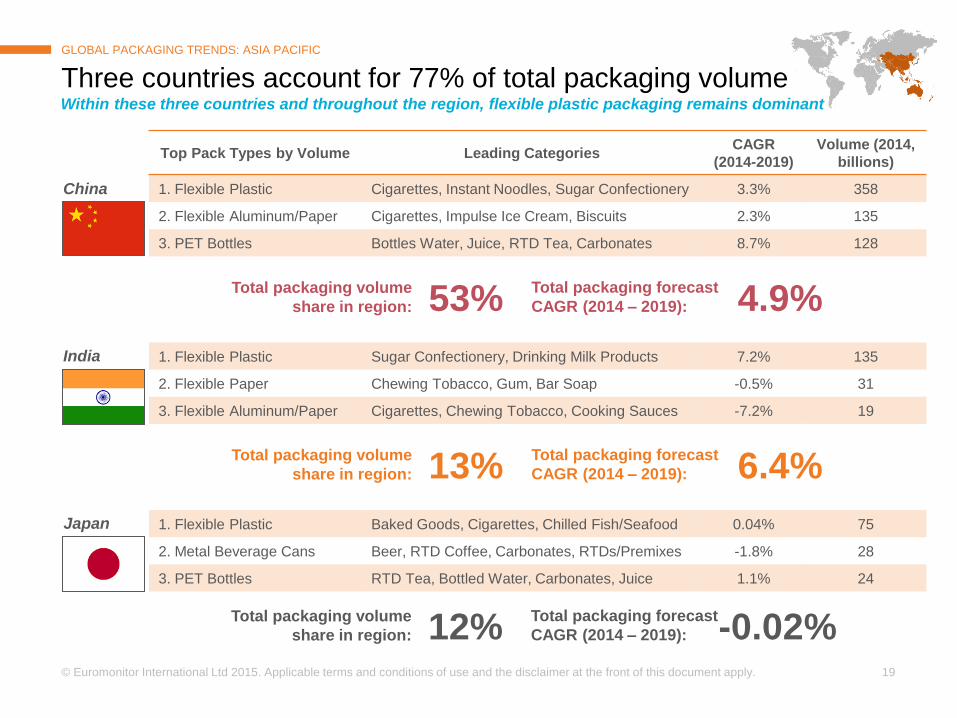
Top Pack Types by Volume Leading Categories CAGR
(2014-2019)
Volume (2014,
billions)
1. Flexible Plastic Cigarettes, Instant Noodles, Sugar Confectionery 3.3% 358
2. Flexible Aluminum/Paper Cigarettes, Impulse Ice Cream, Biscuits 2.3% 135
3. PET Bottles Bottles Water, Juice, RTD Tea, Carbonates 8.7% 128
1. Flexible Plastic Sugar Confectionery, Drinking Milk Products 7.2% 135
2. Flexible Paper Chewing Tobacco, Gum, Bar Soap -0.5% 31
3. Flexible Aluminum/Paper Cigarettes, Chewing Tobacco, Cooking Sauces -7.2% 19
1. Flexible Plastic Baked Goods, Cigarettes, Chilled Fish/Seafood 0.04% 75
2. Metal Beverage Cans Beer, RTD Coffee, Carbonates, RTDs/Premixes -1.8% 28
3. PET Bottles RTD Tea, Bottled Water, Carbonates, Juice 1.1% 24
Three countries account for 77% of total packaging volume
GLOBAL PACKAGING TRENDS: ASIA PACIFIC
India
China
Japan
Within these three countries and throughout the region, flexible plastic packaging remains dominant
Total packaging volume
share in region:
Total packaging forecast
CAGR (2014 – 2019): 53% 4.9%
Total packaging volume
share in region:
Total packaging forecast
CAGR (2014 – 2019): 13% 6.4%
Total packaging volume
share in region:
Total packaging forecast
CAGR (2014 – 2019): 12% -0.02%
Page 20
INTRODUCTION
EXECUTIVE SUMMARY
REGIONAL ANALYSIS
ASIA PACIFIC
WESTERN EUROPE
NORTH AMERICA
LATIN AMERICA
EASTERN EUROPE
CONCLUSIONS
Page 21
© Euromonitor International Ltd 2015. Applicable terms and conditions of use and the disclaimer at the front of this document apply.
21
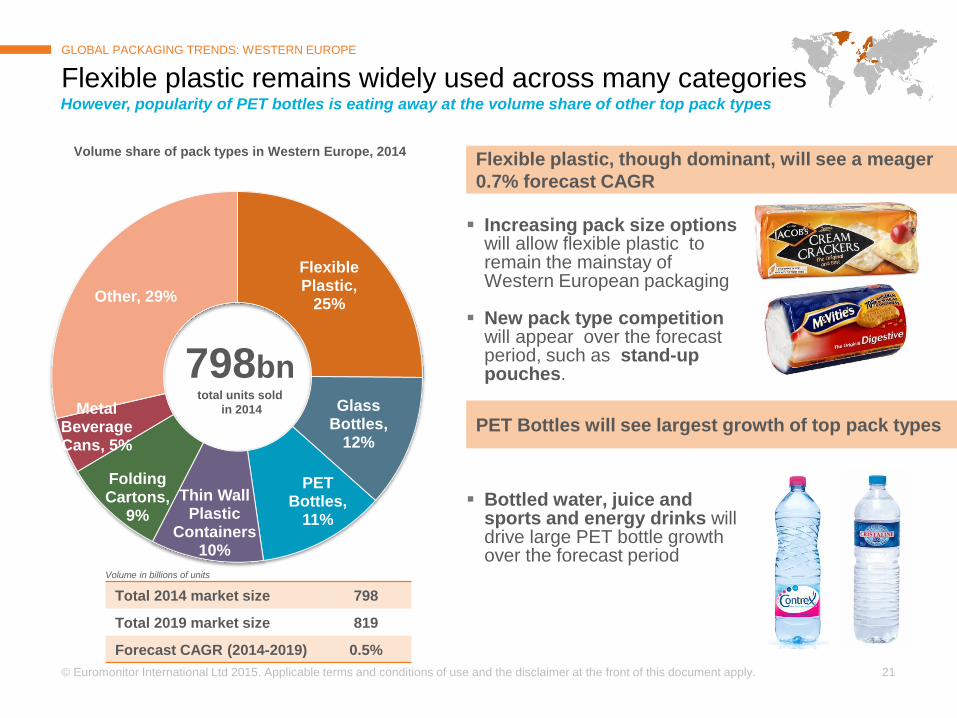
Flexible Plastic,
25%
Glass Bottles,
12%
PET Bottles,
11%
Thin Wall Plastic
Containers 10%
Folding Cartons,
9%
Metal Beverage Cans, 5%
Other, 29%
Flexible plastic remains widely used across many categories
GLOBAL PACKAGING TRENDS: WESTERN EUROPE
Flexible plastic, though dominant, will see a meager
0.7% forecast CAGR
However, popularity of PET bottles is eating away at the volume share of other top pack types
PET Bottles will see largest growth of top pack types
Increasing pack size options
will allow flexible plastic to remain the mainstay of Western European packaging
New pack type competition will appear over the forecast period, such as stand-up pouches.
Bottled water, juice and sports and energy drinks will drive large PET bottle growth over the forecast period
Volume share of pack types in Western Europe, 2014
Total 2014 market size 798
Total 2019 market size 819
Forecast CAGR (2014-2019) 0.5%
Volume in billions of units
798bn total units sold
in 2014
Page 22
© Euromonitor International Ltd 2015. Applicable terms and conditions of use and the disclaimer at the front of this document apply.
22
0.0%
0.5%
1.0%
1.5%
2.0%
2.5%
3.0%
3.5%
4.0%
4.5%
0
1
2
3
4
5
6
Bottled Water ChocolateConfectionery
Biscuits Wet Cat Food Juice Sports andEnergy Drinks
RTD Tea Baked Goods ChilledProcessed
Meat
Coffee
Fo
recast
Vo
lum
e C
AG
R (
2014 –
2019)
Ab
so
lute
Vo
l. G
row
th (
bn
, 2014 –
2019)
Top 10 Product Categories by Absolute Volume Growth of Packaging (2014 – 2019)
Bottled water will see the greatest absolute volume gains
GLOBAL PACKAGING TRENDS: WESTERN EUROPE
However, smaller overall categories such as RTD tea and coffee will register strong forecast CAGRs
Page 23
© Euromonitor International Ltd 2015. Applicable terms and conditions of use and the disclaimer at the front of this document apply.
23
0.0%
2.0%
4.0%
6.0%
8.0%
10.0%
12.0%
0.0
0.5
1.0
1.5
2.0
2.5
3.0
3.5
4.0
4.5
PET Bottles Glass Bottles Thin Wall PlasticContainers
Other
Fo
recast
Vo
lum
e C
AG
R (
2014 –
2019)
Ab
s.
Vo
l. G
row
th (
billio
ns, 2014 –
2019)
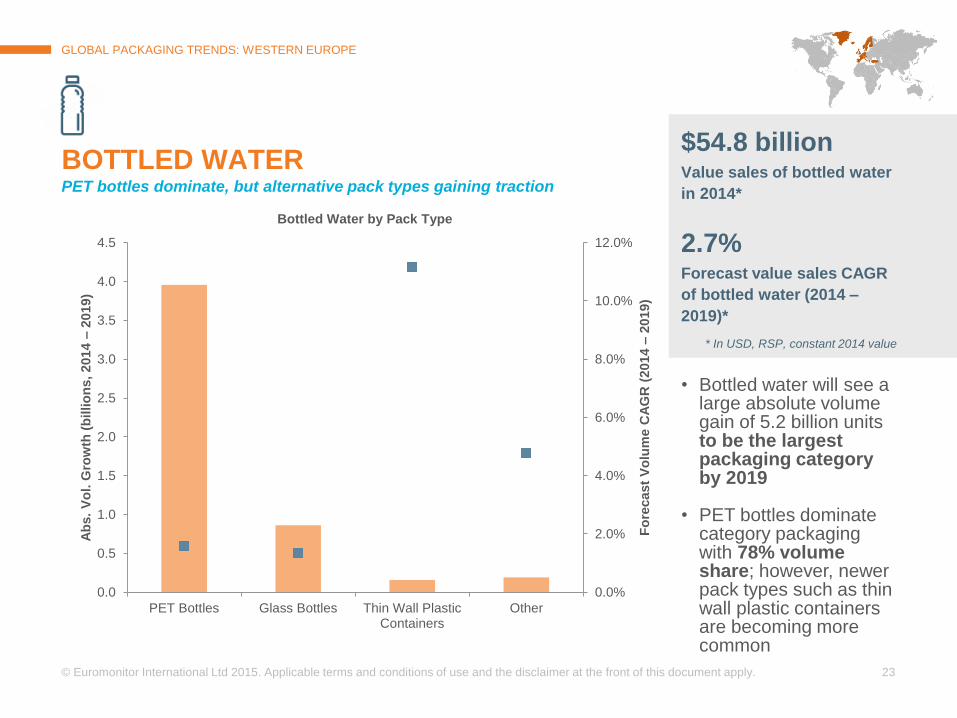
Bottled Water by Pack Type
GLOBAL PACKAGING TRENDS: WESTERN EUROPE
BOTTLED WATER PET bottles dominate, but alternative pack types gaining traction
$54.8 billion Value sales of bottled water
in 2014*
2.7% Forecast value sales CAGR
of bottled water (2014 –
2019)*
* In USD, RSP, constant 2014 value
• Bottled water will see a
large absolute volume gain of 5.2 billion units to be the largest packaging category by 2019
• PET bottles dominate
category packaging with 78% volume share; however, newer pack types such as thin wall plastic containers are becoming more common
Page 24
© Euromonitor International Ltd 2015. Applicable terms and conditions of use and the disclaimer at the front of this document apply.
24
GLOBAL PACKAGING TRENDS: WESTERN EUROPE
TURKEY DRIVES DEMAND
FOR BOTTLED WATER AND
GLASS BOTTLES IN REGION
In 2014, Turkey had the
highest volume of bottled
water packaging of any
Western European country,
with 12.3 billion units
General trends that drive this
growth in Turkey are rapid
urbanization, the demand
for convenience, and the
general perception of tap
water as unhygienic
BOTTLED WATER Category growth driven by demand of Turkey, who represent 20% of bottled water packaging in the region
Turkey, 58%
Rest of Western Europe,
42%
Absolute Volume Growth of Bottled Water Packaging by Country, 2014-2019
5.2bn Abs. volume
growth of
bottled water
Page 25
© Euromonitor International Ltd 2015. Applicable terms and conditions of use and the disclaimer at the front of this document apply.
25
Top Pack Types by
Volume Leading Categories
CAGR
(2014-2019)
Volume (2014,
billions)
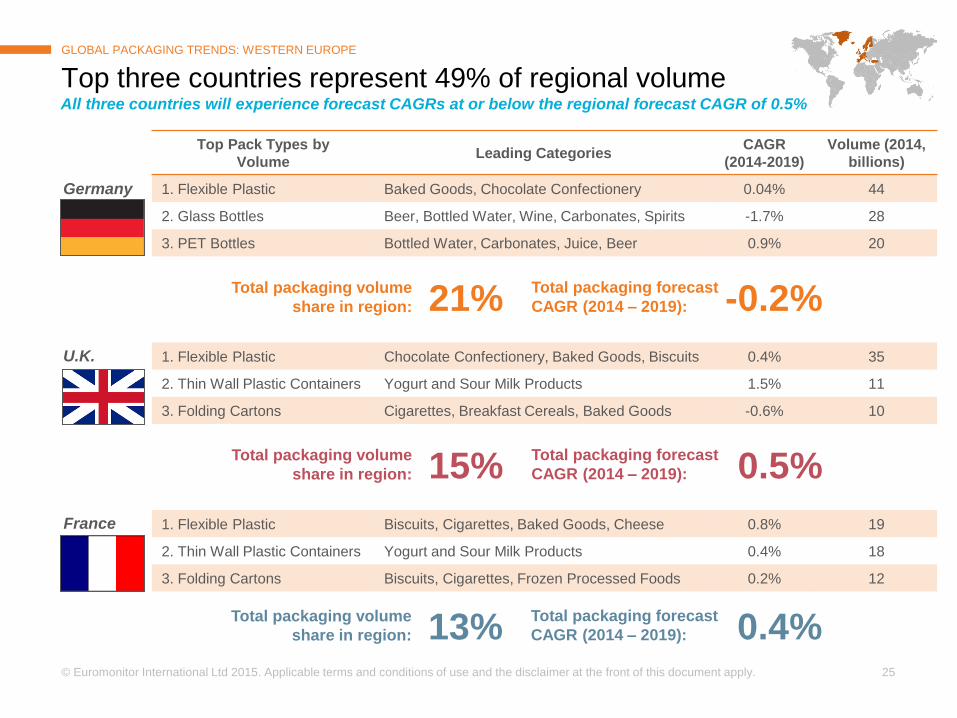
1. Flexible Plastic Baked Goods, Chocolate Confectionery 0.04% 44
2. Glass Bottles Beer, Bottled Water, Wine, Carbonates, Spirits -1.7% 28
3. PET Bottles Bottled Water, Carbonates, Juice, Beer 0.9% 20
1. Flexible Plastic Chocolate Confectionery, Baked Goods, Biscuits 0.4% 35
2. Thin Wall Plastic Containers Yogurt and Sour Milk Products 1.5% 11
3. Folding Cartons Cigarettes, Breakfast Cereals, Baked Goods -0.6% 10
1. Flexible Plastic Biscuits, Cigarettes, Baked Goods, Cheese 0.8% 19
2. Thin Wall Plastic Containers Yogurt and Sour Milk Products 0.4% 18
3. Folding Cartons Biscuits, Cigarettes, Frozen Processed Foods 0.2% 12
Top three countries represent 49% of regional volume
GLOBAL PACKAGING TRENDS: WESTERN EUROPE
U.K.
Germany
France
All three countries will experience forecast CAGRs at or below the regional forecast CAGR of 0.5%
Total packaging volume
share in region:
Total packaging forecast
CAGR (2014 – 2019): 21% -0.2%
Total packaging volume
share in region:
Total packaging forecast
CAGR (2014 – 2019): 15% 0.5%
Total packaging volume
share in region:
Total packaging forecast
CAGR (2014 – 2019): 13% 0.4%
Page 26
INTRODUCTION
EXECUTIVE SUMMARY
REGIONAL ANALYSIS
ASIA PACIFIC
WESTERN EUROPE
NORTH AMERICA
LATIN AMERICA
EASTERN EUROPE
CONCLUSIONS
Page 27
© Euromonitor International Ltd 2015. Applicable terms and conditions of use and the disclaimer at the front of this document apply.
27
PET Bottles, 19%
Flexible Plastic, 18%
Metal Beverage Cans, 16%
Folding Cartons,
10%
Glass Bottles, 7%
Thin Wall Plastic
Containers, 5%
Others, 24%
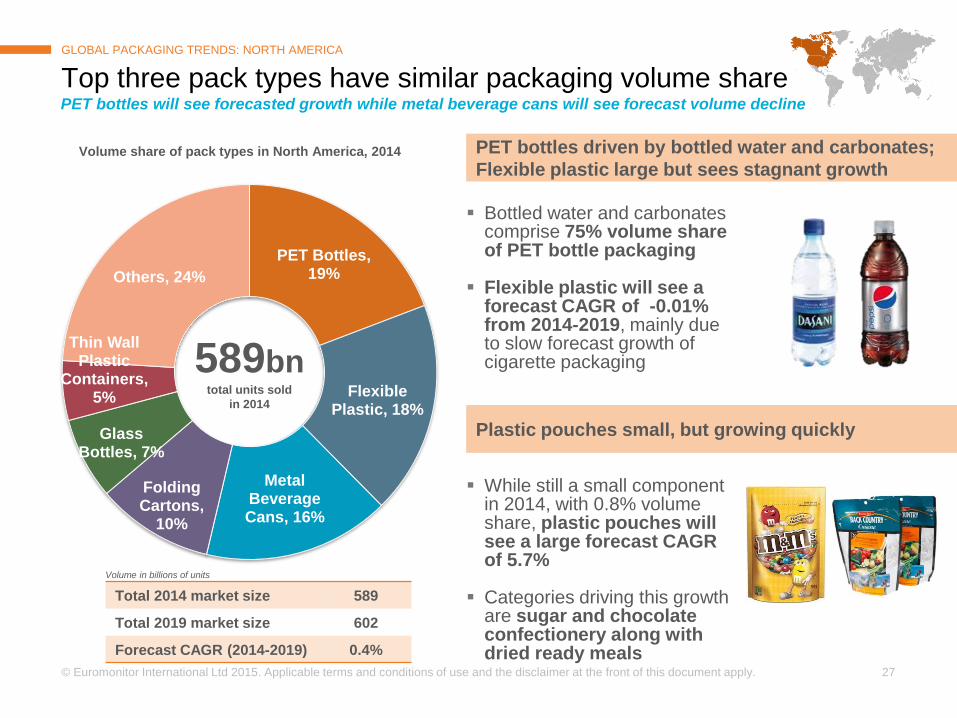
Top three pack types have similar packaging volume share
GLOBAL PACKAGING TRENDS: NORTH AMERICA
PET bottles driven by bottled water and carbonates;
Flexible plastic large but sees stagnant growth
PET bottles will see forecasted growth while metal beverage cans will see forecast volume decline
Plastic pouches small, but growing quickly
Bottled water and carbonates
comprise 75% volume share of PET bottle packaging
Flexible plastic will see a
forecast CAGR of -0.01% from 2014-2019, mainly due to slow forecast growth of cigarette packaging
While still a small component
in 2014, with 0.8% volume share, plastic pouches will see a large forecast CAGR of 5.7%
Categories driving this growth
are sugar and chocolate confectionery along with dried ready meals
Volume share of pack types in North America, 2014
Total 2014 market size 589
Total 2019 market size 602
Forecast CAGR (2014-2019) 0.4%
Volume in billions of units
589bn total units sold
in 2014
Page 28
© Euromonitor International Ltd 2015. Applicable terms and conditions of use and the disclaimer at the front of this document apply.
28
0.0%
1.0%
2.0%
3.0%
4.0%
5.0%
0.0
1.0
2.0
3.0
4.0
5.0
6.0
7.0
Bottled Water Cider/Perry Sports andEnergy Drinks
Drinking MilkProducts
RTD Tea ChilledProcessed
Meat
Yogurt andSour MilkProducts
Wine Cheese SugarConfectionery
Fo
recast
CA
GR
(2014 –
2019)
Ab
so
lute
Vo
l. G
row
th (
bn
, 2014 –
2019)
Top 10 Product Categories by Absolute Volume Growth of Packaging (2014 – 2019)
In absolute volume terms, bottled water will see largest growth
GLOBAL PACKAGING TRENDS: NORTH AMERICA
Cider/perry, though starting from a low base, will see massive forecast growth of more than 32% from 2014-2019
CAGR =
32.2%
Page 29
© Euromonitor International Ltd 2015. Applicable terms and conditions of use and the disclaimer at the front of this document apply.
29
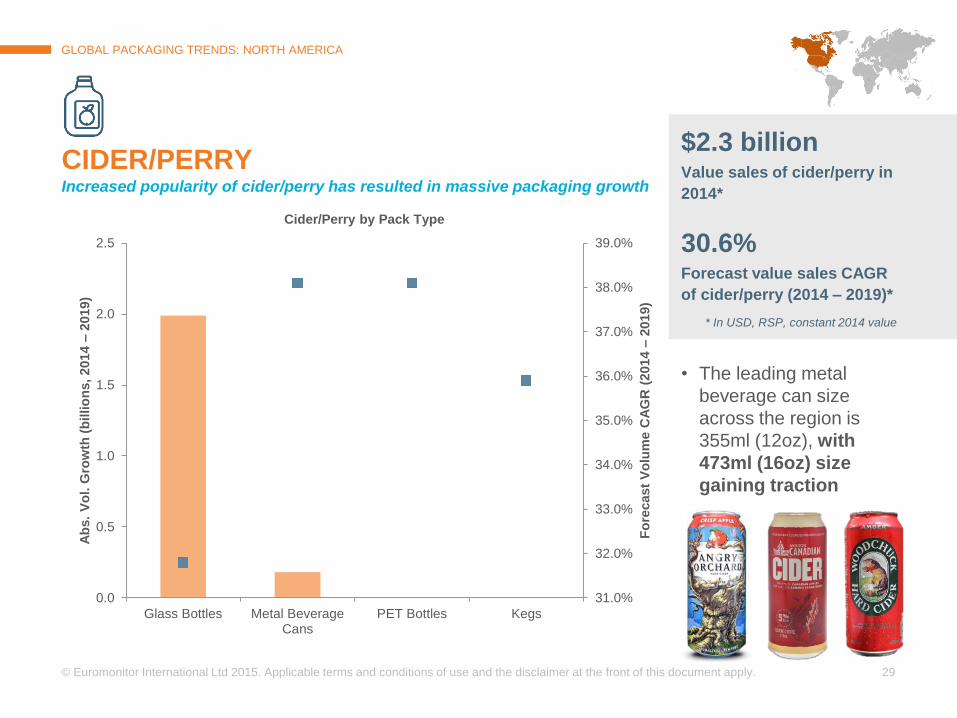
GLOBAL PACKAGING TRENDS: NORTH AMERICA
CIDER/PERRY Increased popularity of cider/perry has resulted in massive packaging growth
31.0%
32.0%
33.0%
34.0%
35.0%
36.0%
37.0%
38.0%
39.0%
0.0
0.5
1.0
1.5
2.0
2.5
Glass Bottles Metal BeverageCans
PET Bottles Kegs
Fo
recast
Vo
lum
e C
AG
R (
2014 –
2019)
Ab
s.
Vo
l. G
row
th (
billio
ns, 2014 –
2019)
Cider/Perry by Pack Type
$2.3 billion Value sales of cider/perry in
2014*
30.6% Forecast value sales CAGR
of cider/perry (2014 – 2019)*
* In USD, RSP, constant 2014 value
• The leading metal
beverage can size
across the region is
355ml (12oz), with
473ml (16oz) size
gaining traction
Page 30
© Euromonitor International Ltd 2015. Applicable terms and conditions of use and the disclaimer at the front of this document apply.
30
0.0%
2.0%
4.0%
6.0%
8.0%
10.0%
12.0%
14.0%
0.0
0.1
0.1
0.2
0.2
0.3
0.3
PET Bottles Glass Bottles Shaped LiquidCartons
Bag In Box Other
Fo
recast
Vo
lum
e C
AG
R (
2014 –
2019)
Ab
s.
Vo
l. G
row
th (
billio
ns, 2014 –
2019)
Wine by Pack Type
GLOBAL PACKAGING TRENDS: NORTH AMERICA
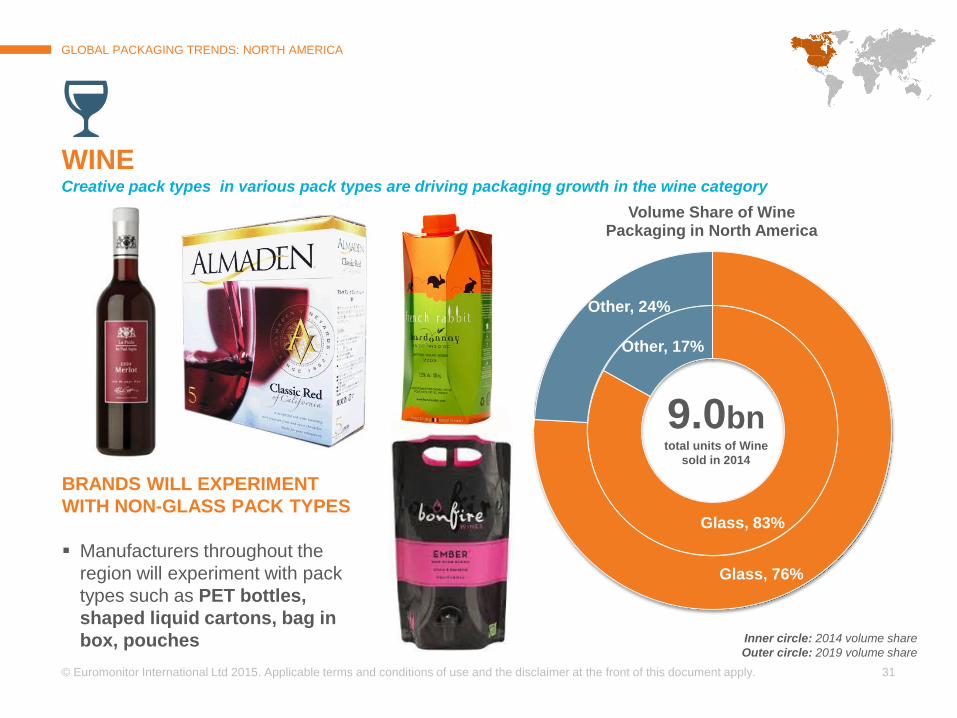
WINE Glass is the volume leader, but will be challenged by new packaging innovations
$51.4 billion Value sales of wine in 2014*
4.8% Forecast value sales CAGR
of wine (2014 – 2019)*
* In USD, RSP, constant 2014 value
• Glass bottles remain the volume leader in 2014, with a 83% volume share
• PET bottles, shaped liquid cartons, bag in box, and pouches drive the growth in the wine category
Page 31
© Euromonitor International Ltd 2015. Applicable terms and conditions of use and the disclaimer at the front of this document apply.
31
Glass, 83%
Other, 17%
Glass, 76%
Other, 24%
Volume Share of Wine Packaging in North America
GLOBAL PACKAGING TRENDS: NORTH AMERICA
WINE Creative pack types in various pack types are driving packaging growth in the wine category
BRANDS WILL EXPERIMENT
WITH NON-GLASS PACK TYPES
Manufacturers throughout the
region will experiment with pack
types such as PET bottles,
shaped liquid cartons, bag in
box, pouches
Inner circle: 2014 volume share
Outer circle: 2019 volume share
9.0bn total units of Wine
sold in 2014
Page 32
© Euromonitor International Ltd 2015. Applicable terms and conditions of use and the disclaimer at the front of this document apply.
32
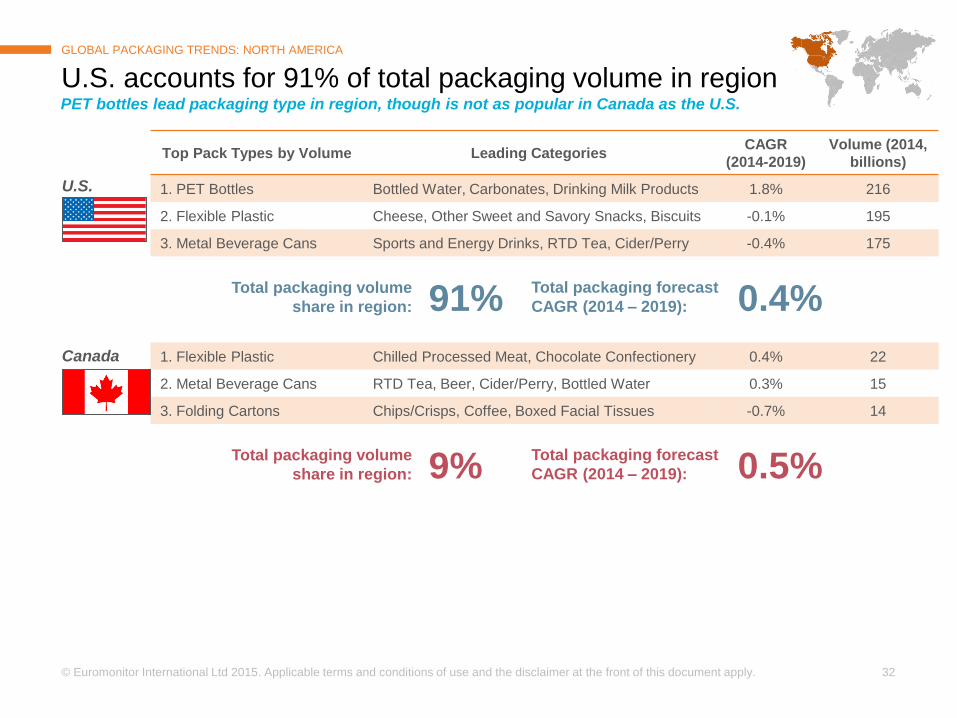
Top Pack Types by Volume Leading Categories CAGR
(2014-2019)
Volume (2014,
billions)
1. PET Bottles Bottled Water, Carbonates, Drinking Milk Products 1.8% 216
2. Flexible Plastic Cheese, Other Sweet and Savory Snacks, Biscuits -0.1% 195
3. Metal Beverage Cans Sports and Energy Drinks, RTD Tea, Cider/Perry -0.4% 175
1. Flexible Plastic Chilled Processed Meat, Chocolate Confectionery 0.4% 22
2. Metal Beverage Cans RTD Tea, Beer, Cider/Perry, Bottled Water 0.3% 15
3. Folding Cartons Chips/Crisps, Coffee, Boxed Facial Tissues -0.7% 14
U.S. accounts for 91% of total packaging volume in region
GLOBAL PACKAGING TRENDS: NORTH AMERICA
Canada
PET bottles lead packaging type in region, though is not as popular in Canada as the U.S.
U.S.
Total packaging volume
share in region:
Total packaging forecast
CAGR (2014 – 2019): 91% 0.4%
Total packaging volume
share in region:
Total packaging forecast
CAGR (2014 – 2019): 9% 0.5%
Page 33
INTRODUCTION
EXECUTIVE SUMMARY
REGIONAL ANALYSIS
ASIA PACIFIC
WESTERN EUROPE
NORTH AMERICA
LATIN AMERICA
EASTERN EUROPE
CONCLUSIONS
Page 34
© Euromonitor International Ltd 2015. Applicable terms and conditions of use and the disclaimer at the front of this document apply.
34
Flexible Plastic
28%
Glass Bottles
14%
PET Bottles
12%
Metal Beverage
Cans 8%
Folding Cartons
6%
Flexible Paper
5%
HDPE Bottles
4%
Other 23%
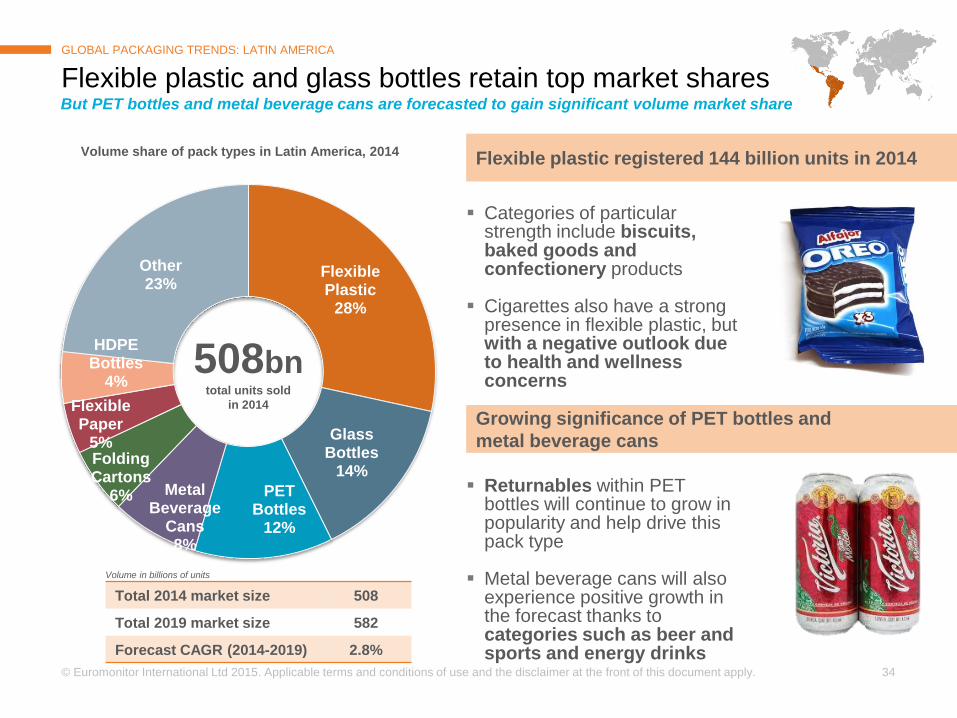
Flexible plastic and glass bottles retain top market shares
GLOBAL PACKAGING TRENDS: LATIN AMERICA
Flexible plastic registered 144 billion units in 2014
But PET bottles and metal beverage cans are forecasted to gain significant volume market share
Growing significance of PET bottles and
metal beverage cans
Categories of particular
strength include biscuits, baked goods and confectionery products
Cigarettes also have a strong
presence in flexible plastic, but with a negative outlook due to health and wellness concerns
Returnables within PET
bottles will continue to grow in popularity and help drive this pack type
Metal beverage cans will also experience positive growth in the forecast thanks to categories such as beer and sports and energy drinks
Volume share of pack types in Latin America, 2014
Total 2014 market size 508
Total 2019 market size 582
Forecast CAGR (2014-2019) 2.8%
Volume in billions of units
508bn total units sold
in 2014
Page 35
© Euromonitor International Ltd 2015. Applicable terms and conditions of use and the disclaimer at the front of this document apply.
35
0.0%
1.0%
2.0%
3.0%
4.0%
5.0%
6.0%
7.0%
8.0%
9.0%
10.0%
0
2
4
6
8
10
12
Beer Bottled Water Yogurt andSour MilkProducts
Carbonates Juice Drinking MilkProducts
Concentrates SugarConfectionery
Sports andEnergy Drinks
ChocolateConfectionery
Fo
recast
CA
GR
(2014 –
2019)
Ab
so
lute
Vo
l. G
row
th (
bn
, 2014 –
2019)
Top 10 Product Categories by Absolute Volume Growth of Packaging (2014 – 2019)
Beer continues to dominate packaging in Latin America
GLOBAL PACKAGING TRENDS: LATIN AMERICA
In terms of forecast CAGR, however, sports and energy drinks and juice show strong packaging growth
Page 36
© Euromonitor International Ltd 2015. Applicable terms and conditions of use and the disclaimer at the front of this document apply.
36
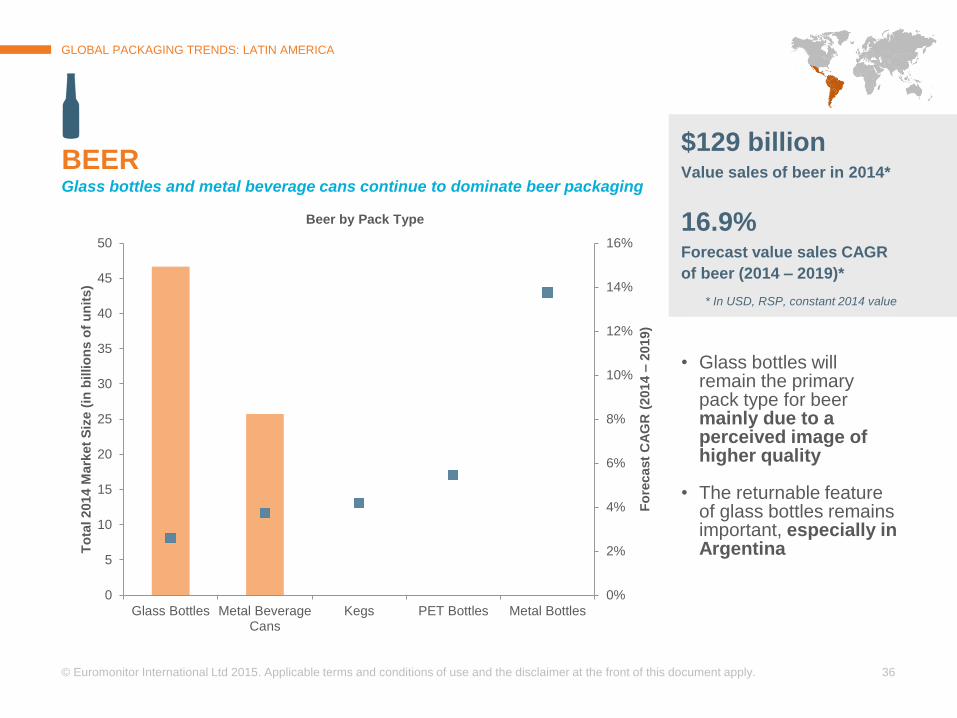
GLOBAL PACKAGING TRENDS: LATIN AMERICA
BEER Glass bottles and metal beverage cans continue to dominate beer packaging
$129 billion Value sales of beer in 2014*
16.9% Forecast value sales CAGR
of beer (2014 – 2019)*
* In USD, RSP, constant 2014 value
0%
2%
4%
6%
8%
10%
12%
14%
16%
0
5
10
15
20
25
30
35
40
45
50
Glass Bottles Metal BeverageCans
Kegs PET Bottles Metal Bottles
Fo
recast
CA
GR
(2014 –
2019)
To
tal 2014 M
ark
et
Siz
e (
in b
illio
ns o
f u
nit
s)
Beer by Pack Type
• Glass bottles will remain the primary pack type for beer mainly due to a perceived image of higher quality
• The returnable feature
of glass bottles remains important, especially in Argentina
Page 37
© Euromonitor International Ltd 2015. Applicable terms and conditions of use and the disclaimer at the front of this document apply.
37
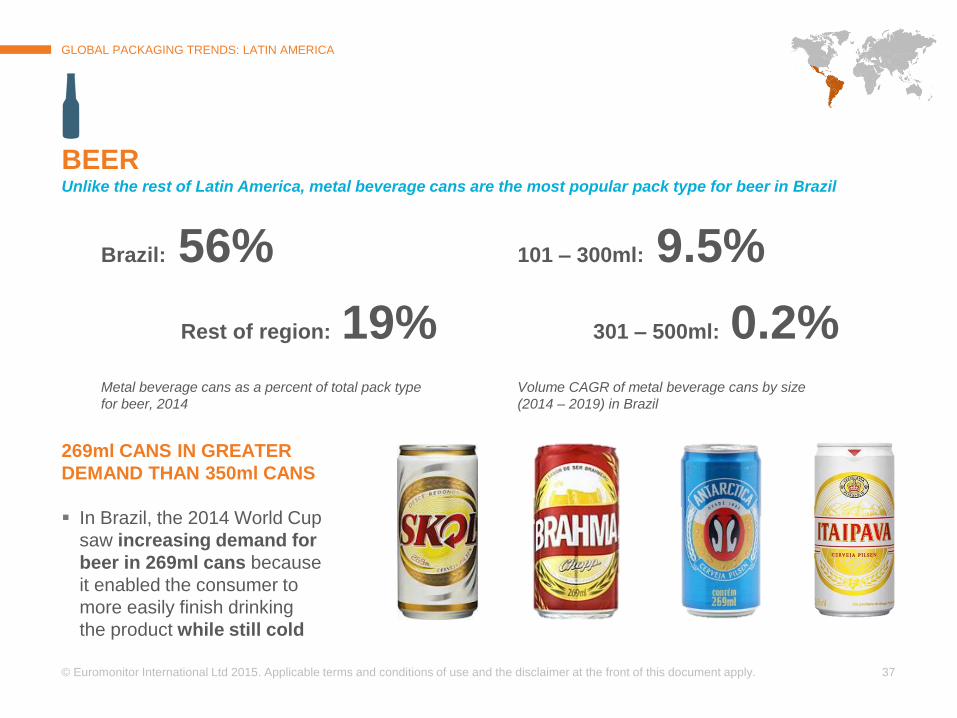
GLOBAL PACKAGING TRENDS: LATIN AMERICA
BEER Unlike the rest of Latin America, metal beverage cans are the most popular pack type for beer in Brazil
269ml CANS IN GREATER
DEMAND THAN 350ml CANS
In Brazil, the 2014 World Cup
saw increasing demand for
beer in 269ml cans because
it enabled the consumer to
more easily finish drinking
the product while still cold
Brazil: 56%
Rest of region: 19%
Metal beverage cans as a percent of total pack type
for beer, 2014
101 – 300ml: 9.5%
301 – 500ml: 0.2%
Volume CAGR of metal beverage cans by size
(2014 – 2019) in Brazil
Page 38
© Euromonitor International Ltd 2015. Applicable terms and conditions of use and the disclaimer at the front of this document apply.
38
GLOBAL PACKAGING TRENDS: LATIN AMERICA
0%
1%
2%
3%
4%
5%
6%
7%
8%
9%
10%
0
1
2
3
4
5
Brick LiquidCartons
HDPEBottles
Gable TopLiquid
Cartons
PET Bottles ShapedLiquid
Cartons
Other PackTypes
Fo
recast
CA
GR
(2014 –
2019)
To
tal 2014 M
ark
et
Siz
e (
in b
illio
ns o
f u
nit
s)
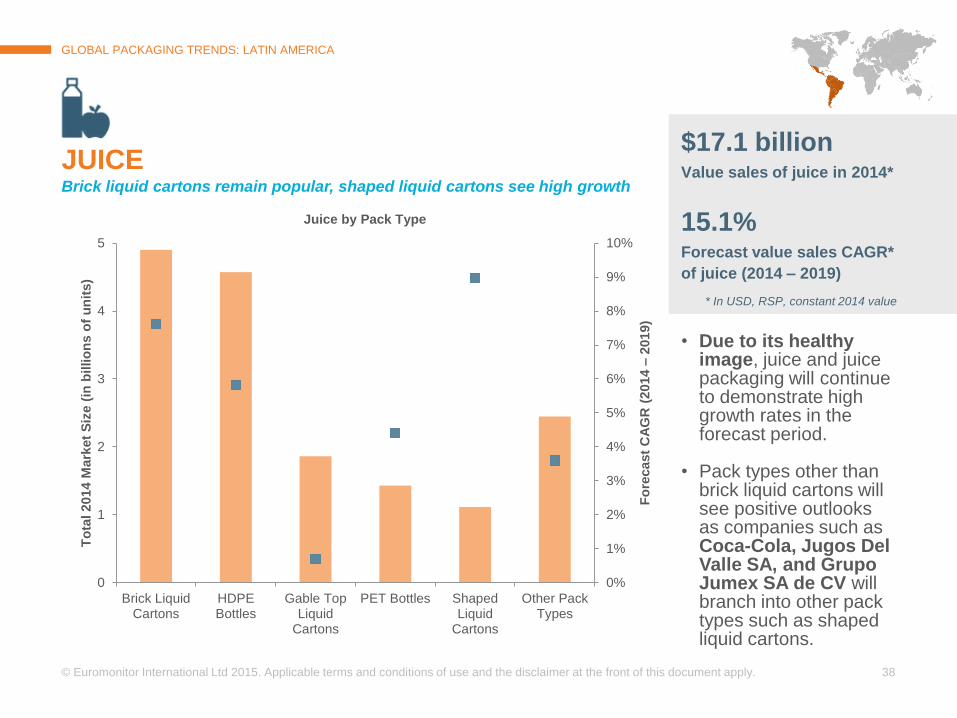
Juice by Pack Type
JUICE Brick liquid cartons remain popular, shaped liquid cartons see high growth
$17.1 billion Value sales of juice in 2014*
15.1% Forecast value sales CAGR*
of juice (2014 – 2019)
* In USD, RSP, constant 2014 value
• Due to its healthy
image, juice and juice packaging will continue to demonstrate high growth rates in the forecast period.
• Pack types other than
brick liquid cartons will see positive outlooks as companies such as Coca-Cola, Jugos Del Valle SA, and Grupo Jumex SA de CV will branch into other pack types such as shaped liquid cartons.
Page 39
© Euromonitor International Ltd 2015. Applicable terms and conditions of use and the disclaimer at the front of this document apply.
39
GLOBAL PACKAGING TRENDS: LATIN AMERICA
JUICE Mexico controls the Latin American juice packaging market, but Brazil drives demand for shaped liquid cartons
HDPE BOTTLES WILL SEE
MOST DYNAMIC GROWTH IN
MEXICO
The popularity of HDPE
bottles in Latin America is
driven by Mexico – 98.5%
of the absolute volume
growth of this pack type in
juice will originate in Mexico
DEMAND FOR SHAPED
LIQUID CARTONS STEMS
FROM BRAZIL
Coca-Cola’s 2014 launch of
its Del Valle Reserva brand
in shaped liquid cartons
can explain high growth for
this pack type
Mexico 49%
Rest of region 51%
Juice Packaging Volume
Sales in Latin America, 2014
16.3bn units of Juice
sold in 2014
Page 40
© Euromonitor International Ltd 2015. Applicable terms and conditions of use and the disclaimer at the front of this document apply.
40
Top Pack Types by Volume Leading Categories CAGR
(2014-2019)
Volume (2014,
billions)
1. Flexible Plastic Biscuits, Gum, Cigarettes, Sugar Confectionery 2.1% 51
2. Metal Beverage Cans Beer, Carbonates, Sports and Energy Drinks 3.8% 24
3. Glass Bottles Beer, Carbonates, Spirits, Bottled Water 2.9% 22
1. Flexible Plastic Baked Goods, Concentrates, Sugar Confectionery 1.4% 41
2. Glass Bottles Beer, Carbonates, Bottled Water, Spirits 2.5% 22.4
3. PET Bottles Carbonates, Bottled Water, Vegetable & Seed Oil 3.6% 22.3
1. Flexible Plastic Biscuits, Cigarettes, Gum, Chocolate Confectionery 1.3% 17
2. PET Bottles Bottled Water, Carbonates, Vegetable & Seed Oil 2.0% 8
3. Flexible Aluminum/Paper Concentrates, Cigarettes, Gum Sugar Confectionery 1.8% 6
Three countries account for 78% of total packaging volume
GLOBAL PACKAGING TRENDS: LATIN AMERICA
Mexico
Brazil
Argentina
Flexible plastic leads across the region, but country specific-differences emerge in subsequent pack types
Total packaging volume
share in region:
Total packaging forecast
CAGR (2014 – 2019): 40% 3.3%
Total packaging volume
share in region:
Total packaging forecast
CAGR (2014 – 2019): 29% 2.2%
Total packaging volume
share in region:
Total packaging forecast
CAGR (2014 – 2019): 10% 1.6%
Page 41
INTRODUCTION
EXECUTIVE SUMMARY
REGIONAL ANALYSIS
ASIA PACIFIC
WESTERN EUROPE
NORTH AMERICA
LATIN AMERICA
EASTERN EUROPE
CONCLUSIONS
Page 42
© Euromonitor International Ltd 2015. Applicable terms and conditions of use and the disclaimer at the front of this document apply.
42
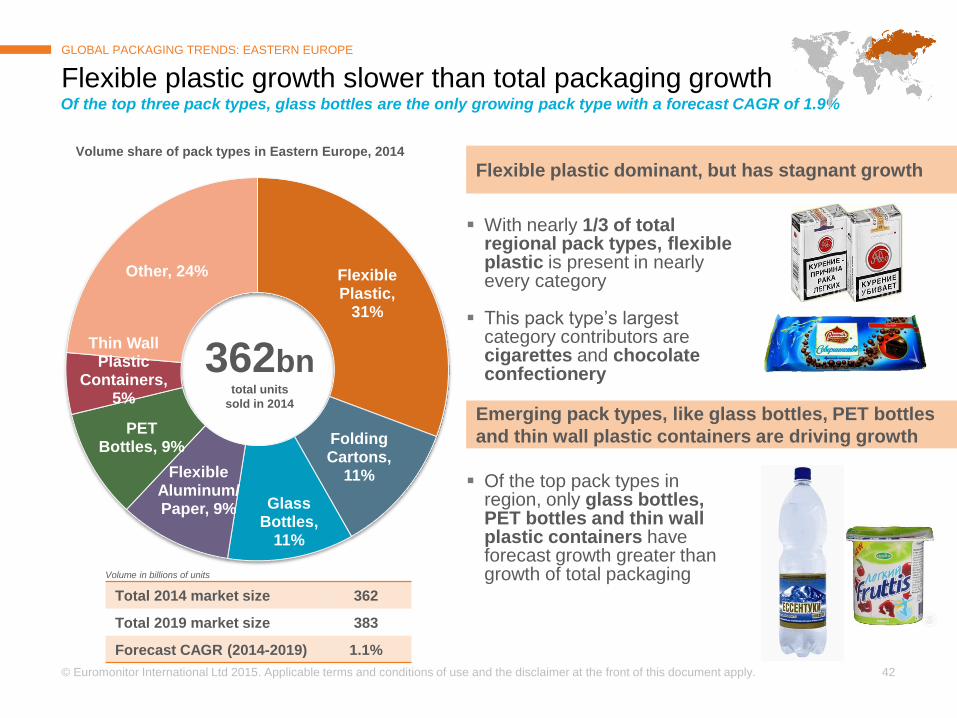
Flexible Plastic,
31%
Folding Cartons,
11%
Glass Bottles,
11%
Flexible Aluminum/ Paper, 9%
PET Bottles, 9%
Thin Wall Plastic
Containers, 5%
Other, 24%
Flexible plastic growth slower than total packaging growth
GLOBAL PACKAGING TRENDS: EASTERN EUROPE
Flexible plastic dominant, but has stagnant growth
Of the top three pack types, glass bottles are the only growing pack type with a forecast CAGR of 1.9%
Emerging pack types, like glass bottles, PET bottles
and thin wall plastic containers are driving growth
With nearly 1/3 of total
regional pack types, flexible plastic is present in nearly every category
This pack type’s largest category contributors are cigarettes and chocolate confectionery
Of the top pack types in
region, only glass bottles, PET bottles and thin wall plastic containers have forecast growth greater than growth of total packaging
Volume share of pack types in Eastern Europe, 2014
Total 2014 market size 362
Total 2019 market size 383
Forecast CAGR (2014-2019) 1.1%
Volume in billions of units
362bn total units
sold in 2014
Page 43
© Euromonitor International Ltd 2015. Applicable terms and conditions of use and the disclaimer at the front of this document apply.
43
0.0%
0.5%
1.0%
1.5%
2.0%
2.5%
3.0%
3.5%
4.0%
0.0
0.5
1.0
1.5
2.0
2.5
3.0
3.5
Beer Bottled Water ChocolateConfectionery
Carbonates Drinking MilkProducts
Baked Goods Biscuits ChilledProcessed
Meat
Juice Other Sweetand Savoury
Snacks
Fo
recast
Vo
lum
e C
AG
R (
2014 –
2019)
Ab
so
lute
Vo
l. G
row
th (
bn
, 2014 –
2019)
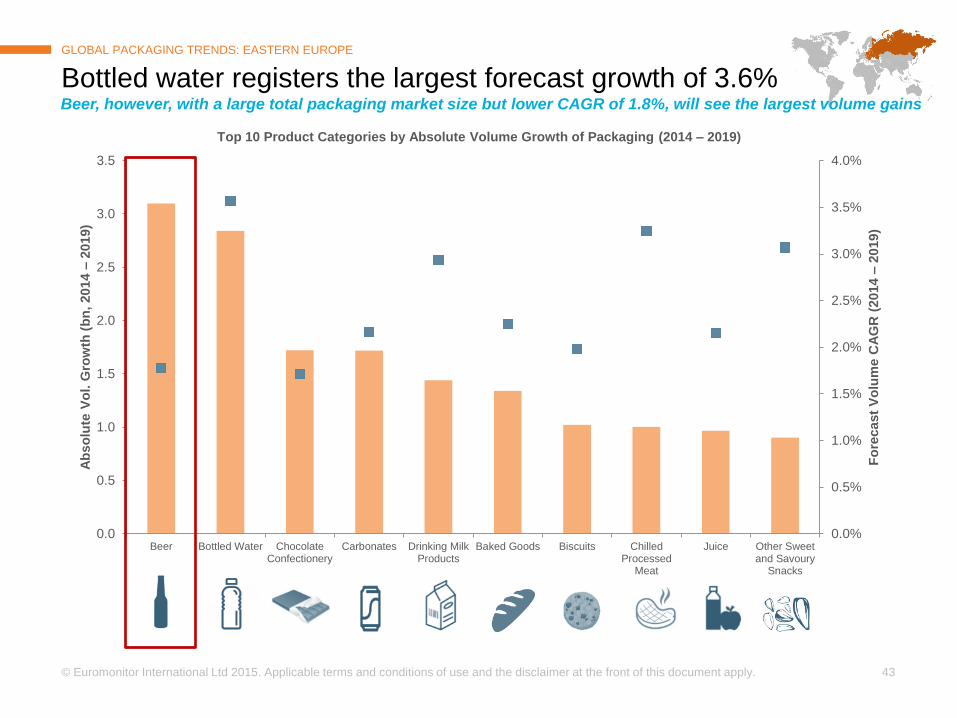
Top 10 Product Categories by Absolute Volume Growth of Packaging (2014 – 2019)
Bottled water registers the largest forecast growth of 3.6%
GLOBAL PACKAGING TRENDS: EASTERN EUROPE
Beer, however, with a large total packaging market size but lower CAGR of 1.8%, will see the largest volume gains
Page 44
© Euromonitor International Ltd 2015. Applicable terms and conditions of use and the disclaimer at the front of this document apply.
44
-2.0%
-1.0%
0.0%
1.0%
2.0%
3.0%
4.0%
5.0%
-0.5
0.0
0.5
1.0
1.5
2.0
Metal Beverage Cans Glass Bottles Other
Fo
recast
Vo
lum
e C
AG
R (
2014 –
2019)
Ab
s.
Vo
l. G
row
th (
billio
ns, 2014 –
2019)
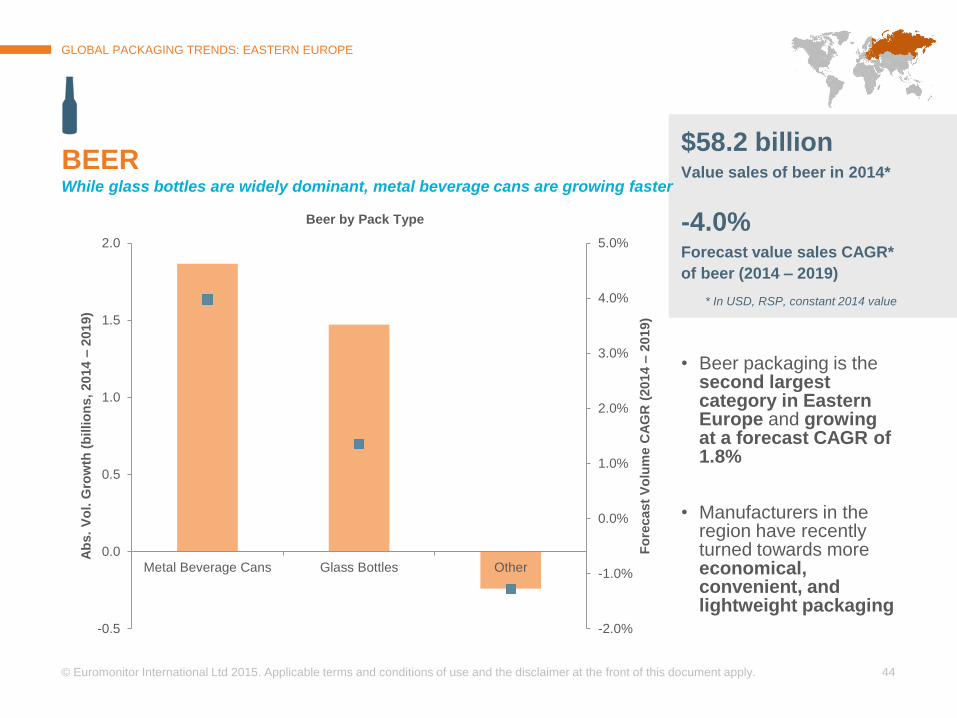
Beer by Pack Type
GLOBAL PACKAGING TRENDS: EASTERN EUROPE
BEER While glass bottles are widely dominant, metal beverage cans are growing faster
$58.2 billion Value sales of beer in 2014*
-4.0% Forecast value sales CAGR*
of beer (2014 – 2019)
* In USD, RSP, constant 2014 value
• Beer packaging is the second largest category in Eastern Europe and growing at a forecast CAGR of 1.8%
• Manufacturers in the region have recently turned towards more economical, convenient, and lightweight packaging
Page 45
© Euromonitor International Ltd 2015. Applicable terms and conditions of use and the disclaimer at the front of this document apply.
45
GLOBAL PACKAGING TRENDS: EASTERN EUROPE
BEER PET bottles for beer packaging are decreasing in Russia and Ukraine, but increasing throughout the rest of region
THOUGH DECREASING
OVERALL, PET BOTTLES ARE
WIDELY POPULAR IN REGION
In Russia and Ukraine,
government regulations and
declining consumer
purchasing power due to
economic conditions pushing
PET packaging in beer down
The rest of the region will
see large growth in PET
bottle packaging
Consumers purchased more
off-trade beer, and PET
bottles allow easier on-the-go
and at-home consumption
0
0.5
1
1.5
2
2.5
2014 2019
To
tal V
olu
me (
billio
ns)
Total Volume of PET Bottle Packaging in Beer with forecast CAGR (2014-2019)
Russia, -5.3%
Ukraine, -1.7%
Romania, 8.1%
Rest of
Eastern
Europe, 8.8%
Page 46
© Euromonitor International Ltd 2015. Applicable terms and conditions of use and the disclaimer at the front of this document apply.
46
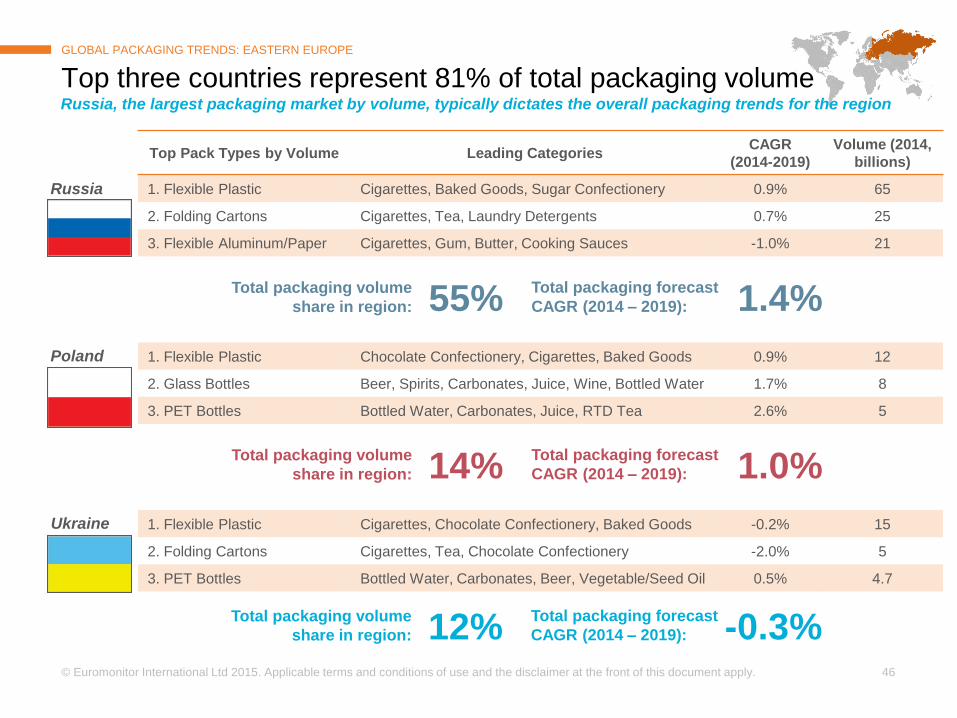
Top Pack Types by Volume Leading Categories CAGR
(2014-2019)
Volume (2014,
billions)
1. Flexible Plastic Cigarettes, Baked Goods, Sugar Confectionery 0.9% 65
2. Folding Cartons Cigarettes, Tea, Laundry Detergents 0.7% 25
3. Flexible Aluminum/Paper Cigarettes, Gum, Butter, Cooking Sauces -1.0% 21
1. Flexible Plastic Chocolate Confectionery, Cigarettes, Baked Goods 0.9% 12
2. Glass Bottles Beer, Spirits, Carbonates, Juice, Wine, Bottled Water 1.7% 8
3. PET Bottles Bottled Water, Carbonates, Juice, RTD Tea 2.6% 5
1. Flexible Plastic Cigarettes, Chocolate Confectionery, Baked Goods -0.2% 15
2. Folding Cartons Cigarettes, Tea, Chocolate Confectionery -2.0% 5
3. PET Bottles Bottled Water, Carbonates, Beer, Vegetable/Seed Oil 0.5% 4.7
Top three countries represent 81% of total packaging volume
GLOBAL PACKAGING TRENDS: EASTERN EUROPE
Poland
Russia
Ukraine
Russia, the largest packaging market by volume, typically dictates the overall packaging trends for the region
Total packaging volume
share in region:
Total packaging forecast
CAGR (2014 – 2019): 55% 1.4%
Total packaging volume
share in region:
Total packaging forecast
CAGR (2014 – 2019): 14% 1.0%
Total packaging volume
share in region:
Total packaging forecast
CAGR (2014 – 2019): 12% -0.3%
Page 47
INTRODUCTION
EXECUTIVE SUMMARY
REGIONAL ANALYSIS
ASIA PACIFIC
WESTERN EUROPE
NORTH AMERICA
LATIN AMERICA
EASTERN EUROPE
CONCLUSIONS
Page 48
© Euromonitor International Ltd 2015. Applicable terms and conditions of use and the disclaimer at the front of this document apply.
48
GLOBAL PACKAGING TRENDS: CONCLUSIONS
Reg
ion
P
ac
k T
yp
e
Cate
go
ry
Asia Pacific is the region with the largest potential growth opportunity In terms of pack type, PET bottles show the strongest growth rates, while bottled water leads category potential
+ 186 absolute volume growth
(in billions of units, 2014-2019)
+ 487 absolute volume growth
(in billions of units, 2014-2019)
+ 63 absolute volume growth
(in billions of units, 2014-2019)
Asia Pacific is the region with the largest
packaging growth opportunity
Forecast growth rate of 4.3%
PET bottles is the pack type with the largest
packaging growth opportunity
Forecast growth rate of 4.7%
Bottled water is the category with the largest
packaging growth opportunity
Forecast growth rate of 7.8%
Page 49
THANK YOU – QUESTIONS?
David Margulies
Consultant
Tel: +1 312-922-1115 x 8237
[email protected]
Stephen Kendall
Associate Consultant
Tel: +1 312-922-1115 x 8240
[email protected]
Mark Wesoloskie
Business Development - Consulting
Tel: +1 312-922-1115 x 8277
[email protected]
Raymond Clark
Business Development Executive
Tel: +1 312-922-1115 x 8373
[email protected]
Page 51
© Euromonitor International Ltd 2015. Applicable terms and conditions of use and the disclaimer at the front of this document apply.
51
Flexible Plastic
27%
Folding Cartons
13%
Glass Bottles
10% PET
Bottles 9%
Metal Beverage
Cans 8%
Flexible Aluminum/
Paper 7%
Thin Wall Plastic
Containers 6%
Other 21%
Flexible plastic represents a quarter of the region’s pack type
GLOBAL PACKAGING TRENDS: MIDDLE EAST & AFRICA
Flexible plastic maintains stronghold on regional
packaging format
Following more than 10% value share behind are folding cartons and glass bottles
This pack type is widely
represented among various categories, including cigarettes, baked goods, biscuits, chips/crisps, and rice, which combined represent a 56% value share of total flexible plastic
Projected growth of this
flexible plastic is 5.5%, which is slightly higher than the total packaging growth of 5.3%
Volume share of pack types in Middle East & Africa, 2014
Total 2014 market size 167
Total 2019 market size 215
Forecast CAGR (2014-2019) 5.3%
Volume in billions of units
167bn total units sold
in 2014
Page 52
© Euromonitor International Ltd 2015. Applicable terms and conditions of use and the disclaimer at the front of this document apply.
52
0.0%
1.0%
2.0%
3.0%
4.0%
5.0%
6.0%
7.0%
8.0%
9.0%
10.0%
0.0
1.0
2.0
3.0
4.0
5.0
6.0
Carbonates Biscuits Yogurt andSour MilkProducts
Cigarettes Rice BakedGoods
Juice DrinkingMilk
Products
BottledWater
Chips/Crisps
Fo
recast
Vo
lum
e C
AG
R (
2014 –
2019)
Ab
so
lute
Vo
l. G
row
th (
bn
, 2014 –
2019)
Top 10 Product Categories by Absolute Volume Growth of Packaging (2014 – 2019)
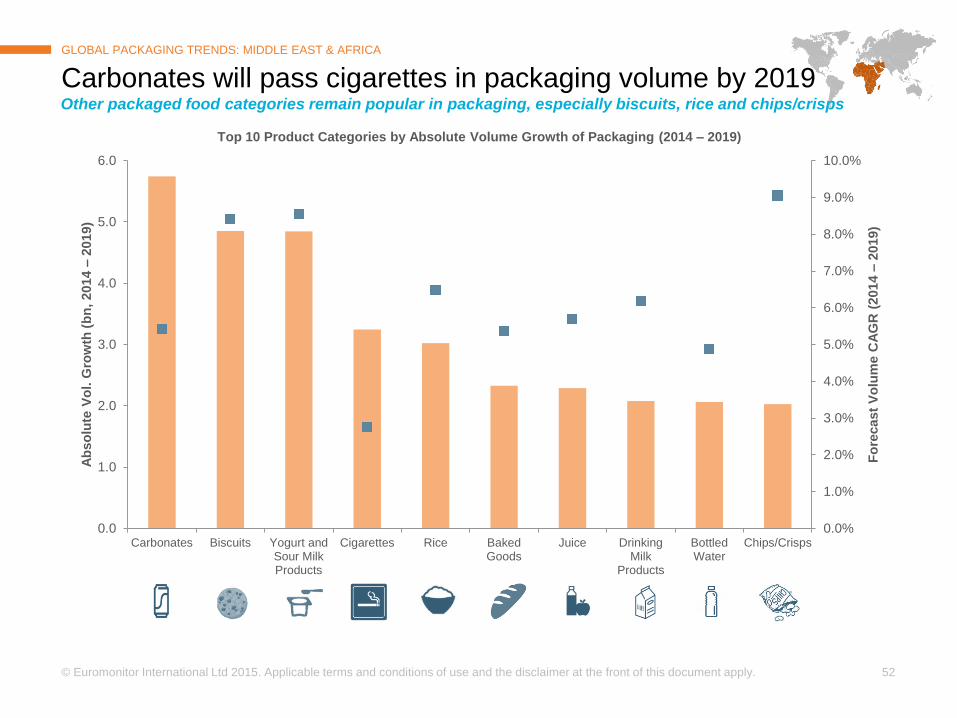
Carbonates will pass cigarettes in packaging volume by 2019
GLOBAL PACKAGING TRENDS: MIDDLE EAST & AFRICA
Other packaged food categories remain popular in packaging, especially biscuits, rice and chips/crisps
Page 53
© Euromonitor International Ltd 2015. Applicable terms and conditions of use and the disclaimer at the front of this document apply.
53
Top Pack Types by Volume Leading Categories CAGR
(2014-2019)
Volume (2014,
billions)
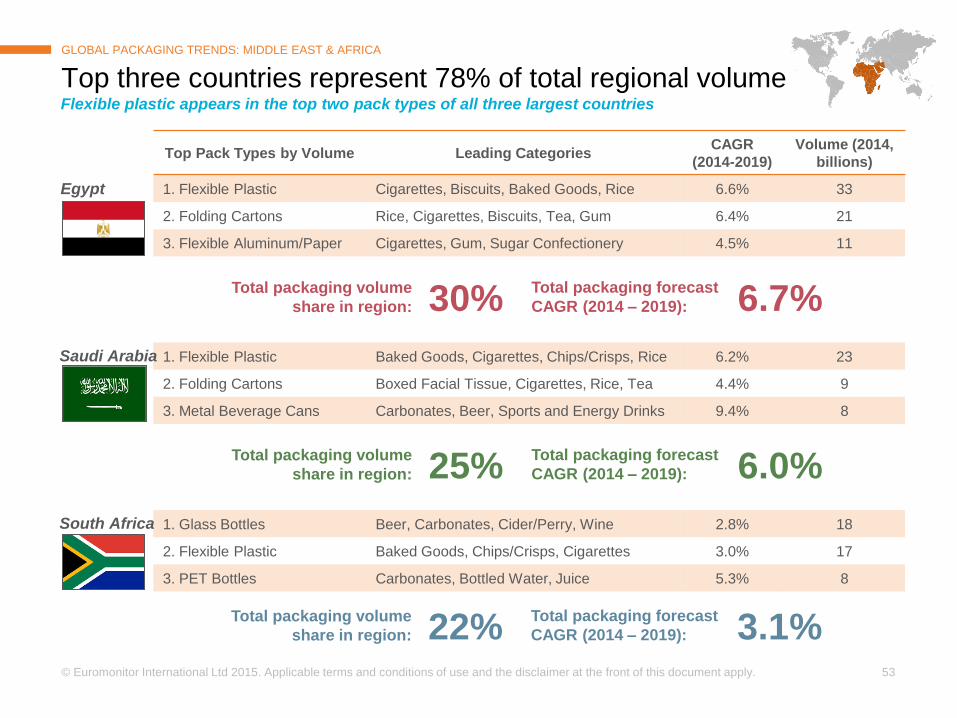
1. Flexible Plastic Cigarettes, Biscuits, Baked Goods, Rice 6.6% 33
2. Folding Cartons Rice, Cigarettes, Biscuits, Tea, Gum 6.4% 21
3. Flexible Aluminum/Paper Cigarettes, Gum, Sugar Confectionery 4.5% 11
1. Flexible Plastic Baked Goods, Cigarettes, Chips/Crisps, Rice 6.2% 23
2. Folding Cartons Boxed Facial Tissue, Cigarettes, Rice, Tea 4.4% 9
3. Metal Beverage Cans Carbonates, Beer, Sports and Energy Drinks 9.4% 8
1. Glass Bottles Beer, Carbonates, Cider/Perry, Wine 2.8% 18
2. Flexible Plastic Baked Goods, Chips/Crisps, Cigarettes 3.0% 17
3. PET Bottles Carbonates, Bottled Water, Juice 5.3% 8
Top three countries represent 78% of total regional volume
GLOBAL PACKAGING TRENDS: MIDDLE EAST & AFRICA
Saudi Arabia
Egypt
South Africa
Flexible plastic appears in the top two pack types of all three largest countries
Total packaging volume
share in region:
Total packaging forecast
CAGR (2014 – 2019): 30% 6.7%
Total packaging volume
share in region:
Total packaging forecast
CAGR (2014 – 2019): 25% 6.0%
Total packaging volume
share in region:
Total packaging forecast
CAGR (2014 – 2019): 22% 3.1%