31
Global Research November 2009 Equities Saudi Research & Marketing Group Saudi Arabia

Global Research
November 2009
Equities
Saudi Research & Marketing Group
Saud
i Ar
abia

Global Investment House KSCCGlobal Tower,P.O. Box 28807 Safat13149 KuwaitTel: (965) 22951000Fax: (965) 22951299Email: [email protected]://www.globalinv.net
Global Investment House stock market indices can be accessedfrom the Bloomberg page GLOHand from Reuters Page GLOB
Faisal Hasan, CFAHead of [email protected] No:(965) 22951270
Umar FaruquiFinancial [email protected] No:(965) 22951000
Mohammed Ali ShahFinancial [email protected] No:(966) 1 2199966 Ext. 951
Global Research - Saudi Arabia Global Investment House
�Saudi Research & Marketing GroupNovember 2009
Tickers:Research AB (Bloomberg)4210.SE (Reuters)
Listing:Saudi Stock Exchange (Tadawul)
Current Price:SR28.4 (1st November, 2009)
Fair Price:SR27.2
November 2009
Hold
Saudi Research & Marketing Group
Investment Summary
• Saudi Research and Marketing Group (SRMG) is the largest integrated publishing business in the Middle East. The group is vertically integrated over publishing, advertising, printing and distribution, specialized publishing and multimedia businesses enabling it to capture the synergies down the value chain. The company mainly operates in the Middle East, Europe and North Africa.
• SRMG has a total of 15 publications and is looking to add more publications to its profile. SRMG publications have a strong brand name and are circulated throughout the Middle East. These publications can be categorized into dailies, weeklies and monthlies. The publications also include English, Urdu and Malayalam language publications which target the specified group.
• The media industry is largely affected by the changes in the economic and demographic factors. The sustained surge in oil price since the year 2000, which saw oil prices reach record highs in 2008 led to rapid economic development in the oil-rich GCC countries. Property, financial services and telecom sector witnessed massive growth leading to sharp increase in spending on advertising.
• Population growth rates in the Middle East have historically been high. During the past 50 years the population has grown around an average of 2.6%. Though the population growth rate is likely to come down, it is likely to stay high compared to other regions. With over 300.0mn inhabitants in the Middle East, the region is home to a large market for media and advertising.
• The contraction in economies in 2009 is likely to lead a decrease in advertising expenditures by major corporations as they look to consolidate their positions by deferring projects and expansion plans. However, in the long run we expect advertising revenues to pick up as these countries continue to diversify their economies by investing in non-oil sectors.
• SRMG consolidated revenues have grown at a 2005-2008 CAGR of 8.1% to SR1.34bn. The increase in revenues has been driven by an increase in printing revenue at a 2005-2008 CAGR of 21.3% to 468.2mn and the introduction of specialized publishing services through Saudi Specialized Publishing Company. Specialized Publishing division managed to generate revenue of SR115.8mn in 2008 after generating SR28.6mn in 2007.
• Net income from continuing operations have grown steadily for SRMG at a 2005-2008 CAGR of 10.9% to SR277.2mn. The growth in income from continuing operations was

Global Research - Saudi Arabia Global Investment House
2 November 2009Saudi Research & Marketing Group
driven by growth in publishing, printing and advertising income in the backdrop of increase in number of publications along with high economic growth rate in the region.
• Net income has been relatively erratic with large one-off gains being realized. In 2007 Net profit increased by 40.1% largely due to a gain of SR161.2mn realized on IPO of Saudi Printing and Packaging Company.
• We expect total revenue to decline by 20.5% in 2009 to SR1.07bn as the global financial crisis and the ensuing global recession takes its toll on the media industry. We expect revenue from advertising division to be hit particularly hard as companies cut on their advertising budgets to counter the recession. Going forward, we expect total revenue to grow at a 2009-2012 CAGR of 10.3%. The revenue growth will be driven by Specialized Publications and Printing divisions.
• We expect income from core operations to decline by 74.7% in 2009 as revenues and margins fall. Going forward we expect the income from core operations to grow at a 2009-2012 CAGR of 47.7% partly due to low base and expected recovery in global economy.
• We initiate our coverage of SRMG with a ‘HOLD’ recommendation. We have used the Discounted Cash Flow Methodology (DCF) to arrive at a value of SR27.2 per share. The share at its current market price of SR28.4 (as on 1st November 2009) is trading at a premium of 4.4% to its fair value.
Table 01: Investment IndicatorsPrice as on 1st
November 2009 (SR)
Shares in issue
(mn)
Market Cap
(SR mn)
52-Week High/
Low
28.4 80.0 2,272 37.4 / 22.0
Year
Revenues
(SR Mn)
Net Profit
(SR Mn)
EPS
(SR)
BVPS
(SR)
ROAE
(%)
P/E
(x)
P/BV
(x)
2011E 1,326 139.4 1.74 20.9 8.5% 16.3 1.36
2010E 1,208 119.3 1.49 20.0 7.7% 19.1 1.42
2009 E 1,068 50.3 0.63 18.7 3.2% 45.2 1.52
2008 A 1,342 224.4 2.81 20.4 13.8% 10.7 1.47
Source: Annual Reports and Global Research Historical P/E & P/BV multiples pertain to respective year-end prices, while those for future years are based on closing prices on the Tadawul as of 1st November 2009
Chart 01: Share Price Performance
Source: Zawya and Global Research
4,0004,5005,0005,5006,0006,5007,0007,500
Oct-0
8
Nov-
08
Dec-
08
Jan-
09
Feb-
09
Mar
-09
Apr-0
9
May
-09
Jun-
09
Jul-0
9
Aug-
09
Sep-
09
2022242628303234363840
Tadawul (LHS) SRMG (RHS)
(SR)

Global Research - Saudi Arabia Global Investment House
November 2009 �Saudi Research & Marketing Group
Company Overview
Saudi Research and Marketing Group (SRMG) is a Joint Stock Company registered in Riyadh, Saudi Arabia. The company offered 30.0% of its share capital to the public on 8 April 2006. SRMG is the largest integrated publishing business in the Middle East. The group is vertically integrated over publishing, advertising, printing and distribution, special ized and multimedia businesses enabling it to capture the synergies down the value chain. The company mainly operates in the Middle East, Europe and North Africa.
Group History
1963 > Madina Printing & Publishing Company
1973 > Saudi Research & Publishing Company
1975 > Launch of Arab News
1978 > Launch of Asharq Al-Awsat
1980 > Launch of Al-Majalla Magazine - political weekly
1981 > Sayyidati- Women weekly
1983 > Saudi Distribution company
1987 > Al- Riyadiah - sports daily Basim - children weekly
1990 > Al-Khalijiah advertising
1992 > Al- Eqtissadiah- Business daily Al - Rajul - men high - life style monthly
1994 > Al- Jamila- women beauty & health monthly mag. > Urdu News - daily Urdu newspaper. > Malialam daily newspaper
1998 > Arab Media Company
1999 > Urdu Magazine
2004 > World Issues Magazine > Group acquires Hala Printing Press > Specialized Publishing unit established
2006 > Group launches IPOSource :SRMG website

Global Research - Saudi Arabia Global Investment House
� November 2009Saudi Research & Marketing Group
Chart 02: SRMG Group Structure
Source: SRMG and Global Research
Saudi Research andMarketing Group
Intellectual Holding Company for
advertisment and Publicity
Saudi Printing andPackagingCompany
Scientific Works Holding Company
Arab MediaCompany Limited
Saudi SpecialisedPublishing Companyand it’s subsidiaries
SaudiDistribution
company
SaudiCommercial
CompanyLimited
Saudi Researchand Publishing
Company
Al KhaleejiahAdvertising andPublic Relations
Moroccan Printing and Publishing
Company-Morocco
UniversityBook
Company
IPM Limited
HH Saudi Research and Marketing-UK
Sayidaty Limited-London
EmiratesPrinting,Publishing and Distribution Company
UAE
Sayidaty Products-London
Kuwait Group for Publishing &
Distribution Co.- KuwaitMoutamarat
Company-UAE
Satellites graphic company -UK
Saudi SpecialisedPublishing Company
Arab Net Technology Limited-
London
Asharq AlAwsat Limited-London
AL-Majalla Limited London
Medina PrintingCompany
Hala PrintingCompany
United Printing andPublishing Company Tayba Printing and
Publishing Company

Global Research - Saudi Arabia Global Investment House
November 2009 �Saudi Research & Marketing Group
Group Evolution
The journey of SRMG can be traced back to 1963 when the first company of the group, Al-Madina Printing and Publication Company was established. The company focused on printing of educational and government related material. Subsequently, the group moved into the publishing business by establishing Saudi Research and Publishing Company (SRPC). SRPC launched the first English newspaper in Saudi Arabia with the title ‘Arab News’ in 1975. Thereafter, it launched and acquired more publications. In 1983 the group stretched its reach into the distributing business by establishing Saudi Distribution Company. In 1990 the group ventured into advertising and media sales by creating Al-Khalijiah Company.
In October 2008 SRMG entered into an agreement with Saudi Telecom and the Malaysian company Astro to provide content services. This is a strategy to gain market advantage in a place where communication mediums are increasingly moving towards convergence. According to the agreement Saudi Telecom will contribute 51.0% of the SR280mn capital while SRMG will contribute 20.0%.
Main divisions
Saudi Research and Publishing Company (SRPC) - The Company was established in 1972. SRPC is the publisher and copyright owner of 14 publications which include six newspapers, four weekly magazines and other bi-monthly, monthly and quarterly magazines. In addition, around 20 supplement publications are issued.
AL-Khaleejiah - This Company was established in 1990 and is based in Jeddah. It has branch offices in Riyadh, Dhahran, London, Paris and Dubai. It is the group’s advertising and media sales arm. It is primarily involved in promoting the SRPC publications portfolio. However, it acts as a media agent for third-party publications as well.
Saudi Distribution Company - (SDC) SDC was established in 1983 and is the distribution arm of the group with a reach extending to 563 cities and towns. It has 45,000 newspaper and magazine outlets and has a fleet of more than 750 vehicles. The company plans to increase its fleet to 1,000 vehicles in the near future. SDC owns two distribution companies based in Kuwait and UAE. The company is also involved in distribution of audio/video cassettes, catalogues, leaflets, educational materials and provision of postal and express delivery services.
Saudi Printing and Packaging Company - (SPPC). This company, formerly known as Madina Printing and Publishing Company, was established in 1963. It is one of the oldest companies of the group. SPPC now specializes in the production of daily newsprints, magazines, perfect bound books and journals, commercial and packaging printing in different languages and styles. The company has five print houses of its own. SPPC has a capacity to print 150,000 copies of newspapers (32 pages) per hour, 5,000 copies of magazines (144 pages) per hour, 6,500 copies of books per hour and 10,000 sheets of carton per hour.
Global Research - Saudi Arabia Global Investment House
� November 2009Saudi Research & Marketing Group
Recent acquisitions and changes in group structure
During 2008 the group established Moutamarat Company for Exhibitions and Conferences with a capital of SR1.0mn. During the same period the Saudi Research and Publishing Company (SRPC) also transferred 5.0% of its share in Hala Printing Company and 50.0% share in Teabah Printing and Publishing Company to Saudi Printing and Packaging Company.
In addition, during 2008 Saudi Printing and Packaging Company acquired 100% of Al-Aoun Factory Commercial Labels & Flexible Packaging Company Ltd.
In the meeting held on 29 December 2008 the SRMG board approved of changing its subsidiary company Saudi Specialized Publishing Company (SPPC) from a Limited Liability company to Closed Joint stock Holding Company. The board also approved to set up Arab Multimedia Company, which will be a 100% subsidiary of SPPC. This is part of a larger plan which envisages restructuring the flagship entities and selling the loss making entities.
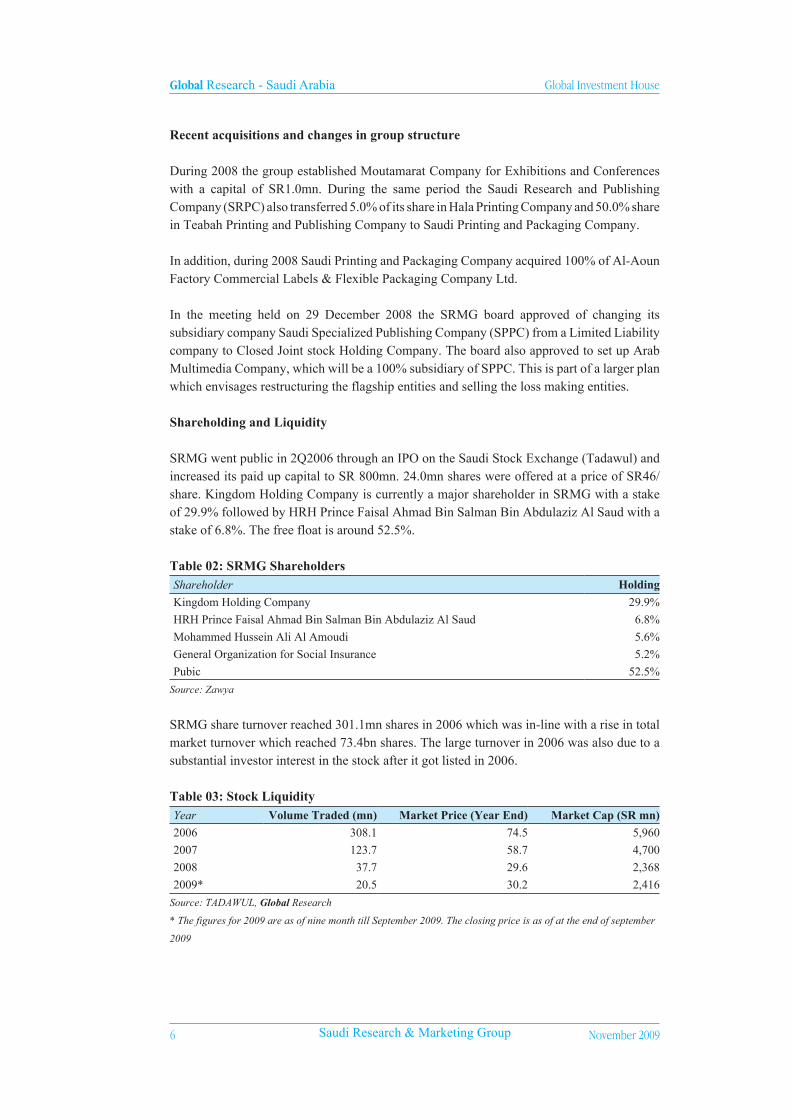
Shareholding and Liquidity
SRMG went public in 2Q2006 through an IPO on the Saudi Stock Exchange (Tadawul) and increased its paid up capital to SR 800mn. 24.0mn shares were offered at a price of SR46/share. Kingdom Holding Company is currently a major shareholder in SRMG with a stake of 29.9% followed by HRH Prince Faisal Ahmad Bin Salman Bin Abdulaziz Al Saud with a stake of 6.8%. The free float is around 52.5%.
Table 02: SRMG ShareholdersShareholder Holding
Kingdom Holding Company 29.9%
HRH Prince Faisal Ahmad Bin Salman Bin Abdulaziz Al Saud 6.8%
Mohammed Hussein Ali Al Amoudi 5.6%
General Organization for Social Insurance 5.2%
Pubic 52.5%
Source: Zawya
SRMG share turnover reached 301.1mn shares in 2006 which was in-line with a rise in total market turnover which reached 73.4bn shares. The large turnover in 2006 was also due to a substantial investor interest in the stock after it got listed in 2006. Table 03: Stock Liquidity Year Volume Traded (mn) Market Price (Year End) Market Cap (SR mn)
2006 308.1 74.5 5,960
2007 123.7 58.7 4,700
2008 37.7 29.6 2,368
2009* 20.5 30.2 2,416
Source: TADAWUL, Global Research
* The figures for 2009 are as of nine month till September 2009. The closing price is as of at the end of september
2009
Global Research - Saudi Arabia Global Investment House
November 2009 �Saudi Research & Marketing Group
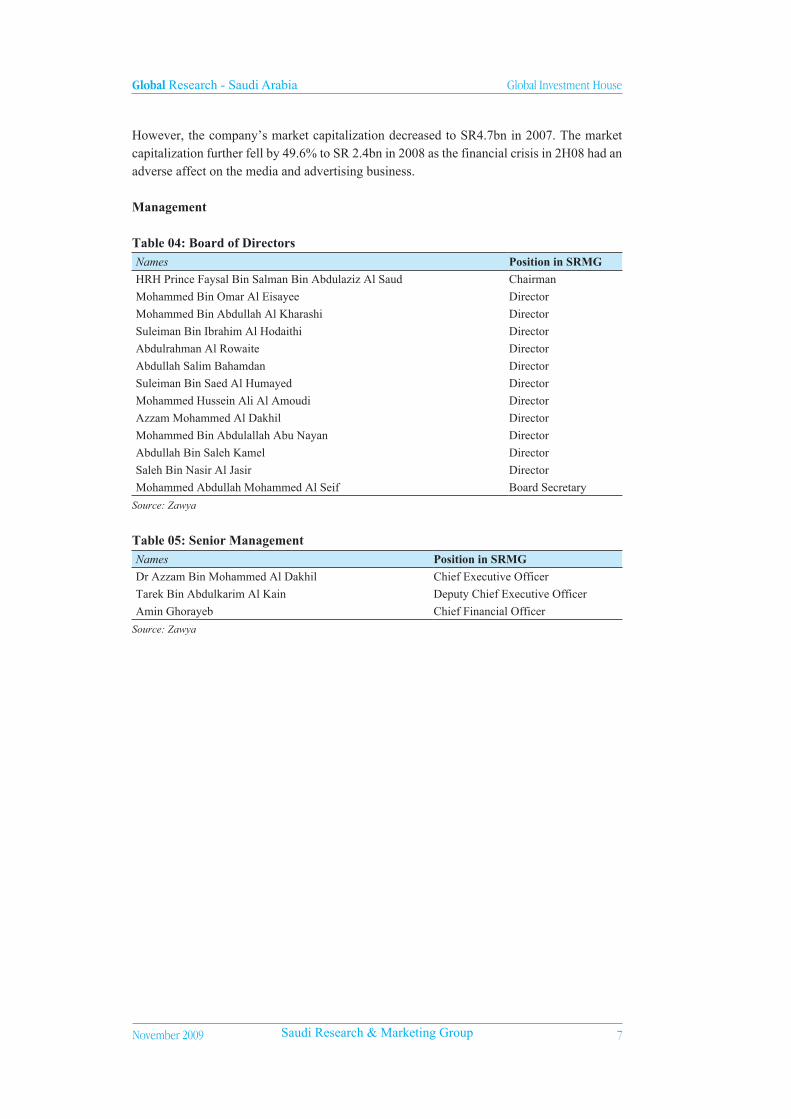
However, the company’s market capitalization decreased to SR4.7bn in 2007. The market capitalization further fell by 49.6% to SR 2.4bn in 2008 as the financial crisis in 2H08 had an adverse affect on the media and advertising business.
Management
Table 04: Board of DirectorsNames Position in SRMG
HRH Prince Faysal Bin Salman Bin Abdulaziz Al Saud Chairman
Mohammed Bin Omar Al Eisayee Director
Mohammed Bin Abdullah Al Kharashi Director
Suleiman Bin Ibrahim Al Hodaithi Director
Abdulrahman Al Rowaite Director
Abdullah Salim Bahamdan Director
Suleiman Bin Saed Al Humayed Director
Mohammed Hussein Ali Al Amoudi Director
Azzam Mohammed Al Dakhil Director
Mohammed Bin Abdulallah Abu Nayan Director
Abdullah Bin Saleh Kamel Director
Saleh Bin Nasir Al Jasir Director
Mohammed Abdullah Mohammed Al Seif Board Secretary
Source: Zawya
Table 05: Senior ManagementNames Position in SRMG
Dr Azzam Bin Mohammed Al Dakhil Chief Executive Officer
Tarek Bin Abdulkarim Al Kain Deputy Chief Executive Officer
Amin Ghorayeb Chief Financial Officer
Source: Zawya

Global Research - Saudi Arabia Global Investment House
� November 2009Saudi Research & Marketing Group
Media and Advertising Industry in the Middle East
Implications of Economic and Demographic FactorsThe media industry is largely affected by the changes in the economic and demographic factors. The sustained surge in oil price since the year 2000 which saw oil prices reach record highs in 2008 led to rapid economic development in the oil-rich GCC countries. Compared to the last boom, there was more focus on diversification of economic base this time around. Property, financial services and telecom sector witnessed massive growth leading to sharp increase in spending on advertising.
Chart 03: Real GDP Growth Rates
Source: Respective Central banks, Statistics bureaus & International organizationsNote: Data of some countries is provisional and may change
During 2H-2008 oil prices fell sharply to around US$35 per barrel reflecting the financial downturn which engulfed the whole world. OPEC basket price averaged approximately US$94.0 per barrel for 2008 largely due to high prices in 1H-2008. Oil prices are forecasted to average US$60.0 per barrel in 2009, 36.1% lower than 2008 levels while world oil demand is expected to fall by 1.6mn barrels per day in 2009. Such a sharp fall in oil prices along with production cuts by OPEC is likely to have a significant impact on economic growth in the GCC countries in the year 2009. The cumulative cuts imposed by OPEC in 2008 were 4.2mn barrels a day.
Oil revenues, capital investments and current account surpluses in the GCC region are likely to witness a sharp deceleration in 2009, which will have a significant impact on the real economic growth of these countries. 2009 will be a year of contraction in nominal GDP.
The contraction in economies in 2009 is likely to lead a decrease in advertising expenditures by major corporations as they look to consolidate their positions by deferring projects and expansion plans. However, in the long run we expect advertising revenues to pick up as these countries continue to diversify their economies by investing in non-oil sectors.
Population growth rates in the Middle East have historically been high. During the past 50 years the population has grown around an average of 2.6%. Though the population growth rate is likely to come down, it is likely to stay high compared to other regions. With over 300.0mn inhabitants in the Middle East, the region is home to a large market for media and advertising. Increase in disposable incomes and literacy rate is likely to lead to an increase in consumption of all types of media.
0.0% 2.0% 4.0% 6.0% 8.0% 10.0% 12.0% 14.0%
Saudi Arabia
UAE
Kuwait
Qatar
Bahrain
Oman
2006 2007 2008

Global Research - Saudi Arabia Global Investment House
November 2009 9Saudi Research & Marketing Group
Table 06: Demographic Profile % of total population 0-14 15-24 25-34 35-44 45 and above
Bahrain 27 17 14 16 26
Egypt 32 19 16 12 20
Jordan 33 20 18 14 15
Kuwait 27 20 27 12 14
Lebanon 27 18 18 16 21
Morocco 31 20 17 13 19
Oman 43 17 13 11 17
Qatar 23 17 15 15 31
Saudi Arabia 38 19 21 13 10
Tunisia 24 20 18 15 23
UAE 21 15 30 22 13
Yemen 46 21 14 7 12
Source: Arab Media Outlook 2008-2012
Population in the Middle Eastern countries is heavily tilted towards the younger age group. As can be seen in the table the young population between the ages of 0-25 make up for a large proportion of the overall population. In Saudi Arabia, Yemen, Oman, Morocco, Jordan and Egypt the amount of population lying in this age group exceeds 50.0%. Young people tend to spend more on media and communication particularly with the advent of new technologies and communication mediums.
Global Research - Saudi Arabia Global Investment House
�0 November 2009Saudi Research & Marketing Group
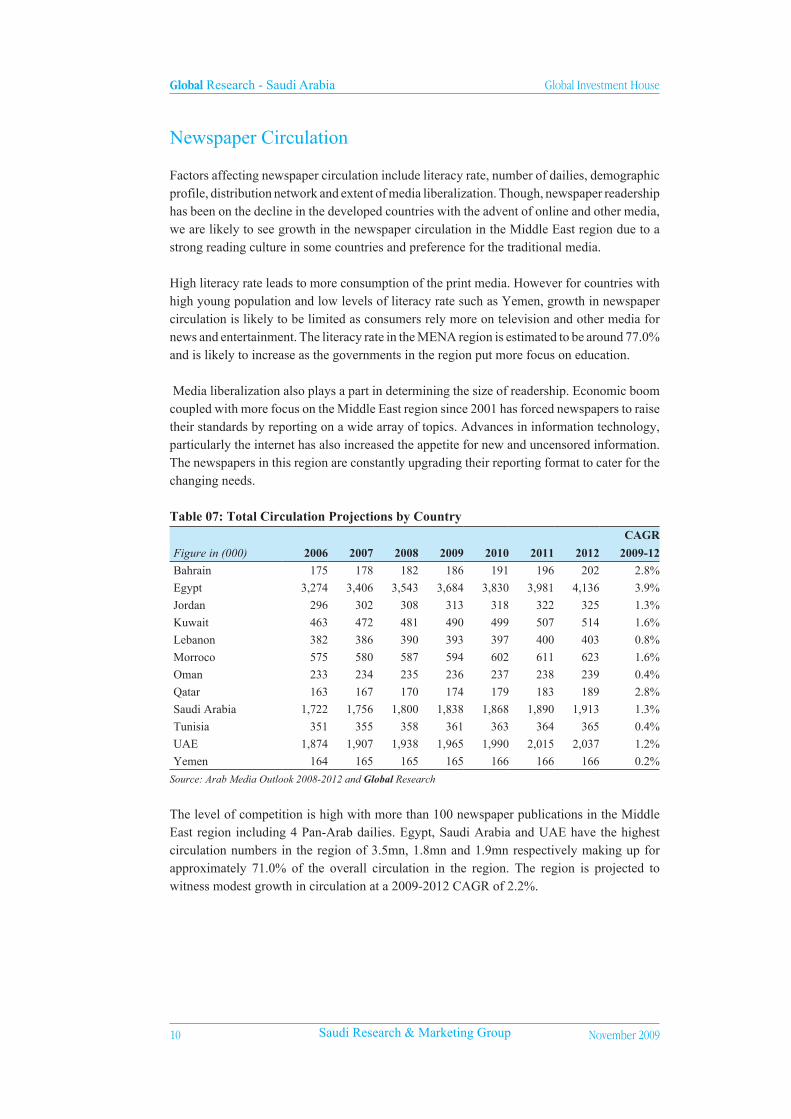
Newspaper Circulation
Factors affecting newspaper circulation include literacy rate, number of dailies, demographic profile, distribution network and extent of media liberalization. Though, newspaper readership has been on the decline in the developed countries with the advent of online and other media, we are likely to see growth in the newspaper circulation in the Middle East region due to a strong reading culture in some countries and preference for the traditional media. High literacy rate leads to more consumption of the print media. However for countries with high young population and low levels of literacy rate such as Yemen, growth in newspaper circulation is likely to be limited as consumers rely more on television and other media for news and entertainment. The literacy rate in the MENA region is estimated to be around 77.0% and is likely to increase as the governments in the region put more focus on education.
Media liberalization also plays a part in determining the size of readership. Economic boom coupled with more focus on the Middle East region since 2001 has forced newspapers to raise their standards by reporting on a wide array of topics. Advances in information technology, particularly the internet has also increased the appetite for new and uncensored information. The newspapers in this region are constantly upgrading their reporting format to cater for the changing needs.
Table 07: Total Circulation Projections by Country
Figure in (000) 2006 2007 2008 2009 2010 2011 2012
CAGR
2009-12
Bahrain 175 178 182 186 191 196 202 2.8%
Egypt 3,274 3,406 3,543 3,684 3,830 3,981 4,136 3.9%
Jordan 296 302 308 313 318 322 325 1.3%
Kuwait 463 472 481 490 499 507 514 1.6%
Lebanon 382 386 390 393 397 400 403 0.8%
Morroco 575 580 587 594 602 611 623 1.6%
Oman 233 234 235 236 237 238 239 0.4%
Qatar 163 167 170 174 179 183 189 2.8%
Saudi Arabia 1,722 1,756 1,800 1,838 1,868 1,890 1,913 1.3%
Tunisia 351 355 358 361 363 364 365 0.4%
UAE 1,874 1,907 1,938 1,965 1,990 2,015 2,037 1.2%
Yemen 164 165 165 165 166 166 166 0.2%
Source: Arab Media Outlook 2008-2012 and Global Research
The level of competition is high with more than 100 newspaper publications in the Middle East region including 4 Pan-Arab dailies. Egypt, Saudi Arabia and UAE have the highest circulation numbers in the region of 3.5mn, 1.8mn and 1.9mn respectively making up for approximately 71.0% of the overall circulation in the region. The region is projected to witness modest growth in circulation at a 2009-2012 CAGR of 2.2%.

Global Research - Saudi Arabia Global Investment House
November 2009 ��Saudi Research & Marketing Group
Advertising MENA region, particularly the GCC region witnessed high economic growth rates since the year 2000 which coincided with the oil boom. Advertising revenues surged as companies looked to target increasingly affluent and informed consumers. Launching of new projects and products also entailed massive advertising campaigns. The growth in advertising revenues was particularly high in 2008 when advertising revenues of all the countries in the Middle East and North African region increased by double digits. Saudi Arabia and Egypt which are by-far the largest countries in terms of population witnessed an increase in advertising revenues by 38.3% and 23.6% respectively.
The advertising budgets of companies are likely to be the first items to be cut in a recession. According to the report “Arab Media Outlook 2008-2012” the growth in advertising revenue is likely to slow down to 9.0% in the region in 2009 compared to growth of 35.0% witnessed in 2008. The forecast figures are subject to downward revision as the current global financial crisis has pushed major economies into recession which is having a spillover impact on other emerging economies.
Table 08: Total Advertising Revenue Projections by Country
(US$ mn) 2006 2007 2008 2009 2010 2011 2012
CAGR
2009-2012
Bahrain 69 74 83 85 89 92 96 4.1%
Egypt 366 437 540 682 793 879 977 12.7%
Jordan 77 86 104 116 129 143 157 10.6%
Kuwait 312 359 514 515 552 599 647 7.9%
Lebanon 171 186 212 230 246 270 298 9.0%
Morroco 200 231 278 295 322 354 389 9.7%
Oman 64 73 102 107 116 125 136 8.3%
Qatar 123 161 257 312 395 442 486 15.9%
Saudi Arabia 650 710 982 1,037 1,162 1,315 1,484 12.7%
Tunisia 24 27 33 34 36 39 43 8.1%
UAE 755 892 1,263 1,348 1,513 1,705 1,913 12.4%
Yemen 7 8 10 13 15 17 19 13.5%
Source: Arab Media Outlook 2008-2012 and Global Research
Saudi Arabia and UAE are the most important markets with estimated advertising revenues of US$982mn and US$1,263mn respectively in 2008. Saudi Arabia with its large size both in terms of its economy and population and UAE as a media hub are likely to continue attracting bulk of the advertising revenue in the region.
Newspapers remain the main recipients of advertising revenue in the Middle East accounting for approximately 40-50% of the overall advertising revenue with the exception of Morocco and Lebanon where television attracts more advertising revenue due to the fragmented nature of the newspaper industry and liberalized nature of the television industry.

Global Research - Saudi Arabia Global Investment House
�2 November 2009Saudi Research & Marketing Group
Saudi Print Media
Saudi newspapers are privately owned. However, the publishers and editors are appointed or approved by the government. Though, there are no legal restrictions on media freedom, self-censorship is heavily practiced.
GCC countries including Saudi Arabia have witnessed high economic growth rates which coincided with the oil boom. Diversification has led to increase in share of services sector in the Saudi economy, particularly the real estate, telecommunications and financial services sector, leading to an increase in advertising expenditure. Saudi Arabia with a huge population of around 26.0mn holds the largest potential. With a large young population and focus on lifting the literacy rate, these factors play in favor of the media industry. In addition, inflow of foreign workers in the Kingdom of Saudi Arabia is giving a boost to non-oil sectors including the media.
The circulation figures for newspapers are hard to find and verify due to unavailability of audited figures. The circulation figures can vary depending on the source. We have taken out the following figures from the BBC website.
Table 09: Circulation of major newspapers in Saudi ArabiaNewspaper Owner Founded Based CirculationAl Sharq Al Awsat SRMG 1978 London 235,000 Arab News SRMG 1975 Jeddah, Riyadh, Dharan 110,000 Al-Hayat Prince Khalid Bin Sultan Bin Abdul Aziz Al-Saud 1946 London 166,650 Al-Jazirah Al-Jazirah Press 1972 Riyadh 110,000Al-Watan Assir Establishment for Press and Publishing 2000 Abha -Okaz Okaz Organisation For Press and Publication 1960 Jeddah 110,000Saudi Gazette Okaz Organisation For Press and Publication 1976 Riyadh 14,400Al-Riyadh Al-Yamama Press Establishment 1964 Riyadh 150,000Al-Yaum Al-Yaum Organisation for printing and publishing 1965 Dammam -
Source: BBCNote: Due to non-availability of official circulation numbers, we have taken the figures from BBC news edition of December 2006 as the best estimate for current circulation.
Al Sharq Al Awsat, the flagship publication for SRMG, has the highest number of circulation of 235,000 copies per day. It competes with the other three Pan Arab dailies Al-Arab, Al-Hayat and Al-Quds al Arabi. Al-Hayat newspaper which is owned by Prince Khalid Bin Sultan Bin Abdul Aziz Al-Saud has a circulation of 166,650 copies per day. Al Qudus al Arab which is also based in London has a circulation of around 50,000 copies per day according to the newspaper itself. Arab news which is owned by SRMG is the largest circulating English newspaper in Saudi Arabia with a circulation of 110,000 copies. This newspaper competes with Saudi Gazette which is owned by Okaz and has a circulation of 14,400.
SRMG PublicationsSRMG has a total of 15 publications and is looking to add more publications to its kitty. These publications can be categorized into dailies, weeklies and monthlies. The publications also include English, Urdu and Malayalam language publications which target the specified group.
Daily PublicationsAl sharq Al Awsat - This newspaper was launched in London in 1978. It has come a long

Global Research - Saudi Arabia Global Investment House
November 2009 ��Saudi Research & Marketing Group
way since then and has established itself as one of the leading Arabic newspapers reporting on Pan-Arab and International affairs. It now has 20 correspondence offices around the globe.
Al-Eqtisadiah - This newspaper provides information on economic, financial and consumer affairs. It targets individuals in the financial services industry and individuals with large amounts of wealth to invest.
Arriyadiyah - This newspaper was the first sports newspaper in Saudi Arabia. It keeps the subscribers up-to-date with the happenings in the local and international sports arena.
Arab News - Arab News, which was launched in 1975, was the first English newspaper in Saudi Arabia. It covers local, international, financial and sports news and is targeted towards the affluent English speaking –expatriate community and English-educated Saudis.
Urdu News - This newspaper is targeted towards the Urdu-speaking expatriates from India and Pakistan.
Malayalam News - This newspaper is circulated in the Malayalam language to cater for the large South Indian Community in Saudi Arabia.
Weekly PublicationsSayidaty - This magazine is women-specific focusing on beauty, fashion and social issues. The magazine is published in Dubai and Beirut and distributed throughout the Middle-East, North Africa, Europe and America.
Al-Majalla - This magazine is published every Sunday. It brings the subscribers an overview of the main weekly news, analysis and exclusive reports with a focus on political affairs. The magazine also has news service arrangements with USA today, Time Magazine, World monitor and MEED.
Basim - This magazine is for the children between the ages of 8-15 years. It contains educational material, educational games, comic strips and other children related material.
Urdu Magazine - This magazine is for the Urdu-speaking community from India and Pakistan and covers a wide variety of topics.
Monthly PublicationsArrajol - This is an international lifestyle magazine targeting the elite section of the Arab society. It focuses on luxury items such as cars and yachts and investment opportunities.
Al-Jamila - Al-Jamilia is a women specific magazine focusing on beauty and fitness. It contains well researched articles on beauty and fitness tips and other articles of interest to women.
Hia - This magazine is also meant for women. It contains interviews with celebrities, fashion articles, travel, jewelers and other articles of interest to women.
Azia Sayadati - This magazine is published every three months. It contains news on fashion industry trends, fashion shows and designer wear.
Global Issues - This is a bi-monthly magazine focusing on world and regional affairs.

Global Research - Saudi Arabia Global Investment House
�� November 2009Saudi Research & Marketing Group
Table 10: SRMG PublicationsNewspaper Circulation
Al-Eqtisadiah 81,888
Al-Majalla 86,961
Arrajol 36,566
Sayidaty 143,351
Basim 31,833
Al-Jamila 69,393
Arriyadiyah 111,093
Al Sharq Al Awsat 235,000
Arab News 110,000
Urdu News -
Hia -
Malayalem News -
Azia Sayadati -
Global issues -
Urdu Magazine -
Source: INSEAD, BBC, ABC and Global Research
Al Sharq Al Awsat is the premier publication for SRMG with a circulation of 235,000. The beauty weekly magazine Sayidaty has also proved very popular amongst the Arab women with an estimated circulation of 143,351.
Chart 04: Saudi Newspaper Market Share
Source: INSEAD, BBC, ABC, Arab Media Outlook 2008-20012 and Global Research
SRMG newspapers which include Al-Eqtisadiah, Arriyadiyah, Arab News and Al Sharq Al Awsat lead the newspaper market with a share of approximately 29.3%.
Al-Hayat follows next with a market share of approximately 9.3%. Al-Hayat is a Pan Arab daily based in London. It launched its Saudi edition in 2005 which has enabled it to penetrate the Saudi market. It has three different editions for Riyadh, Damman and Jeddah.
Al-Riyadh, which is based in Riyadh, is identified as the newspaper of the Capital city. It has an estimated market share of 8.3%. It is one of the most respected newspapers for local and regional affairs.
Al-Hayat, 9%Al-Jazirah, 6%
Okaz, 6%
SRMG newspapers, 30%
AL-Riyadh, 8%
Others, 41%
Global Research - Saudi Arabia Global Investment House
November 2009 ��Saudi Research & Marketing Group
Al-Jazirah, which is owned by the Al-Jazirah press, has a market share of around 6.0%. The newspaper is an Arabic daily known for its daily supplements sports, economy, etc. Okaz also has a share of around 6.0%. It is owned by Okaz organization for Press and Publication. The newspaper is named after the famous Okaz market, one of the largest open markets in the pre-Islamic era.
The other newspapers include newspapers such as Al-Watan, Al-Madina and Al-Yaum among others. The market share figures are based on circulation figures which are not audited figures.
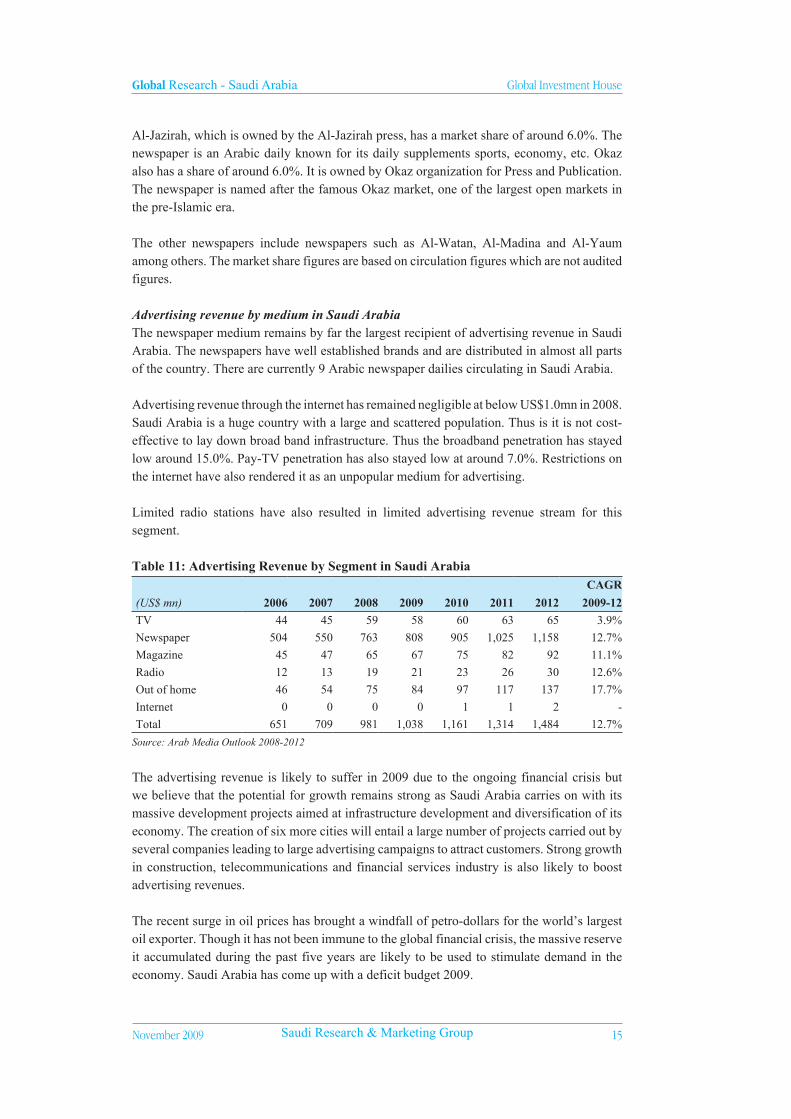
Advertising revenue by medium in Saudi ArabiaThe newspaper medium remains by far the largest recipient of advertising revenue in Saudi Arabia. The newspapers have well established brands and are distributed in almost all parts of the country. There are currently 9 Arabic newspaper dailies circulating in Saudi Arabia.
Advertising revenue through the internet has remained negligible at below US$1.0mn in 2008. Saudi Arabia is a huge country with a large and scattered population. Thus is it is not cost-effective to lay down broad band infrastructure. Thus the broadband penetration has stayed low around 15.0%. Pay-TV penetration has also stayed low at around 7.0%. Restrictions on the internet have also rendered it as an unpopular medium for advertising.
Limited radio stations have also resulted in limited advertising revenue stream for this segment.
Table 11: Advertising Revenue by Segment in Saudi Arabia
(US$ mn) 2006 2007 2008 2009 2010 2011 2012
CAGR
2009-12
TV 44 45 59 58 60 63 65 3.9%
Newspaper 504 550 763 808 905 1,025 1,158 12.7%
Magazine 45 47 65 67 75 82 92 11.1%
Radio 12 13 19 21 23 26 30 12.6%
Out of home 46 54 75 84 97 117 137 17.7%
Internet 0 0 0 0 1 1 2 -
Total 651 709 981 1,038 1,161 1,314 1,484 12.7%
Source: Arab Media Outlook 2008-2012
The advertising revenue is likely to suffer in 2009 due to the ongoing financial crisis but we believe that the potential for growth remains strong as Saudi Arabia carries on with its massive development projects aimed at infrastructure development and diversification of its economy. The creation of six more cities will entail a large number of projects carried out by several companies leading to large advertising campaigns to attract customers. Strong growth in construction, telecommunications and financial services industry is also likely to boost advertising revenues.
The recent surge in oil prices has brought a windfall of petro-dollars for the world’s largest oil exporter. Though it has not been immune to the global financial crisis, the massive reserve it accumulated during the past five years are likely to be used to stimulate demand in the economy. Saudi Arabia has come up with a deficit budget 2009.

Global Research - Saudi Arabia Global Investment House
�� November 2009Saudi Research & Marketing Group
SRMG Financial Overview
SRMG is a vertically integrated business connected through a network of subsidiaries. Inter-company sales contributed 30.7% to the overall revenue of the group in 2008. Inter-company sales are excluded from the analysis of the consolidated revenue since we are measuring the performance of the group as a whole.
Chart 05: SRMG Revenue (SR mn)
Source: SRMG and Global Research
Consolidated revenues have grown at a 2005-2008 CAGR of 8.09% to SR1.34bn. The increase in revenues has been driven by an increase in printing revenue at a 2005-2008 CAGR of 21.3% to 468.2mn and the introduction of specialized publishing services through Saudi Specialized Publishing Company. Specialized Publishing division managed to generate a revenue SR115.8mn in 2008 after generating SR28.6mn in 2007, which was the first year of its operations. Inter-company sales have come down to 30.7% in 2008 from 47.0% in 2005. This has largely been due to a decline in inter-company sales from SR941.8mn in 2005 to SR594.2mn in 2008.
Chart 06: Inter-Company Sales as a % of Total Sales
Source: SRMG and Global Research
-
200
400
600
800
1,000
1,200
1,400
1,600
2005 2006 2007 20080%
5%
10%
15%
20%
25%
Revenues Growth Rate
30%32%34%36%38%40%42%44%46%48%
2005 2006 2007 2008
Global Research - Saudi Arabia Global Investment House
November 2009 ��Saudi Research & Marketing Group
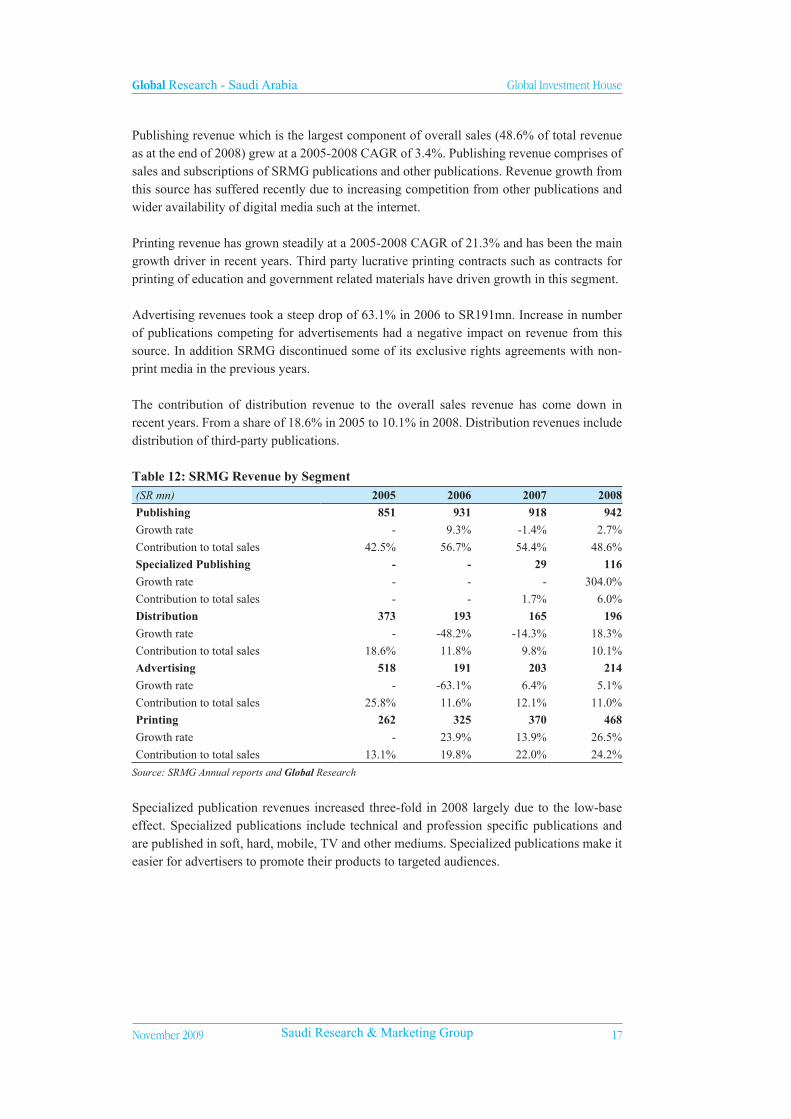
Publishing revenue which is the largest component of overall sales (48.6% of total revenue as at the end of 2008) grew at a 2005-2008 CAGR of 3.4%. Publishing revenue comprises of sales and subscriptions of SRMG publications and other publications. Revenue growth from this source has suffered recently due to increasing competition from other publications and wider availability of digital media such at the internet.
Printing revenue has grown steadily at a 2005-2008 CAGR of 21.3% and has been the main growth driver in recent years. Third party lucrative printing contracts such as contracts for printing of education and government related materials have driven growth in this segment.
Advertising revenues took a steep drop of 63.1% in 2006 to SR191mn. Increase in number of publications competing for advertisements had a negative impact on revenue from this source. In addition SRMG discontinued some of its exclusive rights agreements with non-print media in the previous years.
The contribution of distribution revenue to the overall sales revenue has come down in recent years. From a share of 18.6% in 2005 to 10.1% in 2008. Distribution revenues include distribution of third-party publications.
Table 12: SRMG Revenue by Segment(SR mn) 2005 2006 2007 2008
Publishing 851 931 918 942
Growth rate - 9.3% -1.4% 2.7%
Contribution to total sales 42.5% 56.7% 54.4% 48.6%
Specialized Publishing - - 29 116
Growth rate - - - 304.0%
Contribution to total sales - - 1.7% 6.0%
Distribution 373 193 165 196
Growth rate - -48.2% -14.3% 18.3%
Contribution to total sales 18.6% 11.8% 9.8% 10.1%
Advertising 518 191 203 214
Growth rate - -63.1% 6.4% 5.1%
Contribution to total sales 25.8% 11.6% 12.1% 11.0%
Printing 262 325 370 468
Growth rate - 23.9% 13.9% 26.5%
Contribution to total sales 13.1% 19.8% 22.0% 24.2%
Source: SRMG Annual reports and Global Research
Specialized publication revenues increased three-fold in 2008 largely due to the low-base effect. Specialized publications include technical and profession specific publications and are published in soft, hard, mobile, TV and other mediums. Specialized publications make it easier for advertisers to promote their products to targeted audiences.
Global Research - Saudi Arabia Global Investment House
�� November 2009Saudi Research & Marketing Group
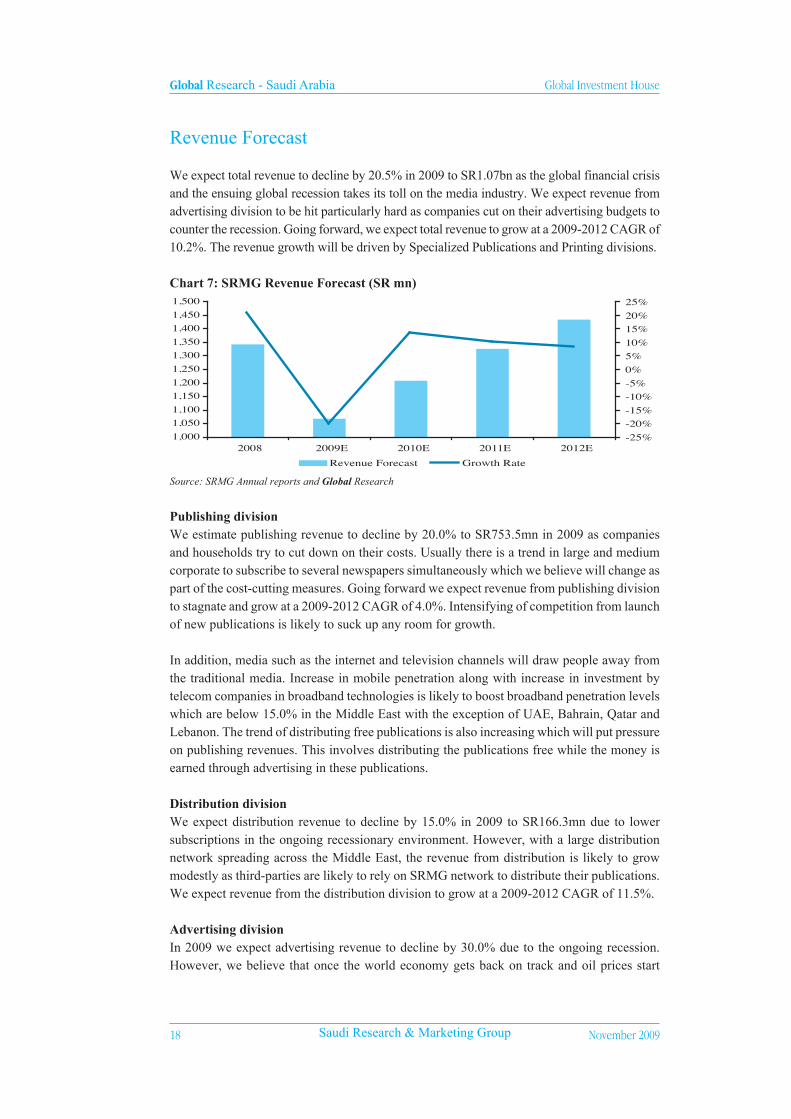
Revenue Forecast
We expect total revenue to decline by 20.5% in 2009 to SR1.07bn as the global financial crisis and the ensuing global recession takes its toll on the media industry. We expect revenue from advertising division to be hit particularly hard as companies cut on their advertising budgets to counter the recession. Going forward, we expect total revenue to grow at a 2009-2012 CAGR of 10.2%. The revenue growth will be driven by Specialized Publications and Printing divisions.
Chart 7: SRMG Revenue Forecast (SR mn)
Source: SRMG Annual reports and Global Research
Publishing divisionWe estimate publishing revenue to decline by 20.0% to SR753.5mn in 2009 as companies and households try to cut down on their costs. Usually there is a trend in large and medium corporate to subscribe to several newspapers simultaneously which we believe will change as part of the cost-cutting measures. Going forward we expect revenue from publishing division to stagnate and grow at a 2009-2012 CAGR of 4.0%. Intensifying of competition from launch of new publications is likely to suck up any room for growth.
In addition, media such as the internet and television channels will draw people away from the traditional media. Increase in mobile penetration along with increase in investment by telecom companies in broadband technologies is likely to boost broadband penetration levels which are below 15.0% in the Middle East with the exception of UAE, Bahrain, Qatar and Lebanon. The trend of distributing free publications is also increasing which will put pressure on publishing revenues. This involves distributing the publications free while the money is earned through advertising in these publications.
Distribution divisionWe expect distribution revenue to decline by 15.0% in 2009 to SR166.3mn due to lower subscriptions in the ongoing recessionary environment. However, with a large distribution network spreading across the Middle East, the revenue from distribution is likely to grow modestly as third-parties are likely to rely on SRMG network to distribute their publications. We expect revenue from the distribution division to grow at a 2009-2012 CAGR of 11.5%.
Advertising divisionIn 2009 we expect advertising revenue to decline by 30.0% due to the ongoing recession. However, we believe that once the world economy gets back on track and oil prices start
1,0001,0501,1001,1501,2001,2501,3001,3501,4001,4501,500
2008 2009E 2010E 2011E 2012E-25%-20%-15%-10%-5%0%5%10%15%20%25%
Revenue Forecast Growth Rate
Global Research - Saudi Arabia Global Investment House
November 2009 �9Saudi Research & Marketing Group
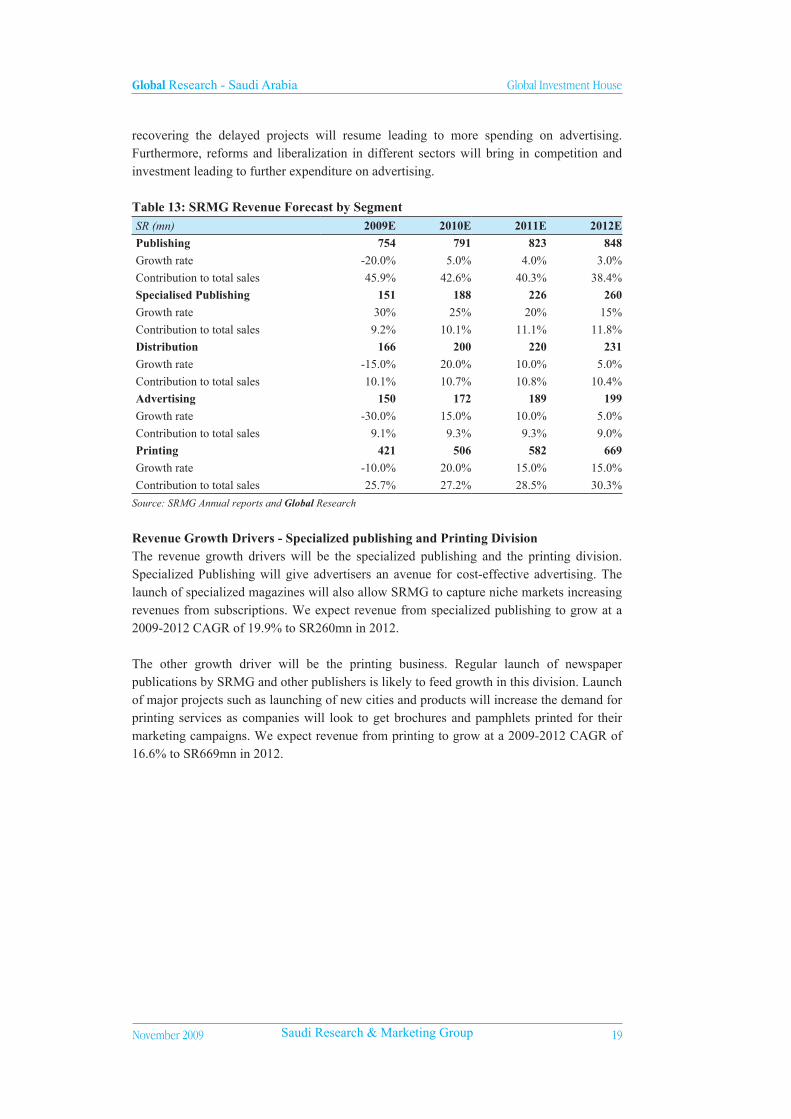
recovering the delayed projects will resume leading to more spending on advertising. Furthermore, reforms and liberalization in different sectors will bring in competition and investment leading to further expenditure on advertising.
Table 13: SRMG Revenue Forecast by SegmentSR (mn) 2009E 2010E 2011E 2012E
Publishing 754 791 823 848
Growth rate -20.0% 5.0% 4.0% 3.0%
Contribution to total sales 45.9% 42.6% 40.3% 38.4%
Specialised Publishing 151 188 226 260
Growth rate 30% 25% 20% 15%
Contribution to total sales 9.2% 10.1% 11.1% 11.8%
Distribution 166 200 220 231
Growth rate -15.0% 20.0% 10.0% 5.0%
Contribution to total sales 10.1% 10.7% 10.8% 10.4%
Advertising 150 172 189 199
Growth rate -30.0% 15.0% 10.0% 5.0%
Contribution to total sales 9.1% 9.3% 9.3% 9.0%
Printing 421 506 582 669
Growth rate -10.0% 20.0% 15.0% 15.0%
Contribution to total sales 25.7% 27.2% 28.5% 30.3%
Source: SRMG Annual reports and Global Research
Revenue Growth Drivers - Specialized publishing and Printing Division The revenue growth drivers will be the specialized publishing and the printing division. Specialized Publishing will give advertisers an avenue for cost-effective advertising. The launch of specialized magazines will also allow SRMG to capture niche markets increasing revenues from subscriptions. We expect revenue from specialized publishing to grow at a 2009-2012 CAGR of 19.9% to SR260mn in 2012. The other growth driver will be the printing business. Regular launch of newspaper publications by SRMG and other publishers is likely to feed growth in this division. Launch of major projects such as launching of new cities and products will increase the demand for printing services as companies will look to get brochures and pamphlets printed for their marketing campaigns. We expect revenue from printing to grow at a 2009-2012 CAGR of 16.6% to SR669mn in 2012.

Global Research - Saudi Arabia Global Investment House
20 November 2009Saudi Research & Marketing Group
Profitability and Margins
The net incomes from continuing operations have grown steadily for SRMG at a 2005-2008 CAGR of 10.5% to SR 277.2mn. The growth in income from continuing operations was driven by growth in publishing, printing and advertising income in the backdrop of increase in number of publications along with high economic growth rate in the region. The introduction of specialized publications also supported the increase in income from continuing operations.
Net income has been relatively erratic with large one-off gains being realized. In 2007 Net profit increased by 40.1% largely due to a gain of SR161.2mn realized on IPO of Saudi Printing and Packaging Company.
Chart 08: SRMG Net Profit (SR mn)
Source: SRMG Annual accounts and Global Research
Publishing margins have remained stable at around 16.0%. They did spike up-to 20.13% in 2006. However they have come down to 16.75% in 2008 in view of the increase in competition. Printing division with an overall contribution of 24.2% to sales has been one the main contributors to gross profit growth with a 2005-2008 CAGR of 14.5%. Printing revenues have received a boost due to a rise in number of publications and lucrative printing contracts. Advertising margins suddenly jumped to 57.62% in 2006 from 21.56% in 2005. This was largely due to increase in focus towards high-margin advertising avenues. Specialized Publications is the other high margin division. The gross profit margin of specialized publications increased to 37.24% in 2008 from 30.28% in 2007.
Table 14: SRMG Gross Margins by Segment2005 2006 2007 2008
Publishing 16.29% 20.13% 17.64% 16.75%
Specialized Publishing - - 30.28% 37.24%
Distribution 14.98% 27.64% 26.55% 22.73%
Advertising 21.56% 57.62% 58.55% 60.66%
Printing 35.78% 39.31% 36.23% 30.07%
Overall Gross margins 37.5% 44.2% 41.3% 38.0%
Source: SRMG Annual Accounts and Global Research
150
200
250
300
350
400
2005 2006 2007 2008
income from core operations Net profit

Global Research - Saudi Arabia Global Investment House
November 2009 2�Saudi Research & Marketing Group
Net profit and margin forecastWe expect income from core operations to decline by 74.7% to SR62.2mn in 2009 as revenues and margins fall. Going forward we expect income from core operations to grow at a 2009-2012 CAGR of 47.7% partly due to low base and expected recovery in global economy. According to the latest IMF forecast, the global economy will grow at 3.1% in 2010. In addition, various investments made by the group will start maturing which will prop up the bottom line.
Chart 09: SRMG Net Profit Forecast (SR mn)
Source: SRMG Annual Accounts and Global Research
We believe that Specialized Publishing division will continue to enjoy the benefit of high margins as it will enable target-specific advertising. In addition it will be able to capitalize on the benefit of niche markets. We have assumed gross margins of 35.0% from this division going forward. Advertising is also expected to continue to enjoying high margins of around 35.0% as SRMG is focusing on high value avenues.
Printing division is expected to have healthy margins of 30.0% going forward due to strong growth in demand for printing services. We have kept the distribution margins at 20.0% for 2009 and 22.0% going forward. Publishing division will see a decline of gross profit margins to around 15.0% from 2009 onwards as SRMG is likely to face stiff competition in this segment with the rise in number of other publications.
Table 15: SRMG Gross Margins by Segment2009E 2010E 2011E 2012E
Publishing 15.0% 15.0% 15.0% 15.0%
Specialised Publishing 35.0% 35.0% 35.0% 35.0%
Distribution 20.0% 22.0% 22.0% 22.0%
Advertising 33.0% 35.0% 35.0% 35.0%
Printing 30.0% 30.0% 30.0% 30.0%
Overall Gross margins 34.5% 35.8% 36.4% 36.9%
Source: SRMG Annual Accounts and Global Research
45
95
145
195
245
295
2008 2009E 2010E 2011E 2012E
income from core operations Net profit

Global Research - Saudi Arabia Global Investment House
22 November 2009Saudi Research & Marketing Group
9M-2009 Financial Results
SRMG reported a net profit of SR34.5mn in 9M-2009, a decline of 81.0% against the net profit of SR181.7mn in corresponding period last year. Revenue declined by 12.3% YoY as the financial crisis which precipitated the global recession had a negative impact on the media and publishing industry as a whole. Advertising revenues were hit hard particularly during the period as companies were forced to cut down their budgets to counter the recession. On the other hand selling, general and administrative expenses increased by 4.8% which squeezed the margins. SRMG announced a dividend of SR160.0mn or SR2.0 per share at the end of 1Q-2009.
Table 16: 9M-2009 Income Statement
SR (000) 9M-2008 9M-2009Net Sales 859,207 753,426CGS (509,659) (505,845)Gross Profit 349,548 247,580Selling, General & Administrative Expenses (180,228) (188,900)Net Profit After Zakat 181,675 34,482
Source: Zawya
Total assets of the company declined by 2.1% to SR2,405mn in 3Q-2009 compared to 2Q-2009. Fixed assets witnessed a rise of 3.8%. This is due to the fact that SRMG is carrying on with the investment program. The returns from these investments will start to mature in a few years time.
Table 17: Balance SheetSR (000) 30-Jun-09 30-Sep-09
Assets
Total Current Assets 952,518 843,081
Total Fixed Assets 1,504,122 1,561,524
Total Assets 2,456,640 2,404,605
Liabilities & Equity
Total Current Liabilities 597,912 586,810
Total Non-Current Liabilities 388,624 341,778
Other Liabilities 218,176 223,424
Total Liabilities 1,204,712 1,152,012
Shareholders’ Equity 1,251,928 1,252,593
Total Liabilities & Shareholders’ Equity 2,456,640 2,404,605
Source: Tadawul

Global Research - Saudi Arabia Global Investment House
November 2009 2�Saudi Research & Marketing Group
Valuation and Recommendation
We have used the Discounted Cash Flow Methodologies to value the company. Under this valuation we have used 4-year (FY2009-12) cash flow forecast for Saudi Research and Marketing Group. We have used constant growth Gordon Growth Model (GGM) to arrive at a terminal value for the company. The forecasted cash flow and the terminal value is then discounted at the Weighted Average Cost of Capital.
1-Risk free rate (RFR) of 5.5%2-Equity risk premium of 5.75%3-Beta of 1.04-Terminal growth rate of 3.0%5-Cost of debt of 7.0%
Table 18: DCF Calculations(SR 000) 2009 (E) 2010 (E) 2011 (E) 2012 (E)
FCF 214,847 92,438 122,040 144,723
Discounted Cash Flow 211,338 82,691 99,281 107,067
Terminal Value 2,141,112
Primary Value (discounted) 612,256
Terminal Value (discounted) 1,573,088
Total DCF Value 2,222,573
Debt 188,075 As of 3Q-2009
Add: Investments & cash equivalents 138,223 As of 3Q-2009
Total Equity Value 2,172,721
Shares Outstanding (000) 80,000
Fair Value Per Share 27.2
Source: Global Research
Sensitivity AnalysisWe have carried out a sensitivity analysis to show the impact of change in terminal growthrate and WACC on the company’s fair value.
Table 19: Sensitivity AnalysisTerminal Growth Rate
1.0% 2.0% 3.0% 4.0% 5.0%
WACC
8.0% 28.2 31.9 37.1 45.0 58.3
9.0% 24.9 27.7 31.3 36.5 44.2
10.0% 22.4 24.5 27.2 30.8 35.8
11.0% 20.3 22.0 24.0 26.7 30.2
12.0% 18.7 20.0 21.6 23.6 26.2
Source: Global Research
Based on assumptions given above we have derived the cost of equity of 11.3% and WACC of 10.0% using the CAPM method. The current market price of SR28.4 (as on 1st November 2009) is at a premium of 4.4% to its fair value of SR27.2. Thus we recommend a Hold on the stock.

Global Research - Saudi Arabia Global Investment House
2� November 2009Saudi Research & Marketing Group
BA
LA
NC
E S
HE
ET
SR 0
00SR
MG
2006
A20
07A
2008
A20
09E
2010
E20
11E
2012
EC
urre
nt a
sset
sC
ash
and
cash
equ
ival
ents
178
,561
4
60,5
51
140
,705
1
71,3
38
233
,750
2
87,5
19
350
,427
T
rade
rec
eiva
ble
294
,626
3
18,5
00
415
,337
2
88,2
35
326
,054
3
58,0
71
387
,267
Pr
epai
d ex
pens
es
76,
646
65,
488
84,
390
64,
052
72,
456
79,
571
86,
059
Inve
ntor
ies
132
,292
2
24,4
06
341
,742
2
24,1
83
253
,598
2
78,4
99
301
,208
Su
btot
al 6
82,1
25
1,0
68,9
45
982
,175
7
47,8
09
885
,859
1
,003
,660
1
,124
,961
Non
-cur
rent
ass
ets
Inve
stm
ent i
n as
soci
ated
com
pani
es 8
3,15
6 8
9,38
8 -
--
-
-
Prop
erty
,pla
nt a
nd e
quip
men
t 6
54,9
15
666
,398
8
32,5
21
939
,210
9
30,3
99
921
,088
9
11,2
77
Inta
ngib
le a
sset
s 3
64,9
79
362
,598
4
44,6
60
444
,347
4
44,0
34
443
,721
4
43,7
21
Subt
otal
1,1
03,0
50
1,1
18,3
83
1,2
77,1
82
1,3
83,5
57
1,3
74,4
33
1,3
64,8
09
1,3
54,9
98
Tot
al A
sset
s 1
,785
,175
2
,187
,329
2
,259
,356
2
,131
,366
2
,260
,292
2
,368
,469
2
,479
,959
Cur
rent
Lia
bilit
ies
Mur
abah
a an
d lo
an 1
0,00
0 63
,333
17
3,47
5 20
,000
20
,000
2
0,00
0 2
0,00
0 C
urre
nt P
of
Mur
abah
a an
d te
rm lo
ans
13,
333
--
--
-
-
Def
erre
d re
venu
e 1
4,36
5 1
7,92
9 1
1,14
6 1
0,67
5 1
2,07
6 1
3,26
2 1
4,34
3 O
blig
atio
ns u
nder
cap
ital l
ease
- C
urre
nt P
46,
800
37,
374
7,0
00
-
-
-
-
Def
erre
d ga
ins
on le
aseb
ack
tr.-
Cur
rent
P 6
0,57
8 4
8,04
8 3
,208
-
-
-
-
T
rade
pay
able
s 2
02,5
54
252
,727
2
53,7
26
279
,779
3
10,0
27
337
,391
3
61,9
99
Zak
at a
nd in
com
e ta
x 1
4,11
8 2
7,05
4 2
4,79
0 2
4,79
0 2
4,79
0 2
4,79
0 2
4,79
0 Su
btot
al 3
61,7
49
446
,466
4
73,3
45
335
,244
3
66,8
92
395
,443
4
21,1
32
Non
-cur
rent
liab
iliti
esL
ong-
term
mur
abah
a 2
0,00
0 6
,667
2
5,97
0 1
80,9
70
175
,970
1
70,9
70
165
,970
C
usto
mer
s de
posi
t 2
6,08
9 2
6,39
2 2
6,77
8 1
6,78
7 1
8,60
2 2
0,24
3 2
1,72
0 T
rade
pay
able
s 1
2,96
1 6
,232
1
1,15
0 1
0,49
2 1
1,62
6 1
2,65
2 1
3,57
5 O
blig
atio
ns u
nder
cap
ital l
ease
44,
374
7,0
00
-
-
-
-
-
Def
erre
d ga
ins
on s
ale
and
leas
ebac
k 5
1,25
6 3
,208
-
-
-
-
-
E
nd o
f se
rvic
e in
dem
nitie
s 7
3,85
5 7
9,85
0 8
6,86
9 9
3,41
0 9
0,57
1 9
9,46
4 1
07,5
74
Subt
otal
228
,535
1
29,3
49
150
,767
3
01,6
58
296
,768
3
03,3
30
308
,839
Shar
ehol
ders
equ
ity a
nd M
ISh
are
Cap
ital
800
,000
8
00,0
00
800
,000
8
00,0
00
800
,000
8
00,0
00
800
,000
St
atut
ory
rese
rve
112
,985
1
49,6
39
172
,084
1
77,1
12
189
,038
2
02,9
83
218
,851
C
ontr
actu
al r
eser
ve 2
2,15
1 4
0,47
8 5
1,70
1 5
4,21
4 6
0,17
8 6
7,15
0 7
5,08
4 U
nrea
lized
gai
n on
rev
al. O
f A
FS -
-
-
-
-
-
-
Fo
reig
n cu
rren
cy tr
ansl
atio
n ad
just
men
t 8
,283
9
,813
(
6,05
6) (
6,05
6) (
6,05
6) (
6,05
6) (
6,05
6)R
estr
icte
d go
vern
men
t gra
nt -
-
8
,361
8
,361
8
,361
8
,361
8
,361
R
etai
ned
earn
ings
251
,420
4
01,1
76
350
,163
2
32,8
63
301
,556
3
42,5
60
386
,801
Su
btot
al 1
,194
,839
1
,401
,106
1
,376
,252
1
,266
,495
1
,353
,077
1
,414
,997
1
,483
,041
M
inor
ity I
nter
est
53
210
,409
2
58,9
92
227
,969
2
43,5
54
254
,700
2
66,9
47
Tot
al e
quit
y 1
,194
,892
1
,611
,514
1
,635
,245
1
,494
,464
1
,596
,631
1
,669
,697
1
,749
,988
Tot
al E
quit
y an
d L
iabi
litie
s 1
,785
,175
2
,187
,329
2
,259
,356
2
,131
,366
2
,260
,292
2
,368
,469
2
,479
,959
Sour
ce:
SRM
G A
nnua
l Acc
ount
s an
d G
loba
l Res
earc
h
Global Research - Saudi Arabia Global Investment House
November 2009 2�Saudi Research & Marketing Group
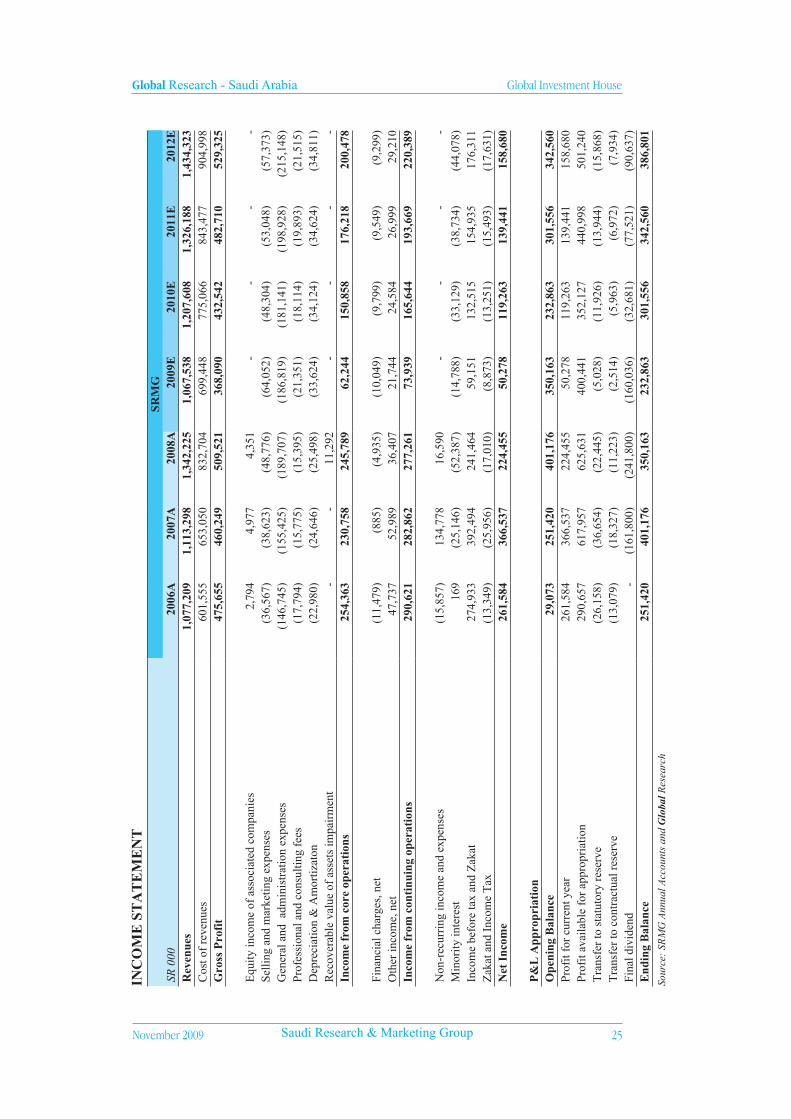
INC
OM
E S
TA
TE
ME
NT
SRM
GSR
000
2006
A20
07A
2008
A20
09E
2010
E20
11E
2012
ER
even
ues
1,0
77,2
09
1,1
13,2
98
1,3
42,2
25
1,0
67,5
38
1,2
07,6
08
1,3
26,1
88
1,4
34,3
23
Cos
t of
reve
nues
601
,555
6
53,0
50
832
,704
6
99,4
48
775
,066
8
43,4
77
904
,998
G
ross
Pro
fit
475
,655
4
60,2
49
509
,521
3
68,0
90
432
,542
4
82,7
10
529
,325
Equ
ity in
com
e of
ass
ocia
ted
com
pani
es 2
,794
4
,977
4
,351
-
-
-
-
Se
lling
and
mar
ketin
g ex
pens
es (
36,5
67)
(38
,623
) (
48,7
76)
(64
,052
) (
48,3
04)
(53
,048
) (
57,3
73)
Gen
eral
and
adm
inis
trat
ion
expe
nses
(14
6,74
5) (
155,
425)
(18
9,70
7)(1
86,8
19)
(181
,141
)(1
98,9
28)
(215
,148
)Pr
ofes
sion
al a
nd c
onsu
lting
fee
s (
17,7
94)
(15
,775
) (
15,3
95)
(21
,351
) (
18,1
14)
(19
,893
) (
21,5
15)
Dep
reci
atio
n &
Am
ortiz
aton
(22
,980
) (
24,6
46)
(25
,498
) (
33,6
24)
(34
,124
) (
34,6
24)
(34
,811
)R
ecov
erab
le v
alue
of
asse
ts im
pair
men
t -
-
11,
292
--
--
Inco
me
from
cor
e op
erat
ions
254
,363
2
30,7
58
245
,789
6
2,24
4 1
50,8
58
176
,218
2
00,4
78
Fina
ncia
l cha
rges
, net
(11
,479
) (
885)
(4,
935)
(10,
049)
(9,7
99)
(9,5
49)
(9,2
99)
Oth
er in
com
e, n
et 4
7,73
7 5
2,98
9 3
6,40
7 2
1,74
4 2
4,58
4 2
6,99
9 2
9,21
0 In
com
e fr
om c
onti
nuin
g op
erat
ions
290
,621
2
82,8
62
277
,261
7
3,93
9 1
65,6
44
193
,669
2
20,3
89
Non
-rec
urri
ng in
com
e an
d ex
pens
es (
15,8
57)
134
,778
1
6,59
0 -
-
-
-
M
inor
ity in
tere
st 1
69
(25
,146
) (
52,3
87)
(14
,788
) (
33,1
29)
(38
,734
) (
44,0
78)
Inco
me
befo
re ta
x an
d Z
akat
274
,933
3
92,4
94
241
,464
5
9,15
1 1
32,5
15
154
,935
1
76,3
11
Zak
at a
nd I
ncom
e T
ax (
13,3
49)
(25
,956
) (
17,0
10)
(8,
873)
(13
,251
) (
15,4
93)
(17
,631
)N
et I
ncom
e 2
61,5
84
366
,537
2
24,4
55
50,
278
119
,263
1
39,4
41
158
,680
P&
L A
ppro
pria
tion
Ope
ning
Bal
ance
29,
073
251
,420
4
01,1
76
350
,163
2
32,8
63
301
,556
3
42,5
60
Prof
it fo
r cu
rren
t yea
r 2
61,5
84
366
,537
2
24,4
55
50,
278
119
,263
1
39,4
41
158
,680
Pr
ofit
avai
labl
e fo
r ap
prop
riat
ion
290
,657
6
17,9
57
625
,631
4
00,4
41
352
,127
4
40,9
98
501
,240
T
rans
fer
to s
tatu
tory
res
erve
(26
,158
) (
36,6
54)
(22
,445
) (
5,02
8) (
11,9
26)
(13
,944
) (
15,8
68)
Tra
nsfe
r to
con
trac
tual
res
erve
(13
,079
) (
18,3
27)
(11
,223
) (
2,51
4) (
5,96
3) (
6,97
2) (
7,93
4)Fi
nal d
ivid
end
-
(16
1,80
0) (
241,
800)
(16
0,03
6) (
32,6
81)
(77
,521
) (
90,6
37)
End
ing
Bal
ance
251
,420
4
01,1
76
350
,163
2
32,8
63
301
,556
3
42,5
60
386
,801
Sour
ce:
SRM
G A
nnua
l Acc
ount
s an
d G
loba
l Res
earc
h
Global Research - Saudi Arabia Global Investment House
2� November 2009Saudi Research & Marketing Group
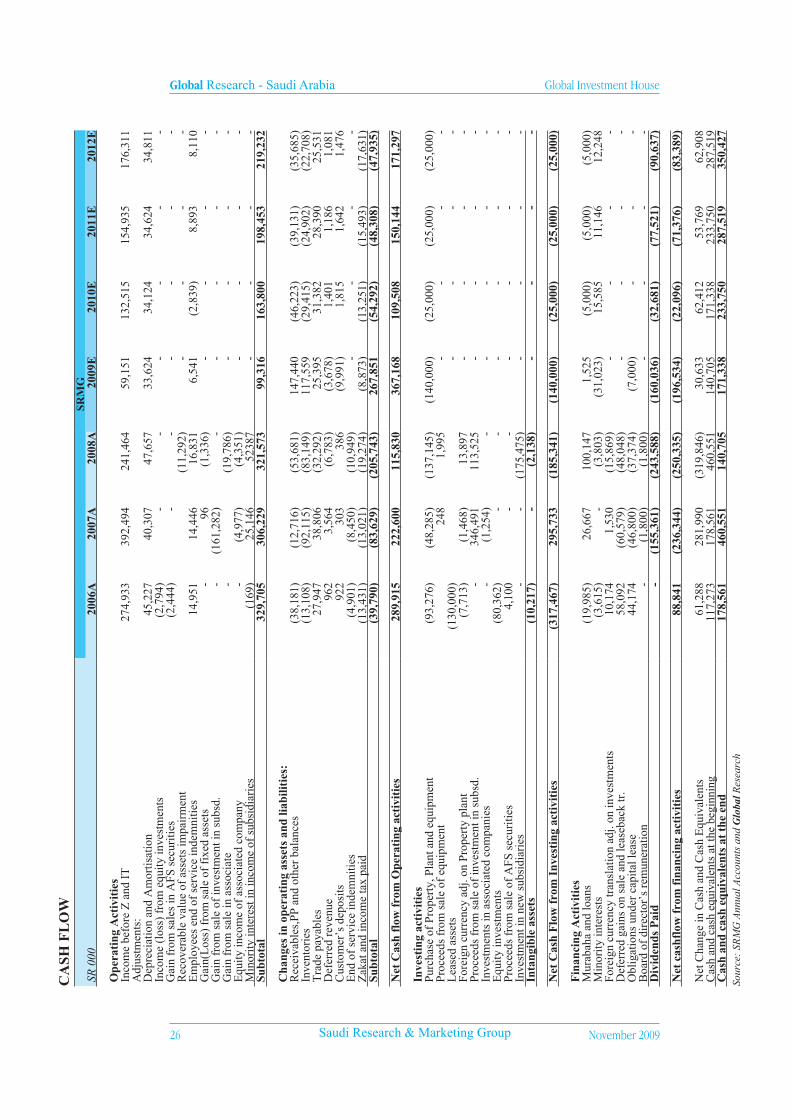
CA
SH F
LO
WSR
MG
SR 0
0020
06A
2007
A20
08A
2009
E20
10E
2011
E20
12E
Ope
rati
ng A
ctiv
itie
sIn
com
e be
fore
Z a
nd I
T 2
74,9
33
392
,494
2
41,4
64
59,
151
132
,515
1
54,9
35
176
,311
A
djus
tmen
ts:
Dep
reci
atio
n an
d A
mor
tisat
ion
45,
227
40,
307
47,6
57
33,6
24
34,1
24
34,6
24
34,
811
Inco
me
(los
s) f
rom
equ
ity in
vest
men
ts (
2,79
4) -
-
--
--
Gai
n fr
om s
ales
in A
FS s
ecur
ities
(2,
444)
-
--
--
-R
ecov
erab
le v
alue
of
asse
ts im
pair
men
t (
11,2
92)
--
--
Em
ploy
ees
end
of s
ervi
ce in
dem
nitie
s 1
4,95
1 1
4,44
6 1
6,83
1 6
,541
(
2,83
9) 8
,893
8
,110
G
ain(
Los
s) f
rom
sal
e of
fix
ed a
sset
s -
9
6 (1
,336
)-
--
-G
ain
from
sal
e of
inve
stm
ent i
n su
bsd.
-
(16
1,28
2)-
--
--
Gai
n fr
om s
ale
in a
ssoc
iate
-
(19,
786)
--
--
Equ
ity in
com
e of
ass
ocia
ted
com
pany
-
(4,
977)
(4,3
51)
--
--
Min
ority
inte
rest
in in
com
e of
sub
sidi
arie
s (
169)
25,
146
5238
7-
--
-Su
btot
al 3
29,7
05
306
,229
3
21,5
73
99,
316
163
,800
1
98,4
53
219
,232
Cha
nges
in o
pera
ting
ass
ets
and
liabi
litie
s:R
ecei
vabl
es,P
P an
d ot
her
bala
nces
(38
,181
) (
12,7
16)
(53
,681
) 1
47,4
40
(46
,223
) (
39,1
31)
(35,
685)
Inve
ntor
ies
(13
,108
) (
92,1
15)
(83
,149
) 1
17,5
59
(29
,415
) (
24,9
02)
(22,
708)
Tra
de p
ayab
les
27,
947
38,
806
(32
,292
) 2
5,39
5 3
1,38
2 2
8,39
0 2
5,53
1 D
efer
red
reve
nue
962
3
,564
(
6,78
3) (
3,67
8) 1
,401
1
,186
1
,081
C
usto
mer
’s d
epos
its 9
22
303
38
6 (
9,99
1) 1
,815
1
,642
1
,476
E
nd o
f se
rvic
e in
dem
nitie
s (
4,90
1) (
8,45
0)(1
0,94
9)-
--
-Z
akat
and
inco
me
tax
paid
(13
,431
) (
13,0
21)
(19
,274
) (
8,87
3) (
13,2
51)
(15
,493
) (
17,6
31)
Subt
otal
(39
,790
) (
83,6
29)
(20
5,74
3) 2
67,8
51
(54
,292
) (
48,3
08)
(47
,935
)
Net
Cas
h fl
ow f
rom
Ope
rati
ng a
ctiv
itie
s 2
89,9
15
222
,600
1
15,8
30
367
,168
1
09,5
08
150
,144
1
71,2
97
Inve
stin
g ac
tivi
ties
Purc
hase
of
Prop
erty
, Pla
nt a
nd e
quip
men
t (
93,2
76)
(48
,285
) (
137,
145)
(14
0,00
0) (
25,0
00)
(25
,000
) (
25,0
00)
Proc
eeds
fro
m s
ale
of e
quip
men
t 2
48
1,9
95
--
--
Lea
sed
asse
ts (
130,
000)
--
--
Fore
ign
curr
ency
adj
. on
Prop
erty
pla
nt
(7,
713)
(1,
468)
13,
897
--
--
Proc
eeds
fro
m s
ale
of in
vest
men
t in
subs
d. -
3
46,4
91
113
,525
-
--
-In
vest
men
ts in
ass
ocia
ted
com
pani
es -
(
1,25
4)-
--
--
Equ
ity in
vest
men
ts (
80,3
62)
-
--
--
-Pr
ocee
ds f
rom
sal
e of
AFS
sec
uriti
es 4
,100
-
-
--
--
Inve
stm
ent i
n ne
w s
ubsi
diar
ies
-
-
(175
,475
)-
--
-In
tang
ible
ass
ets
(10
,217
) -
(2
,138
)-
--
-
Net
Cas
h F
low
fro
m I
nves
ting
act
ivit
ies
(31
7,46
7) 2
95,7
33
(18
5,34
1) (
140,
000)
(25
,000
) (
25,0
00)
(25
,000
)
Fin
anci
ng A
ctiv
itie
sM
urab
aha
and
loan
s (
19,9
85)
26,
667
100,
147
1,52
5 (5
,000
)(5
,000
) (
5,00
0)M
inor
ity in
tere
sts
(3,
615)
-
(3,
803)
(31
,023
) 1
5,58
5 1
1,14
6 1
2,24
8 Fo
reig
n cu
rren
cy tr
ansl
atio
n ad
j. on
inve
stm
ents
10,
174
1,5
30
(15
,869
)-
--
-D
efer
red
gain
s on
sal
e an
d le
aseb
ack
tr.
58,
092
(60
,579
) (
48,0
48)
--
--
Obl
igat
ions
und
er c
apita
l lea
se 4
4,17
4 (
46,8
00)
(37
,374
) (
7,00
0)-
--
Boa
rd o
f di
rect
or’s
rem
uner
atio
n -
(
1,80
0) (
1,80
0)-
--
-D
ivid
ends
Pai
d -
(
155,
361)
(24
3,58
8) (
160,
036)
(32
,681
) (
77,5
21)
(90
,637
)
Net
cas
hflo
w f
rom
fin
anci
ng a
ctiv
itie
s 8
8,84
1 (
236,
344)
(25
0,33
5) (
196,
534)
(22
,096
) (
71,3
76)
(83
,389
)
Net
Cha
nge
in C
ash
and
Cas
h E
quiv
alen
ts 6
1,28
8 2
81,9
90
(31
9,84
6) 3
0,63
3 6
2,41
2 5
3,76
9 6
2,90
8 C
ash
and
cash
equ
ival
ents
at t
he b
egin
ning
117
,273
1
78,5
61
460
,551
1
40,7
05
171
,338
2
33,7
50
287
,519
C
ash
and
cash
equ
ival
ents
at
the
end
178
,561
4
60,5
51
140
,705
1
71,3
38
233
,750
2
87,5
19
350
,427
Sour
ce:
SRM
G A
nnua
l Acc
ount
s an
d G
loba
l Res
earc
h
Global Research - Saudi Arabia Global Investment House
November 2009 2�Saudi Research & Marketing Group
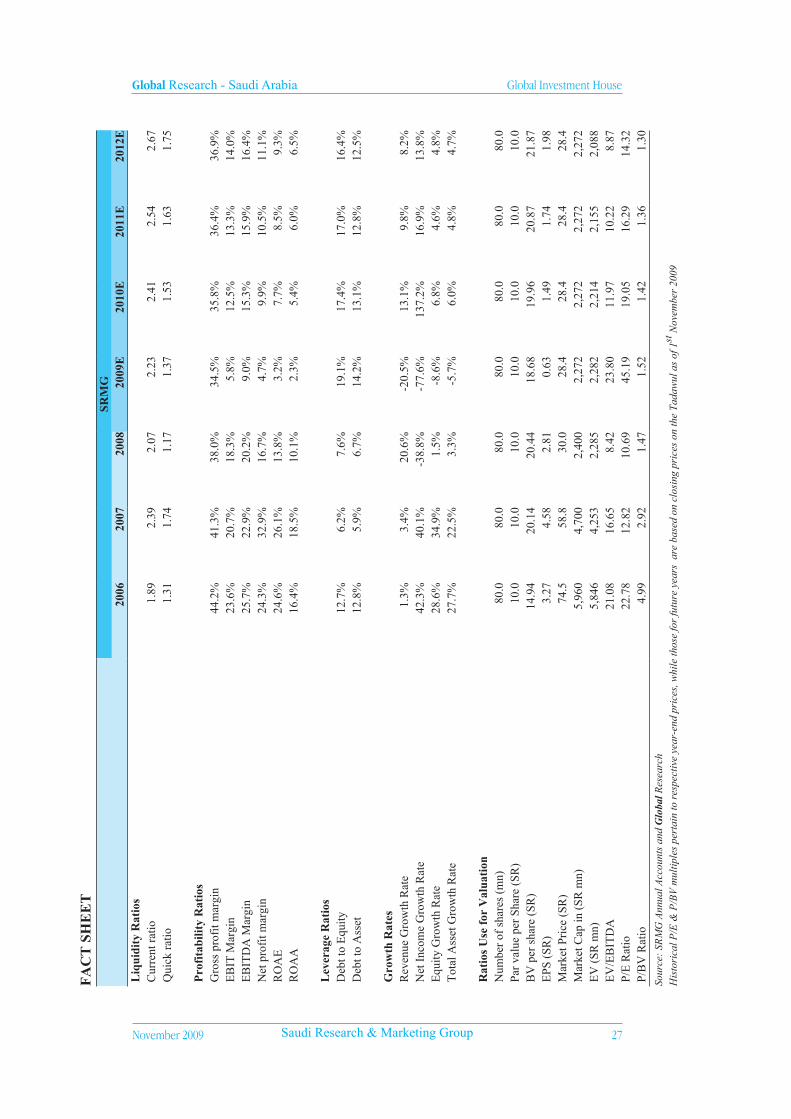
FA
CT
SH
EE
TSR
MG
2006
2007
2008
2009
E20
10E
2011
E20
12E
Liq
uidi
ty R
atio
sC
urre
nt r
atio
1.89
2.39
2.07
2.23
2.41
2.54
2.67
Qui
ck r
atio
1.31
1.74
1.17
1.37
1.53
1.63
1.75
Pro
fita
bilit
y R
atio
sG
ross
pro
fit m
argi
n44
.2%
41.3
%38
.0%
34.5
%35
.8%
36.4
%36
.9%
EB
IT M
argi
n23
.6%
20.7
%18
.3%
5.8%
12.5
%13
.3%
14.0
%E
BIT
DA
Mar
gin
25.7
%22
.9%
20.2
%9.
0%15
.3%
15.9
%16
.4%
Net
pro
fit m
argi
n24
.3%
32.9
%16
.7%
4.7%
9.9%
10.5
%11
.1%
RO
AE
24.6
%26
.1%
13.8
%3.
2%7.
7%8.
5%9.
3%R
OA
A16
.4%
18.5
%10
.1%
2.3%
5.4%
6.0%
6.5%
Lev
erag
e R
atio
sD
ebt t
o E
quity
12.7
%6.
2%7.
6%19
.1%
17.4
%17
.0%
16.4
%D
ebt t
o A
sset
12.8
%5.
9%6.
7%14
.2%
13.1
%12
.8%
12.5
%
Gro
wth
Rat
esR
even
ue G
row
th R
ate
1.3%
3.4%
20.6
%-2
0.5%
13.1
%9.
8%8.
2%N
et I
ncom
e G
row
th R
ate
42.3
%40
.1%
-38.
8%-7
7.6%
137.
2%16
.9%
13.8
%E
quity
Gro
wth
Rat
e28
.6%
34.9
%1.
5%-8
.6%
6.8%
4.6%
4.8%
Tot
al A
sset
Gro
wth
Rat
e27
.7%
22.5
%3.
3%-5
.7%
6.0%
4.8%
4.7%
Rat
ios
Use
for
Val
uati
onN
umbe
r of
sha
res
(mn)
80.0
80.0
80.0
80.0
80.0
80.0
80.0
Par
valu
e pe
r Sh
are
(SR
)10
.010
.010
.010
.010
.010
.010
.0B
V p
er s
hare
(SR
)14
.94
20.1
420
.44
18.6
819
.96
20.8
721
.87
EPS
(SR
)3.
274.
582.
810.
631.
491.
741.
98M
arke
t Pri
ce (
SR)
74.5
58.8
30.0
28.4
28.4
28.4
28.4
Mar
ket C
ap in
(SR
mn)
5,9
60
4,7
00
2,4
00
2,2
72
2,2
72
2,2
72
2,2
72
EV
(SR
mn)
5,8
46
4,2
53
2,2
85
2,2
82
2,2
14
2,1
55
2,0
88
EV
/EB
ITD
A21
.08
16.6
58.
4223
.80
11.9
710
.22
8.87
P/E
Rat
io22
.78
12.8
210
.69
45.1
919
.05
16.2
914
.32
P/B
V R
atio
4.99
2.92
1.47
1.52
1.42
1.36
1.30
Sour
ce:
SRM
G A
nnua
l Acc
ount
s an
d G
loba
l Res
earc
hH
isto
rica
l P/E
& P
/BV
mul
tiple
s pe
rtai
n to
res
pect
ive
year
-end
pri
ces,
whi
le th
ose
for
futu
re y
ears
are
bas
ed o
n cl
osin
g pr
ices
on
the
Tada
wul
as
of 1
st N
ovem
ber
2009

Company
Saudi Research &Marketing Group - SRMG
Recommendation
Hold
Tickers
Research AB (Bloomberg)4210.SE (Reuters)
Price (SR)
SR28.4
Disclosure
1,10
Disclosure Checklist
This material was produced by Global Investment House KSCC (‘Global’),a firm regulated by the Central Bank ofKuwait. This document is not to be used or considered as an offer to sell or a solicitation of an offer to buy anysecurities. Global may, from time to time,to the extent permitted by law, participate or invest in other financingtransactions with the issuers of the securities (‘securities’), perform services for or solicit business from such issuer,and/or have a position or effect transactions in the securities or options thereof. Global may, to the extent permittedby applicable Kuwaiti law or other applicable laws or regulations, effect transactions in the securities before thismaterial is published to recipients.Information and opinions contained herein have been compiled or arrived by Global from sources believed tobe reliable, but Global has not independently verified the contents of this document. Accordingly, no representationor warranty, express or implied, is made as to and no reliance should be placed on the fairness, accuracy,completeness or correctness of the information and opinions contained in this document. Global accepts no liabilityfor any loss arising from the use of this document or its contents or otherwise arising in connection therewith.This document is not to be relied upon or used in substitution for the exercise of independent judgement. Globalshall have no responsibility or liability whatsoever in respect of any inac curacy in or ommission from this orany other document prepared by Global for, or sent by Global to any person and any such person shall beresponsible for conducting his own investigation and analysis of the information contained or referred to in thisdocument and of evaluating the merits and risks involved in the securities forming the subject matter of this orother such document.Opinions and estimates constitute our judgment and are subject to change without prior notice.Past performanceis not indicative of future results. This document does not constitute an offer or invitation to subscribe for orpurchase any securities, and neither this document nor anything contained herein shall form the basis of anycontract or commitment what so ever. It is being furnished to you solely for your information and may not bereproduced or redistributed to any other person.Neither this report nor any copy hereof may be distributed in any jurisdiction outside Kuwait where its distributionmay be restricted by law. Persons who receive this report should make themselves aware of and adhere to anysuch restrictions. By accepting this report you agree to be bound by the foregoing limitations.
The following is a comprehensive list of disclosures which may or may not apply to all our researches.Only the relevant disclosures which apply to this particular research has been mentioned in the tablebelow under the heading of disclosure.
Global Research: Equity Ratings DefinitionsGlobal Rating DefinitionBuy Fair value of the stock is >10% from the current market priceHold Fair value of the stock is between +10% and -10% from the current market priceReduce Fair value of the stock is between -10% and -20% from the current market priceSell Fair value of the stock is < -20% from the current market price
1. Global Investment House did not receive and will not receive any compensation from the companyor anyone else for the preparation of this report.
2. The company being researched holds more than 5% stake in Global Investment House.3. Global Investment House makes a market in securities issued by this company.4. Global Investment House acts as a corporate broker or sponsor to this company.5. The author of or an individual who assisted in the preparation of this report (or a member of his/her
household) has a direct ownership position in securities issued by this company.6. An employee of Global Investment House serves on the board of directors of this company.7. Within the past year , Global Investment House has managed or co-managed a public offering for
this company, for which it received fees.8. Global Investment House has received compensation from this company for the provision of
investment banking or financial advisory services within the past year.9. Global Investment House expects to receive or intends to seek compensation for investment banking
services from this company in the next three months.10. Please see special footnote below for other relevant disclosures.


