228
THE GLOBAL STATUS OF CCS | 2012

THE GLOBAL STATUS OF CCS | 2012

© Global CCS Institute, 2012
Unless stated otherwise, copyright to this product is owned
by the Global Carbon Capture and Storage Institute Ltd
(Global CCS Institute) or used under licence.
Apart from any fair dealings for the purpose of study,
research, reporting, criticism or review as permitted under the
Copyright Act 1968 (Cth), no part may be reproduced by any
process without the written permission of the Global CCS Institute.
For enquiries please contact:
BY TELEPHONE: +61 (0)2 6175 5300
BY EMAIL: [email protected]
BY MAIL: Global CCS Institute, GPO Box 828,
Canberra ACT 2601 Australia
The Global CCS Institute has tried to make information in this
product as accurate as possible. However, it does not guarantee
that the information is totally accurate or complete. Therefore, the
information in this product should not be relied upon solely when
making commercial decisions. The Global CCS Institute has no
responsibility for the persistence or accuracy of URLs for external
or third-party internet websites referred to in this publication and
does not guarantee that any content on such websites is, or will
remain, accurate or appropriate.
Please use the following reference to the whole report:
Global CCS Institute 2012, The Global Status of CCS: 2012,
Canberra, Australia.
ISBN 978-0-9871863-1-7
Cover photo courtesy of TCM.

PREFACE
The Global Status of CCS: 2012 is the fourth edition of the Global CCS Institute’s key publication
on the progress and challenges facing carbon capture and storage (CCS). These reports provide
a comprehensive overview of the state of development of CCS projects and technologies, and of
actions taken to facilitate the demonstration of those technologies at a large scale.
The Global Status of CCS: 2012 covers developments from late 2011, until the beginning of
September 2012. It draws on the results of the Institute’s annual project survey, completed
by lead proponents of major CCS projects around the world. Survey results were supplemented
by interviews with personnel from many of these projects, and by research undertaken by
Institute staff.
The assistance of project proponents in completing survey questionnaires and taking part
in interviews is particularly acknowledged. The Institute is grateful for the high degree of
cooperation received.
The Institute also acknowledges Edlyn Gurney and many of its staff who were instrumental
in authoring, reviewing and designing the report.

CONTENTS
Tables ................................................................................................. iv
Figures ............................................................................................... iv
Executive Summary............................................................................. 1
1 INTRODUCTION 4
1.1 The climate change challenge ............................................................. 5
1.2 The role of CCS ................................................................................. 11
1.3 Scope of report ................................................................................. 13
2 PROJECTS 14
2.1 An overview of large-scale integrated CCS projects ............................. 16
2.2 Key project developments in 2012..................................................... 20
2.3 Regional developments ..................................................................... 22
2.4 Detailed project breakdown ............................................................... 29
2.5 Demonstration of large-scale integrated CCS projects ......................... 38
3 BUSINESS CASE 40
3.1 Introduction ...................................................................................... 41
3.2 CCS costs and competitiveness ......................................................... 44
3.3 Commercial gaps for LSIPs and other CCS projects ............................ 46
3.4 Financing and risk ............................................................................ 51
3.5 Outlook ............................................................................................. 55
4 POLICY, LEGAL, AND REGULATORY DEVELOPMENTS 56
4.1 International policy, legal, and regulatory developments ..................... 57
4.2 Regional, national, and sub-national policy, legal,
and regulatory developments............................................................. 63
4.3 Project views ..................................................................................... 76
4.4 Government funding support ............................................................. 84
4.5 Challenges and outlook ..................................................................... 87
5 CCS IN DEVELOPING COUNTRIES 90
5.1 Importance of CCS in developing countries ........................................ 91
5.2 Status of CCS in developing countries ................................................ 93
5.3 Demonstration projects provide drivers for CCS
in developing countries ..................................................................... 96
6 CAPTURE 98
6.1 Introduction ...................................................................................... 99
6.2 Capture technology progress ........................................................... 102
6.3 Key challenges to large-scale demonstration of capture ................... 110
6.4 Moving towards commercial-scale demonstration ............................ 114
7 TRANSPORT 116
7.1 A brief introduction to CO2 transportation ......................................... 117
7.2 CO2 transportation – status and new developments .......................... 118
7.3 Design considerations for CO2 pipelines ........................................... 123
7.4 CO2 transportation – synopsis and outlook ....................................... 126
8 STORAGE 128
8.1 Introduction .................................................................................... 129
8.2 Overview of storage ......................................................................... 129
8.3 Storage challenges .......................................................................... 140
8.4 Progressing storage projects ............................................................ 143
9 CO2 ENHANCED OIL RECOVERY
AS CCS 144
9.1 Introduction .................................................................................... 145
9.2 Potential role of CO2 EOR in CCS ..................................................... 146
9.3 Infl uencing factors on CO2 EOR as CCS ........................................... 150
9.4 Challenges to CO2 EOR as CCS ........................................................ 153
9.5 Status of CO2 EOR as CCS ............................................................... 156
10 PUBLIC ENGAGEMENT 158
10.1 Emerging trends in public engagement............................................ 159
10.2 Public engagement success factors ................................................. 165
10.3 Improving understanding of CCS ..................................................... 169
APPENDICES 172
Appendix A 2012 projects survey ............................................... 172
Appendix B Asset Lifecycle Model .............................................. 176
Appendix C 2012 LSIPs ............................................................. 178
Appendix D Costs ...................................................................... 186
Appendix E Policy developments ............................................... 190
Appendix F Legal and regulation issues ..................................... 201
Appendix G CCS activities in developing countries ...................... 205
Appendix H US CO2 pipelines ..................................................... 207
Appendix I References and abbreviations ................................. 209

T H E G L O B A L S TAT U S O F C C S : 2 0 1 2iv
TABLES
Table 1 LSIPs in the Operate and Execute stages (‘Active’) ..................................................... 19
Table 2 Portfolio distribution of LSIPs ..................................................................................... 37
Table 3 Comparison of production cost increases with the addition of CO2 capture ................. 43
Table 4 CO2 costs for industrial processes .............................................................................. 46
Table 5 Comparison of power CCS projects in ‘Execution’ ....................................................... 50
Table 6 Operating period bridges of projects approaching FID ................................................ 50
Table 7 Potential CCS funding sources .................................................................................. 51
Table 8 LSIPs with offshore non-EOR CCS activities ............................................................... 62
Table 9 Summary of major policy developments..................................................................... 63
Table 10 Status of transposition of EU CCS Directive ................................................................ 71
Table 11 Schedule for PSD and Title V Operating Permit Applications – ‘GHG Tailoring Rule’ .... 73
Table 12 Stimulus funding for CCS .......................................................................................... 85
Table 13 Technology Readiness Levels (TRLs) description ..................................................... 103
Table 14 LSIPs as part of existing EOR networks in the US ..................................................... 119
Table 15 CO2 network initiatives related to CCS ...................................................................... 121
Table 16 CO2 composition specifi cations for CO
2 EOR pipelines in the US
and expected CO2 compositions from CO
2 capture ................................................... 123
Table 17 Standards and codes for the development of CO2 pipelines ...................................... 125
Table 18 LSIPs in Defi ne or Execute stages involving power generation
and intending to supply CO2 for EOR ....................................................................... 149
Table 19 Engagement methods responding projects found most helpful with
local communities (multi-select answers)................................................................. 163
Table 20 Public engagement and communication: common success factors .......................... 166
Table A1 Reconcililation of LSIPs with those presented in the
Global Status of CCS: 2011 report ........................................................................... 173
Table C1 2012 LSIPs ............................................................................................................. 178
Table G1 Illustrative list of CCS activities in developing countries............................................. 205
Table H1 Exisiting major US CO2 pipelines.............................................................................. 207
FIGURES
Figure 1 Global CO2 emissions .................................................................................................. 5
Figure 2 Total primary energy supply and energy-related CO2 emissions .................................... 7
Figure 3 CO2 concentration, temperature and sea level changes after emissions are reduced ..... 8
Figure 4 Modest economic impact from taking action ................................................................ 8
Figure 5 Geologic storage options for CO2 ................................................................................ 10
Figure 6 Energy-related CO2 emission reductions by technology .............................................. 11
Figure 7 CO2 capture by sector and region .............................................................................. 12
Figure 8 LSIPs by asset lifecycle and region/country ................................................................ 16

vF I G U R E S
Figure 9 World map of LSIPs................................................................................................... 17
Figure 10 LSIPs by Asset Lifecycle and year .............................................................................. 18
Figure 11 Changes in LSIPs from 2010 to 2012 ........................................................................ 20
Figure 12 North America map of LSIPs ..................................................................................... 23
Figure 13 China map of LSIPs .................................................................................................. 25
Figure 14 Europe map of LSIPs ................................................................................................ 27
Figure 15 LSIPs by region and year ........................................................................................... 29
Figure 16 Volume of CO2 potentially stored by region or country ................................................ 30
Figure 17 LSIPs by industry sector and year .............................................................................. 31
Figure 18 Volume of CO2 captured by industry sector and year .................................................. 32
Figure 19 LSIPs by industry sector and project structure ........................................................... 32
Figure 20 LSIPs by capture type and region .............................................................................. 33
Figure 21 LSIPs by capture type and industry ........................................................................... 34
Figure 22 Volume of CO2 potentially stored by primary storage type and region .......................... 35
Figure 23 Comparison of capture and storage progress ............................................................. 36
Figure 24 Volume of CO2 potentially stored by LSIPs (Mtpa CO
2) ................................................ 38
Figure 25 Complexity of the business case ................................................................................ 42
Figure 26 Cost impacts of adding CCS to a power station .......................................................... 44
Figure 27 Costs of CO2 avoided ................................................................................................. 45
Figure 28 The commercial gap facing many CCS projects ......................................................... 47
Figure 29 Bridging the commercial gap .................................................................................... 47
Figure 30 Public funding to large-scale projects ........................................................................ 48
Figure 31 Revenue sources for LSIPs ........................................................................................ 49
Figure 32 Bank lending volumes in Europe for non-investment grade borrowers ........................ 52
Figure 33 Bank lending volumes in the US for non-investment grade borrowers ........................ 52
Figure 34 Contracting strategies for LSIPs ................................................................................. 54
Figure 35 UNFCCC organisation ............................................................................................... 59
Figure 36 Relationship between policy and emissions ............................................................... 65
Figure 37 UK CCS Roadmap .................................................................................................... 69
Figure 38 Project views on whether policy has changed over the past year ................................ 76
Figure 39 Value of the prevailing suite of government policy settings in
supporting a positive business case ........................................................................... 77
Figure 40 Project attitudes to policy issues ................................................................................ 78
Figure 41 Project proponent preferences for enabling policy instruments................................... 79
Figure 42 Do the current regulatory requirements within your project’s jurisdiction(s)
facilitate an investment decision within your organisation?.......................................... 80
Figure 43 Have there been changes to these regulatory requirements in the past 12 months?.... 81
Figure 44 Project-level appraisals of the domestic regulatory environment ................................. 82
Figure 45 Public funding support commitments to CCS demonstrations by country ................... 84
Figure 46 CCS funding programs by stimulus funding ............................................................... 85
Figure 47 CCS development lifecycle ........................................................................................ 94
T H E G L O B A L S TAT U S O F C C S : 2 0 1 2vi
Figure 48 Global CCS Institute approach to capacity development ............................................. 97
Figure 49 Technical options for CO2 capture from coal-fi red power plants ................................ 100
Figure 50 Number of power generation LSIPs by capture technology and stage ....................... 101
Figure 51 MHI’s MK-CDRTM technology at Plant Barry in Alabama, US .................................... 105
Figure 52 Opening of the Technology Centre, Mongstad, Norway, May 2012............................ 106
Figure 53 CO2 being captured, dehydrated, and compressed at ADM ethanol plant ................. 108
Figure 54 Top gas recycling blast furnace ............................................................................... 109
Figure 55 Test facility for amine solvents at NCCC ................................................................... 111
Figure 56 Pipeline transportation distances provided by LSIPs................................................. 118
Figure 57 Schematic overview of the South West Hub in Western Australia .............................. 120
Figure 58 Plausible fl ows of CO2 within and between North Sea basin countries in 2030 .......... 122
Figure 59 Status of current and planned storage projects ........................................................ 130
Figure 60 Ability to meet CCS Roadmap targets ...................................................................... 131
Figure 61 Distribution of Cambrian sedimentary rocks in North America .................................. 132
Figure 62 Core photos of Cambrian Deadwood Formation in Saskatchewan exhibiting
cross-bedded sand grains and good porosity ........................................................... 134
Figure 63 Map of European CO2 sedimentary basins ............................................................... 135
Figure 64 Map of regions having storage capacity assessment initiatives.................................. 139
Figure 65 Potential volume of CO2 stored by storage type options and Asset Lifecycle stage ..... 146
Figure 66 Schematic diagram of a water-alternating-gas (WAG) miscible CO2 EOR operation .... 147
Figure 67 The relationship between oil production, purchased CO2, and recycled CO
2 ............. 148
Figure 68 Projected US supply of CO2 for EOR by source ........................................................ 150
Figure 69 Sources of CO2 for EOR and distribution pipelines in the US .................................... 154
Figure 70 Status of public engagement strategies in responding projects ................................. 160
Figure 71 Community descriptions by overall asset lifecycle stage ........................................... 161
Figure 72 The extent to which projects consider consultation activities with impacted local
communities are suffi cient for anticipating and mitigating public engagement risk.... 162
Figure 73 Year 6 students from St Anne’s primary school, Western Australia,
demonstrating CCS using household items .............................................................. 171
Figure B1 Asset Lifecycle Model .............................................................................................. 176
Figure D1 Levelised costs of electricity for different capture technologies ................................. 186
Figure D2 CCS investment costs: demonstration projects vs. cost studies ................................. 188
Figure F1 Market rules to accommodate CCS outcomes in prevailing market mechanisms ....... 201
Figure F2 Standards to account for cross-border movement of CO2 ......................................... 201
Figure F3 Remediation activities to be undertaken by the operator in the event of leakage ....... 202
Figure F4 Post-operational transfer of operator’s liability .......................................................... 202
Figure F5 Defi nition of project boundaries ............................................................................... 203
Figure F6 Drafting and implementation of a monitoring plan .................................................... 203
Figure F7 Selection and evaluation of a storage site ................................................................. 204
Figure F8 CCS activities adequately addressed in pre-existing planning
and permitting regimes ........................................................................................... 204

1E X E C U T I V E S U M M A R Y
EXECUTIVE SUMMARY
ACTION IS NEEDED NOW TO ENSURE CCS CAN PLAY A VITAL ROLE IN TACKLING
CLIMATE CHANGE
Addressing climate change requires broad-scale action within the global community. Effective action
is needed now to decarbonise energy consumption during this century; no single technology, or even
class of technologies, can achieve this outcome.
To achieve greenhouse gas (GHG) emission reduction targets limiting a global average temperature rise
to no more than 2°C, the International Energy Agency (IEA) estimates that energy-related emissions must
reduce very substantially. Large-scale investments in several technologies are required in order to meet
this target, with carbon capture and storage (CCS) contributing 7 Gt of the required 42 Gt emission
reduction in a least cost scenario. If CCS were to be excluded as a technology option in the electricity
sector, the IEA states that investment costs over the period to 2050 would increase by 40 per cent.
CCS is a vital component of a portfolio of low-carbon technologies, as it is able to reduce carbon dioxide
(CO2) emissions substantially from both the energy sector and other industries.
The Global CCS Institute’s Global Status of CCS: 2012 report identifi es the status of CCS, the
developments that have occurred in the past year, and the challenges that must be addressed in order
for climate change to be managed effectively and effi ciently.
CCS IS ALREADY CONTRIBUTING, BUT PROGRESS MUST BE ACCELERATED
CCS is used in a number of industries today, and already plays an important role in tackling climate
change. Around the world, eight large-scale CCS projects are storing about 23 million tonnes of CO2
each year. With a further eight projects currently under construction (including two in the electricity
generation sector), that fi gure will increase to over 36 million tonnes of CO2 a year by 2015. This is
approximately 70 per cent of the IEA’s target for mitigation activities by CCS by 2015.
To maintain the path to the 2°C target, the number of operational projects must increase to around
130 by 2020, from the 16 currently in operation or under construction. Such an outcome looks very
unlikely as only 51 of the 59 remaining projects captured in the Global CCS Institute’s annual project
survey plan to be operational by 2020, and inevitably some of these will not proceed. This situation
should send a strong message to governments on the adverse impact of delays to climate change
legislation. The lack of progress continues to undermine private sector investment in CCS activities,
which then impedes technology development. Since CCS is the only technology available for complete
decarbonisation of industrial sectors such as iron, steel and cement manufacture, the risk of not being
able to limit temperature rises to just 2°C becomes even greater.
The window of opportunity identifi ed by the IEA means that action is needed now to extend broad-
scale climate policy to support the required technologies. Like all emerging technologies, substantial,
timely and stable policy support – including a carbon-price signal – is required for CCS to be viably
demonstrated and deployed. This will drive industry confi dence and investment, ensuring continuing
innovation, and ultimately reducing capital and operating costs.
SLOW PROGRESS BUT IMPORTANT DEVELOPMENTS
It is clear a very substantial increase in new projects needs to occur if the IEA scenario for CCS is
to be met.
Since the Global Status of CCS: 2011 report, the net number of large-scale integrated projects (LSIPs)
increased by one to a total of 75. During the year, eight previously-identifi ed LSIPs were cancelled,
put on hold or restructured for diverse reasons, ranging from insuffi cient revenues for carbon sales to
inadequate storage regulations. These were offset by nine new projects, and of these, fi ve are in China,
where the progress of CCS continues to be strong.
Currently, at least 19 developing countries are engaged in CCS-related activities, mostly at the early
stage. To achieve global emission reduction targets, 70 per cent of CCS deployment will need to occur
in non-OECD countries by 2050.
T H E G L O B A L S TAT U S O F C C S : 2 0 1 22
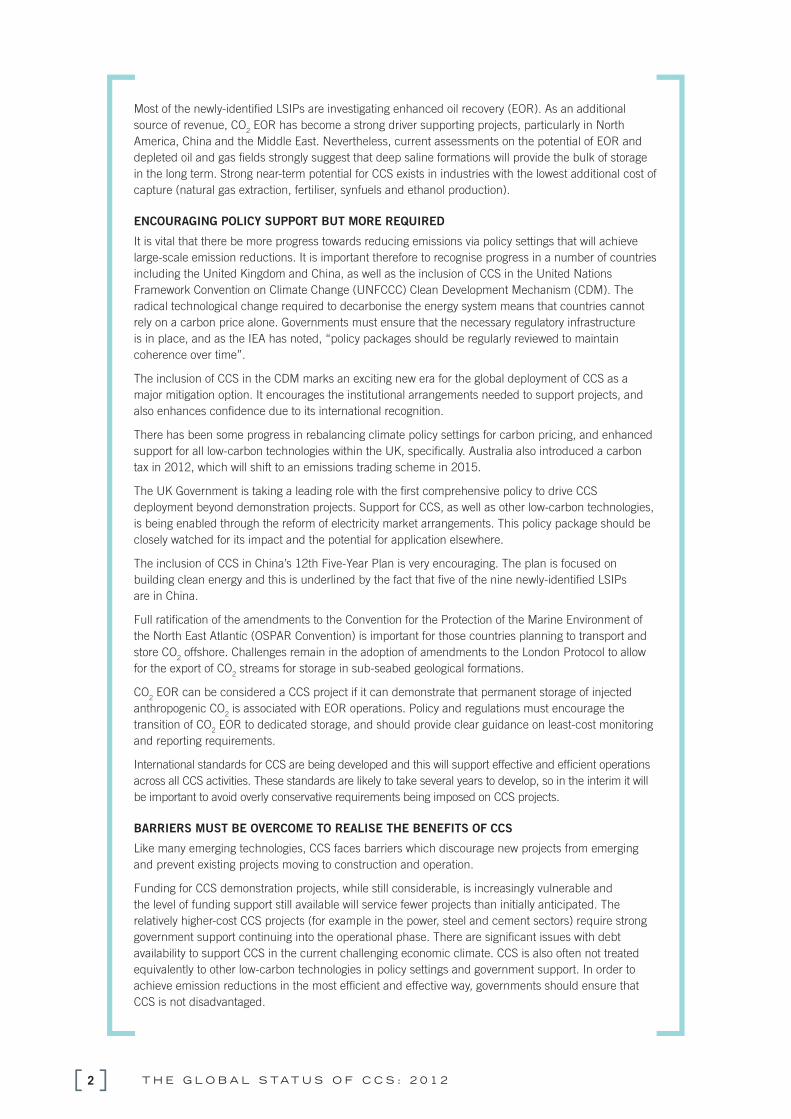
Most of the newly-identifi ed LSIPs are investigating enhanced oil recovery (EOR). As an additional
source of revenue, CO2 EOR has become a strong driver supporting projects, particularly in North
America, China and the Middle East. Nevertheless, current assessments on the potential of EOR and
depleted oil and gas fi elds strongly suggest that deep saline formations will provide the bulk of storage
in the long term. Strong near-term potential for CCS exists in industries with the lowest additional cost of
capture (natural gas extraction, fertiliser, synfuels and ethanol production).
ENCOURAGING POLICY SUPPORT BUT MORE REQUIRED
It is vital that there be more progress towards reducing emissions via policy settings that will achieve
large-scale emission reductions. It is important therefore to recognise progress in a number of countries
including the United Kingdom and China, as well as the inclusion of CCS in the United Nations
Framework Convention on Climate Change (UNFCCC) Clean Development Mechanism (CDM). The
radical technological change required to decarbonise the energy system means that countries cannot
rely on a carbon price alone. Governments must ensure that the necessary regulatory infrastructure
is in place, and as the IEA has noted, “policy packages should be regularly reviewed to maintain
coherence over time”.
The inclusion of CCS in the CDM marks an exciting new era for the global deployment of CCS as a
major mitigation option. It encourages the institutional arrangements needed to support projects, and
also enhances confi dence due to its international recognition.
There has been some progress in rebalancing climate policy settings for carbon pricing, and enhanced
support for all low-carbon technologies within the UK, specifi cally. Australia also introduced a carbon
tax in 2012, which will shift to an emissions trading scheme in 2015.
The UK Government is taking a leading role with the fi rst comprehensive policy to drive CCS
deployment beyond demonstration projects. Support for CCS, as well as other low-carbon technologies,
is being enabled through the reform of electricity market arrangements. This policy package should be
closely watched for its impact and the potential for application elsewhere.
The inclusion of CCS in China’s 12th Five-Year Plan is very encouraging. The plan is focused on
building clean energy and this is underlined by the fact that fi ve of the nine newly-identifi ed LSIPs
are in China.
Full ratifi cation of the amendments to the Convention for the Protection of the Marine Environment of
the North East Atlantic (OSPAR Convention) is important for those countries planning to transport and
store CO2 offshore. Challenges remain in the adoption of amendments to the London Protocol to allow
for the export of CO2 streams for storage in sub-seabed geological formations.
CO2 EOR can be considered a CCS project if it can demonstrate that permanent storage of injected
anthropogenic CO2 is associated with EOR operations. Policy and regulations must encourage the
transition of CO2 EOR to dedicated storage, and should provide clear guidance on least-cost monitoring
and reporting requirements.
International standards for CCS are being developed and this will support effective and effi cient operations
across all CCS activities. These standards are likely to take several years to develop, so in the interim it will
be important to avoid overly conservative requirements being imposed on CCS projects.
BARRIERS MUST BE OVERCOME TO REALISE THE BENEFITS OF CCS
Like many emerging technologies, CCS faces barriers which discourage new projects from emerging
and prevent existing projects moving to construction and operation.
Funding for CCS demonstration projects, while still considerable, is increasingly vulnerable and
the level of funding support still available will service fewer projects than initially anticipated. The
relatively higher-cost CCS projects (for example in the power, steel and cement sectors) require strong
government support continuing into the operational phase. There are signifi cant issues with debt
availability to support CCS in the current challenging economic climate. CCS is also often not treated
equivalently to other low-carbon technologies in policy settings and government support. In order to
achieve emission reductions in the most effi cient and effective way, governments should ensure that
CCS is not disadvantaged.
3E X E C U T I V E S U M M A R Y
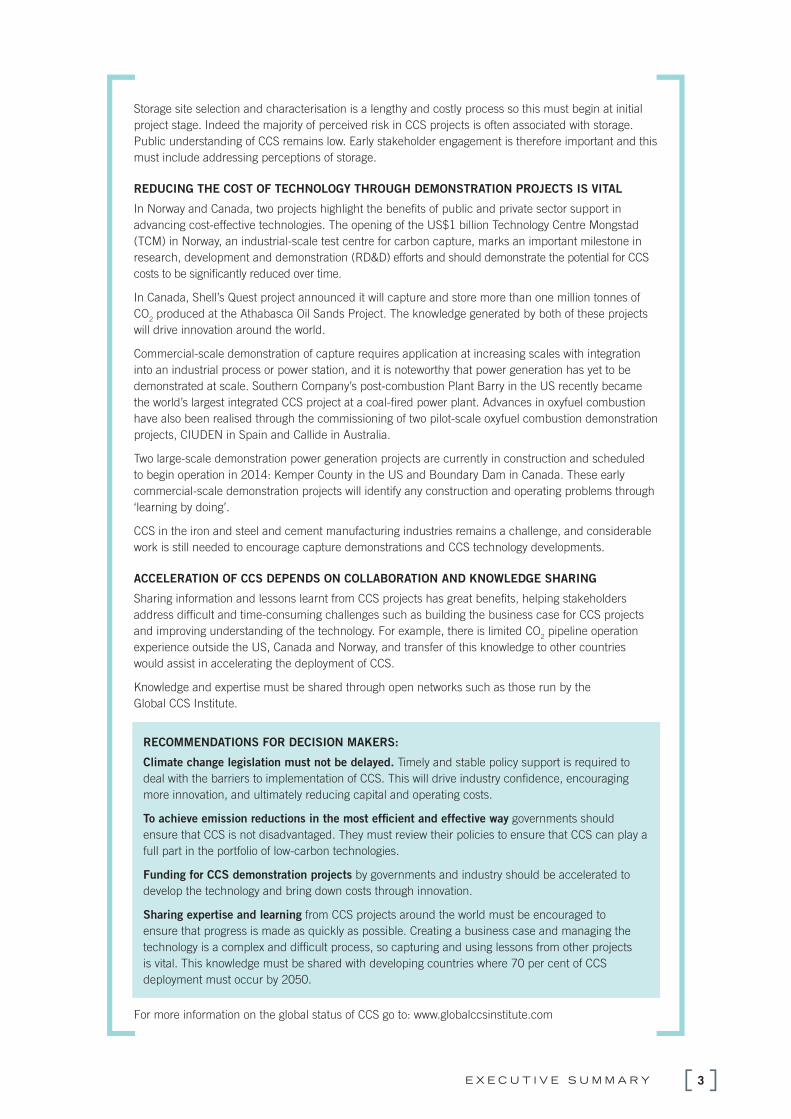
Storage site selection and characterisation is a lengthy and costly process so this must begin at initial
project stage. Indeed the majority of perceived risk in CCS projects is often associated with storage.
Public understanding of CCS remains low. Early stakeholder engagement is therefore important and this
must include addressing perceptions of storage.
REDUCING THE COST OF TECHNOLOGY THROUGH DEMONSTRATION PROJECTS IS VITAL
In Norway and Canada, two projects highlight the benefi ts of public and private sector support in
advancing cost-effective technologies. The opening of the US$1 billion Technology Centre Mongstad
(TCM) in Norway, an industrial-scale test centre for carbon capture, marks an important milestone in
research, development and demonstration (RD&D) efforts and should demonstrate the potential for CCS
costs to be signifi cantly reduced over time.
In Canada, Shell’s Quest project announced it will capture and store more than one million tonnes of
CO2 produced at the Athabasca Oil Sands Project. The knowledge generated by both of these projects
will drive innovation around the world.
Commercial-scale demonstration of capture requires application at increasing scales with integration
into an industrial process or power station, and it is noteworthy that power generation has yet to be
demonstrated at scale. Southern Company’s post-combustion Plant Barry in the US recently became
the world’s largest integrated CCS project at a coal-fi red power plant. Advances in oxyfuel combustion
have also been realised through the commissioning of two pilot-scale oxyfuel combustion demonstration
projects, CIUDEN in Spain and Callide in Australia.
Two large-scale demonstration power generation projects are currently in construction and scheduled
to begin operation in 2014: Kemper County in the US and Boundary Dam in Canada. These early
commercial-scale demonstration projects will identify any construction and operating problems through
‘learning by doing’.
CCS in the iron and steel and cement manufacturing industries remains a challenge, and considerable
work is still needed to encourage capture demonstrations and CCS technology developments.
ACCELERATION OF CCS DEPENDS ON COLLABORATION AND KNOWLEDGE SHARING
Sharing information and lessons learnt from CCS projects has great benefi ts, helping stakeholders
address diffi cult and time-consuming challenges such as building the business case for CCS projects
and improving understanding of the technology. For example, there is limited CO2 pipeline operation
experience outside the US, Canada and Norway, and transfer of this knowledge to other countries
would assist in accelerating the deployment of CCS.
Knowledge and expertise must be shared through open networks such as those run by the
Global CCS Institute.
RECOMMENDATIONS FOR DECISION MAKERS:
Climate change legislation must not be delayed. Timely and stable policy support is required to
deal with the barriers to implementation of CCS. This will drive industry confi dence, encouraging
more innovation, and ultimately reducing capital and operating costs.
To achieve emission reductions in the most effi cient and effective way governments should
ensure that CCS is not disadvantaged. They must review their policies to ensure that CCS can play a
full part in the portfolio of low-carbon technologies.
Funding for CCS demonstration projects by governments and industry should be accelerated to
develop the technology and bring down costs through innovation.
Sharing expertise and learning from CCS projects around the world must be encouraged to
ensure that progress is made as quickly as possible. Creating a business case and managing the
technology is a complex and diffi cult process, so capturing and using lessons from other projects
is vital. This knowledge must be shared with developing countries where 70 per cent of CCS
deployment must occur by 2050.
For more information on the global status of CCS go to: www.globalccsinstitute.com

1I NTRODUCTION
1.1The climate change challenge 5
1.2The role of CCS 11
1.3Scope of report 13
5I N T R O D U C T I O N
KEY MESSAGES › Widespread action is needed to mitigate the effects of climate change.
› CCS is an essential element in a portfolio of climate change mitigation
technologies.
› CCS in the electricity sector reduces total investment needs for abatement
technologies by almost 30 per cent.
› CCS is critical to decarbonising emissions in the industrial sector.
1.1
THE CLIMATE CHANGE CHALLENGE As the effects of climate change become better understood and human-induced CO
2 concentrations in the atmosphere are
globally accepted as the major cause, substantial reductions in CO2 emissions from power production and other high CO
2
emitting industries will be required to manage the risks of climate change through a greater uptake of near-zero emission
technologies.
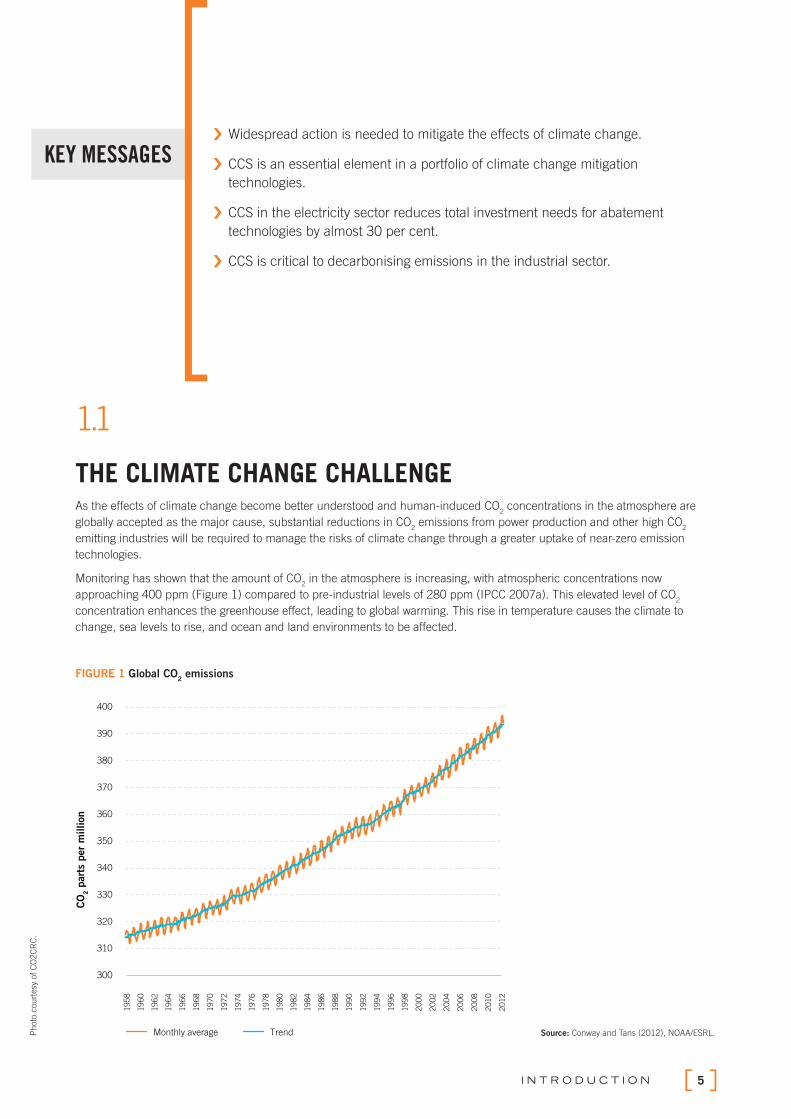
Monitoring has shown that the amount of CO2 in the atmosphere is increasing, with atmospheric concentrations now
approaching 400 ppm (Figure 1) compared to pre-industrial levels of 280 ppm (IPCC 2007a). This elevated level of CO2
concentration enhances the greenhouse effect, leading to global warming. This rise in temperature causes the climate to
change, sea levels to rise, and ocean and land environments to be affected.
FIGURE 1 Global CO2 emissions
Source: Conway and Tans (2012), NOAA/ESRL.Photo
court
esy
of C
O2C
RC
.
TrendMonthly average
300
320
310
330
340
350
360
370
380
390
400
1958
1960
1962
1964
1966
1968
1970
1972
1974
1976
1978
1980
1982
1984
1986
1988
1990
1992
1994
1996
1998
2000
2002
2004
2006
2008
2010
2012
CO
2 p
art
s per
million

T H E G L O B A L S TAT U S O F C C S : 2 0 1 26
During the 20th century, the global average temperature increased by around 0.74°C, with the rate of increase accelerating
over the period (IPCC 2007a). The IPCC estimated that by 2100, the increase in global average temperature could range
between 1.1–6.4°C depending on the level of greenhouse gas (GHG) emissions during this century. More recent estimates
suggest that the world is on a path towards the 6°C level, given currently enacted legislation to reduce emissions (IEA 2011a).
A changing climate will inevitably lead to increased vulnerability to, and severity and frequency of, climate events which could
lead to an increased risk of disasters occurring such as heat waves, species extinction, rising sea levels, and fl ood events.
Developing countries are likely to be the most affected by such adverse impacts of climate change, which will mostly be abrupt
and irreversible in nature. The Intergovernmental Panel on Climate Change (IPCC) cites a sobering statistic that between 1970
and 2008, 95 per cent of all natural disaster-related deaths occurred in developing countries (IPCC 2012).
Recent analysis suggests that temperature increases and climate change affect not only the level of economic output, but also
the rate of economic growth. It has been estimated that, for certain developing countries, a 1°C rise in temperature in a given
year reduces economic growth by 1.3 percentage points, on average (Dell et al. 2012). Further, higher temperatures have
wide-ranging effects, reducing not only agricultural output but also industrial production and infl uencing political stability.
When fossil fuels burn, large amounts of CO2 are released into the atmosphere. CO
2 is also released from the ground together
with natural gas during natural gas production. Industrial processes, such as refi ning oil, or producing iron, steel, cement,
and ammonia, also release large amounts of CO2. Other major sources of CO
2 include emissions from cars, trucks, ships, and
aeroplanes, and emissions from domestic sources – such as heating. In addition, land clearing has reduced the ability of the
Earth to absorb excess CO2 as there is less plant life to assist in natural regulation. All of these activities contribute to increasing
the concentration of CO2 in the atmosphere.
Energy-related CO2 emissions account for nearly 60 per cent of total global anthropogenic GHG emissions. In 2011, CO
2
emissions from the combustion of fossil fuels reached a record 31.6 Gt (IEA 2012a). Primary energy consumption continues to
rise (Figure 2) and fossil fuels have provided the major share of the incremental growth over the past decade, accounting for
more than 80 per cent of the increase in energy consumption (IEA 2012b).

7I N T R O D U C T I O N
FIGURE 2 Total primary energy supply and energy-related CO2 emissions
World OECD Non-OECD
100
0
200
300
400
500
600
1971 1980 1990 2000 2009
EJ
World OECD Non-OECD
5
0
10
15
20
25
30
1971 1980 1990 2000 2009
Gt
CO
2
Total primary energy supply
Energy-related CO2 emissions
Source: IEA (2012b).
Note: The apparent decline in 2009 refl ects reduced energy demand due to the economic recession.
The largest global source of fossil fuel emissions comes from coal-fi red power plants, with around 9 Gt of CO2 emitted in 2011.
Coal is the most abundant fossil-fuel resource worldwide. Recoverable reserves can be found in 70 countries or more, with
suffi cient reserves for 150 years of generation at current global consumption rates. Between 2000 and 2009, growth in coal
consumption far exceeded the combined increase of all non-fossil energy sources (IEA 2012b). Despite the very strong growth
in non-fossil energy generation, its share of total generation has declined.
As climate change is driven by the stock of GHGs in the atmosphere, even if all anthropogenic CO2 emissions were to cease
tomorrow, climate change has already begun and effects will still be seen long into the future. The global challenge is to enact
policies that result in emissions peaking in the near future and rapidly reducing thereafter (Figure 3). In December 2010, the
16th session of the Conference of the Parties (COP 16) to the UNFCCC approved a non-legally binding commitment to cap
global average temperature rises to 2°C. A 2°C rise will still result in rising sea levels, and increased frequency of extreme
weather events, including increased drought and fl ooding (Stern 2009). Limiting the increase in the stock of CO2 in the
atmosphere to 1000 Gt this century will give a 50 per cent chance of limiting to 2°C (Meinshausen, et al. 2009). Achieving this
constraint on carbon emissions requires energy-related CO2 emissions to fall to zero by 2075 (IEA 2012b).
T H E G L O B A L S TAT U S O F C C S : 2 0 1 28
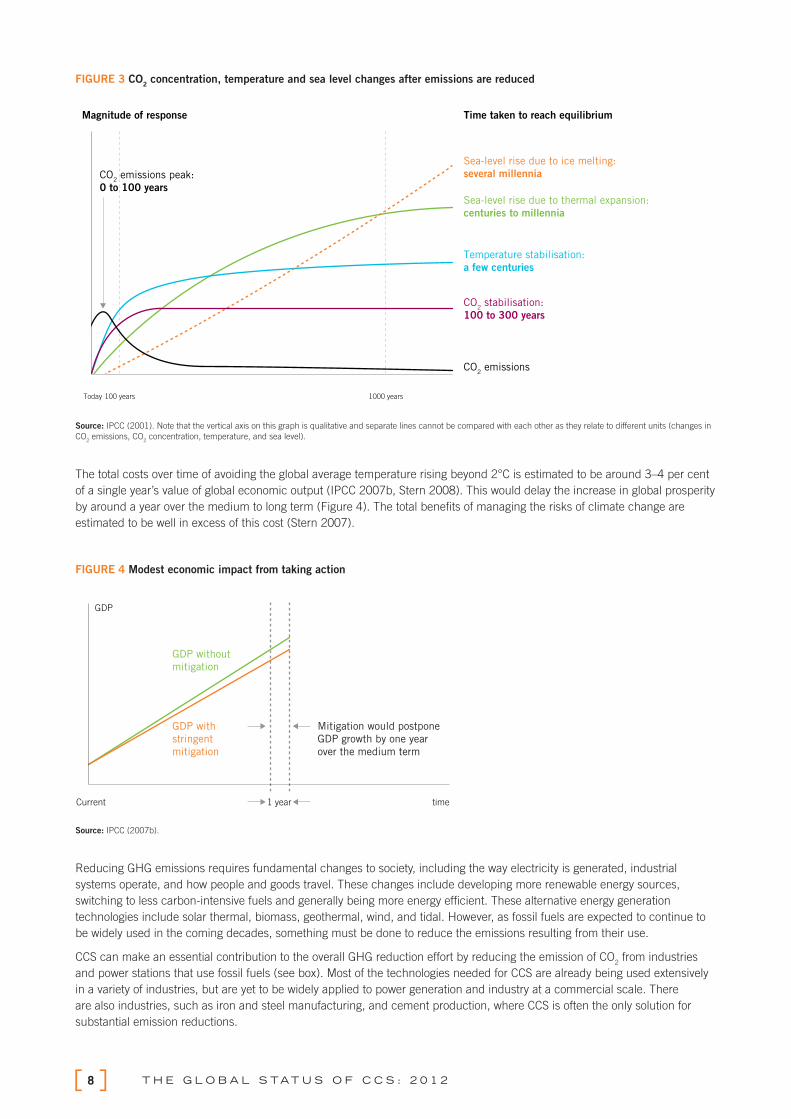
FIGURE 3 CO2 concentration, temperature and sea level changes after emissions are reduced
Magnitude of response Time taken to reach equilibrium
100 yearsToday 1000 years
Sea-level rise due to ice melting:
several millennia
Sea-level rise due to thermal expansion:
centuries to millennia
Temperature stabilisation:
a few centuries
CO2 stabilisation:
100 to 300 years
CO2 emissions
CO2 emissions peak:
0 to 100 years
Source: IPCC (2001). Note that the vertical axis on this graph is qualitative and separate lines cannot be compared with each other as they relate to different units (changes in
CO2 emissions, CO
2 concentration, temperature, and sea level).
The total costs over time of avoiding the global average temperature rising beyond 2°C is estimated to be around 3–4 per cent
of a single year’s value of global economic output (IPCC 2007b, Stern 2008). This would delay the increase in global prosperity
by around a year over the medium to long term (Figure 4). The total benefi ts of managing the risks of climate change are
estimated to be well in excess of this cost (Stern 2007).
FIGURE 4 Modest economic impact from taking action
Source: IPCC (2007b).
Reducing GHG emissions requires fundamental changes to society, including the way electricity is generated, industrial
systems operate, and how people and goods travel. These changes include developing more renewable energy sources,
switching to less carbon-intensive fuels and generally being more energy effi cient. These alternative energy generation
technologies include solar thermal, biomass, geothermal, wind, and tidal. However, as fossil fuels are expected to continue to
be widely used in the coming decades, something must be done to reduce the emissions resulting from their use.
CCS can make an essential contribution to the overall GHG reduction effort by reducing the emission of CO2 from industries
and power stations that use fossil fuels (see box). Most of the technologies needed for CCS are already being used extensively
in a variety of industries, but are yet to be widely applied to power generation and industry at a commercial scale. There
are also industries, such as iron and steel manufacturing, and cement production, where CCS is often the only solution for
substantial emission reductions.
1 year timeCurrent
GDP
GDP without
mitigation
Mitigation would postpone
GDP growth by one year
over the medium term
GDP with
stringent
mitigation

9I N T R O D U C T I O N
CCS is the long-term isolation of fossil fuel CO2 emissions from the atmosphere through capturing and storing the CO
2
deep in the subsurface of the Earth.
CCS is made up of three key stages.
1. Capture: Carbon capture is the separation of CO2 from the other gases produced when fossil fuels are burnt for
power generation and when CO2 is produced in other industrial processes.
2. Transport: Once separated, the CO2 is compressed and transported to a suitable site for geologic storage.
3. Storage: At its storage site, CO2 is injected into deep underground rock formations, often at depths of 1 km or more.
1: Capturing the CO2
Capturing CO2 emissions from industrial processes is easiest at large plants where for example CO
2-rich fl ue gas can
be processed at the facility.
The separation of CO2 is already performed in a number of standard industrial processes. For example, in natural
gas production, CO2 is separated from the natural gas during processing. Similarly, in industrial plants that produce
ammonia or hydrogen, CO2 is removed as part of the process.
As the largest contribution to CO2 emissions is from the burning of fossil fuel, particularly in producing electricity, three
main processes are being developed to capture CO2 from power plants that use coal or gas. These are:
post-combustion capture;
pre-combustion capture; and
oxyfuel combustion capture.
In other industries, such as in steel mills and cement plants, capture processes have not yet been developed at a
large scale, but in each case an existing capture method could be tailored to suit the particular production process.
For instance, collection of CO2 from cement plants uses post-combustion capture, and collection from modifi ed steel
manufacturing processes uses a type of oxyfuel combustion.
2: Transporting the CO2
Once separated, the CO2 is compressed to make it easier to transport and store. It is then transported to a suitable
storage site. Today, CO2 is already being transported by pipeline, by ship, and by road tanker – primarily for use in
industry or to recover more oil and gas from oil and gas fi elds. The scale of transportation required for widespread
deployment of CCS is far more signifi cant than at present, and will involve the transportation of CO2 in a dense phase.
3: Storing the CO2
The fi nal stage of the CCS process sees the CO2 injected into deep underground rock formations, often at depths of
1 km or more (Figure 5). At this depth, the temperature and pressure keep the CO2 as a dense fl uid. The CO
2 slowly
moves through the porous rock, fi lling the tiny spaces known as pore space.
Appropriate storage sites include depleted oil fi elds, depleted gas fi elds, or rock formations which contain water with
a high level of salinity (saline formations). These storage sites generally have an impermeable rock (also known as a
'seal' or ‘cap rock’) above them. The seal and other geologic features prevent the CO2 from returning to the surface.
These types of sites have securely contained fl uids and gases for millions of years, and with careful selection, they can
securely store CO2 for just as long.
Once injected, a range of sensing and monitoring technologies are used to monitor the CO2's movement and changes
within the rock formations. Monitoring, reporting and verifi cation processes are important for the project performance
management and to assure the public and regulators that the CO2 is safely stored.
Finding appropriate storage sites requires the collection of a great deal of data, and takes signifi cant time and effort.
Many economies around the world have active programs to identify storage sites for CO2, including the US, Canada,
China, South Africa, Australia and Europe.
WHAT IS CCS?

T H E G L O B A L S TAT U S O F C C S : 2 0 1 210
FIGURE 5 Geologic storage options for CO2
Image courtesy of CO2CRC.
11I N T R O D U C T I O N
1.2
THE ROLE OF CCSCCS has a key role amongst a portfolio of emission reductions technologies. The IEA (2012b) has developed scenarios to
examine pathways to achieve energy emission reductions under a range of assumptions. Central to the changes required to
cut energy-related CO2 emissions in half by 2050 are three key strategies:
creation of a smarter, more flexible, decentralised energy system;
improved energy efficiency; and
transformation of electricity generation.
The fi rst two items directly target decoupling of energy consumption and economic activity in seeking to use a wider variety of
energy providers and to do so in both technologically and behaviourally more effi cient ways. But it is the decarbonisation of the
electricity system by 2050 that is the most important technological change required, and here CCS has a fundamental role,
together with renewable and nuclear technologies.
CCS is the only technology currently available or on the horizon (later this century) that can decarbonise sectors such as
cement, or iron and steel. The IEA notes that emission reductions in these sectors need to commence shortly, but complete
decarbonisation will require increased penetration of the use of electricity into these sectors (as well as transport), reinforcing
the importance of the technological transformation of electricity generation in the fi rst place.
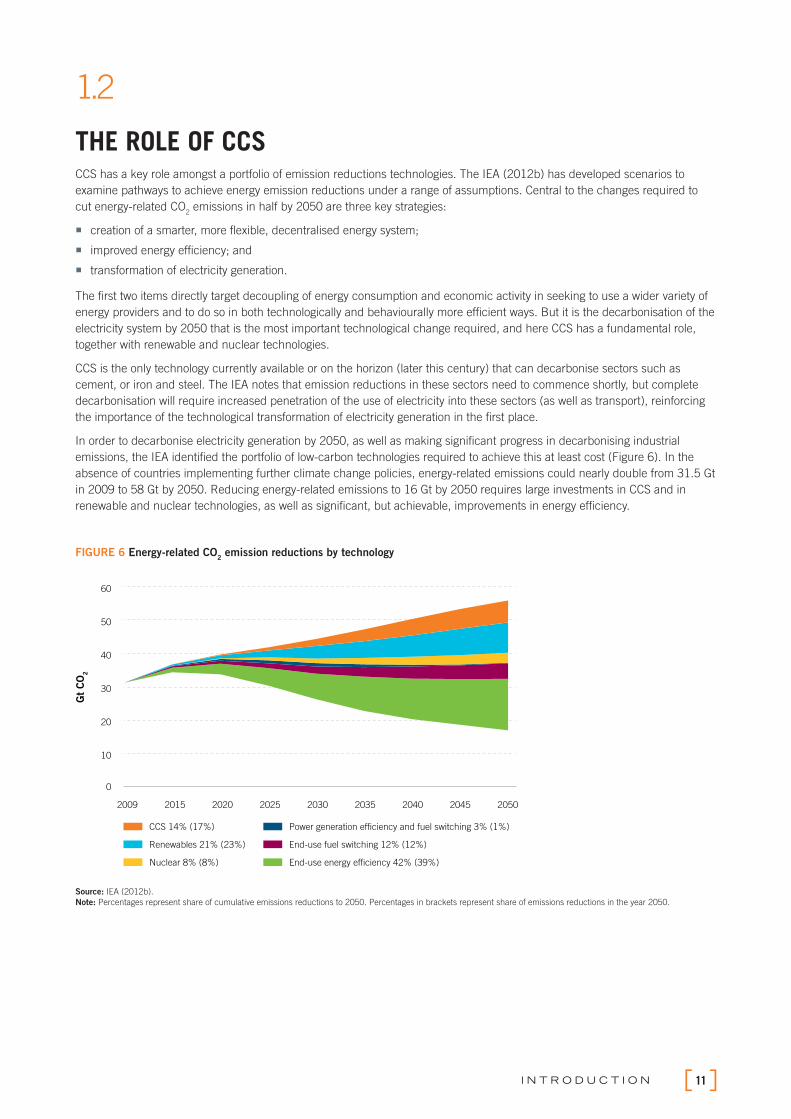
In order to decarbonise electricity generation by 2050, as well as making signifi cant progress in decarbonising industrial
emissions, the IEA identifi ed the portfolio of low-carbon technologies required to achieve this at least cost (Figure 6). In the
absence of countries implementing further climate change policies, energy-related emissions could nearly double from 31.5 Gt
in 2009 to 58 Gt by 2050. Reducing energy-related emissions to 16 Gt by 2050 requires large investments in CCS and in
renewable and nuclear technologies, as well as signifi cant, but achievable, improvements in energy effi ciency.
FIGURE 6 Energy-related CO2 emission reductions by technology
Source: IEA (2012b).
Note: Percentages represent share of cumulative emissions reductions to 2050. Percentages in brackets represent share of emissions reductions in the year 2050.
10
0
20
30
40
50
60
2009 2015 20252020 2030 2035 2040 2045 2050
End-use fuel switching 12% (12%)
End-use energy efficiency 42% (39%)
CCS 14% (17%)
Nuclear 8% (8%)
Renewables 21% (23%)
Power generation efficiency and fuel switching 3% (1%)
Gt
CO
2

T H E G L O B A L S TAT U S O F C C S : 2 0 1 212
The scenario that incurs the lowest overall cost identifi es CCS accounting for 14 per cent of the total 850 Gt reduction in
energy-related CO2 emissions by 2050. The total amount of CO
2 sequestered by CCS technologies through to 2050 in this
scenario is around 123 Gt, with 70 per cent captured from the power sector and 30 per cent from industrial applications such
as gas processing, fertiliser production and cement manufacture. However, as electricity generation must be decarbonised by
2050, the growth of CCS in this sector slows towards the end of this period, whereas CCS activities continue to increase in the
industrial sector (Figure 7). Overall, the role of CCS grows over time as the required reduction in total CO2 emission increases,
requiring increasing action in the industrial sector.
FIGURE 7 CO2 capture by sector and region
Source: IEA (2012b).
By 2050, the role of CCS in decarbonising energy emissions is evenly split between capturing emissions in the power sector
and in industry. Although the deployment of CCS occurs in Organisation for Economic Co-operation and Development (OECD)
member countries initially, it is non-OECD countries where CCS has a larger role. This is because these countries experience
higher rates of economic growth with development over the long term and as industrial activities in particular increase at a
much faster rate in those countries. By 2050, in the scenarios modelled by the IEA, non-OECD countries should account for
70 per cent of CO2 captured and stored securely.
If CCS were to be excluded as a technology option in the electricity sector, the IEA states that investment costs over the period
would increase by 40 per cent, or approximately US$3 trillion, because they will draw on relatively more expensive abatement
options to provide electricity. Minimising the resources required to reduce emissions makes it easier and more affordable for
all countries to undertake the task, including developing economies. Importantly, it means more resources for other key social
and economic tasks such as improving health outcomes, developing skills, and reducing poverty.
As CCS is currently the only technology available to support the complete decarbonisation of the production of industrial
products such as iron and steel or cement, if it were not available to these sectors then it is unclear whether industrial use of
energy could be completely decarbonised at all.
1
2
3
4
5
6
7
8
2015 2020 2025 2030 2035 2040 2045 2050
Power - OECD
Industrial - non-OECD
Power - non-OECD
Industrial - OECD
Gt
CO
2

13I N T R O D U C T I O N
1.3
SCOPE OF REPORTIt is clear that CCS as a low-carbon technology can signifi cantly reduce CO
2 emissions and help mitigate climate change.
The Global CCS Institute’s mission is to accelerate the demonstration and deployment of CCS globally, to bring forward the
technology’s potential. This annual Global Status of CCS report provides a comprehensive reference source on the status of
CCS and measures progress that has occurred in CCS over the past year. This includes showcasing project, policy and other
developments as well as highlighting challenges still to be addressed.
To accelerate and monitor the development of CCS, many aspects must be addressed – from the policy environment
through to technical challenges. This report covers these key aspects across separate chapters while making the link and
dependencies across these areas apparent.
The results from the Global CCS Institute’s annual project survey are featured in Chapter 2. The Institute undertakes the most
comprehensive annual global survey of CCS projects with the aim of providing a global overview of CCS projects which are
intended to demonstrate the technology at a large scale. A critical mass of these large-scale projects is needed in the short
term to demonstrate the integrated application of CCS technologies.
Chapter 3 analyses the business case for a project, one in which the necessary strategic and fi nancial information is presented
to make and monitor a decision about whether the investment should proceed. This information includes many factors – from
government support to the confi dence in the technology.
Key developments in the area of policy, legislation and regulation are presented in Chapter 4. It is of high importance that
national policy settings in all key countries are conducive to CCS demonstration. Developing countries have additional
challenges when implementing CCS and are separately addressed in Chapter 5.
Chapters 6, 7 and 8 then discuss the progress and challenges that have been made in capture, transport, and storage
respectively. Chapter 9 discusses the use of CO2 EOR. This chapter presents the role CO
2 EOR may play in CCS, along with
some of the technical and legal aspects of CO2 in EOR relative to carbon storage, and describes the economic, commercial,
and regulatory landscape infl uencing these operations.
Finally, in Chapter 10 (on public engagement), interesting trends in the annual project survey data are identifi ed and refl ected,
focusing on best practice outcomes emerging from early demonstration projects and applied social research.
2.1An overview of large-scale integrated CCS projects 16
2.2Key project developments in 2012 20
2.3Regional developments 22
2.4Detailed project breakdown 29
2.5Demonstration of large-scale integrated CCS projects 38
PROJECTS
2
15P R O J E C T S
KEY MESSAGES
› The Global CCS Institute identifi ed 75 large-scale integrated CCS projects
globally, as at September 2012, a net increase of one project since the
release of the Global Status of CCS: 2011 report.
› Nine newly-identifi ed projects were added to the listings and another eight
projects were removed due to being cancelled, put on hold,
or restructured. The reasons for cancellation or being put on hold are
diverse and range from insuffi cient revenues for carbon sales to inadequate
storage regulations.
› More than half of all newly-identifi ed large-scale integrated projects are
located in China. All newly-identifi ed projects are investigating EOR options,
at least as an additional source of revenue.
› In general, moderate progress was made by projects this year, with those at
the more advanced planning stages making the most progress. There have
been two additional projects identifi ed as under construction, in the US and
in Canada.
› The fi rst peak in large-scale projects coming online that was expected to
occur in 2015–16 has shifted over the past two years and is now projected to
start from 2018–20.
The Global CCS Institute’s monitoring and analytic efforts are focused on LSIPs, as projects at this scale constitute a reliable
indicator of the demonstration of CCS technology globally, and have the critical mass needed to achieve substantial reductions
in CO2 emissions.
This chapter provides an overview of the current status of LSIPs globally, as well as key developments that have occurred
since the release of the Global Status of CCS: 2011 report, released in October 2011. This analysis is based on the Global
CCS Institute’s annual survey undertaken from March to June 2012, and includes comparisons with the Global CCS Institute’s
2011, 2010, and 2009 Global Status of CCS reports (Global CCS Institute 2011a, 2011b, and WorleyParsons et al. 2009). The
projects survey process is described at Appendix A and a detailed explanation of the stages in the asset lifecycle of a project is
included at Appendix B.
LSIPs are defi ned as projects involving the capture, transport and storage of CO2 at a scale of:
at least 800,000 tonnes of CO2 annually for a coal-based power plant; or
at least 400,000 tonnes of CO2 annually for other emission-intensive industrial facilities (including natural gas-based
power generation).
The thresholds listed above correspond to the minimum volumes of CO2 typically emitted by commercial-scale power plants
and other industrial facilities. Projects at this scale must store anthropogenic CO2 permanently in geologic storage sites to
qualify as LSIPs, and projects that involve EOR using anthropogenic CO2 can also satisfy this defi nition. Since there is currently
no clear standard or regulatory guidance on monitoring requirements involving CO2 storage associated with EOR, criteria
regarding monitoring expectations for CO2 EOR are not included in the current LSIP defi nition. Generally, CO
2 EOR projects will
undertake some monitoring and the monitoring methods will be site-specifi c.
This defi nition of LSIPs will be regularly reviewed and adapted as CCS matures; as clear CCS legislation, regulation, and
standards emerge; and as discussions progress on project boundaries, lifecycle analysis, and acceptable use of CO2.
Additionally, there are many projects around the world of a smaller scale (or which focus on only part of the CCS chain) that
are important for research and development (R&D), for demonstrating individual elements of CCS and building local capacity.
A sample of such projects that were included in the Institute’s project survey this year is provided at Appendix A.
T H E G L O B A L S TAT U S O F C C S : 2 0 1 216
2.1
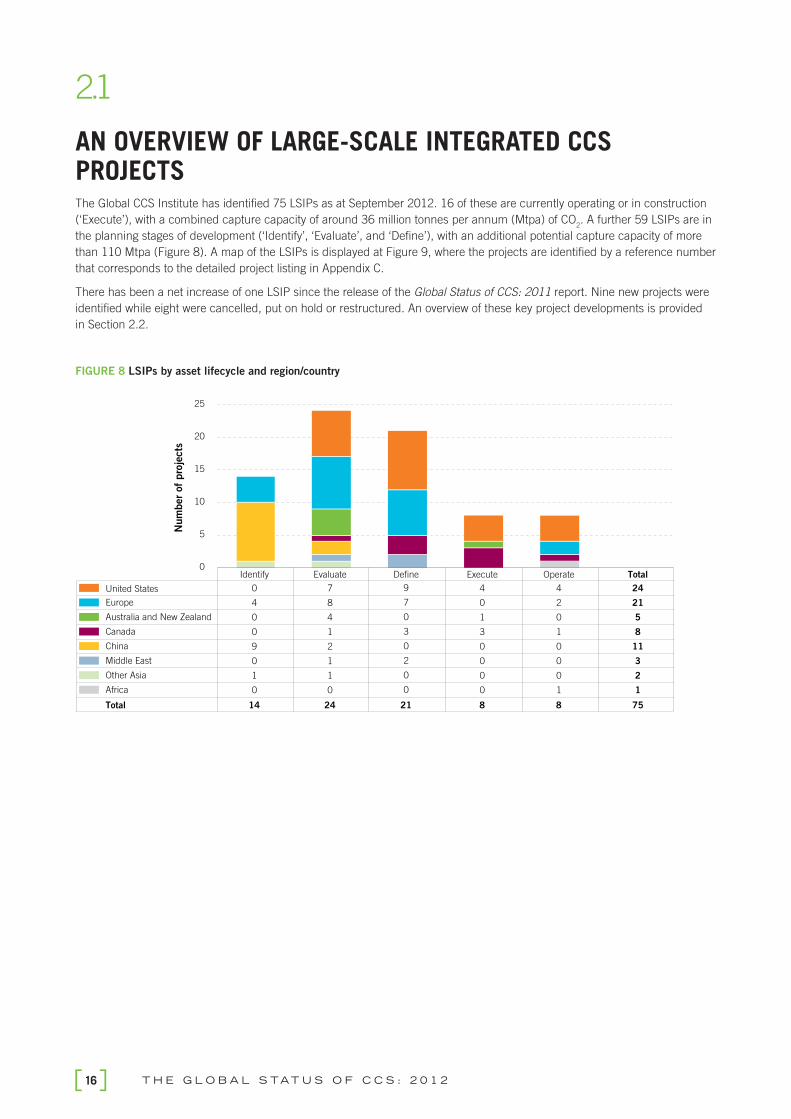
AN OVERVIEW OF LARGE-SCALE INTEGRATED CCS PROJECTSThe Global CCS Institute has identifi ed 75 LSIPs as at September 2012. 16 of these are currently operating or in construction
(‘Execute’), with a combined capture capacity of around 36 million tonnes per annum (Mtpa) of CO2. A further 59 LSIPs are in
the planning stages of development (‘Identify’, ‘Evaluate’, and ‘Defi ne’), with an additional potential capture capacity of more
than 110 Mtpa (Figure 8). A map of the LSIPs is displayed at Figure 9, where the projects are identifi ed by a reference number
that corresponds to the detailed project listing in Appendix C.
There has been a net increase of one LSIP since the release of the Global Status of CCS: 2011 report. Nine new projects were
identifi ed while eight were cancelled, put on hold or restructured. An overview of these key project developments is provided
in Section 2.2.
FIGURE 8 LSIPs by asset lifecycle and region/country
Identify Evaluate Define Execute Operate Total
United States 0 7 4 4 24
Europe 4 8 0 2 21
Australia and New Zealand 0 4 1 0 5
Canada 0 1 3 1 8
China 9 2 0 0 11
Middle East 0 1 0 0 3
Other Asia 1 1 0 0 2
Africa 0 0 0 1 1
Total 14 24 8 8 75
0
5
10
15
20
25
Num
ber
of
pro
jects
9
7
0
3
0
2
0
0
21

17P R O J E C T S
FIGURE 9 World map of LSIPs
57
53 61
1551
55
20
36
6
47 64
See N
orth
Am
eric
an m
ap fo
r deta
il
See E
uro
pe m
ap fo
r deta
il
See C
hin
a m
ap fo
r deta
il
Industry se
cto
rS
tora
ge typ
e
LS
IPs: G
LO
BA
L
Pow
er g
enera
tion
Syn
thetic
natu
ral g
as
Natu
ral g
as p
rocessin
g
Fertilise
r pro
ductio
n
Coal-to
-liquid
s (CTL)
Hyd
rogen p
roductio
n
Deep sa
line fo
rmatio
ns
Chem
ical p
roductio
n
Oil re
finery
Iron a
nd ste
el p
roductio
n
Enhanced o
il recove
ry (EO
R)
Vario
us o
ptio
ns c
onsid
ere
d/
not sp
ecifi
ed
Deple
ted o
il and g
as re
servo
irs

T H E G L O B A L S TAT U S O F C C S : 2 0 1 218
0 5 10 15 20 25 30
Identify
Evaluate
Define
Execute
Operate
Number of projects
2012 2011 2010
During the past three years, there has been a slow but steady increase in LSIPs entering construction, as demonstrated in
Figure 10. There are now eight LSIPs under construction around the world. These provide examples of viable business cases
for CCS technology given specifi c circumstances. In particular:
all but one of those LSIPs are found in North America (four in the US and three in Canada), where project proponents
benefit from an established CO2-based EOR market and the availability of substantial public funding;
only two projects are in the power generation sector (Boundary Dam in Canada and Kemper County in the US), and both
include the sale of CO2 for EOR;
two have been identified as having started construction since the previous status report (Air Products Steam Methane Re-
former EOR Project in the US and Quest in Canada); and
three include the sequestration of CO2 in deep saline formations (the Gorgon Carbon Dioxide Injection Project in Australia,
Archer Daniels Midland’s (ADM’s) Illinois Industrial CCS (ICCS) project in the US and Quest in Canada).
FIGURE 10 LSIPs by asset lifecycle and year
The Global CCS Institute estimates that up to fi ve additional LSIPs could reach a fi nal investment decision (FID) by the end of
2012 – three of which are located in North America, one in Europe, and one in the Middle East. These are:
Texas Clean Energy Project in the US;
NRG Energy Parish Project in the US;
Alberta Carbon Trunk Line (ACTL) with North West Sturgeon Refinery CO2 Stream in Canada;
Rotterdam Opslag en Afvang Demonstratieproject (ROAD) in the Netherlands; and
Emirates Steel Industries in the United Arab Emirates.
Table 1 lists the 16 LSIPs in the Operate and Execute stages. These projects have a combined capture and storage capacity
of approximately 36 Mtpa, equivalent to the emissions of more than seven million cars per year and roughly equivalent to the
current annual emissions of Singapore or New Zealand (United Nations Statistics Division 2012). This highlights the signifi cant
contribution that CCS can already bring as part of a portfolio of CO2 abatement technologies.

19P R O J E C T S
TABLE 1 LSIPs in the Operate and Execute stages (‘Active’)
NAME COUNTRY CAPTURE TYPE VOLUME CO2
(MTPA)
STORAGE TYPE DATE OF
OPERATION
Operate stage
Val Verde Gas Plants United States Pre-combustion
(gas processing)
1.3 Mtpa EOR 1972
Enid Fertilizer CO2-EOR
Project
United States Pre-combustion
(fertiliser)
0.68 Mtpa EOR 1982
Shute Creek Gas Processing
Facility
United States Pre-combustion
(gas processing)
7Mtpa EOR 1986
Sleipner CO2 Injection Norway Pre-combustion
(gas processing)
1 Mtpa
(+0.2 Mtpa in
construction)
Deep saline
formation
1996
Great Plains Synfuel Plant
and Weyburn–Midale Project
United States/
Canada
Pre-combustion
(synfuels)
3 Mtpa EOR 2000
In Salah CO2 Injection Algeria Pre-combustion
(gas processing)
1 Mtpa Deep saline
formation
2004
Snøhvit CO2 Injection Norway Pre-combustion
(gas processing)
0.7 Mtpa Deep saline
formation
2008
Century Plant United States Pre-combustion
(gas processing)
5 Mtpa
(+ 3.5 Mtpa in
construction)
EOR 2010
Execute stage
Air Products Steam Methane
Reformer EOR Project
United States Post-combustion
(hydrogen production)
1 Mtpa EOR 2012
Lost Cabin Gas Plant United States Pre-combustion
(gas processing)
1 Mtpa EOR 2012
Illinois Industrial CCS Project United States Industrial separation
(ethanol)
1 Mtpa Deep saline
formation
2013
ACTL with Agrium CO2
Stream
Canada Pre-combustion
(fertiliser)
0.59 Mtpa EOR 2014
Boundary Dam Integrated
CCS Demonstration Project
Canada Post-combustion
(power generation)
1 Mtpa EOR 2014
Kemper County IGCC Project United States Pre-combustion
(power generation)
3.5 Mtpa EOR 2014
Gorgon Carbon Dioxide
Injection Project
Australia Pre-combustion
(gas processing)
3.4–4.1 Mtpa Deep saline
formation
2015
Quest Canada Pre-combustion
(hydrogen production)
1.08 Mtpa Deep saline
formation
2015
T H E G L O B A L S TAT U S O F C C S : 2 0 1 220
2.2
KEY PROJECT DEVELOPMENTS IN 2012Since the publication of the Global Status of CCS: 2011 report, there have been signifi cant changes in the number of LSIPs; eight
projects from various countries were removed from the Global CCS Institute’s LSIP listing and nine new LSIPs were identifi ed. All
newly-identifi ed projects are considering the use of CO2 for EOR either as a primary or a secondary storage option.
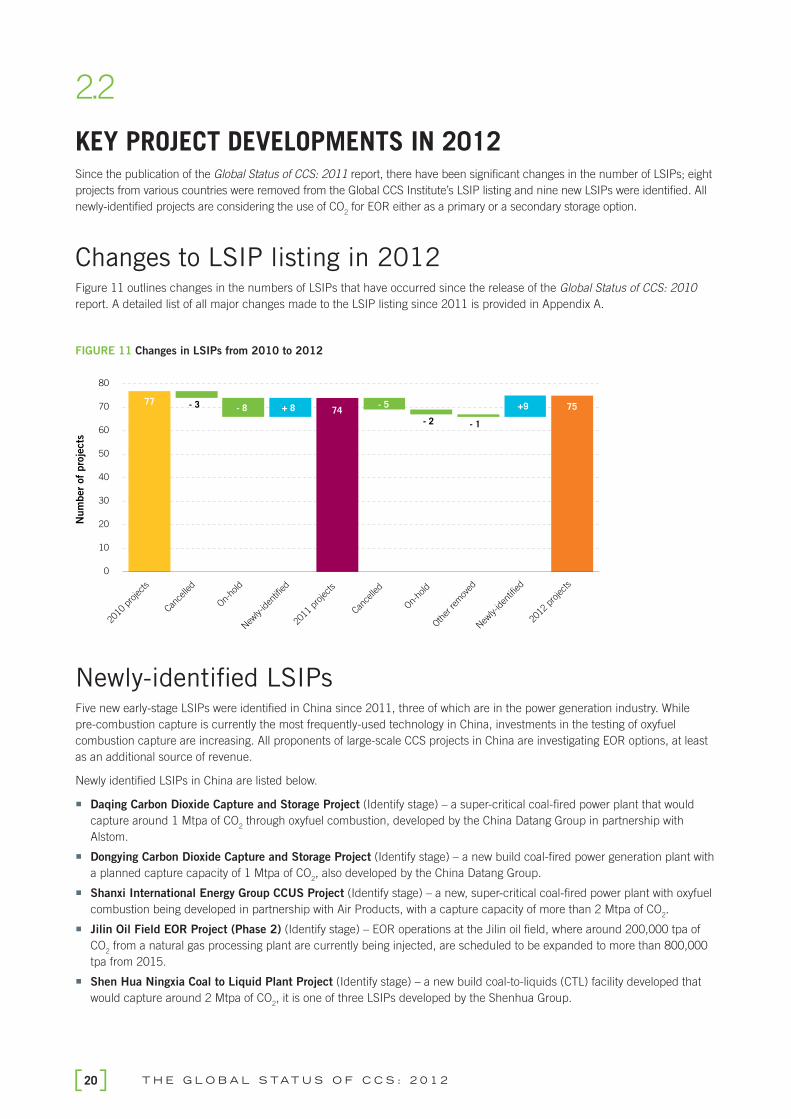
Changes to LSIP listing in 2012Figure 11 outlines changes in the numbers of LSIPs that have occurred since the release of the Global Status of CCS: 2010
report. A detailed list of all major changes made to the LSIP listing since 2011 is provided in Appendix A.
FIGURE 11 Changes in LSIPs from 2010 to 2012
77 74 75
0
10
20
30
40
50
60
70
80
2010
pro
jects
Cance
lled
On-ho
ld
New
ly-iden
tified
2011
pro
jects
Cance
lled
On-ho
ld
Oth
er re
mov
ed
New
ly-iden
tified
2012
pro
jects
- 8 + 8 +9
- 2 - 1
- 3 - 5
Num
ber
of
pro
jects
Newly-identifi ed LSIPsFive new early-stage LSIPs were identifi ed in China since 2011, three of which are in the power generation industry. While
pre-combustion capture is currently the most frequently-used technology in China, investments in the testing of oxyfuel
combustion capture are increasing. All proponents of large-scale CCS projects in China are investigating EOR options, at least
as an additional source of revenue.
Newly identifi ed LSIPs in China are listed below.
Daqing Carbon Dioxide Capture and Storage Project (Identify stage) – a super-critical coal-fired power plant that would
capture around 1 Mtpa of CO2 through oxyfuel combustion, developed by the China Datang Group in partnership with
Alstom.
Dongying Carbon Dioxide Capture and Storage Project (Identify stage) – a new build coal-fired power generation plant with
a planned capture capacity of 1 Mtpa of CO2, also developed by the China Datang Group.
Shanxi International Energy Group CCUS Project (Identify stage) – a new, super-critical coal-fired power plant with oxyfuel
combustion being developed in partnership with Air Products, with a capture capacity of more than 2 Mtpa of CO2.
Jilin Oil Field EOR Project (Phase 2) (Identify stage) – EOR operations at the Jilin oil field, where around 200,000 tpa of
CO2 from a natural gas processing plant are currently being injected, are scheduled to be expanded to more than 800,000
tpa from 2015.
Shen Hua Ningxia Coal to Liquid Plant Project (Identify stage) – a new build coal-to-liquids (CTL) facility developed that
would capture around 2 Mtpa of CO2, it is one of three LSIPs developed by the Shenhua Group.

21P R O J E C T S
A further four new LSIPs were identifi ed in other countries, all in the power generation industry.
Caledonia Clean Energy Project (UK, Identify stage) – a new build integrated gasification combined cycle (IGCC) power
plant proposed by Summit Power that would capture up to 90 per cent of the plant’s CO2 emissions, possibly for use in EOR
in the North Sea. The project will be proposed for funding under the UK’s £1 billion CCS competition.
Sargas Green Power Plant Malta (Malta, Identify stage) – a new build fluidised bed boiler power plant that would capture
around 1.2 Mtpa of CO2 from two 180 MWe modules for use in EOR.
Industrikraft Möre AS Norway (Norway, Identify stage) – a new build natural gas-based power plant planned to capture
more than 1.4 Mtpa from 2016.
NRG Energy Parish CCS Project (US, Define stage) – retrofit of post-combustion CO2 capture from a 240 MWe process
stream at a sub-critical coal-fired power plant, planned to capture around 1.5 Mtpa of CO2 for use in EOR by mid-2015.
Projects removed from LSIP listing Eight projects at various stages of development were removed from the LSIP listing since 2011.
Longannet Project (UK, Define stage) – cancelled in October 2011, following an announcement by the UK Department of
Energy and Climate Change that it would not fund the construction of the CO2 capture facilities.
Vattenfall Jänschwalde (Germany, Define stage) – cancelled in December 2011, citing the lack of government support and
the absence of a clear legal framework.
Sweeny IGCC Power Project (US, Evaluate stage) – cancelled in April 2012 following the split of ConocoPhillips Company
and Phillips 66 Company.
Project Pioneer (Canada, Define stage) – cancelled in April 2012 citing the insufficient price of emissions reductions and
revenue from carbon sales.
Coolimba Power Project (Australia, Identify stage) – removed in May 2012 after the proponent confirmed it had
reprioritised its investments.
Good Spring IGCC (US, Identify stage) – EmberClear announced the project was restructured as a natural gas combined
cycle (NGCC) plant in May 2012, with CCS plans at the site being put on hold.
Peel Energy CCS Project (UK, Evaluate stage) – Ayrshire Power withdrew its planning application for the new Hunterston
power plant in June 2012, thereby putting the project on hold.
Browse Reservoir CO2 Geosequestration Project (Australia, Evaluate stage) – removed August 2012 after the proponent
had confirmed that it had put the project on hold.
Additional details on some of these projects are provided in Section 2.3.
Project progressModerate progress was made by LSIPs this year, with projects at the Defi ne stage advancing the most. Of the 24 LSIPs that
were at the Defi ne stage last year, nine indicated their front end engineering design (FEED) study was 76–100 per cent
complete in the Institute’s annual survey, with a further two indicating a 50–75 per cent completion. In a positive development,
two of these LSIPs, both in the hydrogen production industry, moved to the Execute stage.
Construction of Air Products’ new build hydrogen plant in Texas started in August 2011 and the plant is expected to
become operational by the end of 2012. Around 1 Mtpa of CO2 will be captured and used in EOR.
On 5 September 2012, Shell Canada announced it would go ahead with its Quest project in Alberta. This followed the
formal approval of the project by the Energy Resources Conservation Board (ERCB) in July 2012. More than 1 Mtpa of
CO2 will be captured from hydrogen manufacturing units at the Scotford Upgrader near Edmonton, and transported by
underground pipeline for injection into a 2 km deep saline formation. In October 2011, the project’s storage development
plan was awarded the world’s first certificate of fitness for safe CO2 storage by Det Norske Veritas (DNV).
Five additional projects currently in the Defi ne stage could reach FID by end of 2012 or early 2013. Notable developments that
occurred in the past year for three of these projects are listed below.
A storage permit was obtained in March 2012 for the ROAD project in the Netherlands. This was the first CO2 storage permit
of this kind applied for under the European Union’s CCS Directive, and is an encouraging precedent for other projects that
included the planned storage of CO2 offshore in the North Sea.
Progress on Summit Power’s Texas Clean Energy Project in the US has been steady since a long-term CO2 sales agreement
was signed with Whiting Petroleum Corporation last year. A Record of Decision (ROD) was issued by the US Department of

T H E G L O B A L S TAT U S O F C C S : 2 0 1 222
Energy (DOE) regarding the funds allocated to the Texas Clean Energy Project in October 2011. This ROD formally allows
public funds previously allocated to the project to be spent beyond engineering and design studies. In addition, all key
permits and off-take agreements are now in place and both the Engineering, Procurement and Construction (EPC) and the
Operation and Maintenance (O/M) contracts have been signed. The recently announced introduction of major new project
participants and signing of a memorandum of understanding (MoU) with Sinopec Energy and the Export-Import Bank of
China to advance and help assure the financing for the project supports the view that this project may reach final investment
descision (FID) by the end of 2012.
In Abu Dhabi, Emirates Steel Industries’ CCS project is set to become the Gulf’s first large-scale project in operation after
Abu Dhabi National Oil Company (ADNOC) and Masdar signed a formal agreement in January 2012, concluding three
years of negotiations. In May 2012, ADNOC also announced it was investigating offshore CO2 EOR options, which could
lead to further storage opportunities for Abu Dhabi’s CCS projects in development.
Further to this, two projects that were at the Evaluate stage last year made signifi cant progress and moved up to the Defi ne
stage of the asset lifecycle.
2Co Energy’s Don Valley Power Project in the UK progressed following the appointment of legal and financial advisers
to assist with the delivery of the project, which is expected to be commissioned in 2016. FEED studies have now been
completed and a capture technology provider has been selected (Linde Gas). The project, which has attracted investment
from Samsung C&T and the BOC Group, has a strong chance of reaching FID in 2013, especially as it was announced to
be the front runner in the European Union’s NER300 funding competition in July 2012.
Swan Hills Synfuels A ‘In Situ Coal Gasifi cation/Power Generation Project’ in Canada, with a detailed FEED study under
way and a capture technology provider selected. Negotiations for the CO2 off-take agreements are at the advanced stages
and the project could reach FID by the end of 2013.
For the 34 remaining projects that were at the Evaluate or Identify stages last year, overall progress has been more limited.
Around 15 of these projects were more than halfway through pre-feasibility studies last year; three are now cancelled, with the
remaining projects reporting no signifi cant progress, or in some cases a regression.
2.3
REGIONAL DEVELOPMENTS
North America
CANADA
Canada continues a robust large-scale CCS demonstration program (Figure 12), which includes:
the Great Plains/Weyburn–Midale project, which continues to inject around 3 Mtpa of CO2 for EOR;
three LSIPs that are in construction (Execute stage), SaskPower’s Boundary Dam project, Enhance Energy’s Alberta Carbon
Trunk Line (ACTL) with Agrium and Shell’s Quest; and
two projects (Enhance Energy’s ACTL with Northwest Sturgeon Refinery and Swan Hills Synfuels) that may be in a position
to progress to a FID in 2012-13.
Following the formal approval issued by the ERCB regarding Shell’s Quest project in July 2012, Shell Canada announced on
5 September 2012 that it would go ahead with the project. The project is scheduled to come online in 2015 and will capture
more than 1 Mtpa of CO2 for injection into an onshore deep saline formation. Meanwhile, in April 2012, TransAlta announced
the cancellation of its Project Pioneer, noting that while costs and technology performance were as expected, the potential
revenue from CO2 sales and offset credits were insuffi cient to justify the project at the current time.
At the pilot scale, Husky Energy Inc. announced in May 2012 that it had started operations at its ethanol plant in Lloydminster,
Alberta. Around 90,000 tpa of CO2 will be captured at the plant and transported by truck to enhance recovery in Husky’s heavy
oil projects.

23P R O J E C T S
Industry sector Storage type
LSIPs: NORTH AMERICA
Power generation
Synthetic natural gas
Natural gas processing
Fertiliser production
Coal-to-liquids (CTL)
Hydrogen production
Deep saline formations
Chemical production
Oil refinery
Enhanced oil recovery (EOR)
Various options considered/
not specified
39
41
11
3544
26
30
1219
16
52
513
49
10
43
3
21
33
1 3727
8
2
17
22
9
18 42
14
34
56
British
Columbia
Alberta
Saskatchewan
CANADA
UNITED STATES OF AMERICA
California
Texas
North Dakota
Wyoming
Kansas
Illinois
Indiana
Kentucky
New Jersey
Louisiana
Mississippi
Oklahoma
MEXICO
FIGURE 12 North America map of LSIPs
T H E G L O B A L S TAT U S O F C C S : 2 0 1 224
In April 2012 the formation of the Canadian Oil Sands Innovation Alliance was announced. This group of 12 major oil sands
developers has the objective of mitigating the environmental impact of oil sands projects and has identifi ed GHG emission
reductions as one of the four main areas of focus for the Alliance, with CCS expected to play an important role. In Alberta, the
Regulatory Framework Assessment project, which aims to develop world class regulations for all elements of CCS, is expected
to report its recommendations to the Alberta Minister of Energy by the end of 2012.
UNITED STATES
The US continues to be the country with the largest number of LSIPs, with 24 active and planned projects (Figure 12). The
US also has the largest number of active projects, with four projects in operation and four in construction (Execute stage). In
addition, the US has the most advanced portfolio of projects. All of the 16 US projects in planning are either at the Evaluate or
Defi ne stage, and their continued progress over past years is largely driven by domestic demand for CO2 for use in EOR. One
LSIP, the Good Spring IGCC project in Pennsylvania (Identify stage) was removed from the Institute’s LSIP listings in June 2012
after its proponent, EmberClear Corporation, announced the project was restructured from a coal-based IGCC to a natural gas-
based combined cycle plant (NGCC) without CCS.
The US DOE is providing fi nancial assistance to fi ve power and three industrial LSIPs (see section 3.3). This includes funding
to three of the projects which are under construction. The Air Products Steam Methane Reformer EOR Project; the Illinois-
ICCS project; and the Kemper County IGCC Project are expected to begin operations in 2012, 2013, and 2014 respectively.
In addition, the DOE is continuing to support nine large-volume (≥1 Mt) CO2 injection tests under seven Regional Carbon
Sequestration Partnerships. The Southeast Regional Carbon Sequestration Partnership (SECARB) began injection in Mississippi
in 2009, and the Midwest Geologic Sequestration Consortium (MGSC) began injection in Illinois in November 2011. The
majority of current US LSIPs include the planned use of the captured CO2 for EOR, which is refl ective of the improved
economics of utilisation coupled with storage. The DOE’s integrated coal program technology roadmap is based on continuous
technology development, designed to reduce the cost of capture and establish the safety and effi cacy of CO2 storage.
ChinaChina continues to take a systematic approach to the deployment of CCS, focusing on research and development followed by
the roll out of pilot projects and demonstration projects. Seven of these projects have been included in the Institute’s 2012
annual survey and are listed at Appendix A. Progress has been made with the successful demonstration of smaller-scale
pilot projects. As evidenced by the growing number of planned LSIPs, government and industry recognise the importance of
CCS for the country’s energy future (Figure 13). The growing number of proposals involving CO2 utilisation and EOR highlight
the commercial challenges faced by projects and the importance of establishing a business case for CCS. Cross-sectoral
collaboration also remains a challenge for CCS project developers, particularly for power generators that do not have access to
a suitable CO2 storage site.
Material changes since the release of the Global Status of CCS: 2011 report include the identifi cation of fi ve new LSIPs, as
discussed previously in this chapter. There are now 11 LSIPs in China which are all in the early development stages (nine in
Identify and two in Evaluate). Most of these projects involve major state-owned power, oil, or coal companies, as well as a wide
array of international partners.
China Datang Corporation is a large state-owned power generation enterprise whose project, the Datang Daqing Oxyfuel
Combustion CCS Demo, was added to the Institute’s LSIP listing in December 2011. Datang Heilongjiang Power Generation Co
Ltd (a subsidiary of China Datang Corporation) is developing this new-build super-critical coal-fi red power plant near Daqing
city in Heilongjiang province. Around 1 Mtpa of CO2 is planned to be captured through oxyfuel combustion from one of two
350 MWe cogeneration of heat and power units at the plant. Options for the storage of CO2 include deep saline formations and
the use of CO2 for EOR in nearby oil fi elds.
In addition to the Daqing CCS project, Datang intends to build a 1000 MW coal-fi red power plant in Dongying, Shandong
province. In November 2011 Alstom signed an agreement with Datang for Alstom to develop the CCS facilities, including
feasibility studies. This project plans to capture 1 Mtpa of CO2 from 2020.
In another newly identifi ed LSIP this year, the Shanxi International Energy Group (SIEG) intends to build a 350 MW oxyfuel
combustion power plant with CO2 capture, utilisation, and storage facilities. Air Products has been awarded a contract from
SIEG to perform a feasibility study and detailed cost estimates this year. The project plans include the capture of 2 Mtpa CO2
using Air Products’ oxyfuel CO2 purifi cation technology.
The China National Petroleum Company (CNPC) continues demonstration of small-scale operations. CNPC’s project has seen
the pilot plant of the Jilin oil fi eld successfully inject around 200,000 tpa of CO2 from a natural gas processing facility for EOR
by the end of 2011. The planned next phase is to expand capacity to 0.8–1 Mtpa by 2015 (WorleyParsons 2012).
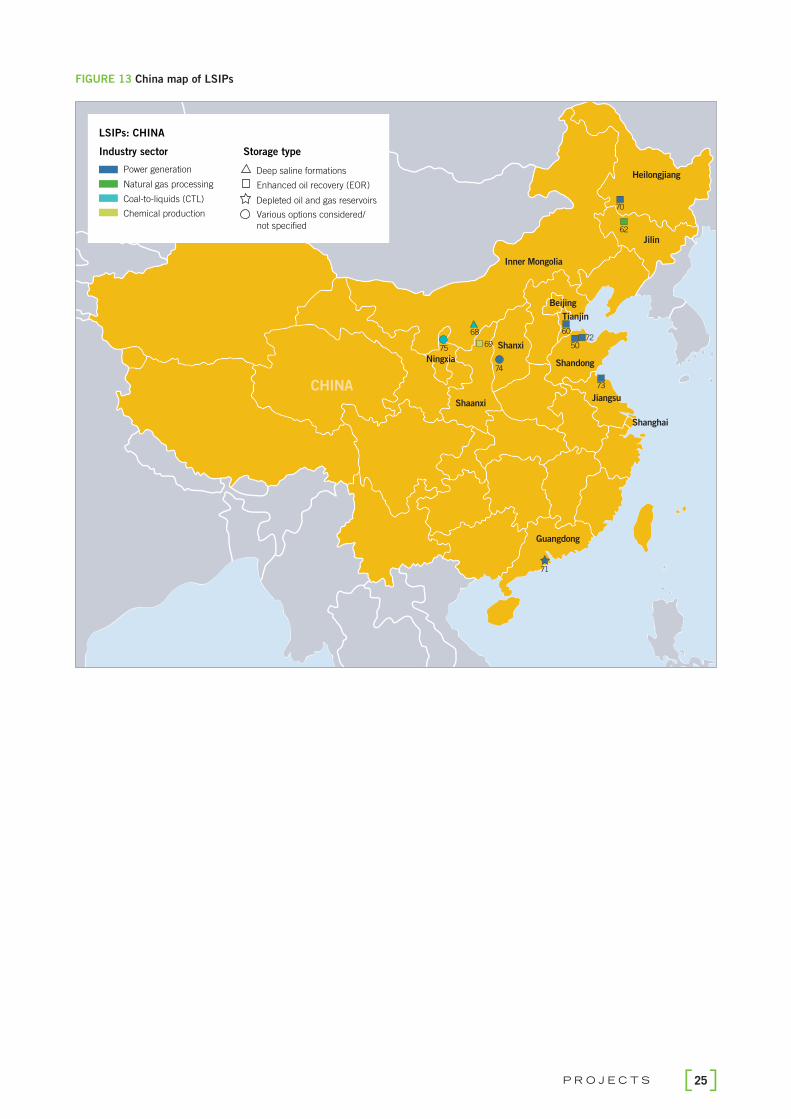
25P R O J E C T S
FIGURE 13 China map of LSIPs
Ningxia
Beijing
Heilongjiang
Shanghai
Jilin
Tianjin
Inner Mongolia
Guangdong
Shaanxi
Shanxi
Shandong
JiangsuCHINA
Industry sector Storage type
LSIPs: CHINA
Power generation
Natural gas processing
Coal-to-liquids (CTL)
Deep saline formations
Chemical production
Enhanced oil recovery (EOR)
Various options considered/
not specified
Depleted oil and gas reservoirs
71
73
7250
60
70
62
75
68
69
74

T H E G L O B A L S TAT U S O F C C S : 2 0 1 226
EuropeThere have been many developments in Europe since 2011 which clearly illustrate the role governments and other public
bodies can play in infl uencing the progress of technology (Figure 14).
In the UK, there was broad and strong political support for CCS, the transposition of the European Union’s (EU) CCS Directive,
and the re-launch of its £1 billion CCS competition, even though two projects were cancelled (Longannet and Peel Energy).
In Germany, the transposition of the CCS Directive was much delayed, resulting in a draft law with more restrictive conditions
and fi nancial support more limited to research activities. As a result, one of Europe’s most advanced CCS demonstration
projects, Vattenfall’s Jänschwalde project, was cancelled and withdrawn from the EU’s New Enterants’ Reserve 300 (NER300)
funding program.
In April 2012, the UK re-launched its CCS competition – a ‘CCS Commercialisation Programme’ – with £1 billion of funding
to support upfront costs and additional support through ‘low carbon contracts for difference’. The competition closed to bids
in July 2012 and it is widely expected that the fi ve projects remaining in the NER300 program have placed bids. The new
competition was open to both solid and gas-fi red electricity generators and industrial CO2 emitters. Storage is to be offshore
and the plants are to be commercial scale and operational by 2020. A further £125 million would be available for a CCS
research and innovation program.
For other European countries involved in CCS activities, the main focus of interest has continued to be the ECs NER300
program. There are still 10 candidate projects in this competition and the release by the Commission of a Working Document
setting out the ‘current order of selection’ and a reserve list in July 2012 fuelled increased discussion around this program.
The fi rst project on the list is the Don Valley IGCC project (UK) followed by the Bełchatów CCS project (Poland). Both of these
projects could expect to receive NER300 co-funding, subject to the availability of suffi cient other funds to cover the remaining
50 per cent of the costs of the CCS part of their project and the confi rmation of co-funding by their Member State. A third
project, the Air Liquide industrial application Green Hydrogen CCS project (the Netherlands), may also be funded. A fi nal
decision on project funding will be taken towards the end of 2012. In the meantime, the Commission continues to strongly
advocate CCS as an important part of its low-carbon economy future.
The NER300 program has been impacted by the low carbon price over recent months during the period when the European
Investment Bank (EIB) tendered the fi rst 200 million allowance units to fund the program. As a result, less money has been
raised than expected. Funding is presently estimated to be between €1.3–1.5 billion, a portion of which will also be spent on
innovative renewable energy projects.
Two major LSIPs outside the NER300 program, the ROAD project in the Netherlands and the OXYCFB 300 Compostilla project
in Spain have made progress. The ROAD project received a positive opinion by the European Commission concerning its
planned storage site (the fi rst such opinion applied for under the CCS Directive), while the Compostilla project made progress
in developing its geologic storage sites in the Duero Basin, both in the area of Sahagún for the commercial storage site and at
the underground laboratory site of Hontomín.
Furthermore, there have been signifi cant technological developments, including the opening of the TCM in May 2012. There
has been a marked increase in interest in the possible application of CCS to a number of bio-energy projects that could lead to
the development of carbon-negative projects in the future, in particular in the Baltic region and Romania.
Despite the progress made, the EC policy objective of having up to 12 commercial-scale demonstration plants operating in
Europe by 2015 is no longer achievable, with 4–5 projects operating in the next 5–6 years being a more realistic scenario.

27P R O J E C T S
FIGURE 14 Europe map of LSIPs
France
Malta
Poland
Romania
Bulgaria
Italy
NetherlandsUnited
Kingdom
Spain
Norway
Industry sector Storage type
LSIPs: EUROPE
Power generation
Natural gas processing
Hydrogen production
Deep saline formations
Iron and steel production
Enhanced oil recovery (EOR)
Various options considered/
not specified
Depleted oil and gas reservoirs
448
28
54
25
2958
23
24
32
40
67
65
31
66
45
38
46
59
63
7
T H E G L O B A L S TAT U S O F C C S : 2 0 1 228
Middle East and North Africa (MENA)The Middle East has some of the highest per capita emissions of CO
2 in the world. In addition, the region has a number of
natural advantages including excellent storage potential and many opportunities for EOR. However, only the United Arab
Emirates (UAE) is actively pursuing an interest in CCS.
When announced in 2007, the Masdar CCS Network in Abu Dhabi was the most ambitious CCS project in the world. The
project scope was for a fully-integrated network designed to capture approximately 6 Mtpa of CO2 from fi ve industrial-scale
emitters, and transport it through a pipeline network for delivery to the Abu Dhabi National Oil Company (ADNOC) for use in EOR.
The range of emitters included the following LSIPs:
Emirates Steel Industries (ESI) – capture of 0.8 Mtpa of CO2 from a dehydration and compression unit at an existing steel plant;
Emirates Aluminium (EMAL) – capture of 2 Mtpa of CO2 from an existing natural gas-based power plant at an aluminium
smelter complex; and
Hydrogen Power Abu Dhabi (HPAD) – new build hydrogen combined cycle power plant designed to capture 1.7 Mtpa of
CO2 (90 per cent of the plant’s emissions).
The Masdar CCS Network is expected to further consider incorporating CCS on its Taweelah Asia Power Co project and the
Habshan gas separation plant, however, in the near future will concentrate efforts on the ESI project.
In North Africa, the In Salah project, operational since 2004, continues to inject around 1 Mtpa of CO2 and play an important
role in the research and development of storage monitoring techniques.
Australia and New ZealandProgress of CCS projects in Australia continues to be dependent on the availability of government funding and there has been
measured progress for four Australian LSIPs over the past 12 months.
In February 2012, the CarbonNet Project received AU$100 million in funding, with AU$70 million as part of the Australian
Government’s CCS Flagships program and AU$30 million from the Victorian State Government. The project, which is
investigating the potential for capturing CO2 from electricity generation and new coal-based industries in the Latrobe Valley
and storing it within Victoria’s geologic basins, is currently at the Evaluate stage. Extensive research and development is
currently being undertaken, including modelling and testing of potential CO2 storage sites.
The South West CO2 Geosequestration (formerly Collie) Hub in Western Australia is currently in the Evaluate stage, focusing
on pre-competitive data acquisition. A drilling program to collect data from a 2.9 km deep well in the investigation area was
completed in March 2012. In addition, an unincorporated joint venture (UJV) agreement has been finalised by the South
West Hub industry partners. The UJV will lead the commercial deployment of the project when it transitions from the
pre-competitive data acquisition phase to CO2 transport and trial injection.
The Gorgon Project is an AU$43 billion offshore gas development in the Indian Ocean and includes the Gorgon CO2 Injection
Project, which is expected to be operational in 2015. More than 3.4 Mtpa of the separated CO2 will be injected and stored
in the Dupuy Formation over the anticipated 40 year life of the project. This project will be the world’s largest initiative for
geologic storage of CO2.
The Surat Basin CCS Project (formerly Wandoan) in Central Queensland is currently being restructured. This power generation
project with post-combustion capture is scheduled to come online in 2020 and is designed to capture around 1 Mtpa of CO2
that would be stored in an onshore deep sandstone formation. CO2 injection testing at the targeted storage site could begin
in 2013.
In addition to this, the pilot-scale Callide Oxyfuel Project, an international low-emissions coal demonstration project at the Callide
Power Station in Biloela (Queensland), achieved operation of its fi rst boiler in full oxyfi ring mode in March 2012. The project has
entered an 18–24 month campaign of process testing, which aims to capture 90 per cent of the CO2 emissions from coal combustion.
Two Western Australian LSIPs were removed from the LSIP listings this year after their respective proponents confi rmed that the
projects were not being progressed further. The Coolimba Power Project (Identify stage) is considered defi nitely cancelled after
the proponent confi rmed no further investment would be made into the project. The Browse Reservoir CO2 Geosequestration
Project (Evaluate) was classifi ed as on hold. While Browse Joint Venture has undertaken geosequestration evaluation studies for
the proposed James Price Point development in line with the Browse Retention Lease conditions, these studies have concluded
that geosequestration is not currently commercially viable. Geosequestration will be maintained as a potential option for managing
carbon from the Browse LNG Development should it become economically and technically viable during the life of the project.
In New Zealand, Solid Energy’s Southland Coal to Fertiliser Project includes the capture of around 1 Mtpa of CO2, that would
be stored in onshore deep saline formations. The project could commence operations in 2018.

29P R O J E C T S
2.4
DETAILED PROJECT BREAKDOWN
Geographic distribution of LSIPsThe US has the largest number of CCS projects in both the active and planning stages, with half of active LSIPs and more than
a quarter of all planned LSIPs (Figure 15). Because LSIPs that were cancelled or put on hold during the past three years have
mostly not been followed by the development of new projects, there are now no LSIPs at the earliest stage of development
planning (Identify) stage in the US.
Conversely, China has more than doubled its number of planned LSIPs from fi ve to 11 in just two years, and has now
overtaken Canada in potential capture capacity (Figure 16). All but two of the Chinese LSIPs, however, are in the Identify stage,
particularly for their storage components.
Although the total number of LSIPs in Europe remained the same between 2010–12, six projects which were quite advanced
in development planning (Evaluate and Defi ne) have been cancelled or put on hold since 2010 and replaced with new, earlier
stage projects.
FIGURE 15 LSIPs by region and year
0 5 10 15 20 25 30
Africa
Other Asia
Middle East
Australia and New Zealand
Canada
China
Europe
United States
Number of LSIPs
2012 2011 2010

T H E G L O B A L S TAT U S O F C C S : 2 0 1 230
FIGURE 16 Volume of CO2 potentially stored by region or country
Distribution of LSIPs by industryThere has been little change in the distribution of LSIPs across industries during the past three years, as demonstrated in
Figure 17.
The largest number of projects in the planning stages of development continues to be in the power generation industry, with 40
LSIPs totalling more than 70 Mtpa in potential CO2 capture capacity. In addition, only two large-scale power generation projects
with CCS are currently being constructed around the world. Three power generation LSIPs could reach FID in 2012–13, two of
which are located in the US (Texas), and one in Europe. The paucity of commercial-scale power generation projects with CCS
progressing through to construction is likely to continue in the coming years as all cancelled projects in 2011–12 were power
projects, with more than half of them being at the most advanced stage of planning development (Defi ne stage). Further to this,
national energy and climate change policy frameworks have increasingly favoured natural gas-based rather than coal-based
power generation, while low natural gas prices continued to support the business case for natural gas-based power generation.
Planned applications of CCS have slightly increased in the synthetic natural gas, fertiliser, and hydrogen production sectors,
while there remains a paucity of CCS projects in other high-emitting industries such as iron and steel production or oil refi ning.
In particular, LSIP cancellations that occurred in these industries over the past three years have not been compensated by new
project announcements, and there is still no commercial-scale CCS project being planned in the cement industry, which now
represents around 8 per cent of all anthropogenic CO2 emissions globally (Olivier et al. 2011).
0 5 10 15 20 25 30 35 40 45 50 55 60 65 70
Africa
Other Asia
Canada
China
Volume of CO2 (Mtpa)
Identify Evaluate Define Execute Operate
Australia and New Zealand
Middle East
Europe
United States

31P R O J E C T S
FIGURE 17 LSIPs by industry sector and year
Number of projects
2012 2011 2010
0 5 10 15 20 25 30 35 40 45
Other
Pulp and paper
Cement production
Oil refining
Iron and steel production
Chemical production
Coal-to-liquids (CTL)
Hydrogen production
Fertiliser production
Synthetic natural gas
Natural gas processing
Power generation

T H E G L O B A L S TAT U S O F C C S : 2 0 1 232
FIGURE 18 Volume of CO2 captured by industry sector and year
0 5 10 15 20 25 30
New unit at existing plant
Retrofit to existing plant
New build construction
Retrofit to plant in construction
Retrofit to existing plant
New build construction
Retrofit to plant in construction
Retrofit to existing plant
New build construction
Number of projects
Natural gas processing
Other industries
Power generation
Identify Evaluate Define Execute Operate
FIGURE 19 LSIPs by industry sector and project structure
0 10 20 30 40 50 60 70 80 90
2010
2011
2012
Other industries
2010
2011
2012
Natural gas processing
2010
2011
2012
Power generation
Identify Evaluate Define Execute Operate
Volume of CO2 (Mtpa)

33P R O J E C T S
Figure 18 shows the potential volume of CO2 captured by industry sector and by survey year, demonstrating an overall
decrease in planned capture capacity. In particular, this fi gure highlights the marked decrease in CO2 capture capacity in the
power generation sector since 2010. While the net number of power generation projects has remained constant since 2010, a
number of projects with a large CO2 capture capacity have been cancelled or put on hold and replaced with smaller projects.
Figure 19 shows the current distribution of LSIPs by industry sector and project structure (new build vs. retrofi t). Projects
involving the retrofi t of CCS technology at an existing plant are progressively being replaced by new-build applications as
effi ciency and GHG emission regulations become more stringent, particularly for power generation projects. Out of the 17 new
LSIPs identifi ed since 2010, only four (less than one-quarter) are retrofi t constructions. In contrast, well over one-third of the
LSIPs that were cancelled or put on hold since 2010 were retrofi t projects.
Distribution of LSIPs by capture technologyThe project announcements and cancellations that occurred during the past year have caused a slight shift in the distribution
of LSIPs across capture technologies in some regions.
Pre-combustion capture is still the most frequently chosen CO2 capture technology in North America, with 75 per cent of all
projects in both the US and Canada (Figure 20). However, the share of pre-combustion capture has decreased in the US
since last year (88 per cent), due to the cancellation of two pre-combustion LSIPs and the announcement of one new post-
combustion LSIP.
In 2011, an overwhelming majority (83 per cent) of projects in China included pre-combustion capture. Due to fi ve new LSIPs
being announced this year, China’s portfolio of capture technologies in planning has become signifi cantly more balanced,
with 40 per cent of projects including pre-combustion capture and the remaining 60 per cent split between all capture
technologies.
There has been little change in the distribution of capture technologies in other regions, with pre-combustion being the most
widely proposed capture technology in Canada as well as Australia and New Zealand, while post-combustion capture remains
the preferred option in Europe, representing 52 per cent of all CCS projects.
FIGURE 20 LSIPs by capture type and region
0 5 10 15 20 25
Africa
Other Asia
Middle East
Australia and New Zealand
Canada
China
Europe
United States
Number of projects
Pre-combustion (including gas processing) Post-combustion
Oxyfuel combustion Industrial separation Not decided

T H E G L O B A L S TAT U S O F C C S : 2 0 1 234
Pre-combustion Post-combustion Oxyfuel combustion
Industrial separation Various/not decided
Number of projects
Power generation
Industrial
applications
(excl. gas processing)
2012
2011
2012
2011
2010
2010
0 5 10 15 20 25 30 35 40 45
While pre-combustion is still the most frequently chosen capture technology by LSIPs in development planning, with 44 per
cent of all planned projects, its share has signifi cantly decreased since last year (55 per cent) as new projects with oxyfuel
combustion or industrial separation capture were announced. Post-combustion capture remains the second most frequently
chosen technology with around 31 per cent of all planned projects.
In the power generation sector, post-combustion capture is the most widely chosen option, with 45 per cent of all power
projects, up by 5 per cent since last year (Figure 21). Pre-combustion capture comes second (33 per cent), followed by
oxyfuel combustion capture (14 per cent).
Further details regarding the maturity levels of CO2 capture technologies can be found in Chapter 6 of this report.
FIGURE 21 LSIPs by capture type and industry
Distribution of LSIPs by transport typePipelines continue to be the primary method chosen for transporting the high quantities of CO
2 associated with CCS. Pipeline
transport has been identifi ed in 92 per cent of all LSIPs, with only four projects stating that transportation will occur via
shipping. The majority of pipelines are identifi ed as being onshore with offshore pipelines being more common in Europe than
in any other region.
Most pipeline projects involve privately owned and operated transportation infrastructure, though 22 per cent of projects with a
pipeline transport system use or will use other entities’ infrastructure for the carriage of CO2.
Further details regarding the transport of CO2 can be found in Chapter 7 of this report.
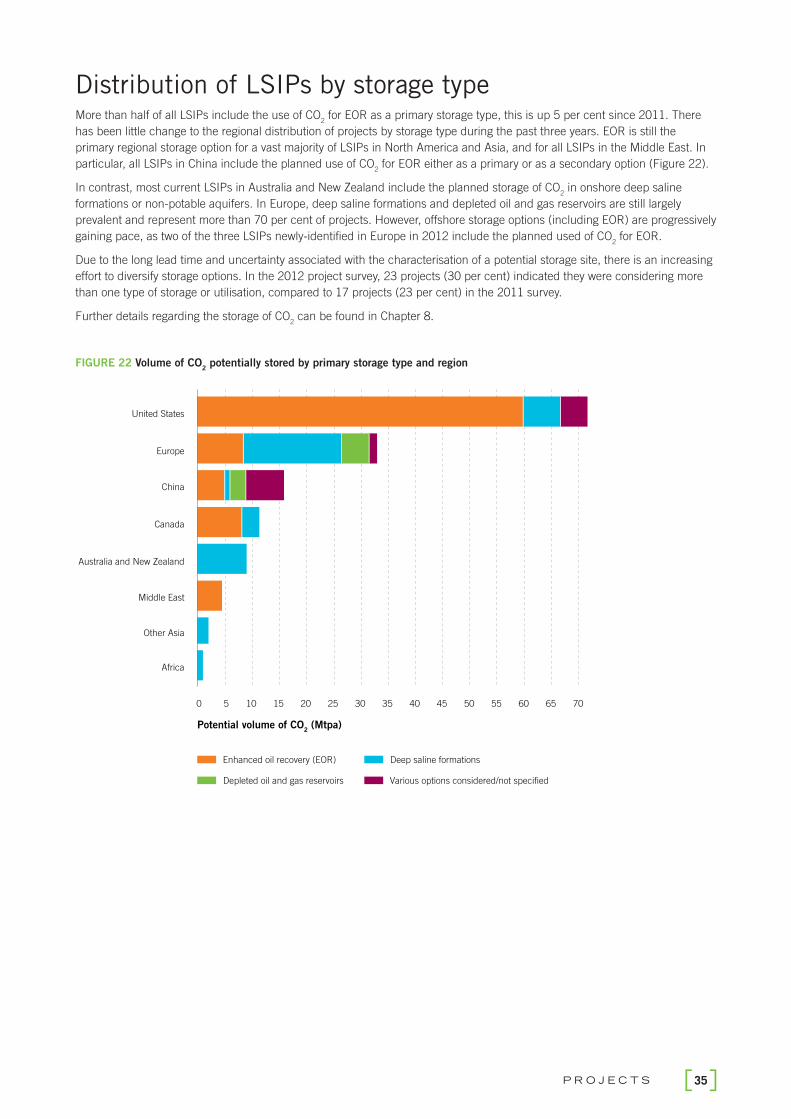
35P R O J E C T S
Distribution of LSIPs by storage typeMore than half of all LSIPs include the use of CO
2 for EOR as a primary storage type, this is up 5 per cent since 2011. There
has been little change to the regional distribution of projects by storage type during the past three years. EOR is still the
primary regional storage option for a vast majority of LSIPs in North America and Asia, and for all LSIPs in the Middle East. In
particular, all LSIPs in China include the planned use of CO2 for EOR either as a primary or as a secondary option (Figure 22).
In contrast, most current LSIPs in Australia and New Zealand include the planned storage of CO2 in onshore deep saline
formations or non-potable aquifers. In Europe, deep saline formations and depleted oil and gas reservoirs are still largely
prevalent and represent more than 70 per cent of projects. However, offshore storage options (including EOR) are progressively
gaining pace, as two of the three LSIPs newly-identifi ed in Europe in 2012 include the planned used of CO2 for EOR.
Due to the long lead time and uncertainty associated with the characterisation of a potential storage site, there is an increasing
effort to diversify storage options. In the 2012 project survey, 23 projects (30 per cent) indicated they were considering more
than one type of storage or utilisation, compared to 17 projects (23 per cent) in the 2011 survey.
Further details regarding the storage of CO2 can be found in Chapter 8.
FIGURE 22 Volume of CO2 potentially stored by primary storage type and region
0 5 10 15 20 25 30 35 40 45 50 55 60 65 70
Africa
Other Asia
Middle East
Australia and New Zealand
Canada
China
Europe
United States
Potential volume of CO2 (Mtpa)
Enhanced oil recovery (EOR) Deep saline formations
Depleted oil and gas reservoirs Various options considered/not specified
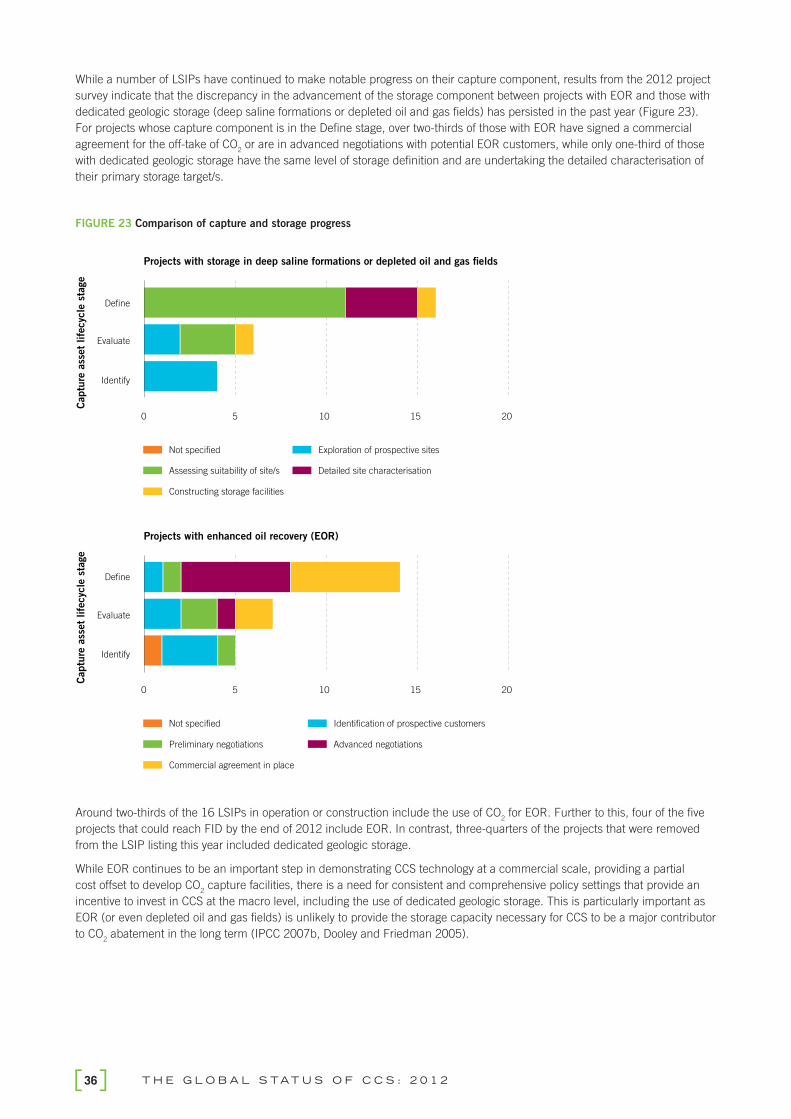
T H E G L O B A L S TAT U S O F C C S : 2 0 1 236
Not specified Exploration of prospective sites
Assessing suitability of site/s
Constructing storage facilities
Detailed site characterisation
0 5 10 15 20
Identify
Evaluate
Define
Captu
re a
sset
life
cyc
le s
tage
Projects with storage in deep saline formations or depleted oil and gas fields
Not specified Identification of prospective customers
Preliminary negotiations
Commercial agreement in place
Advanced negotiations
0 5 10 15 20
Identify
Evaluate
Define
Captu
re a
sset
life
cyc
le s
tage
Projects with enhanced oil recovery (EOR)
While a number of LSIPs have continued to make notable progress on their capture component, results from the 2012 project
survey indicate that the discrepancy in the advancement of the storage component between projects with EOR and those with
dedicated geologic storage (deep saline formations or depleted oil and gas fi elds) has persisted in the past year (Figure 23).
For projects whose capture component is in the Defi ne stage, over two-thirds of those with EOR have signed a commercial
agreement for the off-take of CO2 or are in advanced negotiations with potential EOR customers, while only one-third of those
with dedicated geologic storage have the same level of storage defi nition and are undertaking the detailed characterisation of
their primary storage target/s.
FIGURE 23 Comparison of capture and storage progress
Around two-thirds of the 16 LSIPs in operation or construction include the use of CO2 for EOR. Further to this, four of the fi ve
projects that could reach FID by the end of 2012 include EOR. In contrast, three-quarters of the projects that were removed
from the LSIP listing this year included dedicated geologic storage.
While EOR continues to be an important step in demonstrating CCS technology at a commercial scale, providing a partial
cost offset to develop CO2 capture facilities, there is a need for consistent and comprehensive policy settings that provide an
incentive to invest in CCS at the macro level, including the use of dedicated geologic storage. This is particularly important as
EOR (or even depleted oil and gas fi elds) is unlikely to provide the storage capacity necessary for CCS to be a major contributor
to CO2 abatement in the long term (IPCC 2007b, Dooley and Friedman 2005).
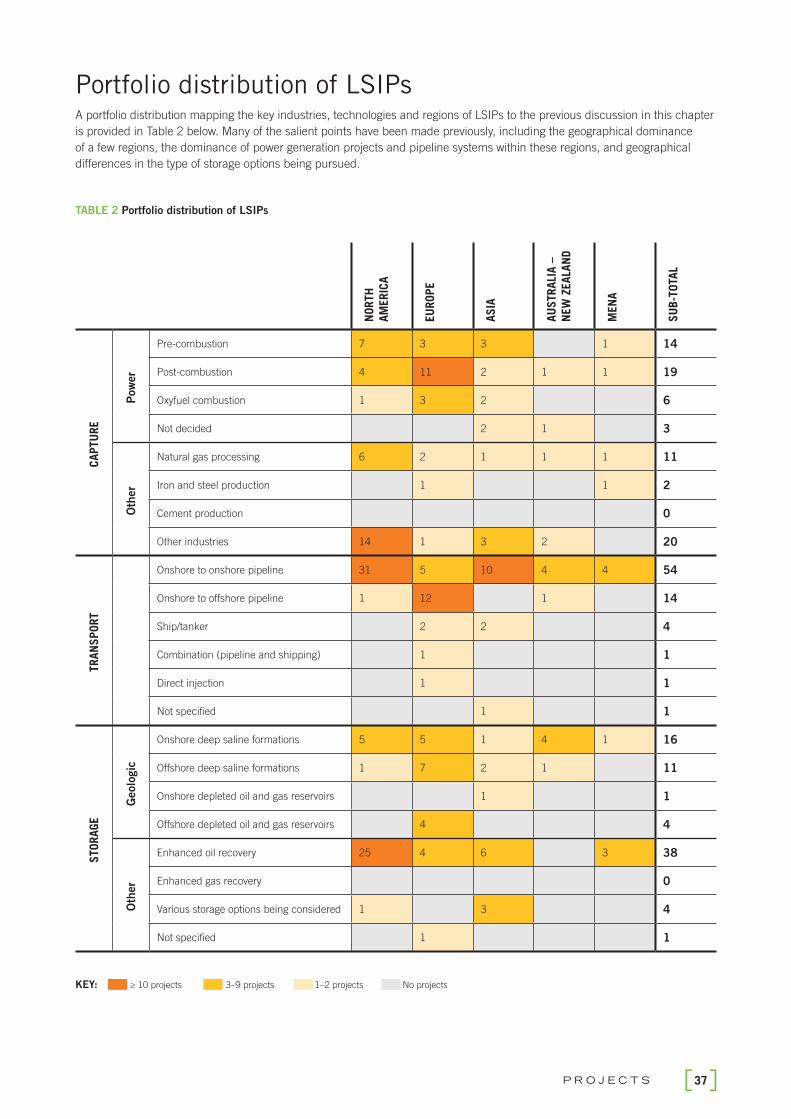
37P R O J E C T S
Portfolio distribution of LSIPsA portfolio distribution mapping the key industries, technologies and regions of LSIPs to the previous discussion in this chapter
is provided in Table 2 below. Many of the salient points have been made previously, including the geographical dominance
of a few regions, the dominance of power generation projects and pipeline systems within these regions, and geographical
differences in the type of storage options being pursued.
TABLE 2 Portfolio distribution of LSIPs
NO
RTH
AM
ER
ICA
EU
RO
PE
AS
IA
AU
STR
ALI
A –
NEW
ZEA
LAN
D
MEN
A
SU
B-T
OTA
L
CAPTU
RE
Pow
er
Pre-combustion 7 3 3 1 14
Post-combustion 4 11 2 1 1 19
Oxyfuel combustion 1 3 2 6
Not decided 2 1 3
Oth
er
Natural gas processing 6 2 1 1 1 11
Iron and steel production 1 1 2
Cement production 0
Other industries 14 1 3 2 20
TRAN
SPORT
Onshore to onshore pipeline 31 5 10 4 4 54
Onshore to offshore pipeline 1 12 1 14
Ship/tanker 2 2 4
Combination (pipeline and shipping) 1 1
Direct injection 1 1
Not specifi ed 1 1
STORAGE
Geolo
gic
Onshore deep saline formations 5 5 1 4 1 16
Offshore deep saline formations 1 7 2 1 11
Onshore depleted oil and gas reservoirs 1 1
Offshore depleted oil and gas reservoirs 4 4
Oth
er
Enhanced oil recovery 25 4 6 3 38
Enhanced gas recovery 0
Various storage options being considered 1 3 4
Not specifi ed 1 1
KEY: ≥ 10 projects 3–9 projects 1–2 projects No projects
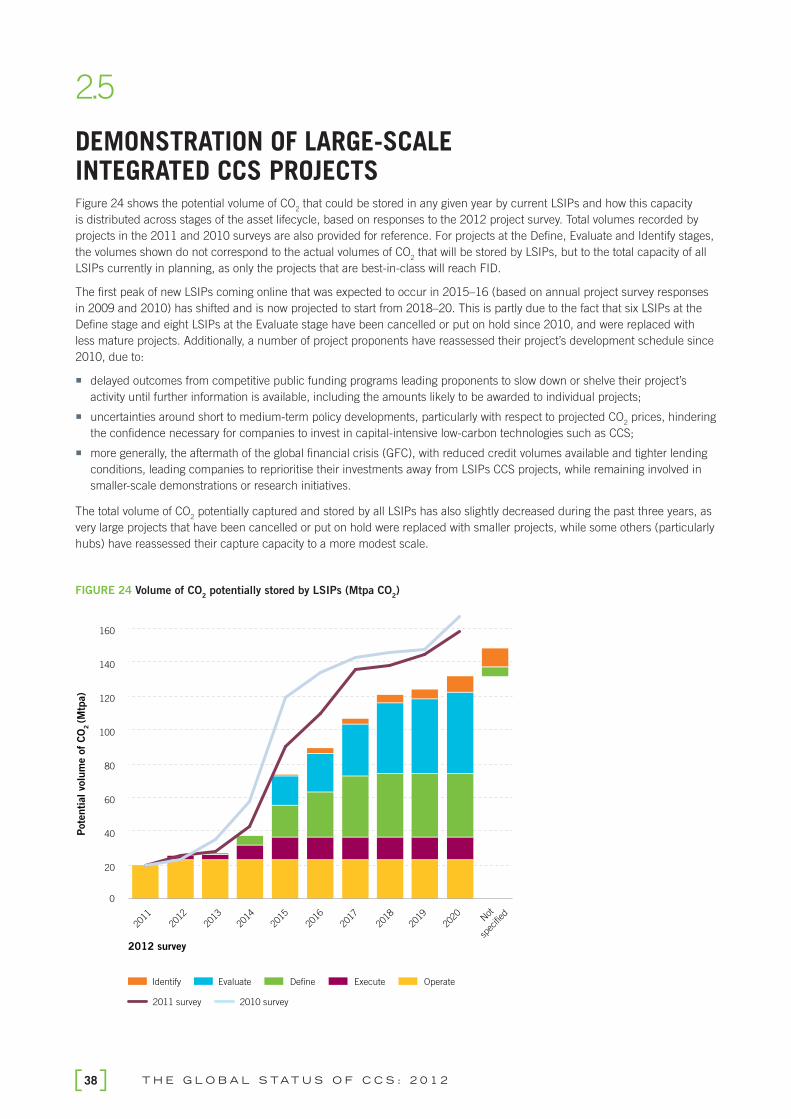
T H E G L O B A L S TAT U S O F C C S : 2 0 1 238
2.5
DEMONSTRATION OF LARGE-SCALE INTEGRATED CCS PROJECTSFigure 24 shows the potential volume of CO
2 that could be stored in any given year by current LSIPs and how this capacity
is distributed across stages of the asset lifecycle, based on responses to the 2012 project survey. Total volumes recorded by
projects in the 2011 and 2010 surveys are also provided for reference. For projects at the Defi ne, Evaluate and Identify stages,
the volumes shown do not correspond to the actual volumes of CO2 that will be stored by LSIPs, but to the total capacity of all
LSIPs currently in planning, as only the projects that are best-in-class will reach FID.
The fi rst peak of new LSIPs coming online that was expected to occur in 2015–16 (based on annual project survey responses
in 2009 and 2010) has shifted and is now projected to start from 2018–20. This is partly due to the fact that six LSIPs at the
Defi ne stage and eight LSIPs at the Evaluate stage have been cancelled or put on hold since 2010, and were replaced with
less mature projects. Additionally, a number of project proponents have reassessed their project’s development schedule since
2010, due to:
delayed outcomes from competitive public funding programs leading proponents to slow down or shelve their project’s
activity until further information is available, including the amounts likely to be awarded to individual projects;
uncertainties around short to medium-term policy developments, particularly with respect to projected CO2 prices, hindering
the confidence necessary for companies to invest in capital-intensive low-carbon technologies such as CCS;
more generally, the aftermath of the global financial crisis (GFC), with reduced credit volumes available and tighter lending
conditions, leading companies to reprioritise their investments away from LSIPs CCS projects, while remaining involved in
smaller-scale demonstrations or research initiatives.
The total volume of CO2 potentially captured and stored by all LSIPs has also slightly decreased during the past three years, as
very large projects that have been cancelled or put on hold were replaced with smaller projects, while some others (particularly
hubs) have reassessed their capture capacity to a more modest scale.
FIGURE 24 Volume of CO2 potentially stored by LSIPs (Mtpa CO
2)
2011
2012
2013
2014
2015
2016
2017
2018
2019
2020
Not
spec
ified
2011 survey 2010 survey
2012 survey
Pote
nti
al vo
lum
e o
f C
O2
(M
tpa)
Identify Evaluate Define Execute Operate
0
20
40
60
80
100
120
140
160

39P R O J E C T S
The rate at which the next generation of CCS projects currently in development is moving forward into construction is
considerably lower than was generally expected in 2008 and 2009, when many clean energy or CCS-specifi c public funding
programs were announced. Government action is needed for CO2 emissions to be priced at a level that is consistent with the
social costs likely to be incurred if low-carbon technologies are not widely adopted. Further to this, there is a need – through
a set of comprehensive, consistent, and stable regulatory and policy frameworks – for CCS to be explicitly and consistently
supported as part of a portfolio of carbon abatement technologies.
In the absence of the above, CCS demonstration is strictly dependent on private initiative or one-off public funding programs
that provide large sums to few LSIPs. This in turn increases the diffi culty of obtaining the balanced set of early-mover CCS
projects that is needed across a range of industries and technologies in order to reduce the costs associated with CCS, as
well as to provide guidance for legislators as to how best to adjust prevailing policy and regulatory frameworks. The ongoing
uncertainty over long-term climate policy is having a signifi cant impact in shaping current investment decisions and is likely
to push out the CCS demonstration phase further into the 2020s. A more concerted approach, supported by strong political
action, is required for CCS technology to achieve its substantial mitigation potential as part of a portfolio of carbon abatement
technologies.

3BUSINESS CASE
3.1Introduction 41
3.2CCS costs and competitiveness 44
3.3Commercial gaps for LSIPs and other CCS projects 46
3.4Financing and risk 51
3.5Outlook 55
41B U S I N E S S C A S E
KEY MESSAGES
› Building the business case for CCS projects is diffi cult and time-consuming.
› There is strong near-term potential for CCS, with the most economic
propositions being natural gas extraction, fertiliser, synfuel, and ethanol
production.
› Higher cost CCS projects (power, steel, and concrete) require strong
government support, including during the operational phase, due to low or
absent carbon pricing arrangements.
› CCS is a competitive technology for power sector emissions reduction when
compared to other low-carbon technologies.
› Many projects target additional revenues from CO2 utilisation to close the
commercial gap.
› There are signifi cant issues with debt availability to support CCS in a post-
GFC world.
3.1
INTRODUCTIONThe business case for a project provides the strategic, fi nancial, commercial, technical, operational and other information
and analysis necessary to make a FID about whether an investment or project should be implemented. It also provides
justifi cation for the project/investment in terms of its alignment with the objectives of the organisation. In the context of CCS
and government support programs for CCS demonstration projects, these objectives can include:
technology development and commercialisation opportunities;
market leadership;
achieving a commercial return;
satisfying expected regulatory changes; and
protecting value of the existing portfolio.
The business case also provides the basis for managing and controlling the delivery of the project on time, within budget, and
to the agreed quality standards and timeframes.
Developing a business case requires signifi cant efforts and work streams running in parallel, and is a diffi cult and complex
undertaking. A wide range of technical, commercial, fi nancial, and operational considerations must be considered and
captured within the business case for a project (Figure 25).
Photo
court
esy
of B
asi
n E
lectr
ic P
ow
er
Coopera
tive
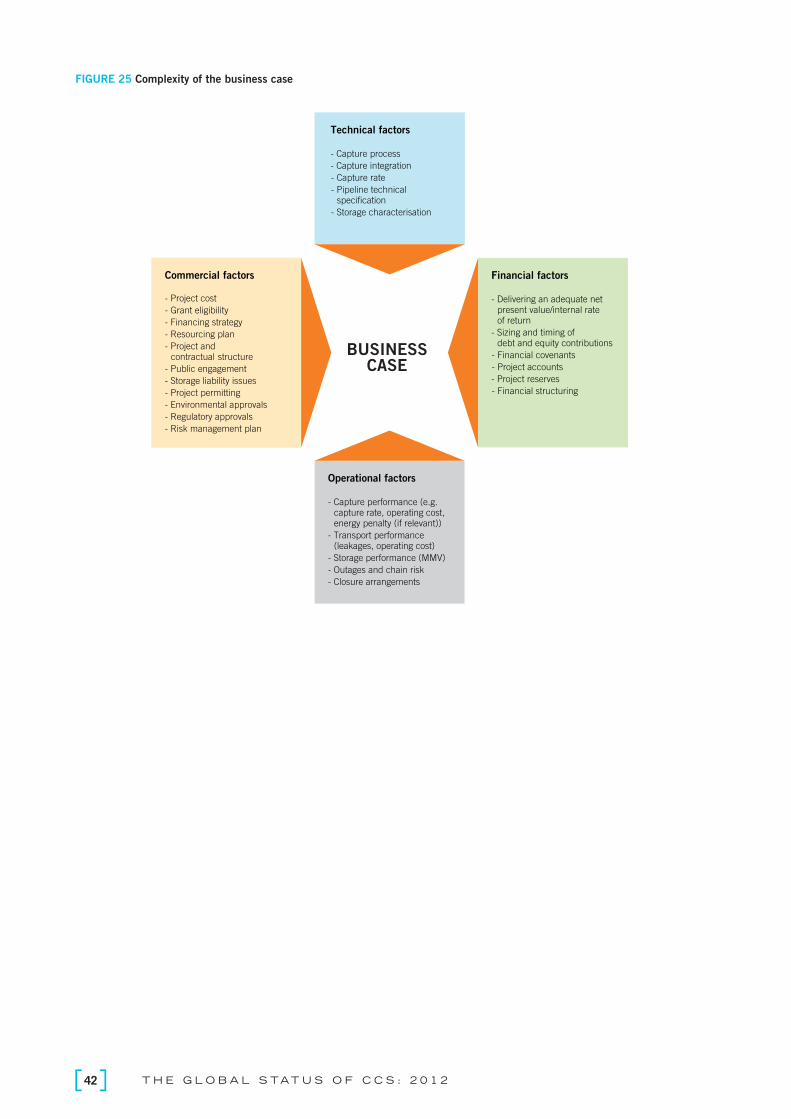
T H E G L O B A L S TAT U S O F C C S : 2 0 1 242
FIGURE 25 Complexity of the business case
Commercial factors
- Project cost
- Grant eligibility
- Financing strategy
- Resourcing plan
- Project and contractual structure
- Public engagement
- Storage liability issues
- Project permitting
- Environmental approvals
- Regulatory approvals
- Risk management plan
Financial factors
- Delivering an adequate net present value/internal rate of return
- Sizing and timing of debt and equity contributions
- Financial covenants
- Project accounts
- Project reserves
- Financial structuring
Technical factors
- Capture process
- Capture integration
- Capture rate
- Pipeline technical specification
- Storage characterisation
Operational factors
- Capture performance (e.g. capture rate, operating cost, energy penalty (if relevant))
- Transport performance (leakages, operating cost)
- Storage performance (MMV)
- Outages and chain risk
- Closure arrangements
BUSINESS CASE
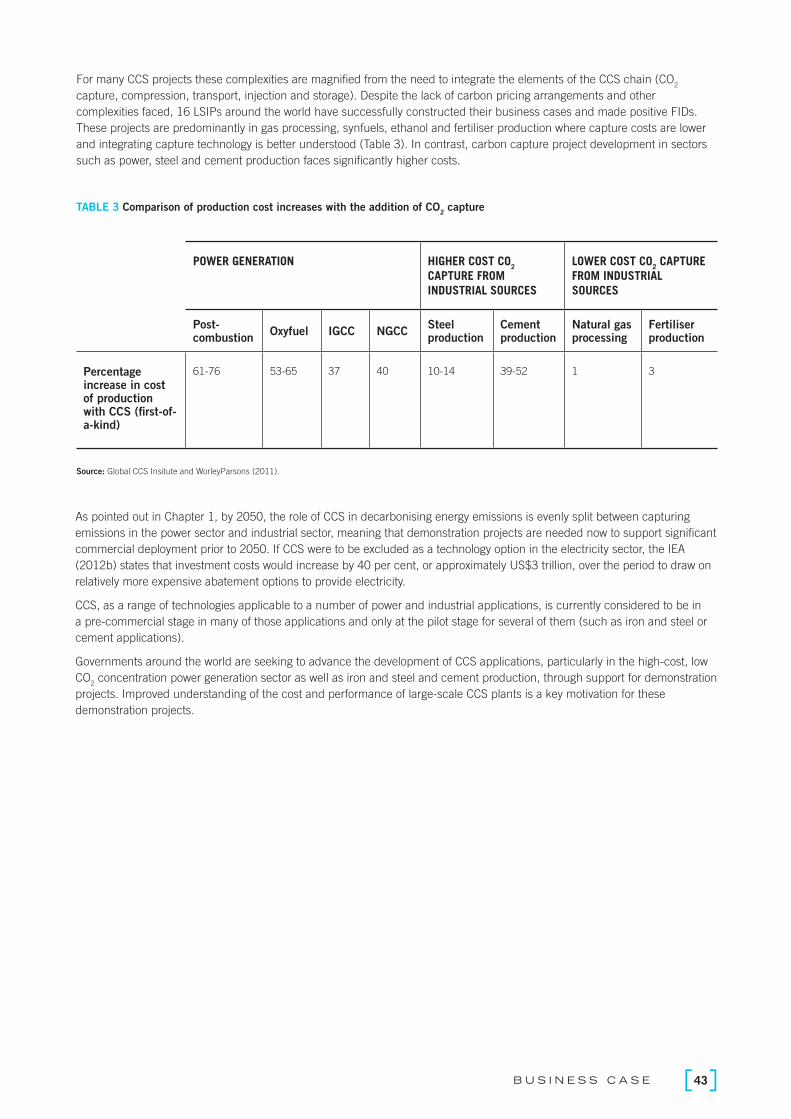
43B U S I N E S S C A S E
For many CCS projects these complexities are magnifi ed from the need to integrate the elements of the CCS chain (CO2
capture, compression, transport, injection and storage). Despite the lack of carbon pricing arrangements and other
complexities faced, 16 LSIPs around the world have successfully constructed their business cases and made positive FIDs.
These projects are predominantly in gas processing, synfuels, ethanol and fertiliser production where capture costs are lower
and integrating capture technology is better understood (Table 3). In contrast, carbon capture project development in sectors
such as power, steel and cement production faces signifi cantly higher costs.
TABLE 3 Comparison of production cost increases with the addition of CO2 capture
POWER GENERATION HIGHER COST CO2
CAPTURE FROM
INDUSTRIAL SOURCES
LOWER COST CO2 CAPTURE
FROM INDUSTRIAL
SOURCES
Post-combustion
Oxyfuel IGCC NGCCSteel production
Cement production
Natural gas processing
Fertiliser production
Percentage increase in cost of production with CCS (fi rst-of- a-kind)
61-76 53-65 37 40 10-14 39-52 1 3
Source: Global CCS Insitute and WorleyParsons (2011).
As pointed out in Chapter 1, by 2050, the role of CCS in decarbonising energy emissions is evenly split between capturing
emissions in the power sector and industrial sector, meaning that demonstration projects are needed now to support signifi cant
commercial deployment prior to 2050. If CCS were to be excluded as a technology option in the electricity sector, the IEA
(2012b) states that investment costs would increase by 40 per cent, or approximately US$3 trillion, over the period to draw on
relatively more expensive abatement options to provide electricity.
CCS, as a range of technologies applicable to a number of power and industrial applications, is currently considered to be in
a pre-commercial stage in many of those applications and only at the pilot stage for several of them (such as iron and steel or
cement applications).
Governments around the world are seeking to advance the development of CCS applications, particularly in the high-cost, low
CO2 concentration power generation sector as well as iron and steel and cement production, through support for demonstration
projects. Improved understanding of the cost and performance of large-scale CCS plants is a key motivation for these
demonstration projects.

T H E G L O B A L S TAT U S O F C C S : 2 0 1 244
3.2
CCS COSTS AND COMPETITIVENESSAdding CCS to any process increases capital costs as well as ongoing operating and maintenance costs. Inevitably, this
increases the cost of the product resulting from that process, whether electricity or industrial outputs. Such cost increases
arise from the role of CCS in signifi cantly reducing CO2 emissions compared with what would otherwise be the case. Placing
these cost increases in context, alternative methods of reducing or avoiding CO2 emissions are also generally more expensive
than traditional electricity generation or industrial production processes. While there is often a focus on the additional costs of
CCS, the appropriate comparison is with alternative means of signifi cantly mitigating CO2 emissions, and on this basis CCS is a
cost-competitive technology.
When applied to electricity generation, CCS has four main impacts on the cost structure for any project seeking to meet a given
level of electricity demand:
additional capital expenditure associated with the CO2 capture and compression plants;
additional fuel costs for the energy used in the capture process;
additional capital expenditure to build a larger power plant (to ensure net power output is unchanged) in order to
compensate for the energy used in the capture process (i.e. host plant compensation); and
additional operations and maintenance costs associated with both the larger plant and the capture and compression
requirements.
The relative share of cost increases of these effects varies across the different capture technologies – post combustion,
oxyfuel or IGCC – refl ecting differences in the processes. However, regardless of the process, it is the capture facilities and the
additional energy requirements as part of the capture process that have the largest impact on costs (Figure 26).
FIGURE 26 Cost impacts of adding CCS to a power station
10
0
20
30
40
50
60
Capital Fuel Fixed
operating and
maintenance
Variable
operating and
maintenance
Transport Storage
US
$/M
Wh
CCS own costs Host plant compensation Reference plant
Note: For a supercritical post-combustion plant based on Global CSS Institute and WorleyParsons (2011) data.
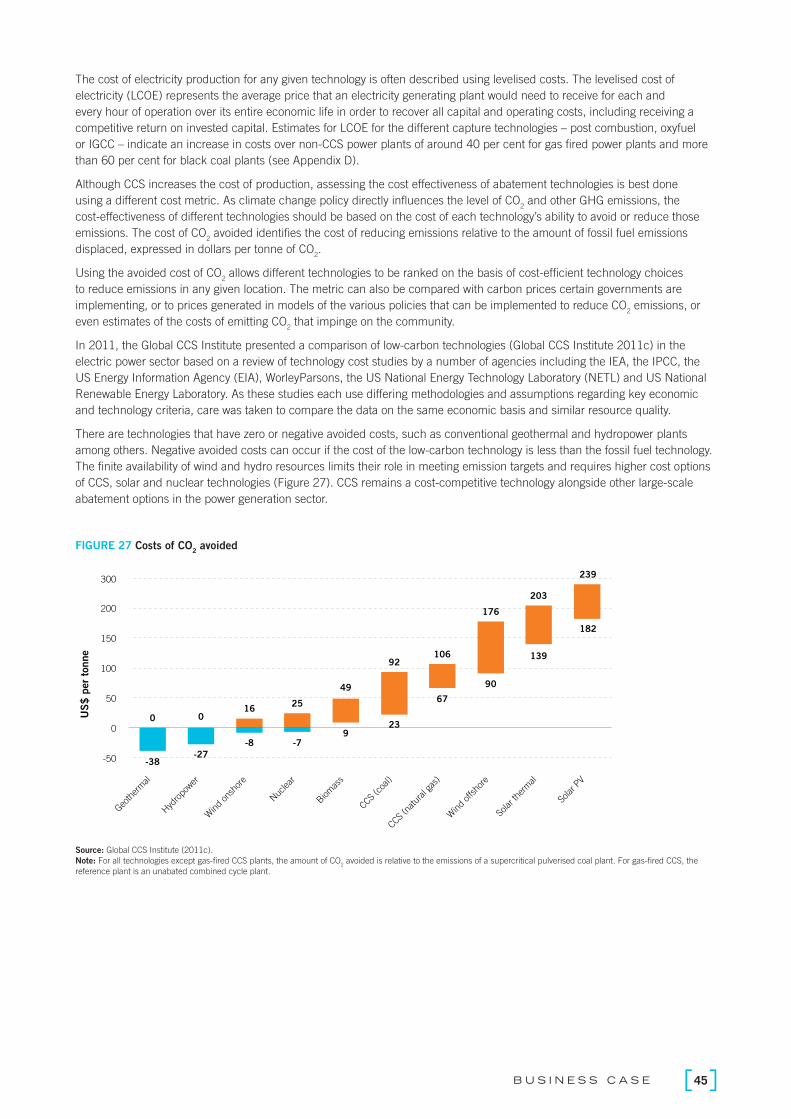
45B U S I N E S S C A S E
The cost of electricity production for any given technology is often described using levelised costs. The levelised cost of
electricity (LCOE) represents the average price that an electricity generating plant would need to receive for each and
every hour of operation over its entire economic life in order to recover all capital and operating costs, including receiving a
competitive return on invested capital. Estimates for LCOE for the different capture technologies – post combustion, oxyfuel
or IGCC – indicate an increase in costs over non-CCS power plants of around 40 per cent for gas fi red power plants and more
than 60 per cent for black coal plants (see Appendix D).
Although CCS increases the cost of production, assessing the cost effectiveness of abatement technologies is best done
using a different cost metric. As climate change policy directly infl uences the level of CO2 and other GHG emissions, the
cost-effectiveness of different technologies should be based on the cost of each technology’s ability to avoid or reduce those
emissions. The cost of CO2 avoided identifi es the cost of reducing emissions relative to the amount of fossil fuel emissions
displaced, expressed in dollars per tonne of CO2.
Using the avoided cost of CO2 allows different technologies to be ranked on the basis of cost-effi cient technology choices
to reduce emissions in any given location. The metric can also be compared with carbon prices certain governments are
implementing, or to prices generated in models of the various policies that can be implemented to reduce CO2 emissions, or
even estimates of the costs of emitting CO2 that impinge on the community.
In 2011, the Global CCS Institute presented a comparison of low-carbon technologies (Global CCS Institute 2011c) in the
electric power sector based on a review of technology cost studies by a number of agencies including the IEA, the IPCC, the
US Energy Information Agency (EIA), WorleyParsons, the US National Energy Technology Laboratory (NETL) and US National
Renewable Energy Laboratory. As these studies each use differing methodologies and assumptions regarding key economic
and technology criteria, care was taken to compare the data on the same economic basis and similar resource quality.
There are technologies that have zero or negative avoided costs, such as conventional geothermal and hydropower plants
among others. Negative avoided costs can occur if the cost of the low-carbon technology is less than the fossil fuel technology.
The fi nite availability of wind and hydro resources limits their role in meeting emission targets and requires higher cost options
of CCS, solar and nuclear technologies (Figure 27). CCS remains a cost-competitive technology alongside other large-scale
abatement options in the power generation sector.
FIGURE 27 Costs of CO2 avoided
-38-27
-8 -79
23
67
90
139
182
0 016
25
49
92106
176
203
239
-50
0
50
100
150
200
300
Geoth
erm
al
Hyd
ropo
wer
Wind
onsh
ore
Nuc
lear
Biom
ass
CCS (n
atur
al gas
)
CCS (c
oal)
Wind
offsho
re
Solar t
herm
al
Solar P
V
US
$ p
er
tonne
Source: Global CCS Institute (2011c).
Note: For all technologies except gas-fi red CCS plants, the amount of CO2 avoided is relative to the emissions of a supercritical pulverised coal plant. For gas-fi red CCS, the
reference plant is an unabated combined cycle plant.
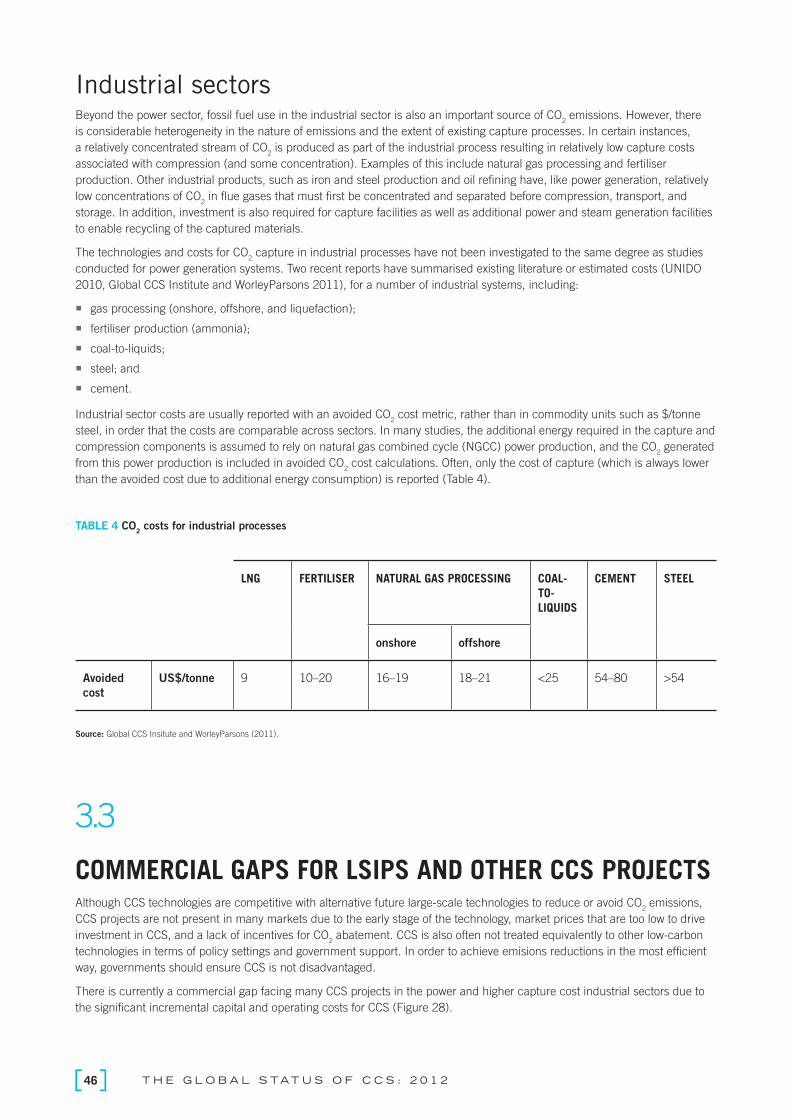
T H E G L O B A L S TAT U S O F C C S : 2 0 1 246
Industrial sectorsBeyond the power sector, fossil fuel use in the industrial sector is also an important source of CO
2 emissions. However, there
is considerable heterogeneity in the nature of emissions and the extent of existing capture processes. In certain instances,
a relatively concentrated stream of CO2 is produced as part of the industrial process resulting in relatively low capture costs
associated with compression (and some concentration). Examples of this include natural gas processing and fertiliser
production. Other industrial products, such as iron and steel production and oil refi ning have, like power generation, relatively
low concentrations of CO2 in fl ue gases that must fi rst be concentrated and separated before compression, transport, and
storage. In addition, investment is also required for capture facilities as well as additional power and steam generation facilities
to enable recycling of the captured materials.
The technologies and costs for CO2 capture in industrial processes have not been investigated to the same degree as studies
conducted for power generation systems. Two recent reports have summarised existing literature or estimated costs (UNIDO
2010, Global CCS Institute and WorleyParsons 2011), for a number of industrial systems, including:
gas processing (onshore, offshore, and liquefaction);
fertiliser production (ammonia);
coal-to-liquids;
steel; and
cement.
Industrial sector costs are usually reported with an avoided CO2 cost metric, rather than in commodity units such as $/tonne
steel, in order that the costs are comparable across sectors. In many studies, the additional energy required in the capture and
compression components is assumed to rely on natural gas combined cycle (NGCC) power production, and the CO2 generated
from this power production is included in avoided CO2 cost calculations. Often, only the cost of capture (which is always lower
than the avoided cost due to additional energy consumption) is reported (Table 4).
TABLE 4 CO2 costs for industrial processes
3.3
COMMERCIAL GAPS FOR LSIPS AND OTHER CCS PROJECTSAlthough CCS technologies are competitive with alternative future large-scale technologies to reduce or avoid CO
2 emissions,
CCS projects are not present in many markets due to the early stage of the technology, market prices that are too low to drive
investment in CCS, and a lack of incentives for CO2 abatement. CCS is also often not treated equivalently to other low-carbon
technologies in terms of policy settings and government support. In order to achieve emisions reductions in the most effi cient
way, governments should ensure CCS is not disadvantaged.
There is currently a commercial gap facing many CCS projects in the power and higher capture cost industrial sectors due to
the signifi cant incremental capital and operating costs for CCS (Figure 28).
LNG FERTILISER NATURAL GAS PROCESSING COAL-
TO-
LIQUIDS
CEMENT STEEL
onshore offshore
Avoided
cost
US$/tonne 9 10–20 16–19 18–21 <25 54–80 >54
Source: Global CCS Insitute and WorleyParsons (2011).

47B U S I N E S S C A S E
Power/industrial plant and CCS
Pro
ject
net
pre
sent
valu
e (
NP
V)
Forecastrevenues
CAPEXbaseplant
OPEXbaseplant
CAPEXcapture,transport,storage
OPEXcapture,transport,storage
Commercialgap
This commercial gap is a major factor limiting the development of CCS projects around the world. Leaving aside general cost
reductions in CCS technologies through R&D and other development activities CCS projects have limited means to attempt to
bridge the commercial gap in their business cases (Figure 29).
These means are further discussed below and can be broken into two key categories:
1. government support; and
2. additional revenue streams.
FIGURE 29 Bridging the commercial gap
Commercialgap
Capital cost bridge
- Capital grants
- Cost reduction/R&D
Operating period bridge
- Price on CO2
- Premium power
- CO2 utilisation revenues
- Regulation
- Tax credits
- Cost reduction/R&D
Power/industrial plant and CCS
FIGURE 28 The commercial gap facing many CCS projects

T H E G L O B A L S TAT U S O F C C S : 2 0 1 248
US$ million
Power generation Other industry
200 0 400 600 800 1000
FutureGen 2.0
Technology Centre Mongstad
Quest
Texas Clean Energy
Kemper County
Alberta Carbon Trunkline
Taylorville Energy Center
ROAD
HECA
Lake Charles Gasification
Korea-CCS 1
Korea-CCS 2
South West Hub
Swan Hills Synfuels
Boundary Dam
Bełchatów CCS
OXYCFB 300 Compostilla
Don Valley
Air Products SMR EOR
Government supportMany CCS projects have received signifi cant monetary support from public funding programs in order to bridge the
commercial gap (Figure 30).
FIGURE 30 Public funding to large-scale projects
Funding support for CCS projects is also expected to be awarded to additional projects under the NER300 process in Europe,
the UK’s CCS Commercialisation Program and the CCS Flagships program in Australia.
However, it should be noted that support under such schemes does also introduce additional challenges for projects, such as:
participating in a competitive process to access grant-funding support;
focus of many programs on support for capital investment and less on the operational phase of the project;
satisfying requirements under a funding agreement with government;
pre-conditions for drawing down support; and
claw-back risk.
To meet longer-term global emissions targets at least cost requires CCS demonstration projects to be undertaken now. This will
require signifi cant further support in the form of both grants and operating period support for CCS.
The need for stronger support for the operating period of CCS projects overlaps with the paramount necessity for clear
carbon emission abatement policies, legislation and regulation, such as direct policy and/or regulatory action to prevent or
limit emissions and establishing a price on carbon emissions. The level of support under current settings does not provide
suffi cient support for most CCS projects to proceed. The current CO2 price is mostly below the level required to drive signifi cant
investment in CCS, and other low-carbon technologies. For example, the price of certifi ed emission reduction unit (CERs)
under the EU Emissions Trading Scheme (ETS) currently sits at around €7–8 per tonne of CO2, Australia’s carbon price is
AU$23 per tonne of CO2 and the price under the Alberta Government’s carbon offset program is CA$15 per tonne CO
2.
There are initiatives being considered to provide stronger incentives for low-carbon technologies such as CCS. The EC is
currently considering draft proposals to delay the sale of up to 1.2 billion carbon allowances as part of a rescheduling of
allowance auctions to support the carbon price under the ETS.
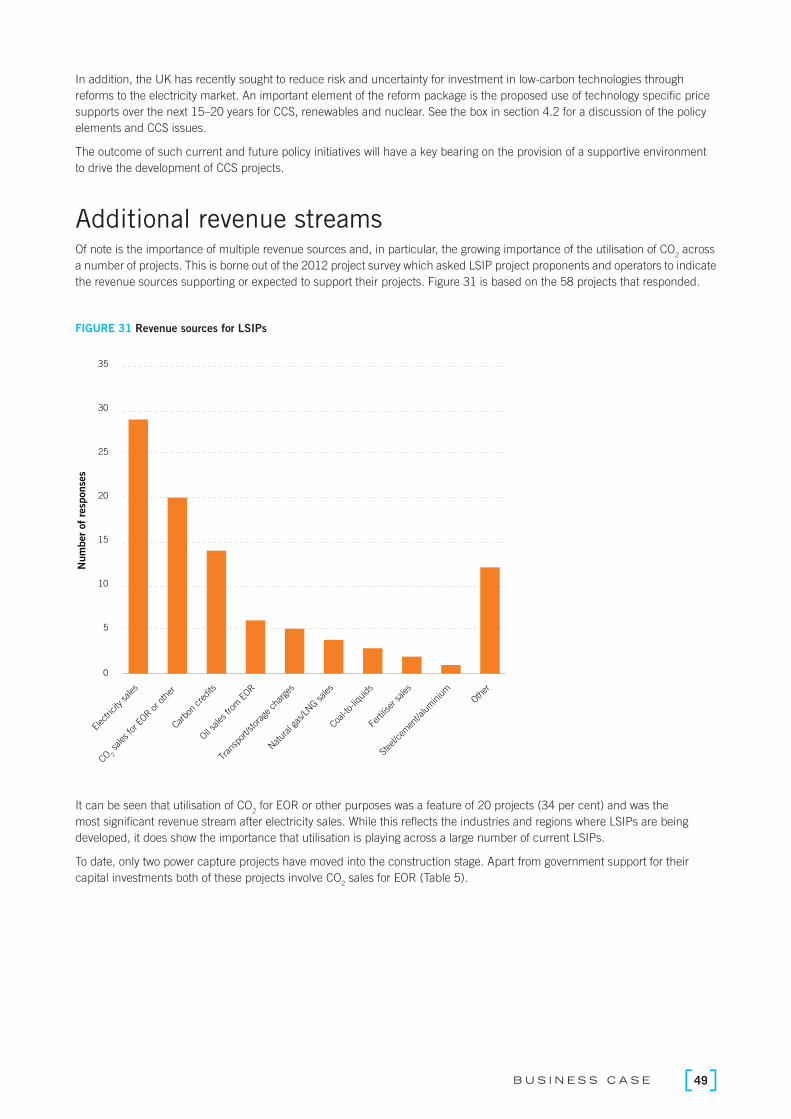
49B U S I N E S S C A S E
In addition, the UK has recently sought to reduce risk and uncertainty for investment in low-carbon technologies through
reforms to the electricity market. An important element of the reform package is the proposed use of technology specifi c price
supports over the next 15–20 years for CCS, renewables and nuclear. See the box in section 4.2 for a discussion of the policy
elements and CCS issues.
The outcome of such current and future policy initiatives will have a key bearing on the provision of a supportive environment
to drive the development of CCS projects.
Additional revenue streamsOf note is the importance of multiple revenue sources and, in particular, the growing importance of the utilisation of CO
2 across
a number of projects. This is borne out of the 2012 project survey which asked LSIP project proponents and operators to indicate
the revenue sources supporting or expected to support their projects. Figure 31 is based on the 58 projects that responded.
FIGURE 31 Revenue sources for LSIPs
0
5
10
15
20
25
30
35
Elec
tricity sales
CO 2 sales
for E
OR or o
ther
Carbo
n cr
edits
Oil sa
les fro
m E
OR
Tran
spor
t/stora
ge cha
rges
Natur
al gas
/LNG s
ales
Coal-t
o-liq
uids
Ferti
liser
sales
Stee
l/cem
ent/a
lum
inium
Other
Num
ber
of
resp
onse
s
It can be seen that utilisation of CO2 for EOR or other purposes was a feature of 20 projects (34 per cent) and was the
most signifi cant revenue stream after electricity sales. While this refl ects the industries and regions where LSIPs are being
developed, it does show the importance that utilisation is playing across a large number of current LSIPs.
To date, only two power capture projects have moved into the construction stage. Apart from government support for their
capital investments both of these projects involve CO2 sales for EOR (Table 5).

T H E G L O B A L S TAT U S O F C C S : 2 0 1 250
This observation is further borne out by examining the fi ve projects that are targeting a FID over the coming 12 months.
Of these fi ve projects, four are diversifying their revenue through CO2 utilisation for EOR or other purposes (Table 6).
TABLE 6 Operating period bridges of projects approaching FID
PROJECT OPERATING PERIOD BRIDGE
Texas Clean Energy Project Utilisation revenues: CO2 for EOR and urea for fertiliser production.
NRG Energy Parish Project Utilisation revenues: CO2 for EOR.
ROAD EU-ETS
North West Sturgeon Refi nery CO2 Project Credits under Alberta Government’s carbon offset program (CA$15/tonne CO
2 emissions).
Utilisation revenues: CO2 for EOR.
Emirates Steel Industries Utilisation revenues: CO2 for EOR.
The Texas Clean Energy Project (TCEP) is illustrative of the important ways that utilisation revenues can be used to enable CCS
development activities.
TCEP is a 400 MW ‘polygen’ IGCC plant being developed by Summit Power Group, LLC, which is currently in
negotiations with the Export-Import Bank of China to raise signifi cant project fi nance for its US$2.9 billion project.
According to Summit, there are three factors that have allowed it to get very close to a bankable project include:
1. Utilising proven technologies that suppliers with strong balance sheets will guarantee. Siemens (power) and Linde
and SK E&C (chemical) are the EPC contractors under fi xed price, turnkey contracts and warrant availability and
performance under 15 year contracts.
2. Accessing additional revenues from other than ratepayers alone – TCEP diversifi es revenue risk via having three
major revenue sources, all under separate long-term off-take agreements: power (30 per cent), CO2 for EOR (20
per cent) and urea for fertiliser production (45 per cent of revenues) as well as 5 per cent of revenues coming from
other by-product sales.
3. Targeting utilisation of CO2 for EOR as an objective because it both helps to reduce the ultimate cost of CCS and it
signifi cantly reduces risks along the CCS chain.
Summit also intends to use TCEP as a reference plant that can provide a template for rolling out other polygen plants
in other locations around the world – changing this as a lending proposition from a one-off plant to a potential new
business line.
PROJECT Kemper County Boundary Dam
CAPITAL SUPPORT A US$270 million grant from the US DOE, US$412
million in investment tax credits.
CA$240 million in federal funding.
OPERATING PERIOD
SUPPORT
The Public Service Commission approved rate
increases to pass the costs of construction through to
utility customers in the State.
Utilisation revenues from CO2 sales for EOR.
SaskPower has applied for a system-wide fl at rate
increase of 4.9 per cent from 1 January 2013 to
cover long-term investment in infrastructure including
Boundary dam.
Utilisation revenues from CO2 sales for EOR.
TABLE 5 Comparison of power CCS projects in ‘Execution’
TEXAS CLEAN ENERGY PROJECT

51B U S I N E S S C A S E
3.4
FINANCING AND RISK
FinancingFunding for CCS projects comes from a wide variety of private and public sector sources as shown in Table 7.
TABLE 7 Potential CCS funding sources
PUBLIC Grants.
Tax credits.
Loan guarantees.
Concessional equity.
Concessional debt.
PRIVATE Sponsor equity.
Institutional equity (infrastructure funds, superannuation funds, pension funds etc.).
Sponsor debt (balance sheet fi nancing).
Commercial debt.
MULTI-LATERAL AGENCIES AND
EXPORT CREDIT AGENCIES
Concessional debt.
Credit guarantees.
As CCS moves towards commercialisation it is expected that increasing amounts of funding will be sourced as institutional
equity and commercial bank debt. However, at the development stage a customised and sophisticated mixture of public,
private, and multi-lateral funding sources will often be required.
Of the 16 CCS projects that have reached fi nancial close, raising fi nance is more problematic for the high-cost, low CO2
concentration projects.
Where private sector fi nancing has been committed to-date for power sector CCS projects like Kemper County and Boundary
Dam, it has typically been via equity and/or debt contributions from the key project sponsors. Such balance sheet fi nancing will
be limited by the appetite and ability of such sponsors (mainly major utility companies) to contribute a signifi cant proportion
of their capital budgets to an activity which may not currently deliver a fi nancial return commensurate with the risks of project
development.
Since the current public funding programs for CCS require private sector fi nance through cost sharing, the lack of ability to
raise debt at the project level provides a signifi cant barrier to the roll-out of CCS.
The ability of CCS projects (as opposed to project sponsors) to access debt markets has been affected by the lasting impacts
of the GFC as well as the BASEL III capital and liquidity requirements.
The GFC severely affected the global fi nancial system, constraining the availability of capital and signifi cantly increasing the
relative cost of borrowing for lower rated credits, particularly for those customers who are not considered to be ‘investment
grade’. The ongoing economic uncertainty stemming from Europe in 2012 will continue to impact fi nancial markets,
reinforcing bank risk aversion and preference for higher rated borrowers. Figure 32 and Figure 33 show bank lending volumes
in Europe and the US for non-investment grade borrowers.

T H E G L O B A L S TAT U S O F C C S : 2 0 1 252
Num
ber
of
issu
es
Value (LHS axis) Number of issues (RHS axis)
0
100
200
300
400
500
600
700
0
100
200
300
400
500
600
20
03
20
04
20
05
20
06
20
07
20
08
20
09
20
10
20
11
20
12
*
Valu
e (
US
$ b
illion)
0
200
400
600
800
1,000
1,200
0
500
1,000
1,500
2,000
2,500
Num
ber
of
issu
es
Value (LHS axis) Number of issues (RHS axis)
2003
2004
2005
2006
2007
2008
2009
2010
2011
2012*
Valu
e (
US
$ b
illion)
FIGURE 32 Bank lending volumes in Europe for non-investment grade borrowers
FIGURE 33 Bank lending volumes in the US for non-investment grade borrowers
Source: ThompsonONE.
Note: Shaded period represents GFC. *2012 fi gure annualised based on data in fi rst two quarters.
Source: ThompsonONE.
Note: Shaded period represents GFC. *2012 fi gure annualised based on data in fi rst two quarters.

53B U S I N E S S C A S E
Both diagrams show the strong fall in volumes during the period of the GFC. They also show some recovery in lending volumes
for 2011, but volumes still remain signifi cantly below the levels achieved immediately before the GFC.
This increased bank risk aversion has a number of implications for the fi nancing market for CCS demonstration projects.
1. CCS projects during the demonstration phase will struggle to raise non-recourse or limited-recourse project fi nance.
Financiers will favour those projects that have been able to signifi cantly de-risk their construction and operation activities.
2. Capital grants of 30–50 per cent of the capital costs of the CCS component of a project are not enough in isolation.
Neither sponsor funds nor bank debt will fund the remaining cost unless a project can be made commercial – which will
require revenues from CO2 utilisation and/or some type of operating period support (e.g. long-term PPA, FIT, operating
period subsidy etc.).
3. Even projects that can access the debt markets may fi nd that debt availability from commercial banks is insuffi cient to
meet the funding needs of their project.
A number of projects are attempting to plug the capital gap remaining after grant funding and debt availability by:
seeking debt at concessional lending rates from multilateral developments banks like the EIB and Asian Development Bank
(ADB); and
seeking support from export credit agencies – which can drive technology selection and project structuring decisions to
ensure project eligibility.
However, funding remains a key barrier for the development of CCS projects.
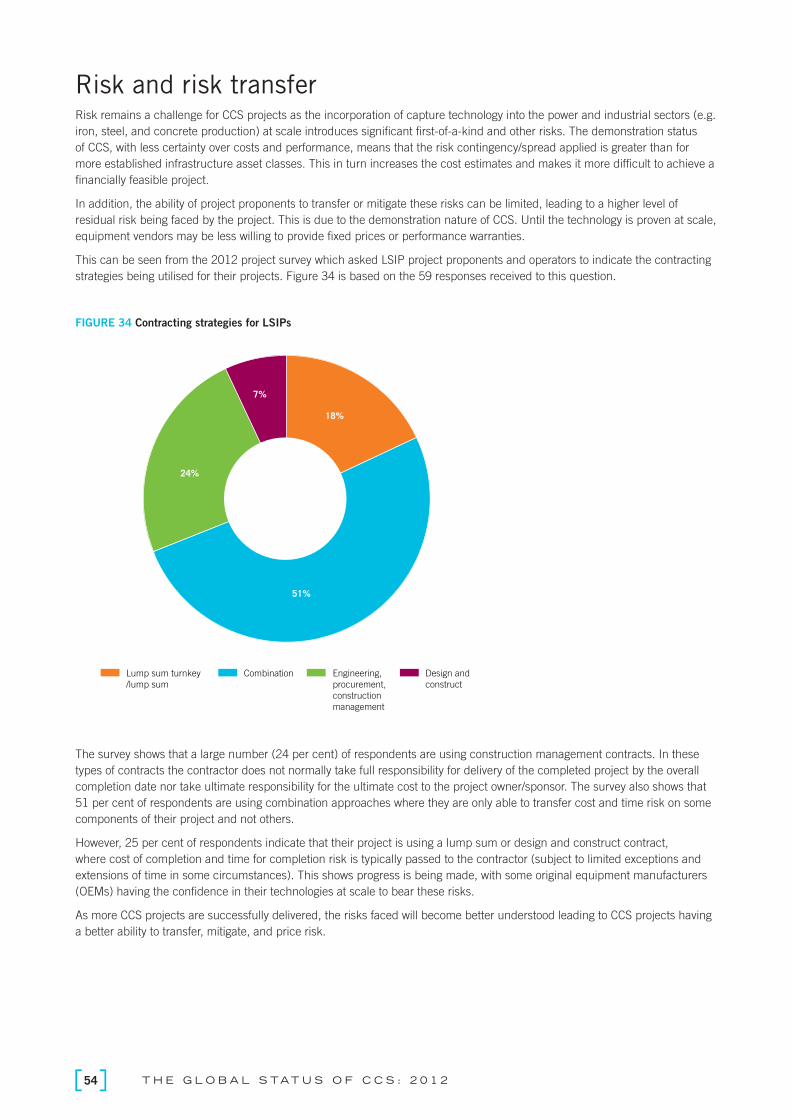
T H E G L O B A L S TAT U S O F C C S : 2 0 1 254
Risk and risk transferRisk remains a challenge for CCS projects as the incorporation of capture technology into the power and industrial sectors (e.g.
iron, steel, and concrete production) at scale introduces signifi cant fi rst-of-a-kind and other risks. The demonstration status
of CCS, with less certainty over costs and performance, means that the risk contingency/spread applied is greater than for
more established infrastructure asset classes. This in turn increases the cost estimates and makes it more diffi cult to achieve a
fi nancially feasible project.
In addition, the ability of project proponents to transfer or mitigate these risks can be limited, leading to a higher level of
residual risk being faced by the project. This is due to the demonstration nature of CCS. Until the technology is proven at scale,
equipment vendors may be less willing to provide fi xed prices or performance warranties.
This can be seen from the 2012 project survey which asked LSIP project proponents and operators to indicate the contracting
strategies being utilised for their projects. Figure 34 is based on the 59 responses received to this question.
FIGURE 34 Contracting strategies for LSIPs
18%
51%
24%
7%
Lump sum turnkey
/lump sum
Combination Engineering,
procurement,
construction
management
Design and
construct
The survey shows that a large number (24 per cent) of respondents are using construction management contracts. In these
types of contracts the contractor does not normally take full responsibility for delivery of the completed project by the overall
completion date nor take ultimate responsibility for the ultimate cost to the project owner/sponsor. The survey also shows that
51 per cent of respondents are using combination approaches where they are only able to transfer cost and time risk on some
components of their project and not others.
However, 25 per cent of respondents indicate that their project is using a lump sum or design and construct contract,
where cost of completion and time for completion risk is typically passed to the contractor (subject to limited exceptions and
extensions of time in some circumstances). This shows progress is being made, with some original equipment manufacturers
(OEMs) having the confi dence in their technologies at scale to bear these risks.
As more CCS projects are successfully delivered, the risks faced will become better understood leading to CCS projects having
a better ability to transfer, mitigate, and price risk.

55B U S I N E S S C A S E
3.5
OUTLOOKOver the coming 12 months it is expected that, with recent progress made towards selecting projects under both NER300 and
the UK funding competition, there will be a number of projects in a position where an FID can be made. Early indications are
that these projects will comprise a range of pre-combustion, post-combustion and industrial projects.
In North America, a mixture of pre-combustion (Texas Clean Energy Project), post-combustion (NRG Energy Parish Project),
and industrial (North West Sturgeon Refi nery CO2 Project) projects are also in a position where a FID can be made over
the course of the next 12 months. All of these projects will rely strongly on EOR or other utilisation opportunities as a key
component of the business case. This refl ects the growing importance of utilisation of CO2, syngas and/or urea to provide an
operating period bridge.
In addition, utilisation of CO2 for EOR will continue to be an important driver of CCS activity in regions like China, the Middle
East and North Africa when conditions are suitable.
Apart from these developments CCS projects are likely to continue to focus on the ‘low-hanging fruit’ of natural gas extraction
and natural gas, hydrogen and synfuels production where CO2 is produced as part of the process and can be captured at
low cost.
Ultimately demonstration projects need to be underpinned by climate policy, CCS-specifi c policy and an effective regulatory
environment. The rate of project development to date suggests that the absence of policy support creates uncertainty and
impedes project progress.

POLICY, LEGAL, AND REGULATORY DEVELOPMENTS
4
4.1International policy legal and regulatory developments 57
4.2Regional, national, and sub-national policy, legal, and regulatory developments 63
4.3Project views 76
4.4Government funding support 84
4.5Challenges and outlook 87

57P O L I C Y, L E G A L , A N D R E G U L AT O R Y D E V E L O P M E N T S
KEY MESSAGES
› International and domestic climate change mitigation commitments signal the
need to decarbonise energy-related emissions, and any delays will continue
to undermine private sector investment in CCS activities and further stifl e
technology development.
› Inclusion of CCS in the CDM and full ratifi cation of the amendments to the
OSPAR Convention were signifi cant developments in the international legal
and regulatory architecture for CCS, but challenges remain in the adoption of
amendments to the London Protocol to allow for the export of CO2 streams for
the purpose of storage in sub-seabed geological formations.
› Only modest CCS-specifi c policy developments have occurred in the past
12 months, however there has been a rebalancing of climate policy settings
for carbon pricing more generally, and enhanced support for all low-carbon
technologies within the UK specifi cally.
› The level of funding for CCS demonstration projects, while still considerable,
is increasingly vulnerable and it is clear that the level of funding support still
available will service fewer projects than was perhaps initially expected.
› The overall perception of CCS project participants is that the current mix
of policy settings and prevailing regulatory environments are somewhat
supportive of positive investment decisions in CCS demonstration projects,
but policy settings over the medium to longer term are seen to be largely
inadequate to ensure future project viability.
Policy, legal, and regulatory developments are key factors determining whether CCS will progress as an important GHG
mitigation technique. There is a wide range of policy, legislation, and regulation that is relevant to CCS, from international
climate change agreements, through national climate and energy policy, to project-specifi c legislation and regulation.
Developments over the past year in this range of instruments and mechanisms are reviewed in this chapter. Some observations
are also made on the challenges for policymakers and regulators, both from a global perspective and from the point of view of
project proponents.
4.1
INTERNATIONAL POLICY LEGAL AND REGULATORY DEVELOPMENTS
United Nations mechanismsIn 2011, the 17th session of the Conference of the Parties (COP 17) to the UNFCCC agreed that a new international climate
change regime would be established by 2015 for implementation in 2020. This new instrument or arrangement would require
Parties to enhance their mitigation efforts in the post-2020 period, beyond the second commitment period of the Kyoto
Protocol. The intention is that Parties will be held to account on the basis of common but differentiated responsibilities under
the one instrument, unlike the Kyoto Protocol that divides Parties into developed and developing nations, with and without
legally-binding carbon constraints, respectively.
Photo
court
esy
of The C
limate
Gro
up.

T H E G L O B A L S TAT U S O F C C S : 2 0 1 258
Negotiations on the new regime will intensify over the next few years, and will be very important for the future of global climate
change mitigation efforts. In the meantime, the Kyoto Protocol remains the principal mechanism for giving effect to these efforts.
The Kyoto Protocol provides the compliance arrangements by which Annex B Parties (essentially Annex I, mainly developed,
countries that have ratifi ed the Kyoto Protocol) can deliver on their negotiated emission reduction targets. The Kyoto Protocol
establishes three fully fungible carbon markets called fl exibility mechanisms or Kyoto markets. These include two project-
based markets called Joint Implementation (JI) and the CDM, as well as a cap and trade system called International Emissions
Trading (IET).
JI and CDM allow for developed countries to claim offset credits for emission reductions generated from their investment in
projects in other countries – JI for projects in Annex B countries and CDM for projects in non-Annex B countries, which are
mostly developing countries. These credits, referred to as emission reduction units (ERU) and certifi ed emission reduction
(CER) units respectively, can be used by Annex B emitters to acquit against their carbon liabilities and/or sell on in a number
of existing and emerging carbon markets. IET allows developed countries to trade in their assigned amount units (AAUs) which
are generated as a consequence of their legally binding emission reduction targets and which are ‘supplemental’ to meeting
their own needs.
The negotiating landscape for CCS under the UNFCCC remains complex. There are fi ve main mechanisms affecting the global
deployment of CCS in the UNFCCC agenda. These are:
inclusion of project level CCS projects/abatement under the CDM;
adoption of a Technology Mechanism;
adoption of a Financial Mechanism;
registration of Nationally Appropriate Mitigation Actions (NAMAs); and
potential for New Market Based Mechanisms (NMBMs).
The UNFCCC is the principal international negotiating forum driving country-by-country action to prevent dangerous
levels of climate change. It consists of the Convention itself, which is the parent treaty accountable to the COP, and
the Kyoto Protocol, which is the subordinate legal instrument accountable to the Meeting of the Parties to the Kyoto
Protocol (CMP).
Supporting the implementation of the Convention and the Kyoto Protocol are fi ve subsidiary bodies, of which two are
permanent (Subsidiary Bodies for Implementation, SBI; and Scientifi c and Technological Advice, SBSTA), and three
are ad hoc working groups (the Long-term Cooperative Action under the Convention, AWG-LCA; Further Commitments
for Annex I Parties under the Kyoto Protocol, AWG-KP; and the Durban Platform for Enhanced Action, ADP).
The AWG-LCA and ADP report and make recommendations to the COP; the AWG-KP reports and makes
recommendations to the CMP; and the SBI and SBSTA report and make recommendations to either the COP or CMP
depending on what they have been tasked to implement or advise on respectively (Figure 35).
UNFCCC ARCHITECTURE
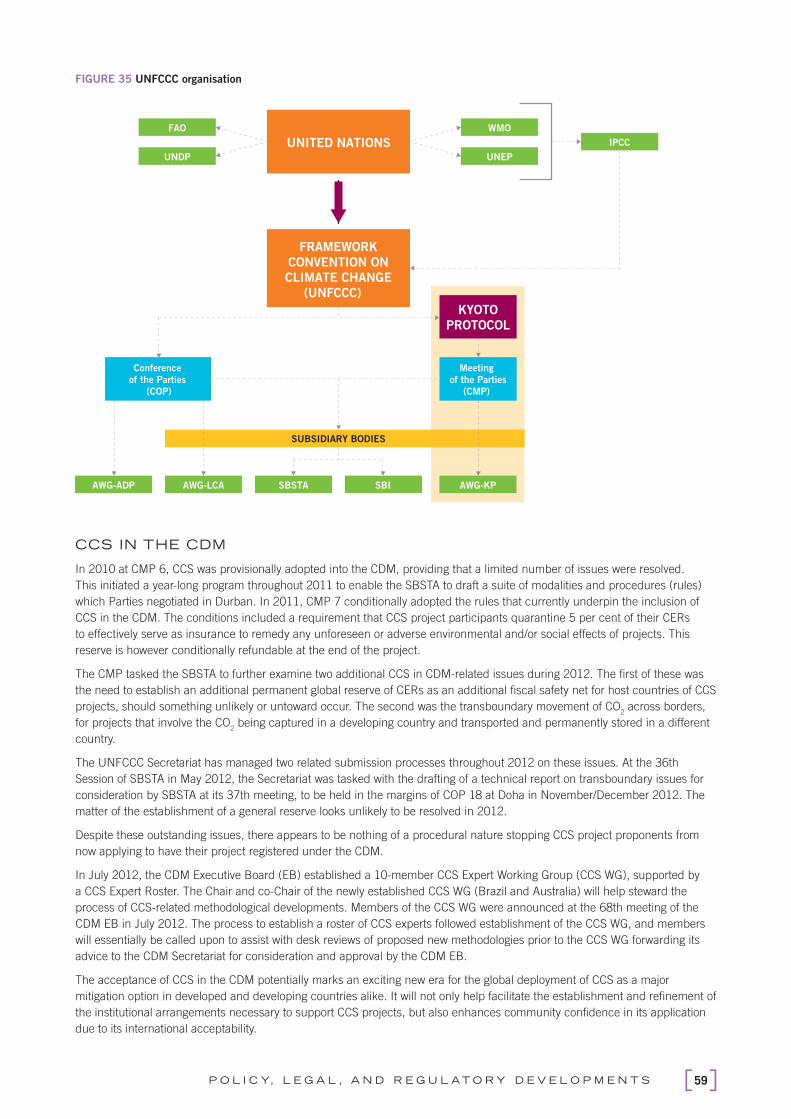
59P O L I C Y, L E G A L , A N D R E G U L AT O R Y D E V E L O P M E N T S
FIGURE 35 UNFCCC organisation
FAO
UNDP
Conference
of the Parties
(COP)
WMO
UNEP
UNITED NATIONS IPCC
FRAMEWORK
CONVENTION ON
CLIMATE CHANGE
(UNFCCC)
Meeting
of the Parties
(CMP)
AWG-KPSBISBSTAAWG-LCAAWG-ADP
KYOTO
PROTOCOL
SUBSIDIARY BODIES
CCS IN THE CDM
In 2010 at CMP 6, CCS was provisionally adopted into the CDM, providing that a limited number of issues were resolved.
This initiated a year-long program throughout 2011 to enable the SBSTA to draft a suite of modalities and procedures (rules)
which Parties negotiated in Durban. In 2011, CMP 7 conditionally adopted the rules that currently underpin the inclusion of
CCS in the CDM. The conditions included a requirement that CCS project participants quarantine 5 per cent of their CERs
to effectively serve as insurance to remedy any unforeseen or adverse environmental and/or social effects of projects. This
reserve is however conditionally refundable at the end of the project.
The CMP tasked the SBSTA to further examine two additional CCS in CDM-related issues during 2012. The fi rst of these was
the need to establish an additional permanent global reserve of CERs as an additional fi scal safety net for host countries of CCS
projects, should something unlikely or untoward occur. The second was the transboundary movement of CO2 across borders,
for projects that involve the CO2 being captured in a developing country and transported and permanently stored in a different
country.
The UNFCCC Secretariat has managed two related submission processes throughout 2012 on these issues. At the 36th
Session of SBSTA in May 2012, the Secretariat was tasked with the drafting of a technical report on transboundary issues for
consideration by SBSTA at its 37th meeting, to be held in the margins of COP 18 at Doha in November/December 2012. The
matter of the establishment of a general reserve looks unlikely to be resolved in 2012.
Despite these outstanding issues, there appears to be nothing of a procedural nature stopping CCS project proponents from
now applying to have their project registered under the CDM.
In July 2012, the CDM Executive Board (EB) established a 10-member CCS Expert Working Group (CCS WG), supported by
a CCS Expert Roster. The Chair and co-Chair of the newly established CCS WG (Brazil and Australia) will help steward the
process of CCS-related methodological developments. Members of the CCS WG were announced at the 68th meeting of the
CDM EB in July 2012. The process to establish a roster of CCS experts followed establishment of the CCS WG, and members
will essentially be called upon to assist with desk reviews of proposed new methodologies prior to the CCS WG forwarding its
advice to the CDM Secretariat for consideration and approval by the CDM EB.
The acceptance of CCS in the CDM potentially marks an exciting new era for the global deployment of CCS as a major
mitigation option in developed and developing countries alike. It will not only help facilitate the establishment and refi nement of
the institutional arrangements necessary to support CCS projects, but also enhances community confi dence in its application
due to its international acceptability.

T H E G L O B A L S TAT U S O F C C S : 2 0 1 260
The CDM has clearly been successful in helping deploy many sorts of mitigation projects in developing countries, but it is
unlikely that, given the depressed value of the CERs, the CDM alone can make marginally uneconomic CCS projects economic
(let alone early-mover CCS projects in developing countries). While most CDM commentators would suggest that it may take
some time for CCS projects to be fully rewarded under the CDM, the mechanism (and other project-based schemes such as
Joint Implementation) is generally recognised as a necessary and important source of additional funding.
CCS IN OTHER UNFCCC MECHANISMS
CCS is currently being explicitly discussed in the AWG-LCA and SBSTA negotiations, and it remains of intrinsic relevance to the
other negotiating tracks.
The AWG-LCA track is examining cooperative action beyond 2012. Under this track, both the Technology Mechanism,
including the Climate Technology Centre and Network (CTCN), and the Financial Mechanism’s Green Climate Fund (GCF)
are being negotiated. These initiatives are critically important to the future of CCS, as developing countries will depend on the
CTCN to facilitate needs assessments and project-level activities, and the GCF is a major source of fi nance for such projects.
The Technology Mechanism needs to be operational by the end of 2012, and the implementation issues surrounding this
mechanism are being managed through the Technology Excutive Committe and the SBI.
The Technology Mechanism will inevitably play a signifi cant role in accelerating the demonstration and diffusion of low
emission technologies such as CCS. The associated CTCN will help establish the enabling environments and capacity building
needs required to overcome market (and human and institutional) barriers.
The Financial Mechanism already includes provision of an agreed ‘fast start’ fi nance for developing countries approaching
US$30 billion up to 2012, and the establishment of a US$100 billion a year (by 2020) GCF administered initially by the World
Bank to support adaptation and mitigation actions (projects, programs, policies, and other activities) in developing countries.
The AWG-LCA carries responsibility for the provision of funding resources for the GCF to support mitigation action and
technology cooperation (especially for developing countries) by mobilising public and private-sector funding and investment.
The GCF Board and the SBI is responsible for its implementation.
The GCF was launched at COP 17, and positively cites CCS as an example of a likely eligible technology. Six bids to host the
GCF were received by the secretariat, including from Germany (Bonn), Mexico (Mexico City), Namibia (Windhoek), Poland
(Warsaw), Korea (New Songdo City), and Switzerland (Geneva). At the time of writing, the GCF had just hosted its fi rst board
meeting, where these applications are to be considered, but the meeting had to be postponed three times due to procedural
issues. It is expected the Board will forward to the COP a recommendation for a host at COP 18. The World Bank (GCF Interim
Trustee) has been ready to receive contributions from Parties from as early as May 2012. While some Parties have formally
expressed willingness to pay, at the present time no contributions have yet been received.
In regards to NAMAs, it was agreed at COP 16 that countries requiring international support in the form of technology, fi nance,
or capacity building will be recorded in a registry where the action and the support for that action can be matched. It was also
agreed that governments will continue to work towards establishing one or more new market-based mechanisms to enhance
and promote the cost-effectiveness of mitigation actions. A key aspect of the NAMA agenda is the extent and possibility of
linking them to NMBMs and existing crediting arrangements.
The AWG-LCA is also looking at the role and legitimacy of NMBMs and how they can facilitate real and enhanced mitigation
action, as well as help transfer, develop, and deploy low-emission technologies such as CCS.
Negotiations affecting the Kyoto Protocol are managed under the AWG-KP track. CCS is explicitly cited in the Kyoto Protocol as
being a legitimate mitigation technology. This negotiating track is relevant to CCS in that it:
currently defines the legally-binding short to medium-term emission constraints (over what is called commitment periods);
defines the scarcity of emissions within carbon markets (CDM, JI, and IET); and
drives the market discovery of carbon prices.

61P O L I C Y, L E G A L , A N D R E G U L AT O R Y D E V E L O P M E N T S
International standards for CCSIn May 2011, the Standards Council of Canada (SCC) submitted a proposal to the International Standards Organization (ISO)
to develop an internationally agreed standard/s for CCS. The SCC’s proposal is a consequence of a collaborative effort between
the International Performance Assessment Centre for Geologic Storage of Carbon Dioxide (IPAC-CO2) and the Canadian
Standards Association (CSA) to establish a bi-national CCS standard for Canada and the US and subsequently use the
standard as a basis for accreditation under the ISO.
The proposal seeks to develop standards that cover: capture, transport, storage, risk management, and quantifi cation and
verifi cation; and include materials, equipment, environmental planning and management, and other CCS-related activities.
By establishing an ISO standard for CCS, the ultimate objective is to have CCS-related activities conform to a global consensus
on performance standards and to defi ne the specifi cations and criteria that can be applied consistently to all CCS projects.
However, the objective to secure a global consensus on a uniform set of rules and criteria that can appropriately, dependably,
and effi ciently address all of the localised needs of CCS projects may prove to be challenging at this stage of global CCS
developments.
ISO standards on CCS are likely to take several years to develop. The process has commenced, with the formation of a
Technical Committee (ISO/TC265) which engages 13 voting countries (as represented by their respective national standards
organisations) and 12 observing countries. The fi rst meeting of TC265 was held in Paris in June 2012. The SCC and the
Standardization Administration of China have been appointed Secretariat of the ISO work program.
A scoping document released by the TC in mid-2012 indicates recognition that not all CCS-related subject matter is ready for
standardisation, and the TC further recognises that CCS is a dynamic and evolving subject, and care will be taken to ensure
that standards remain up to date and do not impede innovation.
The application by sovereign nations of ISO standards is voluntary, and as such governments can choose to adopt them in
their regulations or not. An ISO standard is ultimately decided on by an international consensus of designated experts who
discuss, debate, and argue from within ‘national delegations’. They are subject to a periodic review at least every fi ve years.
There are currently no known accredited national or international standards specifi c to CCS. There are however a large
number of published peer-reviewed expert reports, best practices, and guidelines that contain transparent approaches and
recommendations to address and/or redress CCS-related issues.
Policy makers have tended to avoid placing too much emphasis on institutionalising nascent and evolving CCS-related
performance standards due to the limited amount of project level data currently available to inform the setting of appropriate
performance thresholds. The setting of standards on the basis of incomplete information could potentially lead to overly
conservative permit requirements being imposed on demonstration and pre-commercial CCS projects, and this could
undermine the ability of proponents to proceed with innovative and often fi rst-of-a-kind demonstration projects.
In September 2012, the Institute was notifi ed of its Category A Liaison Organization status. This role will see the Institute inform
and seek input from relevant stakeholders on issues as they arise throughout the discussions.
International marine legislation Two key international marine treaties have a signifi cant impact on offshore CO
2 injection for storage: the Convention for the
Protection of the Marine Environment of the North East Atlantic (OSPAR Convention), and the Protocol to the Convention
on the Prevention of Marine Pollution by Dumping of Wastes and Other Matter at Sea (London Protocol). To eliminate the
prohibition of some offshore CCS activities, amendments were made to the OSPAR Convention in 2007 and London Protocol
in 2006 and 2009. These amendments are particularly signifi cant given the number of LSIPs which plan to transport and store
CO2 offshore for geologic storage in a range of jurisdictions (Table 8).
The 2007 amendment to the OSPAR Convention, which allows for CO2 injection and storage in North East Atlantic waters,
has now entered into force, albeit four years after the original amendment was made. The requisite seven ratifi cations were
reached on 23 June 2011 when Denmark ratifi ed the amendment, joining Germany, Norway, Spain, the UK, Luxembourg,
and the EU. In October 2011, the Netherlands also ratifi ed the 2007 amendment. Thus far, all OSPAR contracting countries
which have CCS demonstration projects have ratifi ed the 2007 amendment, except for France where the ratifi cation process is
underway and expected to be completed by the end of 2012.
Two amendments were made to the London Protocol, to allow for offshore CO2 injection and cross-border movement of CO
2. The
former was addressed by the 2006 amendment to Annex 1 of the London Protocol, which added captured CO2 as one of the
wastes or other matter that may be dumped in subsea geologic formations. This amendment, being an amendment of the Annex,
did not require ratifi cation, and automatically entered into force on 10 February 2007, 100 days from the amendment’s adoption.
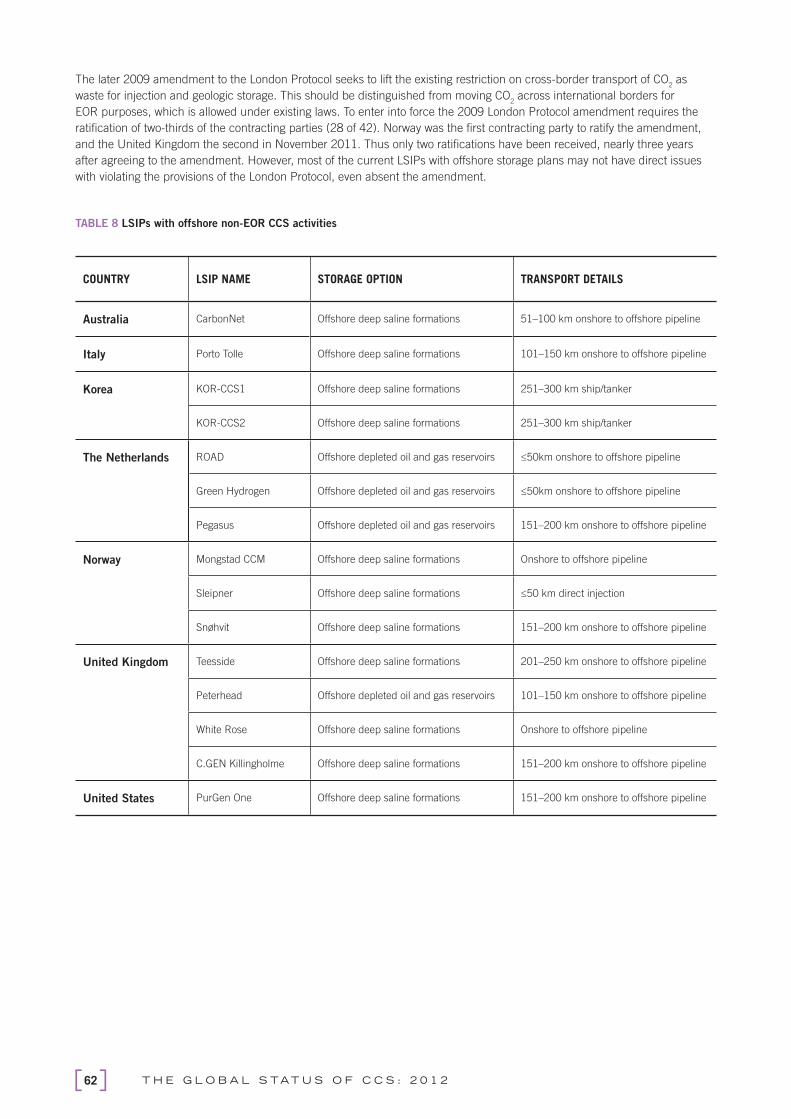
T H E G L O B A L S TAT U S O F C C S : 2 0 1 262
The later 2009 amendment to the London Protocol seeks to lift the existing restriction on cross-border transport of CO2 as
waste for injection and geologic storage. This should be distinguished from moving CO2 across international borders for
EOR purposes, which is allowed under existing laws. To enter into force the 2009 London Protocol amendment requires the
ratifi cation of two-thirds of the contracting parties (28 of 42). Norway was the fi rst contracting party to ratify the amendment,
and the United Kingdom the second in November 2011. Thus only two ratifi cations have been received, nearly three years
after agreeing to the amendment. However, most of the current LSIPs with offshore storage plans may not have direct issues
with violating the provisions of the London Protocol, even absent the amendment.
TABLE 8 LSIPs with offshore non-EOR CCS activities
COUNTRY LSIP NAME STORAGE OPTION TRANSPORT DETAILS
Australia CarbonNet Offshore deep saline formations 51–100 km onshore to offshore pipeline
Italy Porto Tolle Offshore deep saline formations 101–150 km onshore to offshore pipeline
Korea KOR-CCS1 Offshore deep saline formations 251–300 km ship/tanker
KOR-CCS2 Offshore deep saline formations 251–300 km ship/tanker
The Netherlands ROAD Offshore depleted oil and gas reservoirs ≤50km onshore to offshore pipeline
Green Hydrogen Offshore depleted oil and gas reservoirs ≤50km onshore to offshore pipeline
Pegasus Offshore depleted oil and gas reservoirs 151–200 km onshore to offshore pipeline
Norway Mongstad CCM Offshore deep saline formations Onshore to offshore pipeline
Sleipner Offshore deep saline formations ≤50 km direct injection
Snøhvit Offshore deep saline formations 151–200 km onshore to offshore pipeline
United Kingdom Teesside Offshore deep saline formations 201–250 km onshore to offshore pipeline
Peterhead Offshore depleted oil and gas reservoirs 101–150 km onshore to offshore pipeline
White Rose Offshore deep saline formations Onshore to offshore pipeline
C.GEN Killingholme Offshore deep saline formations 151–200 km onshore to offshore pipeline
United States PurGen One Offshore deep saline formations 151–200 km onshore to offshore pipeline
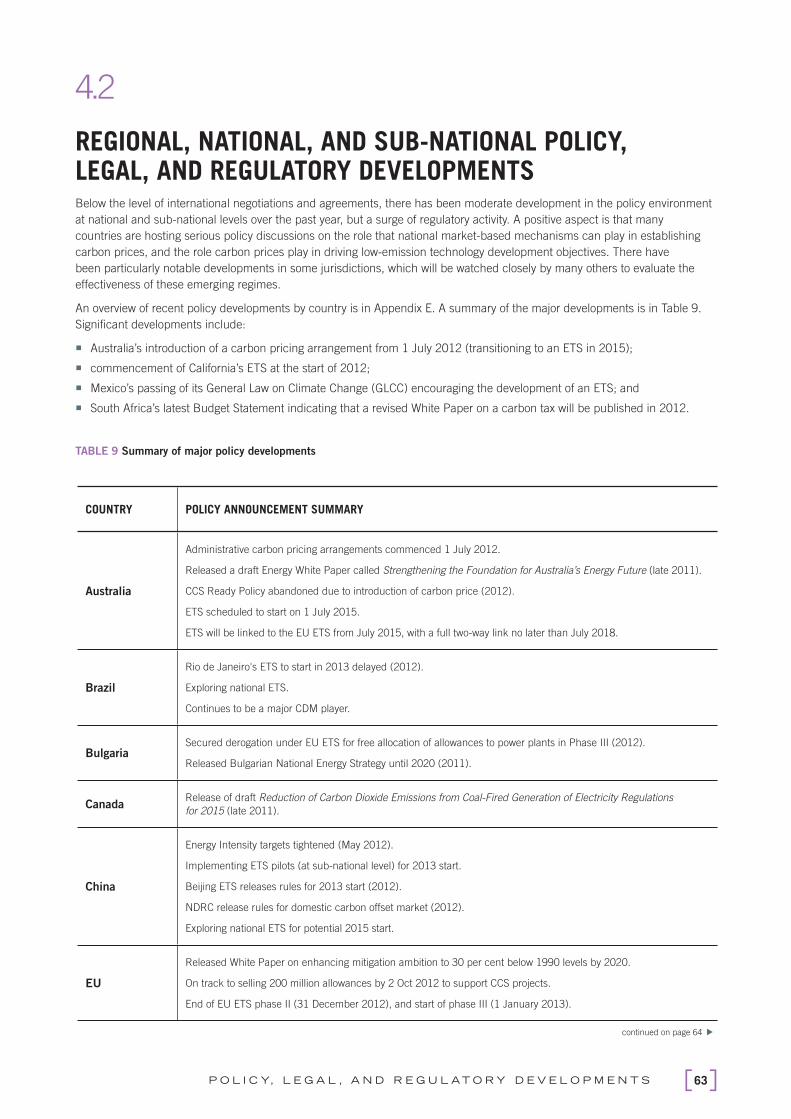
63P O L I C Y, L E G A L , A N D R E G U L AT O R Y D E V E L O P M E N T S
4.2
REGIONAL, NATIONAL, AND SUB-NATIONAL POLICY, LEGAL, AND REGULATORY DEVELOPMENTS Below the level of international negotiations and agreements, there has been moderate development in the policy environment
at national and sub-national levels over the past year, but a surge of regulatory activity. A positive aspect is that many
countries are hosting serious policy discussions on the role that national market-based mechanisms can play in establishing
carbon prices, and the role carbon prices play in driving low-emission technology development objectives. There have
been particularly notable developments in some jurisdictions, which will be watched closely by many others to evaluate the
effectiveness of these emerging regimes.
An overview of recent policy developments by country is in Appendix E. A summary of the major developments is in Table 9.
Signifi cant developments include:
Australia’s introduction of a carbon pricing arrangement from 1 July 2012 (transitioning to an ETS in 2015);
commencement of California’s ETS at the start of 2012;
Mexico’s passing of its General Law on Climate Change (GLCC) encouraging the development of an ETS; and
South Africa’s latest Budget Statement indicating that a revised White Paper on a carbon tax will be published in 2012.
TABLE 9 Summary of major policy developments
COUNTRY POLICY ANNOUNCEMENT SUMMARY
Australia
Administrative carbon pricing arrangements commenced 1 July 2012.
Released a draft Energy White Paper called Strengthening the Foundation for Australia’s Energy Future (late 2011).
CCS Ready Policy abandoned due to introduction of carbon price (2012).
ETS scheduled to start on 1 July 2015.
ETS will be linked to the EU ETS from July 2015, with a full two-way link no later than July 2018.
Brazil
Rio de Janeiro's ETS to start in 2013 delayed (2012).
Exploring national ETS.
Continues to be a major CDM player.
BulgariaSecured derogation under EU ETS for free allocation of allowances to power plants in Phase III (2012).
Released Bulgarian National Energy Strategy until 2020 (2011).
CanadaRelease of draft Reduction of Carbon Dioxide Emissions from Coal-Fired Generation of Electricity Regulations
for 2015 (late 2011).
China
Energy Intensity targets tightened (May 2012).
Implementing ETS pilots (at sub-national level) for 2013 start.
Beijing ETS releases rules for 2013 start (2012).
NDRC release rules for domestic carbon offset market (2012).
Exploring national ETS for potential 2015 start.
EU
Released White Paper on enhancing mitigation ambition to 30 per cent below 1990 levels by 2020.
On track to selling 200 million allowances by 2 Oct 2012 to support CCS projects.
End of EU ETS phase II (31 December 2012), and start of phase III (1 January 2013).
continued on page 64

T H E G L O B A L S TAT U S O F C C S : 2 0 1 264
COUNTRY POLICY ANNOUNCEMENT SUMMARY
India
Intention to launch 9th Mission (clean coal technologies) under National Action Plan on Climate Change announced.
Industrial energy effi ciency targets with tradable instruments announced (mid-2012).
National Clean Energy Fund (sourced from coal levy).
Indonesia Exploring a national ETS.
JapanActively promoting its Bilateral Offset Crediting Mechanism.
A new energy blueprint is expected to be released in late 2012.
KoreaETS law passed by National Assembly (May 2012) for 2015 commencement.
Commitment of funds to the value of 2 per cent of GDP (2009–2013) to foster 'green' growth.
Mexico
Passed The General Law on Climate Change (2012).
Exploring a national ETS.
National Energy Strategy 2012-26, presented to Congress in March 2012 includes CCS goals.
Netherlands Released its Energy Report (2011).
NorwayReleased a White Paper on Climate Change Actions (2012).
Increased carbon tax rates.
Romania Secured derogation under EU ETS for free allocation of allowances to power plants in Phase III (2012).
Russia Released Russian Federation’s Climate Doctrine for the Period until 2020 (2011).
South Africa
Treasury Budget (2012) announced White Paper on Carbon Tax in 2012.
Exploring carbon tax for potential 2013 start.
National Climate Change Response Policy, endorsed by Cabinet October 2011, identifi es CCS as one of South
Africa’s eight near-term Priority Flagship Programmes.
SpainCarbon Fund for a Sustainable Economy established (late 2011).
Is the second largest buyer of CDM credits (CERs).
SwedenIncreases in its energy and CO
2 tax (2011).
Developing a carbon neutral by 2050 roadmap by end of 2012.
Trinidad and
TobagoRelease of National Climate Change Policy (mid-2011).
UK
Released The Carbon Plan (2011).
Released CCS Roadmap Supporting deployment of CCS in the UK (2012).
Scotland released its Electricity Generation Policy Statement (2012).
USARelease of EPA's rules for emission performance of new coal plant (mid-2012).
Clean energy standard strongly supported by President (March 2012).
continued from page 63
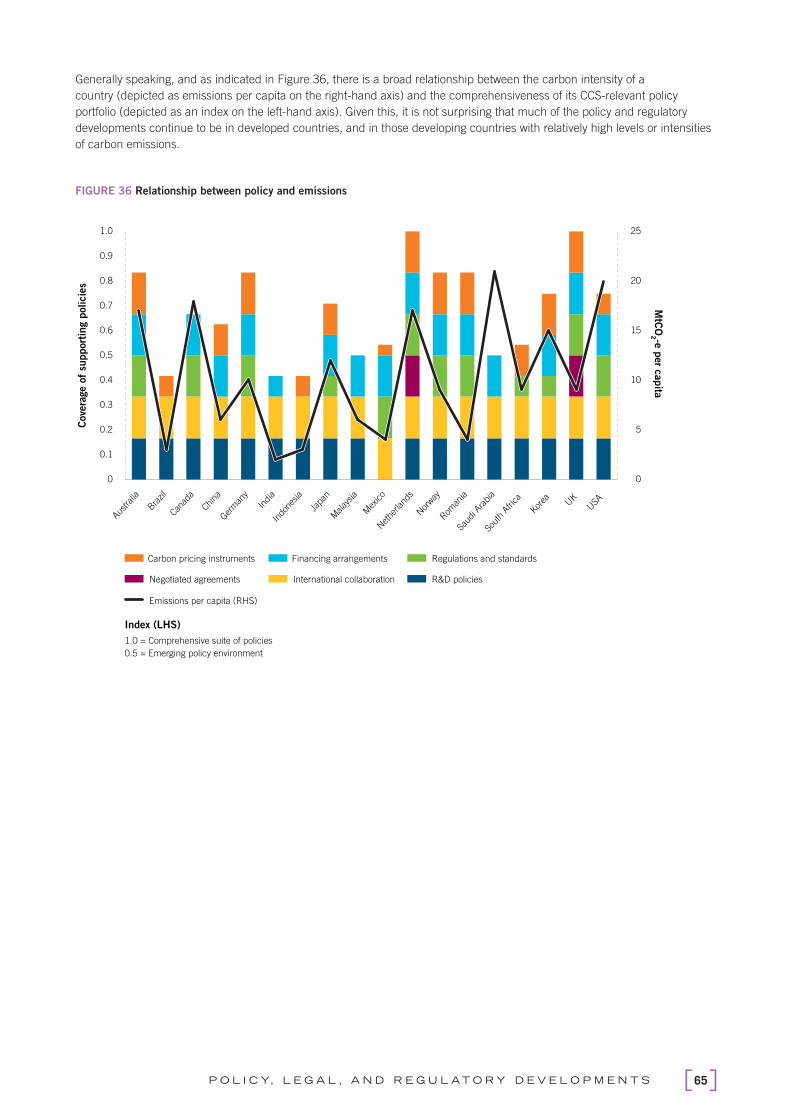
65P O L I C Y, L E G A L , A N D R E G U L AT O R Y D E V E L O P M E N T S
Generally speaking, and as indicated in Figure 36, there is a broad relationship between the carbon intensity of a
country (depicted as emissions per capita on the right-hand axis) and the comprehensiveness of its CCS-relevant policy
portfolio (depicted as an index on the left-hand axis). Given this, it is not surprising that much of the policy and regulatory
developments continue to be in developed countries, and in those developing countries with relatively high levels or intensities
of carbon emissions.
FIGURE 36 Relationship between policy and emissions
0
5
10
15
20
25
0
0.1
0.2
0.3
0.4
0.5
0.6
0.7
0.8
0.9
1.0
Austra
lia
Bra
zil
Canad
a
China
Ger
man
y
India
Indo
nesia
Japa
n
Malay
sia
Mex
ico
Nethe
rland
s
Nor
way
Rom
ania
Saud
i Ara
bia
MtC
O2 -e
per c
apita
Cove
rage o
f su
pport
ing p
olicie
s
Emissions per capita (RHS)
Sout
h Afri
ca
Korea
UK
USA
Carbon pricing instruments Financing arrangements Regulations and standards
R&D policies Negotiated agreements International collaboration
Index (LHS)
1.0 = Comprehensive suite of policies
0.5 = Emerging policy environment

T H E G L O B A L S TAT U S O F C C S : 2 0 1 266
Comprehensive CCS policiesAcross most countries, CCS policy development has focused on:
long-term carbon pricing under climate change policy;
the need to accelerate development of the technology through large-scale demonstration programs and increased R&D
expenditure; and
developing the necessary regulatory infrastructure.
Given the radical technological change required to decarbonise the energy system during this century, combined with short-
term concerns over the rate at which climate policies are being implemented, it is widely acknowledged that relying on a
carbon price alone will not achieve least-cost paths for both the development and deployment of the technologies required. At
the same time, the rate of development of CCS projects has not occurred at a rate commensurate with expectations only a few
years ago.
It is vital to recognise that a suite of CCS-friendly policies can be complementary (mutually reinforcing) or non-complementary
(can undermine one another and/or be redundant) depending on how they are designed and implemented. The IEA (2011b)
observes that in managing the policy interactions “policy packages should be regularly reviewed to maintain coherence over
time, particularly if policies interact strongly. To promote investment certainty, reviews should generally be limited to scheduled
intervals and follow understood criteria. In the event of a major unforeseen shock, a judgement is needed on whether the
benefi ts of restoring policy balance outweigh the damage to investment certainty caused by intervening.”
The UK Government is implementing the fi rst comprehensive attempt globally to set a policy to drive CCS deployment beyond
the fi rst demonstration facilities. Support for CCS is enabled through actions to reform electricity market arrangements and
the implementation of the CCS Roadmap. Details of the UK approach are given in the following Box. This policy package is
being closely watched to see what effect it has on CCS demonstration and deployment in that country, and the extent to which
aspects of the regime are applicable elsewhere.

67P O L I C Y, L E G A L , A N D R E G U L AT O R Y D E V E L O P M E N T S
The UK Government acknowledges that the EU ETS is the cornerstone of UK action to reduce GHG emissions from
the power and industrial sectors in Europe. However, they have stated that:
Whilst the EU ETS is successfully delivering emissions reductions across the UK and Europe, so far the carbon price
has not been suffi cient to incentivise the required levels of new low carbon investment (DECC 2011).
To reduce risk and uncertainty for investment in low-carbon technologies (necessary to support an estimated £110
billion investment in new generating capacity and transmission investment by 2020), the UK Government introduced
three mechanisms to support low-carbon technologies:
a Carbon Price Support scheme (also known as the carbon floor price);
a Feed-in Tariff supported though technology-specific ‘contract for differences’ for low-carbon energy; and
an Emissions Performance Standard.
It has also introduced a ‘CCS Commercialisation Program’ to provide capital subsidies and address technical and
regulatory barriers specifi c to CCS.
The combination of instruments seeks to manage investment expectations regarding market demand and price
outcomes over a suffi ciently long term.
Overall, the policy framework seeks to provide:
long-term instruments to provide stable and predictable incentives for companies to invest in low-carbon
generation, including CCS;
to limit CO2 emissions from new fossil fuel power stations; and
reduce existing policy risk.
CARBON PRICE SUPPORT
The Carbon Price Support scheme was legislated in 2011 and is levied on all fossil fuels used to generate electricity.
The levy (part of the broader Climate Change Levy arrangements) will be set annually, depending on the forecast EU
ETS carbon price, to achieve an overall carbon price trajectory in the UK that rises to £30/tonne by 2020 and then to
£70/tonne by 2030.
CONTRACT FOR DIFFERENCES
The Contract for Differences (CfD) introduced in the draft Energy Bill in May 2012 is proposed as a long-term
transition mechanism with different arrangements for CCS, renewables, and nuclear. The CfD is an agreement for a
project to effectively receive a fi xed price, also known as a ‘strike price’, for the energy delivered.
If the strike price is higher than the electricity wholesale market price, the generator is paid the difference, and
conversely, if the electricity market price is higher than the strike price, the generator pays back the difference. Strike
prices will be established at levels suffi cient to support the different types of technologies being supported.
The price transition arrangements are in four phases:
Stage 1: 2014–17
A project (and technology) specifi c strike price will be agreed through negotiation between projects and government.
For CCS, this phase will also be part of the CCS Commercialisation Program (discussed on page 68).
Stage 2: 2017–early 2020s
The use of tenders or auctions to procure generation, but still segregated on a technology basis and primarily focused
on renewable generation.
Stage 3: Early–mid 2020s
CfDs established in a technology-neutral process (by tendering or auction).
A COMPREHENSIVE LOW-CARBON REGIME – THE UNITED KINGDOM
continued on page 68
T H E G L O B A L S TAT U S O F C C S : 2 0 1 268
Stage 4: Late 2020s
Phase out CfDs and rely on carbon pricing only for continuing low-carbon technology deployment.
At the time of writing this report, there remain a number of issues to be resolved with implementing the CfDs,
including the counter-party and contract term. The draft Energy Bill implements the CfDs by statute, obliging all
energy retailers and/or marketers to pay for the CfDs and spread the costs across their customer base. This approach
may require further regulatory changes to provide the necessary contract security for low-carbon generators.
For CCS projects supported through the CCS Commercialisation Program, the length of the contract is recommended
to be a 10-year term. This is in contrast to renewables with a 15-year term, and nuclear with an in-principle
recommendation of no less than 15 years.
The strike price for CCS projects may also have a price review clause included in the terms, so that it can be reviewed
at the end of construction and following a period of further testing of the CCS plant.
EMISSIONS PERFORMANCE STANDARDS
Announced in 2010, the draft Energy Bill limits the amount of CO2 emitted by new fossil fuel power stations to 450 kg/
MWh. With the carbon fl oor price and CfDs driving investment away from unabated coal plants, this regulation is not
expected to have any direct effects. Instead, it acts indirectly as a regulatory backstop to clearly signal that the most
carbon-intensive (unabated coal) power stations will not be permitted to be built.
CCS ROADMAP AND COMMERCIALISATION PROGRAM
A policy goal of the UK Government is commercial deployment of CCS during the 2020s. A CCS Roadmap (Figure
37) has developed a 10-year work program that, beyond the electricity market reform and the CCS commercialisation
program, includes:
CCS innovation;
continuing regulatory framework development;
storage review and research;
transport infrastructure;
CCS cost examination;
workforce skills and supply chain development; and
international policy engagement.
The framework seeks to deliver “investment decisions to build CCS equipped fossil-fuel power stations, in the early
2020s, without a capital subsidy, at an agreed CfD strike price that is competitive with the strike prices for other low
carbon generation technologies” (DECC 2012).
The CCS Commercialisation Program provides £1 billion in direct grant support that, dependent on what industry
brings forward, may cover:
demonstrating either full-chain or key-elements of CCS projects in the power or industrial sectors;
developing infrastructure, which might be available to subsequent projects; and
investigate alternative options, including enhanced hydrocarbon recovery.
It is expected that recipients of funding will be announced in October 2012, prior to announcements for successful
applicants under the NER300 program. The intention is that funding from both programs will be able to support UK-
based CCS projects.
continued from page 67
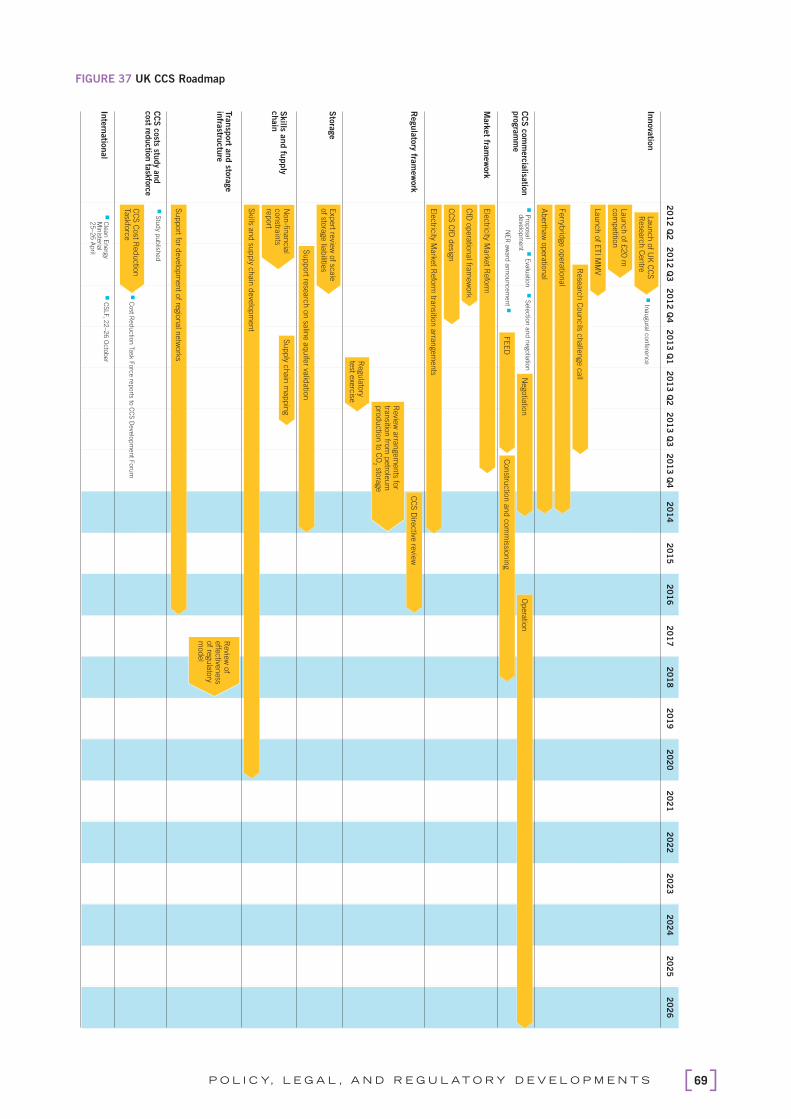
69P O L I C Y, L E G A L , A N D R E G U L AT O R Y D E V E L O P M E N T S
FIGURE 37 UK CCS Roadmap
20
12
Q2
20
12
Q3
20
12
Q4
20
13
Q1
20
13
Q2
20
13
Q3
20
13
Q4
20
14
20
15
20
16
20
17
20
18
20
19
20
20
20
21
20
22
20
23
20
24
20
25
20
26
Innova
tion
CC
S c
om
merc
ialisa
tion
pro
gra
mm
e
Mark
et fra
mew
ork
Regula
tory fra
mew
ork
Sto
rage
Skills a
nd fu
pply
chain
Tra
nsp
ort a
nd sto
rage
infra
structu
re
CC
S costs stu
dy an
d
cost reduction
taskforce
Inte
rnatio
nal
Regula
tory
test e
xerc
ise
Launch o
f £20 m
com
petitio
n
Launch o
f ETI M
MV
Ele
ctric
ity Mark
et R
efo
rm
CfD
opera
tional fra
mew
ork
CC
S C
fD d
esig
n
Ele
ctric
ity Mark
et R
efo
rm tra
nsitio
n a
rrangem
ents
Skills a
nd su
pply c
hain
deve
lopm
ent
Support fo
r deve
lopm
ent o
f regio
nal n
etw
ork
s
Support re
searc
h o
n sa
line a
quife
r valid
atio
n
Rese
arc
h C
ouncils c
halle
nge c
all
CC
S D
irective
revie
w
Negotia
tion
Opera
tion
FEED
Constru
ctio
n a
nd c
om
missio
nin
g
Ferryb
ridge o
pera
tional
Aberth
aw
opera
tional
Revie
w o
f effe
ctive
ness
of re
gula
tory
model
Supply c
hain
mappin
gN
on-fi n
ancia
l constra
ints
report
Revie
w a
rrangem
ents fo
r tra
nsitio
n fro
m p
etro
leum
pro
ductio
n to
CO
2 stora
ge
� P
rop
osa
ld
eve
lop
men
t
Exp
ert re
view
of sc
ale
of sto
rage lia
bilitie
s
� C
lean
En
erg
y M
iniste
rial
25
–2
6 A
pril
� C
SLF, 2
2–2
6 O
cto
ber
CC
S C
ost R
eductio
n
Task
forc
e�
Cost R
ed
uctio
n Ta
sk F
orc
e re
ports to
CC
S D
eve
lop
men
t Foru
m
� E
valu
atio
n
Launch o
f UK
CC
S
Rese
arc
h C
entre
�
Inau
gu
ral c
on
fere
nce
NE
R a
ward
an
nou
ncem
en
t �
� S
ele
ctio
n a
nd
negotia
tion
� S
tud
y pu
blish
ed

T H E G L O B A L S TAT U S O F C C S : 2 0 1 270
EuropeIn the UK, as elsewhere in Europe, efforts continue to develop CCS regulatory frameworks. The main driver for this has
been the EU CCS Directive. The Directive provides a regulatory framework for CO2 storage and mandates EU member states
to transpose its requirements into domestic legislation. On 25 June 2011, the deadline for transposing of the regulatory
framework closed, however, the implementation of the Directive is still in progress for some member states.
EU member states are bound to communicate to the European Commission the legislative and regulatory measures they have
adopted to meet the Directive’s requirements. While many EU states began the process, all but Spain failed to complete their
transposition within the deadline. Consequently, the Commission initiated infringement cases against 26 out of the 27 EU
member states that failed to fully comply with the Directive, or for failing to communicate their compliance to the Commission.
For jurisdictions that have communicated to the Commission that they have complied with the Directive, the Commission has
been verifying whether there has been an accurate transposition of the regulatory framework.
Table 10 provides a snapshot of status of transposition of the CO2 Storage Directive in EU member states. Nine of the 26
infringement cases have been closed already, including Denmark, France, Italy, Lithuania, Malta, the Netherlands, Portugal,
Romania, and Slovakia. Jurisdictions with pending applications under the NER300 funding program have completed or
nearly completed the transposition. This is partly due to the requirement set out under the NER300 rules that for contenders
to secure funding, transposition of the Directive must have been correctly completed. Further, it is worthwhile noting that EU
countries with ongoing CCS demonstration programs have completed or at least begun the process of developing their CCS
legislation and regulation, underscoring the importance of CCS regulations in CCS demonstration and deployment.
EU member states faced different challenges in the transposition process, which have to some extent impacted upon the
timely and comprehensive adoption of national legislation. Germany may be highlighted as one of such jurisdiction that has
encountered diffi culties in adopting a CCS regulatory framework. The Bundestag (Lower House of the German Parliament)
passed the CCS Law on 7 July 2011 however, the draft law was rejected by the Bundesrat (Assembly of German States –
Upper House) on 23 September 2011. This led to a formal conciliation procedure applied for by the German Government on
26 October 2011. The result was a compromise that was approved by the German parliamentary mediation committee and the
passage of a CCS law in Germany on 29 June 2012, which would allow CCS in Germany on a test or experimental basis. The
CCS law differs from the draft initially passed by the Bundestag, for it restricts the amount of CO2 to be captured and stored
to 1.3 million tonnes and provides individual states the option to opt out. The new German CCS law will be examined by the
Commission to determine whether it meets the requirements of the Directive.
Non-EU member countries, such as Norway, Liechtenstein, and Iceland are members of the European Free Trade Association
(EFTA) and participate in the single European market with members of the European Union under the European Economic
Area (EEA) agreement. Their participation in the internal market, however, carries an obligation to adopt all EU legislation
relating to the market, including the EU CCS Directive. Norway has been drafting new regulations for the storage and
transportation of CO2 in subsea reservoirs on the Norwegian Continental Shelf. CCS activities in Norway, such as Sleipner and
Snøhvit, are currently regulated under existing petroleum laws. Two new regulations are being drafted: one by the Ministry
of Petroleum and Energy for transport and storage of CO2 in relation to managing the CO
2 and geologic reservoirs as natural
resources (resource management), and another by the Ministry of Environment for environmentally safe storage of CO2. The
draft regulations will undergo public consultations once drafting is complete.

71P O L I C Y, L E G A L , A N D R E G U L AT O R Y D E V E L O P M E N T S
TABLE 10 Status of transposition of EU CCS Directive
EUROPEAN UNION
MEMBER STATES
STATUS OF TRANSPOSITION NER300 FUND
APPLICATION
CURRENT LSIPS
Austria Ongoing infringement case None 0
Belgium Ongoing infringement case None 0
Bulgaria Ongoing infringement case None 1 (Maritsa TPP)
Cyprus Ongoing infringement case None 0
Czech Republic Ongoing infringement case None 0
Denmark Infringement case closed None 0
Estonia Ongoing infringement case None 0
Finland Ongoing infringement case None 0
France Infringement case closed Pending 1 (Ulcos BF)
Germany Ongoing infringement case None 0
Greece Ongoing infringement case None 0
Hungary Ongoing infringement case None 0
Ireland Ongoing infringement case None 0
Italy Infringement case closed Pending 1 (Porto Tolle)
Latvia Ongoing infringement case None 0
Lithuania Infringement case closed None 0
Luxembourg Ongoing infringement case None 0
Malta Infringement case closed None 1 (Sargas Malta)
The Netherlands Infringement case closed Pending 4 (Eemshaven, ROAD, Green Hydrogen, Pegasus)
Poland Ongoing infringement case Pending 1 (Belchatow)
Portugal Infringement case closed None 0
Romania Infringement case closed Pending 1 (Getica)
Slovakia Infringement case closed None 0
Slovenia Ongoing infringement case None 0
Spain Fully transposed None 1 (Compostilla)
Sweden Ongoing infringement case None 0
UK Ongoing infringement case Pending 6 (Peterhead, Don Valley, C. Gen Killingholme,
Teeside, White Rose, Caledonia)

T H E G L O B A L S TAT U S O F C C S : 2 0 1 272
North America
UNITED STATES
There is no comprehensive federal climate policy in the US. In the absence of a comprehensive federal scheme, GHG
control is proceeding through federal regulation under the existing Clean Air Act and individual state initiatives. New bills and
regulations are being proposed and released with the aim of incentivising CCS innovation and development.
CCS continues to be recognised as a source of ‘clean energy’ in a Bill before the US Senate. On 1 March 2012, the US Senate
Committee on Energy and Natural Resources received a Bill sponsored by Senator Jeff Bingaman, entitled The Clean Energy
Standard (CES) Act of 2012. The draft Bill, if passed, will require large utilities to produce at least 24 per cent of their electricity
from ‘clean’ sources by 2015, increasing by 3 per cent annually through 2035. Clean energy is defi ned in the draft Bill to
include “electricity generated at a facility that captures and stores its CO2 emissions”. The fate of the ‘Bingaman Bill’, and the
fate of other climate legislation, remains highly uncertain.
The US EPA has actively drafted and released rules allowing for CCS operations. On 27 March 2012 the EPA released its
proposed emissions performance standards for new fossil-fuelled power plants, limiting GHG emissions to 1000 lbs CO2 per
megawatt hour. For new power plants with CCS, the proposed limit may either be satisfi ed by meeting the annual standard
yearly or a 30-year average of CO2 emissions.
In the past year, the EPA continued to develop technical guidance materials for the Class VI Injection Well Rule and has
released seven guidance documents on well testing and monitoring, primacy application and implementation manual,
site characterisation, area of review evaluation and corrective action, well construction, fi nancial responsibility, and public
participation considerations for geologic sequestration wells. Six more guidance documents for the Rule are expected to be
issued by the EPA as it continues to evaluate risks to drinking water sources, human health, and the environment.
On 12 July 2012, the US EPA fi nalised Step 3 of the GHG Tailoring Rule for the Prevention of Signifi cant Deterioration (PSD)
and Title V Operating permit programs (Table 11). Step 3 retains the existing permitting thresholds as state permitting authorities
have not had suffi cient time and opportunity to develop the necessary infrastructure and increase their GHG permitting
expertise and capacity. Step 3 also revises the federal program for establishing plant-wide applicability limitations (PALs) for
GHG emissions by allowing GHG PALs to be established on a CO2e basis, not just on a mass basis (or tonnes per year), and
allowing GHG-only sources to apply for CO2e-based PALs as a minor source candidate. This third instalment of the Tailoring
Rule will take effect on 1 July 2013. CCS is considered as one of the control technologies that may be used to reduce emissions
from facilities covered by the Rule, provided that CCS is determined to be the Best Available Control Technology (BACT).
Individual states continue to consider and adopt policies to eliminate barriers to CCS. For example, proposed legislation
in California (SB 1139) is drafted to address pore space ownership and direct state agencies to develop a quantifi cation
methodology for projects seeking to demonstrate geologic storage, including simultaneous sequestration via enhanced oil
recovery. The methodology would be used for GHG reporting, implementation of California’s market-based compliance
mechanisms, and compliance with GHG performance standards under California law. Another example is Illinois, where in
February 2012 draft CCS legislation was re-introduced to its General Assembly for consideration. The CCS Bill (SB 3758) seeks
to address signifi cant areas of CCS regulations including pore-space ownership, storage project development (defi nitions and
requirements), and unitisation of lease blocks.
CANADA
In the latter half of 2011, the Canadian Government published for public comment its proposed regulations to reduce CO2
emissions from coal-fi red electricity generators. Under these proposed regulations, new coal-fi red generators, as well as
mature units nearing retirement, will be required to abide by stringent performance standards based on the emissions
performance of high-effi ciency NGCC plants. If units covered under these regulations incorporate CCS, a temporary exemption
is given from the standard until 2025. Following the consultation period, which closed in October 2011, the Canadian
Government announced on 5 September 2012 the fi nal regulations, which will enter into force on 1 July 2015.
CCS regulations are also being developed in the Canadian provinces of Alberta, British Columbia, Nova Scotia, and
Saskatchewan.
Alberta has made signifi cant progress in its CCS Regulatory Framework Assessment (RFA) that began in early 2011 by
identifying and addressing gaps in its regulations. The recommendations from the RFA have suggested improvements in:
geologic site characterisation and site closure;
post-closure stewardship fund;
monitoring, measurement, and verification requirements; and
environmental issues.

73P O L I C Y, L E G A L , A N D R E G U L AT O R Y D E V E L O P M E N T S
Tailoring
rule
Step 1 Step 2 Step 3
Permit
type
PSD PSD Title V PSD and Title V
Entry into
force
2 January 2011 (to 30
June 2011)
1 July 2011 (to 30 June 2013) 1 July 2013
Facilities
covered
1. new sources subject
to PSD anyway for
other regulated
pollutants;
2. modifi ed sources
subject to PSD
anyway for other
regulated pollutants.
1. new sources
subject to PSD
anyway for
other regulated
pollutants;
2. new sources.
1. modifi ed sources
subject to PSD anyway
for other regulated
pollutants;
2. modifi ed source;
3. modifi ed minor source
for PSD.
1. new or existing
sources (not
already subject to
Title V).
New and modifi ed
sources.
GHG
emission
levels
1. have potential to emit
≥ 75,000 t/yr CO2e;
2. increase and net
emissions increase
≥ 75,000 t/yr CO2e;
and > 0 t/yr mass
basis.
1. have potential to
emit ≥ 75,000 t/
yr CO2e;
2. have potential to
emit ≥ 100,000
t/yr CO2e; and
≥ 100/250 t/yr
mass basis.
1. increase and net
emissions increase ≥
75,000 t/yr CO2e, and
> 0 t/yr mass basis;
2. exisiting source has
potential to emit ≥
100,000 t/yr CO2e, and
≥ 100/250 t/yr mass
basis; and modifi cation
has GHG emissions
increase and net
increase≥ 75,000 t/
yr CO2e; and > 0 t/yr
mass basis;
3. modifi cation alone
has actual or potential
to emit ≥ 100,000 t/
yr and; ≥100/250 t/yr
mass basis.
1. have the potential
to emit/emit ≥
100,000 t/yr
CO2e; and ≥ 100
t/yr GHGs on
mass basis.
Retains thresholds
for Steps 1 and 2.
Alberta expects to conclude the RFA at the end of 2012 with submission of a fi nal report to Alberta’s Energy Minister.
In February 2012, British Columbia released a Natural Gas Strategy, wherein CCS will be promoted through the development
of a regulatory framework and amendment of existing legislation, in consultation with its Oil and Gas Commission. The CCS
regulatory framework being developed will be built on existing oil and gas legislation and regulation, the Petroleum and Natural
Gas Act and the 2008 Oil and Gas Activities Act. Under the latter law, exploration and use of storage reservoirs fall under the
defi nition of oil and gas activities, which are regulated by the province’s Oil and Gas Commission.
The CCS Research Consortium of Nova Scotia is in the fi nal year of its research into the technical and economic feasibility
of capturing CO2 from coal-fi red power plants in Nova Scotia and storing it both onshore and offshore. A legal and regulatory
report will be released as part of the resulting products of this research.
In Saskatchewan, its climate change legislation, the Management and Reduction of GHGes Act, which received Royal Assent
in 2010, is expected to be proclaimed by November 2012. This Act establishes emissions reduction targets for the province
with a 2 per cent annual improvement in emissions intensity and payment into a technology fund for failing to meet the target.
TABLE 11 Schedule for PSD and Title V Operating Permit Applications—‘GHG Tailoring Rule’
Source: EPA (2011).
T H E G L O B A L S TAT U S O F C C S : 2 0 1 274
AustraliaA core pillar of the Australian Government’s recent Clean Energy Legislation (CEL) is the establishment of a carbon pricing
mechanism, which commenced on 1 July 2012. The mechanism acts like a tax through imposing an emission liability at a
fi xed carbon price on entities emitting 25,000 tCO2e a year or more. The current price is set at AU$23/tCO
2, with a pathway
rising at 2.5 per cent each year in real terms. After three years, the fi xed price period transitions to a market determined
period, driven by a cap and trade ETS.
On 28 August 2012, Australia and the EC announced their intention to link Australia’s ETS with the EU ETS. Initially, this would
be through a partial link from July 2015, followed by a full two-way link no later than July 2018. Australian businesses will
be able to buy and use EU Emissions Allowances for compliance under the Australian scheme from July 2015. To facilitate
these arrangements, the Australian Government will not proceed with the implementation of its price fl oor and will limit the use
of Kyoto Protocol eligible international units under the Australian scheme. In addition, Australia will set its price ceiling with
reference to the expected 2015–16 price of European allowances.
While carbon pricing is vital for the deployment of clean energy technologies, the prevailing suite of complementary measures
that specifi cally support renewables clearly indicates some recognition by Australian policy makers that the carbon pricing
mechanism is, by itself, not yet at a suffi cient price point to make large-scale clean energy investments commercially attractive.
This clearly applies equally to CCS technologies as it does to renewables.
While the CEL package aims to support Australia’s transition to a clean energy economy, it also led to the Government
announcing in late 2011 that it would not proceed with its original intention to require all new coal-fi red power stations to be
built CCS ready (CCSR). This is due to a policy rationale that the effi ciency of a carbon price can be relied upon to determine
investment decisions for both clean energy and other mitigation options, as well as some stakeholder pushback.
Australia’s Department of Resources, Energy and Tourism hosted a public consultation process in late 2010 inviting views on
a discussion paper it released on CCSR policy, and while some stakeholders expressed a good understanding of and support
for CCSR approaches, concern was also expressed over the practicality of introducing such mandatory standards. This was
especially in regards to the diffi culty of, and risks associated with, defi ning criteria for a CCSR power station when CCS was still
at an early stage of development and demonstration.
Australia’s regulatory framework for offshore and onshore CCS activities remains one of the most developed globally. The
Australian Government, with jurisdiction over Commonwealth waters, already set in place primary and secondary legislation to
govern CCS activities offshore. State governments similarly exercise jurisdiction over offshore areas however, this is limited to
Australia’s coastal waters or seas three nautical miles from the shore baseline. For instance, the offshore CCS regulations of
Victoria – the Offshore Petroleum and GHG Storage Act 2010 and the Offshore Petroleum and GHG Storage Regulations 2011
– entered into force on 1 January 2012.
As state and federal Governments have complementary jurisdiction over offshore CCS activities, a system of joint state/federal
authority has been set in place to manage offshore CCS activities. In the past year, Australia has streamlined the authority
regulating offshore CCS activities by creating a new national body – The National Offshore Petroleum Titles Administrator.
Commencing on 1 January 2012, the National Offshore Petroleum Titles Administrator has jurisdiction over the administration
of offshore GHG injection and storage projects.
For onshore CCS activities in Australia, the state Governments of Victoria, Queensland, and South Australia have established
their respective regulations, while in New South Wales and Western Australia new onshore CCS regulations are under
development.
Legislative consistency has been the goal of Queensland CCS legislators who have begun amending other legislation that
may potentially limit the application of its onshore CCS legislation. For example, an amendment was made in the Geothermal
Energy Act 2010 to change the defi nition of ‘authorised activity’ that is carried out under the GHG Storage Act 2009 (GHG
Act). In consultation with CCS project proponents, links have also been identifi ed between the GHG Act and other state
laws such as the Water Act 2000 and the Petroleum and Gas (Production Safety) Act 2004. Legislative mapping is being
considered to identify further connections to other regulations.
Apart from looking at the impacts of CCS regulations on other laws, Australian regulators, through a cross-jurisdictional body,
the CCS Working Group, have also been investigating ways of harmonising CCS regulations across Australia. The CCS Working
Group, operating under the Council of Australian Governments (COAG) Standing Committee on Energy and Resources, is
currently looking at several issues including:
establishing national consistency on long-term liability;
cross-jurisdictional CO2 storage;
use of abandoned wells and reservoirs for storage; and
identification of potential CO2 pipeline corridors.

75P O L I C Y, L E G A L , A N D R E G U L AT O R Y D E V E L O P M E N T S
AsiaJapan’s 2010 Basic Energy Plan is currently under review. In June 2012, following the agreement between Japan CCS and
the Japanese Ministry of Economy, Trade and Industry to implement the fi rst national integrated CCS demonstration project
in Tomakomai City, Hokkaido, Japan CCS has commenced work on engineering design, procurement, and services for boring
monitoring wells as well as other activities. In late 2011, the Institute published a report by the Chiyoda Corporation (2011),
Preliminary Feasibility Study on CO2 Carrier for Ship-Based CCS, which provides a detailed discussion of the regulatory
ramifi cations of ship-based CCS operations under international marine regulation, as well as domestic Japanese legislation.
Korea has taken great strides in promoting climate change mitigation through market-based instruments and remains
committed to CCS with the announcement of US$150 million funding for CCS for the next decade. During the past 12
months, a review of the domestic regulatory regime for CCS has been completed by the Korean Carbon Capture and Storage
Association and a report on the regulatory review has been fi nalised.
In Asia more broadly, the Asia-Pacifi c Economic Cooperation (APEC) has been carrying out a study on ‘Permitting Issues
Related to Carbon Capture and Storage for Coal-based Power Plant Projects in Developing APEC Economies’. The regulatory
assessment study examines permitting regimes in Malaysia, China, Korea, Chinese Taipei, and Mexico, and was released in
September 2012. Malaysia has developed a CCS strategy that outlines the medium-term establishment of a CCS regulatory
regime and the longer-term broad uptake of the technology. In China, preparatory work on analysing CCS regulations is also
underway to identify gaps in current legislation as well as barriers to CCS operations.
South AfricaProgress has also been made in South Africa and further defi nitive steps have been taken in terms of formulating CCS
regulations. An interdepartmental task team (IDTT) for CCS, including the Departments of Energy, Environmental Affairs,
Mineral Resources, Trade and Industries, Science and Technology, National Treasury, and Transport was formed specifi cally to
develop a regulatory framework for CCS in the pilot and demonstration stages and eventually commercial deployment. Legal
and regulatory studies regarding a planned CO2 test injection and CCS Ready are also being completed by the South African
Centre for CCS (SACCCS) in collaboration with the Department of Energy and the IDTT.

T H E G L O B A L S TAT U S O F C C S : 2 0 1 276
0
2
4
6
8
10
12
AsiaAustralia and
New Zealand Europe North America MENA
Regress Same Progress
8%69%23%
Num
ber
of
resp
onse
s
4.3
PROJECT VIEWSProjects across all locations largely back up the view that only moderate progress has been made in policy settings over
the past year (Figure 38). Recent policy changes are viewed more positively in some locations than in others, especially in
Australia (where carbon pricing commenced on 1 July 2012), United Arab Emirates (UAE) (likely driven by increasing interest
in EOR), Europe (with implementation of the CCS Directive and signifi cant national action in the UK, the Netherlands, and
Romania), and Canada (with draft regulations for an emissions performance standard on all new coal-fi red plant).
FIGURE 38 Project views on whether policy has changed over the past year
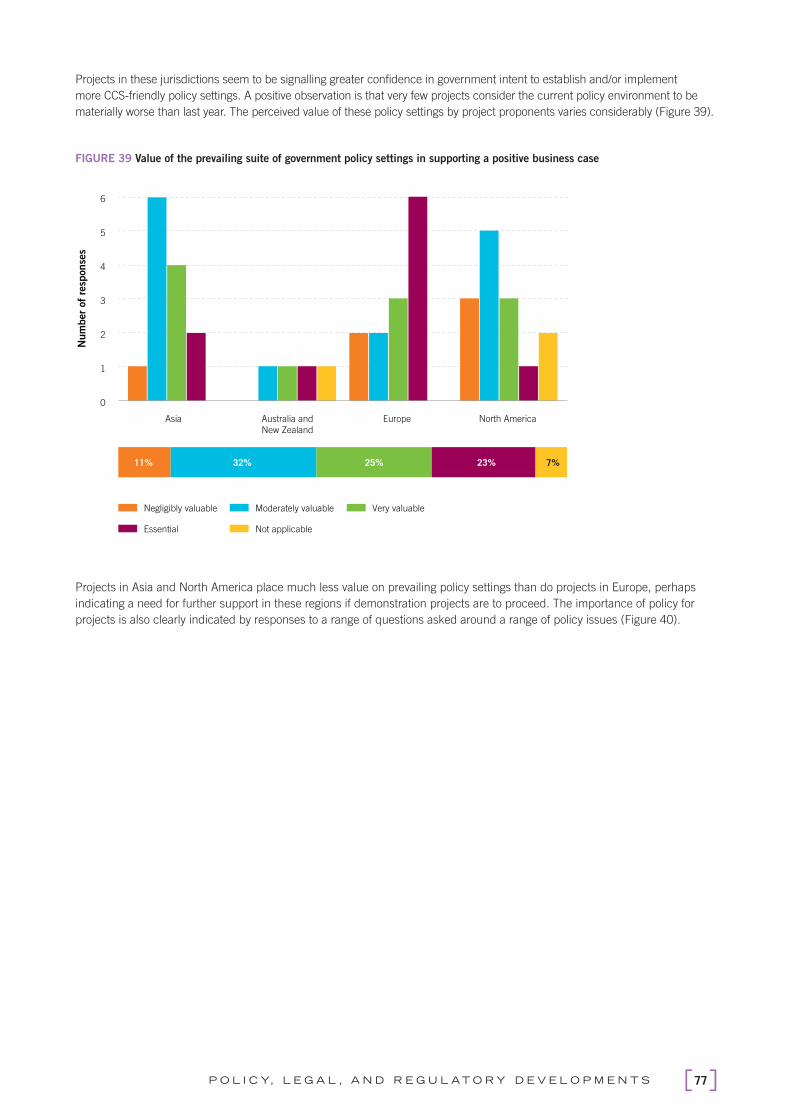
77P O L I C Y, L E G A L , A N D R E G U L AT O R Y D E V E L O P M E N T S
0
1
2
3
4
5
6
Asia Australia and
New Zealand
Europe North America
32% 11% 25% 23% 7%
Very valuable Moderately valuable Negligibly valuable
Essential Not applicable
Num
ber
of
resp
onse
sProjects in these jurisdictions seem to be signalling greater confi dence in government intent to establish and/or implement
more CCS-friendly policy settings. A positive observation is that very few projects consider the current policy environment to be
materially worse than last year. The perceived value of these policy settings by project proponents varies considerably (Figure 39).
FIGURE 39 Value of the prevailing suite of government policy settings in supporting a positive business case
Projects in Asia and North America place much less value on prevailing policy settings than do projects in Europe, perhaps
indicating a need for further support in these regions if demonstration projects are to proceed. The importance of policy for
projects is also clearly indicated by responses to a range of questions asked around a range of policy issues (Figure 40).

T H E G L O B A L S TAT U S O F C C S : 2 0 1 278
FIG
UR
E 4
0 P
roje
ct
att
itudes
to p
olicy
issu
es
5
8
2
7 6 5
11
8
2
9
17
4
9
3
11
1
2
5
11
7
3
2
9
3
6
3
9
6
3
2
11
6
11
5
12
9
14
15
15
18
10
21
25
14
11
12
24
11
5
15
11
1
7
4
12
4
5
1
5
4
7
2 3
1
1
1
1
1 3
2
-30
-20
-10
0
10
2
0
30
4
0
Inte
rnational clim
ate
change c
om
mitm
ents
are
drivi
ng n
ational clim
ate
change p
olic
y se
ttin
gs.
Adequate
incentive
s in
pla
ce to m
inim
ise a
ny
risk
of pro
ject bein
g c
om
merc
ially
str
anded in the futu
re.
CC
S c
an b
e c
om
merc
ially
viable
by
2020 in this
location.
Early
move
rs in C
CS technolo
gy
have
a h
igh p
ropensi
ty to take
on the c
om
merc
ial risk
and p
refe
r m
inim
al gove
rnm
ent in
terv
ention.
The im
port
ance o
f C
CS to m
itig
ate
em
issi
ons
can o
nly
incre
ase
ove
r tim
e.
CC
S c
an o
nly
be c
om
merc
ially
via
ble
in this
location
by
2020 w
ith m
ark
et oriente
d c
arb
on r
egim
es.
Gove
rnm
ent
should
be p
rim
arily
resp
onsi
ble
for
inve
stm
ent
in c
om
mon u
ser
infr
ast
ructu
re, su
ch a
s pip
elin
es.
Curr
ent gove
rnm
ent polic
y si
gnals
are
suffi
cie
nt
for
pro
ject pro
ponents
to s
ecure
com
petitive
pro
ject finan
ce.
Fundin
g c
halle
nge o
f
CA
PEX is
much less
than O
PE
X.
Majo
r and c
urr
ent risk
to the s
uccess
of th
is p
roje
ct is
polic
y uncert
ain
ty.
Gettin
g the s
tora
ge s
ite s
ele
ction r
ight is
far
more
import
ant th
an r
eso
lvin
g long term
lia
bili
ty a
rrangem
en
ts.
Pro
spect of
futu
re c
arb
on c
onst
rain
ts n
egate
s any
thou
ght
of in
vest
ing in c
onve
ntional fo
ssil
fuel te
chnolo
gie
s.
Gove
rnm
ent su
pport
should
be p
rioritise
d
tow
ard
s st
ora
ge s
olu
tions
rath
er
than c
apital cost
s.
Neither
Dis
agre
e
Str
ongly
dis
agre
e
Not ap
plic
ab
le
Str
on
gly
agre
e
Agre
e
Resp
onse
s

79P O L I C Y, L E G A L , A N D R E G U L AT O R Y D E V E L O P M E N T S
Perhaps not surprisingly, project proponents are increasingly optimistic about the role that CCS must play in climate mitigation
over time, and as such consider that fossil fuel technologies can continue to deliver highly competitive, secure, and reliable
energy to support essential economic activity. Mostly they consider that CCS can be commercially viable by 2020, but also view
market-oriented carbon regimes as being important to achieve this outcome.
Many project proponents also draw a link between their national government’s emission reduction commitments or pledges
under the UNFCCC and the nature and adequacy of domestic climate change policy settings as a major driver of investment
in CCS projects. Policy uncertainty remains a major risk, but interestingly proponents are split on the adequacy of existing
policy settings in securing project fi nance, and in minimising the risk of projects being commercially stranded in the future. It
does seem that early mover proponents (i.e. pre-commercial demonstration) are generally not in a position to bear all of the
commercial project risk and prefer instead some form of equitable risk sharing arrangement with governments.
This year’s survey also raised some novel ways for how the CCS community might think about addressing some of the better
known challenges of CCS projects. For example, about two-thirds of those surveyed did not disagree that getting the storage
site selection right can be far more important than resolving upfront long-term liability arrangements (40 per cent agreed and
one-third neither agreed nor disagreed). This is not to say that resolving liability arrangements is not critical, but rather that if
the site is well selected then the associated liability risks may also diminish and/or be more readily acceptable to permitting
authorities. Perhaps related to this matter is a strong preference for government support to be prioritised towards storage
solutions over more upstream CCS components.
Interestingly, respondents rated the implementation of policies to access common user infrastructure (CUI) as being relatively
low among a range of CCS-relevant policy options however, the majority (not all) view such infrastructure to be primarily the
responsibility of governments. While investment in or the construction of pipelines tends not to be the domain of capture plant
and/or storage developers, the effi cient linking of source to sink will be critical to the successful commercial deployment of
CCS more generally. It may also infl uence the location of new additional projects, and given the future volumes of CO2 that
it is envisioned need to be handled, it will certainly be critical for governments to consider upfront what the future capacity
requirements may be and the extent to which public-private partnerships must fi nancially provide for such investments.
Project proponents have a variety of views as to what are the most effective policy instruments that can adequately cater
for the commercial and operational requirements of their projects (Figure 41). Project proponents consider that most of the
heavy lifting for future CCS development and ultimately commercial deployment needs to be given effect through carbon
pricing arrangements (clearly identifi ed as the most important), followed by power purchase agreements, feed-in tariffs,
up-front capital subsidies (such as grants or low-interest loans), access to viable storage solutions, and regulated returns
(especially in the US where some projects will be operating in regulated electricity markets). Streamlined regulatory approvals
were considered an operational priority for projects in the post-FID (execute and operate) stage, as well as the natural
gas processing sector, but less of an imminent consideration for projects in the pre-FID that may still be undertaking pre-
feasibility analysis.
FIGURE 41 Project proponent preferences for enabling policy instruments
MEAN RESPONSES
Highest importance Second most important Third most important
Carbon pricing arrangements
Regulated returns on investment
Offtake arrangements
Feed-in tariffs
Access to direct subsidies
Access to a viable storage solution
Streamlined regulatory approvals
Access to indirect subsidies
Access to common user infrastructure
Emissions performance standards
Clean energy targets
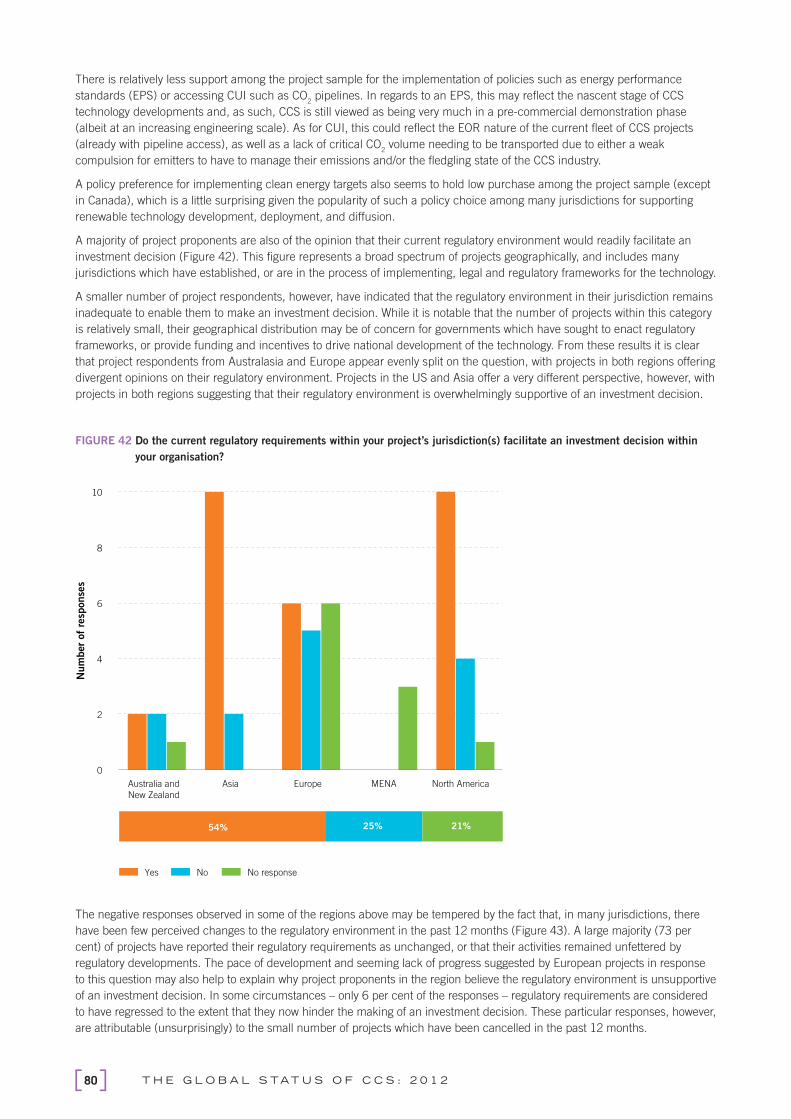
T H E G L O B A L S TAT U S O F C C S : 2 0 1 280
There is relatively less support among the project sample for the implementation of policies such as energy performance
standards (EPS) or accessing CUI such as CO2 pipelines. In regards to an EPS, this may refl ect the nascent stage of CCS
technology developments and, as such, CCS is still viewed as being very much in a pre-commercial demonstration phase
(albeit at an increasing engineering scale). As for CUI, this could refl ect the EOR nature of the current fl eet of CCS projects
(already with pipeline access), as well as a lack of critical CO2 volume needing to be transported due to either a weak
compulsion for emitters to have to manage their emissions and/or the fl edgling state of the CCS industry.
A policy preference for implementing clean energy targets also seems to hold low purchase among the project sample (except
in Canada), which is a little surprising given the popularity of such a policy choice among many jurisdictions for supporting
renewable technology development, deployment, and diffusion.
A majority of project proponents are also of the opinion that their current regulatory environment would readily facilitate an
investment decision (Figure 42). This fi gure represents a broad spectrum of projects geographically, and includes many
jurisdictions which have established, or are in the process of implementing, legal and regulatory frameworks for the technology.
A smaller number of project respondents, however, have indicated that the regulatory environment in their jurisdiction remains
inadequate to enable them to make an investment decision. While it is notable that the number of projects within this category
is relatively small, their geographical distribution may be of concern for governments which have sought to enact regulatory
frameworks, or provide funding and incentives to drive national development of the technology. From these results it is clear
that project respondents from Australasia and Europe appear evenly split on the question, with projects in both regions offering
divergent opinions on their regulatory environment. Projects in the US and Asia offer a very different perspective, however, with
projects in both regions suggesting that their regulatory environment is overwhelmingly supportive of an investment decision.
FIGURE 42 Do the current regulatory requirements within your project’s jurisdiction(s) facilitate an investment decision within
your organisation?
The negative responses observed in some of the regions above may be tempered by the fact that, in many jurisdictions, there
have been few perceived changes to the regulatory environment in the past 12 months (Figure 43). A large majority (73 per
cent) of projects have reported their regulatory requirements as unchanged, or that their activities remained unfettered by
regulatory developments. The pace of development and seeming lack of progress suggested by European projects in response
to this question may also help to explain why project proponents in the region believe the regulatory environment is unsupportive
of an investment decision. In some circumstances – only 6 per cent of the responses – regulatory requirements are considered
to have regressed to the extent that they now hinder the making of an investment decision. These particular responses, however,
are attributable (unsurprisingly) to the small number of projects which have been cancelled in the past 12 months.
0
2
4
6
8
10
Australia and
New Zealand
Asia Europe MENA North America
25% 21% 54%
No responseNoYes
Num
ber
of
resp
onse
s

81P O L I C Y, L E G A L , A N D R E G U L AT O R Y D E V E L O P M E N T S
For the large majority of projects, these results are perhaps symptomatic of a more restrained pace of legal and regulatory
development in many jurisdictions over the past 12 months. The promulgation of fewer new laws, and a focus upon the
implementation of regulations and processing amendments to existing frameworks, has perhaps resulted in some issues,
previously viewed as uncertainties, to be now considered by some project proponents as unresolved. More encouraging are
the occasions where project proponents have highlighted progress and changes to their regulatory environment, which have
assisted in the making of an investment decision.
A number of project proponents in Europe, Australasia, and MENA all highlighted recent changes that demonstrate progress
by governments and which inspire more commercial confi dence. Two of the regions, Europe and Australasia, where project
proponents have suggested their regulatory environment did not support an investment decision at present, have also been
named as jurisdictions where there is progress from regulators.
The results from these particular questions also reveal a clear dichotomy in the responses received from Australasian projects.
Despite proponents in the region indicating that their regulatory environment did not support a fi rm decision about funding, the
responses also suggest that there has been substantial progress by regulators in progressing regulations, which assists in the
making of an investment decision. These responses are perhaps indicative of the success of project-specifi c legislation, which
has enabled the development of individual projects through the crafting of dedicated regulatory models to address the precise
requirements of both the project and regulator.
The 2012 survey also sought a project-level appraisal of a number of legal and regulatory elements that were either
‘addressed’, ‘partly addressed’, or ‘not addressed’ by regulation and guidance in their particular jurisdiction (or ‘not
applicable’).
FIGURE 43 Have there been changes to these regulatory requirements in the past 12 months?
0
2
4
6
8
10
12
Australia and
New Zealand
Asia Europe MENA North America
6% 8% 73% 13%
Regression No ResponseSameProgress
Num
ber
of
resp
onse
s
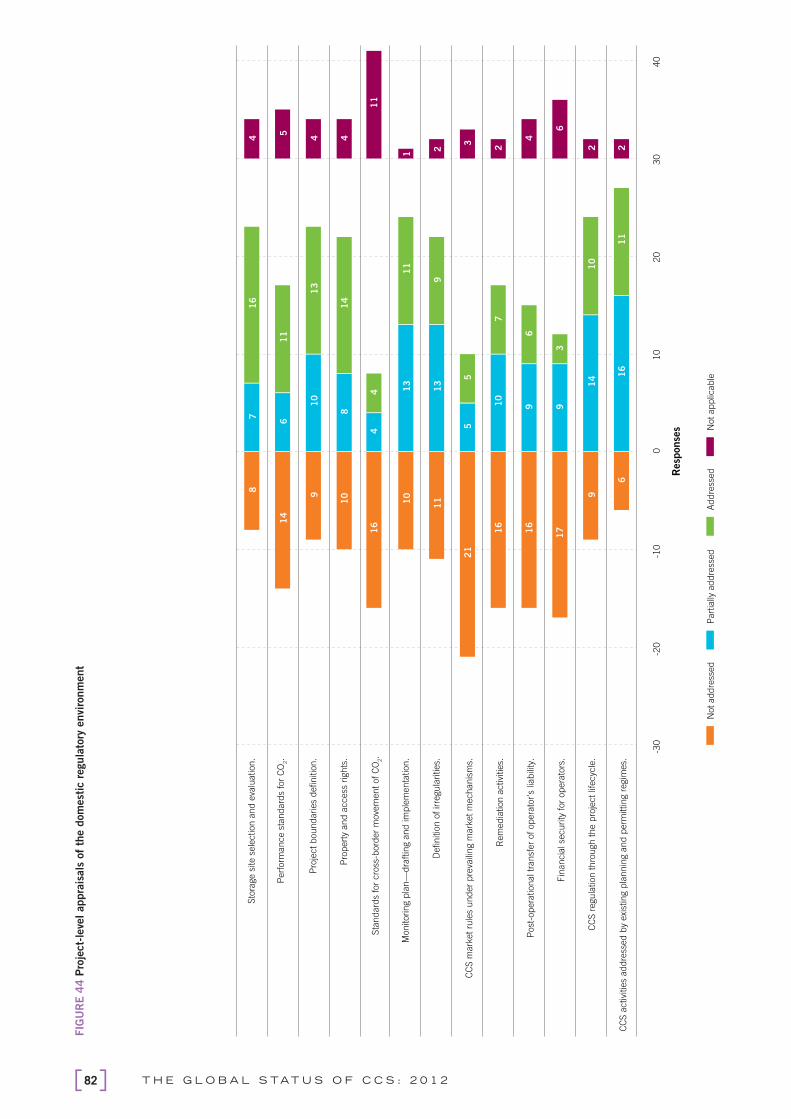
T H E G L O B A L S TAT U S O F C C S : 2 0 1 282
Sto
rage s
ite s
ele
ction a
nd e
valu
ation.
8
7
16
4
Perf
orm
ance s
tandard
s fo
r C
O2.
14
6
1
1
5
Pro
ject boundaries
definitio
n.
9
10
1
3
4
Pro
pert
y and a
ccess
rig
hts
.1
0
8
14
4
Sta
ndard
s fo
r cro
ss-b
ord
er
move
ment of
CO
2.
16
4
4
1
1
Monitoring p
lan—
dra
ftin
g a
nd im
ple
menta
tion.
10
1
3
11
1
Definitio
n o
f irre
gula
rities.
11
1
3
9
2
CC
S m
ark
et ru
les
under
pre
vaili
ng m
ark
et m
echanis
ms.
21
5
5
3
Rem
edia
tion a
ctivi
ties.
16
1
0
7
2
Post
-opera
tional tr
ansf
er
of opera
tor's
liabili
ty.
16
9
6
4
Fin
ancia
l se
curity
for
opera
tors
.1
7
9
3
6
CC
S r
egula
tion thro
ugh the p
roje
ct lif
ecyc
le.
9
14
1
0
2
CC
S a
ctivi
ties
addre
ssed b
y exi
stin
g p
lannin
g a
nd p
erm
itting r
egim
es.
6
16
1
1
2
-30
-20
-10
0
10
2
0
30
4
0
Addre
ssed
Part
ially
addre
ssed
Not
addre
ssed
Not ap
plic
ab
le
Resp
onse
s
FIG
UR
E 4
4 P
roje
ct-
leve
l appra
isals
of
the d
om
est
ic r
egula
tory
envi
ronm
ent

83P O L I C Y, L E G A L , A N D R E G U L AT O R Y D E V E L O P M E N T S
Figure 44 details the number of project-level responses by individual issue. It would appear that several of the legal and
regulatory elements, highlighted for consideration in the survey, have been addressed to a signifi cant extent by laws and
regulations enacted in some jurisdictions. The view of a number of project proponents is that the selection and evaluation
of storage sites, the defi nition of project boundaries, and issues regarding property and access rights appear to have been
addressed to an extent in many countries worldwide. These responses also suggest, conversely, that the current legal
and regulatory regimes are incomplete in various jurisdictions and that there are issues requiring further clarifi cation from
regulators. The adoption of rules to accommodate CCS under market-based mechanisms, an operator’s duties with regard
to remediation and fi nancial security, the post-operational transfer of long-term liability, and standards for the cross-border
movement of CO2 have all been indicated as ‘unaddressed’ by project proponents in some jurisdictions.
The survey responses also indicate that a number of these issues have only been ‘partly addressed’ by the legal and regulatory
regimes in some jurisdictions. A constructive interpretation would therefore suggest that many regulators have already begun
the process of regulatory development, or that these jurisdictions already provide, to some extent, a supportive environment for
CCS activities. Such a positive outlook, however, does not take account of the details omitted from the regulations, particularly
the effect of partial regulation upon projects at different stages of the project lifecycle.
A different perspective, perhaps one borne out by many project proponents’ portrayal of the regulatory environment, is that
the regulatory process in several jurisdictions has progressed but at a slower rate (as regulators take steps to implement
overarching regulatory requirements or make broader policy considerations around the technology).
Appendix F provides a detailed breakdown, by region, of the legal and regulatory issues which several LSIPs have identifi ed as
insuffi ciently addressed by regulators in their respective jurisdictions.
In the survey responses the partial development, or failure to address, market rules to accommodate CCS within prevailing
market mechanisms was highlighted as particularly signifi cant by LSIPs.
Notable from the responses is that for projects across Europe, Asia, Australasia, and North America the number of negative
responses far outweighs the examples of successful or complete development of legislation to address this issue. For LSIPs
in Asia, this disparity is possibly symptomatic of the immaturity of CCS legal, regulatory, and policy frameworks within the
region. In North America however, the negative results perhaps indicate the uncertainty many LSIPs continue to face with
regard to policies around carbon pricing. North American proponents have also classifi ed the issue as ‘not applicable’ in some
instances, indicative perhaps of the role EOR plays in supporting project development in Canada and the US. These particular
results may be of concern to regulators and policymakers in Europe, who have sought to clarify the role CCS will play under the
EU Emissions Trading Scheme and climate change policy architecture.
Similar assumptions may also be behind proponent responses to issues of standards for the cross-border movement of CO2,
operator’s remediation and fi nancial security requirements, and the post-operational transfer of liability. Respondents in Asia
highlighted these issues as insuffi ciently addressed in their domestic systems, perhaps underlining once more the nascent
stage of development of the legal and regulatory frameworks in these jurisdictions. However the responses to these issues from
proponents in the US and Canada suggest a different situation, with far fewer proponents viewing the legislation as entirely
incomplete or indeed applicable. These results are perhaps again symptomatic of the nature of operations undertaken by
LSIPs in North America where there is a prevalence of EOR activities regulated under well-characterised legal and regulatory
regimes. A more detailed exploration of the legal and regulatory regimes governing EOR is provided in Chapter 9.
Most notable within these responses are those from European and Australasian project proponents, which highlight
defi ciencies in some aspects of their domestic frameworks. Despite considerable legislative activity at the national and supra-
national levels in these regions, it would appear that several specifi c issues remain. In the EU, these responses are perhaps
symptomatic of the pace of the transposition process within several Member States, with a number of delays observed in the
past 12 months. The issues of remediation and liability have also proven to be of particular concern for potential operators
in Europe and Australia, with some concerned that framework legislation and secondary guidance does not go far enough in
determining the extent of their operational and long-term responsibilities.
The responses received to these questions from projects in Asia and North America are particularly striking when contrasted
with their earlier responses to the questions addressing the ability to make a FID. Despite the majority of projects in these
regions suggesting that their legal and regulatory environment supports a fi nal investment decision, it would appear that this
view is not substantiated when considering many of the elements which conventionally make up a regulatory regime for CCS.
One explanation is that some of these projects, particularly in North America, have already passed this point in the project
lifecycle, or are to be regulated under pre-existing regulatory regimes for EOR operations. The reasons behind these results are
less clear in Asia, where many of the projects surveyed remain in the early phases of the project lifecycle.
Project respondents have also highlighted several areas of successful regulation. The law and regulations governing the
defi nition of project boundaries, the drafting and implementation of a monitoring plan, and the selection and evaluation
of a storage site have all been identifi ed as suffi ciently addressed (to an extent) by projects in Australasia, Europe, and
North America.
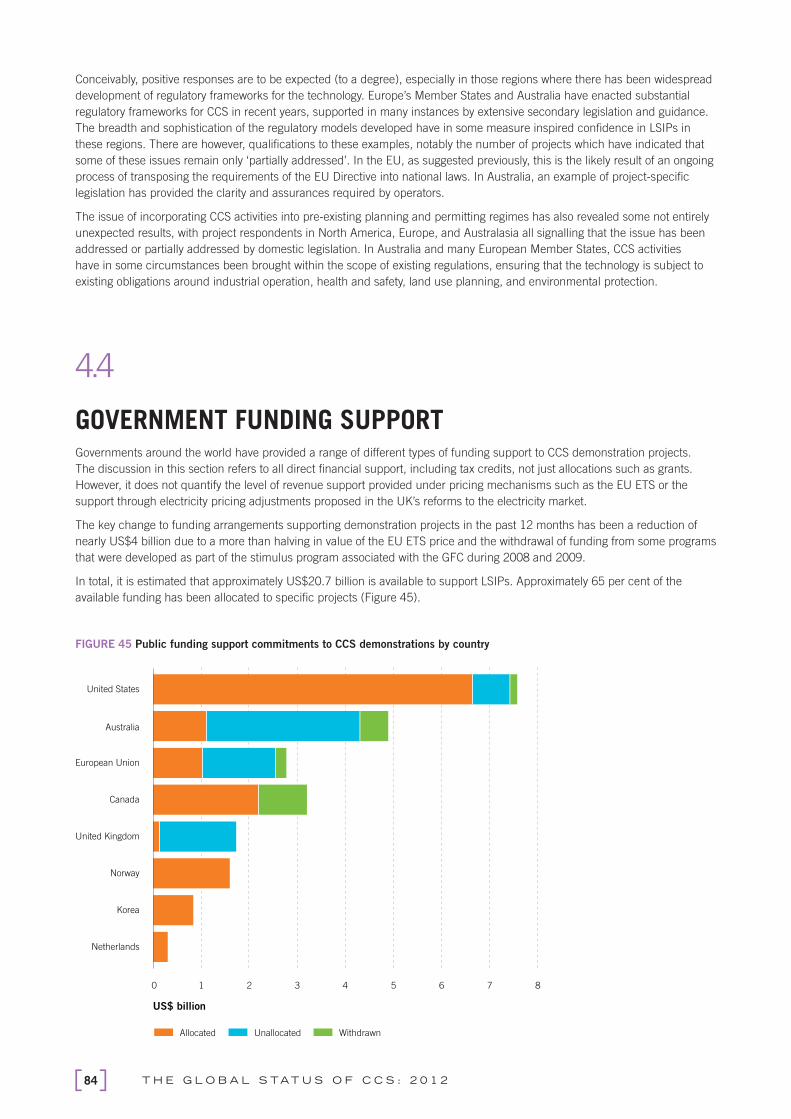
T H E G L O B A L S TAT U S O F C C S : 2 0 1 284
Conceivably, positive responses are to be expected (to a degree), especially in those regions where there has been widespread
development of regulatory frameworks for the technology. Europe’s Member States and Australia have enacted substantial
regulatory frameworks for CCS in recent years, supported in many instances by extensive secondary legislation and guidance.
The breadth and sophistication of the regulatory models developed have in some measure inspired confi dence in LSIPs in
these regions. There are however, qualifi cations to these examples, notably the number of projects which have indicated that
some of these issues remain only ‘partially addressed’. In the EU, as suggested previously, this is the likely result of an ongoing
process of transposing the requirements of the EU Directive into national laws. In Australia, an example of project-specifi c
legislation has provided the clarity and assurances required by operators.
The issue of incorporating CCS activities into pre-existing planning and permitting regimes has also revealed some not entirely
unexpected results, with project respondents in North America, Europe, and Australasia all signalling that the issue has been
addressed or partially addressed by domestic legislation. In Australia and many European Member States, CCS activities
have in some circumstances been brought within the scope of existing regulations, ensuring that the technology is subject to
existing obligations around industrial operation, health and safety, land use planning, and environmental protection.
4.4
GOVERNMENT FUNDING SUPPORTGovernments around the world have provided a range of different types of funding support to CCS demonstration projects.
The discussion in this section refers to all direct fi nancial support, including tax credits, not just allocations such as grants.
However, it does not quantify the level of revenue support provided under pricing mechanisms such as the EU ETS or the
support through electricity pricing adjustments proposed in the UK’s reforms to the electricity market.
The key change to funding arrangements supporting demonstration projects in the past 12 months has been a reduction of
nearly US$4 billion due to a more than halving in value of the EU ETS price and the withdrawal of funding from some programs
that were developed as part of the stimulus program associated with the GFC during 2008 and 2009.
In total, it is estimated that approximately US$20.7 billion is available to support LSIPs. Approximately 65 per cent of the
available funding has been allocated to specifi c projects (Figure 45).
FIGURE 45 Public funding support commitments to CCS demonstrations by country
Netherlands
Korea
Norway
United Kingdom
Canada
European Union
Australia
United States
1 0 2 3 4 5 6 7 8
US$ billion
Withdrawn Unallocated Allocated

85P O L I C Y, L E G A L , A N D R E G U L AT O R Y D E V E L O P M E N T S
CCS funding programs and GFC stimulusIn 2008 and 2009, many governments announced major public spending programs that focused on stimulating the economy
in response to the GFC. During this time, there was signifi cant support for increasing government spending to offset declines in
private spending. Included in these large stimulus programs was government spending for clean energy, partly in anticipation
of coordinated global policy action to reduce GHGs at COP 15 in 2009. The total funding for clean energy programs amounted
to US$195 billion (Czajkowska and Munro 2012). Of this, US$9.3 billion was provided to CCS, approximately 5 per cent of the
total global green stimulus package (Table 12).
TABLE 12 Stimulus funding for CCS
1. Based on July 2012 exchange rates. As the US dollar has appreciated relative to most currencies since the GFC, the US dollar values reported here are lower than would
have been the case at the time the programs were announced.
Funds from stimulus programs form a major part of the total funding for CCS developments, representing 40 per cent of the
total global funding (Figure 46).
FIGURE 46 CCS funding programs by stimulus funding
COUNTRY PROGRAM TITLE FUNDING FUNDING (IN US$)1
Australia CCS Flagships Program AU$4.0 bn US$4.1 bn
Canada Clean Energy Fund CA$0.6 bn US$ 0.6 bn
EU European Energy Programme for Recovery (EEPR) €1 bn US$1.2 bn
US
ARRA – Clean Coal Power Initiative
US$3.4 bn US$3.4 bnARRA – FutureGen
ARRA – Industrial Carbon Capture and Storage
Total US$9.3 billion
Netherlands
Korea
Norway
United Kingdom
Canada
European Union
Australia
United States
1 0 2 3 4 5 6 7 8
US$ billion
Non-stimulus Stimulus
T H E G L O B A L S TAT U S O F C C S : 2 0 1 286
Stimulus spending programs were designed to be ‘timely, targeted, and temporary’ and most had legislated deadlines for
commitment of the funds to specifi c projects. For example, funds in the American Recovery and Reinvestment Act (ARRA)
were required to be allocated to projects by 30 September 2010, while EEPR funds were required to be committed by 31
December 2010.
Where funds in these programs formerly committed to projects were subsequently returned to governments due to project
cancellations or suspensions, that money is not currently available to other CCS projects. Over the past 15 months, US$1.4
billion has been returned associated with project suspensions in the US (AEP Mountaineer), Canada (Project Pioneer), and
Europe (Vattenfall Jänschwalde).
Australia’s CCS Flagships program has been repurposed away from stimulus funding and is now considered an integral part
of Australia’s clean energy initiative in response to climate change risks. Nonetheless, since the program was announced
in 2009, funding has been reduced by more than US$600 million in response to other budget priorities of the Australian
Government.
The bulk of the project-level funding allocated to date has been awarded to 19 projects receiving US$200 million or more
each. In total, these LSIPs have been allocated US$8.6 billion, accounting for 64 per cent of total CCS project funding
awarded. FutureGen 2.0 is the largest single project recipient receiving US$1.048 billion. See Section 3.3 for the full breakdown.
NER300 funding program declinesThe NER300 program in Europe was designed to support CCS and innovative renewable energy projects through the sale of
300 million allowances in the EU ETS. At the time of the program’s design, the market price in the EU ETS was in the range
of €16–20/tonne and projected to rise to €25/tonne by December 2013. However, with the recession in Europe depressing
energy demand, and the use of renewable energy targets and energy effi ciency policies resulting in the ETS acting as a
residual carbon market, prices began to decline during 2011.
When sales of the NER300 EUAs commenced in December 2011, prices had fallen to around €9/tonne. By August 2012,
around 180 million allowances sold at an average price of a little over €8/tonne.
In July 2012, the European Commission announced that around 60 per cent of the funds raised from the NER300 program
would be provided to CCS projects. It is estimated that total funding from the program for CCS projects will be approximately
€1.2 billion (US$1.5 billion), after accounting for the costs incurred by the European Investment Bank in selling the NER300
allowances through a range of fi nancial channels. This contrasts with the €4.5–6 billion initially thought to be available for CCS
projects when the funding arrangements were announced in 2008. The change is due to both a substantial fall in ETS prices
as well as reduced overall level of funding due to the subsequent decision to include innovative renewable energy projects.

87P O L I C Y, L E G A L , A N D R E G U L AT O R Y D E V E L O P M E N T S
4.5
CHALLENGES AND OUTLOOKCarbon prices are currently recognised as essential but not suffi cient drivers of CCS projects. The importance placed by project
proponents on carbon prices emphasises the need for governments to continue both national and international actions to put a
price on carbon emissions. To this end, there have been some positive developments in the past year, such as the introduction
of a carbon price in Australia. However, much more needs to be done.
The challenges of addressing climate change are often presented in the public domain as being insurmountable and politically
fraught. While the challenges remain great, there is clearly a substantial level of international collaboration, goodwill, and
legal basis to form a legitimate expectation that sustained mitigation action will not only form tomorrow’s business-as-usual
expectations, but will increasingly be deliverable and affordable. Nevertheless, it is clear from the negotiations throughout 2012
that reaching agreement on the post-Kyoto framework will experience substantial challenges.
At the level of international negotiations, key issues include the length of the second Kyoto commitment period and the extent
to which surplus ‘rights to pollute’ (allowances) from the fi rst commitment period can be carried over to the second. This latter
point is very important, as it will infl uence the supply of allowances and hence the global price of carbon. While the second
Kyoto commitment period starts on 1 January 2013, there is still debate whether it ends in 2017 or 2020.
Within the UNFCCC framework, the AWG-LCA and AWG-KP are destined to end their work plans in 2012. Any outstanding
issues will thus need to be tasked to the remaining bodies – the ADP, SBI, and/or SBSTA. The SBI is already managing the
implementation of the institutional arrangements supporting NAMAs, for which the issues of technology transfer and climate
fi nancing remain critically important.
The post-2020 action (mitigation and adaptation) to combat climate change is being negotiated in the ADP. The fi rst meeting
of the ADP was held in May 2012, and it is clear that the lack of distinction between developed and developing nations in
the need for action will create some tension for some time. This makes the concept of ‘equity’, in conjunction with the NAMA
process, fundamental to the success of any new climate change regime.
International action is also commencing to develop standards for CCS. As noted above, the setting of standards on the basis of
incomplete information could potentially lead to overly conservative permitting requirements being imposed on demonstration
and pre-commercial CCS projects, which could undermine the ability of proponents to proceed with innovative and often fi rst
of-a-kind demonstration projects.
To overcome these problems, it is suggested that a ‘one size fi ts all’ approach should be avoided where possible. When
appropriate, a fi t-for-purpose approach is suffi cient to provide for accurate, conservative, relevant, credible, reliable, complete,
and verifi able data monitoring plans and measurement methodologies. A large number of published peer-reviewed expert
reports exist that provide for approaches and/or recommendations to address and/or redress CCS-related issues. The
adequacy of applying these existing and extensive suites of best practice guidelines and protocols should be tested fi rst before
imposing additional sets of rules on CCS projects. It would seem that suffi cient technical and scientifi cally valid analysis,
methodology, and procedures currently exist to appropriately address CCS demonstration-related issues.
There has been good progress over the past year in relation to one international marine agreement affecting CCS (the OSPAR
Convention) but not the other (the London Protocol). While many LSIPs may undertake offshore CCS transport and storage,
at this stage their planned CCS activities require CO2 to cross international boundaries only from domestic to international
waters, and not into another contracting party’s jurisdiction. Considering that this does not amount to ‘cross-border’ movement
of CO2 from one jurisdiction to another, the IEA (2011c) argues that it is unlikely that the situation would be covered by the
London Protocol prohibition. While there is little information to suggest that these projects are planning to send captured CO2
to another jurisdiction for storage, any cross-border plans may be precluded by the current prohibition under the London
Protocol. Eliminating the prohibition against cross-border transport and storage of CO2 will be especially important for
jurisdictions that fi nd that CCS is a viable GHG mitigation option but which do not have the suitable geology for storage or have
limited storage capacity.
Delays posed by slow progress internationally will inevitably require national and sub-national policies to address any associated
uncertainty around investing in low-carbon technologies such as CCS, and to address more general carbon-related obligations.
Modest policy developments have been reported over the past year, with the most notable perhaps being the ongoing
implementation of the UK’s climate change policies, Australia’s establishment of a carbon price, Korea’s adoption of
an emission trading scheme in 2015, and South Africa’s budgeting for a phased introduction of a carbon tax in 2013.
Increasingly, carbon pricing arrangements (carbon tax and emissions trading schemes with international linkages between
national schemes) are emerging, as are performance standards and innovative fi nancing and funding measures.

T H E G L O B A L S TAT U S O F C C S : 2 0 1 288
Governments have a wide array of policy and regulatory instruments available to use to address the level of emissions and
facilitate climate mitigation action. These include:
a range of policy levers that in effect establish a price on carbon emissions, such as establishing a tradable market in
emissions (the EC’s ETS), imposing a direct tax on emissions (Norway), setting a minimum ‘floor’ price to drive technology
deployment (the UK’s carbon floor price scheme), or a combination of these approaches (such as Australia’s initial carbon
tax moving to a trading scheme);
market-based and/or technology-specific drivers to favour deployment of low-carbon or ‘clean’ technologies, such as feed-in
tariffs, portfolio quotas for electricity supply companies, and a range of other market mechanisms aimed at harnessing the
power of the market to support the development and ultimate deployment of low-carbon technologies;
direct policy and/or regulatory action to prevent or limit emissions, such as emissions performance standards (Canada
and UK), direct bans on certain technologies such as no new coal-fired power stations (Denmark, New Zealand), specific
requirements on deployment of some technologies such as new fossil fuel generation (above a certain capacity) to
integrate CCS (Scotland) or to undertake a CCS Ready assessment (EU CCS Directive), and requirements that new plants
be CCS Ready (France, UK); and
both direct and indirect support for the development and deployment of emerging technologies, such as direct capital
assistance (Australia’s CCS Flagships program, EC NER300 grants), and aid for focused
research and development.
Within this context, the perception of CCS project participants is that only modest policy change has taken place recently, and
that while the current mix of policy settings are viewed as being supportive of positive investment decisions in CCS projects,
they are seen as inadequate. Investors in CCS projects (including fi nancial institutions, emitters, manufacturers, and service
providers) are clearly focusing on the opportunities and risks presented by an evolving balance of policy settings aimed at
supporting CCS projects while also intended to drive commercially attractive mitigation outcomes.
The IEA (2012c) observes that the technologies with the greatest potential for saving energy and reducing CO2 emissions are
making the slowest progress. In particular, they state specifi cally that CCS is not receiving the necessary rates of investment
into full-scale demonstration projects and that nearly half of new coal-fi red power plants are still being built with ineffi cient
technology. In addition to broad climate policy, adequate government funding of demonstration projects is also required to spur
investment. In this regard, available funding, while considerable, is shrinking and is increasingly vulnerable. A major challenge
for government is to ensure that CCS is treated equitably with other emerging clean-energy technologies.
Opposite: Photo of seismic testing activity on the Gorgon Project, courtesy of Chevron Australia.


CCS IN DEVELOPING COUNTRIES
5
5.1Importance of CCS in developing countries 91
5.2Status of CCS in developing countries 93
5.3Demonstration projects provide drivers for CCS in developing countries 96

91C C S I N D E V E L O P I N G C O U N T R I E S
KEY MESSAGES › 70 per cent of CCS deployment will need to occur in non-OECD countries to
achieve global emission reduction targets by 2050.
› Undertaking enabling, pre-investment, and demonstration activities today
puts developing countries in a position to benefi t tomorrow from CCS
emission reductions.
› At least 19 developing countries are currently engaged in CCS-related
activities, mostly at the early stage of scoping out the opportunities and
potential for CCS.
› Implementing CCS pilot or demonstration projects acts as a catalyst for
CCS development around all aspects of the technology, both technical
and non-technical.
5.1
IMPORTANCE OF CCS IN DEVELOPING COUNTRIESIn order for CCS to play a role in reducing global CO
2 emissions on a signifi cant scale, it will need to be deployed in both
developed and developing countries (‘Annex 1’ and ‘Non-Annex 1’ countries respectively, under the UNFCCC), particularly
since it is expected that in the coming decades all the net fossil fuel growth (and associated CO2 emissions) will come from
developing countries. The IEA estimates that 70 per cent of CCS deployment will need to happen in non-OECD countries to
achieve global emission reduction targets by 2050 (IEA 2012b).
A substantial challenge for many developing countries is to increase access to energy in a sustainable, climate-friendly way.
Many developing countries are also interested in continuing to utilise their indigenous fossil fuel resources to ensure energy
security and to continue to benefi t from them economically.
While developing countries may face many obstacles to CCS deployment, under the UNFCCC Annex 1 parties have agreed
to assist developing countries to undertake mitigation action. As previously reported in the Global Status of CCS: 2011, since
2009 a number of governments and organisations have collectively contributed or allocated hundreds of millions of dollars
to current and future activities to support CCS capacity and project development in developing countries. Organisations
and countries that have contributed signifi cant funds in this space include the EU, the Global CCS Institute, the Norwegian
Government, the UK Government and the US Government. These contributors have provided direct support by fi nancing
specifi c activities, as well as contributing to CCS capacity development funding mechanisms managed by organisations such
as the ADB, APEC, the CSLF, the World Bank, and the Institute itself.
The most signifi cant funding contribution in 2012 has come from the UK Government. At the CEM held in London on 25–26
April 2012, the UK Government announced £60 million to support CCS in developing countries, in response to a call for
funding from the Working Group on CCS Funding Mechanisms for Developing Countries, a subgroup of the CEM Carbon
Capture Utilisation and Storage (CCUS) Action Group.
The signifi cant emission reductions that can be obtained by CCS underpin the international funding support outlined above,
but emission reductions need to be realised at the project level within individual countries. However, a number of recurrent

T H E G L O B A L S TAT U S O F C C S : 2 0 1 292
concerns are shared by a number of developing countries. Key concerns tend to include the high cost of CCS, access to
energy, and permanence of storage. This underlies the importance of capacity development and knowledge sharing, even at
the early stages, to help countries:
Analyse the costs of CO2 mitigation efforts compared to the cost of climate change impacts on health, population
migration, catastrophic events, etc. The IEA estimates that abandoning CCS as a mitigation option in electricity generation
increases investment cost in other low-carbon technologies by 40–57 per cent in order to meet emissions reduction targets
(IEA 2012b).
Keep abreast of developments in capture and compression technology. Reducing the energy penalty will be vital for large-
scale deployment of CCS, addressing not only a significant cost component but also the ‘energy access’ issue. However, it
is only through ongoing research and development and ‘testing’ CCS at large-scale demonstration projects that the energy
penalty issue can be addressed.
Learn from the experience of existing pilot and large-scale demonstration projects, in particular about the monitoring,
measurement, and verification techniques that can be utilised to track the permanence of CO2 storage.
Why should developing countries prepare for CCS now?These aforementioned concerns and the challenges posed by CCS are prompting a ‘wait and see’ approach in some
developing countries. Such an approach was a key issue identifi ed by the CEM Working Group on CCS Funding Mechanisms
for Developing Countries. The Working Group identifi ed the importance of acting now. If countries identify that CCS is a
relevant technology for their low-emission strategies, then it is important for countries to start undertaking the enabling, pre-
investment, and demonstration activities now in order to be in a position to benefi t from emission reductions from CCS in the
coming decades. Many of these enabling and pre-investment activities will need to address country-specifi c requirements.
Enabling and pre-investment activities that need to be undertaken before implementing a CCS project include, but are
not limited to:
developing geologic storage assessment;
developing legal and regulatory frameworks;
understanding the technology and project development framework through pre-feasibility and feasibility studies;
understanding funding and commercial issues; and
good practices for public engagement.
Some of these activities can take a number of years to develop. For instance, storage characterisation from the basin level
down to the site-specifi c level can take 3–6 years or longer, depending on how much information is already available.
Developing appropriate legislative and regulatory frameworks for implementing CCS can also take considerable time,
depending on the individual circumstances of each country or region.
The storage and regulatory aspects not only take time to develop, but are not transferable from country to country. The
fact that these aspects are not transferable is an arguement against taking a ‘wait and see’ approach. Taking a more active
approach is particularly relevant for developing countries which have an ongoing interest or reliance on fossil fuel from the
perspective of: “securing revenues from fossil fuel production; consuming fossil fuels to promote economic growth; promoting
energy security; promoting regional cohesion; and facilitating foreign-policy objectives, such as earnings from CCS technology
exports” (Meadowcroft and Langhelle 2009).
Some countries have undertaken dedicated CCS scoping studies to investigate their CCS potential. These studies generally
consider key aspects such as the country’s emissions profi le (whether there is a high degree of emissions from fossil fuel
based power generation and/or industrial processes which is suited to CCS), its storage potential, and the feasibility of
transporting CO2 to likely storage sites.

93C C S I N D E V E L O P I N G C O U N T R I E S
5.2
STATUS OF CCS IN DEVELOPING COUNTRIESOf the 75 LSIPs identifi ed around the world in this report, 17 are in developing countries. This is an increase of fi ve since 2011.
There are at least 19 developing countries engaged in CCS activities. Activities in these countries range from capacity
development, pre-investment, and planning activities, and in two cases it involves operation of a CCS project. Most of these
19 countries are at an early stage of scoping out the opportunities and potential for CCS. There is a growing awareness of
CCS as a potential mitigation technology within developing countries, especially by those which have a heavy reliance of fossil
fuel based energy and industries. This growing awareness and importance has been facilitated by the inclusion of CCS in the
UNFCCC’s CDM.
The CCS development lifecycle represented in Figure 47 is a tool developed by the Global CCS Institute to help conceptualise
different stages of CCS development. This tool helps identify what sort of capacity development and pre-investment activities
are relevant for a country based on where they are in the lifecycle. The lifecycle is split into fi ve major stages, and the rotating
circles imply that moving through the different stages is an iterative process and not necessarily linear. In fact, it can be
seen that some countries are operating in different stages, sometimes concurrently, driven by their own needs, interests,
approaches, and projects.
Figure 47 identifi es what sort of activities a country has undertaken or is undertaking. The purpose of the fi gure is to provide
an overview of the key types of activities being undertaken at a country level. It should be noted that different sectors within
individual countries will be at varying stages of the lifecycle.
While most developing countries are still at the early ‘scoping’ stage, there are some developing countries which are further
along the development lifecycle, notably Algeria, Brazil, Mexico, South Africa, the UAE, and China.
The In Salah project in Algeria, which is a gas processing project, started injecting CO2 in 2004. More than 3 million tonnes of CO
2
have been stored in a deep saline aquifer (more than 2 km underground) so far. The natural gas extracted at the site contains a
small percentage of CO2; this CO
2 needed to be separated out of the gas stream to ensure purity standards for sale. The two original
partners in the project, BP and Sonatrach, decided to invest US$100 million to store the CO2 geologically, rather than just vent
it, thereby making a valuable contribution to the demonstration of CCS and its monitoring, measurement, and verifi cation (MMV).
In Brazil, Petrobras has reported that the Miranga CO2 Experimental Site sequesters close to 200,000 t of CO
2 per annum,
work which is being undertaken on a commercial scale. Petrobras plans to sequester CO2 at the Lula oil fi eld as part of an
EOR project. This project is part of a plan by Petrobras to invest in 2–4 large-scale CCS demonstration projects as part of its
sustainability and climate change plan.
Mexico has made signifi cant progress in 2011–12 in putting CCS on its policy agenda. The development of a National
CCUS Strategy and Regulatory Framework was identifi ed as a goal in Mexico’s National Energy Strategy 2012–26 which was
presented to the Mexican Congress in March 2012. Mexico also released a country-level storage atlas in May 2012 and is
now focusing on developing a regional atlas. In addition, the country is undertaking scoping studies for a CCS demonstration
project. Mexico has a high potential for EOR, and there is recognition of a synergy between achieving low-emission goals
(especially from the power generation sector) and increasing yields from aging oil and gas fi elds.
South Africa is committed to addressing climate change while continuing to improve access to household electricity, address
energy security, and alleviate poverty. They recognise that the negative impacts of climate change will ultimately cost more
and have a bigger negative impact, especially on the poor, than the cost of addressing climate change. With the majority of
South Africa’s GHG emissions coming from the energy industry, CCS has been identifi ed as a key technology that can help
achieve CO2 emission reduction goals. As such, South Africa’s National Climate Change Response Policy, which was endorsed
by its Cabinet on 12 October 2011, identifi es CCS as one of South Africa’s eight Near-term Priority Flagship Programmes.
South Africa is currently focusing on a number of planning and enabling activities to facilitate the implementation of a CO2
test injection project. These activities include evaluating its regulatory framework, creating a public engagement strategy, and
undertaking a technical feasibility study.
As discussed in more detail in Chapter 2, the UAE has three LSIPs in the planning and development stage. The plan is to use
the CO2 captured from a network of projects for EOR.
There is a growing recognition in China of the importance of CCS as part of a portfolio of solutions for reducing the country’s
GHG emissions from its large and rapidly expanding power generation and other coal-based industries. The past 18 months
have seen a number of important developments regarding CCUS in China, particularly on policy and projects, and active
involvement and support from the Central Government.

T H E G L O B A L S TAT U S O F C C S : 2 0 1 294
Identify
basi
c C
CS technic
al pote
ntial
Recognis
e C
CS v
alu
e p
roposi
tion
Identify
key
stakehold
ers
Rais
e g
ovt
and in
dust
ry a
ware
ness
of C
CS
Stim
ula
te d
ebate
Inve
stig
ate
CC
S a
s a p
olic
y option
Build
CC
S e
xpert
ise
Est
ablis
h fundin
g a
nd fi n
ancia
l in
centive
s
Deve
lop p
olic
y and r
egula
tory
envi
ronm
ent
Build
public
engagem
ent exp
ert
ise
Idenitfy
Engage p
ublic
Eva
luate
Defi ne
Exe
cute
Opera
te
Com
munic
ate
fi r
st p
roje
ct su
ccess
Sust
ain
inte
rest
gro
ups
Cre
ate
envi
ronm
ent fo
r fu
rther
pro
jects
Algeria
Botswana
Brazil
China
Egypt
India
Indonesia
Jordan
Kenya
Kosovo
Mexico
Maghreb
Malaysia
Philippines
South Africa
Trinidad and Tobago
Thailand
UAE
Vietnam
Scope opportunity
Create enablingenvironment
for CCS
Projectdelivery
Multiple large-scale
CCS projects
1 2 3 4 5
KEY: Activity in this place
Put CCSon policy agenda
FIGURE 47 CCS development lifecycle
95C C S I N D E V E L O P I N G C O U N T R I E S
China is now clearly transitioning from purely focusing on CCS R&D to taking steps towards creating an enabling environment
for the demonstration and deployment of CCS.
In March 2011, the National Development and Reform Commission (NDRC) issued China’s Notifi cation on Orderly
Development of Coal-Chemistry, which requires all new coal-chemical demonstration projects to be capable of substantially
reducing CO2 emissions. This means that newly-built coal-chemical demonstration projects will need to consider installing
technologies such as large-scale CCUS facilities in order to control their CO2 emissions.
In March 2011 the Chinese Government issued its much-anticipated 12th Five-Year Plan (2011–15) (FYP), a blueprint
outlining the key economic and development targets for the country. Unlike previous plans, there is considerable focus on
energy and climate change and plans for a slower and more sustainable growth trajectory. The key targets to reduce China’s
GHG emissions under this plan include:
reducing carbon intensity (CO2 emissions per unit of GDP) by 17 per cent;
reducing energy intensity (energy consumption per unit of GDP) by 16 per cent; and
increasing the share of non-fossil energy to 11.4 per cent.
Following the release of the national 12th FYP, in November 2011 the NDRC issued the 12th Five-Year Work Plan on
Controlling GHG Emissions. This work plan outlines China’s goal of developing new CCUS technologies and indigenous
intellectual property rights. It includes broad goals to develop the technology across a range of sectors including thermal
power, coal-chemical, cement, and steel. It also states China’s plans to develop fully integrated CCS demonstration projects
with the captured CO2 to be used for EOR or for geologic storage. More recently, in March 2012, NDRC issued the 12th FYP
on Coal Industry Development, which states that China will support research and demonstration of CCUS.
For the fi rst time, the recent period has also seen strong public endorsements of CCS from a number of senior Chinese
leaders, including from the NDRC Vice Chairman, Xie Zhenhua, at a CCS Conference in July 2011. In March 2012, senior
NDRC leaders reinforced China’s commitment to developing CCS with the signing of the MoU with the Global CCS Institute to
strengthen the parties’ cooperation on CCS.
Coinciding with these positive policy developments is a recent increase in the number of LSIPs in China. In the 2012 project
survey, fi ve new LSIPs were recorded in China, bringing the total number of China’s LSIPs to 11.
Appendix G summarises some of the specifi c activities that have been undertaken in the 19 countries identifi ed.
Policy, legal, and regulatory developmentsThere has been a preliminary analysis of legal and regulatory issues and/or review in the majority of developing countries that
have an interest in CCS, including Brazil, China, Botswana, India, Indonesia, Jordan, Kosovo, Malaysia, Philippines, South
Africa, Thailand, Trinidad and Tobago, and Vietnam. Most of these preliminary analyses can be found in studies funded
through APEC, the ADB, the CSLF, the Global CCS Institute, and the World Bank; some studies are still being fi nalised.
The depth of analysis differs between studies. For instance, in Botswana the World Bank on behalf of the Government is
undertaking a CCS feasibility study to evaluate CCS opportunities in the country, as well as make recommendations as to an
appropriate legal and regulatory environment. At a CCS workshop conducted in 2010, Botswana identifi ed areas upon which
regulations need to be defi ned, including possible leakage of CO2 and its impact on groundwater quality, CO
2 streams for
storage, suitability of storage sites, and permits for fi lling pore spaces.
In addition, the UAE commenced a study to develop a CCS Value Proposition taking into account the necessary CCS regulatory
framework and international standards set by the UNFCCC.
In Latin America, CCS is seen as a crucial component in the region’s efforts to combat climate change, particularly for
emerging oil-based economies such as Mexico, Brazil, and Venezuela. However, undertaking commercial-scale CCS projects
in the region is diffi cult without a legal framework in Latin America. The Latin American Thematic Network on Carbon Dioxide
Capture and Storage was formed to help facilitate the development of CCS. The Network seeks to promote collaboration and
integrate CCS activities by scientists, research centres, and other agencies.
Refer to Appendix E for a summary of the key policy context in a number of countries including Brazil, China, India, Indonesia,
Malaysia, Mexico, Saudi Arabia, South Africa, and Trinidad and Tobago.
T H E G L O B A L S TAT U S O F C C S : 2 0 1 296
Storage developmentsBrazil, Mexico, and South Africa are developing countries that have already undertaken a country-level storage assessment.
Brazil is in the process of fi nalising its storage atlas for publication later in 2012. Mexico released their country-level
storage atlas in May 2012 as part of the North American Carbon Atlas Partnership program. Mexico is now focused on
investigating basins in the north of the country. South Africa released its national storage atlas in 2010, and is undertaking
three more detailed storage assessments at basin level, the outcomes of which will feed into decisions around a test injection
project. China has also undertaken some fairly developed regional-scale storage assessments as well as some detailed site
characterisation, especially in relation to EOR.
Very preliminary storage assessments have been undertaken (or are currently being undertaken) as part of broader CCS
scoping studies in a number of other developing countries, including Botswana, Indonesia, Jordan, Kosovo, the Maghreb
region, Malaysia, Philippines, Thailand, and Vietnam.
5.3
Demonstration projects provide drivers for CCS in developing countriesThe developing countries that are most advanced along the CCS lifecycle are countries that are developing or have already
implemented a CCS pilot or demonstration project. Pilot and demonstration projects are a key part of ‘learning by doing’. These
projects provide a catalyst or focus for associated activities such as capacity development, enabling, and pre-investment.
Demonstration projects and their learning by doing underscore the importance, at least in the short term, of funding for
enabling and pre-investment activities in developing countries. In the medium term, more signifi cant funding is needed for the
‘extra’ CCS costs associated with construction and operation of at least 5–10 demonstration projects in these countries.
As discussed above, a key catalyst underpinning interest in CCS in a number of developing countries is the link with enhanced
oil recovery and/or gas processing. Given that EOR can help make CCS projects commercially viable, developing countries with
EOR potential are well placed to take further CCS steps in the future (e.g. Indonesia, Malaysia, the Middle East, and countries
in North Africa).
The Global CCS Institute defi nes capacity development as a country’s ability to build awareness, understanding,
knowledge, and ultimately the skills required to progress CCS. It may be appropriate to build knowledge and
understanding across a variety of stakeholder groups, including policy makers, regulators, industry, and not-for-profi t
organisations. All these groups are vital in making CCS a viable low-carbon energy solution. CCS capacity can be built
around a number of different topics, for example;
government understanding of legal and policy issues and how this applies to legislation and regulation
development and application;
technical knowledge and skills in engineers, geologists, and project managers;
understanding fi nancial and commercial issues, risks, and incentives by policy makers, lenders, and companies;
and
the ability of companies and governments to effectively and genuinely engage with the public and local
stakeholders around a specifi c CCS project.
GLOBAL CCS INSTITUTE’S APPROACH TO CAPACITY DEVELOPMENT
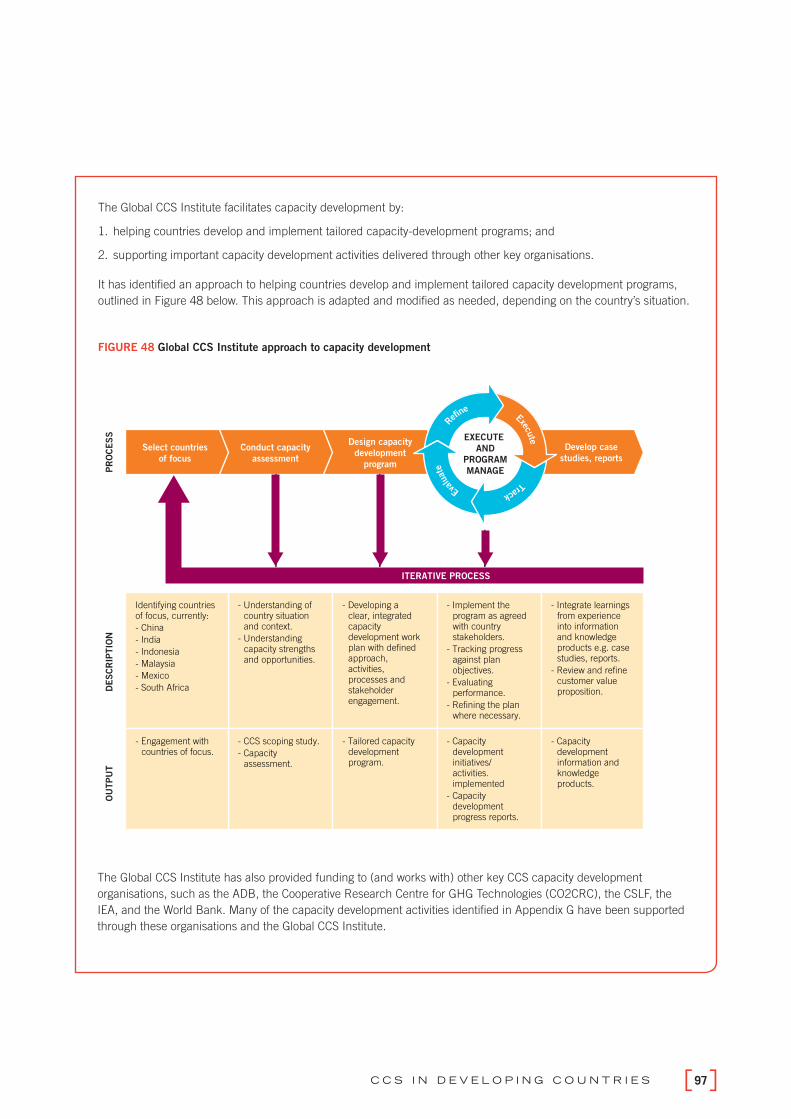
97C C S I N D E V E L O P I N G C O U N T R I E S
The Global CCS Institute has also provided funding to (and works with) other key CCS capacity development
organisations, such as the ADB, the Cooperative Research Centre for GHG Technologies (CO2CRC), the CSLF, the
IEA, and the World Bank. Many of the capacity development activities identifi ed in Appendix G have been supported
through these organisations and the Global CCS Institute.
The Global CCS Institute facilitates capacity development by:
1. helping countries develop and implement tailored capacity-development programs; and
2. supporting important capacity development activities delivered through other key organisations.
It has identifi ed an approach to helping countries develop and implement tailored capacity development programs,
outlined in Figure 48 below. This approach is adapted and modifi ed as needed, depending on the country’s situation.
FIGURE 48 Global CCS Institute approach to capacity development
Design capacity
development
program
Develop case
studies, reportsConduct capacity
assessment
Select countries
of focus
PR
OC
ES
SD
ES
CR
IPTIO
N
ITERATIVE PROCESS
- Understanding of country situation and context.
- Understanding capacity strengths and opportunities.
- Developing a clear, integrated capacity development work plan with defined approach, activities, processes and stakeholder engagement.
- Implement the program as agreed with country stakeholders.
- Tracking progress against plan objectives.
- Evaluating performance.
- Refining the plan where necessary.
- Integrate learnings from experience into information and knowledge products e.g. case studies, reports.
- Review and refine customer value proposition.
Identifying countries of focus, currently:
- China
- India
- Indonesia
- Malaysia
- Mexico
- South Africa
OU
TP
UT
- CCS scoping study.
- Capacity assessment.
- Tailored capacity development program.
- Capacity development initiatives/ activities. implemented
- Capacity development progress reports.
- Capacity development information and knowledge products.
- Engagement with countries of focus.
Refin
eExecu
teTrackEva
luat
eEXECUTE
AND
PROGRAM
MANAGE

CAPTURE
6
6.1Introduction 99
6.2Capture technology progress 102
6.3Key challenges to large-scale demonstration of capture 110
6.4Moving towards commercial-scale demonstration 114
99C A P T U R E
KEY MESSAGES
› Capturing CO2 at a commercial scale is currently being undertaken in gas
processing and industrial processes that produce high-purity CO2. Capture is
starting to be applied to power generation at the demonstration scale.
› Creating a viable business case for fi rst-of-a-kind capture projects at
commercial scale in power generation remains the key challenge for power
generation. The high capital costs and ongoing operational costs (partly
due to additional energy requirements associated with capture) are the key
obstacles.
› Advances have been made in oxyfuel combustion through the commissioning
of two small-scale oxyfuel combustion demonstration projects.
› Pilot-scale facilities are demonstrating capture of CO2 from coal-fi red power
generation, but more operational experience is required.
› Further work needs to be supported to reduce the cost of capture, including
promoting more effi cient combustion processes, improved integration and
fl exibility of CCS into the power plant, and ongoing R&D into new capture
technologies.
› Capture demonstrations in iron and steel and cement manufacturing need to
be further encouraged.
6.1
INTRODUCTION Capturing CO
2 that would otherwise be emitted to the atmosphere, cleaning it, and compressing it to the point where it can
be transported represents the greatest additional costs for applying CCS to power generation. In some other processes, for
example gas processing, the CO2 is already captured as part of the process, so the greatest cost is that of compressing,
transporting, and storing the CO2 instead of venting it to the atmosphere. This chapter provides an update on the progress
made in capture technology, its challenges, and an outlook across the different sectors where CCS can be applied.
The most advanced technology options for CO2 capture from fossil fuel usage are:
pre-combustion capture from gas streams;
post-combustion capture from combustion flue gas; and
oxyfuel combustion – the direct combustion of fuel with oxygen.
These three approaches are shown for coal-based power systems in Figure 49. These technologies can also be applied to gas-
fi red power systems and are also applicable to certain non-power generation applications.
Photo
court
esy
of South
ern
Com
pany.
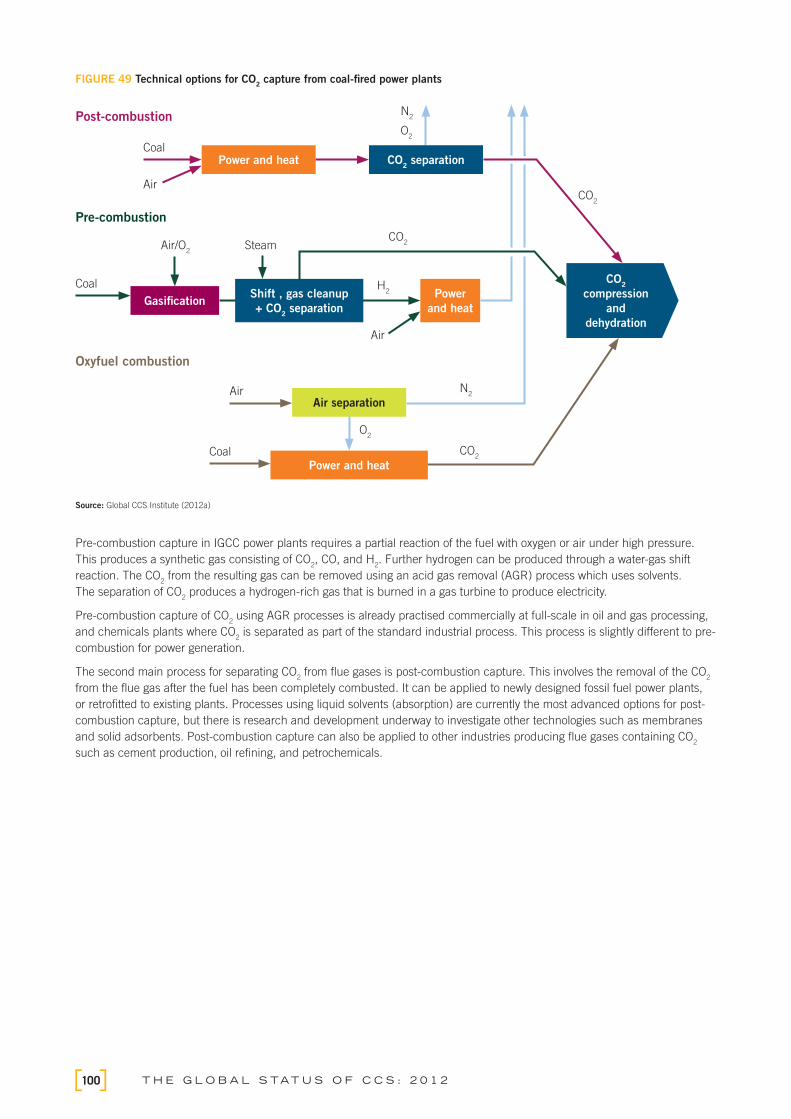
T H E G L O B A L S TAT U S O F C C S : 2 0 1 2100
FIGURE 49 Technical options for CO2 capture from coal-fi red power plants
Source: Global CCS Institute (2012a)
Pre-combustion capture in IGCC power plants requires a partial reaction of the fuel with oxygen or air under high pressure.
This produces a synthetic gas consisting of CO2, CO, and H
2. Further hydrogen can be produced through a water-gas shift
reaction. The CO2 from the resulting gas can be removed using an acid gas removal (AGR) process which uses solvents.
The separation of CO2 produces a hydrogen-rich gas that is burned in a gas turbine to produce electricity.
Pre-combustion capture of CO2 using AGR processes is already practised commercially at full-scale in oil and gas processing,
and chemicals plants where CO2 is separated as part of the standard industrial process. This process is slightly different to pre-
combustion for power generation.
The second main process for separating CO2 from fl ue gases is post-combustion capture. This involves the removal of the CO
2
from the fl ue gas after the fuel has been completely combusted. It can be applied to newly designed fossil fuel power plants,
or retrofi tted to existing plants. Processes using liquid solvents (absorption) are currently the most advanced options for post-
combustion capture, but there is research and development underway to investigate other technologies such as membranes
and solid adsorbents. Post-combustion capture can also be applied to other industries producing fl ue gases containing CO2
such as cement production, oil refi ning, and petrochemicals.
Coal
Coal
Coal
Air
Air
Steam
H2
N2
N2
O2
O2
CO2
CO2
CO2
Air/O2
Air
Post-combustion
Pre-combustion
Oxyfuel combustion
Power and heat
Gasifi cation
Air separation
Power and heat
CO2 separation
Shift , gas cleanup
+ CO2 separation
Power
and heat
CO2
compression
and
dehydration
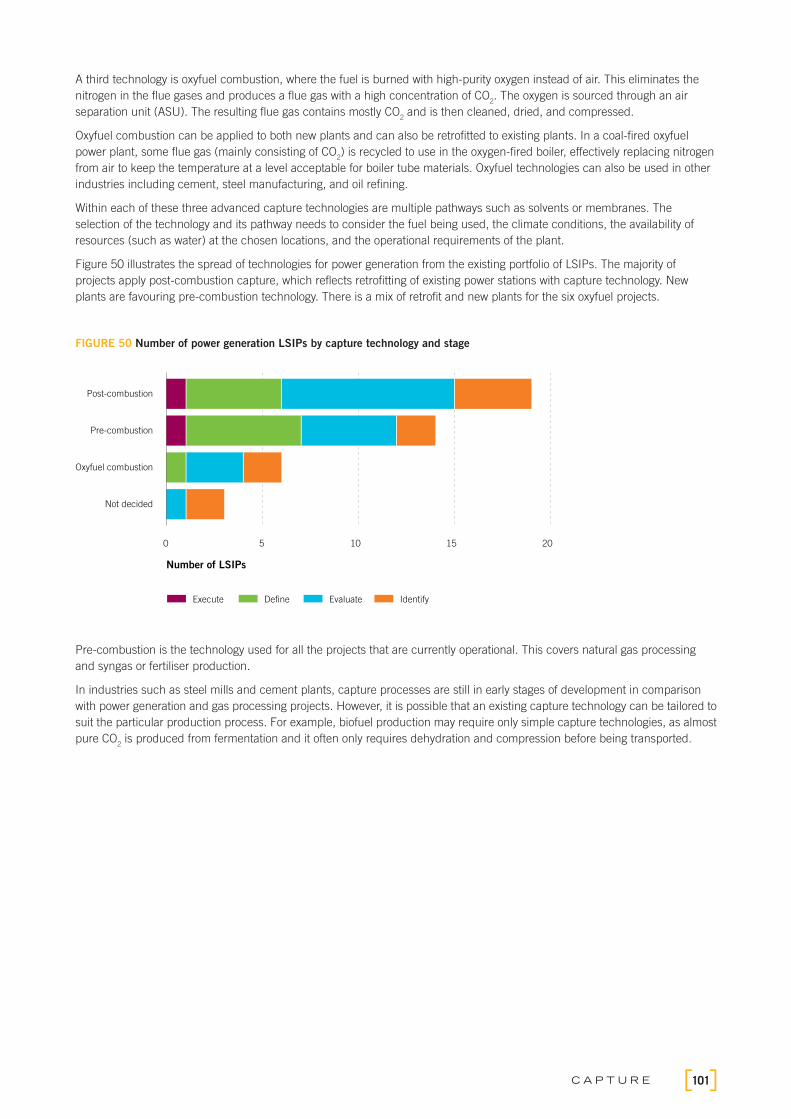
101C A P T U R E
A third technology is oxyfuel combustion, where the fuel is burned with high-purity oxygen instead of air. This eliminates the
nitrogen in the fl ue gases and produces a fl ue gas with a high concentration of CO2. The oxygen is sourced through an air
separation unit (ASU). The resulting fl ue gas contains mostly CO2 and is then cleaned, dried, and compressed.
Oxyfuel combustion can be applied to both new plants and can also be retrofi tted to existing plants. In a coal-fi red oxyfuel
power plant, some fl ue gas (mainly consisting of CO2) is recycled to use in the oxygen-fi red boiler, effectively replacing nitrogen
from air to keep the temperature at a level acceptable for boiler tube materials. Oxyfuel technologies can also be used in other
industries including cement, steel manufacturing, and oil refi ning.
Within each of these three advanced capture technologies are multiple pathways such as solvents or membranes. The
selection of the technology and its pathway needs to consider the fuel being used, the climate conditions, the availability of
resources (such as water) at the chosen locations, and the operational requirements of the plant.
Figure 50 illustrates the spread of technologies for power generation from the existing portfolio of LSIPs. The majority of
projects apply post-combustion capture, which refl ects retrofi tting of existing power stations with capture technology. New
plants are favouring pre-combustion technology. There is a mix of retrofi t and new plants for the six oxyfuel projects.
FIGURE 50 Number of power generation LSIPs by capture technology and stage
0 5 10 15 20
Not decided
Oxyfuel combustion
Pre-combustion
Post-combustion
Number of LSIPs
Execute Define Evaluate Identify
Pre-combustion is the technology used for all the projects that are currently operational. This covers natural gas processing
and syngas or fertiliser production.
In industries such as steel mills and cement plants, capture processes are still in early stages of development in comparison
with power generation and gas processing projects. However, it is possible that an existing capture technology can be tailored to
suit the particular production process. For example, biofuel production may require only simple capture technologies, as almost
pure CO2 is produced from fermentation and it often only requires dehydration and compression before being transported.

T H E G L O B A L S TAT U S O F C C S : 2 0 1 2102
6.2
CAPTURE TECHNOLOGY PROGRESSProgress has been made in capture technology during 2012. This progress relates to ongoing construction of large-scale
capture projects covering pre-combustion across a range of industries and post-combustion capture applied to coal-fi red
power generation and the demonstrating of oxyfuel technology at smaller scale.
This section describes the progress made in power generation, followed by the progress made in the non-power
generation sector.
Pre-combustion capture progress in power generationPre-combustion carbon capture systems for power generation have been demonstrated at pilot and demonstration scale and
there are projects under construction that will demonstrate the technology at a commercial scale. The focus of RD&D is on
the reduction in capital cost and in particular a reduction in parasitic energy requirements of existing and new pre-combustion
capture systems.
In the US there are pre-combustion carbon capture projects in power and/or industrial applications that are progressing into
construction or are showing promise in achieving a positive FID. These projects partially offset the cost of capture through
additional revenue from captured CO2 such as enhanced oil recovery.
The most developed commercial scale IGCC with CCS plant is being built by the Mississippi Power Company – a subsidiary
of Southern Company – in Kemper County in the US. Construction is well underway, with operations scheduled to commence
in 2014. Globally, this will be the fi rst to combine commercial-scale IGCC and CCS. Its construction and operation aims to
demonstrate that commercial scale IGCC and CCS is both technically and commercially viable. The project will generate 524
MW of electricity and approximately 65 per cent of its emissions will be captured using a Selexol acid gas removal unit. The
annual CO2 to be captured will be approximately 3.5 Mt. Engineering has been a joint effort between Southern Company
Services and a third party, with the latter undertaking procurement and construction management. Through this joint approach
to engineering the project is already achieving additional project delivery cost savings.
Another project in the US is the Texas Clean Energy Project (TCEP) being developed by the Summit Power Group. This will be
a 400 MW (gross) IGCC poly-generation plant with CCS. Some of the produced syngas will be used for power generation and
the balance will be used for the production of granulated urea for commercial sale. Using poly-generation will create additional
revenue for the project. The project will capture 90 per cent of the CO2 from the production of urea using Rectisol. EPC
contracts and operation and maintenance agreements were fi nalised in early 2012 with three EPC contractors. The project is
expected to make an FID in late 2012.
In a similar project, SCS Energy is developing the Hydrogen Energy California Project. This is a 400 MW (gross) IGCC poly-
generation plant. A portion of the syngas produced is proposed to fuel a gas turbine power block and the balance will also be
used for the commercial production of granulated urea.
Other projects of note in the US involve modifi cations to existing industrial gas processing and chemicals facilities, and include
the Air Products Steam Methane Reformer EOR Project in East Texas that is planning to capture 1 Mt per annum of CO2
from existing syngas plants. Also, the Leucadia Energy CCS Project in Lake Charles, Louisiana, is planning to capture 4.5
Mt per annum of CO2 in an existing methanol plant (from syngas). All the aforementioned projects have received signifi cant
government funding from US DOE/NETL.
One of the projects at an advanced stage of development outside of the US is the Chinese 250 MW GreenGen IGCC/CCS
project. Following completion of Stage I, the project will be enlarged to 650 MWe though the addition of a 400 MW unit.
The exact duration of the subsequent R&D operational program for the plant (rather than subsequent commercial power
generation) has not yet been fi nalised however this project shows the successful operation of IGCC outside North America.

103C A P T U R E
The Global CCS Institute uses a Technology Readiness Level (TRL) to indicate the development level of the capture
technologies described. This system was developed by NASA in the 1980s to better understand the developmental
pathways of immature technologies. The TRL uses a scale of 1–9 to measure development from a basic concept (1)
through to being available at commercial scale (9), with each step representing an increase in the level of maturity
of a technology. The nine TRLs are described in the box below. TRLs 1–5 are often denoted as research, while TRLs
5–9 are focused on development and demonstration activities. Signifi cant investment of time and money is required
to progress from lower to higher TRLs, although it is diffi cult to gauge the amount of time required to progress through
to higher TRL values. NASA have analysed the development of a range of different NASA technologies through
increasing levels of TRL maturity (Peisen 1999) and found that for their technologies it can take over 16 years for a
technology to mature to TRL-9. However, MHI, a major technology provider, has given some contextual data for TRL
maturity for IGCC power generation. MHI indicate that it took about 25 years to move from level 3 to level 8 and then a
further fi ve years to reach level 9 (Sakamoto 2010).
TABLE 13 Technology Readiness Levels (TRLs) description
TECHNOLOGY READINESS LEVEL
READINESS LEVEL DESCRIPTION
TRL-9 Full-scale commercial deployment (400–500 MW)
TRL-8 Sub-scale commercial demonstration plant (>25 per cent commercial scale)
TRL-7 Pilot plant (>5 per cent commercial scale)
TRL-6 Process development unit (0.1–5 per cent of full scale)
TRL-5 Component validation in relevant environment
TRL-4 Laboratory component testing
TRL-3 Analytical, ‘proof of concept’
TRL-2 Application formulated
TRL-1 Basic principles observed
An achievement of TRL-9 indicates that the fi rst successful operation at a scale normally associated with commercial
deployment has been achieved. This refers to the physical scale of deployment only. Thus, a technology may reach
TRL-9 and be technically mature but still not meet project economic requirements in existing markets. The TRL
system does not address the commercial or economic feasibility of deploying the technology.
The TRL classifi cation is not intended to express overall project development risk. This is project-specifi c, and
progress on fi rst-of-a-kind projects may be infl uenced by the extent to which sophisticated project proponents have
gained confi dence in technology components and their ability to integrate these into a viable process. This may mean
the project proponent may select a particular technology component with a lower (less mature) TRL if the project-
specifi c business case is better than that for an alternative technology component with a higher (more mature) TRL.

T H E G L O B A L S TAT U S O F C C S : 2 0 1 2104
Post-combustion capture progress in power generationPost-combustion capture (PCC) for LSIPs has experienced some setbacks during the past year. The application of post-
combustion has mostly focused on power generation and projects have had diffi culty in creating a commercially viable project
using PCC. Nevertheless, progress has been made in the LSIP using PCC that is under construction, Boundary Dam in
Canada, and it is expected to be operational in 2014. There are many projects in the planning stages – all for
power generation.
The major challenges in PCC revolve around the relatively large parasitic load CCS imposes on a power plant, the majority of
which is due to capture (especially the energy needed to regenerate the solvent). Development of new chemistry (solvent-
based and non-solvent based), new process designs, and novel power plant integration schemes (e.g. waste heat and heat
recovery) – all aimed at reducing the parasitic load of CCS – are the focus of virtually all RD&D in PCC. Reducing the parasitic
load by 50 per cent without increasing cost of capture would reduce the cost of carbon abatement by approximately 27 per cent.
In general, capital cost reductions, solvent degradation, solvent volatility, and other such parameters are secondary to the
prime issue – reduction in parasitic load on the host power plant imposed by the PCC process itself. These secondary issues,
while important, do not constitute the major challenge in PCC and consequently receive less R&D attention.
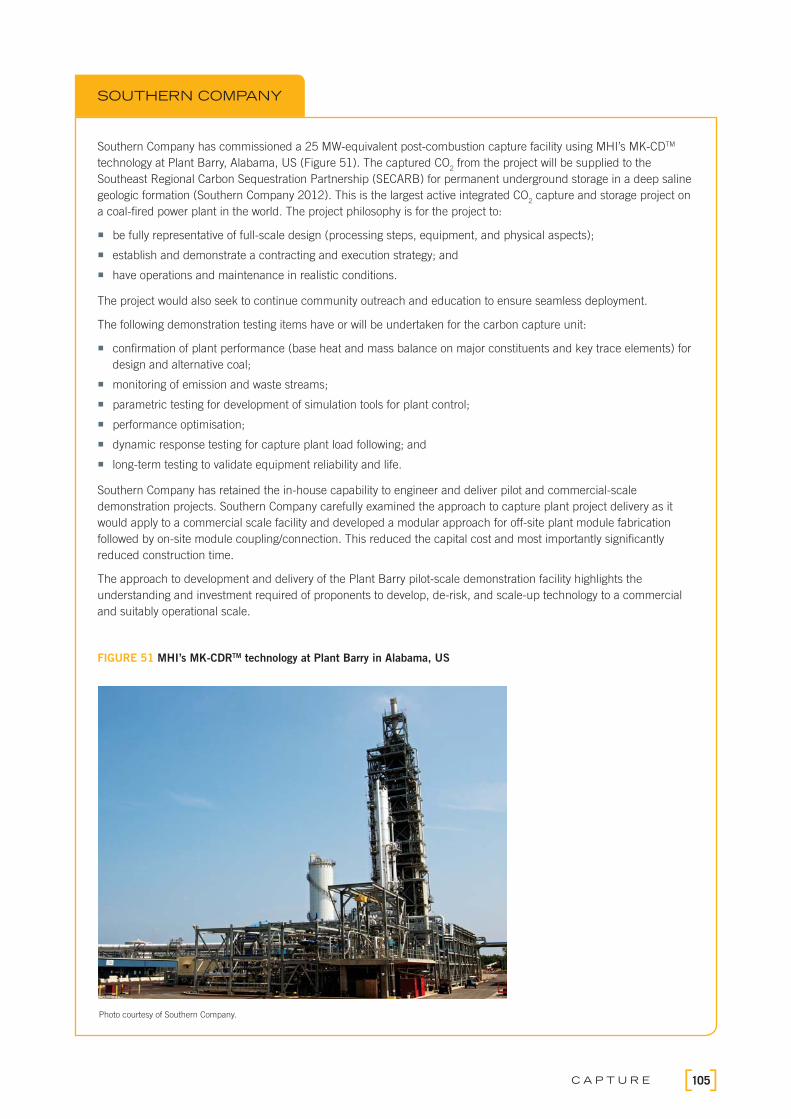
105C A P T U R E
Southern Company has commissioned a 25 MW-equivalent post-combustion capture facility using MHI’s MK-CDTM
technology at Plant Barry, Alabama, US (Figure 51). The captured CO2 from the project will be supplied to the
Southeast Regional Carbon Sequestration Partnership (SECARB) for permanent underground storage in a deep saline
geologic formation (Southern Company 2012). This is the largest active integrated CO2 capture and storage project on
a coal-fi red power plant in the world. The project philosophy is for the project to:
be fully representative of full-scale design (processing steps, equipment, and physical aspects);
establish and demonstrate a contracting and execution strategy; and
have operations and maintenance in realistic conditions.
The project would also seek to continue community outreach and education to ensure seamless deployment.
The following demonstration testing items have or will be undertaken for the carbon capture unit:
confirmation of plant performance (base heat and mass balance on major constituents and key trace elements) for
design and alternative coal;
monitoring of emission and waste streams;
parametric testing for development of simulation tools for plant control;
performance optimisation;
dynamic response testing for capture plant load following; and
long-term testing to validate equipment reliability and life.
Southern Company has retained the in-house capability to engineer and deliver pilot and commercial-scale
demonstration projects. Southern Company carefully examined the approach to capture plant project delivery as it
would apply to a commercial scale facility and developed a modular approach for off-site plant module fabrication
followed by on-site module coupling/connection. This reduced the capital cost and most importantly signifi cantly
reduced construction time.
The approach to development and delivery of the Plant Barry pilot-scale demonstration facility highlights the
understanding and investment required of proponents to develop, de-risk, and scale-up technology to a commercial
and suitably operational scale.
FIGURE 51 MHI’s MK-CDRTM technology at Plant Barry in Alabama, US
SOUTHERN COMPANY
Photo courtesy of Southern Company.
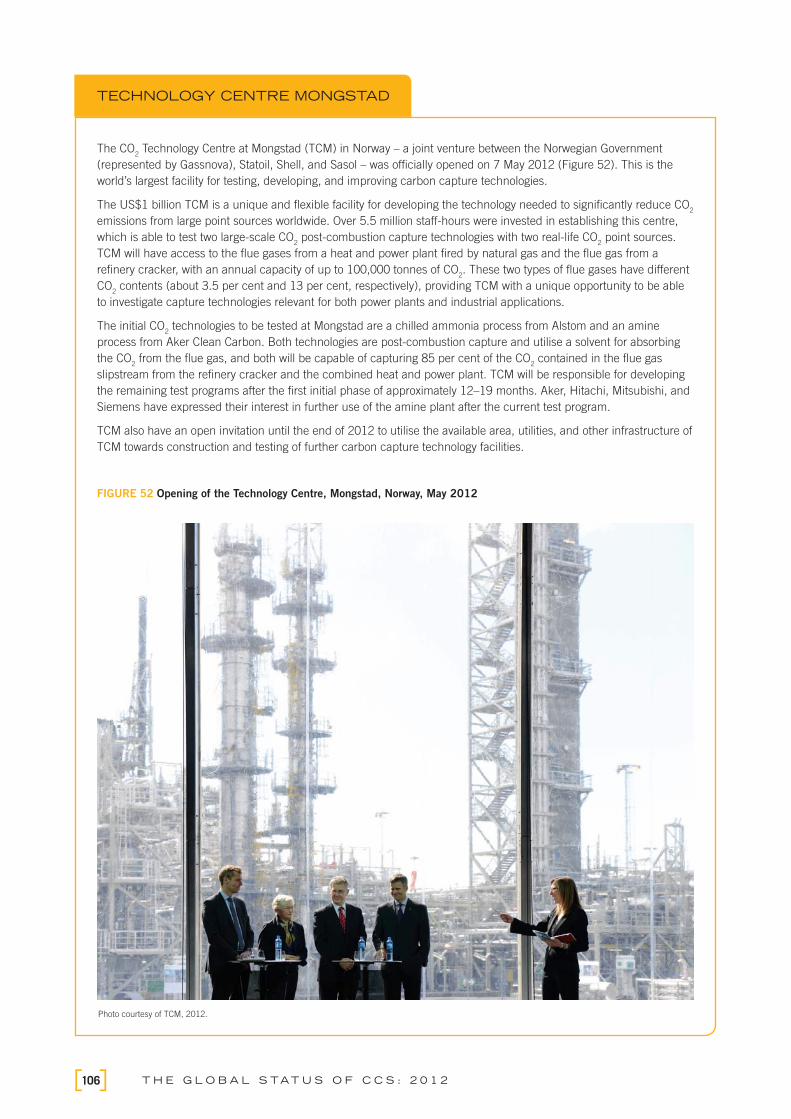
T H E G L O B A L S TAT U S O F C C S : 2 0 1 2106
The CO
2 Technology Centre at Mongstad (TCM) in Norway – a joint venture between the Norwegian Government
(represented by Gassnova), Statoil, Shell, and Sasol – was offi cially opened on 7 May 2012 (Figure 52). This is the
world’s largest facility for testing, developing, and improving carbon capture technologies.
The US$1 billion TCM is a unique and fl exible facility for developing the technology needed to signifi cantly reduce CO2
emissions from large point sources worldwide. Over 5.5 million staff-hours were invested in establishing this centre,
which is able to test two large-scale CO2 post-combustion capture technologies with two real-life CO
2 point sources.
TCM will have access to the fl ue gases from a heat and power plant fi red by natural gas and the fl ue gas from a
refi nery cracker, with an annual capacity of up to 100,000 tonnes of CO2. These two types of fl ue gases have different
CO2 contents (about 3.5 per cent and 13 per cent, respectively), providing TCM with a unique opportunity to be able
to investigate capture technologies relevant for both power plants and industrial applications.
The initial CO2 technologies to be tested at Mongstad are a chilled ammonia process from Alstom and an amine
process from Aker Clean Carbon. Both technologies are post-combustion capture and utilise a solvent for absorbing
the CO2 from the fl ue gas, and both will be capable of capturing 85 per cent of the CO
2 contained in the fl ue gas
slipstream from the refi nery cracker and the combined heat and power plant. TCM will be responsible for developing
the remaining test programs after the fi rst initial phase of approximately 12–19 months. Aker, Hitachi, Mitsubishi, and
Siemens have expressed their interest in further use of the amine plant after the current test program.
TCM also have an open invitation until the end of 2012 to utilise the available area, utilities, and other infrastructure of
TCM towards construction and testing of further carbon capture technology facilities.
FIGURE 52 Opening of the Technology Centre, Mongstad, Norway, May 2012
TECHNOLOGY CENTRE MONGSTAD
Photo courtesy of TCM, 2012.

107C A P T U R E
ABSORPTION CAPTURE PROCESSES
Absorption processes rely on a solvent dissolving the CO2 into a liquid. The absorbed CO
2 is then released by changing the
temperature and/or pressure. The solvent is then recovered for re-use. Much of the current research in absorption-based PCC
is focused on developing new solvents that reduce the energy required to release the CO2 from the solvent. Some early-stage
research is also being conducted in more novel chemistries such as ionic liquids and phase separation solvents (TRL-5).
The use of naturally occurring enzymes (such as carbonic anhydrase) as a catalyst to effectively increase the reaction kinetics
of certain low-energy solvents (e.g. amines and carbonate solvents such as potassium carbonate) and enable them to operate
more effi ciently has created considerable interest (TRL-5). Cost reductions in carbon capture of AU$20 per tonne of CO2
captured have been claimed for deployment of this type of technology (CO2CRC 2012).
In addition to lower regeneration energy requirements, RD&D activity for solvent-based capture systems is focused on faster
reaction rates, contactor improvements (e.g. foams and fl uid curtains), higher liquid capacities, chemical stability and
corrosion, and desorption process improvements. Systems integration is also the subject of RD&D activity, including heat and
waste heat recovery.
ADSORPTION
Adsorption processes rely on CO2 being collected on the surface of a solid. Then, similar to absorption, the solid is exposed
to alternating temperatures and/or pressures to release the CO2. Adsorption processes for PCC are not as developed as
absorption processes and are still in the research and development stage (TRL-4). Early stage work, conducted mostly at
academic institutions, is focused on the development of new materials such as carbon-based sorbents (e.g. activated carbon),
metal organic frameworks (MOFs), zeolites, immobilised amine sorbents, and regenerable solid sorbents (e.g. limestone or
chemical looping concepts).
OTHER PROCESSES
Novel process confi gurations, along with novel membrane materials, could reduce the parasitic load on a power plant. This
has been tested at a scale of 1 tonne of CO2 per day scale (TRL-4) and is currently being scaled to 20 tonnes of CO
2 per day
(TRL-6) at a coal-fi red power plant. Other developments around membranes for PCC are still at the laboratory stage (TRL-4),
focusing chiefl y on improving membrane material properties.
Although receiving much less R&D attention, it is worth mentioning current R&D activity focused on growing microalgae in
ponds as a route to the fi xation of CO2 directly from fl ue gas streams and in so doing avoiding the substantial parasitic energy
penalty of CO2 capture. The biomass produced could then be subsequently used as a combustion fuel for energy production
or other value-added products such as nutritional supplements. This work is at an early stage of development and it is
probably able to contribute only a relatively small amount to overall CO2 emissions reductions (Novel CO
2 Capture Taskforce
2012). Consideration is being given to the possible use of genetically modifi ed microalgae.
Oxyfuel combustion progress for power generation2012 is a crucial year for oxyfuel combustion technologies as key demonstration projects providing vital information for
technology scale-up come into operation. These projects are focused on demonstrating integrated oxyfuel power plant
operation at pilot to sub-commercial scale (TRL 6–7). While oxyfuel projects are not yet at full scale, there are some projects
being developed that will target a higher TRL. Oxyfuel technology must also be fully applied to a power plant module as it is
not possible to have a ‘slipstream’ in the same way as pre- or post-combustion capture can be applied to a slipstream from a
power plant. Oxyfuel is an ‘all or nothing’ approach.
In December 2011, CIUDEN fi rst successfully tested its 30 MWth oxy-CFB (circulating fl uidised bed) boiler at its test facility
in Spain which also includes a 20 MWth oxy-PC (pulverised coal) boiler. Successful operations at CIUDEN demonstrate
the achievement of TRL-6 for oxyfuel combustion with CO2 capture as applied to electric power production with circulating
fl uidised beds. Plans for the Compostilla 300 MWe unit will be based upon successful pilot plant operation. This project is
expected to be operational by 2015 when it will move the TRL to level 8 for oxyfuel combustion in power generation.
In March 2012 CS Energy announced successful oxy-fi ring trials as part of the project commissioning stage for its Callide
project in Australia. This project retrofi tted a retired 100 MWth (30 MWe) coal-fi red power plant for oxyfuel combustion. The
facility includes an air separation unit, an oxy-PC boiler, and a steam turbo-generator. 10 per cent of the fl ue gas produced is
processed further to demonstrate the capture features of the technology. Successful operation of this plant will demonstrate
TRL-7 for oxyfuel combustion with CO2 capture as applied to electric power production.

T H E G L O B A L S TAT U S O F C C S : 2 0 1 2108
The Kimberlina, California, project of Clean Energy Systems is now on hold. This 50 MW pilot plant was intended to
demonstrate the direct combustion of natural gas and oxygen producing a gas that is mostly steam and CO2. After exiting the
expansion turbine, the steam is condensed to water, leaving pure CO2 for compression and storage. Funding sources include
the US DOE and the California Energy Commission.
In Germany, Vattenfall had planned for a 250 MW fully integrated oxyfuel combustion project (TRL-8) at Jänschwalde. This
project was cancelled during 2012 for reasons mainly associated with the lack of political support for the project’s proposed
geologic storage. This project was expected to be operational by 2015 allowing the oxyfuel technology to proceed to TRL-8.
China Datang Corporation and Alstom announced their intention to commence feasibility studies for a 350 MW oxyfuel
combustion plant for Daqing. The project plans to capture up to 1 Mtpa. A fi nal investment decision is planned for 2015.
Progression of capture in the non-power generation sectorThe majority of ongoing progress in large-scale projects has occurred in the non-power generating sector. The main reason for
this is that these processes (e.g. gas processing and fertiliser production) already require the CO2 to be removed as part of the
commercial operations. Hence the cost associated with capturing the CO2 and compressing it so that it is ready for geologic
storage is much less compared to the costs associated with power generation.
The projects under construction in gas processing and chemicals are continuing to progress.
BIOMASS BIOPROCESSING
Progress has been made in projects where a high-purity stream of CO2 is produced. This includes fermentation, fertiliser
manufacturing, and CTL projects. Much of the recent development in carbon capture from biomass bioprocessing, which has
the potential for a net negative carbon emissions profi le, has occurred in the US. In November 2011 an integrated system for
collecting CO2 from an ethanol production plant and geologically sequestering it began injecting 1000 tonnes per day of CO
2.
The CO2 is a by-product from processing corn into fuel-grade ethanol at the ADM ethanol plant in Decatur, Illinois (Figure 53).
Additionally, the design, construction, and operation has commenced of a new collection, compression, and dehydration
facility at the ADM plant which will be capable of delivering up to 2000 tonnes of CO2 per day. This Illinois-ICCS project is
expected to be operational in 2013. Integration of the new facility with the existing 1000 tonnes per day CO2 compression and
dehydration facility will be undertaken to achieve a total daily injection capacity of up to 3000 tonnes of CO2 (NETL 2012). The
completion of this project will demonstrate capture from an industrial process at 1 Mtpa.
FIGURE 53 CO2 being captured, dehydrated, and compressed at ADM ethanol plant
Photo courtesy of Archer Daniels Midland Co.

109C A P T U R E
STEEL AND CEMENT PRODUCTION
Steel and cement production give rise to a large amount of CO2. It is expected that CCS will play a key role in reducing global
emissions from these sectors.
Some progress is being made at the pilot scale in the steel sector. Most of this is organised through the Ultra-Low Carbon
Dioxide Steelmaking (ULCOS) project in France. This project is aiming to develop technology that will produce less CO2
emissions per tonne of steel. The project has made funding available to construct and operate a pilot project at Ijmuden in the
Netherlands. Post-combustion capture is being studied in the ULCOS project for demonstrating CCS from steel production.
A commercial-scale ULCOS project with capture is planned for 2016. A FID for this project is expected by March 2013.
They have determined that the most promising process route for Europe is a re-engineered blast furnace operating with
pure oxygen and where the top gas is separated of its CO2 while the remaining reducing gas is re-introduced into the blast
furnace to be used as a reducing agent, rather than burned in gas burners. The process has been validated at pilot scale and
scale-up is under way with a large pilot and a full-scale CCS demonstration plant planned in Florange, France. The Florange
demonstration has been proposed as an NER300 project and is now ranked eighth on an interim shortlist, pending a fi nal
award decision in late 2012. A signifi cant challenge is that the process modifi cations to incorporate CCS into the iron and steel
production processes are complex (Figure 54).
FIGURE 54 Top gas recycling blast furnace
Sinter, pellets
lump ore and coke
Coal and
cold oxygen
Hot metal
and slag
Dust
catcher
Export
gas
CO2
removal
HeaterVersion 3
1250oC1250oC
Version 4
900oC
CO2
for storage
Source: ULCOS.
T H E G L O B A L S TAT U S O F C C S : 2 0 1 2110
Other steelmaking processes are also under development, such as HIsarna, ULCORED, and ULCOWIN. The main focus of
these technologies is for more effi cient steelmaking processes. Capture from these processes is also being investigated.
To date, there are no large-scale projects proposed for the cement industry. Some desktop studies have applied CCS to the
cement industry and have developed concepts for applying capture to cement plants and have come up with estimates of their
fi nancial impact. There is a small-scale pilot project planned at the Brevik cement plant in Norway. This project aims to be
operational by 2018 and capture up to 10,000 tpa.
6.3
KEY CHALLENGES TO LARGE-SCALE DEMONSTRATION OF CAPTURE Commercial-scale demonstration of capture requires demonstration of capture technologies at increasing TRLs, up to a level
of 9, and then integrating that capture technology into a power station. Beyond this, the challenges associated with capture
technologies are predominantly commercial. Reducing the costs of capture will require ongoing innovation through the
development of new capture technologies and developing systems for integrating capture plants into a power plant.
NEED TO FUND COMMERCIAL-SCALE DEMONSTRATIONS(TRL-9) TO ENCOURAGE RD&D
The 2012 project survey of LSIPs has highlighted that only two projects moved to the Execute stage since the 2011 project
survey. This slow progress of projects reaching FID and commencing construction can have a negative impact on continued
investment in RD&D for second and third-generation capture technologies.
Optimisation and enhanced integration, combined with technology improvements, will undoubtedly be necessary to reduce
cost and improve performance on a system and component basis. Progress at the commercial CCS demonstration scale has a
key role in indicating the priority areas to be addressed and in providing the confi dence and drivers for continued investment
in RD&D for second and third generation technologies.
For all technologies, there is an underlying need to construct and operate commercial-scale facilities with carbon capture to
demonstrate the host power generation or host industrial technology integrated with the capture. This will allow industry to
become familiar with the technology and gain confi dence that commercial-scale capture is achievable.
NEED TO FUND ONGOING RESEARCH AND PILOT SCALE DEMONSTRATIONS (TRL-6+)
Improvements in the cost of capture are required and this will require ongoing research and development focused on
improving component performance and developing new capture processes (e.g. improved membranes, TRL-4+).
Progress of CO2 capture in the power sector is currently aimed at achieving process development at the unit scale. Advancing
to pilot and sub-commercial scale demonstrations (and larger) will be slow and will require an order of magnitude greater level
of funding.
Furthermore, the early commercial-scale demonstration projects will inevitably identify unexpected construction and operating
problems (through ‘learning by doing’). However, such learning by doing may not lead to the signifi cant changes in cost and
performance required to make CO2 capture more economically viable (NETL 2010). RD&D at smaller scale (TRL-4 and 5),
which is complementary to demonstration programs, is essential to promote step changes in performance/operability and
manage the complexity and risk with new components; only in this way can they contribute to improved performance in the
next generation of commercial-scale CCS projects.
Ongoing support to develop new technologies and to develop these technologies to pilot and demonstration scale is required to
achieve the desired large cuts in capture costs.
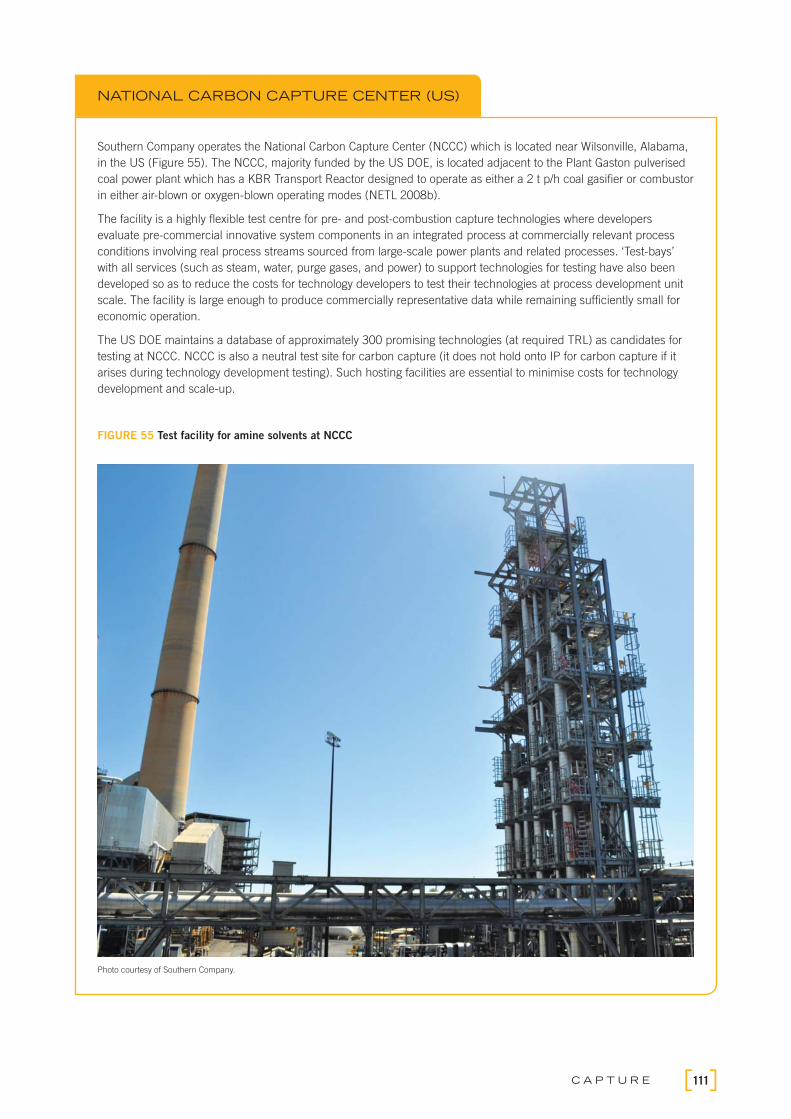
111C A P T U R E
Southern Company operates the National Carbon Capture Center (NCCC) which is located near Wilsonville, Alabama,
in the US (Figure 55). The NCCC, majority funded by the US DOE, is located adjacent to the Plant Gaston pulverised
coal power plant which has a KBR Transport Reactor designed to operate as either a 2 t p/h coal gasifi er or combustor
in either air-blown or oxygen-blown operating modes (NETL 2008b).
The facility is a highly fl exible test centre for pre- and post-combustion capture technologies where developers
evaluate pre-commercial innovative system components in an integrated process at commercially relevant process
conditions involving real process streams sourced from large-scale power plants and related processes. ‘Test-bays’
with all services (such as steam, water, purge gases, and power) to support technologies for testing have also been
developed so as to reduce the costs for technology developers to test their technologies at process development unit
scale. The facility is large enough to produce commercially representative data while remaining suffi ciently small for
economic operation.
The US DOE maintains a database of approximately 300 promising technologies (at required TRL) as candidates for
testing at NCCC. NCCC is also a neutral test site for carbon capture (it does not hold onto IP for carbon capture if it
arises during technology development testing). Such hosting facilities are essential to minimise costs for technology
development and scale-up.
FIGURE 55 Test facility for amine solvents at NCCC
NATIONAL CARBON CAPTURE CENTER (US)
Photo courtesy of Southern Company.

T H E G L O B A L S TAT U S O F C C S : 2 0 1 2112
INTEGRATION WITH POWER GENERATION
Project integration is a key challenge for CCS. A large proportion of proposed industrial-scale projects include power-related
projects that extend the scope of project integration. These project proponents may or may not have experience or expertise in
all of that scope, particularly the storage components.
In a workshop in November 2011 held by the Global CCS Institute and the CSLF, it was highlighted that the focus of the fi rst
large-scale CCS demonstration plants in the power sector should be on ‘making CCS work at scale’ and that real innovation
and integration was something for next-of-a-kind projects. In such projects, integration and experience could drive down the
costs of CCS, but for now it is important to strike the right balance between plant operation and integration. In particular, CCS
industry experts identifi ed that more work is needed in the following areas:
integration/regeneration of plant heat (and cooling) in the CO2 capture process;
integration of environmental control systems (SOx, NOx, and CO2 removal) to maximise efficiency;
improvement of options for operational flexibility, while ensuring CCS system reliability;
impacts of CO2 compositions and impurities for CCS operations (in particular for transportation systems); and
understanding the scale-up risks of CO2 capture processes.
It was also emphasised that one of the keys to successful project integration is to facilitate effective collaboration and
communication between the various entities involved in the project. Identifying the project team and ‘getting them all in the
same tent’ is key for successful project integration. In the case of oxyfuel technology, for example, the industrial gas companies
and the power companies have different design philosophies that need to come together in a project.
It is expected that fl exible operation of coal-fi red power plants with CO2 capture will be required in many electricity systems;
however, current knowledge in public literature is limited.
It is very likely that different CO2 capture technologies will have different impacts on plant performance, and there is a trade-off
between fl exibility, costs, and effi ciency (IEAGHG 2012b). CCS may impose additional constraints on the fl exible operation of
power plants, but in general there are ways of overcoming these limitations. There are some instances when a plant with CO2
capture may be able to ramp up its net power output more quickly and produce more peak generation than a plant without
capture (IEAGHG 2012b).
Post-combustion capture with aqueous solvents can be undertaken, with relatively few changes, to an industry-standard
pulverised coal fi red power plant with air combustion. The majority of integration modifi cations required for post-combustion
capture involve integration with the turbine part of the power station. Current demonstration projects have been designed to
demonstrate capture, and only a secondary focus has been on effi ciency. During start-up, the CO2 absorber could be operated
using lean solvent from a storage tank, and the CO2-rich solvent from the absorber would be stored and fed to the regenerator
later. This would enable a natural gas combined cycle or pulverised coal fi red power plant with CO2 capture to start up and
change load as quickly as a plant without capture (IEAGHG 2012b). The practicality of CO2 solvent storage has been discussed
with some leading technology suppliers, with these companies all confi rming the technical feasibility of storing solvent
(IEAGHG 2012b). The solvent storage tanks are conventional sized tanks as used at oil refi neries, but they are nevertheless
large (IEAGHG 2012b). Plants could be built with a wide range of storage volumes, solvent regenerator sizes, and peak power
generation capacities; selecting the optimum would be a diffi cult commercial decision (IEAGHG 2012b).
Southern Company and MHI are now undertaking operating fl exibility (plant-ramping) trials at Plant Barry in Alabama, US.
These studies will provide design and dynamic modelling information necessary to design the next generation of larger
scale carbon capture plants; these will be capable of fl exible commercial-scale operation and meet dynamic performance
requirements for power generation (Southern Company 2012).
An important operating option for oxyfuel power plants could be storage of oxygen in liquid or gaseous form. This interim
storage option could be important in improving plant ramp rates by adding to oxygen production rates (higher than those
possible with only an air separation unit), (Chalmers 2010). Liquid oxygen storage would typically be included for a safe
change-over from oxygen to air fi ring, and in the case of an air separation unit trip, no additional liquid oxygen storage would
be needed to satisfy the ramp rate. From an economic perspective this is expected to be a relatively attractive option for short-
term peak power generation (IEAGHG 2012b).
The fl exibility of IGCC plants without capture is relatively poor. Hence, the addition of capture is not expected to reduce the
fl exibility. It seems likely that the most practical options for providing operating fl exibility at these plants will involve interim
storage of hydrogen (or syngas in cases where CO2 capture is not used). It is expected that increased integration could improve
effi ciency, but would reduce fl exibility (Chalmers 2010).
Compressed CO2 could be stored at capture plants to reduce the variability of fl ows of CO
2 to transport and storage (if this is
found to be necessary). Buffer storage of CO2 would enable a smaller capacity CO
2 pipeline to be built, but this would constrain
the ability of the power plant to operate at continuous full load, which may not be commercially attractive (IEAGHG 2012b).

113C A P T U R E
While the current focus is on demonstrating capture, more practical project experience is required to integrate capture
and power generation. This experience will lead to the development of more effi cient systems by investigating ways where
capture and power generation can operate more fl exibly and more effi ciently (in line with the operational requirements of
the power plant).
CHALLENGES WITH POST-COMBUSTION CO2 CAPTURE
REGULATORY APPROVAL
To reduce CO2 emissions from existing and new power plants, amine-based post-combustion capture technology is considered
a crucial part of the CCS chain. The use of amine-based solvents is the most advanced of the post-combustion options, and it
is therefore well positioned for use in demonstration projects and future commercial plants.
However, the amine-based liquid absorbents used in these processes degrade slowly. As a result of side reactions between
the amine and components present in the fl ue gas components, a wide range of reaction by-products are formed. At present,
the knowledge about the type and level of components being emitted by the post-combustion process is limited. In recent
years, concerns have been raised about the nature of the emissions, either on their own or following chemical reaction in the
atmosphere (Mitch 2002).
Additionally, technology providers are developing improved amines for post-combustion capture application. These technology
providers are seeking to protect their intellectual property by keeping their improved amine formulations confi dential. This
confl icts with the regulatory approvals process for carbon capture systems in many jurisdictions, which require the nature
of emissions from post-combustion capture systems (as well as the composition of post-combustion capture solvents) to be
released into the public domain.
As post-combustion capture moves towards large-scale demonstration, this topic has received considerable attention
(especially in Europe and Norway). Although academic studies are increasing, there is a considerable lack of validated
information in the public domain, especially that involving IP-protected improved amines. This knowledge gap constitutes a
potential deployment risk to amine-based post-combustion capture CCS.
In order to assist regulators in the regulatory approval of amine-based post-combustion capture projects (including those
using IP-protected amine solvents), the Global CCS Institute and Australia’s Commonwealth Scientifi c Industrial Research
Organisation (CSIRO) are undertaking a site-based peer-reviewed amine solvent post-combustion carbon capture case study –
using results from the Loy Yang Power Station in Victoria – to assist in the development of a regulatory framework or standard
and in development of best practices using a well described amine-based post-combustion capture process.
NEED FOR CAPTURE FROM GAS-FIRED POWER GENERATION
The emphasis in capture from power plants has been on coal, but there is an increasing recognition that CCS will have to be
applied to natural gas fi red plants as well.
The renewed focus on unconventional gas, such as coal seam gas and shale gas, will mean that there will be a greater use
of gas, and for longer. This has two implications for CO2 emissions. Firstly, more gas processing plants will be constructed
producing high CO2 fl ue gases, and secondly more gas turbines will be built for power generation. Capture from gas turbines
has not received much attention due to the low concentration of CO2 in the fl ue gases when using natural gas. Nevertheless, if
the desired levels of atmospheric CO2 are to be achieved by 2050, CCS will have to be applied to gas-fi red power plants as well
as those using coal.
In a recent report on carbon capture from gas-fi red power generation, it was established that adding post-combustion capture
reduces the thermal effi ciency of a natural gas combined cycle plant by 7–8 per cent, increases the capital cost by about
80–120 per cent, and increases the cost of electricity by about 30–40 per cent (IEAGHG 2012a).
Recycling part of the cooled fl ue gas to the gas turbine compressor inlet would increase the CO2 concentration in the feed to
the CO2 capture unit, which could increase the thermal effi ciency by about 0.3 per cent and reduce the cost of electricity by
up to 8 per cent. IEAGHG has acknowledged that this study could be extended to assess a combination of high-effi ciency
proprietary solvents and fl ue gas recycling (IEAGHG 2012a).

T H E G L O B A L S TAT U S O F C C S : 2 0 1 2114
6.4
MOVING TOWARDS COMMERCIAL-SCALE DEMONSTRATIONThere are some developments underway that will make capture more effi cient. These include the demonstration plants
mentioned above where different capture technologies are being investigated. Other ways to improve capture include
improving energy effi ciency of the host power station and/or adopting novel capture processes.
Effi ciency improvements for conventional coal-fi red power plantsA major contribution to the reduction of CO
2 from fossil-based plants will be achieved through increases in the effi ciency of the
basic technologies of pulverised coal combustion and combustion (gas) turbines. The impact of effi ciency improvements on
CO2 emissions is substantial. A 2 per cent effi ciency gain yields a 5 per cent CO
2 reduction (Global CCS Institute 2012a).
Considerable work is underway to develop and qualify advanced materials for use in new conventional pulverised coal
combustion power plants that will enable the use of ultra-supercritical steam conditions with higher temperatures (up to 700–
750°C) and pressures (up to 350 bar). Furthermore, one of the greatest improvements to the overall IGCC technology is the
development of high-fi ring-temperature larger gas turbines of higher effi ciency. These improvements will lead to higher plant
effi ciencies and lower CO2 emissions per MWh (Global CCS Institute 2012a). These type of effi ciency improvements generate
‘no regrets’ from a carbon capture perspective in that they do not make the task of carbon capture more diffi cult.
However, other effi ciency improvement options for conventional pulverised coal combustion power plants, such as those which
recover low-grade heat previously lost to the atmosphere, may actually make the task of (post-combustion) carbon capture
more diffi cult – as the (post-combustion) carbon capture systems may rely on these sources of low-grade heat for solvent
regeneration. Other sources of heat would therefore be required from the host plant, the use of which would then result in
overall lower effi ciencies.
Conventional pulverised coal combustion power plants, which utilise the Rankine thermodynamic cycle for producing power,
have an effective upper limit of thermal effi ciency. For example, measures for effi ciency enhancement currently being
considered would result in a net effi ciency of just over 50 per cent Lower Heating Value basis (or 48 per cent Higher Heating
Value basis) without carbon capture (Meier 2012). However, for such a facility, there would be virtually no low-grade heat
available for use in regeneration of (post-combustion) carbon capture solvents. The net thermal effi ciency of such a facility
could be reduced to as low as 35 per cent after retrofi tting with conventional (post-combustion) carbon capture technology.
Power generation technologiesThe substantial thermal effi ciency reductions resulting from incorporation of carbon capture technology to conventional
pulverised coal combustion power plants have led to increased attention being given to investigations examining alternative
fossil fuel-based host power generation technologies. These technologies need to provide high thermal effi ciencies when
coupled with carbon capture.
Two notable examples of alternative host power generation technologies which provide improved fundamentals for carbon
capture are described.
CHEMICAL LOOPING COMBUSTION
Chemical Looping Combustion (CLC) technology is a form of oxyfuel combustion without the use of an air separation plant.
It can be used for combustion of coal for power generation. It relies on the use of paired fl uidised beds (an oxidiser and a
reducer) and the use of a solid oxygen carrier. The reducer exit gas contains almost all of the CO2 generated by the system
and CLC therefore can be said to exhibit ‘inherent carbon capture’, as water vapour can easily be removed from the reducer
exit gas via condensation, leading to a stream of almost pure CO2. The production of a sequestration-ready CO
2 stream
therefore does not require any additional separation units and there is no energy penalty or reduction in power plant effi ciency
(NETL 2008a).
Theoretically, the effi ciency penalty for CO2 capture only comes from the compressors that give the CO
2 stream the right
pressure for subsequent transport and geologic storage.

115C A P T U R E
Analysis of CLC system performance has indicated that the thermal effi ciency of a CLC system can be expected to be over 41
per cent with carbon capture (Global CCS Institute 2012b). The units are expected to be able to start up and then adjust their
power production rate in a similar manner to a conventional pulverised coal combustion power plant.
A key current requirement for CLC is to scale-up the technology. Currently, the largest CLC system being demonstrated is the 1
MWth unit at University of Darmstadt in Germany. Once successful, this will see the technology achieve TRL-5. The test work
in 2012 on this CLC system is seen as being critical to the development of CLC.
DIRECT INJECTION CARBON ENGINE
A Direct Injection Carbon Engine (DICE) power generation unit is based around a large low-speed diesel engine that is fuelled
with micronised refi ned carbon fuel, which is made from coal and water instead of diesel oil.
Analysis of DICE system performance has indicated that the thermal effi ciency of a DICE system can be expected to be
up to 50 per cent with carbon capture (Wibberley 2012). One reason for this is the inherently high effi ciency of the diesel
thermodynamic engine cycle. Another key reason is that a DICE, unlike other power cycles, has large quantities of highly
usable low-grade heat present in cooling streams. This heat can be used to regenerate post-combustion capture solvents
without reducing net power output. For improved post-combustion capture solvent, the quantity of usable low-grade waste heat
is a close match with solvent regeneration requirements. This is a signifi cant advantage compared to applying post-combustion
capture to conventional pulverised coal-fi red plants and to natural gas combined cycle power plants, which both are likely to
experience signifi cant reductions in net power output as a result of the regeneration energy requirements of post-combustion
solvent capture.
This process is currently the subject of RD&D work being undertaken by CSIRO in Australia building on the earlier work done
by the US DOE in 1980–90s. The work is currently at TRL-4.

TRANSPORT
7
7.1A brief introduction to CO
2
transportation 117
7.2CO
2 transportation – status
and new developments 118
7.3Design considerations for CO
2 pipelines 123
7.4CO
2 transportation – synopsis
and outlook 126

117T R A N S P O R T
KEY MESSAGES › CO
2 pipelines are an established technology, both on land and under the sea.
However, the scale of transportation infrastructure and investment required to
enable large-scale deployment of CCS should not be underestimated.
› There is limited CO2 pipeline operation experience outside the US, Canada,
and Norway, and transfer of knowledge to other parts of the world is
important to accelerate the deployment of CCS globally.
› The development of so called ‘trunk lines’, or LSIPs with spare CO2 transport
capacity, lowers the barriers of entry for other CCS projects and may lead to
the establishment of integrated CCS networks in the future.
› CO2 pipelines and ships pose no higher risk than that which is already
safely managed for transporting hydrocarbons (such as natural gas and oil).
International standards are currently being developed to further promote safe
and effi cient operation of CO2 infrastructure.
7.1
A BRIEF INTRODUCTION TO CO2 TRANSPORTATION
Safely and reliably transporting CO2 from where it is captured to a storage site is an important stage in the CCS process.
Transportation of CO2 is already a reality, occurring daily in many parts of the world.
Pipelines are – and are likely to continue to be – the most common method of transporting the very large quantities of CO2
involved in CCS. There are already millions of kilometres of pipelines around the world that transport various gases,
including CO2.
Transport of smaller volumes of CO2 is currently undertaken by truck and rail for industrial and food grade CO
2. The cost of
transportation by truck or train is relatively high per tonne of CO2. For the large volume of CO
2 that would be captured via
CCS, it is much cheaper to transport by pipeline, so it is unlikely that truck and rail transport will have a signifi cant role in CCS
except for small pilot projects.
Ship transportation can be an alternative option for many regions of the world. Shipment of CO2 already takes place on a small
scale in Europe, where ships transport food-quality CO2 (around 1000 tonnes) from large point sources to coastal distribution
terminals. Larger-scale shipment of CO2, with capacities in the range of 10,000 to 40,000 m3, is likely to have much in
common with the shipment of liquefi ed petroleum gas (LPG), an area in which there is already a great deal of expertise and
which has developed into a worldwide industry over a period of 70 years.
As discussed in the cost section of this report, when looking at all the components of an integrated CCS project, the
transportation aspect of the project contributes only a small proportion of the total cost compared to capture, compression, and
storage. Even though the cost share of CO2 transportation may be in the order of 2–5 per cent of the total CCS facility, they are
still signifi cant in the demonstration phase with US$2–7 per tonne of CO2 for transportation distances under 200 km. Studies
undertaken by ElementEnergy (2010a) and ZEP (2011) also suggest that, over time, when CCS hubs or clusters have emerged
(as opposed to point-to-point projects), a signifi cant reduction in total transportation distance and costs may be achieved.
The existing experience with CO2 transportation may have led to a general perception among the CCS community that CO
2
transport is not considered a major barrier to the deployment of CCS. While in general this may be true, this component of the
CCS chain requires careful consideration in design and operation. Before discussing these, this chapter will fi rst outline the
status and new developments of CO2 transportation infrastructure, including the emerging CCS hubs, clusters, and networks.
Photo
court
esy
of D
enbury
Reso
urc
es
Inc.

T H E G L O B A L S TAT U S O F C C S : 2 0 1 2118
7.2
CO2 TRANSPORTATION — STATUS AND
NEW DEVELOPMENTS CO
2 pipelines and ships form an essential element in the deployment of CCS technologies. The total transportation distance
covered (or to be covered) by the 75 LSIPS currently under development and in operation is around 9000 km. More than
70 per cent of these projects are looking to use onshore pipelines, in particular in the US and Canada (Figure 56). This
planned infrastructure development is approximately 1.5 times the size of the existing network of dedicated CO2 EOR pipelines
presently available in the US.
Offshore pipelines are mainly considered by projects in Europe, in particular in the Netherlands, Norway, and the UK. In these
countries projects are looking to transport their CO2 via pipeline or ship to various offshore storage locations in the North Sea.
The only offshore pipeline for CO2 currently in use is part of the Snøhvit project (Norway), which has been operational since
2008 and covers some 153 km linking Hammerfest to the Snøhvit fi eld under the Barents Sea. Further CO2 transportation by
pipeline in Europe occurs in the Netherlands, with approximately 85 km of pipeline supplying 300 kt per annum of gaseous
CO2 to greenhouses, as well as other pipelines in Hungary, Croatia, and Turkey for EOR (Buit et al. 2011).
FIGURE 56 Pipeline transportation distances provided by LSIPs
0 2 4 6 8 10 12 14
Australia and New Zealand
Europe
United States
Australia and New Zealand
MENA
Europe
China
Canada
United States
Onsh
ore
to
off
shore
pip
eline
Onsh
ore
to o
nsh
ore
pip
eline
Number of projects
251–400 km >400 km 151–250 km
101–150 km 51–100 km ≤ 50 km
As mentioned above, there is signifi cant experience with CO2 pipeline development and operation in North America. There are
36 CO2 pipelines currently operating in the US alone, transporting 48–58 Mtpa of CO
2 in 2010 (DiPietro and Balash 2012).
These onshore pipelines around 6500 km in length and deliver mainly naturally sourced CO2 for EOR purposes, as opposed to
captured anthropogenic CO2. Six of these pipelines cross provincial/state boundaries and one crosses an international border
into Canada (Interstate Oil and Gas Compact Commission 2010).
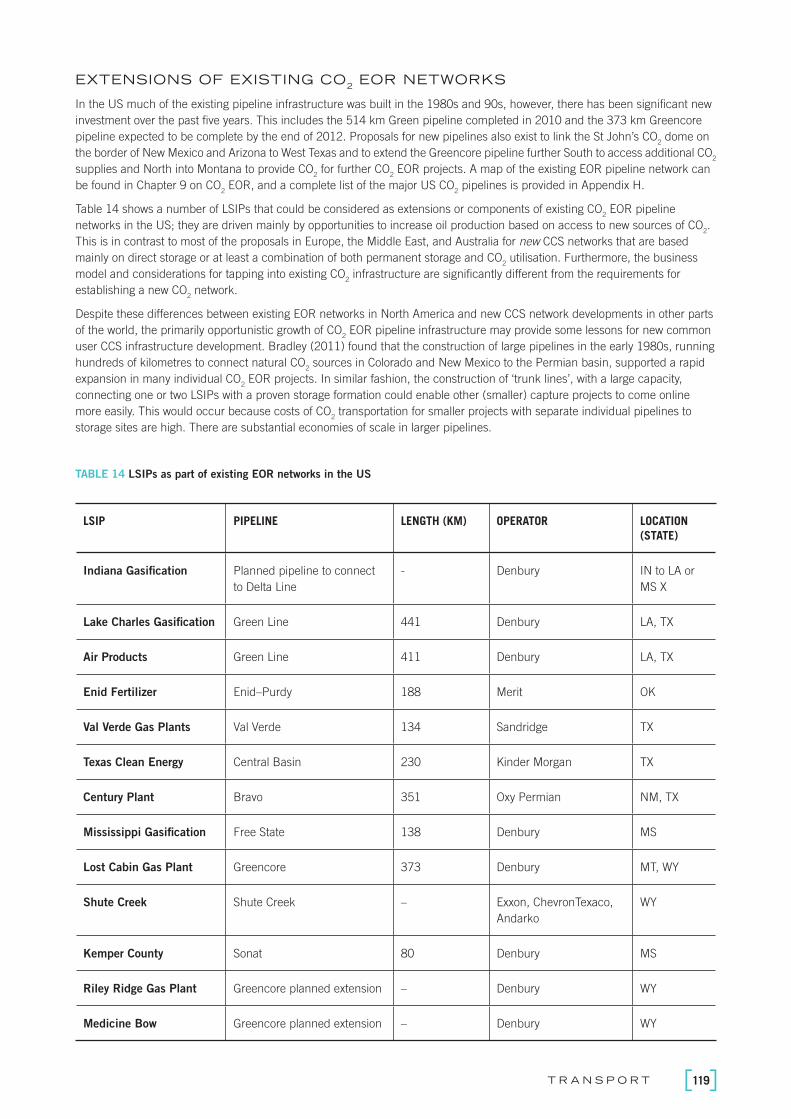
119T R A N S P O R T
EXTENSIONS OF EXISTING CO2 EOR NETWORKS
In the US much of the existing pipeline infrastructure was built in the 1980s and 90s, however, there has been signifi cant new
investment over the past fi ve years. This includes the 514 km Green pipeline completed in 2010 and the 373 km Greencore
pipeline expected to be complete by the end of 2012. Proposals for new pipelines also exist to link the St John’s CO2 dome on
the border of New Mexico and Arizona to West Texas and to extend the Greencore pipeline further South to access additional CO2
supplies and North into Montana to provide CO2 for further CO
2 EOR projects. A map of the existing EOR pipeline network can
be found in Chapter 9 on CO2 EOR, and a complete list of the major US CO
2 pipelines is provided in Appendix H.
Table 14 shows a number of LSIPs that could be considered as extensions or components of existing CO2 EOR pipeline
networks in the US; they are driven mainly by opportunities to increase oil production based on access to new sources of CO2.
This is in contrast to most of the proposals in Europe, the Middle East, and Australia for new CCS networks that are based
mainly on direct storage or at least a combination of both permanent storage and CO2 utilisation. Furthermore, the business
model and considerations for tapping into existing CO2 infrastructure are signifi cantly different from the requirements for
establishing a new CO2 network.
Despite these differences between existing EOR networks in North America and new CCS network developments in other parts
of the world, the primarily opportunistic growth of CO2 EOR pipeline infrastructure may provide some lessons for new common
user CCS infrastructure development. Bradley (2011) found that the construction of large pipelines in the early 1980s, running
hundreds of kilometres to connect natural CO2 sources in Colorado and New Mexico to the Permian basin, supported a rapid
expansion in many individual CO2 EOR projects. In similar fashion, the construction of ‘trunk lines’, with a large capacity,
connecting one or two LSIPs with a proven storage formation could enable other (smaller) capture projects to come online
more easily. This would occur because costs of CO2 transportation for smaller projects with separate individual pipelines to
storage sites are high. There are substantial economies of scale in larger pipelines.
TABLE 14 LSIPs as part of existing EOR networks in the US
LSIP PIPELINE LENGTH (KM) OPERATOR LOCATION
(STATE)
Indiana Gasifi cation Planned pipeline to connect
to Delta Line
- Denbury IN to LA or
MS X
Lake Charles Gasifi cation Green Line 441 Denbury LA, TX
Air Products Green Line 411 Denbury LA, TX
Enid Fertilizer Enid–Purdy 188 Merit OK
Val Verde Gas Plants Val Verde 134 Sandridge TX
Texas Clean Energy Central Basin 230 Kinder Morgan TX
Century Plant Bravo 351 Oxy Permian NM, TX
Mississippi Gasifi cation Free State 138 Denbury MS
Lost Cabin Gas Plant Greencore 373 Denbury MT, WY
Shute Creek Shute Creek – Exxon, ChevronTexaco,
Andarko
WY
Kemper County Sonat 80 Denbury MS
Riley Ridge Gas Plant Greencore planned extension – Denbury WY
Medicine Bow Greencore planned extension – Denbury WY

T H E G L O B A L S TAT U S O F C C S : 2 0 1 2120
CO2 hubs, clusters, and transportation networks
The initial demand for additional CO2 transportation capacity will likely unfold in an incremental and geographically dispersed
manner as new dedicated capture plants, storage and EOR facilities are brought online. Large-scale deployment of CCS is
likely to result in the linking of proximate CO2 sources, through a hub, to clusters of sinks, either by ship or so-called ‘back
bone’ pipelines. For example, the 240 km Alberta Carbon Trunkline in Canada is designed to accommodate about 14 Mtpa of
CO2 (in a dense phase) for EOR purposes. The initial CO
2 will be captured from the existing Agrium fertiliser plant and a new oil
sands upgrader operated by Northwest. Other sources for this pipeline could develop from the Alberta Heartland, which is host
to petrochemical and refi ning industries.
While hubs, clusters, and networks are terms used somewhat interchangeably, in examining their use in describing projects
some subtle differences become apparent:
A CO2 cluster may refer to a grouping of individual CO
2 sources, or to storage sites such as multiple fields within a region.
The Permian Basin in the US has several clusters of oilfields undergoing CO2 EOR fed by a network of pipelines.
A CO2 hub collects CO
2 from various emitters and redistributes it to single or multiple storage locations. For example, the
South West CO2 Geosequestration Hub project in Western Australia seeks to collect CO
2 from various sources in the
Kwinana and Collie industrial areas for storage in the Lesueur formation in the Southern Perth Basin (Figure 57).
A CO2 network is an expandable collection and transportation infrastructure providing access for multiple emitters. For
instance, the CO2Europipe project has developed a roadmap towards a Europe-wide infrastructure network for the transport
and storage of CO2 (Neele et al. 2011).
FIGURE 57 Schematic overview of the South West Hub in Western Australia
The incentives for CCS projects to be developed as part of a hub, cluster, or network include economies of scale (lower per
unit costs for constructing and operating CO2 pipelines); these costs are lower than can be achieved with stand-alone projects
where each CO2 point source has its own independent and smaller scale transportation or storage requirement. A coordinated
network approach can also lower the barriers of entry for all participating CCS projects, including for emitters, that don’t have
to develop their own separate transportation and storage solutions.
Source: Government of Western Australia (2011).

121T R A N S P O R T
Benefi ts and opportunities of integrated network projects are not linked only to economies of scale or technical performance
of the transportation network. Network projects can also minimise and streamline efforts in relation to planning and regulatory
approvals, negotiations with landowners, and public consultations. For example, a progress report from the South West
Hub in Western Australia cites the long lead times associated with obtaining a range of licenses, permits, and approvals for
land access rights associated with constructing and operating CO2 pipelines and highlights the importance of a coordinated
approach (Government of Western Australia 2011). Figure 57 displays a schematic overview of the planned pipeline route.
PROPOSALS FOR NEW CO2 CLUSTERS AND HUBS
For new CO2 network initiatives, an important distinction should be made between ‘overarching’ initiatives (a network that
might emerge over time from integrating multiple CCS projects) and ‘anchor’ LSIPs (which might be the fi rst phase of some
of these broader and longer-term network initiatives). For example, the South Yorkshire and Humber CCS Cluster in the UK is
designed around capture of CO2 from the fossil fuel fi red power plants and other industrial sources in the region with geologic
storage in reservoirs of the southern North Sea. The long-term aim of the cluster is to capture around 40–60 Mtpa of the
CO2, representing approximately 10 per cent of the UK’s annual CO
2 emissions. There is also a parallel focus in the region
for advancing three anchor LSIPs within this network that when combined will capture up to 10 Mtpa CO2 by 2020 from
the proposed White Rose oxyfuel project, 2Co’s Don Valley IGCC Project, and C.Gen’s North Killingholme project. Table 15
provides an overview of such anchor LSIPs and their relation to the proposed integrated networks in various parts of the world.
Storage options for the Humber Cluster, while preliminary, are being evaluated by National Grid Carbon and include saline
reservoirs and oil and gas reservoirs. In parallel, 2Co are working with Talisman Energy on CO2 EOR and CO
2 storage in
the North Sea.
TABLE 15 CO2 network initiatives related to CCS
CO2 NETWORK PROPOSALS FOR CCS DESCRIPTION AND ANCHOR LSIPS (HIGHLIGHTED IN BOLD)
Rotterdam CO2 Hub
(The Netherlands)
The Rotterdam CO2 Hub aims to capture and store 5 Mtpa of CO
2 from anchor projects like
ROAD, as well as the Green Hydrogen and Pegasus projects by 2015, expanding to 20 Mtpa in
2020–25 and providing the basis for low-carbon industrial and economic growth in Rotterdam.
Humber Cluster
(United Kingdom)
The Humber and Yorkshire region has the long-term potential to capture and store upwards
of 40 Mtpa CO2 from numerous sources. Anchor projects include the White Rose Oxy-fuel
project, the Don Valley Power Project, and C.Gen’s North Killingholme project.
Teesside Cluster
(United Kingdom)
The cluster in the Teesside region would capture and store up to 15 Mtpa CO2 from the
Teesside Low Carbon project (formerly Eston Grange), an aluminium smelter, and emissions
from other surrounding industries.
Scottish CCS Cluster
(United Kingdom)
The Caledonia Clean Energy Project could accelerate the development of a Scottish CCS
Cluster. The CO2 captured in the Firth of Forth area will be transported by pipeline to the St
Fergus terminal in close proximity to SSE’s Peterhead project, where CO2DeepStore will store it
in depleted reservoirs under the North Sea.
Southwest Hub
(Australia)
The South West CO2 Geosequestration Hub project in Western Australia seeks to collect up to
5–6 Mtpa of CO2 by 2018–22 from industrial processes, including the Perdaman Collie Urea
project, as well as from alumina production and power facilities for storage in the Lesueur
formation in the Southern Perth Basin.
CarbonNet Project
(Australia)
The CarbonNet CCS network aims to integrate multiple CCS projects across the entire CCS
value chain within the next 10 years. The network is initially sized to capture and store around
1 Mtpa of CO2 from power stations in the Latrobe Valley by 2018, with the potential to rapidly
scale up to support over 20 Mtpa thereafter.
Masdar CCS Project
(United Arab Emirates)
The Abu Dhabi CCS network (Masdar) aims at capturing existing CO2 emissions from power
and industrial sites as well as developing a network of CO2 pipelines to transport the CO
2 to Abu
Dhabi's oil reservoirs for EOR. Anchor projects include: Emirates Steel Industries (ESI) CCS
Project, Emirates Aluminium CCS Project, and Hydrogen Power Abu Dhabi (HPAD).
Alberta Carbon Trunk Line
(Canada)
The Alberta Carbon Trunk Line will be a 240 km pipeline constructed by Enhance Energy
to initially collect captured CO2 from the Agrium Fertilizer plant and Northwest Heavy Oil
Upgrader for distribution for EOR or storage in geologic reservoirs.
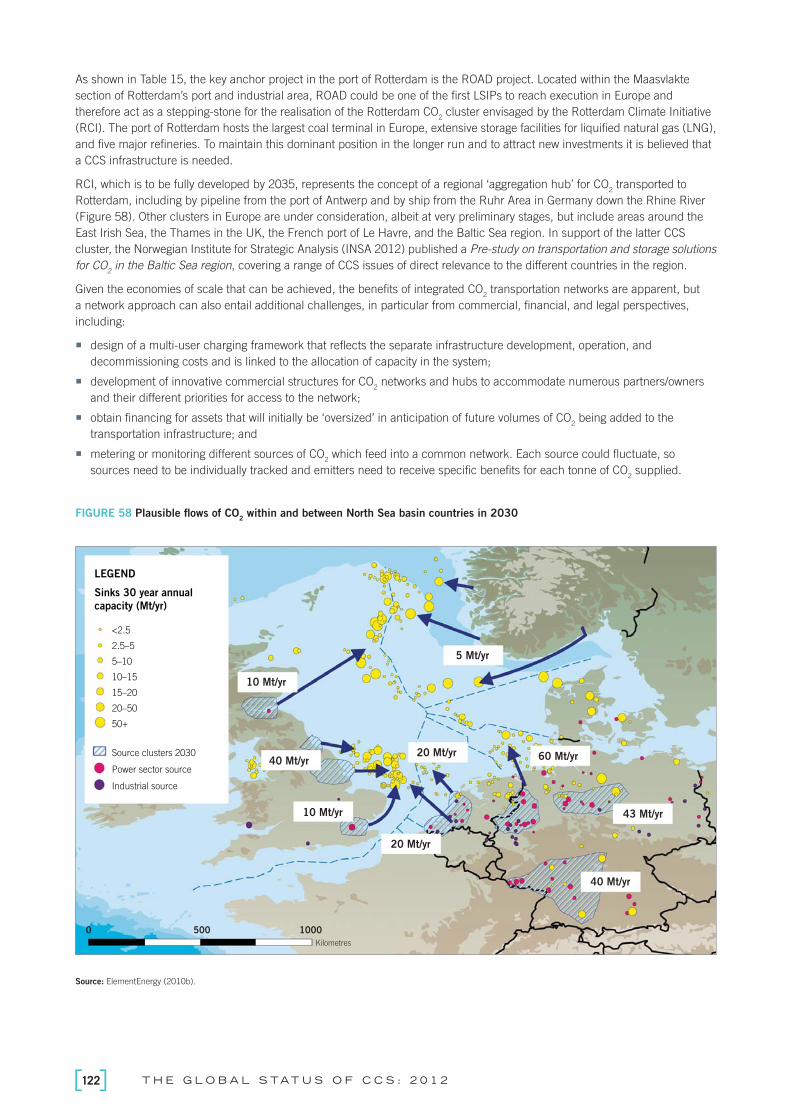
T H E G L O B A L S TAT U S O F C C S : 2 0 1 2122
As shown in Table 15, the key anchor project in the port of Rotterdam is the ROAD project. Located within the Maasvlakte
section of Rotterdam’s port and industrial area, ROAD could be one of the fi rst LSIPs to reach execution in Europe and
therefore act as a stepping-stone for the realisation of the Rotterdam CO2 cluster envisaged by the Rotterdam Climate Initiative
(RCI). The port of Rotterdam hosts the largest coal terminal in Europe, extensive storage facilities for liquifi ed natural gas (LNG),
and fi ve major refi neries. To maintain this dominant position in the longer run and to attract new investments it is believed that
a CCS infrastructure is needed.
RCI, which is to be fully developed by 2035, represents the concept of a regional ‘aggregation hub’ for CO2 transported to
Rotterdam, including by pipeline from the port of Antwerp and by ship from the Ruhr Area in Germany down the Rhine River
(Figure 58). Other clusters in Europe are under consideration, albeit at very preliminary stages, but include areas around the
East Irish Sea, the Thames in the UK, the French port of Le Havre, and the Baltic Sea region. In support of the latter CCS
cluster, the Norwegian Institute for Strategic Analysis (INSA 2012) published a Pre-study on transportation and storage solutions
for CO2 in the Baltic Sea region, covering a range of CCS issues of direct relevance to the different countries in the region.
Given the economies of scale that can be achieved, the benefi ts of integrated CO2 transportation networks are apparent, but
a network approach can also entail additional challenges, in particular from commercial, fi nancial, and legal perspectives,
including:
design of a multi-user charging framework that reflects the separate infrastructure development, operation, and
decommissioning costs and is linked to the allocation of capacity in the system;
development of innovative commercial structures for CO2 networks and hubs to accommodate numerous partners/owners
and their different priorities for access to the network;
obtain financing for assets that will initially be ‘oversized’ in anticipation of future volumes of CO2 being added to the
transportation infrastructure; and
metering or monitoring different sources of CO2 which feed into a common network. Each source could fluctuate, so
sources need to be individually tracked and emitters need to receive specific benefits for each tonne of CO2 supplied.
FIGURE 58 Plausible fl ows of CO2 within and between North Sea basin countries in 2030
LEGEND
Sinks 30 year annual
capacity (Mt/yr)
<2.5
2.5–5
5–10
10–15
15–20
20–50
50+
Source clusters 2030
Power sector source
Industrial source
10005000
Kilometres
10 Mt/yr
5 Mt/yr
20 Mt/yr40 Mt/yr
10 Mt/yr
20 Mt/yr
60 Mt/yr
43 Mt/yr
40 Mt/yr
Source: ElementEnergy (2010b).

123T R A N S P O R T
7.3
DESIGN CONSIDERATIONS FOR CO2 PIPELINES
Pipeline engineering is a mature profession. However, for the specifi c fi eld of CO2 transportation, there are a number of issues
that need to be taken into account. With more projects completing their FEED studies, further insights are being created
among the key design considerations of CO2 infrastructure – see for example the FEED study of the CO
2 transport pipeline for
the Jänschwalde project in Germany (Vattenfall 2012), the American Electric Power Mountaineer Project FEED (AEP 2012),
and the FEED close-out studies created by the ScottishPower CCS Consortium that focuses on CO2 pipelines (ScottishPower
CCS Consortium 2011). In addition, a series of interviews with CCS project engineers and CO2 pipeline operators has been
undertaken by the Global CCS Institute to discuss the main design considerations for CO2 transportation infrastructure. For
pipeline transportation system design the following data is generally required:
1. pipeline route, profi le, and depth of cover;
2. maximum and minimum inlet, operating, and delivery temperatures/pressures;
3. ground/environment temperature;
4. pipe material/grade, diameter, wall thickness, and roughness;
5. piping pressure loss through compression, pumping, and measurement stations;
6. CO2 mixture properties (level of impurities) and density/pressure changes;
7. pipeline fl ow and fl ow build-up;
8. cost data of materials and labour; and
9. applicable codes, standards, and regulations.
Items 6–9 are considered to be of special importance when designing CO2 pipelines (compared to standard practices around
the transportation of hydrocarbons) and are discussed in more detail below.
CO2 composition and phase changes
For most of the LSIPs in the US that are seeking entry into existing CO2 EOR pipeline systems, design specifi cations are
controlled in terms of conditions, temperature, and pressure as well as composition (see Table 16). However, there are
signifi cant differences between the US experience with CO2 EOR pipelines (mainly dealing with naturally occurring CO
2), and
the expertise needed to design transport systems for anthropogenic CO2. The composition of CO
2 that is captured from power
plants, for instance, will infl uence the hydraulics calculations that are needed to design these pipelines.
TABLE 16 CO2 composition specifi cations for CO
2 EOR pipelines in the US and expected CO
2 compositions from CO
2 capture
COMPONENT KINDER MORGAN
CO2 PIPELINE
SPECS
DENBURY CO2
PIPELINE SPECS
CANYON REEF
CARRIERS CO2
SPECS
POST-
COMBUSTION
PRE-
COMBUSTION
OXYFUEL
COMBUSTION
CO2
≥95% ≥95% ≥95% >99% >95.6% >90%
Water 0.064% 0.047% 0.064% 0.14% 0.14% 0.14%
H2S 0.00127–
0.0254%
0.0015% <0.19% trace <3.4% trace
N2
≤4% ≤4% ≤4% <0.17% <0.6% <7%
CH4
≤5% ≤5% ≤5% <0.01% <0.035% –
O2
≤0.00136% – ≤0.00136% <0.01% trace <3%
continued on page 124

T H E G L O B A L S TAT U S O F C C S : 2 0 1 2124
Source: Global CCS Institute’s 2011/12 project survey and Mohitpour et al. (2011).
Impurities or by-products such as nitrogen, argon, methane, and hydrogen lower the density of a CO2 stream, resulting in
a higher pressure drop. The critical pressure will also increase, meaning that higher pressures are needed to prevent the
occurrence of what is known as a two-phase fl ow (i.e. gas and liquid CO2). Hydrogen especially has a signifi cant infl uence on
this. Moreover, combinations of impurities (e.g. from different sources) could together raise the critical pressure more than
that from one component in isolation. The characteristics of CO2 with impurities are therefore vitally important to know in order
to properly engineer a CO2 transport system. Detailed thermodynamics of CO
2 with impurities has been modelled, but the
available models need to be further validated.
Pipeline fl ow and fl ow build-upSimilar to modelling of the effects on impurities on the phase behaviour of the CO
2 stream, pressure changes in CO
2 from
intermittent sources need to be very carefully managed to avoid two-phase fl ows of CO2. Intermittency has not been a
signifi cant issue for existing CO2 EOR pipelines where fl ow is relatively uniform, but it requires careful examination for projects
using CO2 from power plants and other industrial sources that may operate with variable and irregular capture rates. Minimum
pressures of CO2 gas and start-up or shut-down procedures of the capture plant need to be carefully understood to avoid
potentially damaging transportation equipment. Moreover, fl ow assurance models need to take into account the pressure and
temperature needed at the wellhead, since for safety and operational reasons the CO2 to be injected must have about the same
pressure and temperature as the reservoir.
CO2 transportation costs
As mentioned in the introduction of this chapter, CO2 transportation costs may be in the order of 2–5 per cent of the
investments needed for a complete CCS facility. However, they are still signifi cant in the demonstration phase (with US$2–7
per tonne of CO2 for transportation distances under 200 km) and are therefore considered to be an important element of every
CO2 pipeline system design. There are a number of well-defi ned approaches for estimating the cost of pipelines; in essence,
they all identify three major cost components. These are:
construction (e.g. materials, labour, equipment, design, land acquisition, insurance, project management);
annual operational and maintenance costs (e.g. labour, maintenance, fuel costs); and
end of project life abandonment costs.
The costs for CO2 transportation may differ on a project-by-project basis, due to a number of factors like the expected volumes
of CO2 available and the corresponding optimal pipe diameters; the cost of labour in the local market; the expected economic
lifetime of the infrastructure; as well as the type of terrain along the pipeline route. Pipeline construction through diffi cult
terrain (e.g. on the seabed) can be costly not only in terms of additional materials (e.g. isolation layers), but also in relation
to the offshore equipment that needs to be hired to lay a pipe under the sea. The most important cost factors in constructing
a pipeline are related to the materials used. For example, material costs (such as carbon steel) can account for as much as
15–35 per cent of the pipeline cost (ZEP 2011).
COMPONENT KINDER MORGAN
CO2 PIPELINE
SPECS
DENBURY CO2
PIPELINE SPECS
CANYON REEF
CARRIERS CO2
SPECS
POST-
COMBUSTION
PRE-
COMBUSTION
OXYFUEL
COMBUSTION
CO – – – <0.001% <0.4% <trace
NOx – – – <0.005% – <0.25%
SOx – – – <0.001% – <2.5%
H2
– – – trace <3% <trace
Ar – – – trace <0.05% <5%
continued from page 123
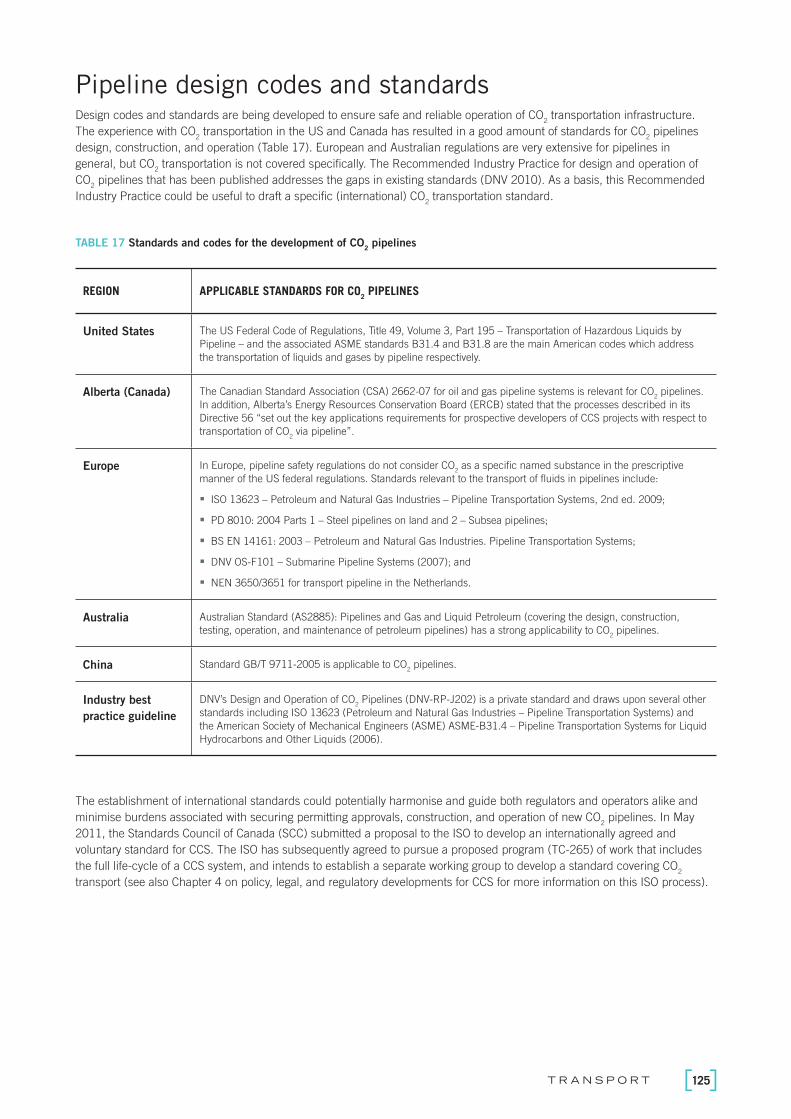
125T R A N S P O R T
Pipeline design codes and standards Design codes and standards are being developed to ensure safe and reliable operation of CO
2 transportation infrastructure.
The experience with CO2 transportation in the US and Canada has resulted in a good amount of standards for CO
2 pipelines
design, construction, and operation (Table 17). European and Australian regulations are very extensive for pipelines in
general, but CO2 transportation is not covered specifi cally. The Recommended Industry Practice for design and operation of
CO2 pipelines that has been published addresses the gaps in existing standards (DNV 2010). As a basis, this Recommended
Industry Practice could be useful to draft a specifi c (international) CO2 transportation standard.
TABLE 17 Standards and codes for the development of CO2 pipelines
REGION APPLICABLE STANDARDS FOR CO2 PIPELINES
United States The US Federal Code of Regulations, Title 49, Volume 3, Part 195 – Transportation of Hazardous Liquids by
Pipeline – and the associated ASME standards B31.4 and B31.8 are the main American codes which address
the transportation of liquids and gases by pipeline respectively.
Alberta (Canada) The Canadian Standard Association (CSA) 2662-07 for oil and gas pipeline systems is relevant for CO2 pipelines.
In addition, Alberta’s Energy Resources Conservation Board (ERCB) stated that the processes described in its
Directive 56 “set out the key applications requirements for prospective developers of CCS projects with respect to
transportation of CO2 via pipeline”.
Europe In Europe, pipeline safety regulations do not consider CO2 as a specifi c named substance in the prescriptive
manner of the US federal regulations. Standards relevant to the transport of fl uids in pipelines include:
ISO 13623 – Petroleum and Natural Gas Industries – Pipeline Transportation Systems, 2nd ed. 2009;
PD 8010: 2004 Parts 1 – Steel pipelines on land and 2 – Subsea pipelines;
BS EN 14161: 2003 – Petroleum and Natural Gas Industries. Pipeline Transportation Systems;
DNV OS-F101 – Submarine Pipeline Systems (2007); and
NEN 3650/3651 for transport pipeline in the Netherlands.
Australia Australian Standard (AS2885): Pipelines and Gas and Liquid Petroleum (covering the design, construction,
testing, operation, and maintenance of petroleum pipelines) has a strong applicability to CO2 pipelines.
China Standard GB/T 9711-2005 is applicable to CO2 pipelines.
Industry best
practice guideline
DNV’s Design and Operation of CO2 Pipelines (DNV-RP-J202) is a private standard and draws upon several other
standards including ISO 13623 (Petroleum and Natural Gas Industries – Pipeline Transportation Systems) and
the American Society of Mechanical Engineers (ASME) ASME-B31.4 – Pipeline Transportation Systems for Liquid
Hydrocarbons and Other Liquids (2006).
The establishment of international standards could potentially harmonise and guide both regulators and operators alike and
minimise burdens associated with securing permitting approvals, construction, and operation of new CO2 pipelines. In May
2011, the Standards Council of Canada (SCC) submitted a proposal to the ISO to develop an internationally agreed and
voluntary standard for CCS. The ISO has subsequently agreed to pursue a proposed program (TC-265) of work that includes
the full life-cycle of a CCS system, and intends to establish a separate working group to develop a standard covering CO2
transport (see also Chapter 4 on policy, legal, and regulatory developments for CCS for more information on this ISO process).

T H E G L O B A L S TAT U S O F C C S : 2 0 1 2126
7.4
CO2 TRANSPORTATION – SYNOPSIS AND OUTLOOK
Safely and reliably transporting CO2 from where it is captured to a storage site is an important stage in the CCS process.
Transportation of CO2 and other gases is already a reality, occurring daily in many parts of the world. The total transportation
distance that would be covered by the 75 LSIPs currently under development and in operation is around 9000 km. More than
80 per cent of these projects are looking to utilise onshore pipelines, in particular in the US and Canada, where a wealth of
experience in CO2 transportation already exists.
The growth of a CO2 EOR pipeline infrastructure in North America over the past decades may provide some important lessons
for new common user CCS infrastructure development. The construction of so called ‘trunk lines’ connecting one or two LSIPs
with a proven storage formation could enable subsequent (smaller) projects to come online more easily. In order to better
facilitate the development of this new CO2 transportation infrastructure, there are a few areas that require further attention,
including:
development of appropriate (international) standards and design codes to further promote safe and efficient operation of
CO2 transport infrastructure;
development of innovative financial and commercial structures for CO2 networks and hubs to:
accommodate numerous partners and their priority access within a network;
obtain fi nancing for assets that will initially be ‘oversized’ in anticipation of future volumes of CO2 being added
to the network;
validation of detailed thermodynamic modelling of CO2 streams containing impurities.
Most of the items listed above in relation to the development of CO2 transport infrastructure have been met by other major
transport infrastructure programs. Notably, integrated transport networks have been fi nanced and constructed in virtually every
country to move fl uids, solids, or waste materials safely.
Opposite: Atmospheric testing. Photo courtesy of CO2CRC.

8STORAGE
8.1Introduction 129
8.2Overview of storage 129
8.3Storage challenges 140
8.4Progressing storage projects 143

129S T O R A G E
KEY MESSAGES › Large-scale injection and geological storage of CO
2 has been safely performed
in saline reservoirs for more than 15 years and in oil and gas reservoirs
for decades.
› Current storage projects have developed and demonstrated comprehensive
and thorough approaches to site management and monitoring.
› The majority of perceived risk in CCS projects is often associated with storage.
› It is important therefore that storage site selection and characterisation begin
with the initial concept of a CCS project.
› More effort is needed to foster storage deployment globally, particularly in
non-OECD countries. Interest is increasing in the role CO2 EOR may have
toward benefi ting CCS.
8.1
INTRODUCTIONInjection of CO
2 into sandstones of the Utsira Formation in the North Sea began in 1996 as part of Statoil’s Sleipner
Project which has now stored over 13 Mt CO2. In Algeria, the In Salah Gas Project has been injecting CO
2 into the Krechba
Formation since 2004 with over 4 Mt CO2 stored. These projects have used a wide range of monitoring techniques and have
demonstrated that it is possible to safely manage the injection of CO2 into geologic reservoirs. Oil companies have been
injecting CO2 into ageing oil fi elds to enhance the recovery of oil (CO
2 EOR) since the 1970s, and there are now more than
130 such operations, mainly in North America. Most companies, for economic reasons, recycle the injected CO2 which results
in the CO2 being effectively stored permanently within the oil reservoir. The Weyburn Oil Field in Saskatchewan, Canada, for
example, has now stored in excess of 18 Mt CO2. Thus the technologies and operational aspects of injecting and storing CO
2
in geologic formations are established processes. Storing CO2 captured from industrial processes in geologic formations is also
the component in the CCS chain that presents some of the greatest project challenges. Each geologic storage site is unique
and must be screened and extensively characterised, taking years and millions of dollars before a decision can be made to
proceed with a commercial project. Geologic storage can also represent the most important public perception challenge and
the greatest long-term fi nancial liability associated with a CCS project.
8.2
OVERVIEW OF STORAGE Progress is being made globally in the deployment of large-scale geologic storage of CO
2. For example, injection of CO
2
commenced late in 2011 into a deep saline reservoir at the Illinois Basin – Decatur Project, the fi rst saline injection program
in the US. The fi rst statement of fi tness for purpose and conditional regulatory approval has been awarded to the storage
development plan for Shell’s Quest project, that will proceed with targeting a deep saline reservoir in Alberta, Canada. In
Europe, the ROAD project received a positive opinion by the EC concerning its planned storage site in an offshore depleted
gas fi eld – the fi rst such opinion applied for under the CCS Directive. Additionally, the Peterhead CCS project received an
Photo
court
esy
of C
O2C
RC
.

T H E G L O B A L S TAT U S O F C C S : 2 0 1 2130
agreement for lease of Goldeneye, a depleted gas fi eld 65 miles northeast of the Scottish coast. Advanced evaluation programs
are ongoing in Australia to identify onshore and offshore storage targets in Western Australia, Victoria, and Queensland.
The potential of storing CO2 through EOR as a means of CCS is growing in interest outside of the traditional regions in North
America to areas such as Latin America, the Middle East, and, increasingly, China. Standards regarding geologic storage have
been developed in North America and have undergone the fi rst steps in transitioning to the ISO. Regional assessments that
may help accelerate storage demonstration are in progress in Australia, North America (including Mexico), Brazil, Asia, South
Africa, and Europe.
Ultimately, all types of geologic storage – deep saline reservoirs, depleted oil and gas formations, and CO2 EOR – are needed to
reduce atmospheric emissions of CO2 from industrial processes (Figure 59). The majority of planned and operational projects
are currently in OECD countries, with a signifi cant shortfall in non-OECD regions. To help develop and deploy CCS to the
scale required, more must be done to improve knowledge of the subsurface in the vicinity of large CO2 emitters to improve
development time for future commercial CCS projects.
FIGURE 59 Status of current and planned storage projects
0 5 10 15 20 25 30 35 40 45 50
Identify
Evaluate
Define
Execute
Operate
Potential volume of CO2 (Mtpa)
Offshore depleted oil and gas reservoirs
Not specified
Various storage options being considered
Onshore depleted oil and gas reservoirs Offshore deep saline formations
Onshore deep saline formations Enhanced oil recovery (EOR)
Roadmap TargetsA review of the current global portfolio of operational and announced CO
2 geologic storage projects (Geogreen 2011)
addressed an ambitious challenge to meet internationally stated deployment objectives for CCS projects. Most considerations
of the Global CCS Institute-supported review inclines toward the target envisaged by G8 Leaders in 2008 of having CCS broadly
deployed by 2020, and the 2009 IEA CCS Roadmap goal of 100 projects by 2020. Although the IEA Roadmap is evolving,
there is a signifi cant challenge to identify enough bankable storage sites by 2015–17 so that CCS projects can be operational
by 2020.
Bankable storage sites are those that are suffi ciently advanced in characterisation to support fi nal investment decisions in
advance of site construction, commissioning, and operations. The Geogreen study indicated that it can take between 4–12
years to reach bankable status when evaluating deep saline reservoirs or depleted oil and gas fi elds. Lead times for projects
using CO2 EOR can be much less, as little as 1–3 years, although these opportunities are, at present, more geographically
restricted. Although much of the effort is focused on data acquisition and technical evaluation of a proposed site, the time
related to licensing and addressing environmental regulations is also signifi cant. The availability of legacy geologic information
on the prospective site will have a large infl uence on the time and cost required to reach a fi nal investment decision.
Additionally, the gap from achieving bankable status to commencement of operations (encompassing construction and
commissioning) can be three years or longer. Thus, to reach 2020 deployment targets, storage sites must reach bankable
status around 2015–17.

131S T O R A G E
The Geogreen review examined announced and operational projects involving deep saline formations or depleted oil and gas
fi elds and identifi ed 54 technically feasible bankable candidate sites. Of these, the review suggested 24–30 could potentially
reach bankability status in time to be operational by 2020. Non-technical issues such as funding or public perception, while
not included in this workfl ow, may at least double the failure rate and further reduce the number of bankable sites. Therefore,
the estimated number of bankable sites is optimistic, and while there may be suffi cient deep saline formations or depleted oil
and gas fi eld projects announced to foreshadow broad deployment of commercial-scale operating projects by 2020, achieving
this goal is far from certain. Moreover, the projected number of bankable or operating projects falls far short of the 2009 IEA
Roadmap requirements of 100 projects by 2020.
Including CO2 EOR projects in this portfolio could markedly improve the status of CCS deployment (Figure 60). In this scenario,
however, the CO2 must be anthropogenic and appropriate monitoring procedures to address storage requirements must be
implemented. By considering suitable CO2 EOR projects the number of bankable projects by 2018 increases as much as 75
per cent, with 100 sites potentially operational by 2028. CO2 EOR may also reduce the need for public funding of CCS projects
in the near term, but currently opportunities are mainly within North America although interest is growing in many other
regions including Europe, China, South America, and the Middle East.
FIGURE 60 Ability to meet CCS Roadmap targets
Existing projects EOR Existing non-EOR
Candidates for bankability 2015–2017 Additional stand-by candidates for bankability 2016–17
Potential EOR contribution Proposed additional candidates for bankability 2018–2022
44
4
4
4 4
4
4
4
45
3
4
4
5
1
4
4
9
6
26
4
4
20
11
4
4
4
26
1
16
7
4
4
34
2
21
10
4
4
38
3
26
13
4
4
42
3
26
15
4
4
45
3
26
16
4
4
45
3
26
18 19
4
4
45
3
26
20
0
10
20
30
40
50
60
70
80
90
100
110
2012 2013 2014 2015 2016 2017 2018 2019 2020 2021 2022 2023 2024 2025
Num
ber
of
pro
jects
Source: Geogreen (2011).

T H E G L O B A L S TAT U S O F C C S : 2 0 1 2132
Progress in saline reservoir storage
NORTH AMERICA
In areas of North America, rocks of Cambrian age have emerged as a target of choice for saline reservoir storage projects
including the Illinois Basin – Decatur Project, Shell’s Quest Project in Alberta, and the Aquistore Project in Saskatchewan
that will store CO2 captured from SaskPower’s Boundary Dam coal-fi red power plant. The storage reservoirs chosen by these
projects are in sandstones that accumulated on the submerged margins of the North American craton more than 500 million
years ago (Runkel et al. 2007). The sands formed laterally extensive veneers or blankets over the continental margins and
now are preserved as sandstones within regions such as the Alberta, Williston, Illinois, and Michigan basins. Generally the
sandstones directly overlay dense igneous and metamorphic basement rocks equivalent to the rocks observed at the surface
in the Precambrian or Canadian Shield, and the topography on this surface greatly infl uenced the deposition of the sediments
that are refl ected in their reservoir characteristics today. Because the Cambrian sandstones are generally at the base of
the sedimentary succession they can be overlain by up to several kilometres of sedimentary rocks that commonly contain
abundant seals and barriers to vertical fl uid movement. Their great depth, generally favourable reservoir characteristics, large
estimated storage capacity, numerous seals to retain injected CO2, and general lack of alternative economic use make the
basal Cambrian sandstones highly attractive targets for large-scale storage of CO2.
The potential importance of the Cambrian strata for CO2 storage in parts of North America (Figure 61) has driven a bi-national
study involving characterisation of the Cambro-Ordovician saline aquifer system supported by federal governments of the US
and Canada. The project involves several state and provincial research organisations led by Alberta Innovates–Technology
Futures, the Energy and Environmental Research Center in North Dakota, and several other consortia members. In the
Northern Plains–Prairie Region (that is, the Alberta and Williston basins not including the Illinois and Michigan basins), the
basal Cambrian aquifer system extends over 1.1 million km2. In the deeper parts of the Alberta and Williston basins the
Cambrian aquifer system is more than 4 km deep and salinities can be over 300,000 mg/L (for comparison, the ocean is about
32,000 mg/L). Hauck et al. (2012) estimated the regional-scale storage capacity of this single aquifer at 85 Gt in Canada
alone, with the potential to support other large-scale storage projects in addition to Quest and Aquistore.
FIGURE 61 Distribution of Cambrian sedimentary rocks in North America
Facies belt
IBDP and Illinois ICCS
Quest
Aquistore
Inner Detrital
Medial Carbonate
Distal Detrital
Source: Modifi ed after Runkel et al. (2007).
133S T O R A G E
ILLINOIS BASIN – DECATUR PROJECT
In November 2011, continuous injection of CO2 began into Cambrian sandstones over 2 km deep near Decatur, Illinois, as part
of the Illinois Basin – Decatur Project (IBDP) directed by the Midwest Geological Sequestration Consortium (MGSC), one of
seven US regional partnerships. Overall the project is managed by the Illinois State Geological Survey and, signifi cantly, is the
fi rst million-tonne demonstration of carbon storage in the US. The injection will take place over three years (ca. 300,000 tpa)
using CO2 captured from fermentation processes used to produce ethanol at Archer Daniels Midland Company’s (ADM) corn
processing complex at Decatur, Illinois.
Although the US$96 million funding for this demonstration project was received in 2007, research and data acquisition for
the project began in 2003, again underscoring the time requirement for developing a storage program. The Illinois State
Geological Survey performed the regional characterisation that eventually led to selection of the Decatur site. The Cambrian
Mt Simon Formation is the most widespread saline reservoir in the Illinois Basin and covers two-thirds of Illinois and parts of
western Indiana and western Kentucky. The CO2 storage capacity of the Mt Simon Formation in the Illinois Basin is estimated
at between 11 to 151 Gt (NACSA 2012), and in the Michigan Basin it is around 29 Gt (Barnes et al. 2009), whereas overall
in the Midwest area it is estimated at between 23 to 355 Gt depending on the effi ciency factor used (Medina et al. 2011).
Characterising the Mt Simon reservoir and the overlying shale seals (the primary seal being the Eau Claire shale) has been
part of ongoing research to fi nalise the decision to proceed with injection at IBDP. The injection well was drilled in 2009
and provided data to help confi rm the suitability of the site. In 2010 a seismic survey was conducted, along with drilling of
a geophysical monitoring well and a pressure and fl uid sampling (verifi cation) well. Schlumberger Carbon Services provided
management on the design and construction of all wells associated with the storage and deep monitoring parts of the
project. After the fl uid sampling well was drilled, two rounds of fl uid sampling were performed to determine pre-injection
reservoir conditions. In addition, the IBDP has developed one of the most extensive environmental monitoring and subsurface
monitoring programs of any storage site. The IBDP includes an extensive outreach program, has held several workshops, and
hosted visitors from around the world to learn from this project.
ILLINOIS INDUSTRIAL CCS PROJECT
The Illinois Industrial CCS Project (Illinois ICCS Project) is a larger-scale demonstration building on what was learnt from
the IBDP and involving many of the same proponents. The Illinois ICCS Project has entered the construction phase and is
designed to inject 1 Mtpa CO2 into the Mt Simon Formation beginning in 2013 for about 2.5 years. The injection site is within
several kilometres of the IBDP and will use many of the monitoring and surveillance methods employed at IBDP. After injection
into the Mt Simon saline reservoir is complete, CO2 capture is expected to continue for EOR operations.
QUEST CCS PROJECT
Quest is a fully-integrated CCS project designed to capture, transport, and store about 1.08 Mtpa of CO2 for 25 years in the
Basal Cambrian Sands of North-Central Alberta, Canada. The project is operated as a joint venture by Shell Canada, Chevron,
and Marathon Oil. The CO2 will be captured from three steam reformer units at the Scotford Upgrader near Fort Saskatchewan,
Alberta. The CO2 will be compressed and transported by pipeline to the storage site about 50 km northeast, although due to
routing the pipeline itself will be about 84 km long. The CO2 will be injected into the Cambrian sandstones at about 2 km depth
using 3–8 injection wells. The sandstones at this depth contain very saline water which has a concentration of approximately
200,000 mg/L.
Geologically, the Basal Cambrian Sands are broadly analogous to the Mt Simon Formation of the IBDP in that they represent
deposits resulting from a global Cambrian transgression that produced very similar sequences of tidally infl uenced sheet
sandstones. These sandstone packages are typically less than about 100 m thick but are texturally and mineralogically
mature – that is, they are made of grains of a uniform size and shape and are dominantly quartz. These are generally positive
characteristics for reservoir rocks.
The Quest subsurface work has developed a comprehensive storage development plan driven by an expansive, systematic
risk-management process. From the earliest conception of a storage opportunity to the status of reaching maturity for the
fi nal investment decision in Spetember 2012 has taken about nine years, with focused effort since 2008. Development of the
geologic model for Quest is in its fourth generation and the progressive evolution of these models has involved data acquisition
programs that included drilling three data appraisal wells, performing 2D and 3D seismic surveys, obtaining high-resolution
aeromagnetic survey data, and conducting numerous laboratory measurements and simulation exercises.
The Quest project has been subject to numerous internal technical and joint venture reviews as well as several independent
peer reviews. In 2011, DNV awarded Shell and its Quest project the world’s fi rst certifi cate of fi tness for safe CO2 storage. This
has been viewed as additional confi rmation that the project meets rigorous storage standards. In July 2012, Quest received
conditional approval from Alberta’s Energy Resources Conservation Board. This approval was an important consideration in the
fi nal investment decision to proceed with the storage project and commence injection in 2015.

T H E G L O B A L S TAT U S O F C C S : 2 0 1 2134
AQUISTORE PROJECT
The Aquistore Project is also evaluating the storage potential of basal Cambrian strata in western Canada near SaskPower’s
Boundary Dam Power Station which is undergoing a retrofi t for CO2 capture. The Cambrian Deadwood Formation is the basal
Cambrian unit in the area (Figure 62) and is a dominantly sandstone sequence that is about 3.3 km deep near the power
plant. The Aquistore Project, managed by the Petroleum Technology Research Centre, Regina, Saskatchewan, completed
drilling an injection/evaluation well in mid-2012 to obtain cores from the Deadwood Formation and overlying seals to extract
essential geologic, petrophysical, and hydrogeologic information for model and simulation development, as well as to calibrate
geophysical data and obtain baseline reservoir conditions. The well will eventually test injectivity and is designed to inject
up to 2000 t/day of CO2 after a potential pipeline tie-in from the Boundary Dam Power Station. Other site investigations have
included performing baseline monitoring surveys, including a 30 km2 3D seismic survey and installing a permanent geophone
array over 12 km2. Groundwater and soil gas surveys are also in progress with a second well for observation and monitoring
planned to be drilled in late 2012. An injection test will be scheduled soon after completion of the monitoring well.
FIGURE 62 Core photos of Cambrian Deadwood Formation in Saskatchewan exhibiting cross-bedded sand grains and good porosity
Source: Petroleum Technology Research Centre, Regina, Saskatchewan, Canada.
EUROPE
There are numerous European initiatives around CCS projects and they involve research consortiums to large-scale
commercial considerations of single sites and hubs and networks. The EU GeoCapacity (2009) study, which developed out of
the EU Framework Programme 6 for Research and Technological Development, determined a conservative estimate of 116 Gt
storage capacity in European onshore and offshore aquifers and hydrocarbon fi elds. This capacity potentially represents more
than 60 years of CO2 storage from European large-point source emitters (Figure 63).
NORWAY
About 25 per cent of the storage capacity in Europe is located offshore of Norway (EU GeoCapacity 2009). Two of the largest
operating saline reservoir storage projects in the world, the Sleipner and Snøhvit projects, are located in the Norwegian sector
of the North Sea and are operated by Statoil. The largest offshore aquifers in Norway are the Utsira–Skade Formation aquifer
with 15.8 Gt storage capacity and the Bryne–Sandnes Formation aquifer with 13.6 Gt capacity. The Utsira Formation is used
by the Sleipner Project which is among the best studied geologic storage sites in the world. Another saline reservoir, the
Johansen–Cook Formation has less capacity at 1.8 Gt, but is being investigated for storage potential by Gassnova because of
its good reservoir and seal properties (Norwegian Storage Atlas, NPD 2011). Initiatives of the CO2 Storage Atlas published by
the Norwegian Petroleum Directorate are discussed later.
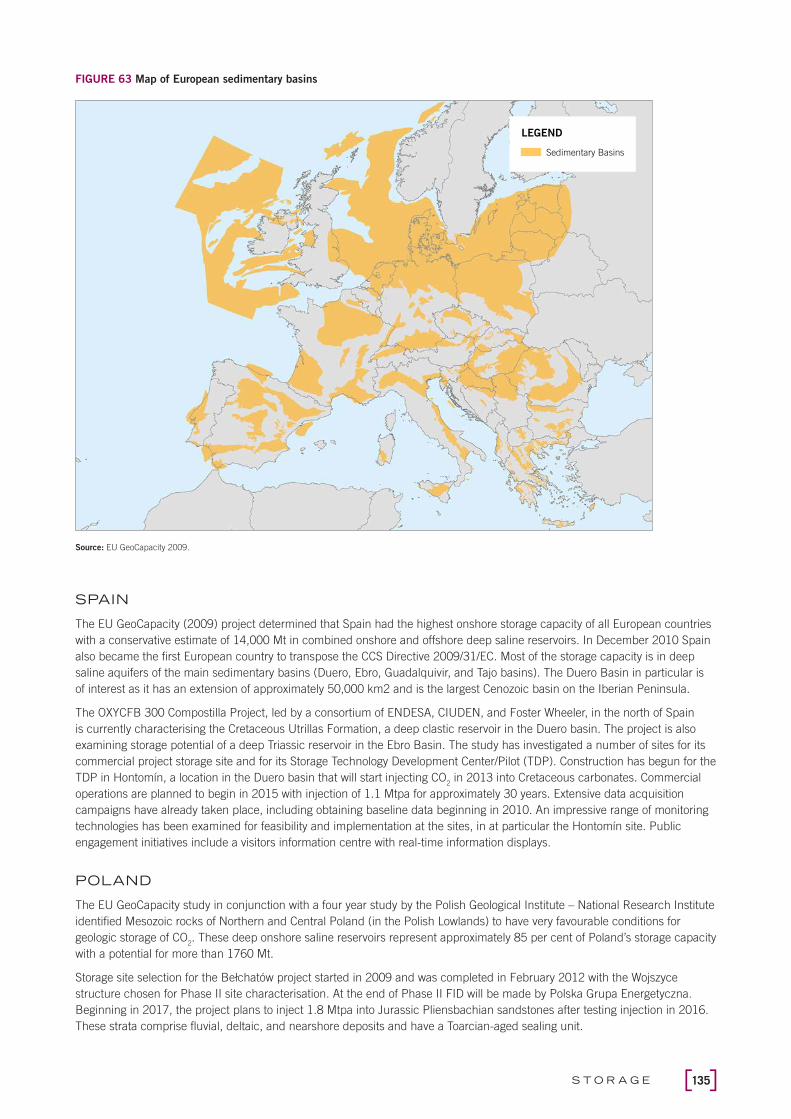
135S T O R A G E
FIGURE 63 Map of European sedimentary basins
LEGEND
Sedimentary Basins
Source: EU GeoCapacity 2009.
SPAIN
The EU GeoCapacity (2009) project determined that Spain had the highest onshore storage capacity of all European countries
with a conservative estimate of 14,000 Mt in combined onshore and offshore deep saline reservoirs. In December 2010 Spain
also became the fi rst European country to transpose the CCS Directive 2009/31/EC. Most of the storage capacity is in deep
saline aquifers of the main sedimentary basins (Duero, Ebro, Guadalquivir, and Tajo basins). The Duero Basin in particular is
of interest as it has an extension of approximately 50,000 km2 and is the largest Cenozoic basin on the Iberian Peninsula.
The OXYCFB 300 Compostilla Project, led by a consortium of ENDESA, CIUDEN, and Foster Wheeler, in the north of Spain
is currently characterising the Cretaceous Utrillas Formation, a deep clastic reservoir in the Duero basin. The project is also
examining storage potential of a deep Triassic reservoir in the Ebro Basin. The study has investigated a number of sites for its
commercial project storage site and for its Storage Technology Development Center/Pilot (TDP). Construction has begun for the
TDP in Hontomín, a location in the Duero basin that will start injecting CO2 in 2013 into Cretaceous carbonates. Commercial
operations are planned to begin in 2015 with injection of 1.1 Mtpa for approximately 30 years. Extensive data acquisition
campaigns have already taken place, including obtaining baseline data beginning in 2010. An impressive range of monitoring
technologies has been examined for feasibility and implementation at the sites, in at particular the Hontomín site. Public
engagement initiatives include a visitors information centre with real-time information displays.
POLAND
The EU GeoCapacity study in conjunction with a four year study by the Polish Geological Institute – National Research Institute
identifi ed Mesozoic rocks of Northern and Central Poland (in the Polish Lowlands) to have very favourable conditions for
geologic storage of CO2. These deep onshore saline reservoirs represent approximately 85 per cent of Poland’s storage capacity
with a potential for more than 1760 Mt.
Storage site selection for the Bełchatów project started in 2009 and was completed in February 2012 with the Wojszyce
structure chosen for Phase II site characterisation. At the end of Phase II FID will be made by Polska Grupa Energetyczna.
Beginning in 2017, the project plans to inject 1.8 Mtpa into Jurassic Pliensbachian sandstones after testing injection in 2016.
These strata comprise fl uvial, deltaic, and nearshore deposits and have a Toarcian-aged sealing unit.

T H E G L O B A L S TAT U S O F C C S : 2 0 1 2136
ROMANIA
The Pannonian Basin Province covers much of Central East Europe, underlying mainly parts of Hungary, Romania, and
Croatia. Total storage capacity in deep saline aquifers of Romania was estimated at 7500 Mt by the EU GeoCapacity project.
The Pannonian Basin is characterised by a system of Cenozoic basins, and is the area of primary petroleum exploration with
CO2 EOR pilots beginning in the region during the 1960s.
The Getica CCS Demonstration project is located in the Getic depression, a 50–100 km wide basin containing more than
6 km of late Cretaceous to Tertiary sediments. The Tertiary deposits are being investigated for CO2 storage and are mainly
sandstones, conglomerates, and sands known to have good reservoir properties; the average porosity is approximately 14 per
cent and the permeability is between 50 to 100 mD. The Getica team initially screened 11 potential sites and has narrowed
this down to two sites with reservoirs in the Neogene Sarmatian for further investigation. The project intends to begin injection
of 1.5 Mtpa CO2 in 2015. The three project partners – CE Turceni SA, SNTGN Transgaz SA, and SNGN Romgaz SA – are
currently establishing a legal entity to run the project.
FRANCE
France has three large sedimentary basins hosting major deep aquifers and petroleum resources: Aquitaine, Paris, and the
South-East Basin, with a CO2 storage capacity estimated at 7922 Mt by the EU FP6 GeoCapacity project. The Paris Basin is
the largest covering 180,000 km2, and contains sedimentary rocks representing over 248 million years of deposition from
the Triassic to the Pliocene. France Nord, a 54 million EUR project funded 40 per cent by French energy agency ADEME and
60 per cent by industrial partners was designed to study the feasibility of a CCS pilot in the Centre-North part of the basin,
matching sources and possible sinks. The project was concluded in early 2012.
The ULCOS-BF project is located in the eastern Paris Basin and is a large-scale demonstration led by ArcelorMittal and
supported by a consortium that includes most EU integrated steel producers, some mineral groups, and a number of energy
producers and technology suppliers. Pre-screening has identifi ed two possible suitable storage sites in Lorraine in several deep
clastic formations. Injection testing is planned to start in 2014 with the objective to store 700,000 tpa in a deep saline reservoir.
The well-known Lacq Pilot CCS project is an industrial demonstration that has been storing CO2 in a depleted gas reservoir
since 2010 in a Jurassic dolomite reservoir. This project, operated and funded by Total, is located in the Aquitaine basin in a
region with a long history of oil and gas production and natural gas storage in aquifers.
GERMANY
Regional deep saline formations are present in the Northern part of Germany, both onshore and offshore. The Federal Institute
for Geosciences and Natural Resources (BGR) has completed regional storage capacity assessments (e.g. in the region where
the Jänschwalde project is located) as well as a publicly available storage catalogue for Germany completed in 2011. The CO2
storage capacity potential of deep saline geologic structures (traps) in investigated areas covering most of Northern Germany
onshore and offshore is estimated at 6.3–12.8 Gt (90–10 per cent probability) or 9.3 Gt (50 per cent probability) in 408
geologic storage structures.
BGR is currently leading the Geo-Scientifi c Potential of the German North Sea project in cooperation with research institutions,
public authorities, and industry partners. The fi ve year project involves the acquisition and provision of basic geoscientifi c
information supporting a sustainable development of the German North Sea, and is to be completed at the end of 2013.
The results of the project will be made accessible for the private, business, and research sectors through the internet. The
information will be an essential contribution towards spatial planning, sustainable economic use, and protection of the marine
environment of the North Sea.
The well-known Ketzin project in Northern Germany, led by the German Research Centre for Geoscience, has demonstrated
safe storage of CO2 in the Stuttgart Formation since 2008. The Stuttgart Formation contains mainly sandy channel-facies rocks
with good reservoir properties that alternate with muddy fl ood-plain facies rocks of poor reservoir quality. This demonstration
project has been a major source of scientifi c knowledge to the global CCS community.
UNITED KINGDOM
The UK has the highest number of European storage projects under development, with six projects in Identify, Evaluate, or
Defi ne stage; all plan to store CO2 offshore in the North Sea in either depleted hydrocarbon fi elds or deep saline reservoirs.
CO2 EOR is being considered by at least one of the projects. Characterisation of sedimentary basins in the North Sea has
been driven by oil and gas exploration. Onshore storage potential in the UK is considered small, but storage capacity in deep
offshore saline aquifers was estimated at 14,935 Mt (conservative estimate 7100 Mt) by the EU GeoCapacity (2009) project.
The conservative storage capacity in offshore hydrocarbon fi elds is estimated at 7300 Mt. Note the above values do not
include the Northern and Central North Sea offshore basins as storage capacity had not yet been estimated in 2009, but could

137S T O R A G E
be large. The UK Energy Technology Institute (ETI) carbon storage capacity appraisal, expected to be available online in late
2012, will give an updated assessment of storage locations and capacity.
Although the North Sea has been the focus of the fi rst storage sites for UK projects, the Irish Sea also has a large potential
storage capacity and is surrounded by many large-scale CO2 emitters in eastern Ireland, Northern Ireland, west Scotland,
northwest England, and southern Wales. The calculated CO2 storage capacity in the oil and gas fi elds of the East Irish Sea
Basin is approximately 1047 Mt. Additional storage potential exists in newly discovered fi elds where data is not yet in the
public domain, and in non-hydrocarbon-bearing structures in the Ormskirk Sandstone. Storage capacity of these structures is
estimated to be 630 Mt (Kirk 2006). Further storage capacity work is being carried out by the Geological Survey of Ireland and
the British Geological Survey.
UK HUBS AND CLUSTERS
The South Yorkshire and Humber CCS cluster in the UK is designed around capture of CO2 from fossil fuel fi red power plants
and other Industrial sources in the region and its geologic storage in reservoirs of the southern North Sea. The long-term
aim of the cluster is to capture around 40–60 Mtpa of the CO2, representing approximately 10 per cent of the UK’s annual
CO2 emissions. Current proposed CCS projects in the region are Don Valley (2Co), White Rose (Drax) and North Killingholme
(C.Gen). The Teesside low carbon CCS project, although further north, could also possibly feed into this cluster. Storage
options, while preliminary, are being evaluated by National Grid Carbon, a subsidiary of National Grid and include saline
reservoirs and oil and gas reservoirs. 2Co are working with Talisman Energy on CO2 EOR and CO
2 storage in the North Sea.
ROTTERDAM CO2 HUB
The port of Rotterdam, through the Rotterdam Climate Initiative (RCI) aims to become a hub channelling CO2 from industrial
sites in Northern and Eastern continental Europe and redistributing it to storage locations in the North Sea in depleted
and (depleting) oil and gas fi elds or deep saline aquifers. In 2010 the RCI, funded in part by the Global CCS Institute,
commissioned TNO to identify potential storage locations to assist planning infrastructure requirements. Neele et al. (2011)
provided an overview and ranking of potential storage sites that were potentially available by 2015, when some of the fi rst CCS
projects in the area could become operational. Options for later development were also explored.
The TNO reports indicated that the best initial options for geologic storage are in offshore, depleted gas fi elds. The study
focused on geologic formations in the P and Q blocks of the Dutch part of the North Sea that which contain over 60 oil and
gas fi elds, and deep saline reservoirs generally less than 100 km offshore. A cluster of small gas fi elds identifi ed as P18 had
suffi cient storage capacity and injectivity to accept between 1–1.6 Mtpa CO2 from sources in the Rotterdam region expected to
arise in the period 2015–20. A factor in this choice is that the site must be ready for injection by 2015. The P18 cluster, and
the principal storage location for the ROAD CCS project, is about 20 km offshore and has a storage capacity of nearly 40 Mt.
Gas production is still occurring in the fi elds but will taper off (depending on the individual fi eld) from 2015 onwards. A new
insulated pipeline will be built with a planned capacity of 5 Mtpa to allow for additional partners and scale-up.
Because there is a fi nite amount of storage capacity in the depleted gas fi elds of this region, Neele et al. (2012) evaluated
additional storage options, including saline reservoirs on the Dutch Continental Shelf, to allow for potential further CCS
development associated with the hub. The initial capacity estimates of these saline reservoirs are promising, but will need
further assessment as data on these locations is limited at present. This lack of data and infrastructure, however, will mean
that injection cannot be initiated until the reservoirs can be adequately characterised, work that will take a number of years.
AUSTRALIA
The Gorgon Injection Project in Western Australia will be the largest carbon storage project in the world when operational.
The project intends to inject up to 4 Mtpa CO2 into sandstones of the Dupuy Formation beneath Barrow Island. The CO
2 will be
separated from natural gas produced from the giant offshore Gorgon, Janz, and Io gas fi elds that each contain variable amounts
of associated CO2. The project has developed a robust uncertainty management plan and undergone the largest environmental
impact assessment in Australian history. Progressing the storage component to reach fi nal investment decision in 2009 took
more than six years and involved a dedicated subsurface team of geoscientists, engineers, and regulatory support personnel.
The injection component alone to this massive project is estimated at AU$2 billion. The project is preparing for injection in 2015.
AUSTRALIAN HUBS
In Australia, Flagship Projects have also been adopting a hub model. In the state of Victoria, the CarbonNet project is
evaluating storage opportunities in the offshore Gippsland Basin. The storage target would likely be in shoreface or barrier
bar sandstones of the Latrobe Group that have excellent reservoir qualities. Options include depleted oil and gas fi elds and
saline reservoirs. The Lake Entrance Formation provides a regional top seal of marls, mudstones, and marly limestones. The
T H E G L O B A L S TAT U S O F C C S : 2 0 1 2138
CarbonNet program has undergone two peer reviews of its geosciences evaluation program and is focusing on reducing its
portfolio of potential storage sites to a few high priority locations. 1–5 Mtpa of CO2 captured from industrial activity in the
Latrobe Valley corridor is initially planned to be stored as part of CarbonNet, with possible scale-up to near 20 Mtpa.
The South West CO2 Geosequestration Hub (formerly Collie Hub) in Western Australia includes coal mining companies,
electricity generators, alumina refi ners, and fertiliser manufacturers. The consortium is investigating onshore storage options
linked by a common pipeline to eventually inject up to 10 Mtpa CO2. Exploration work is ongoing to evaluate the storage
potential in the Lesueur sandstone in the southern Perth Basin. The fi rst data acquisition well was recently drilled and an
extensive 3D seismic program is in place to help further characterise the subsurface and identify four or fi ve future drilling
locations. The storage target is a saline reservoir 1800–3000 m deep overlain by silty sandstones and shales of the Cockleshell
Gully Formation. Initial evaluations of newly obtained core suggest that the Lesueur Formation is permeable and that
favourable sealing characteristics are present in the strata above.
CO2 EOR developments
Interest in CO2 EOR as a method of permanent storage of anthropogenic CO
2 has increased markedly over the past several
years, mainly because it presents a viable business case for integrated CCS without the need for a GHG policy or a price for
carbon. Sustained high oil prices make CO2 EOR more attractive for operators and thereby increase demand for CO
2, which
may, in turn, increase infrastructure development and spur improvements in capture technologies. There have been a number
of publications produced during the past several years considering CO2 EOR potential for CCS, such as the National EOR
Initiative (2012), Melzer (2012), Berenblyum et al. (2011), Kuuskraa et al. (2011), and Hovorka and Tinker (2010) among
others. The Global CCS Institute is also undertaking a multifaceted study on CO2 EOR as a CCS mechanism that is summarised
in Chapter 9.
Presently, more anthropogenic CO2 is being stored through CO
2 EOR than by any other method (around 25 per cent of CO
2
supply for EOR projects use anthropogenic CO2). The largest current anthropogenic CO
2 injection projects globally are EOR
operations such as at Weyburn, Saskatchewan (2.4 Mtpa not including recycle) and the Salt Creek Field, Wyoming (around
2 Mtpa). With more than 130 CO2 EOR operations in existence, albeit mostly in North America, there is demonstrably greater
community acceptance of EOR as a long-standing, familiar industrial activity over other types of geologic storage. But the
opportunity for CCS associated with CO2 EOR is being recognised more widely as Brazil, Mexico, the Middle East, and China
are all involved in fi eld pilot and demonstration programs, and countries in Southeast Asia are advanced in evaluating potential
operations. Interestingly, Europe has some of the world’s longest running CO2 EOR operations as Hungary began pilot studies
in the 1960s and initiated fi eld-scale CO2 injection in the Budafa Field in 1972, the same year injection began at SACROC
in Texas. Offshore potential in the North Sea has been well studied, although European onshore EOR opportunities are more
restricted. However, recognition of the role CO2 EOR may play in CCS was indicated in a speech by Günther Oettinger, the EU
Commissioner for Energy, in Brussels on 12 December 2011, in which he stated “the only existing and short term realistic use
for large amounts of CO2 is EOR” (Oettinger 2011, p. 3).
Storage standards and regulationsWork on the Canadian Standards Association (CSA) Z741 – Geological Storage of Carbon Dioxide began in 2010 and is
expected to be publically available in the fourth quarter of 2012. The CSA Z741 standard addresses only aspects of geologic
storage of CO2 and not capture and transportation. The technical content of the standard has been completed, including
receiving and responding to more than 500 comments received during the public feedback period.
The ISO has convened Technical Committee 265 (TC 265) to examine CO2 capture, transport, and geologic storage. It is
expected that the scope of this committee will include all standards related to CO2, including capture, transportation, and
storage in underground formations. The CSA Z741 standard may serve as a seed document for the geologic storage component.
In Alberta, Canada, the provincial government is performing a detailed review of the existing regulatory framework as it applies
to CCS projects, and that has very specifi c implications towards storage activities. This regulatory framework assessment is
discussed in more detail in Chapter 4, but it addresses aspects of closure criteria, stakeholder engagement, and the role of risk
assessment in CCS. It will provide recommendations to the Minister of Energy in late 2012. These recommendations will deal
with all aspects of CO2 storage, including site characterisation, well design, injection rates, monitoring, long-term liability (and
the liability transfer from the proponent to the Crown), and the establishment of a post-closure stewardship fund.
In Australia, the Global CCS Institute, with the endorsement of the Department of Resources, Energy and Tourism and through
the assistance of the CarbonNet project, has sponsored an examination into the future development of a nationally consistent
technical framework for the measurement, monitoring, and verifi cation of geologically stored CO2. Preliminary workshops with
stakeholders in Australia identifi ed considerable support for such a national, voluntary framework.
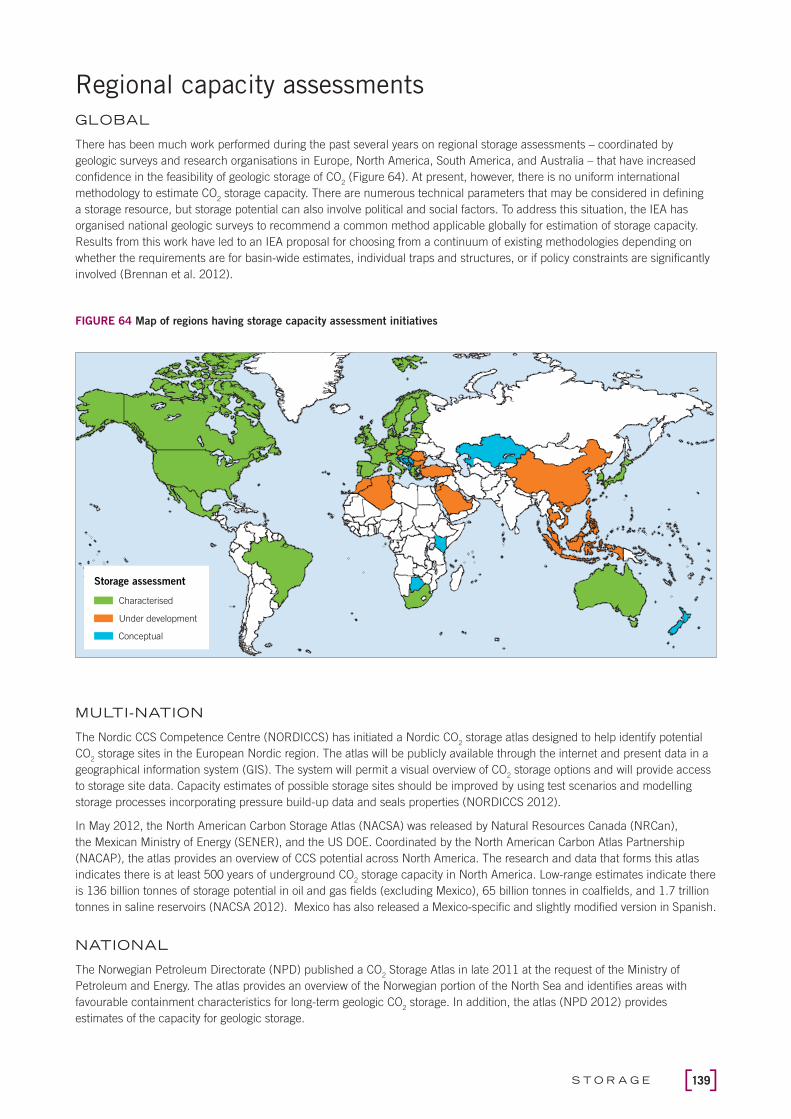
139S T O R A G E
Regional capacity assessments
GLOBAL
There has been much work performed during the past several years on regional storage assessments – coordinated by
geologic surveys and research organisations in Europe, North America, South America, and Australia – that have increased
confi dence in the feasibility of geologic storage of CO2 (Figure 64). At present, however, there is no uniform international
methodology to estimate CO2 storage capacity. There are numerous technical parameters that may be considered in defi ning
a storage resource, but storage potential can also involve political and social factors. To address this situation, the IEA has
organised national geologic surveys to recommend a common method applicable globally for estimation of storage capacity.
Results from this work have led to an IEA proposal for choosing from a continuum of existing methodologies depending on
whether the requirements are for basin-wide estimates, individual traps and structures, or if policy constraints are signifi cantly
involved (Brennan et al. 2012).
FIGURE 64 Map of regions having storage capacity assessment initiatives
Storage assessment
Characterised
Conceptual
Under development
MULTI-NATION
The Nordic CCS Competence Centre (NORDICCS) has initiated a Nordic CO2 storage atlas designed to help identify potential
CO2 storage sites in the European Nordic region. The atlas will be publicly available through the internet and present data in a
geographical information system (GIS). The system will permit a visual overview of CO2 storage options and will provide access
to storage site data. Capacity estimates of possible storage sites should be improved by using test scenarios and modelling
storage processes incorporating pressure build-up data and seals properties (NORDICCS 2012).
In May 2012, the North American Carbon Storage Atlas (NACSA) was released by Natural Resources Canada (NRCan),
the Mexican Ministry of Energy (SENER), and the US DOE. Coordinated by the North American Carbon Atlas Partnership
(NACAP), the atlas provides an overview of CCS potential across North America. The research and data that forms this atlas
indicates there is at least 500 years of underground CO2 storage capacity in North America. Low-range estimates indicate there
is 136 billion tonnes of storage potential in oil and gas fi elds (excluding Mexico), 65 billion tonnes in coalfi elds, and 1.7 trillion
tonnes in saline reservoirs (NACSA 2012). Mexico has also released a Mexico-specifi c and slightly modifi ed version in Spanish.
NATIONAL
The Norwegian Petroleum Directorate (NPD) published a CO2 Storage Atlas in late 2011 at the request of the Ministry of
Petroleum and Energy. The atlas provides an overview of the Norwegian portion of the North Sea and identifi es areas with
favourable containment characteristics for long-term geologic CO2 storage. In addition, the atlas (NPD 2012) provides
estimates of the capacity for geologic storage.
T H E G L O B A L S TAT U S O F C C S : 2 0 1 2140
The evaluation of all relevant geologic formations in the Norwegian sector used a comprehensive database built from over
40 years of petroleum exploration experience. The atlas is free to access through the Norwegian Petroleum Directorate website
(NPD 2012).
The UK ETI funded a national assessment of CO2 offshore storage capacity that began in 2009. Results of the UK CO
2 Storage
Appraisal Project (UKSAP) will be available through a web-enabled GIS database together with a CCS system modelling toolkit
currently in preparation (ETI 2009).
Australia is funding a four year National CO2 Infrastructure Plan to accelerate the identifi cation and development of offshore
CO2 storage sites. Four offshore basins are under evaluation and pre-competitive data acquisition by Geoscience Australia,
primarily by using existing 2D and 3D seismic surveys and conducting some new ones. The basins and project completion
dates are: Petrel Sub-Basin, offshore of the Northern Territory, by 2013; Browse Basin, offshore of Western Australia, by 2015;
Vlaming Sub-Basin, offshore of Western Australia, by 2014; and Gippsland Basin, offshore of Victoria, by 2015 (Department of
Resources, Energy and Tourism 2011).
Brazil is also preparing a storage atlas for release in 2012 in Portuguese, with the Global CCS Institute supporting its translation
and distribution in English.
8.3
STORAGE CHALLENGESIn most respects, the technical procedures around geologic storage of CO
2 can be regarded as mature technologies. For
decades, activities such as drilling wells, subsurface mapping, fl uid injection, reservoir management, and many monitoring
methods have been performed safely and successfully with a high degree of accuracy. Yet storage can be project limiting.
If no suitable site can be identifi ed within a region within a reasonable time, there will be greatly increased costs, extensive
delays, or even no integrated project. Therefore:
it is essential that storage site characterisation begin as soon as possible in the consideration of any CCS project. There is
no shortcut to site characterisation;
storage evaluations must consider potential impacts or interactions with other basin resources;
public concerns of risk associated with CCS are generally around aspects of storage. The perceived risk of leakage and
induced seismicity are among the biggest challenges in CCS; and
most remaining issues regarding regulations for CCS are storage-related, particularly the issue of long-term liability.
Basin resource interaction Effectively all large-scale CCS projects will use geologic storage in sedimentary basins which may contain a variety of
resources, including conventional and unconventional oil and gas, coal, coal seam gas, mineable minerals, and groundwater
for industrial, agricultural, and human use. Other, and perhaps generally less obvious, resources include pore space for
disposal of oil fi eld brines or other industrial wastes, storage of natural gas, and for the exploitation of geothermal energy.
Some resources still undeveloped or marginally economic today could potentially become more valuable as commodity prices
change or technologies for extraction are developed. By injecting large quantities of CO2 into the subsurface there exists
potential for resource confl ict or impact with future resource use.
Identifying potential resource confl icts is an important part of characterising storage sites. Resource management systems,
likely at basin scale, are important for regulators, other industries using the basin resources, and the public. Much like
risk management, resource management will be highly site-specifi c and resource assessments will infl uence the choice of
storage sites, impact the storage capacity and operating parameters, and inform the design of monitoring plans. In addition,
geomechanical effects associated with injection of CO2 that may impact other resource development, or conversely other
resource extraction that may potentially impact storage integrity, must be considered. Varma et al. (2011) have produced an
extensive review of aspects of basin resource management associated with carbon storage. This document presents a workfl ow
to assist with resource assessment of potential storage locations which includes identifying and locating known and potential
resources, evaluating the geomechanical and geologic regime for security of storage, investigating injection options for risk
reduction, and developing monitoring and mitigation strategies.

141S T O R A G E
The EC recently initiated a two year project, the European Geological Data Infrastructure scoping study (EGDI-Scope), that
further demonstrates the growing importance of subsurface resource management on a regional scale. The consortium
carrying out the study includes the Geological Survey of the Netherlands (TNO), the British Geological Survey (BGS), the
French Geological Survey (BRGM), the Geological Survey of Denmark and Greenland (GEUS), and EuroGeoSurveys, which is
the umbrella organisation of the national geologic surveys of Europe. EGDI-Scope intends to improve broad understanding of
social and economic challenges which include sustainable use of energy, water, and mineral resources and mitigating climate
change through storage of GHGs.
Risk management of geologic storage of CO2
Risk assessment is an essential activity during the selection and qualifi cation of sites for long-term storage of CO2 and for the
development of a risk management strategy. While geologic uncertainties or risks are highly site-specifi c, the main perceived
risks are of potential leakage, induced seismicity and ground displacement, and their potential impact on health, environment,
resources, and value. Primary risks around storage that may affect project feasibility are the timely identifi cation of a suitable
storage site and public acceptance.
Storage-related risk assessments and risk management processes have matured as more projects approach fi nal investment
decisions, a stage at which detailed operational plans that describe MMV programs must be provided. Projects in development
have benefi ted signifi cantly from knowledge dissemination of risk management plans and MMV programs from operational or
near-operational projects, such as Sleipner, the IEAGHG Weyburn–Midale CO2 Storage and Monitoring Project, In Salah, and
the Gorgon Injection Project. It is notable that many of the smaller R&D projects in particular have contributed to monitoring
expertise through deployment of a wide range of technologies, including at Otway, Frio, Nagaoka, Lacq-Rousse, Ketzin,
Cranfi eld, and a number of tests in the US Regional CO2 Partnership program.
At the end of 2011 the UK Department of Energy and Climate change released the FEED study of the ScottishPower
Consortium’s Longannet CCS project and E.ON UK’s Kingsnorth CCS Project. This material includes risk assessments and
mitigation studies and makes available many reports to all CCS project developers and other interested parties to disseminate
the lessons from these FEED studies. Risk registers identifi ed the top 50 risks and assessed them as to whether they were
active or closed. The fi ve highest scoring demonstration risks specifi c to CCS reported by the ScottishPower Consortium were:
key project consents not obtained for program or in line with expectations;
technology scale-up challenge;
adverse public reaction to project;
challenges of operating with CO2; and
offshore transportation system sensitivities to variable flow rates of CO2.
In Canada, the Quest CCS project (FID achieved in 2012 and operational start in 2015) has a risk-based MMV plan which
is central to the project’s risk management framework. It fully integrates extensive storage characterisation, monitoring
design, regular evaluation, and performance reviews to build active safeguards and control responses and feed the project’s
communication.
The Norwegian company DNV initiated the CO2 Risk Management (CO2RISKMAN) joint industry project in mid-2011 to
develop a publicly available guidance document which will help the emerging CCS industry deliver effective risk management,
particularly around safety and environmental hazards associated with handling CO2 in a CCS operation. The project should be
complete in mid-2012 and cover all phases of a CCS system from concept and selection to operation and cessation, as well
as addressing hazard management for all links in the CCS. The project has involved various types of stakeholders (industries
and specialists, regulators, risk management specialists) to defi ne a common basis for more effective communication and
consultation among all CCS stakeholders regarding the management of risk. This work will complement the Best practices for
risk analysis and simulation for geologic storage of CO2 published by NETL (2011a) and the Assessment of the major hazard
potential of carbon dioxide (CO2) published by the UK Health and Safety Executive (Harper et al. 2011).
The European project ECO2 intends to examine risks with storage of CO
2 below the seabed in marine ecosystems and aims to
provide a best practice guide for monitoring sub-seabed storage by 2015 (ECO2 2011). State-of-the-art monitoring techniques
will be applied at offshore storage sites and locations of natural CO2 seeps in the North, Barents, and Mediterranean seas.
Experimental work and numerical simulations will augment these fi eld studies with the goal of detecting and quantifying the
fl uxes of formation fl uids, natural gas, and CO2 from storage sites. Importantly the project will transfer this knowledge into a risk
management and communication framework with an evaluation of the costs of leakage, monitoring, and mitigation measures.

T H E G L O B A L S TAT U S O F C C S : 2 0 1 2142
PROVIDING COMMUNICATORS WITH ADEQUATE INFORMATION
Storage risk management includes the related processes of public communication and crisis management. Technical risk
management ideally aims to avoid having to manage any crisis, but projects need to be prepared to deal with situations related
to misinformation, lack of understanding, or potential incidents. Because these situations may exaggerate the perceptions
of risks, they can seriously affect or even result in the cancellation of projects. Providing accurate and timely technical
information to project communicators is an important role for the storage team (Bradbury et al. 2011).
Issues may also arise that impact CCS more broadly than those directly related to an individual project. For example, in
mid-2012 the US National Research Council (NRC 2012) and Zoback and Gorelick (2012) released papers that discuss the
potential of seismicity induced by large-scale injection of CO2 into the subsurface. This topic has been studied previously
and is evaluated in all site characterisation processes. Whereas the CCS community views the expansive NRC report as a
balanced study, the Zoback and Gorelick paper attracted far more media and public attention by using the phrase ‘earthquake
triggering’ compared with the NRC’s term ‘induced seismicity’. Numerous individual scientists and scientifi c organisations, all
very familiar with CCS, are in general agreement that the statements in the Zoback and Gorelick paper about storage capacity
and associated seismicity reach questionable conclusions. It is an ongoing challenge for the technical CCS community to
provide factual, understandable, and timely responses to all stakeholders around issues associated with CO2 storage.
LONG-TERM STORAGE LIABILITY
In most areas, projects still report long-term storage liability as a hindrance to progressing CCS. Liability issues relating to
post-closure CO2 storage centre on the size of the storage area and the length of time over which CCS projects operate.
Geologic features and decommissioned wells comprise the containment system and there is uncertainty in assessing long-
term behaviour of CO2 within this regime and with the methods of identifying and valuing possible impacts to the environment.
There is even further uncertainty in the sharing of responsibilities and fi nancing of potential damage remediation between
operators and governments.
Considerable work has been conducted in the area of life cycle risk management of CO2 storage – such as the EC Guidance
documents 1–4 for the Implementation of Directive 2009/31/EC on the Geological Storage of Carbon Dioxide and DNV’s
CO2QUALSTORE (2009) and CO2RISKMAN (2012), among others. The general perception is that progress has been made
on the technical and economic aspects of post-closure CO2 storage, whereas the legal aspects and overarching regulatory
frameworks related to long-term liability remain largely unsolved.
Long-term liability and its transfer from the project proponent to the state is directly addressed by the Mines and Minerals Act,
Carbon Sequestration Tenure Regulation (Bill 24) in Alberta, Canada. This act stipulates that monitoring of a CCS site with
comparison to predictive models will be performed and reported on at regular intervals throughout the project. This activity
will continue for a period (in the order of 10 years) after injection has been terminated, and if monitoring results support
predictions, liability transfer to the state will occur. During the injection period, the proponent will contribute to a ‘stewardship
fund’ which will be used by the state for MMV and decommissioning activities on an ‘as needed’ basis.

143S T O R A G E
8.4
PROGRESSING STORAGE PROJECTS
Knowledge transferProgressing CCS projects and CO
2 storage in general can be accelerated by transferring knowledge and experience gained
from existing projects, large or small, to other projects in various phases of development. In particular, many of the smaller
research programs involving injection have contributed signifi cantly to development of monitoring capabilities, characterisation
criteria, and refi ning modelling and simulation tools. The coordination of technical needs and fostering the transfer of fi ndings
among research and industrial communities is of paramount importance to the broader CCS community.
Although many of the technologies involved in storage are mature, there are still numerous uncertainties associated with
characterising deep saline formations, modelling and predicting long-term behaviour of CO2 in the subsurface, and monitoring
and verifi cation procedures at the large spatial and temporal scales involved in CCS. Targeting specifi c topics and supporting
research in these areas is one mechanism the Global CCS Institute pursues, both independently and in association with
technically focused agencies such as the IEAGHG GHG R&D Programme, CO2CRC, and others. For example, the Global
CCS Institute currently sponsors targeted work to describe and catalogue relative permeability analyses for use in dynamic
simulation, and supports a study on options for remedial techniques in the subsurface. Findings from these studies, along with
other project-specifi c reports supported by the Institute, are available on the Institute’s website.
The development of standards, such as the CSA Standard Z741 – Geological Storage of Carbon Dioxide and emerging work
by the ISO on CCS, may provide additional confi dence to both proponents and regulators in many jurisdictions to proceed with
planning of CCS projects. Guidelines and best practices emerging from existing research and commercial projects are also
highly instructional in formulating screening and characterisation strategies and with developing risk management plans to
inform operations and monitoring activities. Lessons from these storage activities can provide many insights to progress future
CCS projects more rapidly.
Ultimately, capacity development by transferring knowledge through reports, webinars, and workshops is critical. The Global
CCS Institute is active in all these areas as well as having a strong focus on providing workshops and courses on storage and
CCS in emerging economies.

9CO
2 ENHANCED OIL RECOVERY AS CCS
9.1Introduction 145
9.2Potential role of CO
2
EOR in CCS 146
9.3Infl uencing factors on CO
2
EOR as CCS 150
9.4Challenges to CO
2
EOR as CCS 153
9.5Status of CO
2 EOR as CCS 156

145C O2 E N H A N C E D O I L R E C O V E R Y A S C C S
KEY MESSAGES › Most anthropogenic CO
2 currently being geologically stored is associated with
CO2 EOR.
› To be considered CCS, CO2 EOR must demonstrate that the storage of injected
anthropogenic CO2 is permanent. Regulations and policy are required to transition
from CO2 EOR to CCS.
› Current CO2 EOR activities contribute to technical and scientifi c knowledge and
public confi dence around CCS.
› CO2 EOR is an important commercial driver in some regions, and also supports
some CCS demonstration activity.
› CO2 EOR presents important opportunities for CCS demonstration in the near term.
9.1
INTRODUCTIONInjecting CO
2 into mature oil fi elds has been a method used for enhancing oil production for about 40 years. Enhanced oil
recovery (EOR) refers to a suite of techniques that can be applied to reservoirs with declining oil production to maintain
or improve production. Most fi elds considered for EOR have already undergone primary production – in which the natural
reservoir pressure brings the oil to surface – and secondary production methods, usually by injecting water to restore reservoir
pressure. Using CO2 for EOR (CO
2 EOR) has proven successful in rejuvenating oil production in many maturing oil fi elds and
extending their productive lives by decades – the degree of improvement in production is highly dependent on site-specifi c
reservoir characteristics and oil composition, and not all oil fi elds are amenable to CO2 EOR.
Of the more than 130 CO2 EOR projects in operation globally, the considerable majority take place in North America and
of these, about half are in a geologic setting known as the Permian Basin in West Texas. There are other commercial CO2
EOR operations ongoing in Canada, Turkey, and Hungary, and pilot projects scattered even further afi eld. The historical
development of CO2 EOR has largely been constrained by the availability of inexpensive CO
2. In the US, large naturally
occurring accumulations of CO2 (N-CO
2) are found in geologic reservoirs such as McElmo Dome, Doe Canyon Deep, and
Sheep Mountain in Colorado and Bravo Dome in New Mexico, sources from which the CO2 can be produced relatively
inexpensively. CO2 produced by human activities, such as those associated with extraction or burning of fossil fuels or other
industrial process, is considered anthropogenic CO2 (A-CO
2) and is also used for CO
2 EOR. Because A-CO
2 must be separated
or captured using physical and chemical processes it is generally more expensive and historically less available than N-CO2.
A-CO2, however, is now becoming increasingly recognised as an economically viable option as more operators globally are
interested in CO2 EOR and geologic (N-CO
2) sources are not always accessible. In North America more than 6500 km of
pipelines transport CO2 for use in CO
2 EOR operations to produce around 300,000 bbl of oil per day. The expected supply of
CO2 in 2012 for EOR in North America is 66 Mtpa of which over 25 per cent is A-CO
2. More anthropogenic CO
2 is injected by
operating CO2 EOR projects than by any other storage option for CCS (Figure 65).
This chapter presents the role CO2 EOR may play in CCS (along with some of the technical and legal aspects of CO
2 EOR
relative to carbon storage) and describes the economic, commercial, and regulatory landscape infl uencing these operations.
Photo
court
esy
of C
enovu
s Energ
y.
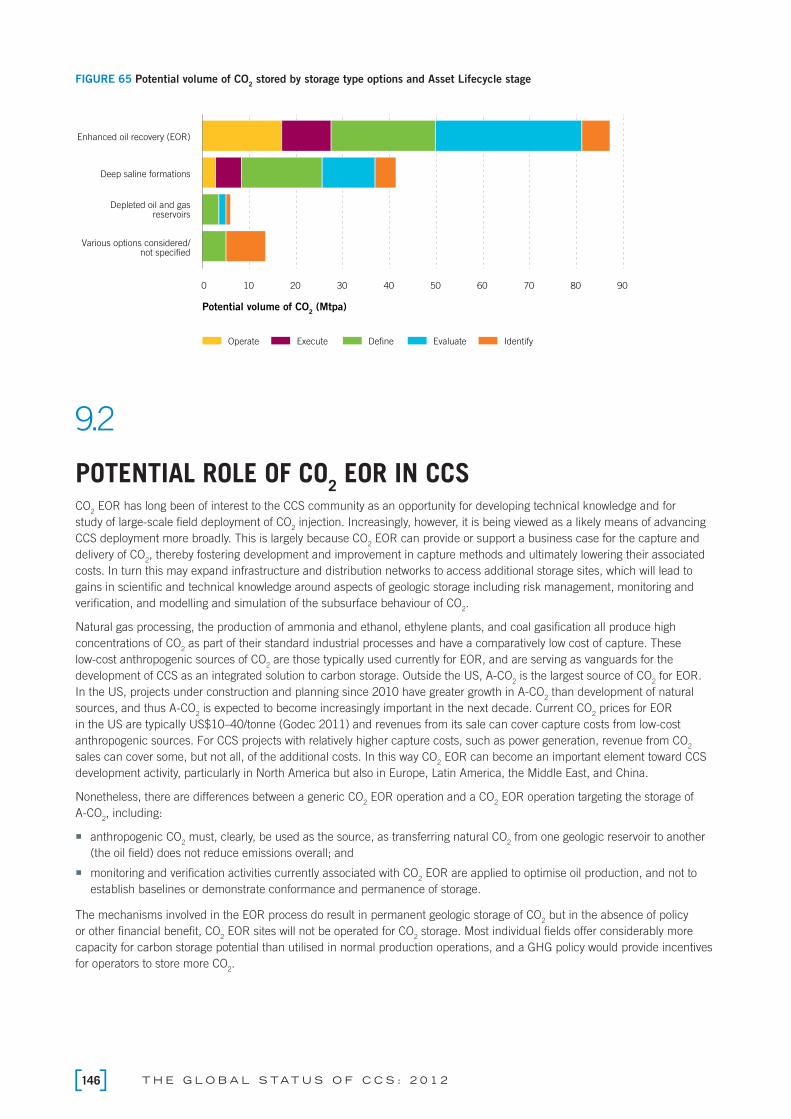
T H E G L O B A L S TAT U S O F C C S : 2 0 1 2146
FIGURE 65 Potential volume of CO2 stored by storage type options and Asset Lifecycle stage
0 10 20 30 40 50 60 70 80 90
Various options considered/not specified
Depleted oil and gasreservoirs
Deep saline formations
Enhanced oil recovery (EOR)
Potential volume of CO2 (Mtpa)
Operate Execute Define Evaluate Identify
9.2
POTENTIAL ROLE OF CO2 EOR IN CCS
CO2 EOR has long been of interest to the CCS community as an opportunity for developing technical knowledge and for
study of large-scale fi eld deployment of CO2 injection. Increasingly, however, it is being viewed as a likely means of advancing
CCS deployment more broadly. This is largely because CO2 EOR can provide or support a business case for the capture and
delivery of CO2, thereby fostering development and improvement in capture methods and ultimately lowering their associated
costs. In turn this may expand infrastructure and distribution networks to access additional storage sites, which will lead to
gains in scientifi c and technical knowledge around aspects of geologic storage including risk management, monitoring and
verifi cation, and modelling and simulation of the subsurface behaviour of CO2.
Natural gas processing, the production of ammonia and ethanol, ethylene plants, and coal gasifi cation all produce high
concentrations of CO2 as part of their standard industrial processes and have a comparatively low cost of capture. These
low-cost anthropogenic sources of CO2 are those typically used currently for EOR, and are serving as vanguards for the
development of CCS as an integrated solution to carbon storage. Outside the US, A-CO2 is the largest source of CO
2 for EOR.
In the US, projects under construction and planning since 2010 have greater growth in A-CO2 than development of natural
sources, and thus A-CO2 is expected to become increasingly important in the next decade. Current CO
2 prices for EOR
in the US are typically US$10–40/tonne (Godec 2011) and revenues from its sale can cover capture costs from low-cost
anthropogenic sources. For CCS projects with relatively higher capture costs, such as power generation, revenue from CO2
sales can cover some, but not all, of the additional costs. In this way CO2 EOR can become an important element toward CCS
development activity, particularly in North America but also in Europe, Latin America, the Middle East, and China.
Nonetheless, there are differences between a generic CO2 EOR operation and a CO
2 EOR operation targeting the storage of
A-CO2, including:
anthropogenic CO2 must, clearly, be used as the source, as transferring natural CO
2 from one geologic reservoir to another
(the oil field) does not reduce emissions overall; and
monitoring and verification activities currently associated with CO2 EOR are applied to optimise oil production, and not to
establish baselines or demonstrate conformance and permanence of storage.
The mechanisms involved in the EOR process do result in permanent geologic storage of CO2 but in the absence of policy
or other fi nancial benefi t, CO2 EOR sites will not be operated for CO
2 storage. Most individual fi elds offer considerably more
capacity for carbon storage potential than utilised in normal production operations, and a GHG policy would provide incentives
for operators to store more CO2.

147C O2 E N H A N C E D O I L R E C O V E R Y A S C C S
How does it work? Injection of CO
2 for EOR is a well-established technology used to increase oil production in many mature fi elds. Oil fi elds
suitable for CO2 EOR have some similar characteristics, although a wide variety of reservoir types can be effectively used. As
stated previously, oil fi elds undergoing CO2 EOR have typically gone through primary and secondary phases of production
and, in general, if the fi eld responded favourably to a water-fl ood and if more than 25 per cent of the original oil remains in the
reservoir, the fi eld is a promising candidate for CO2 EOR. Hovorka and Tinker (2010) provide an accessible technical overview
of the CO2 EOR process.
FIGURE 66 Schematic diagram of a water-alternating-gas (WAG) miscible CO2 EOR operation
Source: ARI and Melzer Consulting (2010).
CO2 EOR usually targets reservoirs greater than 800 m deep as the pressure and temperature at these depths maintains
the CO2 in a dense or supercritical state. After CO
2 injection has begun it can take months or more than a year before
breakthrough occurs and the injected CO2 begins to be produced along with oil. The produced CO
2 is separated from the oil,
collected, compressed, and re-injected into the reservoir. Ideally, as much purchased CO2 as possible is produced with the oil
as this refl ects effective reservoir sweep, but importantly re-injection or recycling reduces the need to purchase additional CO2.
With time, the amount of recycled CO2 progressively increases in an EOR operation so that the need for newly-purchased CO
2
is reduced until at some point the operation may be able to rely almost entirely on recycled CO2 (Figure 67). Eventually, most
of the injected CO2 becomes permanently contained within the reservoir in unconnected pores, trapped on mineral surfaces,
or dissolved in immobile oil and is no longer available to the EOR cycle. This trapping or retention of CO2 is continuously
occurring while CO2 is being injected and recycled and is considered incidental storage. Industry experience indicates
incidental trapping will eventually involve up to 90–95 per cent of purchased CO2 over the project life (Melzer 2012). The
remaining CO2 not incidentally trapped is also permanently contained and distributed within the reservoir, either dissolved in
unproduced mobile oil or undissolved as dense CO2 so that effectively all the injected CO
2 is retained within the subsurface.
Melzer (2012) provides a clear and detailed description of this geologic storage mechanism.

T H E G L O B A L S TAT U S O F C C S : 2 0 1 2148
Time
Time
Oil production (barrels)
Time from C02 injection
to incremental oil production
Point of economical
production shut-down
Start CO2 EOR
oil production
CO2 injection (tonnes)
Start C02
injection
Purchased C02
Recycled C02
FIGURE 67 The relationship between oil production, purchased CO2, and recycled CO
2
Source: Jakobsen et al. (2005).
Associated storage CO
2 EOR is a demonstrated commercial process that can be applied to many existing oil fi elds to address declining oil
production and is associated with permanent geologic storage of CO2. In the present operating environment, in which there
is no incentive to inject additional CO2 beyond that needed for profi table oil recovery, the associated carbon storage can be
considered incidental to the normal operating procedures as described above. Other storage scenarios that may be envisioned
within CO2 EOR include incremental storage, in which either additional CO
2 is injected into the reservoir during the EOR
operations (beyond that required to optimise profi ts) or through injecting additional CO2 post EOR operations. Both of these will
require changes to reservoir management, monitoring techniques, and additional expense for the surplus CO2. In addition, CO
2
can be injected into non-oil-bearing strata as a buffer for balancing supply with injection requirements during operations.
CO2 EOR storage opportunities globally
The recently released North American Carbon Storage Atlas (NACSA 2012) indicates that about 136 Gt of CO2 storage potential
exists in Canadian and US oil fi elds (Mexican fi elds were not included). This is a signifi cant volume of storage potential, and
although more capacity is estimated for saline formations, CO2 EOR operations currently represent more CO
2 injection than
any other uses of CO2. They additionally provide a business case to develop and improve CO
2 capture facilities and transport
infrastructure more broadly, and provide existing opportunities for scientifi c and technical learning around long-term storage.
Although CO2 EOR production from North America currently represents about 90 per cent of the world’s production, globally
there are many areas with suitable fi elds. In Europe, Tzimas et al. (2005) and Gozalpour et al. (2005) indicated that the
North Sea oil fi elds offer the greatest potential as many are, without implementing tertiary methods such as CO2 EOR, nearing
the end of their productive lives. Lack of low-cost CO2 and high capital expenses have limited development in Europe, but
potentially there is an incremental 8 billion barrels in the UK, Norwegian, and Danish sectors that would result in about 5 Gt
of CO2 storage (Tzimas et al. 2005). Onshore European opportunities for CO
2 EOR appear mainly limited to the Pannonian
Basin region of Croatia, Romania, and Hungary where CO2 EOR was deployed in the 1970s. Interest in CO
2 EOR is also high
in the Middle East with several national oil companies pursuing commercial agreements for CO2 purchase. In China, national
oil companies also are aggressively investigating the potential of CO2 EOR, having demonstrated success in pilot operations by
CNCP at the Jilin oilfi eld for several years (Jin et al. 2012, ARI 2009). In Brazil, some of the offshore fi elds in the Santos basin
are expected to produce more than 10 Mtpa of CO2 and CO
2 may be reinjected into the reservoir to boost production. Mexico
and Indonesia are also considering CO2 EOR as an option for their declining onshore and offshore fi elds.

149C O2 E N H A N C E D O I L R E C O V E R Y A S C C S
Support for CO2 capture
Presently about 75 per cent of global CO2 use for EOR is from natural accumulations of CO
2 in geologic reservoirs, the use
of which cannot be considered to mitigate GHG emissions (as it would not have been emitted without extraction for specifi c
use in EOR). The A-CO2 sources typically used for EOR produce relatively high concentrations of CO
2 that can be captured at
relatively low cost. These lower cost A-CO2 sources include:
fermentation at ethanol plants;
separation of CO2 from hydrogen production at ammonia plants;
processing of natural gas to remove associated CO2;
separation of CO2 at ethylene oxide plants; and
gasification of coal.
In contrast, there are high-cost sources of CO2 that produce high volumes of CO
2 at low concentrations which must fi rst
concentrate CO2, thereby incurring signifi cant additional costs. Examples of higher-cost A-CO
2 sources include:
fossil fuel-based electricity generation;
refineries;
cement manufacture; and
iron and steel manufacture.
Although the full cost of CO2 from high-cost sources is greater than CO
2 EOR producers are willing to pay, there are a number
of government-supported CCS projects around the world which are targeting EOR as an important component in their overall
business cases to cover part of the cost of capture (Table 18).
TABLE 18 LSIPs in Defi ne or Execute stages involving power generation and intending to supply CO2 for EOR
PROJECT STAGE PROCESS CO2 MTPA LOCATION
Boundary Dam Execute Sub-critical coal-fi red 1.0 Canada
Kemper County Execute Integrated gasifi cation combined cycle 3.5 United States
Tenaska Trailblazer Defi ne Super-critical coal-fi red 5.75 United States
NRG Energy Parish Defi ne Sub-critical coal-fi red 1.5 United States
HECA Defi ne Integrated gasifi cation combined cycle 2.0 United States
HPAD Defi ne Other 1.7 United Arab Emirates
Don Valley Defi ne Integrated gasifi cation combined cycle 4.75 United Kingdom
Texas Clean Energy Defi ne Integrated gasifi cation combined cycle 2.5 United States
The Kemper County IGCC project intends to capture 3.5 Mtpa CO2 beginning in 2014 and the SaskPower Boundary Dam
retrofi t project plans on capturing 1 Mtpa in early 2014; both projects intend to sell CO2 for EOR. Both coal projects have
received government funding to pay for the cost of demonstrating CO2 capture: Kemper County (US$705 million) and
Boundary Dam (US$305 million). The sale of CO2 for EOR is an important source of revenue for these projects. The Texas
Clean Energy project also has a contract to sell CO2 for EOR from its fertiliser operations and receives support as well
(US$663 million). The value of CO2 sales to these projects can be substantial, and complements government support.
The contractual price of CO2 for these projects is not public. Historically, CO
2 prices have ranged between US$10–40/tonne
(Godec 2011). Assuming a price of US$25/tonne of CO2, the total value to a project selling 1 Mtpa over 20 years would
be around US$287 million (at a 6 per cent real discount rate). Selling more CO2 or receiving a higher price would result in
increased value to a project.

T H E G L O B A L S TAT U S O F C C S : 2 0 1 2150
9.3
INFLUENCING FACTORS ON CO2 EOR AS CCS
Market and price for CO2
A key driver for the interest from CCS projects in EOR is the revenue stream that can be delivered. Five of the eight operating
LSIPs sell CO2 to CO
2 EOR operators. These are fully commercial endeavours at prevailing CO
2 prices with the revenue covering
the capture and transport costs from low-cost sources, such as the natural gas processing, synfuels, or fertiliser sectors, and
has developed along with the broader US EOR market over the past 40 years.
CO2 EOR production is linked to the price of oil, and rising oil prices have increased the demand for CO
2. In response, the
number of active CO2 EOR projects rose from 78 in 2002 to more than 130 in 2012. The price of CO
2, strongly infl uenced by
regional constraints in supplying CO2, also increased with rising demand during this period.
The EIA (2012) and IEA (2011a) each project that oil prices will continue to increase over the next decade, increasing the
demand for CO2 and leading to increased CO
2 supplies. In the US the supply of CO
2 is expected to increase by 50 per cent
by 2015 relative to 2010 production levels, and could potentially double by 2020 (Figure 68) (EIA 2012). More than half this
growth will come from A-CO2 which will become increasingly important during the following decade (DiPietro et al. 2012).
Growth in oil output may lag behind growth in use of CO2 because high oil prices encourage operators in existing fi elds to inject
CO2, even when rates of production are lower than previously targeted rates of production. The average rate of use of CO
2 in
the US is estimated to be 0.5 tonnes of CO2/barrel of oil in 2011 (Bloomberg 2012). This is an increase from 0.3–0.4 t CO
2/
barrel of oil for some projects as described by earlier studies (Gozalpour et al. 2005, Godec 2011).
With increasing pipeline investments to relieve supply constraints, together with additional A-CO2 supply sources being
developed, it is expected that over the medium term CO2 prices will be set by these low-cost anthropogenic sources.
Until 2020, and in the absence of coherent GHG policies in the US, there is little fi nancial impetus to develop higher cost
anthropogenic sources of CO2 for EOR other than in demonstration projects with government support unless effective GHG
mitigation policies are introduced.
FIGURE 68 Projected US supply of CO2 for EOR by source
Natural CO2 Gas plants
Other low-cost anthropogenic CO2
High-cost anthropogenic CO2
20
0
40
60
80
100
120
2010 2015 2020
Pote
nti
al vo
lum
e o
f C
O2 (
Mtp
a)
Source: DiPietro et al. (2012) and projects in the Defi ne stage of the Global CCS Institute’s Asset Lifecycle Model (Appendix C).
151C O2 E N H A N C E D O I L R E C O V E R Y A S C C S
Benefi ts of CO2 EOR for government support of
CCS developmentMost government-supported demonstration projects of CO
2 capture currently under construction in North America intend to
sell CO2 for EOR. This is an important source of revenue for the demonstration project and reduces the amount of government
support needed to make the project fi nancially viable. A more diffi cult benefi t to quantity in using captured CO2 for EOR is
additional government revenue. Generally, oil recovery from CO2 EOR is about 10–20 per cent higher than without enhanced
methods. Therefore, policies that increase the supply of A-CO2 and expand CO
2 EOR production, increase government revenue
from royalties, corporate income, and oil production taxes.
The cost of government subsidies supporting CO2 capture for EOR can potentially be partially or completely offset by growth in
government revenue from increased oil production. Based on this, the National Enhanced Oil Recovery Initiative (NEORI 2012)
has proposed a production tax credit to support CO2 capture for EOR; NEORI projects that the cost will be completely offset by
an increase in other government revenue.
The NEORI proposed tax credit would be provided through a competitive bidding process in a series of tranches: a pioneer
tranche for commercial-scale, ‘fi rst mover’ projects, followed by two subsequent tranches, one for electric power and one for the
industrial sector when the technology is more mature. The industrial tranche would include sub-tranches for both lower-cost
and higher-cost CCS technologies. Though funding would be provided over four decades, greater support would be targeted in
earlier years so that total yearly support peaks in 2024. NEORI (2012) estimates that a full take-up of its policy would directly
support the storage (with appropriate monitoring and reporting) of approximately four billion tonnes of CO2 over 40 years.
Though public policies implemented in other sectors might create similar increases in income and sales tax revenue, CO2 EOR
programs generate additional revenue from government royalties and severance taxes from increased oil production.
With increasing concern about near-term and long-term government budgets, government expenditures to support the
development and demonstration of CO2 capture (and associated monitoring, measuring, and verifi cation technologies)
compete with other programs for scarce government funds. In demonstrating net positive benefi ts to the community from
government funding, CO2 capture and storage demonstration projects linked to CO
2 EOR have the advantage that there is the
potential for government expenditures to be partially (or even completely) offset by increases in government revenue from
increases in oil production.
Contracting for CO2
Contracts for CO2 sales from N-CO
2 generally refl ect the large body of precedents developed for the sales of natural gas.
Typical terms of such contracts include commitments by the buyer and seller stating base and maximum quantities, quality
specifi cations, banking and make-good provisions, and terms from less than fi ve years up to 15 years. Payment terms vary
from volume-based under non-fi rm contracts to take-or-pay arrangements for fi rm contracts. Contracts of less than a year
generally have no adjustment to the agreed contract price, whereas longer term contracts typically have semi-annual or
quarterly adjustments to the price of CO2. These may incorporate an agreed fl oor price combined with a linear escalation of the
CO2 price above that fl oor in accordance with the oil price (Veld and Phillips 2009).
The terms and conditions of contracts developed for fi rm sales of N-CO2 would appear to meet the requirements for A-CO
2. As
noted above, such contracts can be long term and include take-or-pay commitments and payments on termination. Given the
high capital costs and long-life nature of the capture assets, industrial and power CCS projects typically require long terms and
revenue certainty.
The following three issues need to be addressed to extend to A-CO2 the principles for the sale of N-CO
2:
1. risk issues around interruption and the potential impact this can have on EOR operations (e.g. fi eld de-pressurisation);
2. future environmental obligations; and
3. sharing of the value of emission reduction carbon credits and/or voluntary emission reductions.
A further key difference is the impact on A-CO2 projects of changes in EOR operations over time as more recycled CO
2 is
utilised. For N-CO2, shifts in demand (such as ramping production up or down to accommodate fl uctuations in injection rates)
are readily accommodated by natural reservoirs. However, for A-CO2 such demand shifts are diffi cult to accommodate and,
given the economic gap facing A-CO2 projects, plants want all of the CO
2 captured to be sold and not vented.
The key implication of this is that ‘single source, single sink’ is an inadequate model for the development of anthropogenic
sources of CO2. The needs of both the CO
2 supplier and the EOR operator are better delivered by ‘multiple source, multiple
sink’ network arrangements that allow better balancing of supply and demand.
T H E G L O B A L S TAT U S O F C C S : 2 0 1 2152
These issues are part of the negotiating framework between buyers and sellers used to justify either a discount (due to
risks around interruption and environmental obligations) or a premium (due to sharing in future carbon value) to prices for
anthropogenic sources of CO2. They are also part of the reason that when signifi cant N-CO
2 sources are available A-CO
2 can
prove diffi cult to sell to oil producers.
Well-characterised legal and regulatory regimesA long history of activity, in a number of jurisdictions, has resulted in a well-characterised system of law and regulation for
the injection of CO2 as part of EOR operations. This is particularly true of North America, where oil companies in the US and
Canada continue to inject large volumes of CO2 under the auspices of their existing legal and regulatory frameworks applying
to oil and gas.
The US provides the most complex model for the regulation of EOR activities, although it affords EOR operators a clearly
defi ned system of law and regulation, as well as distinct roles and responsibilities for federal and state-level regulators.
Predicated upon historic experience, the resulting combination of commercial law, property law, and regulations addressing
injection activities, it provides a refi ned system which governs the sale and acquisition of CO2, the transportation of CO
2, the
construction of pipelines, ownership and access rights to pore space, authorisations to inject CO2 and conduct EOR operations;
and post-closure abandonment procedures and responsibilities.
A similar methodology for the regulation of CO2 EOR activities has also been employed by federal and provincial regulators in
Canada. Several key distinctions do exist, however, most notably with regard to subsurface mineral and petroleum rights which
in Canada tend to be more often owned by provincial governments than private individuals.
In Europe, where there has been less CO2 EOR activity, there is less regulatory experience. CO
2 EOR activities in Hungary and
in the North Sea have been regulated under existing oil and gas law and regulation. Much of the regulatory focus in Europe
remains upon the design and implementation of legislation for the storage of CO2 as a climate change mitigation activity.
Emergence of CCS-specifi c law and regulationsIn recent years there has been widespread development of CCS-specifi c legislation, which has sought to incentivise and
remove barriers to the technology, as well as regulate the contingent processes associated with storage. The EU (and its
Member States), Australia, Canada, and the US have all enacted legislation to regulate the entire CCS process or discrete
aspects of it. Whereas approaches have ranged from stand-alone frameworks to amendment of existing petroleum or resource
legislation, all have sought, by providing regulatory certainty, to establish CCS as a legitimate technology for reducing CO2
emissions into the atmosphere.
The EU, through its Storage Directive (Directive 2009/31/EC), has adopted one of the most comprehensive examples of CCS-
specifi c legislation by creating a permitting framework which applies traditional methods of pollution control and removes
obstacles to the technology. Amendments to the EU’s ETS allow for CO2, captured and stored in accordance with the Storage
Directive, to be treated as ‘not emitted’ for the purpose of the EU ETS. Accordingly, operators will not be required to surrender
allowances where emissions are captured and stored under the terms of the Storage Directive. The Directive’s recitals state
that EOR is ‘not in itself included in the scope of the Directive’, however, its provisions on environmentally safe storage are
applicable where EOR is ‘combined with geologic storage’.
The situation in North America differs greatly from that in Europe, with no dedicated national regulatory frameworks for CCS
in either the US or Canada. In Canada, the provincial governments of Alberta, Saskatchewan, and British Columbia have all
addressed, to some extent, the policy and regulatory environments for CCS. The most detailed regulatory regime has been
developed in Alberta, where the introduction of the Carbon Capture and Storage Statutes Amendment Act 2010 clarifi ed
issues relating to pore-space access and introduced requirements around the long-term liability of stored CO2. This was further
amplifi ed by the Carbon Sequestration Tenure Regulation Act 2011, which clarifi ed issues with respect to areas, monitoring
and verifi cation plans, durations, and closure for both Evaluation Permits and Carbon Sequestration Leases.
In the US, a number of states have developed legislation aimed at facilitating and permitting CO2 storage. The legislation
includes, in some instances, regulatory mechanisms for verifying and certifying the quantities of CO2 that may be stored during
particular phases of the EOR process, and provisions around storage site closure and post-closure. It is clear however, that for
many of these states, these developments are decisively aimed at incorporating captured CO2 into the EOR process, which in
some instances includes ensuring the ability to re-use stored CO2.
153C O2 E N H A N C E D O I L R E C O V E R Y A S C C S
9.4
CHALLENGES TO CO2 EOR AS CCS
Life-cycle analysis Anthropogenic CO
2 used and trapped within an EOR reservoir represents abated emissions, but questions have been
raised about whether it reduces GHG emissions on a project life-cycle basis. This is primarily because CO2 EOR involves
producing oil. Although energy is consumed and CO2 produced in the CO
2 EOR process, it is the emissions associated with
the combustion of the resulting refi ned petroleum products that can tip the balance from abatement to increased emissions
overall. If CO2 EOR just displaces other oil supplies, and does not change the level of petroleum product consumption, CO
2
EOR reduces emissions. For an example of a study that assumes no change in oil consumption see Faltinson and Gunter
(2010). See Jarmillo et al. (2009) for a study which compares life-cycle emissions from oil production from CO2 EOR relative to
other sources of oil.
The extent to which oil production from CO2 EOR is exactly offset by a reduction in other sources of oil supply depends on
the impact CO2 EOR has on global oil consumption and associated change in the market price of oil. A lower oil price will
be required to increase consumption. But a lower price of oil would reduce total oil supply from other suppliers as marginal
projects became uneconomic. That is, even as oil consumption increases, the change in consumption is less that the
incremental production of CO2 EOR as other supplies of oil decline in response to lower prices.
Based on recent estimates of the responsiveness of consumption and production to oil prices changes (e.g. Baumeister and
Peersman 2011), the increase in consumption is likely to be between 17–67 per cent of the increase in production resulting
from CO2 EOR with a median increase of 50 per cent. That is, given the demand and supply response, each barrel of oil
produced from CO2 EOR most likely displaces half a barrel of oil from other production sources resulting in a net increase in oil
consumption of half a barrel.
Given this range of likely consumption increases due to each barrel of CO2 EOR production then it is likely that there is a
net reduction in emissions when A-CO2 is used as the source given the average effi ciency of CO
2 EOR production. This
analysis includes accounting for the emissions associated with recycling the CO2 and refi ning the oil into petroleum products.
Nonetheless, in certain cases, if production of oil is very high for a given amount of injected CO2 it is possible for net emissions
to be positive at a project level. Although defi ning the boundaries of a project is critical to correctly account for life-cycle
emissions from EOR, even including the energy and CO2 costs incurred in the cleaning, compression and transport of the CO
2,
an unpriced good that would otherwise be released to the atmosphere still results in negative life-cycle emissions on average.
CO2 availability
Low-cost CO2 supply is often limited in quantity and restricted geographically, and not always available near appropriate oil
fi elds. Projects can support pipelines several hundred kilometres long if the volume of delivered CO2 is large enough to achieve
economies of scale, but longer lengths can be prohibitively costly for a single site. Rising oil prices and energy security concerns
of the late 1970s and early 1980s increased US interest in expanding CO2 EOR production, but a lack of low-cost nearby
CO2 prevented its development. During the mid-1980s, construction of pipelines hundreds of kilometres long connected
natural CO2 sources in Colorado and New Mexico to the Permian Basin, and this drove a rapid expansion in CO
2 EOR projects
(Bradley 2011). In Canada, the Weyburn CO2 EOR project was large enough to support construction during the late 1990s of
a 320 km pipeline from a coal gasifi cation plant across the border in North Dakota. Developments in the rest of the world such
as in Hungary, Turkey, Brazil, Mexico, and China are typically linked to low-cost CO2 supplies near suitable oil fi elds.

T H E G L O B A L S TAT U S O F C C S : 2 0 1 2154
FIGURE 69 Sources of CO2 for EOR and distribution pipelines in the US
McElmo Dome natural source
Jackson Dome natural source
Great Plains Coal GasificationPlant anthropogenic source
LaBarge Gas Plant anthropogenic source
Lost Cabin Plant anthropogenic source
Ammonia plants anthropogenic sources
Antrim Gas Plant anthropogenic source
Sheep Mountain Wells natural source
Bravo Dome natural source
Gas plants anthropogenic sources
UNITED STATES OF AMERICA
LEGEND
Natural CO2 source In service
ProposedAnthropogenic source
Different colours represent different pipeline operations
Source: Data supplied by Ventyx, United States Department of Energy’s National Energy Technology Laboratory and National Sequestration Database and Geographic
Information System, modifi ed by the Global CCS Institute.
HIGH-COST ANTHROPOGENIC CO2 SOURCES NEED
MORE THAN EOR ALONE
For CCS projects associated with the power, steel, and concrete industries the cost of capture technology is signifi cant and is
still primarily at the demonstration stage. In addition, such projects face increased operating and maintenance costs and an
‘energy penalty’ by implementing CO2 capture.
For example, Tenaska, the main proponent of a 600 MW net supercritical pulverised coal-based power station project in Texas,
US (the ‘Trailblazer Project’), has stated that for these type of projects the addition of a carbon capture plant adds about 30
per cent to capital costs, approximately 10 per cent to operating and maintenance costs, and reduces net electrical output by
about 25 per cent of what would otherwise be available for sale (Tenaska 2011).
Although the evidence to date from projects in the US and Canada is that sales of CO2 for EOR, while helpful, are not enough
in isolation to close this gap, it is noteworthy that the government-supported Kemper County IGCC and SaskPower Boundary
Dam projects are proceeding with capture and intended sales of CO2. As described previously, the current demand vs. supply
dynamics are unlikely to support high-cost capture until around 2020.
In conjunction with other support measures, sales of CO2 for EOR can provide a range of benefi ts to such high-cost projects,
such as:
contributing towards closing the commercial gap;
mitigating integration risk between capture, transport, and storage elements of the CCS chain; and
mitigating the risk in relation to cost and timeframe (which can be 5–10 years or more and hundreds of millions of dollars in
cost) to develop a suitable greenfield deep saline formation to the level of certainty required for FID.

155C O2 E N H A N C E D O I L R E C O V E R Y A S C C S
Legal and regulatory challengesThe opportunities for CO
2 EOR operations using A-CO
2 to transition to full CO
2 storage projects are tempered by the legal and
regulatory regimes which have emerged around the two distinct processes. Where adequate policy settings and economic
drivers exist, policymakers and regulators must consider the adequacy of their legal and regulatory environment to enable and
encourage a transition.
ENABLING A TRANSITION WITHIN THE LAW
Regulators seeking to enable a transition from EOR activities to full-scale geologic storage must consider the extent to which
a legal and regulatory regime governing CO2 EOR may also support the injection and storage of A-CO
2. Consideration of the
scenarios in which CO2 may be stored, together with the legal and regulatory regimes that govern them, reveals that a number
of legal barriers to the integration of the two activities remain.
It is important that the legal and regulatory framework accurately identifi es property rights involved in each storage scenario.
The rules should also address competing uses of the subsurface and provide a mechanism to resolve potential confl icts.
One example of potential confl ict may arise in jurisdictions where pore space occupied by a mineral is not available for CO2
storage unless the rights to that mineral are also acquired. It may be necessary to amend laws to allow for the acquisition of
property rights or owner consents across the various storage scenarios. Issues around property rights associated with storage
are alleviated somewhat in jurisdictions where ownership of pore space has been vested in the State. In these instances, the
determination of resource management and priority of use will become increasingly important for government.
Presently in the US, CO2 storage during CO
2 EOR operations is viewed by the EPA as presenting a lower risk than other
storage operations mainly because of the pressure management provided by the concurrent injection of CO2 and extraction of
reservoir fl uids (including the oil and recycled CO2). During the basic storage model in which CO
2 is stored during normal EOR
operations, the EPA determined that the Class II wells regime would continue to apply. Where there is proposed incremental
storage with the aim of maximising CO2 storage, the EPA suggests this will ‘likely’ increase risk and that an operator should
determine whether a Class VI well permit is required. Given that various factors may affect the risk profi le of a particular
operation, it is important for the regulatory framework to be appropriately adapted to the risk profi le presented.
Some regulatory frameworks for CCS require a high degree of assurance that injected CO2 will not return to the atmosphere. In
contrast, for EOR a similar high level of documented scrutiny has not been employed. Meeting the permanence requirements
expected for CCS under some regulatory frameworks may require additional monitoring and accounting protocols for CO2 EOR
relative to current practices, but not likely more onerous than for sequestration sites using saline formations.
Post-closure liability has proved particularly signifi cant during the design and implementation phases of many of the new
regulatory models for CCS. Where there is the likelihood of potential damage to third parties, potentially occurring far into the
future, policymakers may choose to ensure that some sort of industry-funded compensation scheme is available. It is unclear
how costly the schemes would be and during the early years of CCS development whether it is possible to create a large
enough pool of funds to suffi ciently spread the risk among participants. This may lead to costs that discourage participation
of commercial EOR operators. Many operations are presently within jurisdictions that have orphan well schemes (which are
much more limited in scope). Policymakers may also wish to create a stewardship entity for storage sites to address potential
incidents over an extended period that may exceed the lifetime of private companies or even of nations. However, the cost and
complexity of trying to establish and fund such a stewardship entity may prove prohibitive; consequently, shorter time frames
or more limited responsibilities for the stewardship entity may ultimately need to be accepted.
In developing CCS regulations, it is desirable to require CCS and CO2 EOR operators to undertake actions which signifi cantly
lower the expected risk of leaks and to make them liable for costs due to leaks if they fail to undertake these actions.
Increasing requirements to avoid leaks and liability for leaks necessarily increases the cost to operators. Where the costs
of transitioning from CO2 storage during EOR operations to dedicated storage are greater than the anticipated benefi ts, the
transition will not occur. Policymakers will need to consider the issues of costs and benefi ts in crafting liability rules that they
deem appropriate under the circumstances.
T H E G L O B A L S TAT U S O F C C S : 2 0 1 2156
9.5
STATUS OF CO2 EOR AS CCS
The intent or objective of CCS is the long-term isolation of CO2 in the deep subsurface as a means of managing the risks of
global climate change. At present, CO2 EOR operations in North America and in other oil basins in Eastern Europe, the Middle
East, South America, and China are injecting anthropogenic CO2 into maturing oil reservoirs where the CO
2 is likely to be
permanently stored. The capacity for storage in these fi elds, while signifi cant, is less than that available in saline reservoirs
and, by itself, less than required for CCS to mitigate CO2 emissions to the atmosphere.
Additionally, for CO2 EOR projects to be recognised as CCS, certain regulatory thresholds will need to be met, including levels
of reporting regarding monitoring, measurement, and verifi cation requirements. There are no current overarching regulations
or guides regarding the transition of a CO2 EOR project into a dedicated storage project. However, CO
2 EOR offers benefi ts
to the body of knowledge needed to implement CCS, including useful experience in handling and injecting CO2, modelling,
predicting its behaviour in the subsurface, and demonstrating effective monitoring methodologies.
CO2 EOR may also create a revenue stream for the project proponents, since demand for CO
2 EOR is driven by high oil prices
which create incentives to increase the supply of oil. Although there may be a willingness to pay a high price for CO2 when
oil prices are high, the price will primarily be determined by the availability of supply sources. Over the next decade the CO2
price is expected to be determined by low-cost CO2 sources. CO
2 prices alone will be insuffi cient to support relatively high-cost
projects associated with electricity or iron and steel.
CCS requires credible long-term climate change policies to enable investment in both demonstration and deployment,
particularly for the majority of large-scale, relatively high-cost sources of CO2 emissions. When credible GHG mitigation policies
are introduced, then CO2 EOR can accelerate the development of a broad-scale CCS industry – since CO
2 EOR effectively
brings forward the revenue stream required to support large-scale CCS projects, leading to earlier deployment than if the only
driver was climate policy. In the absence of GHG policy, CO2 EOR is unlikely to lead to additional geologic storage beyond what
the commercial CO2 EOR market delivers.
CO2 EOR is supporting projects today, but it will not lead to a CCS industry by itself. CO
2 EOR does offer benefi ts to the
demonstration and deployment of CCS, and it adds to the body of knowledge needed to implement CCS broadly. This includes
the development of numerous materials, technologies, and industrial best practices that should be directly transferable to the
large-scale commercial adoption of CCS across the global power and industrial economies. Overall, CO2 EOR is likely to have
a substantial role in the next decade supporting CO2 storage and development of capture technology. Its role will diminish in
future decades as the need to store much larger volumes of CO2 will require the use of dedicated storage such as saline aquifers.
Opposite: Photo courtesy of Cenovus Energy.


10PUBLIC ENGAGEMENT
10.1Emerging trends in public engagement 159
10.2Public engagement success factors 165
10.3Improving understanding of CCS 169

159P U B L I C E N G A G E M E N T
KEY MESSAGES › Public engagement and communication is increasingly recognised as a
fundamental project management component for most CCS demonstration
projects.
› All communication and engagement activity around a CCS demonstration
project should be designed to build and reinforce trust between a developer
and key stakeholders.
› Effort is required to improve understanding of CCS technology and its wider
low-emission energy context.
The term ‘public engagement’ is used generically to describe multiple areas of stakeholder interaction – from dealings with key
infl uencers over project progress (such as regulators and local site communities) to interaction with a more broadly defi ned
public, including media and environmental NGOs. For all but a few CCS projects based in isolated locations, key stakeholder
lists can be long and varied.
High-profi le examples of the effects of organised public opposition in Europe, in combination with increased sensitivity to
public spending following the GFC, means that proponents of CCS demonstration projects must become more adept at
understanding and engaging with key stakeholders. The topic of public engagement is therefore growing in international
signifi cance.
For the 2011 project survey, the Global CCS Institute sought specifi c information from project proponents regarding their
progress in the creation and execution of public engagement strategies. The 2012 project survey further developed these
themes to examine the type of communities that CCS projects are dealing with, the communication and engagement tools
that projects have found successful, key areas of concern voiced by stakeholders, the current levels of satisfaction with the
project’s community data, and public engagement strategies as risk-mitigation tools.
In this chapter, interesting trends in the 2012 project survey data are identifi ed and refl ected on in the context of best practice
lessons emerging from early demonstration projects and applied social research.
Short case studies are used to highlight two themes that consistently emerge from project feedback and social research: the
need to improve understanding of CCS and energy more generally, and the importance of building and maintaining trust as a
fundamental success factor in any public engagement strategy.
10.1
EMERGING TRENDS IN PUBLIC ENGAGEMENT Most public engagement best practice guidance will cite the importance of understanding the local context of a site and
tailoring activities and messages to meet those specifi c needs.
This site specifi city makes it notoriously diffi cult to monitor trends in public engagement activity for CCS demonstration
projects, however, with this caveat in place, the responses to 2012 project survey highlight some potential focus areas which
largely correlate with key areas of learning emerging from social research data and early CCS demonstration experience.

T H E G L O B A L S TAT U S O F C C S : 2 0 1 2160
Public engagement recognised as a key component of project management Early demonstration projects have consistently shown the value of both early stakeholder engagement and of embedding
communication/engagement expertise within a project management team from the outset of a project (Ashworth et al. 2010a).
The ROAD Project in Rotterdam, the Netherlands, cites the integration of stakeholder management expertise in their project
team as the fi rst key lesson that can be taken from their current successful public outreach process (Kombrink et al. 2011).
The UK’s Peterhead Project also recognises the value of a wide skill-set in a CCS project team:
Given the importance of managing stakeholder engagement for a CCS project, we made sure
that we had communication expertise integrated into our project management team from a very
early stage. It is really important to have broader social and political viewpoints represented when
making important project decisions.
George Clements, Development Manager, SSE, Peterhead CCS Project, UK.
Evidence from early CCS demonstrations and also from other large industrial projects have shown that announcing project
plans before engaging with local communities and other affected stakeholders and familiarising them with the project
contributes to signifi cant confl ict between stakeholders (Russell and Hampton 2006).
Growing recognition of the importance of managing stakeholder communication and engagement is evident from the 2012
project survey results in which a high percentage of projects (in all but the earliest Identify phase of the project lifecycle) have,
or are in the process of developing, a public engagement strategy (Figure 70).
FIGURE 70 Status of public engagement strategies in responding projects
0 5 10 15 20
Identify
Evaluate
Number of projects
Ove
rall p
roje
ct
stage
Project has strategy Currently developing strategy
In need of strategy Strategy not required
Operate
Execute
Define
However, the survey results also highlight that a relatively large fraction (13 of the 56 LSIP respondents) report that their CCS
project did not require a public engagement strategy. These results are largely explained by projects citing remote geographic
locations, successful achievement of necessary permissions, or projects located on privately-owned land.
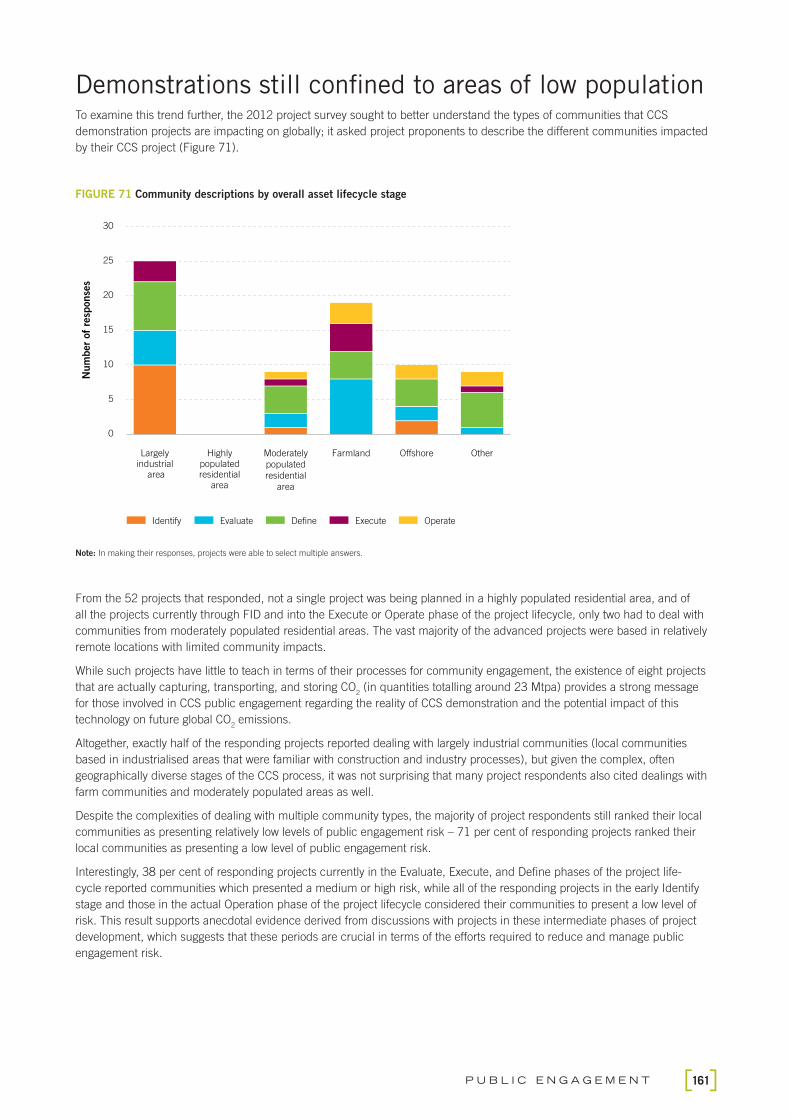
161P U B L I C E N G A G E M E N T
Demonstrations still confi ned to areas of low populationTo examine this trend further, the 2012 project survey sought to better understand the types of communities that CCS
demonstration projects are impacting on globally; it asked project proponents to describe the different communities impacted
by their CCS project (Figure 71).
FIGURE 71 Community descriptions by overall asset lifecycle stage
0
5
10
15
20
25
30
Largelyindustrial
area
Highlypopulatedresidential
area
Moderately
populated
residential
area
Farmland Offshore Other
Operate Execute Define Evaluate Identify
Num
ber
of
resp
onse
s
Note: In making their responses, projects were able to select multiple answers.
From the 52 projects that responded, not a single project was being planned in a highly populated residential area, and of
all the projects currently through FID and into the Execute or Operate phase of the project lifecycle, only two had to deal with
communities from moderately populated residential areas. The vast majority of the advanced projects were based in relatively
remote locations with limited community impacts.
While such projects have little to teach in terms of their processes for community engagement, the existence of eight projects
that are actually capturing, transporting, and storing CO2 (in quantities totalling around 23 Mtpa) provides a strong message
for those involved in CCS public engagement regarding the reality of CCS demonstration and the potential impact of this
technology on future global CO2 emissions.
Altogether, exactly half of the responding projects reported dealing with largely industrial communities (local communities
based in industrialised areas that were familiar with construction and industry processes), but given the complex, often
geographically diverse stages of the CCS process, it was not surprising that many project respondents also cited dealings with
farm communities and moderately populated areas as well.
Despite the complexities of dealing with multiple community types, the majority of project respondents still ranked their local
communities as presenting relatively low levels of public engagement risk – 71 per cent of responding projects ranked their
local communities as presenting a low level of public engagement risk.
Interestingly, 38 per cent of responding projects currently in the Evaluate, Execute, and Defi ne phases of the project life-
cycle reported communities which presented a medium or high risk, while all of the responding projects in the early Identify
stage and those in the actual Operation phase of the project lifecycle considered their communities to present a low level of
risk. This result supports anecdotal evidence derived from discussions with projects in these intermediate phases of project
development, which suggests that these periods are crucial in terms of the efforts required to reduce and manage public
engagement risk.

T H E G L O B A L S TAT U S O F C C S : 2 0 1 2162
Public engagement as a risk-mitigation strategyLessons emerging from both social research and early CCS demonstration experience highlighted the critical role of
communication and public engagement as a project risk mitigation function (Bradbury et al. 2011). To explore this further,
the survey asked projects that had, or were developing, a public engagement strategy to assess the suitability of their current
community data and engagement strategies as tools for understanding, anticipating, and mitigating public engagement risk
(Figure 72).
FIGURE 72 The extent to which projects consider consultation activities with impacted local communities are suffi cient for
anticipating and mitigating public engagement risk
Sufficient In progress Not sufficient Not necessary
19%
44%
35%
2%
Over half of the responding projects expressed confi dence in their current engagement and communication activities. That is,
they felt they were either suffi cient or on track to anticipate and mitigate public engagement risks in their local communities.
These results seem to support the general trend, where projects are taking a more sophisticated approach to public
engagement activities.
The 2012 project survey results also reveal a substantial number of projects reporting dissatisfaction with both their
understanding of local communities and their current levels of engagement. Best practice consistently reiterates the
importance of gaining a sound understanding not just of a project’s stakeholders, but of the wider social context in which a
potential project is expecting to operate.
Understanding a project’s social context should form a fundamental part of a project’s initial risk assessment process. The
subsequent creation of a public engagement strategy is ideally a positive, proactive, trust-building exercise, but in project
management terms many projects fi nd it useful to badge the strategy as a detailed risk mitigation strategy that requires
monitoring and management like any other project risk (Bradbury et al. 2011).
The Toolkit for Social Site Characterisation (Wade and Greenberg 2011) and its Communication and Engagement Toolkit
(Ashworth et al. 2011) both offer an array of practical tools to assist project developers to gain a better understanding of their
local communities and stakeholders.

163P U B L I C E N G A G E M E N T
Social research highlights a number of key areas that projects should consider exploring to understand a project’s
social environment.
Local economic conditions: What are the major industries employing people in the community? Is the base more
service-oriented or industrial? How is the economic health of the community and the region? What is the tax base?
What are local energy costs?
Local empowerment: How established are local property owners? Does the community feel that it has a voice
in making decisions that impact the community? Are there positive or negative examples of these? What is the
community experience with industry or environmental concerns?
Underlying views: What are the local views and experience relating to climate change, coal-based energy,
renewable energy, coal mining, drilling, oil production, natural gas storage, and emissions trading? Is there a local
history of royalty payments for mineral or other property rights?
Environment: Has the community experienced environmental damage in the past? How was it resolved?
To help shape engagement approaches, the research is meant to identify both positive and negative impacts to a
project, but it can also infl uence a project’s technical design and planning elements. This social site information
will only be useful if it is truly integrated into the overall project planning and management of a project.
Note: Adapted from Wade and Greenberg (2011, p. 17).
A preference for face timeIn order to gain a better picture of the kind of public engagement activity that projects around the world are engaged in, the
Global CCS Institute asked all 2012 project survey respondents that had, or were developing, a public engagement strategy to
identify the engagement methods they found most helpful in their local communities (Table 19).
TABLE 19 Engagement methods responding projects found most helpful with local communities (multi-select answers)
Reported project experience, social research (Itaoka et al. 2012, Reiner et al. 2006 and de Best-Waldhober et al. 2008), and
large-scale public opinion surveys, such as the EC Eurobarometer (Eurobarometer 2011), and the Canadian and Albertan
perceptions of CCS survey (TransAlta 2011) all indicate that large segments of the population have very little knowledge of
CCS and issues related to low-carbon energy more generally. Social science research confi rms that when people are missing
information or direct experience with a particular risk or issue, they will seek information from sources around them – from
friends or other trusted sources of information (Wade and Greenberg 2011, Rowe and Wright 2012).
Given this context, it is perhaps not surprising that all of the respondents cited face-to-face meetings of some form as the most
helpful methods of engaging with local communities. Site visits also ranked particularly highly, along with media coverage and
communication materials.
ANSWER RESPONSE PERCENTAGE OF RESPONDENTS
SELECTING ANSWERS
Face-to-face meetings 31 100
Formal consultation events 22 68
Media 21 68
Communications material 20 65
Site visits 19 61
Websites 14 45
Education programs 10 32
SOCIAL RESEARCH HIGHLIGHTS

T H E G L O B A L S TAT U S O F C C S : 2 0 1 2164
A number of respondents clarifi ed that they were using the full suite of engagement tools, but tools such as websites, posters,
and leafl ets were created as support materials to enhance face-to-face interaction with stakeholders.
In the end it’s about the people behind the monoliths. It’s about personal contact, you have to be
sensitive and that means you have to invest time and money and effort. In our experience if people
get the impression you have good intentions and that you are willing to listen you will be successful.
Marc Kombrink, Director Stakeholder Management, ROAD, the Netherlands.
Storage risks top the list of community concernsResults from a comparison study of four international large group workshops designed to inform stakeholders about CCS and
other climate issues (held in Australia, the UK, Canada, and the Netherlands), found that participants’ perceptions of CCS
tended to focus on the perceived risks and uncertainties associated with the technology. Workshop participants in each
country raised questions around CCS safety, the likelihood of unplanned leaks of CO2, and the likelihood of CO
2 remaining
safely stored for long periods of time, but other areas of questioning spanned a host of wider economic and social concerns
(Ashworth et al 2012).
The 2012 project survey results echo these fi ndings. The survey asked projects for feedback on their most frequently raised
stakeholder concerns. The health, safety, and environmental impacts of onshore CO2 storage topped the project survey
list, closely followed by health, safety, and environmental concerns regarding onshore transportation of CO2. The next most
reported concerns were around the cost/benefi t of CCS and potential impacts to community property values.
These fi ndings undoubtedly point to the need for those trying to communicate the benefi ts of CCS to be able to provide
accurate information on key technical topics such as the properties of CO2, CO
2 behaviour underground, and CO
2 behaviour in
its different phases of transportation. However, social research and emerging project experience indicates that allaying public
concerns around future CCS demonstration projects involves much more than a simple provision of facts, or a beautifully
crafted scientifi c argument. It is not simply about what is communicated, but how it is communicated.
To help with the delivery of technical project information, a number of recent CCS demonstration projects such as ROAD,
Getica CCS, Compostilla and Longannet have reported great success in providing communications training for their project’s
technical staff.
We have found that just providing a basic level of communication training to the technical staff
on our project greatly improved their confi dence and ability to interact with a wider array of
stakeholders. We have worked hard to make sure that our project staff can hold dialogs and
present in a balanced way – explaining both the benefi ts and potential risks of CCS technology,
using language their audience can understand! Having technical staff able to present in public
has brought real credibility to our outreach and education work.
Gloria Popescu, Head of Knowledge Sharing and Communication at the
Romanian Institute for Studies and Power Engineering (ISPE), Getica CCS, Romania.
Multiple sources of risk research (on CCS but also on more established topics such as nuclear power and genetically modifi ed
crops) confi rm that the ‘general public’ assess risk based on a range of factors, not just probabilistic assessments or empirical
facts (Bradbury et al. 2011). This more expansive approach to risk assessment becomes particularly evident in the case of
evolving technologies like CCS that are still in the demonstration and learning phase of development. Risk communication in
this kind of uncertain environment relies very heavily on establishing trust between the communicator and stakeholder.
CSIRO’s comparison of fi ve international CCS projects (Ashworth et al. 2010a) found that the projects that were framed as
research projects and were aligned to research organisations were more readily accepted than those initiated or fronted by
a private company. Projects led by private companies that have been well received – despite not being aligned to specifi c
research projects – tend to have either framed their project as part of a responsible approach to business as usual (CO2 EOR
projects in North America), or they have gone to great lengths to demonstrate the knowledge-sharing public good components
of the project.

165P U B L I C E N G A G E M E N T
It’s all about the economy
The people who endorsed us talked about it (CCS) being a vital tool in the battle against
climate change. I don’t think that that kind of argument worked at a local level, within the local
community, they didn’t care. We would bring it up and they would say ‘oh that’s nice for us’.
Norm Sacuta, Director of Communication, Weyburn, Canada.
Framing a project and creating the messages and resources to communicate its value should be a fairly site and stakeholder-
specifi c process. A strong project communication/engagement strategy will take the time to consider interested, affected, and
infl uential stakeholders impacted by the project, and then frame their message to address questions like: What is the value of
the project? Why is it taking place here? Why should I care about this? How will this directly impact me?
The experiences emerging from many of the early demonstration projects is that multiple ways of framing a project are
required. For example, the potential of CCS to make a critical contribution to lowering the world’s carbon emissions is an
important context for early, high-level engagement activities, but local communities affected by a CCS demonstration show very
little interest in the importance of CCS for lowering their nation’s carbon emissions. Instead, messages around sustainable job
creation and skill development opportunities are likely to be more relevant.
A clear trend emerged from responses made by all 10 projects that answered a request for information on the benefi ts that
projects were communicating to local stakeholders. All mentioned some kind of economic benefi t including future-proofi ng
traditional local industries, creating new jobs and skills, development opportunities, improving access to CO2 for EOR-related
projects, and general improvements to a region’s energy-related infrastructure.
This focus on the potential economic benefi ts that a project might bring a region or community has become increasingly evident
as larger numbers of CCS demonstration projects have started moving from the ‘identify phase of the project life-cycle into the
Evaluate and Defi ne phases and have had to undertake more direct interaction with communities impacted by CCS demonstration.
This ‘direct’ or ‘human’ approach supports one of the key recommendations of the international research team that compared
the communication and outreach practices of fi ve early CCS projects. The team emphasise the importance of fi rst identifying,
and then clearly articulating, the local benefi ts of a project; communications should be designed to address stakeholders’
needs, not push out generic information (Ashworth et al. 2010a).
10.2
PUBLIC ENGAGEMENT SUCCESS FACTORSThere is a wealth of public engagement-related resources designed to support CCS project proponents and other interested
stakeholders with the design and implementation of a CCS engagement and communication strategy (Ashworth et al. 2010a,
Ashworth et al. 2011, European CCS Demonstration Project Network 2012, NETL 2009, CATO-2 2008 and WRI 2010).
Through collaborations with CCS demonstration projects, CSIRO, and a network of international social researchers, the
Global CCS Institute’s knowledge platform now contains over 50 different public engagement and communication knowledge
products – including an internationally trialled and peer-reviewed toolkit with supporting resources (Ashworth et al. 2010a,
Ashworth et al. 2011, Wade and Greenberg 2011 and Bradbury et al. 2011).
Encouragingly, respondents to the 2012 project survey indicated a strong uptake of the available international resources, in
support of their existing in-house and project-specifi c guidelines. The gradual release of early demonstration project lessons
and experience is helping to improve the relevance of public engagement best practice and guidance.
Researchers, such as the European-funded SiteChar group (SiteChar 2011), are now beginning to monitor and report on
projects as they deploy these best practice guides, capturing lessons that will improve processes and fast-track learning for
future project proponents.
By consolidating the best current social research with the experiences and emerging lessons from early CCS demonstrations, it
is possible to identify a number of factors common to projects with successful public engagement programs (Table 20).
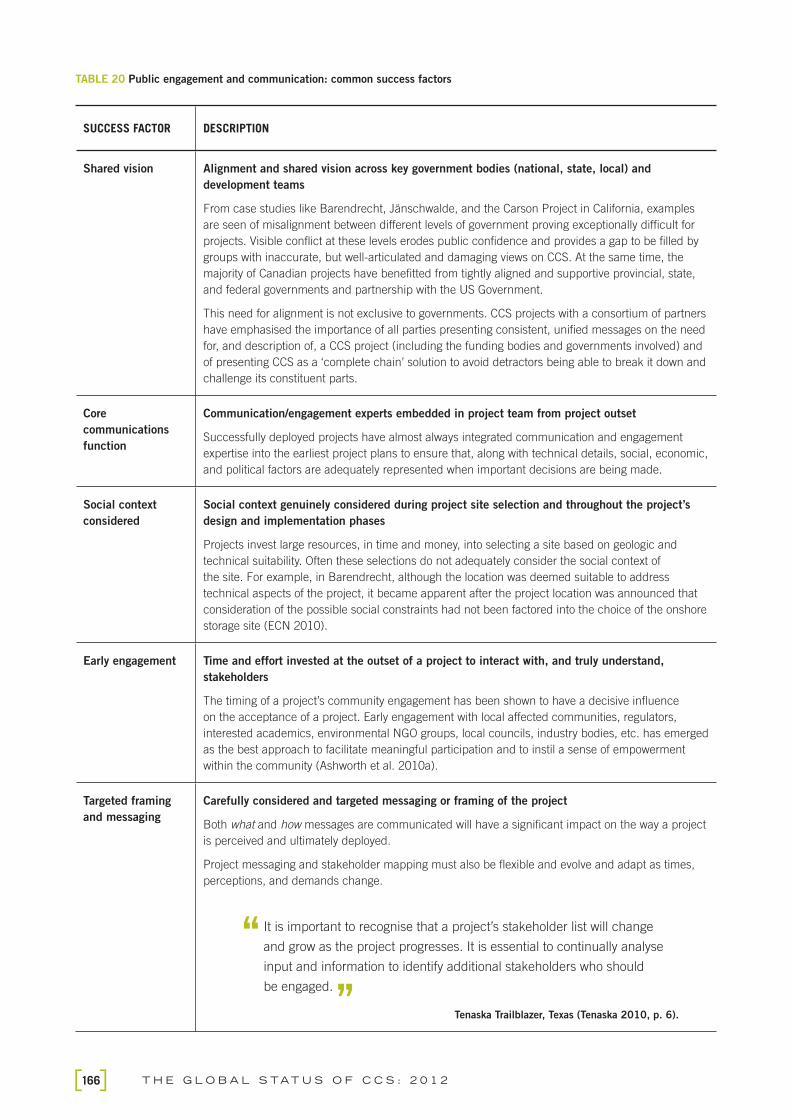
T H E G L O B A L S TAT U S O F C C S : 2 0 1 2166
TABLE 20 Public engagement and communication: common success factors
SUCCESS FACTOR DESCRIPTION
Shared vision Alignment and shared vision across key government bodies (national, state, local) and
development teams
From case studies like Barendrecht, Jänschwalde, and the Carson Project in California, examples
are seen of misalignment between different levels of government proving exceptionally diffi cult for
projects. Visible confl ict at these levels erodes public confi dence and provides a gap to be fi lled by
groups with inaccurate, but well-articulated and damaging views on CCS. At the same time, the
majority of Canadian projects have benefi tted from tightly aligned and supportive provincial, state,
and federal governments and partnership with the US Government.
This need for alignment is not exclusive to governments. CCS projects with a consortium of partners
have emphasised the importance of all parties presenting consistent, unifi ed messages on the need
for, and description of, a CCS project (including the funding bodies and governments involved) and
of presenting CCS as a ‘complete chain’ solution to avoid detractors being able to break it down and
challenge its constituent parts.
Core
communications
function
Communication/engagement experts embedded in project team from project outset
Successfully deployed projects have almost always integrated communication and engagement
expertise into the earliest project plans to ensure that, along with technical details, social, economic,
and political factors are adequately represented when important decisions are being made.
Social context
considered
Social context genuinely considered during project site selection and throughout the project’s
design and implementation phases
Projects invest large resources, in time and money, into selecting a site based on geologic and
technical suitability. Often these selections do not adequately consider the social context of
the site. For example, in Barendrecht, although the location was deemed suitable to address
technical aspects of the project, it became apparent after the project location was announced that
consideration of the possible social constraints had not been factored into the choice of the onshore
storage site (ECN 2010).
Early engagement Time and effort invested at the outset of a project to interact with, and truly understand,
stakeholders
The timing of a project’s community engagement has been shown to have a decisive infl uence
on the acceptance of a project. Early engagement with local affected communities, regulators,
interested academics, environmental NGO groups, local councils, industry bodies, etc. has emerged
as the best approach to facilitate meaningful participation and to instil a sense of empowerment
within the community (Ashworth et al. 2010a).
Targeted framing
and messaging
Carefully considered and targeted messaging or framing of the project
Both what and how messages are communicated will have a signifi cant impact on the way a project
is perceived and ultimately deployed.
Project messaging and stakeholder mapping must also be fl exible and evolve and adapt as times,
perceptions, and demands change.
It is important to recognise that a project’s stakeholder list will change
and grow as the project progresses. It is essential to continually analyse
input and information to identify additional stakeholders who should
be engaged.
Tenaska Trailblazer, Texas (Tenaska 2010, p. 6).

167P U B L I C E N G A G E M E N T
SUCCESS FACTOR DESCRIPTION
Flexible project
implementation
strategy
Having the ability to adapt solutions to meet stakeholder concerns
Flexibility in project implementation, whether allowing time for informal discussions before
project announcements, or identifying multiple options for storage or pipeline sites, provides
greater opportunity to involve community stakeholders in some project decision making (Ashworth
et al. 2010b).
At Quest, we demonstrated our commitment to responding to community
input by making a total of 30 changes to our initial pipeline route in order
to take account of community feedback. Upfront community consultation
had tangible benefi ts for our project, with mostly positive responses
from the community during our public hearing.
Len Heckel, Business Opportunity Manager, Shell Canada Energy, Quest project, Canada.
This can be a diffi cult process to manage and requires close integration between technical, project
management, and engagement staff. However there is strong evidence from CCS projects and other
analogous industries that where stakeholders can be involved in some decision-making processes
and can see the impact their involvement has had on project outcomes, trusting partnerships begin
to emerge and are usually highly fruitful (Bradbury et al. 2011).
Even if design fl exibility is diffi cult, it is important that all decision-making processes and timelines
are still made explicit to stakeholders to elicit trust in the transparency of the decision-making
processes.
Note: Listed success factors are adapted from Ashworth et al. (2010a).

T H E G L O B A L S TAT U S O F C C S : 2 0 1 2168
Building trustThe common factor at the root of all these success factors is the practice of building trust. Essentially, all communication and
engagement activity around a CCS demonstration project should be designed to build and reinforce trust and understanding
between a developer and their stakeholders – that is why public engagement work must start early, and demonstrate
commitment, consistency, respect, and honesty.
If CCS is being cast, in some circles, as the Cinderella of future low-carbon energy technologies, then the Spanish
Government-funded City of Energy Foundation (CIUDEN) might just have the right magic spell to be considered its fairy
godmother. There was no royal ball, but the Compostilla Project did manage to engage local communities to such an
extent that the project in the Spanish village of Hontomín is now celebrated and considered part of the local community.
CIUDEN was created by the Spanish Government to support research, development, and demonstration of advanced
clean coal technologies, as well as drive social and economic regeneration in the mining region of El Bierzo in Northwest
Spain, and by extension to improve technology development at a national level.
On the Compostilla Project, CIUDEN works in partnership with the project coordinator and Spain’s leading electricity
company, Endessa, and boiler technology provider, Foster Wheeler. Like a number of other successful CCS demonstration
projects worldwide, the Compostilla Project coordinates most of its education and outreach work through the consortium
research partner, in this case CIUDEN.
From planning through to execution, CIUDEN’s engagement activities for the fi rst phase of the Compostilla Project were a
textbook example of best practice public engagement and communication. Activities included:
comprehensive social site characterisations and stakeholder identification processes carried out at every phase of
the project;
an outreach strategy and communication plan developed to target different levels of stakeholders from local
communities through to policy makers and media;
engagement expertise fully integrated into the project management through a ‘communication panel’ of both
communication and technical staff from all three consortium partners, as well as representatives from academia
and the media;
tailored messaging and communication material to specific audiences;
project staff trained in communication and engagement; and
running of a proactive outreach and education campaign, both with a presence at local events and by organising
tours, site visits, and other events at the project site and learning centre.
Moving into the industrial phase of the project, problems started to emerge. The project had to engage with a different
community when it scaled up for the next phase (moving from the storage test site in Hontomín to the industrial
storage site in Sahagun). It had undergone a change of leadership (from CIUDEN to the project co-ordinators
Endessa), and it was starting a permitting process during a time of political uncertainty due to national elections.
When some local permits were denied and environmental NGOs started to leafl et communities against fossil fuels and
CCS, the Compostilla team had to regroup and take immediate action.
It emerged that the project had started to undertake geological assessments prior to any meaningful public engagement in
the community to explain what the project was about. The mistrust this created was compounded by the public face of the
project moving to a large power generator rather than the research scientists from Hontomín.
CIUDEN’s communication lead, Monica Lupion, refl ects on the lessons learned by the Compostilla Project at this juncture.
You’re asking people to accept something they don’t know very much about, and
that you yourself are saying is a new technology, will always, in the end, come down
to a matter of trust. There was nothing wrong with Endesa, it is simply that in the
current economic climate there’s a distrust of big business.
BUILDING TRUST IN THE CITY OF ENERGY

169P U B L I C E N G A G E M E N T
The project’s original communication reformed and embarked on an intensive community engagement campaign.
Says Lupion:
We knew we were coming to the problem late, but we felt we still had time to
undertake proper engagement and start winning back that trust – before opposition
became too big to handle and people’s opinions became too entrenched. We
needed to be dynamic and take an innovative approach, not just sit there and say
“we’ll do it this way, because this is the way we’ve always done it”.
The group held multiple visits and open days at the City of Energy museum, with staff handpicked for their
communication ability with different stakeholder groups. These were social events with wine and snacks, to
encourage people to take an interest in what is a really important regeneration project for this area of Spain.
Lupion is clear that all the communication activity that they undertook to recover this phase of the project was about
providing an honest assessment of the facts in a manner that builds mutual respect.
Our job was just to explain the facts about CCS in a way that people can understand.
We made sure we had plenty of third-party advocates such as academics at the
meetings who could explain things in everyday terms. The theory says you need
everyone’s permission – you don’t. But you do need everyone to see that you are
listening to their concerns.
Permits to continue the geological survey for Spain’s full chain CCS project, Compostilla, were awarded, and at the
end of 2011 the activities in the area restarted. Local media hailed it as a great step forward. The decision about
the technical viability of Sahagun as a site for CO2 storage is expected in December 2012, before the FID of the
Compostilla Project.
10.3
IMPROVING UNDERSTANDING OF CCSAlthough the CCS industry is demonstrating a growing recognition of the importance of engaging with communities and other
interested and infl uential stakeholders, multiple public opinion surveys and workshop results have shown that CCS remains
a relatively unknown quantity with the wider public (Itaoka et al. 2012, Reiner et al. 2006 and de Best-Waldhober et al. 2008).
Despite its potential to make a substantial impact on future CO2 emissions (IEA 2012b), CCS suffers from something of an
image problem: it is not a renewable energy technology and therefore is not as palatable for political sound bites; it is not a
single piece of technology that can be easily packaged and encapsulated in nice imagery; its relationship with fossil fuels
creates an uneasy tension with environmental activists; it is easily confused with extraction technologies such as CSG; and an
understanding of the relative cost and risks associated with CCS in comparison to other low-carbon technologies requires a
level of scientifi c literacy and familiarity with complex energy markets.
Research emerging from a CSIRO-led international study into people’s perceptions of CO2, and the implications for their
acceptance of CCS, highlights a fundamental lack of knowledge about the basic properties and behaviour of CO2 among the
general public (including its role in anthropogenic climate change) (Itaoka et al. 2012). The results of interviews and focus
groups held in Japan, the Netherlands, and Australia revealed a tendency to perceive CO2 negatively as toxic and harmful.
Common misperceptions shared by survey respondents included the belief that CO2 had qualities similar to air pollution or soot
and that it could be fl ammable or explosive.
T H E G L O B A L S TAT U S O F C C S : 2 0 1 2170
Among the key recommendations in the report is a reminder to those communicating about CCS not to assume prior knowledge.
Many members of the public still require basic information on climate change, CCS, and their
relationship to CO2 emissions. Awareness of these topics does not directly imply knowledge, as for
example, more participants indicated having heard of CCS than did actually understand what it is.
Itaoka et al. (2010, p. 10).
There is also a recommendation to consider the sources and style of information being presented on CCS, recommending a
softer, education-based approach for harder-to-reach stakeholders.
Additional CCS education and outreach campaigns should be planned through less formal
mechanisms. Given a correlation between trust in informal sources and poorer understanding
of CCS, sole reliance on formal information and communication sources (i.e., public sector
organisations, local government, national newspapers, and scientists) may not reach the people
with the poorest understanding of CCS, who instead place their trust in NGOs, friends, and
the internet.
Itaoka et al. (2012, p. 10).
Cambridge University’s recent survey of current global CCS communication highlighted that there had been improvements
since the last survey in 2008, but that there is still a technical bias in most communication, with little attention to the
socio-economic issues around CCS deployment (Corry and Reiner 2011).
The Cambridge survey fi ndings also supported a CSIRO study into CCS education materials available worldwide,
acknowledging that while there were a growing variety of online education resources and a few bespoke examples of CCS
education materials, very few attempted to create resources that could be meaningfully integrated into a teaching curriculum.
Both studies highlighted the need for educational resources created by independent bodies, which included teaching
strategies and learning support for teachers, and consider the social, political, environmental, and economic aspects of CCS as
well as the technical components.
In August 2012 the Global CCS Institute launched its fi rst set of CCS education materials. Both the primary and
secondary school curriculum resources and supporting teacher notes are available to download from the Institute’s
website.
The materials were created by CSIRO in response to a global review of publicly available CCS education resources,
which exposed a gap in knowledge, with teachers reporting a particular lack of confi dence in teaching students about
CCS and low-carbon technologies (Colliver et al. 2011).
CSIRO program developer, Angela Colliver, explained:
For teachers to have trust in these resources, it was essential to prove that they were
scientifi cally sound and easily adapted to fi t within a school’s existing curriculum
activities. These resources use the latest science and inquiry-based learning
methodologies to inspire students to do their own research and learn more about
climate change and the potential role of low-emissions technologies in a
low-carbon future.
CARBONKIDS

171P U B L I C E N G A G E M E N T
The Global CCS Institute resources underwent extensive reviews by scientifi c and educational experts, as well as
classroom trials in both Australian and international schools and use a teaching methodology known as ‘enquiry-
based learning’ to encourage students to self-research to form and justify their own opinions. In Australia, the
resources were fully integrated into CSIRO’s sustainability program for schools, ‘CarbonKids’.
Although the resources were specifi cally mapped to fi t the Australian national curriculum, they are easily transferable
to most modern curricula. The Global CCS Institute is currently developing plans to trial an international support
system for educators looking to incorporate CCS resources into their national or regional curricula.
FIGURE 73 Year 6 students from St Anne’s School, Western Australia, demonstrating CCS using household items.
A number of challenges remain for public engagement around CCS, and most are inextricably linked to the challenges
facing CCS development more generally. These are improving understanding of CCS and the need to consider low-carbon
technologies in a future energy mix, making the business case for CCS at both a local and national level, and providing tangible
demonstration experience to improve industry, government, and public confi dence in both the commercial and technical
viability of the technology.
However, it is encouraging that best practice guidance, rooted in actual demonstration experience, is beginning to emerge. It
is even more encouraging that projects appear to be using at least elements of this guidance to improve the sophistication and
quality of their public engagement and communication strategies.
Just as public engagement strategies have to be fl exible and evolve as situations change, it is essential that effort is
undertaken to monitor and capture learning from demonstration projects currently using best practice guidance to engage with
stakeholders. Only by maintaining this continual loop of knowledge-sharing can we improve and adapt public engagement
activities and ultimately improve public understanding of CCS and its crucial role in a low-carbon energy future.
T H E G L O B A L S TAT U S O F C C S : 2 0 1 2172
APPENDIX A: 2012 PROJECTS SURVEY
A.1 Overview of data analysis processSince 2009, the Global CCS Institute has maintained a comprehensive database on CCS projects in order to quantify progress
made towards CCS demonstration. Historically, the Institute’s dataset on LSIPs has been compiled from an annual project
survey completed by lead project proponents. This survey monitors projects’ progress through the asset lifecycle. It is
supported by primary research undertaken by the Institute’s Australian, North American and European offi ces, with results
retained for proprietary analysis and displayed in summary form on the Institute’s public website and within its Global Status of
CCS reports.
For 2012, the Institute has improved data quality and relevance to more accurately understand and report on project
demonstration and movement. At the time of publication, the Institute had received survey returns from 75 per cent of
surveyed projects. This demonstrates a high level of direct engagement with projects around the world and forms an empirical
basis for analysis. For those projects that did not complete the survey this year, previously collected and publically available
data was used for analysis purposes.
A key element to these improvements was the adoption of a statistical framework driving stronger process and control through
survey efforts, and creating the appropriate supporting structures to reinforce this.
There are fi ve phases to the Institute’s framework.
1. Development phase: during which planning for the conduct of the survey and the topics on which information is to be
collected are determined.
2. Collection phase: covers those activities undertaken up to and including the lodgement of the completed survey forms
from projects.
3. Processing phase: covers the capture of responses on survey forms and representation in Institute systems.
4. Analysis/Dissemination phase: the key objective is to produce a statistical package which can inform annual reporting
on overall development of CCS projects and their respective contributions toward demonstration.
5. Evaluation phase: evaluation activity brings together all phases to assess performance in preparation for the following
year/s.
This sequence provides the Institute with the ability to adopt a repeatable process with the necessary supporting structures
in place.
In addition to this, the Institute undertook a series of interviews with projects in 2012 and gratefully acknowledges instructive
discussions with Green Hydrogen, Getica CCS, ROAD, South West Hub, Don Valley, Peterhead, and Quest.

173A P P E N D I C E S
A.2 Reconciliation of LSIPs with 2011 Status ReportTable A1 outlines the major changes that have occurred amongst the LSIPs since the Global Status of CCS: 2011 report was
published in October 2011.
TABLE A1 Reconciliation of LSIPs with those presented in the Global Status of CCS: 2011 report
COUNTRY LSIP CAPTURE
CAPACITY
COMMENTS
Newly-identifi ed projects
China Datang Daqing Oxyfuel Combustion CCS
Demo Project
> 1 Mtpa New build super-critical coal-fi red power plant
generating electricity and heat, with oxyfuel combustion
CO2 capture. Operation is expected to start in 2015.
Datang Dongying Carbon Dioxide Capture
and Storage Project
1 Mtpa New build 1000 MWe coal-fi red power generation plant.
The plant will use one of Alstom’s CO2 capture
technologies.
Jilin Oil Field EOR Project > 0.8 Mtpa New build natural gas processing plant. Operation is
expected to start in 2015.
Shanxi International Energy Group CCUS
Project
> 2 Mtpa New build super-critical coal-fi red power plant with
oxyfuel combustion CO2 capture.
Shen Hua Ningxia Coal to Liquids Plant
Project
2 Mtpa New build coal-to-liquids plant.
Europe Caledonia Clean Energy Project TBA New build IGCC power plant with post-combustion CO2
capture and use of CO2 for EOR. Operation is expected
to start in 2015.
Sargas Green Power Plant Malta 1.2 Mtpa New build fl uidised bed boiler power plant that would
capture around 1.2 Mtpa of CO2 from two 180 MWe
modules for use in EOR.
Industrikraft Möre AS Norway 1.4 Mtpa New build natural gas-based power plant scheduled to
begin operations in 2016.
United States NRG Energy Parish CCS Project 1.5 Mtpa Retrofi t of post-combustion capture technology at a coal-
fi red power plant in Texas. The CO2 will be used for EOR.
An air permit application was fi led in September 2011,
an EIS process is underway, and the FEED is continuing.
Operation is expected to start in 2015.
Projects removed from LSIP listing
Australia/New
Zealand
Browse Reservoir CO2 Geosequestration
Project
3 Mtpa Removed from the Institute’s LSIP listing in August
2012, after receiving confi rmation the project had been
put on hold.
Coolimba Power Project 2 Mtpa Removed from the Institute's LSIP listing in May 2012,
after receiving confi rmation no further investment would
be made into the project.
Canada Project Pioneer 1 Mtpa Cancelled in April 2012, due to the revenue from carbon
sales and the price of emissions reductions being
insuffi cient to fund the project.
continued on page 174

T H E G L O B A L S TAT U S O F C C S : 2 0 1 2174
COUNTRY LSIP CAPTURE
CAPACITY
COMMENTS
Europe Longannet Project 2 Mtpa Cancelled in December 2011 following announcement
by the UK Department of Energy and Climate Change
that it would not fund the construction of the CO2
capture facilities.
Peel Energy CCS Project 2 Mtpa Put on hold in June 2012, citing the economic slowdown
and uncertainties around public funding.
Vattenfall Jänschwalde 1.7 Mtpa Cancelled in October 2011, citing the lack of government
support and the absence of a clear legal framework.
United States Good Spring IGCC 1 Mtpa Removed from the LSIP listing in May 2012, after the
project was reconfi gured as a natural gas-fi red plant
without CO2 capture due to the lower price of natural gas
compared to coal.
Sweeny IGCC Power Project 5 Mtpa Cancelled in April 2012 following the split of
ConocoPhillips Company (oil and gas exploration and
development) and Phillips 66 Company (midstream
operations, refi ning and power generation).
Project progress
Europe Don Valley Power Project 4.75 Mtpa Moved to Defi ne in February 2012 following the
appointment of fi nancial and legal advisers, and the
choice of the capture technology provider.
United States Air Products Steam Methane Reformer
EOR Project
1 Mtpa Moved to Execute as it started construction in August
2011 – the new build hydrogen plant is expected to
begin operation in 2012.
Canada Quest 1.08 Mtpa Moved to Execute following the announcement by Shell
Canada on 5 September 2012 that it would proceed with
the construction of the project.
Swan Hills Synfuels A ’In-Situ Coal
Gasifi cation/Power Generation Project’
1.2–1.4
Mtpa
Moved to Defi ne, as a detailed FEED study is under way
and a capture technology provider has been selected,
while negotiations for the off-take of CO2 are at the
advanced stages.
Other key changes
Australia/New
Zealand
Surat Basin CCS Project 1 Mtpa Planned CO2 capture capacity was revised down to 1
Mtpa from 2.5 Mtpa.
China Shenhua/Dow Chemicals Coal to
Chemicals Plant Project (Yulin)
2.5 Mtpa Planned CO2 capture capacity was revised down to 2.5
Mtpa from 5 Mtpa.
Europe Sleipner CO2 Injection 1.1–1.2
Mtpa
Volume of CO2 captured and injected will be expanded to
1.1–1.2 Mtpa in 2014, with the addition of 0.1–0.2 Mtpa
of CO2 from the gas produced from the Gudrun fi eld,
currently under development.
Green Hydrogen 0.5 Mtpa Primary CO2 storage option was changed from EOR to an
offshore depleted gas fi eld.
continued from page 173
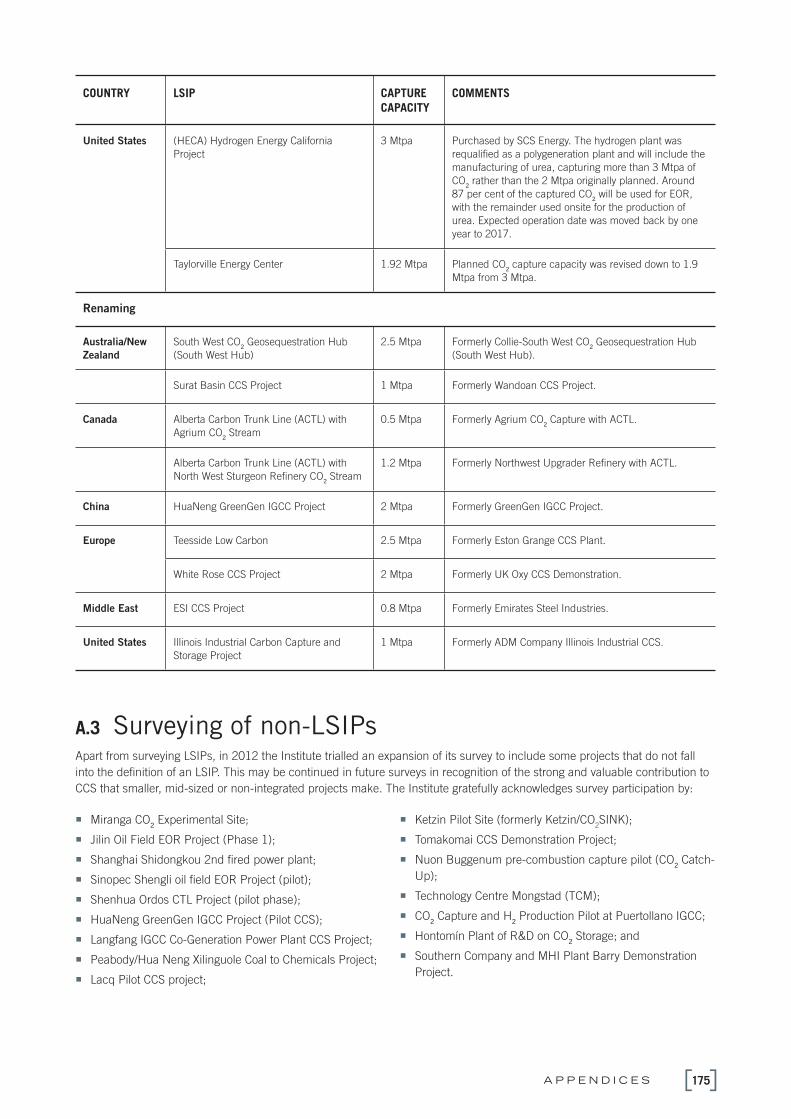
175A P P E N D I C E S
COUNTRY LSIP CAPTURE
CAPACITY
COMMENTS
United States (HECA) Hydrogen Energy California
Project
3 Mtpa Purchased by SCS Energy. The hydrogen plant was
requalifi ed as a polygeneration plant and will include the
manufacturing of urea, capturing more than 3 Mtpa of
CO2 rather than the 2 Mtpa originally planned. Around
87 per cent of the captured CO2 will be used for EOR,
with the remainder used onsite for the production of
urea. Expected operation date was moved back by one
year to 2017.
Taylorville Energy Center 1.92 Mtpa Planned CO2 capture capacity was revised down to 1.9
Mtpa from 3 Mtpa.
Renaming
Australia/New
Zealand
South West CO2 Geosequestration Hub
(South West Hub)
2.5 Mtpa Formerly Collie-South West CO2 Geosequestration Hub
(South West Hub).
Surat Basin CCS Project 1 Mtpa Formerly Wandoan CCS Project.
Canada Alberta Carbon Trunk Line (ACTL) with
Agrium CO2 Stream
0.5 Mtpa Formerly Agrium CO2 Capture with ACTL.
Alberta Carbon Trunk Line (ACTL) with
North West Sturgeon Refi nery CO2 Stream
1.2 Mtpa Formerly Northwest Upgrader Refi nery with ACTL.
China HuaNeng GreenGen IGCC Project 2 Mtpa Formerly GreenGen IGCC Project.
Europe Teesside Low Carbon 2.5 Mtpa Formerly Eston Grange CCS Plant.
White Rose CCS Project 2 Mtpa Formerly UK Oxy CCS Demonstration.
Middle East ESI CCS Project 0.8 Mtpa Formerly Emirates Steel Industries.
United States Illinois Industrial Carbon Capture and
Storage Project
1 Mtpa Formerly ADM Company Illinois Industrial CCS.
A.3 Surveying of non-LSIPsApart from surveying LSIPs, in 2012 the Institute trialled an expansion of its survey to include some projects that do not fall
into the defi nition of an LSIP. This may be continued in future surveys in recognition of the strong and valuable contribution to
CCS that smaller, mid-sized or non-integrated projects make. The Institute gratefully acknowledges survey participation by:
Miranga CO2 Experimental Site;
Jilin Oil Field EOR Project (Phase 1);
Shanghai Shidongkou 2nd fired power plant;
Sinopec Shengli oil field EOR Project (pilot);
Shenhua Ordos CTL Project (pilot phase);
HuaNeng GreenGen IGCC Project (Pilot CCS);
Langfang IGCC Co-Generation Power Plant CCS Project;
Peabody/Hua Neng Xilinguole Coal to Chemicals Project;
Lacq Pilot CCS project;
Ketzin Pilot Site (formerly Ketzin/CO2SINK);
Tomakomai CCS Demonstration Project;
Nuon Buggenum pre-combustion capture pilot (CO2 Catch-
Up);
Technology Centre Mongstad (TCM);
CO2 Capture and H2 Production Pilot at Puertollano IGCC;
Hontomín Plant of R&D on CO2 Storage; and
Southern Company and MHI Plant Barry Demonstration
Project.
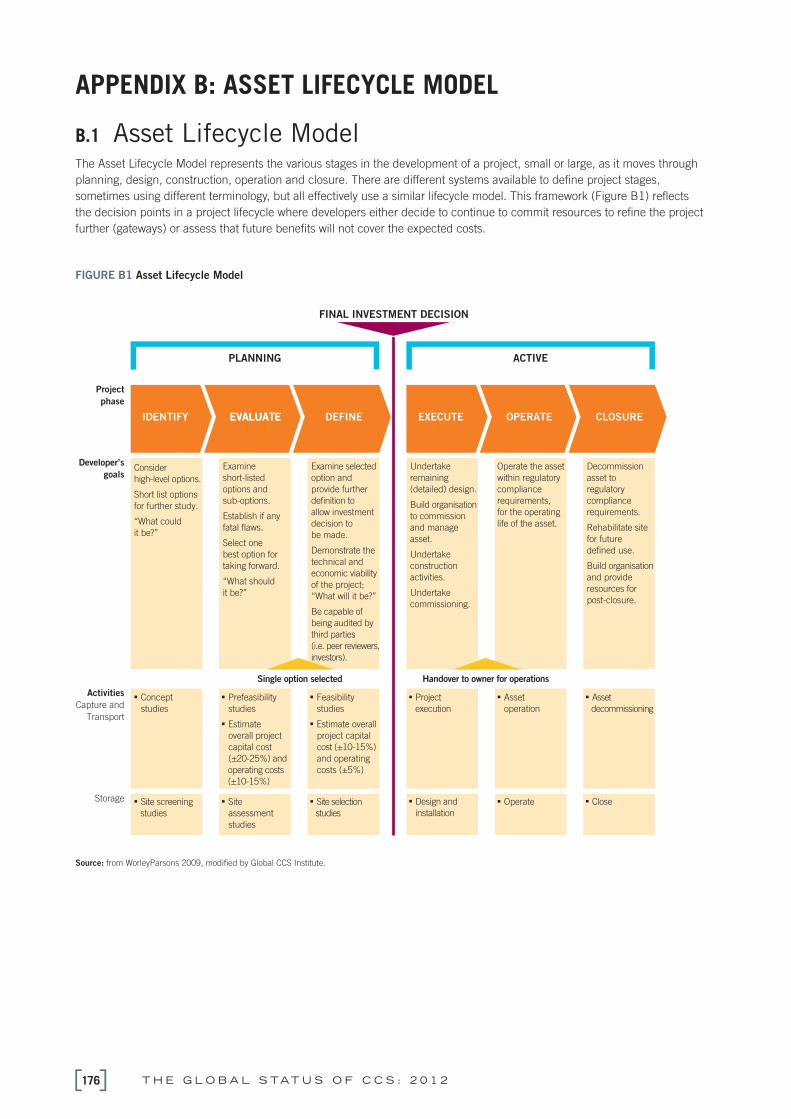
T H E G L O B A L S TAT U S O F C C S : 2 0 1 2176
APPENDIX B: ASSET LIFECYCLE MODEL
B.1 Asset Lifecycle ModelThe Asset Lifecycle Model represents the various stages in the development of a project, small or large, as it moves through
planning, design, construction, operation and closure. There are different systems available to defi ne project stages,
sometimes using different terminology, but all effectively use a similar lifecycle model. This framework (Figure B1) refl ects
the decision points in a project lifecycle where developers either decide to continue to commit resources to refi ne the project
further (gateways) or assess that future benefi ts will not cover the expected costs.
F IGURE B1 Asset Lifecycle Model
IDENTIFY
Consider
high-level options.
Short list options
for further study.
“What could
it be?”
Project
phase
Developer’s
goals
Activities
Capture and
Transport
Concept
studies
Prefeasibility
studies
Estimate
overall project
capital cost
(±20-25%) and
operating costs
(±10-15%)
Feasibility
studies
Estimate overall
project capital
cost (±10-15%)
and operating
costs (±5%)
Project
execution
Asset
operation
PLANNING ACTIVE
FINAL INVESTMENT DECISION
EVALUATEEVALUATE
Examine
short-listed
options and
sub-options.
Establish if any
fatal flaws.
Select one
best option for
taking forward.
“What should
it be?”
Single option selected Handover to owner for operations
DEFINE
Examine selected
option and
provide further
definition to
allow investment
decision to
be made.
Demonstrate the
technical and
economic viability
of the project;
“What will it be?”
Be capable of
being audited by
third parties
(i.e. peer reviewers,
investors).
EXECUTE
Undertake
remaining
(detailed) design.
Build organisation
to commission
and manage
asset.
Undertake
construction
activities.
Undertake
commissioning.
OPERATE
Operate the asset
within regulatory
compliance
requirements,
for the operating
life of the asset.
Asset
decommissioning
CLOSURE
Decommission
asset to
regulatory
compliance
requirements.
Rehabilitate site
for future
defined use.
Build organisation
and provide
resources for
post-closure.
Site screening
studies
Storage Site
assessment
studies
Site selection
studies
Design and
installation
Operate
Close
Source: from WorleyParsons 2009, modifi ed by Global CCS Institute.

177A P P E N D I C E S
A project is considered in ‘planning’ when it is in the Identify, Evaluate or Defi ne stages and is considered ‘active’ if it has made
a positive FID and has entered construction (Execute stage) or is in operation (Operate stage). As a project progresses through
each stage, the level of defi nition increases with an improved understanding of the scope, cost, risk and schedule of the
project. This approach reduces the uncertainty surrounding the project while managing upfront development costs.
In the Identify stage, a proponent carries out early studies and preliminary comparisons of alternatives to determine the
business viability of the broad project concept. For example, an oil and gas company believes that it could take concentrated
CO2 from one of its natural gas processing facilities and inject and store the CO
2 to increase oil production at one of its existing
facilities. To start the process the company would conduct preliminary desktop analysis of both the surface and subsurface
requirements of the project to determine if the overall project concept seemed viable and attractive. It is important that the
Identify stage considers all relevant aspects of the project (stakeholder management, project delivery, regulatory approvals and
infrastructure as well as physical carbon capture and storage facilities). Before progressing to the Evaluate stage, all the project
options that meet the overall concept should be clearly identifi ed.
In the Evaluate stage, the broad project concept is built upon by exploring the range of possible options that could be
employed. For the oil and gas company this would involve exploring:
which of its facilities, and possibly even facilities of other companies, might be best placed to provide the concentrated CO2
for the project;
possible pipeline routes that could be utilised from each of these sites and even alternative transport options such as
shipping if relevant; and
which oil production field is suitable for CO2 injection based on its proximity to the concentrated CO
2, the stage of oil
production at the field and other site factors.
For each option the costs, benefi ts, risks and opportunities would be identifi ed. The Evaluate stage must continue to
consider, for each option, all relevant aspects of the project (stakeholder management, project delivery, regulatory approvals,
infrastructure as well as physical carbon capture and storage facilities). At the end of this stage, the preferred option is
selected and becomes the subject of the Defi ne stage. The preferred option must be suffi ciently defi ned. No further key
options are to be studied in the Defi ne stage.
In the Defi ne stage, the selected option is investigated in greater detail by carrying out feasibility studies and preliminary FEED.
For the oil and gas company this would involve determining the specifi c technology to be used, the design and overall costs for
the project, the permits and approvals required and the key risks to the project. In addition, it involves undertaking a range of
activities such as focused stakeholder engagement processes, seeking out fi nance or funding opportunities and tendering for
and selecting an engineering, procurement and contracting supplier.
At the end of the Defi ne stage, the level of project defi nition must be suffi cient to allow for a FID to be made. The level of
confi dence in costing estimates should be ±10–15 per cent for overall project capital costs and ±5–10 per cent for project
operating costs. Collectively, the Identify, Evaluate and Defi ne stages can take between 4–7 years. Development costs to reach
a FID can be in the order of 10–15 per cent of overall project capital cost depending on the size, industry and complexity of
the project.
In the Execute stage, the detailed engineering design is fi nalised. The construction and commissioning of the plant occurs and
the organisation to operate the facility is established. Once completed, the project then moves into the Operate stage.
In the Operate stage, the CCS asset is operated within regulatory requirements and maintained and, where needed, modifi ed
to improve performance.
In the Closure stage, the CCS asset is decommissioned to comply with regulatory requirements. The site is rehabilitated for
future defi ned use and resources are allocated to manage post-closure responsibilities.

T H E G L O B A L S TAT U S O F C C S : 2 0 1 2178
LSIP
NO.
2012
OVERALL ASSET
LIFECYCLE
STAGE
PROJECT NAME DISTRICT COUNTRY INDUSTRY CAPTURE TYPE TRANSPORT
TYPE
1 Operate Val Verde Natural Gas
Plants
Texas United States Natural gas
processing
Pre-combustion
(gas processing)
Onshore to
onshore pipeline
2 Operate Enid Fertilizer CO2-EOR
Project
Oklahoma United States Fertiliser
production
Pre-combustion Onshore to
onshore pipeline
3 Operate Shute Creek Gas
Processing Facility
Wyoming United States Natural gas
processing
Pre-combustion
(gas processing)
Onshore to
onshore pipeline
4 Operate Sleipner CO2 Injection North Sea Norway Natural gas
processing
Pre-combustion
(gas processing)
Direct injection
5 Operate Great Plains Synfuel
Plant and Weyburn-
Midale Project
Saskatchewan Canada Synthetic
natural gas
Pre-combustion Onshore to
onshore pipeline
6 Operate In Salah CO2 Storage Wilaya de
Ouargla
Algeria Natural gas
processing
Pre-combustion
(gas processing)
Onshore to
onshore pipeline
7 Operate Snøhvit CO2 Injection Barents Sea Norway Natural gas
processing
Pre-combustion
(gas processing)
Onshore to
offshore pipeline
8 Operate Century Plant Texas United States Natural gas
processing
Pre-combustion
(gas processing)
Onshore to
onshore pipeline
9 Execute Air Products Steam
Methane Reformer
EOR Project
Texas United States Hydrogen
production
Post-combustion Onshore to
onshore pipeline
10 Execute Lost Cabin Gas Plant Wyoming United States Natural gas
processing
Pre-combustion
(gas processing)
Onshore to
onshore pipeline
11 Execute Illinois Industrial
Carbon Capture and
Storage Project
Illinois United States Chemical
production
Industrial
separation
Onshore to
onshore pipeline
12 Execute Alberta Carbon Trunk
Line (ACTL) with
Agrium CO2 Stream
Alberta Canada Fertiliser
production
Pre-combustion Onshore to
onshore pipeline
13 Execute Boundary Dam
Integrated Carbon
Capture and
Sequestration
Demonstration Project
Saskatchewan Canada Power
generation
Post-combustion Onshore to
onshore pipeline
14 Execute Kemper County IGCC
Project
Mississippi United States Power
generation
Pre-combustion Onshore to
onshore pipeline
15 Execute Gorgon Carbon Dioxide
Injection Project
Western
Australia
Australia Natural gas
processing
Pre-combustion
(gas processing)
Onshore to
onshore pipeline
APPENDIX C: 20 12 LSIPsTable C1 presents the detailed list of the LSIPs that were included in the analysis for the Global Status of CCS: 2012 report.
The 2012 LSIP number correlates with the world map of LSIPs (Figure 9) and regional maps (Figure 12, Figure 13 and Figure 14)
presented in Chapter 2.
TA BLE C1 2012 LSIPs

179A P P E N D I C E S
TRANSPORT
DISTANCE
PRIMARY
STORAGE OPTION
CAPTURE
CAPACITY
YEAR OF
OPERATION
CAPTURE ASSET
LIFECYCLE
STAGE
TRANSPORT ASSET
LIFECYCLE STAGE
STORAGE ASSET
LIFECYCLE STAGE
LSIP
NO.
2011
132 km Enhanced oil
recovery
1.3 Mtpa 1972 Operate Operational transport Commercial
agreement EOR
1
225 km Enhanced oil
recovery
0.68 Mtpa 1982 Operate Operational transport Commercial
agreement EOR
2
190 km Enhanced oil
recovery
7 Mtpa 1986 Operate Operational transport Commercial
agreement EOR
3
0 km Offshore deep
saline formations
1 Mtpa
(+0.2 Mtpa in
construction)
1996 Operate Operational transport Operating storage
facilities
4
315 km Enhanced oil
recovery
3 Mtpa 2000 Operate Operational transport Commercial
agreement EOR
5
14 km Onshore deep
saline formations
1 Mtpa 2004 Operate Operational transport Operating storage
facilities
6
152 km Offshore deep
saline formations
0.7 Mtpa 2008 Operate Operational transport Operating storage
facilities
7
256 km Enhanced oil
recovery
8.5 Mtpa
(5 Mtpa in
operation +
3.5 Mtpa in
construction)
2010 Operate Operational transport Commercial
agreement EOR
8
101–150 km Enhanced oil
recovery
1 Mtpa 2012 Execute Operational transport Commercial
agreement EOR
15
Not specifi ed Enhanced oil
recovery
1 Mtpa 2012 Execute Construction of
pipeline
Commercial
agreement EOR
9
1.6 km Onshore deep
saline formations
1 Mtpa 2013 Execute Construction of
pipeline
Constructing
storage facilities
10
240 km Enhanced oil
recovery
Up to 0.59
Mtpa (initially
0.29 Mtpa)
2014 Execute Design of pipeline Commercial
agreement EOR
12
100 km Enhanced oil
recovery
1 Mtpa 2014 Execute Design of pipeline Advanced
negotiations EOR
11
75 km Enhanced oil
recovery
3.5 Mtpa 2014 Execute Design of pipeline Commercial
agreement EOR
13
7 km Onshore deep
saline formations
3.4–4.1
Mtpa
2015 Execute Construction of
pipeline
Constructing
storage facilities
14
continued on page 180
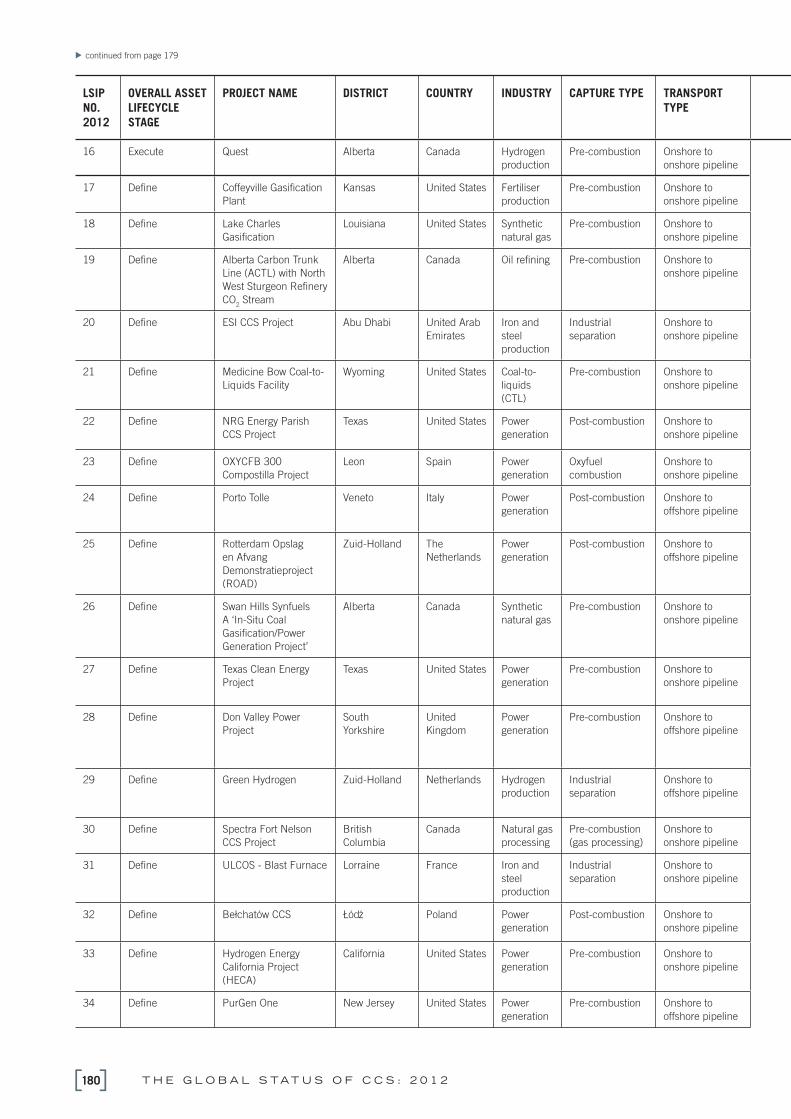
T H E G L O B A L S TAT U S O F C C S : 2 0 1 2180
LSIP
NO.
2012
OVERALL ASSET
LIFECYCLE
STAGE
PROJECT NAME DISTRICT COUNTRY INDUSTRY CAPTURE TYPE TRANSPORT
TYPE
16 Execute Quest Alberta Canada Hydrogen
production
Pre-combustion Onshore to
onshore pipeline
17 Defi ne Coffeyville Gasifi cation
Plant
Kansas United States Fertiliser
production
Pre-combustion Onshore to
onshore pipeline
18 Defi ne Lake Charles
Gasifi cation
Louisiana United States Synthetic
natural gas
Pre-combustion Onshore to
onshore pipeline
19 Defi ne Alberta Carbon Trunk
Line (ACTL) with North
West Sturgeon Refi nery
CO2 Stream
Alberta Canada Oil refi ning Pre-combustion Onshore to
onshore pipeline
20 Defi ne ESI CCS Project Abu Dhabi United Arab
Emirates
Iron and
steel
production
Industrial
separation
Onshore to
onshore pipeline
21 Defi ne Medicine Bow Coal-to-
Liquids Facility
Wyoming United States Coal-to-
liquids
(CTL)
Pre-combustion Onshore to
onshore pipeline
22 Defi ne NRG Energy Parish
CCS Project
Texas United States Power
generation
Post-combustion Onshore to
onshore pipeline
23 Defi ne OXYCFB 300
Compostilla Project
Leon Spain Power
generation
Oxyfuel
combustion
Onshore to
onshore pipeline
24 Defi ne Porto Tolle Veneto Italy Power
generation
Post-combustion Onshore to
offshore pipeline
25 Defi ne Rotterdam Opslag
en Afvang
Demonstratieproject
(ROAD)
Zuid-Holland The
Netherlands
Power
generation
Post-combustion Onshore to
offshore pipeline
26 Defi ne Swan Hills Synfuels
A ‘In-Situ Coal
Gasifi cation/Power
Generation Project’
Alberta Canada Synthetic
natural gas
Pre-combustion Onshore to
onshore pipeline
27 Defi ne Texas Clean Energy
Project
Texas United States Power
generation
Pre-combustion Onshore to
onshore pipeline
28 Defi ne Don Valley Power
Project
South
Yorkshire
United
Kingdom
Power
generation
Pre-combustion Onshore to
offshore pipeline
29 Defi ne Green Hydrogen Zuid-Holland Netherlands Hydrogen
production
Industrial
separation
Onshore to
offshore pipeline
30 Defi ne Spectra Fort Nelson
CCS Project
British
Columbia
Canada Natural gas
processing
Pre-combustion
(gas processing)
Onshore to
onshore pipeline
31 Defi ne ULCOS - Blast Furnace Lorraine France Iron and
steel
production
Industrial
separation
Onshore to
onshore pipeline
32 Defi ne Bełchatów CCS Łódz Poland Power
generation
Post-combustion Onshore to
onshore pipeline
33 Defi ne Hydrogen Energy
California Project
(HECA)
California United States Power
generation
Pre-combustion Onshore to
onshore pipeline
34 Defi ne PurGen One New Jersey United States Power
generation
Pre-combustion Onshore to
offshore pipeline
continued from page 179

181A P P E N D I C E S
TRANSPORT
DISTANCE
PRIMARY
STORAGE OPTION
CAPTURE
CAPACITY
YEAR OF
OPERATION
CAPTURE ASSET
LIFECYCLE
STAGE
TRANSPORT ASSET
LIFECYCLE STAGE
STORAGE ASSET
LIFECYCLE STAGE
LSIP
NO.
2011
84 km Onshore deep
saline formations
1.08 Mtpa 2015 Execute Construction of
pipeline
Constructing
storage facilities
27
112 km Enhanced oil
recovery
0.85 Mtpa 2013 Defi ne Construction of
pipeline
Commercial
agreement EOR
16
Not specifi ed Enhanced oil
recovery
4.5 Mtpa 2014 Defi ne Design of pipeline Commercial
agreement EOR
17
240 km Enhanced oil
recovery
1.2 Mtpa 2015 Defi ne Design of pipeline Commercial
agreement EOR
18
Not specifi ed Enhanced oil
recovery
0.8 Mtpa 2015 Defi ne Design of pipeline Advanced
negotiations EOR
21
Not specifi ed Enhanced oil
recovery
3.6 Mtpa 2015 Defi ne Operational transport Commercial
agreement EOR
23
130 km Enhanced oil
recovery
1.4–1.6
Mtpa
2015 Defi ne Design of pipeline Commercial
agreement EOR
New
120 km Onshore deep
saline formations
1.1 Mtpa 2015 Defi ne Design of pipeline Assessing suitability
of storage site/s
24
101–150 km Offshore deep
saline formations
1 Mtpa 2015 Defi ne Design of pipeline Assessing suitability
of storage site/s
25
26 km Offshore depleted
oil and gas
reservoirs
1 Mtpa 2015 Defi ne Design of pipeline Constructing
storage facilities
28
51–100 km Enhanced oil
recovery
1.2–1.4
Mtpa
2015 Defi ne Design of pipeline Advanced
negotiations EOR
48
≤50 km Enhanced oil
recovery
2.5 Mtpa 2015 Defi ne Operational transport Commercial
agreement EOR
19
425 km for
EOR, 175km
to alternative
saline site
Enhanced oil
recovery
4.75 Mtpa 2016 Defi ne Design of pipeline Advanced
negotiations EOR
43
26 km Offshore depleted
oil and gas
reservoirs
0.5 Mtpa 2016 Defi ne Design of pipeline Detailed site
characterisation
31
35 km Onshore deep
saline formations
2.2 Mtpa 2016 Defi ne Design of pipeline Detailed site
characterisation
29
51–100 km Onshore deep
saline formations
0.7 Mtpa 2016 Defi ne Design of pipeline Assessing suitability
of storage site/s
34
101–150 km Onshore deep
saline formations
1.6–1.8
Mtpa
2017 Defi ne Design of pipeline Assessing suitability
of storage site/s
20
6.4 km Enhanced oil
recovery
3 Mtpa 2017 Defi ne Design of pipeline Advanced
negotiations EOR
36
160 km Offshore deep
saline formations
2.6 Mtpa 2017 Defi ne Design of pipeline Detailed site
characterisation
38
continued on page 182

T H E G L O B A L S TAT U S O F C C S : 2 0 1 2182
LSIP
NO.
2012
OVERALL ASSET
LIFECYCLE
STAGE
PROJECT NAME DISTRICT COUNTRY INDUSTRY CAPTURE TYPE TRANSPORT
TYPE
35 Defi ne Taylorville Energy
Center
Illinois United States Power
generation
Pre-combustion Onshore to
onshore pipeline
36 Defi ne Hydrogen Power Abu
Dhabi (HPAD)
Abu Dhabi United Arab
Emirates
Power
generation
Pre-combustion Onshore to
onshore pipeline
37 Defi ne Tenaska Trailblazer
Energy Center
Texas United States Power
generation
Post-combustion Onshore to
onshore pipeline
38 Evaluate C.GEN North
Killingholme Power
Project
North
Lincolnshire
United
Kingdom
Power
generation
Pre-combustion Onshore to
offshore pipeline
39 Evaluate Cash Creek Generation Kentucky United States Power
generation
Pre-combustion Onshore to
onshore pipeline
40 Evaluate Getica CCS
Demonstration Project
Gorj County Romania Power
generation
Post-combustion Onshore to
onshore pipeline
41 Evaluate Indiana Gasifi cation Indiana United States Synthetic
natural gas
Pre-combustion Onshore to
onshore pipeline
42 Evaluate Mississippi Gasifi cation
(Leucadia)
Mississippi United States Synthetic
natural gas
Pre-combustion Onshore to
onshore pipeline
43 Evaluate Riley Ridge Gas Plant Wyoming United States Natural gas
processing
Pre-combustion
(gas processing)
Onshore to
onshore pipeline
44 Evaluate FutureGen 2.0 Oxy-
Combustion Large
Scale Test
Illinois United States Power
generation
Oxyfuel
combustion
Onshore to
onshore pipeline
45 Evaluate Teesside Low Carbon North East
England
United
Kingdom
Power
generation
Pre-combustion Onshore to
offshore pipeline
46 Evaluate White Rose CCS
Project (formerly
UK Oxy CCS
Demonstration)
North
Yorkshire
United
Kingdom
Power
generation
Oxyfuel
combustion
Onshore to
offshore pipeline
47 Evaluate Korea-CCS 1 Not Decided Korea Power
generation
Post-combustion Ship/tanker
48 Evaluate Peterhead Gas CCS
Project
Aberdeenshire United
Kingdom
Power
generation
Post-combustion Onshore to
offshore pipeline
49 Evaluate Quintana South Heart
Project
North Dakota United States Power
generation
Pre-combustion Onshore to
onshore pipeline
50 Evaluate Sinopec Shengli Oil
Field EOR Project
Shandong China Power
generation
Post-combustion Ship/tanker
51 Evaluate South West CO2
Geosequestration Hub
(South West Hub)
Western
Australia
Australia Fertiliser
production
Pre-combustion Onshore to
onshore pipeline
52 Evaluate Bow City Power Project Alberta Canada Power
generation
Post-combustion Onshore to
onshore pipeline
53 Evaluate CarbonNet Project Victoria Australia Power
generation
Not decided Onshore to
offshore pipeline
54 Evaluate Eemshaven CCS Groningen Netherlands Power
generation
Post-combustion Ship/tanker
55 Evaluate Emirates Aluminium
CCS Project
Abu Dhabi United Arab
Emirates
Power
generation
Post-combustion Onshore to
onshore pipeline
continued from page 181

183A P P E N D I C E S
TRANSPORT
DISTANCE
PRIMARY
STORAGE OPTION
CAPTURE
CAPACITY
YEAR OF
OPERATION
CAPTURE ASSET
LIFECYCLE
STAGE
TRANSPORT ASSET
LIFECYCLE STAGE
STORAGE ASSET
LIFECYCLE STAGE
LSIP
NO.
2011
8 km Onshore deep
saline formations
1.92 Mtpa 2017 Defi ne Design of pipeline Detailed site
characterisation
32
201–250 km Enhanced oil
recovery
1.7Mtpa 2018 Defi ne Design of pipeline Advanced
negotiations EOR
37
201–250 km Enhanced oil
recovery
5.75 Mtpa Not
specifi ed
Defi ne Not specifi ed Identifying
prospective EOR
customers
37
151–200 km Offshore deep
saline formations
2.5 Mtpa 2015 Defi ne Design of pipeline Assessing suitability
of storage site/s
40
Not specifi ed Enhanced oil
recovery
2 Mtpa 2015 Evaluate Design of pipeline Advanced
negotiations EOR
41
40 km Onshore deep
saline formations
1.5 Mtpa 2015 Defi ne Design of pipeline Assessing suitability
of storage site/s
44
Not specifi ed Enhanced oil
recovery
4.5 Mtpa 2015 Evaluate Design of pipeline Commercial
agreement EOR
45
176 km Enhanced oil
recovery
4Mtpa 2015 Evaluate Design of pipeline Commercial
agreement EOR
46
Not specifi ed Enhanced oil
recovery
2.5 Mtpa 2015 Evaluate Design of pipeline Preliminary
negotiations EOR
47
≤50 km Onshore deep
saline formations
1.3 Mtpa 2016 Defi ne Design of pipeline Assessing suitability
of storage site/s
50
225 km Offshore deep
saline formations
2.5 Mtpa 2016 Defi ne Design of pipeline Assessing suitability
of storage site/s
49
Not specifi ed Offshore deep
saline formations
2 Mtpa 2016 Defi ne Design of pipeline Assessing suitability
of storage site/s
55
251–300 km Offshore deep
saline formations
1 Mtpa 2017 Evaluate Not specifi ed Exploration of
prospective sites
61
102 km Offshore depleted
oil and gas
reservoirs
0.97 Mtpa 2017 Evaluate Conversion of
pipeline
Constructing
storage facilities
53
Not specifi ed Enhanced oil
recovery
2.1 Mtpa 2017 Evaluate Not specifi ed Identifying
prospective EOR
customers
63
51–100 km Enhanced oil
recovery
1 Mtpa 2017 Evaluate Not specifi ed Preliminary
negotiations EOR
39
51–100 km Onshore deep
saline formations
2–3 Mtpa 2017 Defi ne Design of pipeline Assessing suitability
of storage site/s
42
≤50 km Enhanced oil
recovery
1 Mtpa 2018 Defi ne Design of pipeline Preliminary
negotiations EOR
57
51–100 km Offshore deep
saline formations
1 Mtpa 2018 Evaluate Design of pipeline Assessing suitability
of storage site/s
64
Not specifi ed Enhanced oil
recovery
1.1 Mtpa 2018 Evaluate Not specifi ed Preliminary
negotiations EOR
35
351–400 km Enhanced oil
recovery
2 Mtpa 2018 Defi ne Design of pipeline Advanced
negotiations EOR
59
continued on page 184

T H E G L O B A L S TAT U S O F C C S : 2 0 1 2184
LSIP
NO.
2012
OVERALL ASSET
LIFECYCLE
STAGE
PROJECT NAME DISTRICT COUNTRY INDUSTRY CAPTURE TYPE TRANSPORT
TYPE
56 Evaluate Kentucky NewGas Kentucky United States Synthetic
natural gas
Pre-combustion Onshore to
onshore pipeline
57 Evaluate Southland Coal to
Fertiliser Project
Southland New Zealand Fertiliser
production
Pre-combustion Onshore to
onshore pipeline
58 Evaluate Pegasus Rotterdam Zuid-Holland Netherlands Power
generation
Oxyfuel
combustion
Onshore to
offshore pipeline
59 Evaluate Full-scale CO2 Capture
Mongstad (CCM)
Hordaland Norway Power
generation
Post-combustion Onshore to
offshore pipeline
60 Evaluate HuaNeng GreenGen
IGCC Project
Tianjin China Power
generation
Pre-combustion Onshore to
onshore pipeline
61 Evaluate Surat Basin CCS
Project
Queensland Australia Power
generation
Post-combustion Onshore to
onshore pipeline
62 Identify Jilin Oil Field EOR
Project (Phase 2)
Jilin China Natural gas
processing
Pre-combustion
(gas processing)
Onshore to
onshore pipeline
63 Identify Industrikraft Möre AS
Norway
Møre og
Romsdal
Norway Power
generation
Post-combustion Combination
(pipeline and
shipping)
64 Identify Korea-CCS 2 Not Decided Korea Power
generation
Oxyfuel or pre-
combustion
Ship/tanker
65 Identify Sargas Green Power
Plant Malta
Delimara Malta Power
generation
Post-combustion Ship/tanker
66 Identify Caledonia Clean
Energy Project
Scotland United
Kingdom
Power
generation
Post-combustion Onshore to
offshore pipeline
67 Identify Maritsa Thermal Power
Plant CCS Project
Stara Zagora Bulgaria Power
generation
Post-combustion Onshore to
onshore pipeline
68 Identify Shenhua Ordos CTL
Project
Inner Mongolia China Coal-to-
liquids
(CTL)
Industrial
separation
Onshore to
onshore pipeline
69 Identify Shenhua/Dow
Chemicals Coal to
Chemicals Plant
Project (Yulin)
Shaanxi China Chemical
production
Industrial
separation
Onshore to
onshore pipeline
70 Identify Daqing Carbon Dioxide
Capture and Storage
Project
Heilongjiang China Power
generation
Oxyfuel
combustion
Onshore to
onshore pipeline
71 Identify Dongguan Taiyangzhou
IGCC with CCS Project
Guangdong China Power
generation
Pre-combustion Onshore to
onshore pipeline
72 Identify Dongying Carbon
Dioxide Capture and
Storage Project
Shandong China Power
generation
Not decided Onshore to
onshore pipeline
73 Identify Lianyungang IGCC with
CCS Project
Jiangsu China Power
generation
Pre-combustion Onshore to
onshore pipeline
74 Identify Shanxi International
Energy Group CCUS
project
Shanxi China Power
generation
Oxyfuel
combustion
Not specifi ed
75 Identify Shen Hua Ningxia Coal
to Liquid Plant Project
Ningxia China Coal-to-
liquids
(CTL)
Industrial
separation
Onshore to
onshore pipeline
continued from page 183

185A P P E N D I C E S
TRANSPORT
DISTANCE
PRIMARY
STORAGE OPTION
CAPTURE
CAPACITY
YEAR OF
OPERATION
CAPTURE ASSET
LIFECYCLE
STAGE
TRANSPORT ASSET
LIFECYCLE STAGE
STORAGE ASSET
LIFECYCLE STAGE
LSIP
NO.
2011
Not specifi ed Various storage
options being
considered
5 Mtpa 2018 Evaluate Not specifi ed Exploration of
prospective sites
60
51–100 km Onshore deep
saline formations
1 Mtpa 2018 Evaluate Design of pipeline Assessing suitability
of storage site/s
65
151–200 km Offshore depleted
oil and gas
reservoirs
2.5 Mtpa 2019 Defi ne Design of pipeline Assessing suitability
of storage site/s
62
Not decided Offshore deep
saline formations
1 Mtpa 2020 Evaluate Design of pipeline Exploration of
prospective sites
66
151–200 km Enhanced oil
recovery
2 Mtpa 2020 Evaluate Not specifi ed Exploration of
prospective sites
51
151–200 km Onshore deep
sandstone
formations
1 Mtpa 2020 Evaluate Design of pipeline Assessing suitability
of storage site/s
56
151–200 km Enhanced oil
recovery
0.8–1 Mtpa 2015 Identify Design of pipeline Preliminary
negotiations EOR
New
Not specifi ed Not specifi ed 1.4–1.6
Mtpa
2016 Defi ne Not specifi ed Not specifi ed New
251–300 km Offshore deep
saline formations
1 Mtpa 2019 Identify Not specifi ed Exploration of
prospective sites
70
351–400 km Enhanced oil
recovery
1.2 Mtpa 2017 Identify Not specifi ed Identifying
prospective EOR
customers
New
Not specifi ed Enhanced oil
recovery
Not specifi ed 2018 Identify Not specifi ed Not specifi ed New
Not specifi ed Onshore deep
saline formations
2.5 Mtpa 2020 Identify Design of pipeline Exploration of
prospective sites
73
201–250 km Onshore deep
saline formations
1 Mtpa 2020 Identify Not specifi ed Exploration of
prospective sites
74
≤50 km Enhanced oil
recovery
2–3 Mtpa Not
specifi ed
Identify Not specifi ed Exploration of
prospective sites
71
Not specifi ed Enhanced oil
recovery
1 Mtpa Not
specifi ed
Identify Design of pipeline Exploration of
prospective sites
New
101–150 km Onshore depleted
oil and gas
reservoirs
1 Mtpa Not
specifi ed
Identify Not specifi ed Exploration of
prospective sites
69
≤50 km Enhanced oil
recovery
1 Mtpa Not
specifi ed
Identify Not specifi ed Identifying
prospective EOR
customers
New
201–250 km Enhanced oil
recovery
1 Mtpa Not
specifi ed
Identify Not specifi ed Identifying
prospective EOR
customers
68
Not specifi ed Various storage
options being
considered
2–3 Mtpa Not
specifi ed
Identify Not specifi ed Exploration of
prospective sites
New
201–250 km Various storage
options being
considered
2 Mtpa Not
specifi ed
Identify Not specifi ed Exploration of
prospective sites
New

T H E G L O B A L S TAT U S O F C C S : 2 0 1 2186
APPENDIX D: COSTS
D.1 Levelised electricity costsThe levelised costs, in 2010 dollar terms, for different power technologies fi tted with CCS range from US$114/MWh for oxyfuel
combustion to US$130/MWh for post-combustion capture at a supercritical pulverised coal plant (Figure D1). This represents
an increase in costs over non-CCS power plants of around 40 per cent for NGCC and IGCC plants and more than 60 per cent
for supercritical black coal plants.
FIGURE D1 Levelised costs of electricity for different capture technologies
Source: Global CCS Institute and Worley Parsons (2011).
The costs for transport and storage are often considered to account for a relatively small share of the total costs of a CCS
project, around 5–7 per cent in many cases (Figure D1). This refl ects modelling choices often made to transport the CO2
to high-capacity onshore saline reservoirs with good injectivity that are less than 200 km from the source of the emissions.
Transporting the CO2 a similar distance offshore can double the transport costs and doubling the distance offshore may double
that cost again. Storing in off-shore rather than onshore saline aquifers can also double or triple the storage cost (ZEP 2011).
While transporting CO2 is a mature technology and considered relatively low risk, the costs associated with characterising a
secure storage site, even a good site, can present challenges to projects. Site characterisation costs must be borne well in
advance of any opportunity to recover costs, and have non-trivial levels of risk as the site assessment may indicate the site is
not suitable for storage, and another site must be located and the process started again.
Cost studies are often based around building a plant in the US, and translating those studies to other countries or regions often
results in even larger increases in costs over unabated fossil fuel plants, refl ecting different capital costs as well as different
country-specifi c requirements, including different fossil fuel costs. For example, for CCS plants in the UK, it was recently
estimated that incorporating CCS would increase costs by between 75–116 per cent (Parsons Brinckerhoff 2011). Even within
a single country, regional factors infl uencing labour costs or fuel types can change costs for otherwise identical projects. In the
US, the difference between labour costs in union versus non-union workforces alone can increase project costs by 20 per cent.
25
0
50
75
100
125
Post-combustion
US
$/M
Wh
Oxyfuel IGCC NGCC
Storage Transportation Operating and maintenance
Capital Fuel

187A P P E N D I C E S
Similarly, there can be signifi cant differences and inconsistencies in the way CCS costs are currently calculated and reported
by various authors and organisations (Rubin 2012). The different cost estimates observed in studies often arise due to
differences in assumptions regarding technology performance, the costs of inputs, or the methodology used. Nonetheless,
in detailed studies such as those prepared by the IEA (Finkenrath 2011), the Global CCS Institute (Global CCS Institute and
WorleyParsons 2011), and the National Energy Technology Laboratory (NETL 2011), many of these differences disappear
when the assumptions are normalised and a common methodology applied. In these specifi c studies, the effect of any
individual assumption on the estimated levelised cost for power generation is generally 5 per cent or smaller (Global CCS
Institute 2011a). In other studies, these effects can often be more pronounced, but at the same time, may lack transparency
around key assumptions or methodologies.
Given the importance of CCS as an option for mitigating energy-related CO2 emissions, efforts to improve and harmonise the
methodology for estimating and communicating CCS costs are being undertaken by an international group of experts from
industrial fi rms, government agencies, universities, and environmental organisations. Key agencies involved in cost estimation,
including NETL, the EPRI, the IEA, and the Global CCS Institute are engaged in this task in order to improve transparency and
understanding.
D.2 FEED studiesThe CCS costs studies discussed above make certain assumptions that preclude certain site-specifi c or project-specifi c
assumptions in order to compare the expected costs of two or more different technologies in a specifi c application.
Technology-levelling assumptions are made so that the true differences in typical plant confi gurations are highlighted. As such,
they are typically poor predictors of specifi c project costs. The level of accuracy for those technology studies is within the range
of –30 to +50 per cent of project costs, with certainty limited due to the level of design detail undertaken and estimated risk
level around the technology and project. Issues relating to contingencies for CCS projects are discussed further below.
In contrast, cost studies for specifi c projects aim to provide the owner with as accurate an estimate as possible of all the
project costs that must be fi nanced. The level of accuracy for project studies refl ects the resourcing applied to completing the
project design, tendering to equipment suppliers and level of risk analysis undertaken. Performing cost estimates to a high
level of accuracy requires a signifi cant amount of engineering detail and effort to assess the lowest cost options for specifi c
locations as well as increased levels of information from equipment providers. For FEED studies, undertaken to provide further
defi nition to the project in order to allow an investment decision to be made, the overall project capital cost is expected to be in
the range of ±10–15 per cent with a smaller range for operating cost assessments.
Although a number of project-specifi c FEED and other studies have been completed in recent years, only a few are in the
public domain including:
Scottish Power’s Longannet project;
Eon’s Kingsnorth project; and
ROAD.
The fi rst two projects have been cancelled, as funding – from both anticipated market revenue opportunities and government
demonstration programs – was insuffi cient, while ROAD is currently considering issues around the investment decision.
Further, the level of detail publicly available varies. The Kingsnorth project was cancelled in 2010 in the early stages of the
feasibility assessment with costs released for the capture, transport and storage facilities. As a result, the information provided
from this project has a higher level of uncertainty and less detail regarding specifi c cost elements. ROAD, refl ecting ongoing
commercial consideration and confi dentiality concerns, has released highly aggregated costs for the capture process. The
Longannet project, in development for a lengthy time, has released a detailed FEED study where the cost components
refl ected a thorough tendering process and a high level of design effort.
As a project capturing a slipstream from an existing power project, the Longannet costs refl ect the capture, transport and
storage elements only, and so do not include the full costs of establishing a new generation facility incorporating CCS. However,
the proposed Longannet demonstration also included costs for new steam and power supplies required for the capture process
(rather than drawing on the Longannet plant itself) as well as certain ‘balance of plant’ items that would normally be included
in a new build plant.
The investment costs for CCS demonstration projects in the public domain vary signifi cantly, refl ecting a number of issues
including scale, risk and site-specifi c considerations (Figure D2). Nonetheless, the published project investment costs appear
to differ signifi cantly from (and are usually larger than) the estimates provided in generalised cost studies. However, the
costs estimates for most projects tend to provide limited details on what is included or excluded in the cost estimate – what
is site specifi c and what is technology-related. Consequently, it can be diffi cult to interpret the wide range of investment cost
estimates presented in Figure D2. It appears likely that the design cost studies represent a lower bound for projects rather than

T H E G L O B A L S TAT U S O F C C S : 2 0 1 2188
a mid-point estimate. Underpinned by the detailed information provided in the Longannet FEED study, CCS investment costs
for a large-scale project are likely to incur a cost at least US$5000–6000 per kW. As demonstration plants are built, it is likely
that these costs will be better understood and the range of investment costs narrow as perceptions of risk also changes.
F IGURE D2 CCS investment costs: demonstration projects vs. cost studies
HECA
Boundary Dam
NRG Energy Longannet
Kemper
TCEP
2000
0
4000
6000
8000
10000
12000
14000
100 200 300 400 500 600
US
$/k
W
MW
New power station Slipstream project Repowered project Cost studies
One of the reasons that project-specifi c costs may vary from design studies relates to the accounting for contingencies, to
account either for risk or for unknown but expected costs. Contingencies are included in cost estimates to refl ect unknown
costs which are omitted or unforeseen due to a lack of complete project defi nition and engineering effort for a given level of
design estimation (NETL 2011). In these cases, this contingency, known as project contingencies decreases with the level
of design effort. For mature technologies, such as unabated coal and gas-fi red power plants, project contingencies in pre-
feasibility studies are considered to be around 10 per cent or less and decline further through a FEED study. In the Longannet
FEED study, the contingency associated with the estimates for the transport component was 7 per cent in total (and less for
certain elements), refl ecting both the real world experience of transporting CO2 and the maturity of the technology.
The maturity of the technology affects cost estimates because of performance uncertainties associated with the development
status of a technology. Usually included as ‘process contingencies’, they are applied to individual technology components
within the entire CCS production chain.
In publicly available project studies, it is common for both types of contingencies to be combined and reported as a single
number, even if it is provided against components of the CCS process. In the Longannet FEED study, contingencies for the
capture process accounted for 20 per cent of the capture costs. This contrasts with the average contingencies used in design
studies, such as the Institute/WorleyParsons estimate of 16–18 per cent for the power and capture process. For the storage
elements, the share of costs allocated to contingencies in the Longannet project varied across the elements of storage
construction (from platform preparation offshore through subsea work and injection wells) averaging 21 per cent across the
entire storage chain.

189A P P E N D I C E S
D.3 Cost reduction programsThere are also a number of research programs exploring opportunities to reduce costs. The largest program is the US
DOE Fossil Energy Program which funds work by the NETL. Acknowledging in particular the challenges of current capture
technologies, the challenges of large-scale demonstrations, and the energy costs associated with capture, the stated goal of
this program is to develop advanced capture technologies that achieve at least 90 per cent CO2 capture with a corresponding
cost and energy penalty reduction of 50 per cent compared to current state of the art technologies. Focusing on IGCC
and post-combustion capture (including oxyfuel) technologies, the aim is to make several possible improvements in those
technologies available for commercial deployment by 2030 (Ciferno et al. 2012). In the case of post-combustion technologies,
the target is that the increase in costs above unabated coal power plants is less than 35 per cent.
The UK Government established a Cost Reduction Task Force, led by industry to identify the scope for cost reductions in CCS
for fuel and technology components. The approach seeks to establish a partnership between industry and government to bring
forward the deployment of CCS. Recognising that the opportunities for cost reductions in capture will only be achieved over the
longer term (given the long lead times to construct CCS plants), this process is seeking to gain a commitment from industry
on initiatives to reduce cost and to develop advice for Government in identifying the most promising technologies, market
frameworks and incentives. The group will report to Government in the second quarter of 2013.

T H E G L O B A L S TAT U S O F C C S : 2 0 1 2190
APPENDIX E: PO LICY DEVELOPMENTS
E.1 Policy developments by country
E.1.1 AUSTRALIA
In 2010, the Australian Government announced that all new coal-fi red power stations would be required to be built CCS
Ready, as part of the Cleaner Future for Power Stations election commitment.
In late 2011, the Government’s legislation to introduce a carbon price, the Clean Energy Legislative Package (CELP), was given
effect and the CCS Ready policy was subsequently abandoned in favour of market driven investment outcomes. The Victorian
Government also made a similar announcement in March 2012 to not proceed with CCS Ready regulations.
The CELP underpins the carbon-pricing mechanism that commenced on 1 July 2012, and that will extend to 30 June 2015.
Covering Australia’s top 500 emitters (those producing over 25,000 tCO2 per year), the price starts at AU$23/tCO
2-e and rises
by 2.5 per cent per year in real terms to 30 June 2015.
After 2015, the administratively fi xed price will transition to a market-determined price. There is also an independent regulatory
compliance and management regime in place.
On 28 August 2012, Australia and the EC announced plans to link their ETS. A full two-way link, by means of the mutual
recognition of carbon units between the two cap and trade systems, will commence no later than 1 July 2018. Under this
arrangement, businesses will be allowed to use carbon units from the Australian emissions trading scheme or the EU ETS for
compliance under either system.
To facilitate the link, the Australian Government will make two changes to the design of the Australian carbon price.
These are that:
the price floor will not be implemented; and
a new sub-limit will apply to the use of eligible Kyoto units. While liable entities in Australia will still be able to meet up to 50
per cent of their liabilities through purchasing eligible international units, only 12.5 per cent of their liabilities will be able to
be met by Kyoto units.
In recognition of these changes and while formal negotiations proceed towards a full two-way link, an interim link will be
established, whereby Australian businesses will be able to use EU allowances to help meet liabilities under the Australian
emissions trading scheme from 1 July 2015 until a full link is established, no later than 1 July 2018.
The Australian Government also released in late 2011 a draft Energy White Paper called Strengthening the Foundation for
Australia’s Energy Future. The Paper outlines the Government’s reform of the domestic energy markets and the carbon-pricing
mechanism. A key message in the Paper is that the carbon-pricing mechanism is now the major policy instrument for driving
new low-carbon technology deployment.
E.1.2 BRAZIL
Brazil’s principal framework for climate change policy is the 2010 National Climate Change Policy (Decree No. 7390,
implementing regulation of Law No. 12187), which sets a nationwide emissions reduction target. The Decree sets a deadline
of 15 December 2011 for the major emitting sectors (including power generation) to submit action plans (including targets,
actions, performance indicators, and proposed incentives to implement the plans) for emissions reductions. It also indicates
that the adopted targets may form the basis for emissions trading.
There is no ETS in Brazil, but as a host country for CDM projects, it is often regarded as one of the main players in the global
carbon credit market. A state-wide ETS covering large emitters in Rio de Janeiro was expected to have been signed into law via
decree in June 2012 for commencement in January 2013.
At the time of drafting, however, the signing of the decree has been delayed. It is expected that other states will be invited into
the consultation process, creating a possibility for the emergence of a national system. The scheme would have covered major
emitters from the oil, steel, cement, ceramics, chemical, and petrochemical sectors. The fi rst commitment period will be from
2013 until 2015, with subsequent periods expected to last fi ve years.

191A P P E N D I C E S
E.1.3 BULGARIA
The principal framework for climate change is outlined in the Bulgarian National Energy Strategy until 2020, adopted by the
Bulgarian Parliament in mid-2011. The Bulgarian Government estimates that about 9.2 MtCO2 will be avoided by 2030
through CCS.
Bulgaria abides by the EC’s common emission reduction targets, although trading in Bulgaria was suspended in 2010 and
re-launched in early 2011. In early 2012, the EC authorised Bulgaria’s request for the continued free allocation of EU ETS
allowances to their power sectors beyond this year (rather than having to purchase them on the open market).
Bulgaria’s climate policy includes supporting, both fi nancially and institutionally, the construction of power plants with facilities
for CCS by schemes and mechanisms adopted at the European level.
E.1.4 CANADA
Canada’s policy focus is primarily about providing funding support for projects. Canada agreed to only voluntary emission
pledges to 2020 under the UNFCCC, and has indicated that it will not be ratifying a second commitment period under the
Kyoto Protocol.
In the third quarter of 2011, the Canadian Government released the text of the proposed regulations titled Reduction of
Carbon Dioxide Emissions from Coal-Fired Generation of Electricity Regulations. If passed, the regulations would come into
effect on 1 July 2015, requiring all existing and new coal-fi red units to meet an emissions performance standard equivalent to
combined cycle natural gas (set at and fi xed at 0.375 tCO2 per MWh). A temporary exception would be provided for plants that
incorporate CCS out to 2025.
The policy includes incentives for early action for existing plants that incorporate CCS prior to having to do so. The comments
received and how they were addressed by the Government will be available in a Regulatory Impact Analysis Summary when
the fi nal regulations are published in Canada Gazette Part II later in 2012
Canada is also a key component of the North American Carbon Storage Atlas.
E.1.5 CHINA
China recently became the largest global GHG emitter, as well as arguably one of the largest investors (competing with the US)
in clean energy with over US$55 billion in 2010. According to the Lawrence Berkeley National Laboratory, China’s anticipated
peak emission point under a 450 ppm scenario will need to be realised between 2025 and 2030.
As reported last year, China has adopted in its 12th Five Year Plan (approved in March 2011) both national energy and carbon
intensity targets. These intensity targets have been subsequently allocated on a differentiated basis across provinces where
governors and mayors alike are responsible for their implementation and compliance. This emphasises the important role that
provincial and local levels have in both the implementation of the national strategy and in the design of sub-national policies.
The national carbon intensity target is set at 17 per cent per unit of GDP by 2015 (relative to 2005) and 40–45 per cent by
2020. It is understood that China announced at the April 2012 MEF that the 2020 target is to be pushed out to 2025.
In May 2012, the energy intensity targets were tightened (from 18–21 per cent below 2010 levels by 2015) and allocated to
sectors. Sector-specifi c energy intensity reduction targets by 2015 include 20 per cent reduction for chemicals and 18 per
cent reduction for steel, non-ferrous metals, and petrochemicals.
Over the period 2006–10, it appears China has enacted all the institutional requirements to realise these targets. This includes
supporting quite pro-market oriented tools over the next fi ve years (such as pilot emissions trading schemes to commence in
2013 across two provinces and fi ve cities) to reduce emissions.
It is also understood that the NDRC has given the pilot regions the authority to make independent choices on which sectors
should be brought into the schemes (but clearly power, steel, cement, chemicals, and non-ferrous metals are likely candidates
– also indicating opportunities to support CCS mitigation solutions).
Reports in the public domain suggest that the pilots are unlikely to be launched by 2013, as only Beijing has released (in
March 2012) draft rules and regulations of its ETS. Design issues still include which sectors are to be covered. The two
provinces of Guangdong and Hubei have publicly indicated this sort of delay.
The NDRC (which acts as China’s regulator for UNFCCC offsets) recently published rules governing China’s future domestic
carbon offset market. This is very much in line with China’s preference for project-based market mechanisms, such as the
CDM, in the UNFCCC. The offsets, known as Chinese Certifi ed Emission Reductions (CCERs) will be awarded to projects that
have received government approval to earn credits under the CDM, but have yet to be registered by the UNFCCC. Projects that
have already earned credits under the CDM will not be allowed to produce domestic offsets (to avoid double counting).

T H E G L O B A L S TAT U S O F C C S : 2 0 1 2192
This policy direction supplements an already quite extensive suite of demand measures (including a national electricity smart
grid) and fi scal and tax regimes including a resource tax, a fuel/energy tax, and potentially a carbon tax. While a carbon tax
could be implemented in parallel to an ETS, this policy discussion may be superseded by a cross-over to a national emissions
trading scheme by 2015.
Another initiative is the China Coal Cap (CCC), announced by the National Energy Administration last year in recognition of
having to curtail China’s dependency on coal use (which is the cheapest energy source in the country). The CCC caps coal
production at 3.8 billion tonnes by 2015. China produces about 50 per cent of the global supply of coal (with its biggest
imports from Australia and Indonesia). Currently 70 per cent of its energy consumption is satisfi ed by coal, 60 per cent is
consumed by the power sector, 15 per cent by metallurgy, and over 10 per cent for cement manufacture.
The CCC is in the process of implementation and could see the national coal cap being implemented through both sectoral
(power, metallurgy, cement, chemicals, etc.) and provincial/city caps. China’s high reliance on coal indicates a dependency on
CCS to help decouple emissions from economic growth, as well as manage air pollution issues. China is also enthusiastically
pursuing both nuclear and renewable energy sources, including binding targets for the latter.
Like many other countries in the world, China has strong reasons to explore, and is sitting on a large supply of non-
conventional gas sources (coal bed methane and shale). Some 5 per cent of China’s coal, 20 per cent of its gas, and 55 per
cent of its oil is currently imported.
In March 2012, the UNFCCC’s Global Environment Facility and the World Bank awarded China a grant to undertake a Climate
Change Technology Needs Assessment (TNA). A report is expected in 2–3 years.
In 2012, the Global CCS Institute also struck a MoU with China’s NDRC to share information on CCS to help it plan to roll out
the technology to cut emissions.
E.1.6 EUROPEAN UNION
The EU’s climate change policy is characterised by strong cooperation with the international community, compliance with the
UNFCCC and Kyoto Protocol, and leadership in terms of assuming emission reduction targets and implementing mechanisms.
The EC’s common emission reduction targets include:
20 per cent reduction of emissions relative to 1990 by 2020 (or 14 per cent compared to 2005);
20 per cent share of renewables in total energy mix by 2020; and
20 per cent increase in energy efficiency by 2020.
The EC has committed to move to a 30 per cent emission reduction target if there is a global comprehensive agreement for
the post-2012 period (i.e. other developed countries commit to comparable efforts) and developing countries contributions are
meaningful.
In early 2012, the EC released a paper on the policy options to drive a 30 per cent emission reduction on 1990 levels by 2020.
In essence, a tighter carbon constraint could realise potentially higher revenues to be hypothecated back into low carbon
developments due to higher carbon prices.
The key climate change policy instrument for facilitating emission reductions and encouraging low emission technologies is
the EU ETS. It covers emitters in the power generation and other energy-intensive sectors such as steel, cement, paper, and
chemicals. The third phase is due to start on 1 January 2013 and extends to 2020.
The third phase sees the fi xed national emission caps cancelled and replaced by one common ceiling for the whole EU. After
this, the target is set to decrease linearly every year over the period up to 2020, in conformity with the set goal of a 21 per
cent emission reduction compared to 2005. It will also adopt a market allocation approach (auctioning), replacing the current
administrative allocation method. The obligation on power plants will be to purchase on the open market and acquit a quantity
of allowance every year equivalent to their verifi ed emissions for the preceding year.
Every member state receives an annual quantity of allowances on the basis of their emission reduction targets. The revenues
from the auction sales are collected in the national budgets of the member states and a minimum 50 per cent of these
revenues must be used to combat climate change (including for CCS).
There are basically 10 countries that can apply for derogation of this rule. Bulgaria and Romania applied and were granted
such derogations for the third phase.
In addition to the revenues raised at national level through auction sales, an additional 300 million allowances have been
allocated under the NER300 at the European level for fi nancing demonstration projects for CCS and renewables.

193A P P E N D I C E S
There were 13 CCS proposals received by the European Investment Bank (EIB) under the NER300 program. The EIB has
completed its due diligence assessments of these proposals (which are confi dential) and must monetise (sell) 200 million of
the 300 million allowances (expected by October 2012) prior to making recommendations to the EC on prospective projects.
The EIB is on track to do this.
Sales of the NER300 tranche of allowances as at April 2012 stand at around 99 million (about 20 million sold per month). The
allowances are for use in phase 3 of the EU ETS. The average price for an allowance is about €8.
E.1.7 EU ETS PHASE III
Starting from the commencement of the third trading period (2013–20), the ETS will implement a new single EU-wide
emissions cap. Individual national allocation plans for each EU member state will be replaced by one EU-wide cap on
emissions amounting to around 2 billion allowances in 2013. This cap will reduce linearly and annually by 1.74 per cent of the
average annual level of the Phase II cap (equalling approximately 37 million allowances each year), with a view to delivering an
overall reduction of 21 per cent below 2005 verifi ed emissions by 2020.
Auctions for emission allowances will be held by member states and will be open to any EU installation operator. The
associated revenues will be collected in member states’ national budgets, and no less than 20 per cent of these will be used to
encourage the use of clean coal technology (including CCS).
Furthermore, the regulations on how the allowances are allocated to individual installations are set by the EU rather than the
member states. There will be no free allocation to installations from the energy sector in the third phase, with installations from
industry sectors receiving free allocation based on a benchmark approach. This means that fossil fuel fi red power plants will
have to purchase/pay for the allowances for all the emissions they emit, unless derogations are granted (only a limited number
of countries can apply, and to date derogations have been authorised for Bulgaria, Romania, the Czech Republic, Cyprus,
Estonia, Lithuania, and Poland – Hungary and Latvia are yet to be decided).
The EC adopted a decision in April 2011 which provides for more than 50 product-related benchmarks for industry sectors.
According to EU legislation, the percentage of allowances allocated free of costs will decrease from 80 per cent in 2013 to 30
per cent in 2020. Also, a reduction factor will be applied to all industry sectors if the overall cap is not suffi cient to meet the
demand for emission allowances (as calculated on the basis of the benchmark model).
E.1.8 FRANCE
The basis of French climate change policy is the EC’s policy framework, including participation in the EU ETS. Climate policy in
France has not changed signifi cantly in the past 12 months, with strategies in the Plan Climate (2010) scheduled to run until
2020.
The Government established a working group in mid-2011 to explore scenarios to reduce emissions by 80 per cent by 2050.
E.1.9 GERMANY
Germany abides by the EC’s climate change policy and legislative frameworks, and it participates in the EU ETS. The
Government goes deeper than the unilateral emission reduction targets by setting a domestic target to reduce emissions by
40 per cent below 1990 levels by 2020.
In mid-2011, the German Government adopted the Energy Package, which complements the 2010 Energy Concept and
defi nes Germany’s energy policy.
In this policy document, the Government expressed strong support for CCS projects both under the EC’s Energy and Climate
Package (CCS Ready) as well as its development in the domestic energy and industrial sectors. It tried doing this through
the CCS Act (fi nally adopted mid-2012 by the mediation committee for the transposition of the EC Directive) but this Act now
only allows for CCS on a test basis, restricts the amount of CO2 to be captured and stored to 1.3 million tonnes a year (up to a
maximum of 4 million tonnes), and provides individual states the option to opt out.
E.1.10 INDIA
While India is taking a cautious approach to CCS developments, the central government acknowledges that a lot of India’s
energy production for the next 20 years will be coal based. According to India’s 2nd National Communications under the
UNFCCC, coal meets 63 per cent of India’s total commercial energy requirement (indigenous reserves are suffi cient to meet
India’s power needs for at least another 100 years), followed by petroleum products (30 per cent), and natural gas. Nearly 70
per cent of the power requirements in India are presently met by thermal power plants.
T H E G L O B A L S TAT U S O F C C S : 2 0 1 2194
When this consideration is added to India’s 450 million people who do not have access to electricity, there seems an even
greater need to ensure that CCS is available to countries like India, where the use of coal to generate electricity is expected to
dramatically increase, especially since it will remain for some time the cheapest energy source available.
The IEA estimates that India’s emissions rose by 140 MtCO2-e or 8.7 per cent in 2011 compared to 2010. India’s principal
climate change framework is its National Action Plan on Climate Change (NAPCC) 12th Plan period 2012/13–2016/17. This
complements the existing Integrated Energy Policy, as well as state governments’ respective State Action Plan on Climate
Change (SAPCC).
India has also set up an Expert Group on Low Carbon Strategy for Inclusive Growth to develop a roadmap for low carbon
development in prioritised sectors such as electricity, industry, oil, and gas.
The Group released an interim report in May 2011 noting that the implementation of existing policies can achieve an emission
intensity reduction of nearly 23–25 per cent by 2020 compared to 2005 levels. It further notes that with external development
assistance and technology transfer, a 33–35 per cent emission intensity reduction by 2020 is even possible.
As at the fi rst Quarter 2012, six of the original eight missions envisaged in the NAPCC have been approved, with the
Government announcing its intention to introduce a ‘National Mission on Clean Coal Technologies’, including CCS. This will be
the ninth mission under the NAPCC, which aims to minimise the emissions arising specifi cally from coal-fi red power plants.
India has a coal levy, for which funds (estimated to be US$500 million over the fi nancial year 2010–11) are hypothecated to a
National Clean Energy Fund which will be used for funding research and innovative projects in clean energy technologies.
The 2012 Budget, announced in May, did not carry details on the scale or fate of the fund, simply announcing that imported
steaming coal was exempted for the next two years from full customs duty. Bloomberg estimates the fund could yield some
US$1.2 billion in 2012.
In addition to this, the IEA estimates that India invested more than US$10.2 billion in clean energy technologies in 2010.
In March 2012, industrial energy effi ciency targets (with tradable instruments for over-achieving targets) were announced
under the Perform, Achieve, and Trade (PAT) program, for about 480 entities; the program is estimated to save some
30 MtCO2 per annum. The power sector and steel sectors are expected to drive some 70 per cent of the savings.
The Global CCS Institute is currently working with the Energy and Resources Institute (TERI) on a CCS scoping study, which
should be completed in 2012.
Interestingly, India was only one of six parties which submitted views on the UNFCCC’s CCS in the CDM process, which were
formally considered in the inter-sessional meeting in May. In it they express support for a permanent global reserve of offsets,
equal to 2 per cent of the total number of project offsets generated, to remedy unexpected events from CCS projects.
E.1.11 INDONESIA
Indonesia’s National Council on Climate Change, which has 17 Ministers and is chaired by the President, is in charge of
coordinating Indonesia’s climate change policies and international positions. The Council is being supported by a number of
Working Groups, including Mitigation, and Transfer of Technology. While the Council is exploring the establishment of a cap
and trade mechanism, Indonesia does not seem to have any plans to set up a domestic carbon trading system.
In Indonesia, many of the key initiatives are embodied in decrees rather than legislation, and passed by Ministries rather than
Parliament. In late 2011, the President approved a decree that obligates Indonesia to cut its emissions 26 per cent below
unchecked levels by 2020, and 41 per cent if the country can secure international funding.
Most of Indonesia’s mitigation efforts are focused on the forestry sector, as the country emits well over 1 billion tonnes of CO2-e
annually from deforestation and burning of peat land (80 per cent of its emissions).
Per capita electricity demand has increased nearly three-fold over the past two decades in Indonesia, spurring its nuclear
program to install four nuclear power plants with a combined capacity of 4000 MW by 2025. Along with Australia and South
Africa, Indonesia is one of the world’s top coal exporters (although it is planning in 2012 to introduce an export tax on coal).
The climate change decree also provides emission targets for sectors compared to expected emission levels if no further
policies are implemented. The energy and transport sector must save 38 to 56 MtCO2-e.
E.1.12 ITALY
The basis of Italian climate change policy is the EC’s policy framework, including participating in the EU ETS. Climate policy in
Italy has not changed signifi cantly in the past 12 months.

195A P P E N D I C E S
E.1.13 JAPAN
The principal framework for developing climate change policy is the 1998 Guideline of Measures to Prevent Global Warming
and Climate Change Law Concerning the Promotion of Measures to Cope with Global Warming (Act on Promotion of Global
Warming Countermeasures). The principles surrounding the establishment of carbon pricing are underpinned by the National
Fundamental Law on Energy (Basic Act on Energy Policy).
To deliver on its UNFCCC obligations, Japan has mostly relied on domestic emission reductions through mitigation and
forest carbon-sink measures, as well as purchases of UNFCCC backed units (it is one of the biggest buyers internationally of
these tradable units). It is understood that this is because Japan does not currently have adequate scope for GHG emissions
reductions through energy conservation or energy effi ciency, especially in the industrial sector, as it has been a global front-
runner in these areas since the 1980s.
Japan made it clear at COP 16 that it does not intend participating in the continuation of the Kyoto Protocol post-2012, and
as such will no longer be subject to binding emission reduction targets. This is because they see the framework as forcing
legal obligations on certain parties only, and to limited effect, and the framework does not involve major GHG emitters such as
China, the US, and India. To facilitate its long-term emission reduction target, Japan is expecting to pursue offset opportunities.
In addition to the CDM, Japan is proposing a new market mechanism under a post-2012 framework called a bilateral offsets
crediting mechanism (BOCM).
A key difference between CDM and the BOCM is that any UNFCCC oversight of the BOCM is minimised to the function of
providing guidance for emissions monitoring, reporting, and verifi cation (MRV) and accounting rules. The BOCM will be
technology-agnostic and intends to cover a wider range of sectors and activities from transport, waste management, energy
effi ciency, renewable energy, and also REDD+ projects. Japan also advocates that bilateral cooperation will potentially pave the
way for more engagements by developing countries in emission reduction efforts in the future.
The Ministry of Economy, Trade and Industry (METI) and the Ministry of the Environment have commissioned over 100
feasibility studies to identify potential emissions reduction projects which can be implemented.
With Japan as one of the world’s biggest coal importers, coupled with continued power shortages and a curtailing of new
nuclear power plants projects, this all seems to further limit its ability to achieve its stated emission reduction target.
A new energy blueprint is expected to be released in late 2012, outlining an aggressive role to play by renewables (some 30 per
cent share) and supported by a feed-in tariff regime. The premium prices paid by utilities could be as high as US$0.57c per kWh.
E.1.14 MALAYSIA
Malaysia launched its National Policy on Climate Change in 2010, which provides its overarching policy framework. There
have been no substantial policy announcements over the past year. In mid-2011, Malaysia released its 2nd National
Communications to the UNFCCC.
Malaysia indicated in its high-level statement at COP 17 (late 2011) that its low-carbon strategy is dependent on multi-sectoral
and trans-ministerial initiatives (such as National Green Technology and Climate Change Council, National Climate Change
Focal Point, and National Steering Committee on Climate Change).
Delivering its 2020 emission reduction pledge (up to 40 per cent energy intensity per capita compared to 2005 levels) is
conditional on technology transfer and access to international fi nance from developed countries, such as those potentially
provided through the Technology Mechanism and the GCF.
E.1.15 MEXICO
The General Law on Climate Change (GLCC) was passed in mid-2012. There is also a permanent Inter-ministerial Commission
on Climate Change comprising the Departments of Foreign Relations, Social Development, Environment and Natural
Resources, Energy, Economy, Agriculture, and Communications and Transport.
The GLCC demonstrates major progress for Mexico, and leads by example for other countries to address climate change
and transition to a low-carbon economy. While this law does not include concrete measures and activities, it consolidates the
existing institutional structures (under the Special Programme on Climate Change 2009–2012) and tasks the Commission to
encourage the development of a carbon trading scheme.
The Commission will oversee six working groups including the following two: Mitigation and a Mexican Committee for Emission
Reduction and GHG Capture Projects.
In a recent submission to the UNFCCC, Mexico supports the establishment of new market mechanisms, as well as possibly
sectoral approaches where countries retain sovereign capacity to decide which aspects of its economy are introduced into
international markets, and which count as a contribution to the achievement of its own pledges.
T H E G L O B A L S TAT U S O F C C S : 2 0 1 2196
It also sets the target for the electricity sector to provide 35 per cent of Mexico’s electricity from clean sources by 2024. Mexico
considers CCS an important option in a long-term climate strategy, but outside of the CCS-CO2 EOR opportunities, there are no
direct incentives for coal-related CCS.
Mexico is very much an international leader. Apart from hosting COP 16, it recently hosted the Group of 20 (G20) Summit, as
well as a strong advocate for the creation of the Green Climate Fund. It has subsequently submitted a bid (one of six countries)
to host it. The Government offered US$500,000 to support administrative expenses of the Secretariat.
To support CCS activities, Mexico, in partnership with the US DOE and Canada, recently released an atlas mapping potential
storage capacity in North America. It cites Mexico’s resource as at least 100 GtCO2, compared with annual emissions of about
205 MtCO2.
The development of a National CCUS Strategy and Regulatory Framework was identifi ed as a goal in Mexico’s National Energy
Strategy 2012–2026, which was presented to the Mexican Congress in April 2012
E.1.16 THE NETHERLANDS
Like other EU member states, the Netherlands operates within the broader framework of the EC climate policy and its
emissions targets.
In November 2011, the Government released its Energy Report 2011, recognising not only the inevitability of CCS use
(including for gas), but also that the Dutch economy can benefi t greatly from being a global leader in CCS. Its major policy
focus is to support CCS via demonstration projects.
The Government is only permitting demonstration projects for under-sea storage (not on-shore storage), and is actively
pursuing European funding opportunities (such as the NER300) for them. It is also adopting policy measures that encourage
CCS as well as setting parameters for conventional fuels.
E.1.17 NEW ZEALAND
In mid-2011, a review panel released its fi ndings on how the NZ ETS (which started in 2009, with liquid fossil fuels, stationary
energy, and industrial processes beginning to be covered in 2010) should evolve beyond 2012. A Government consultation
paper was released in mid 2012 outlining two proposals. The fi rst limits CERs to 50 per cent fulfi lment of the emission
reduction obligation and the second proposes auctioning of permits.
The limit on CERs is similar to that of Australia, as the Government accords a high priority to the development of international
carbon markets more generally. It is in formal discussions with Australia and Korea. It is interesting to note that only about 2
per cent of total allowances acquitted were sourced from CDM projects (noting that CERs generated from HFC-23 and N2O
projects are not allowed).
NZ has adopted a 90 per cent by 2025 renewable electricity target.
E.1.18 NORWAY
Climate policy in Norway has not changed signifi cantly in the past 12 months, and it continues to rely on its carbon tax on
offshore petroleum production installations, along with its membership in the EU ETS, to reduce emissions (even though the
country is not a member of the EU it is a member of the European Economic Area Agreement).
The Government released in April 2012 a White Paper on Climate Change Actions. While there are no new national measures,
there is an increase to the CO2 tax rate to about €51/tCO
2, a new technology fund established with up to €6.6 billion by 2016,
and the intent to pass a law requiring all new gas power plants to be CCS ready at start-up.
E.1.19 ROMANIA
The basis of Romania’s climate change policy is the EC’s policy framework. Romania also participates in the EU ETS. In early
2012, the EC authorised Romania’s request for the continued free allocation of EU ETS allowances to their power sectors
beyond this year (rather than having to purchase them on the open market).
Due to irregularities found in the country’s national GHG emissions inventory, Romania’s eligibility to internationally trade its
surplus Kyoto allowances under the Kyoto Protocol’s international emissions trading scheme was suspended in late August
2011.
Romania’s National Emissions Registry underpinning its participation in the EU ETS was also suspended in 2011 by the EC
due to unlawfully transferred allowances, and allowed to re-open in March 2012.

197A P P E N D I C E S
E.1.20 RUSSIA
According to public sources, the Russian Government released in mid-2011 a decree titled Comprehensive Plan of
Implementing the Russian Federation’s Climate Doctrine for the Period until 2020.
It includes the Ministry for Energy overseeing the:
development and implementation of pilot projects on the construction and development of industrial exploitation in the field
of energy for the capture and disposal of CO2; and
implementation of a set of measures to limit GHG emissions from energy generation from fossil fuels.
Russia has refused to take on a second target under the Kyoto Protocol, preferring instead to keep to its voluntary emissions
cut pledge made under the Copenhagen Accord in 2009. As such, the fate of its estimated 6 billion surplus of Kyoto credits
remains in doubt.
In late 2011, the Government approved a self-imposed cap (300 million) on the number of JI credits it can issue to projects.
E.1.21 SAUDI ARABIA
The principal climate change framework is the Ninth Development Plan, Chapters 14 (Environmental Management) and 26 (oil
and gas); the latter indicates a preference for CCS. There has been no substantial change in policy over the past 12 months.
E.1.22 SOUTH AFRICA
Policymaking in South Africa typically starts with the introduction of a Green Paper (a public discussion document) followed
by a White Paper (broadly outlining government policy). Although there is no climate change law, there has been a number
of Green Papers outlining market-based approaches to facilitating mitigation. The principal framework for climate change is
the Vision, Strategic Direction and Framework for Climate Policy (2008). This Policy supports CCS for coal-fi red power stations
and all CTL plants, and in general power plants that are not CCS Ready should not be approved. The Treasury has also been
charged with studying the implementation of a carbon tax by 2018–20. It is expected that this will be considered by the
recently formed CCS Interdepartmental Task Team.
In October 2011, it released a White Paper on National Climate Change Response Strategy. It recognises the potential of CCS
over the short and medium term in the synthetic fuels industry, and highlights the Carbon Capture and Sequestration Flagship
Programme as led by the Department of Energy in partnership with the South African Energy Research Institute. The program
includes, among other initiatives, the development of a CCS demonstration plant to store the emissions from an existing high-
carbon emissions facility.
It also notes that a portfolio of economic instruments, including carbon taxes and emissions trading schemes and
complemented by appropriate regulatory policy measures, are essential to driving and facilitating mitigation efforts and creating
incentives for mitigation actions across a wide range of key economic sectors. This will be overseen by the Treasury, and the
Departments of Trade and Industry and Economic Development.
In addition to the 2010 Green Paper on a carbon tax, the 2012 Budget states that a revised policy paper on a carbon tax will
be published in 2012 for a second round of public comment and consultation. The Government accepts the need to price
carbon emissions and the phasing in of a tax instrument for this purpose. A phased implementation of the carbon tax by 2013
is expected, with the price starting at US$15.60/tCO2e above a tax-free threshold (for most sectors this is 60 per cent) and
would increase by 10 per cent until 2019–20.
South Africa also hosted the UNFCCC’s COP 17/CMP 7 in Durban. These climate negotiations achieved the resolution of the
inclusion of CCS in the CDM with the fi nalisation of modalities and procedures, as well as agreement to explore a new legally
binding instrument or arrangement for enhanced mitigation in a post-Kyoto world (mostly after 2020).
E.1.23 KOREA
Korea is listed as one of the top 10 largest emitters globally, driven by its energy-intensive economic activity (manufacturing).
The central policy platform driving emissions and pollution management, as well as economic development in Korea,
is the Five Year National Plan for Green Growth (see the Global Status of CCS: 2011 report for details). Korea, through
the Presidential Committee on Green Growth (its central policy making force), has equipped its regulatory institutions to
appropriately enforce these policies.
The two major objectives of this Plan are to reduce emissions by 4 per cent below 2005 levels by 2020 (as submitted to the
UNFCCC), and to allocate 2 per cent of annual GDP to Green Growth investments and development projects.

T H E G L O B A L S TAT U S O F C C S : 2 0 1 2198
The Korean National Assembly recently released the emission profi les of the country’s top 150 emitters, showing a 9.1 per
cent growth year on year. This is driven by the power, oil refi ning, and steel sectors.
After what seems much national deliberation, in May 2012 Korea approved the establishment of a cap-and-trade scheme
in 2015 (with commitment periods expected to be 2015–17, 2018–20, and 2021–26) as the major enabler of its mitigation
efforts. This is in addition to the imposition in 2012 of its Emissions Target Management Scheme (ETMS) (i.e. emission
reduction goals on 458 of its largest emitters ranging from factories, buildings, and livestock farms). The expected
interplay between the ETMS and the ETS is that facilities producing less than 25,000 tCO2-e per year (or entities producing
125,000 tCO2-e per year) will not have obligations under the ETS, but there will be a voluntary opt-in option.
While it could take some months for the ETS design to be fi nalised (the promulgation of a Presidential Decree is expected by
November 2012), it has been indicated that the penalty for non-compliance could be set at three times the prevailing market
price (expected to be no more than US$113 per tonne). There may also be a 95 per cent free allocation of permits (and 100
per cent to trade-exposed entities) in the fi rst and second commitment periods, as well as permission for both banking and
borrowing from other commitment periods.
There are many key issues still to be decided, however, including: coverage (about 60 per cent of emitters are expected to be
included), the emissions caps and reduction targets for each period, the caps on banking and borrowing, and the rules for
using international offsets (such as those generated under the CDM). Korea is also reportedly in talks with both Australia and
New Zealand to discuss ways of linking their respective emissions trading schemes.
Korea is showing a preference for incentive-based instruments that not only allow national industries to act in their own self-
interest but in a way that can deliver effi ciently on national objectives.
In a 2012 submission to the UNFCCC on Nationally Appropriate Mitigation Actions (NAMAs), Korea stated that it believed
what was lacking in the international climate change agenda was a climate regime that could improve the commercial viability
of investments for mitigation, and that if such a regime existed then the market will drive fi nance and technology to fl ow to
mitigation actions in developing countries.
In addition to market-based instruments, the Government indicated that it will spend US$150 million over the next decade
specifi cally on CCS, and the Ministry of Education, Science and Technology (MEST) recently publicly stated that the
Government intends to enhance Korea’s R&D efforts in CCS.
Korea is demonstrating international leadership in the climate change policy agenda by being one of two countries shortlisted
to host COP 18. While Qatar won the bid, Korea will host a key ministerial meeting in the lead-up to COP 18, which will be
instrumental in clarifying the central issues in the weeks before a COP.
Korea has also submitted a bid to host the GCF (one of six countries to do so). It has offered support of US$2 million in 2012
for its start-up and an additional US$1 million per annum until 2019.
E.1.24 SPAIN
The basis of Spain’s climate change policy is the EC’s policy framework, including participating in the EU ETS. Spain’s National
Allocation Plan (holding 2012 emissions to at most 37 per cent of the 1990 base year) ends in 2013. From this date, the EC
approach will be adopted.
In late 2011, a Carbon Fund for a Sustainable Economy was established by means of Royal Decree (1494/2011) to buy carbon
credits. It is administered by the Secretary of State for Climate Change, and will contribute to the fulfi lment of the objectives
of reducing emissions taken by Spain with the acquisition of carbon credits. Spain is the second largest buyer of UN offsets
under the CDM after Japan.
E.1.25 SWEDEN
The basis of Sweden’s climate change policy is the EC’s policy framework, including participating in the EU ETS. Sweden’s
National Emissions Registry, underpinning its participation in the EU ETS, was suspended early this year due to security issues
and allowed to re-open in March 2012.
Climate policy in Sweden has not changed signifi cantly in the past 12 months, although there have been increases in its
energy and CO2 tax from 2011. Sweden is also developing a carbon neutral by 2050 roadmap, which is expected to be
considered by Government at the end of 2012. In 2011, the Government also presented an environmental technology strategy.

199A P P E N D I C E S
E.1.26 TRINIDAD AND TOBAGO
In mid-2011, the Government of Trinidad and Tobago released its National Climate Change Policy. The document highlights
that it will increase the use of cleaner technology in all sectors by developing regulatory approaches and technology standards,
explore the feasibility of cap and trade schemes within and across emitting entities, and explore CCS and CCUS (among other
approaches).
E.1.27 UNITED KINGDOM
In addition to the UK refl ecting the broader EC climate policy framework and emissions targets, it has had several instruments
directly aimed at achieving emissions reduction since the early 2000s.
The principal long-term framework for managing emissions is the Climate Change Act (2008). The Act enshrines in legislation
the UK’s emissions reduction targets (at least 34 and 80 per cent lower than the 1990 baseline for the years 2020 and 2050
respectively), and creates fi ve-yearly carbon budgets (the fi rst four are 2008–12, 2013–17, 2018–22, and 2023–27). It also
established an independent Climate Change Committee (CCC) to advise the Government.
In 2010, the CCC released, and the Government responded to, several recommendations dealing with electricity market
reform, carbon price fl oor, and the Emissions Performance Standard (EPS), among other things.
The EPS is currently set at the equivalent of 0.45 kg of CO2 per kWh. The carbon price fl oor is aimed at avoiding stranding low-
carbon assets due to very low international carbon prices.
The Energy Act 2011 provides for specifi c CCS incentives to support the construction of four commercial-scale demonstration
projects in the UK, and retrofi tting additional CCS capacity to these projects should it be required at a future point. It also
adopts a CCS Ready policy for new fossil fuel fi red power stations.
In late 2011, pursuant to the Climate Change Act, the Government released The Carbon Plan outlining its plans for achieving
the fi rst four carbon budgets (2008–27) on a pathway consistent with meeting the 2050 target.
The Plan recognises that by being an early mover in technologies such as CCS (for both fossil fuel and biomass plants), the UK
could establish a long-term comparative advantage in growing global markets for these technologies.
As such, CCS forms an integral component of the sectoral plans for both industry and the power sector. The Plan also states
that Scotland believes that fossil fuels – with CCS, renewables, and energy effi ciency – are the best long-term solutions to its
energy security.
Complementing the sectoral plans is the release of the CCS Roadmap titled Supporting Deployment of CCS in the UK.
The roadmap outlines:
a CCS commercialisation program (£1 billion);
a R&D innovation program (£125 million);
continued electricity market reform including long-term feed-in tariffs with ‘contract for difference’ tailored to the needs of
CCS power plants;
development of transport and storage networks; and
continued international engagement.
In 2012, Scotland released its Electricity Generation Policy Statement which specifi ed that new fossil fuel plants over 300 MW
will need to demonstrate CCS readiness (previously it applied only to coal).
E.1.28 UNITED STATES
Despite multiple attempts in recent years, the US has been unsuccessful in passing federal climate legislation. In the absence
of a dedicated federal scheme, US climate policy is being pursued through federal regulation under the existing Clean Air Act
(CAA) and individual state initiatives.
At the federal level, the US EPA and the Department of Transportation have issued regulations establishing GHG emission
standards and corporate average fuel economy standards for light duty vehicles and GHG emissions standards and fuel
effi ciency standards for medium and heavy-duty engines and vehicles.
EPA has also issued regulations establishing permitting requirements for major stationary sources of GHGs under the New
Source Review Prevention of Signifi cant Deterioration (PSD) and Title V Operating Permit programs. PSD (preconstruction)
permitting involves a fi ve-step top-down analysis for the Best Available Control Technology (BACT). The permitting guidance
identifi es CCS as an add-on pollution control technology that is ‘available’ for facilities emitting CO2 in large amounts and which
should be listed as an option at step one of the BACT process for such facilities.

T H E G L O B A L S TAT U S O F C C S : 2 0 1 2200
On 27 March 2012 the EPA issued for comment a Rule proposing that new fossil fuel-fi red power plants greater than 25 MW
(electric) meet an output‐based performance standard of 1000 pounds of CO2 per megawatt‐hour. New power plants that use
CCS would have the option to use a 30‐year average of CO2 emissions to meet the proposed standard rather than meeting the
annual standard each year. The proposal does not apply to existing units and transitional sources that have PSD permits by the
date of the proposal and commence construction within 12 months of the proposal.
Multiple states have established GHG emission targets. California, one of the world’s largest economies, enacted the
comprehensive Global Warming Solutions Act in 2006 to reduce GHG emissions through a combination of regulatory and
market mechanisms. Under the Act, California established a cap and trade program for major sources with enforceable
compliance obligations, beginning with 2013 emissions. California is also partnering with British Columbia, Ontario, Quebec,
and Manitoba in the Western Climate Initiative to develop a cap and trade program that transcends national boundaries.
The Regional GHG Initiative – a cooperative effort among nine Northeastern and Mid-Atlantic states to reduce GHGs through
a market-based cap and trade program – completed its fi rst three year control period in 2011. In addition to GHG specifi c
laws and policies, EIA reports that 30 states and the District of Columbia have enforceable renewable portfolio standards or
similar laws.
In the 2013 Energy Budget, the President announced a clean energy standard (CES) is one policy option to be considered
for supporting the deployment of clean energy technology (including CCS) and reducing emissions from the electric power
sector. This is consistent with his 2011 State of the Union address, where he announced the goal of producing 80 per cent of
electricity from ‘clean’ energy sources by 2035.
In addition, the Budget allocates US$276 million for research and development of advanced fossil fuel power systems, CCS,
and CCUS.
In March 2012, the Clean Energy Standard Act was introduced which, if passed, will establish a standard for clean energy
generation in the US through 2035. The Act provides for CCS facilities.
The US has agreed to only voluntary emission pledges to 2020 under the UNFCCC, and has indicated that, similar to the fi rst
commitment period under the Kyoto Protocol, it will not be ratifying a second commitment period either.
The US seems to be placing increasing emphasis on CCUS as a potential path for early-mover CCS adoption.
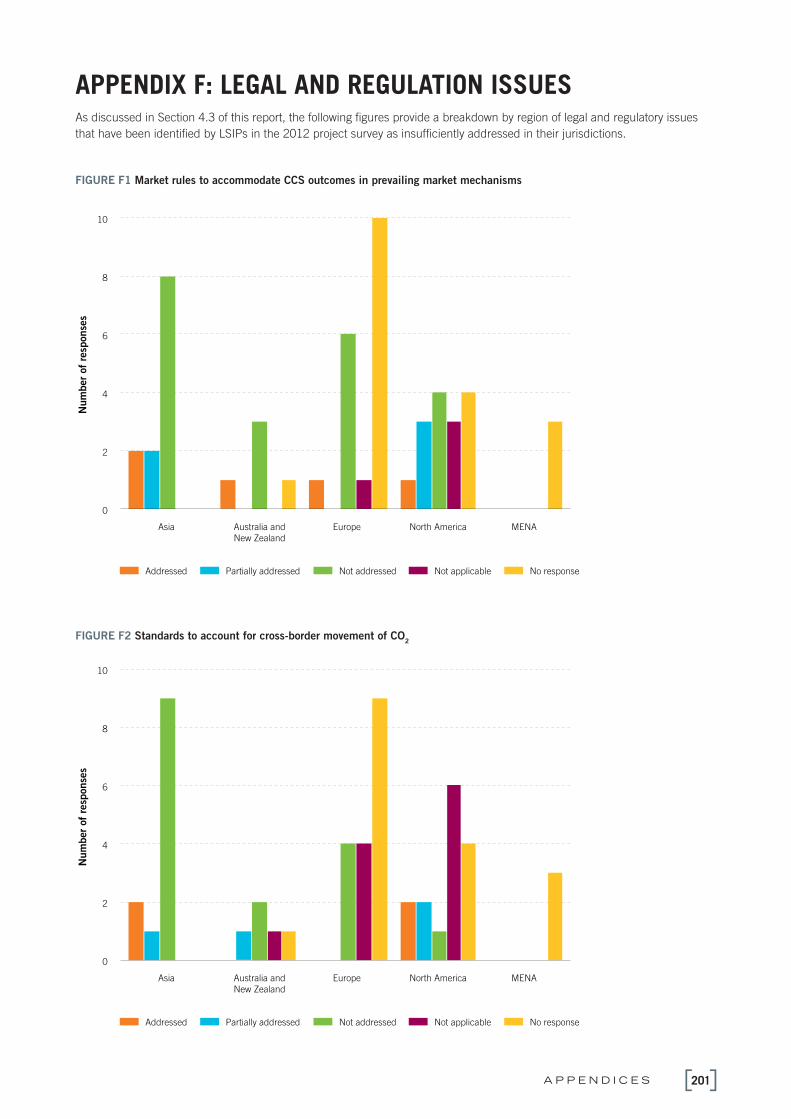
201A P P E N D I C E S
APPENDIX F: LE GAL AND REGULATION ISSUESAs discussed in Section 4.3 of this report, the following fi gures provide a breakdown by region of legal and regulatory issues
that have been identifi ed by LSIPs in the 2012 project survey as insuffi ciently addressed in their jurisdictions.
FIGURE F1 Market rules to accommodate CCS outcomes in prevailing market mechanisms
Not addressed Not applicable No response Partially addressed Addressed
0
2
4
6
8
10
Asia Australia and
New Zealand
Europe North America MENA
Num
ber
of
resp
onse
s
FIGURE F2 Standards to account for cross-border movement of CO2
Not addressed Not applicable No response Partially addressed Addressed
0
2
4
6
8
10
Asia Australia and
New Zealand
Europe North America MENA
Num
ber
of
resp
onse
s

T H E G L O B A L S TAT U S O F C C S : 2 0 1 2202
Not addressed Not applicable No response Partially addressed Addressed
0
2
4
6
8
10
Asia Australia and
New Zealand
Europe North America MENA
Num
ber
of
resp
onse
sFIGURE F3 Remediation activities to be undertaken by the operator in the event of leakage
FIGURE F4 Post-operational transfer of operator's liability
Not addressed Not applicable No response Partially addressed Addressed
0
2
4
6
8
10
Asia Australia and
New Zealand
Europe North America MENA
Num
ber
of
resp
onse
s

203A P P E N D I C E S
Not addressed Not applicable No response Partially addressed Addressed
0
2
4
6
8
10
Asia Australia and
New Zealand
Europe North America MENA
Num
ber
of
resp
onse
s
Not addressed Not applicable No response Partially addressed Addressed
0
2
4
6
8
10
Asia Australia and
New Zealand
Europe North America MENA
Num
ber
of
resp
onse
sFIGURE F5 Defi nition of project boundaries
FIGURE F6 Drafting and implementation of a monitoring plan

T H E G L O B A L S TAT U S O F C C S : 2 0 1 2204
FIGURE F7 Selection and evaluation of a storage site
Not addressed Not applicable No response Partially addressed Addressed
0
2
4
6
8
10
Asia Australia and
New Zealand
Europe North America MENA
Num
ber
of
resp
onse
s
Not addressed Not applicable No response Partially addressed Addressed
0
2
4
6
8
10
Asia Australia and
New Zealand
Europe North America MENA
Num
ber
of
resp
onse
s
FIGURE F8 CCS activities adequately addressed in pre-existing planning and permitting regimes

205A P P E N D I C E S
APPENDIX G: CCS ACTIVI TIES IN DEVELOPING COUNTRIESTable G1 provides an illustrative list of CCS activities developing countries, as at August 2012.
TABLE G1 Illustrative list of CCS activities in developing countries
COUNTRY CCS ACTIVITIES
Algeria CCS project in operation
Botswana CCS workshops conducted, raising awareness
Study underway which includes:
Initial assessments on role and opportunity for CCS
Undertaking preliminary geologic assessment
Brazil Centre of Excellence in CCS R&D has been established
Completed a Geographic Information System (GIS)-based database of CO2 sources and sinks
Pilot CO2 injection program underway
Reviewing and refi ning Brazilian Carbon Geological Sequestration Map (CARBMAP) program
China CCS adopted as a key GHG mitigation technology in National Climate Change Program
Numerous domestic R&D initiatives
Efforts underway to assess and characterise CO2 storage capacity by Chinese Geological Survey
Several pilot projects, e.g. for CO2 capture and CO
2 EOR
11 large-scale integrated demonstration projects in the planning stages
Egypt Study underway assessing potential for CCS in gas processing and power industry, identifying barriers and
environmental impacts
India Interest in CO2 capture for EOR fi eld studies
Indian CCS Scoping Study
Proposed study to carry out a technical feasibility assessment to review and evaluate a range of capture
technologies
Indonesia Study being fi nalised on potential for CCS as part of South East Asia CCS Scoping Study, including
opportunities for deployment and regulatory and economic analysis
Assessment of current CCS R&D activities and technical capacity of the domestic industry to provide support
throughout the CCS chain
Workshops on developing a CCS Technology Roadmap
Preliminary studies on CCS and EOR
Jordan Study underway assessing potential for CCS in oil shale development strategy and to identify and address
legal, regulatory, and fi nancial barriers
Kenya Investigating possibility for high-level storage study
Kosovo Study completed which covers:
Preliminary geologic potential
Capacity-building assessment including legal and regulatory requirements
Workshops and training on CCS technology
continued on page 206
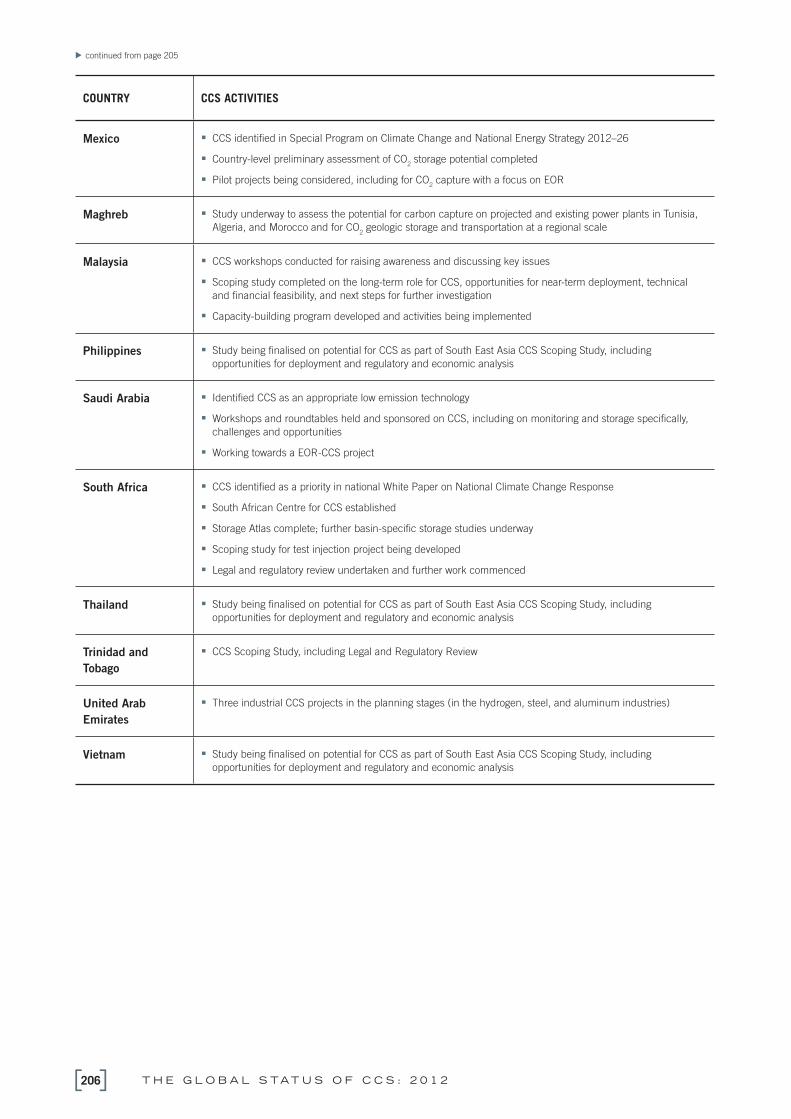
T H E G L O B A L S TAT U S O F C C S : 2 0 1 2206
COUNTRY CCS ACTIVITIES
Mexico CCS identifi ed in Special Program on Climate Change and National Energy Strategy 2012–26
Country-level preliminary assessment of CO2 storage potential completed
Pilot projects being considered, including for CO2 capture with a focus on EOR
Maghreb Study underway to assess the potential for carbon capture on projected and existing power plants in Tunisia,
Algeria, and Morocco and for CO2 geologic storage and transportation at a regional scale
Malaysia CCS workshops conducted for raising awareness and discussing key issues
Scoping study completed on the long-term role for CCS, opportunities for near-term deployment, technical
and fi nancial feasibility, and next steps for further investigation
Capacity-building program developed and activities being implemented
Philippines Study being fi nalised on potential for CCS as part of South East Asia CCS Scoping Study, including
opportunities for deployment and regulatory and economic analysis
Saudi Arabia Identifi ed CCS as an appropriate low emission technology
Workshops and roundtables held and sponsored on CCS, including on monitoring and storage specifi cally,
challenges and opportunities
Working towards a EOR-CCS project
South Africa CCS identifi ed as a priority in national White Paper on National Climate Change Response
South African Centre for CCS established
Storage Atlas complete; further basin-specifi c storage studies underway
Scoping study for test injection project being developed
Legal and regulatory review undertaken and further work commenced
Thailand Study being fi nalised on potential for CCS as part of South East Asia CCS Scoping Study, including
opportunities for deployment and regulatory and economic analysis
Trinidad and
Tobago
CCS Scoping Study, including Legal and Regulatory Review
United Arab
Emirates
Three industrial CCS projects in the planning stages (in the hydrogen, steel, and aluminum industries)
Vietnam Study being fi nalised on potential for CCS as part of South East Asia CCS Scoping Study, including
opportunities for deployment and regulatory and economic analysis
continued from page 205

207A P P E N D I C E S
APPENDIX H: US CO2 PIPELINES
Table H1 provides an overview of the main existing CO2 EOR pipelines in the US. Chapter 7 discusses a number of LSIPs that
could be considered extensions or components of these existing CO2 EOR pipeline networks in the US.
TABLE H1 Exisiting major US CO2 pipelines
PIPELINE OWNER/OPERATOR LENGTH (KM) DIAMETER (IN) ESTIMATED MAX
FLOW CAPACITY
(MTPA)
LOCATION
(STATE)
Adair Apache 24 4 1 TX
Anton Irish Oxy 64 8 1.6 TX
Beaver Creek Devon 85 WY
Borger, TX to Camrick, OK Chaparral Energy 138 4 1 TX, OK
Bravo Oxy Permian 351 20 7 NM, TX
Centerline Kinder Morgan 182 16 4.3 TX
Central Basin Kinder Morgan 230 16 4.3 TX
Chaparral Chaparral Energy 37 6 1.3 OK
Choctaw (NEJD) Denbury Onshore, LLC 294 20 7 MS, LA
Comanche Creek (currently
inactive)
PetroSource 193 6 1.3 TX
Cordona Lake XTO 11 6 1.3 TX
Cortez Kinder Morgan 808 30 23.6 TX
Delta Denbury Onshore, LLC 174 24 11.4 MS, LA
Dollarhide Chevron 37 8 1.6 TX
El Mar Kinder Morgan 56 6 1.3 TX
Enid-Purdy (Central
Oklahoma)
Merit 188 8 1.6 OK
Este I to Welch, TX ExxonMobil 64 14 3.4 TX
Este II to Salt Creek Field ExxonMobil 72 12 2.6 TX
Ford Kinder Morgan 19 4 1 TX
Free State Denbury Onshore, LLC 138 20 7 MS
Green Line I Denbury Green Pipeline LLC 441 24 18 LA
Joffre Viking Penn West Petroleum, Ltd 13 6 1.3 Alberta
continued on page 208

T H E G L O B A L S TAT U S O F C C S : 2 0 1 2208
Source: Melzer Consulting, Hattenbach, BlueSource (2010).
PIPELINE OWNER/OPERATOR LENGTH (KM) DIAMETER (IN) ESTIMATED MAX
FLOW CAPACITY
(MTPA)
LOCATION
(STATE)
Llaro Trinity CO2 85 41133 1.6 NM
Lost Soldier/Werrz Merit 47 WY
Mabee Lateral Chevron 29 10 2.1 TX
McElmo Creek Kinder Morgan 64 8 1.6 CO, UT
Means ExxonMobil 56 12 2.6 TX
Monell Anadarko 8 1.6 WY
North Ward Estes Whiting 42 12 2.6 TX
North Cowden Oxy Permian 13 8 1.6 TX
Pecos County Kinder Morgan 42 8 1.6 TX
Powder River Basin CO2 PL Anadarko 201 16 4.3 WY
Raven Ridge Chevron 257 16 4.3 WY, CO
Rosebud Hess NM
Sheep Mountain Oxy Permian 656 24 11.4 TX
Shute Creek ExxonMobil 48 30 23.6 WY
Slaughter Oxy Permian 56 12 2.6 TX
Sonat (reconditioned
natural gas)
Denbury Onshore, LLC 80 18 3.2 MS
TransPetco TransPetco 177 8 1.6 TX, OK
W. Texas Trinity CO2 97 41133 1.6 TX, NM
Wellman PetroSource 42 6 1.3 TX
White Frost Core Energy, LLC 18 6 1.3 MI
Wyoming CO2 ExxonMobil 180 20-16 4.3 WY
Canyon Reef Carriers Kinder Morgan 224 16 4.3 TX
Dakota Gasifi cation (Souris
Valley)
Dakota Gasifi cation 328 41257 2.6 ND, Sask
Pikes Peak SandRidge 64 8 1.6 TX
Val Verde SandRidge 134 10 2.1 TX
continued from page 207

209R E F E R E N C E S
APPENDIX I: REFERENCES AND ABBREVIATIONSAEP, 2012. AEP Mountaineer II Project - Front end engineering and design (FEED) report, prepared for the Global CCS
Institute.
ONLINE http://www.globalccsinstitute.com/publications/aep-mountaineer-ii-project-front-end-engineering-and-design-feed-
report.
ARI (Advanced Resources International), 2009. Screening-level assessment of CO2 enhanced oil recovery opportunities in
China, prepared for Powerspan Corporation.
ARI and Melzer Consulting, 2010. Optimization of CO2 storage in CO
2 enhanced oil recovery projects, prepared for the
Department of Energy and Climate Change, Offi ce of Carbon Capture and Storage.
ONLINE http://www.adv-res.com/pdf/1006-optimization-of-co2-storage-in-co2-enhanced-oil-re.pdf.
Ashworth, P, Jeanneret, T, Stenner, K and Hobman, E.V, 2012. International comparison of the large group process, results
from Canada, Netherlands, Scotland and Australia. CSIRO: Australia. Report produced in conjunction with: Energy Research
Centre of the Netherlands, University of Calgary and University of Edinburgh.
ONLINE http://www.globalccsinstitute.com/publications/international-comparison-large-group-process-results-canada-
netherlands-scotland-and.
Ashworth, P, Bradbury, J, Feenstra, C.F.J, Greenberg, S, Hund, G, Mikunda, T, Shaw, H, and Wade, S, 2011. Communication/
engagement toolkit for CCS projects. CSIRO, Australia.
ONLINE www.globalccsinstitute.com/publications/communication-and-engagement-toolkit-ccs-projects.
Ashworth, P, Bradbury, J, Feenstra, C.F.J, Greenberg, S, Hund, G, Mikunda, T and Wade, S, 2010a. Communication, project
planning and management for CCS projects: an international comparison. CSIRO, Australia.
ONLINE www.globalccsinstitute.com/publications/communication-project-planning-and-management-carbon-capture-and-
storage-projects-inter.
Ashworth, P, Rodriguez, S, and Miller, A, 2010b. ZeroGen Project case study. CSIRO, Australia.
ONLINE www.globalccsinstitute.com/publications/zerogen-project-case-study.
Barnes, D.A, Bacon, DH, and Kelley, S.R, 2009. Geological sequestration of carbon dioxide in the Cambrian Mount Simon
Sandstone: Regional storage capacity, site characterization, and large-scale injection feasibility, Michigan Basin. Environmental
Geosciences, 16(3), pp.163-183.
Baumeister, C, and G, Peersman, 2011. The role of time-varying price elasticities in accounting for volatility changes in the
crude oil market. Bank of Canada Working Paper 2011-28, Canada.
Berenblyum, R, Shchipanov, A, Surguchev, L and Kollbotn, L, 2011. CO2 EOR and storage – lessons learned from several case
studies. In: 16th European Symposium on Improved Oil Recovery Cambridge, 12-14 April 2011, UK.
Bloomberg, 2012. Carbon capture and storage: Research note, 27 June 2012, Bloomberg New Energy Finance.
Bradbury, J, Greenburg, S and Wade, S, 2011. Communicating the risks of CCS. Wade LLC, US.
ONLINE www.globalccsinstitute.com/publications/communicating-risks-ccs.
Bradley, T, 2011. CO2 EOR – Quite a story… and a couple of tall tales. In: 17th Annual CO
2 Flooding Conference, 6-12
December 2011, Midland Texas, US.
Brennan, S, Causebrook, R, Gerling, P, Heidug, W, Holloway, S, Lipponen, J, McCoy, S, Pagnier, H, Warwick, P, White, D, and
Yoshimura, T, 2012. Towards international guidelines for CO2 storage capacity estimation. Abstract submitted for the 12th
Greenhouse Gas Control Technologies (GHGT) conference.
Buit, L, van den Noort, A, Triezenberg, D, Mastenbroek, M and Hage, F, 2011. Development of a large-scale CO2 transport
infrastructure in Europe: existing infrastructure for the transport of CO2. CO
2Europipe.
ONLINE http://www.co2europipe.eu/Publications/D2.1.1%20-%20Existing%20infrastructure%20for%20the%20transport%20
of%20CO2.pdf.
CATO-2, 2008. The Dutch National P&D programme for CCS, Holland.
ONLINE http://www.co2-cato.org/cato-2/themes/sp5-public-perception.
Chalmers, H, 2010. Flexible operation of coal-fi red power plant with CO2 capture. CCC/160, IEA Clean Coal Centre, London, UK.
Chiyoda Corporation, 2011. Preliminary feasibility study on CO2 carrier for ship-based CCS, prepared for the Global CCS
Institute.
ONLINE http://www.globalccsinstitute.com/publications/preliminary-feasibility-study-co2-carrier-ship-based-ccs.

T H E G L O B A L S TAT U S O F C C S : 2 0 1 2210
Ciferno, J.P, Munson, R.K and J.T, Murphy 2012. US DOE National Energy Technology Laboratory’s post combustion carbon
capture R&D program. In Carbon Management Technology Conference, 7-9 February 2012, Orland, US.
CO2CRC, 2012. New system reduces carbon capture costs by $20 per tonne, media release, 6 June 2012.
ONLINE http://www.CO2crc.com.au/dls/media/12/UNOClearwater.pdf.
CO2QUALSTORE, 2009. Guideline for the selection and qualifi cation of sites and projects for geological storage of CO2. DNV
Report No.: 2009-1425.
CO2RISKMAN 2012 (in prep). Guidance on effective risk management of safety and environmental major accident hazards
from CCS CO2 handling systems. DNV Report.
Colliver, A, Dowd, A and Rodriguez, S, 2011. Report on international carbon capture and storage education materials. CSIRO,
Australia.
Conway, T.J, Tans, P. P, 2012. Trends in atmospheric carbon dioxide. National Oceanic and Atmospheric Administration, and
Earth System Research Laboratory.
ONLINE http://www.esrl.noaa.gov/gmd/ccgg/trends/global.html.
Corry, O, and Reiner, D, 2011. Evaluating global CCS communication materials: A survey of global CCS communications,
prepared by the University of Cambridge for CSIRO, Australia.
ONLINE http://www.globalccsinstitute.com/publications/evaluating-global-ccs-communications.
Czajkowska, A, and Munro,S, 2012. Still stimulating: Government clean energy spending, Bloomberg New Energy Finance
Insight Notes, 13 March 2012, Bloomberg New Energy Finance.
de Best-Waldhober, M, Daamen, D, and Faaij, A, 2008. Informed and uninformed public opinions on CO2 capture and storage
technologies in the Netherlands, International Journal of Greenhouse Gas Control, 3(3), pp.322-332.
DECC (Department of Energy and Climate Change), 2012. CCS Roadmap: Learning by doing – launching the CCS
Commercialisation Programme. UK.
ONLINE http://www.decc.gov.uk/assets/decc/11/cutting-emissions/carbon-capture-storage/4900-ccs-roadmap-ccs-
commercialisation-programme.pdf.
DECC, 2011. Overarching National Policy Statement for Energy (EN-1), Presented to Parliament pursuant to Section 5(9) of
the Planning Act 2008. London: The Stationery Offi ce, UK.
ONLINE http://www.decc.gov.uk/assets/decc/11/meeting-energy-demand/consents-planning/nps2011/1938-overarching-nps-
for-energy-en1.pdf.
Dell, M, Jones, F, and A. Olken, 2012. Temperature shocks and economic growth: Evidence from the Last Half Century,
American Economic Journal: Macroeconomics, 4(3), pp.66-95.
DiPietro, P, Balash, P and Wallace M, 2012. A note on sources of CO2 supply for enhanced-oil-recovery operations, prepared
for NETL, April 2012, SPE Economics & Management.
DNV (Det Norske Veritas), 2010. Recommended Practice: DNV-RP-J202, Design and Operation of CO2 pipelines.
ONLINE http://exchange.dnv.com/publishing/codes/download.asp?url=2010-04/rp-j202.pdf.
Dooley, J.J and Friedman, S.J, 2005. A global but regionally disaggregated accounting of CO2 storage capacity: Data and
assumptions for compiling regional CO2 storage capacity supply curves (Lawrence Livermore National Laboratory), In: IEA,
2005, ObjECTS->MiniCAM, OECD/IEA, Paris, France.
ECN (Energy Research Centre of the Netherlands), 2010. What happened in Barendrecht? ECN/CAESAR.
ONLINE www.globalccsinstitute.com/publications/what-happened-barendrecht.
ECO2, 2011. ECO
2 - Sub-seabed CO
2 storage: Impact on marine ecosystems, website, ECO
2, Germany.
ONLINE http://www.eCO2-project.eu.
EIA, 2012. Annual energy outlook 2012. Offi ce of Integrated and International Energy Analysis, US Department of Energy.
ONLINE www.eia.gov/forecasts/aeo.
EIA, 2011. Annual energy outlook 2011. Offi ce of Integrated and International Energy Analysis, US Department of Energy.
Element Energy, 2010a. CO2 pipeline infrastructure: An analysis of global challenges and opportunities, prepared for the
IEAGHG. Cambridge, United Kingdom.
ElementEnergy, 2010b. One North Sea: A study into North Sea cross-border CO2 transport and storage, prepared for The
Norwegian Ministry of Petroleum and Energy and The UK Foreign and Commonwealth Offi ce on behalf of the North Sea Basin
Task Force (NSBTF).
211R E F E R E N C E S
EPA, 2011. PSD and Title V permitting guidance for greenhouse gases. Offi ce of Air Quality Planning and Standards, Air
Quality Policy Division, US.
ETI, 2009. Carbon capture and storage, website, Energy Technologies Institute LLP, UK.
ONLINE http://www.eti.co.uk/technology_programmes/carbon_capture_and_storage <http://www.eti.co.uk/technology_
programmes/carbon_capture_and_storage
EU GeoCapacity, 2009. Assessing European capacity for geological storage of carbon dioxide, report capacity standards and
site selection criteria D26 WP 4, Geological Survey of Denmark and Greenland, SES6-518318.
EU Storage Directive, 2009. Directive 2009/31/EC of the European Parliament and of the Council of 23 April 2009 on the
geological storage of carbon dioxide and amending Council Directive 85/337/EEC, European Parliament and Council Directives
2000/60/EC, 2001/80/EC, 2004/35/EC, 2006/12/EC, 2008/1/EC and Regulation (EC) No 1013/2006.
Eurobarometer, 2011, Eurobarometer survey on public awareness and acceptance of CCS. Special Eurobarometer 364, DG-
Research.
ONLINE http://ec.europa.eu/public_opinion/archives/ebs/ebs_364_en.pdf.
European CCS Demonstration Project Network, 2012. Thematic report: Public engagement session May 2012. European CCS
Demonstration Project Network.
ONLINE http://www.ccsnetwork.eu/uploads/publications/thematic_report_-_public_engagement_session_-_may_2012.pdf.
Faltinson, J, and Gunter, B, 2010. Net CO2 stored in North American EOR projects. Journal of Canadian Petroleum
Technology, 50(7/8), pp.55-60.
Finkenrath, M, 2011. Cost and performance of carbon capture from power generation, IEA Working Paper. OECD/IEA, Paris,
France.
Geogreen, 2011, Global analysis of storage resources and recommendations to policy makers to meet CCS deployment
objectives; prepared for IEAGHG and Global CCS Institute. Cambridge, UK.
Global CCS Institute and WorleyParsons, 2011. Economic assessment of carbon capture and storage technologies: 2011
update. Canberra, Australia.
ONLINE http://www.globalccsinstitute.com/publications/economic-assessment-carbon-capture-and-storage-technologies-
2011-update.
Global CCS Institute, 2012a. Technology options for CO2 capture. Canberra, Australia.
ONLINE http://www.globalccsinstitute.com/publications/technology-options-CO2-capture.
Global CCS Institute, 2012b. CO2 capture technologies: Oxy-combustion with CO2 capture. Canberra, Australia.
ONLINE http://www.globalccsinstitute.com/publications/CO2-capture-technologies-oxy-combustion-CO
2-capture.
Global CCS Institute, 2011a. The Global Status of CCS: 2010. Canberra, Australia.
ONLINE http://www.globalccsinstitute.com/publications/global-status-ccs-2010.
Global CCS Institute, 2011b. The Global Status of CCS: 2011. Canberra, Australia.
ONLINE http://www.globalccsinstitute.com/publications/global-status-ccs-2011.
Global CCS Institute, 2011c. The costs of CCS and other low-carbon technologies, Issues Brief 2011, no. 2., Canberra,
Australia.
ONLINE http://www.globalccsinstitute.com/publications/costs-ccs-and-other-low-carbon-technologies.
Godec, M, 2011. Global technology roadmap for CCS in industry: Sectoral assessment CO2 enhanced oil recovery, prepared by
Advanced Resources International for United Nations Industrial Development Organization (UNIDO).
Government of Western Australia, 2011. Collie-South West CO2 Geosequestration Hub: Project and activity progress report for
the Global CCS Institute.
ONLINE http://www.globalccsinstitute.com/publications/south-west-co2-geosequestration-hub-%E2%80%93-project-overview-
report.
Gozalpour, F, Ren S.R, and Tohidi, B, 2005. CO2 EOR and storage in oil reservoirs. Oil & Gas Science and Technology – Rev.
IFP, 60(3), pp.537-546.
Harper, P, Wilday, J and Bilio, M, 2011. Assessment of the major hazard potential of carbon dioxide (CO2). Health and Safety
Executive, UK.
Hauck, T.E, Peterson, J, Melnik, A and Bachu, S, 2012. Geology and hydrogeology of the basal aquifer in the Prairie Region of
Canada: Characterization for CO2 storage. In: GeoConvention 2012: Vision, 14-18 May 2012, Calgary, Canada.
T H E G L O B A L S TAT U S O F C C S : 2 0 1 2212
Hovorka, S and Tinker, S, 2010. EOR as sequestration: Geoscience perspective. In: Symposium on the role of enhanced oil
recovery in accelerating the deployment of carbon capture and storage, 23 July 2010, Cambridge, MA, US.
IEA 2012a. Global carbon-dioxide emissions increase by 1.0 Gt in 2011 to record high, news item, 24 May 2012, OECD/IEA.
ONLINE http://www.iea.org/newsroomandevents/news/2012/may/name,27216,en.html.
IEA, 2011a. World Energy Outlook 2011, OECD/IEA, France.
IEA, 2011b. Summing up the parts: Combining policy instruments for least-cost climate mitigation strategies, Information
Paper. OECD/IEA, France.
IEA, 2011c. Carbon capture and storage and the London Protocol: Options for enabling transboundary CO2 transfer, Working
Paper. OECD/IEA, France.
IEA, 2012b. Energy technology perspectives 2012: Pathways to a clean energy system. OECD/IEA, France.
IEA, 2012c. Tracking clean energy progress report: Energy Technology Perspectives 2012 excerpt as IEA input to the Clean
Energy Ministerial, OECD/IEA, France.
IEAGHG, 2012a (in press). CO2 capture at gas fi red power plants, prepared by Parsons Brinckerhoff. Cambridge, UK.
IEAGHG, 2012b, Operating fl exibility of power plants with CCS, prepared by Foster Wheeler Italiana. Cambridge, UK.
INSA, 2012. BASREC pre-study on transportation and storage solutions for CO2 in the Baltic Sea region. Norwegian Institute
for Strategic Analysis, Norway.
Interstate Oil and Gas Compact Commission, 2010. A policy, legal, and regulatory evaluation of the feasibility of a national
pipeline infrastructure for the transport and storage of carbon dioxide, submitted to Southern States Energy Board, US.
IPCC, 2012. Managing the risks of extreme events and disasters to advance climate change adaptation. A Special Report
of Working Groups I and II of the Intergovernmental Panel on Climate Change [Field, C.B, Barros, V, Stocker, T.F, Qin, D,
Dokken, D.J, Ebi, K.L, Mastrandrea, M.D, Mach, K.J, Plattner, G.-K, Allen, S.K, Tignor, M and Midgley, P.M (eds.)]. Cambridge
University Press, Cambridge, UK and New York, US.
IPCC, 2007a. Climate change 2007: Synthesis Report, contribution of Working Groups I, II and III to the fourth assessment
report of the Intergovernmental Panel on Climate Change [Pachauri, R.K and Reisinger, A (eds.)]. IPCC, Geneva, Switzerland.
IPCC, 2007b. Contribution of Working Group III to the Fourth Assessment Report of the Intergovernmental Panel on Climate
Change. [Metz, O.R Davidson, P.R Bosch, R Dave, L.A Meyer (eds)]. Cambridge University Press, Cambridge, UK and New
York, US.
IPCC, 2001. Climate change 2001: Synthesis report. A contribution of Working Groups I, II, and III to the Third Assessment
Report of the Intergovernmental Panel on Climate Change [Watson, R.T. and the Core Writing Team (eds.)]. Cambridge
University Press, Cambridge, UK and New York, US.
Itaoka, K, Saito, A. Paukovic, M, de Best-Waldhober, M, Dowd, A-M, Jeanneret, T, Ashworth, P and James, M, 2012.
Understanding how individuals perceive carbon dioxide: Implications for acceptance of carbon dioxide capture and storage.
CSIRO, Australia.
ONLINE http://www.globalccsinstitute.com/publications/understanding-how-individuals-perceive-carbon-dioxide-implications-
acceptance-carbon.
Jakobsen, V.E, Hauge, F, Holm M and Kristiansen, B, 2005. CO2 for EOR on the Norwegian shelf – A case study. The Bellona
Foundation.
ONLINE http://www.bellona.org/reports/co2_report.
Jarmillo, P, Griffi n, M and McCoy, S, 2009. Life cycle inventory in an enhanced oil recovery system. Environmental Science
and Technology, 39, pp.8027-8032.
Jin, H, Gao, L, Li, S, van Sambeek, E, Porter, R, Mikunda, T, Dijkstra, J, de Coninck, H and Jansen, D, 2012. Supporting early
carbon capture utilization and storage development in non-power industrial sectors, Shaanxi Province, China. The Centre for
Low Carbon Futures 2012, China.
Kirk, K, 2006. Potential for storage of carbon dioxide in the rocks beneath the East Irish Sea, Tyndall Centre Working Papers,
Nottingham, UK.
Kombrink, M, Jonker, T, and Thonon, I, 2011. Stakeholder management ROAD, prepared for the Global CCS Institute.
ONLINE http://www.globalccsinstitute.com/publications/stakeholder-management-report.
Kuuskraa, V, Van Leeuwen, T and Wallace, M, 2011. Improving domestic energy security and lowering CO2 emissions with
‘next generation’ CO2-enhanced oil recovery (CO
2-EOR), DOE/NETL-2011/1504, US.
213R E F E R E N C E S
Meadowcroft, J and Langhelle, O, 2009. Caching the carbon: The politics and policy of carbon capture and storage. 1st edn.,
Edward Elgar Publishing Limited, Cheltenham, UK.
Medina, C. R, Rupp, J and Barnes, D.A, 2011. Effects of reduction in porosity and permeability with depth on storage capacity
and injectivity in deep saline aquifers: A case study from the Mount Simon Sandstone aquifer. International Journal of GHG
Control, 5, pp.146–156.
Meier, H, 2012. VGB initiatives for coal fi red power plant enhancement in Europe. In: Workshop on upgrading and effi ciency
improvement in coal-fi red plants, 19-20 April 2012, Melbourne, Australia.
Meinshausen, M, Meinshausen, N, Hare, W, Raper, S.C.B, Frieler, K, Knutti, R, Frame, D.J, and Allen, M.R, 2009.
Greenhouse-gas emission targets for limiting global warming to 2°C. Nature, 458(30 April 2009), pp. 1158-1162.
Melzer Consulting, Hattenbach, BlueSource (2010). In: Interstate Oil and Gas Compact Commission, 2010. A policy, legal,
and regulatory evaluation of the feasibility of a national pipeline infrastructure for the transport and storage of carbon dioxide.
Submitted to Southern States Energy Board, US.
Melzer, S.L, 2012. Carbon dioxide enhanced oil recovery (CO2 EOR): Factors involved in adding carbon capture, utilization and
storage (CCUS) to enhanced oil recovery, prepared by Melzer Consulting for the National Enhanced Oil Recovery Initiative,
Center for Climate and Energy Solutions, US.
Mitch, W, 2002. Task 1 and 3 report: Critical literature review of nitrosation/nitration pathways. Yale University.
ONLINE http://www.gassnova.no/frontend/fi les/CONTENT/Rapporter/NitrosamineandNitramineformationchemistry_YALE.pdf.
Mohitpour, M, Seevan, P; Botros, K, Rothwell, B, Ennis, C, 2012. Pipeline transportation of carbon dioxide containing
impurities. ASME Press, New York, US.
NACSA, 2012. The North American carbon storage atlas.
ONLINE www.nacsap.org.
NDP (Norwegian Petroleum Directorate), 2011. CO2 storage atlas, Norwegian North Sea. Norwegian Petroleum Directorate.
ONLINE http://www.npd.no/Global/Norsk/3-Publikasjoner/Rapporter/PDF/CO2-ATLAS-lav.pdf.
Neele, F, ten Veen, J, Wilschut, F, Hofstee, C, 2012. Independent assessment of high-capacity offshore CO2 storage options,
TNO Report, TNO-060-UT-2012-00414 / B.
Neele, F, Hofstee, C, Dillen, M, Nepveu, M, 2011. Independent storage assessment of offshore CO2 storage options for
Rotterdam: Summary report. TNO Report, TNO-060-UT-2011-00809.
Neele, F, Koenen, M, Seebregts, A, van Deurzen, J, Kerssemakers, K and Mastenbroek, M, 2010. Development of a large-
scale CO2 transport infrastructure in Europe: Matching captured volumes and storage availability, prepared by TNO for
CO2Europipe. Project no.: 226317.
NEORI, 2012. Carbon dioxide enhanced oil recovery: A critical domestic energy, economic and environmental opportunity,
National EOR Initiative, Center for Climate and Energy Solutions, Great Plains Institute. U.S. Policy.
ONLINE www.neori.org/NEORI_Report.pdf.
NETL, 2012. Archer Daniels Midland Company: CO2 capture from biofuels production and storage into the Mt. Simon
Sandstone, Project facts: Industrial Carbon Capture and Storage (ICCS). The Energy Lab, DOE/NETL, US.
ONLINE http://www.netl.doe.gov/publications/factsheets/project/ARRA1547.pdf.
NETL, 2011a, Best practices for: Risk Analysis and simulation for geologic storage of CO2. National Energy Technology
Laboratory Report, DOE/NETL-2011/1459, US.
NETL, 2011b. Cost and performance baseline for fossil energy plants, Volumes 1-3, DOE/NETL, US.
NETL, 2010. Carbon dioxide capture and storage RD&D roadmap. DOE/NETL, US.
ONLINE www.netl.doe.gov/technologies/carbon_seq/refshelf/CCSRoadmap.pdf.
NETL, 2009, Best practices for public outreach and education for carbon storage projects, DOE/NETL, US.
ONLINE www.netl.doe.gov/technologies/carbon_seq/refshelf/BPM_PublicOutreach.pdf.
NETL, 2008a, Chemical looping for combustion and hydrogen production, DOE/NETL, US.
ONLINE http://www.netl.doe.gov/publications/factsheets/rd/R%26D128.pdf
NETL, 2008b, Wilsonville Power Systems Development Facility, DOE/NETL, US.
ONLINE http://www.netl.doe.gov/publications/factsheets/project/proj003.pdf
NORDICCS, 2012. The Nordic CO2 Storage atlas - WP6, website, 15 February 2012, Nordic CCS Competence Centre.
ONLINE http://www.sintef.no/Projectweb/NORDICCS/Work-Packages/CO2-Storage---WP6/ <http://www.sintef.no/Projectweb/
NORDICCS/Work-Packages/CO2-Storage---WP6/

T H E G L O B A L S TAT U S O F C C S : 2 0 1 2214
Novel CO2 Capture Taskforce, 2012. Novel CO
2 Capture Taskforce report, prepared by Burgess, J, Jeffery, L; Lowe, A; Schuck,
S and Flentje, W, for ANLEC R&D, BCIA and the Global CCS Institute.
ONLINE http://www.globalccsinstitute.com/publications/novel-co2-capture-taskforce-report.
NRC (National Research Council), 2012. Induced seismicity potential in energy technologies: Committee on induced seismicity
potential in energy technologies; Committee on earth resources; Committee on geological and geotechnical engineering;
Committee on seismology and geodynamics; Board on Earth and sciences and resources; division on Earth and life studies;
National Research Council, US.
Oettinger, G, 2011. CCS and CCU - A future for clean coal? Speech/11 presented at European Centre for Energy and Resource
Security Events, 12 December 2011, Brussels, Belgium.
Olivier, J.G.J, Janssens-Maenhout, G, Peters, J.A.H.W and Wilson, J, 2011. Long-term trend in global CO2 emissions. 2011
report, The Hague: PBL/JRC, Netherlands.
Parsons Brinckerhoff, 2011. Electricity generation cost model: 2011 Update Revision 1, prepared for the Department of
Energy and Climate Change, UK.
Peisen, D.J, 1999. Case studies: time required to mature aeronautical technologies to operational readiness, SAIC, US.
ONLINE http://www.aeronautics.nasa.gov/docs/study/221/fi nalrpt.pdf.
Reiner, D.M, Curry,T.E, de Figueiredo, M.A, Herzog, H.J, Ansolabehere, S.D, Itaoka, K, Johnsson, F, and Odenberger, M.
2006 American exceptionalism? Similarities and differences in national attitudes toward energy policy and global warming.
Environmental Science and Technology. 40(7), pp.2093-2098.
RET (Department of Resources, Energy and Tourism), 2011. National CO2 Infrastructure Plan, website, Department of
Resources, Energy and Tourism, Australia.
ONLINE http://www.ret.gov.au/energy/clean/nco2infplan/Pages/default.aspx.
Rowe, G, and Wright, G, 2001. Differences in expert and lay judgements of risk: Myth or reality? Risk Analysis, 21(2),
pp.341-356.
Rubin, E, 2012. Understanding the pitfalls of CCS cost estimates. International Journal of Greenhouse, 10, pp.181-190.
Runkel, A. C, Miller, J. F, McKay, R. M, Palmer, A. R, and Taylor, J. F, 2007. High resolution sequence stratigraphy of lower
Paleozoic sheet sandstones in central North America: The role of special conditions of cratonic interiors in development of
stratal architecture. Geological Society of America Bulletin, 119(7-8), pp.860-881.
Russell, S, and Hampton, G, 2006. Challenges in understanding public responses and providing effective public consultation
on water reuse. Desalination, 187(1-3), pp.215-227.
Sakamoto, K, 2010, Progress update of MHI air-blown IGCC & O2-blown gasifi cation, In: 4th International Freiberg Conference
on IGCC & XtL Technologies, 3-5 May 2010, Dresden, Germany.
ONLINE www.gasifi cation-freiberg.org/ResourceImage.aspx?raid=807.
ScottishPower CCS Consortium, 2011. UK Carbon Capture and Storage Demonstration Competition: FEED close out report –
Key FEED decisions, prepared for the Department for Energy and Climate Change, UK.
ONLINE http://www.decc.gov.uk/assets/decc/11/ccs/sp-chapter5/fcor-5-key-feed-decisions.pdf.
SiteChar, 2011, European Commission Seventh Framework Programme, website.
ONLINE www.sitechar-co2.eu/
Southern Company, 2012. Twenty-fi ve megawatt carbon capture and storage demonstration, GP1103721, Southern Company, US.
Stern, N, 2009. The global deal: Climate change and the creation of a new era of progress and prosperity. Public Affairs, New York.
Stern, N, 2007. The economics of climate change: The Stern Review. Cambridge University Press, Cambridge, UK.
Stern, N, 2008. Richard T. Ely Lecture: The economics of climate change, American Economic Review: Papers and
Proceedings, pp.1-37.
Tenaska, 2010. The management of public engagement at the local, state and federal levels for the Tenaska Trailblazer Energy
Centre Project, prepared for the Global CCS Institute.
ONLINE http://www.globalccsinstitute.com/publications/management-public-engagement-local-state-and-federal-levels-
tenaska-trailblazer-energy-.
Tenaska, 2011. Financing a new pulverized coal plant with post combustion carbon capture, prepared for the Global CCS
Institute.
ONLINE http://www.globalccsinstitute.com/publications/fi nancing-new-pulverized-coal-plant-post-combustion-carbon-capture.
215R E F E R E N C E S
Transalta, 2011. Canadian and Albertan perceptions of carbon capture and storage, prepared for the Global CCS Institute.
ONLINE http://www.globalccsinstitute.com/publications/canadian-and-albertan-perceptions-carbon-capture-and-storage.
Tzimas, E, and A, Georgakaki, C, Cortes, G and Peteves, S.D, 2005. Enhanced oil recovery using carbon dioxide in the
European energy system, Directorate General Joint Research Centre (DG JRC), Institute for Energy, Petten, Netherlands.
UNIDO, 2010. Carbon capture and storage in industrial applications: Technology synthesis report, Working Paper, November
2010. Vienna, Austria.
ONLINE http://www.globalccsinstitute.com/publications/carbon-capture-and-storage-industrial-applications-technology-
synthesis-report.
United Nations Statistics Division, 2012. Millennium development goals indicators: Carbon dioxide emissions (CO2), thousand
metric tons of CO2; collected by the Carbon Dioxide Information Analysis Center (CDIAC).
ONLINE http://mdgs.un.org/unsd/mdg/SeriesDetail.aspx?srid=749&crid=.
Varma, S, Hodgkinson, J, Langhi, L, Ciftci, B, Harris, B, and Underschultz, J, 2011. Basin resource management for carbon
storage: A literature review. CSIRO, Australia.
Vattenfall, 2012. Non confi dential study: FEED study CO2 transport pipeline – CCS Demonstration Project Jänschwalde,
prepared by OLAJTERV Co. Ltd.
ONLINE www.ccsnetwork.eu/assets/publications/Feed_study_pipeline.pdf.
Veld, K, and Phillips, O, 2009. Pegging input prices to output prices in long-term contracts: CO2 purchase agreements in
enhanced oil recovery, University of Wyoming Department of Economics Working Paper, Wyoming, US.
Wade, S, and Greenberg, S, 2011. Social site characterisation: From concept to application, prepared for the Global CCS
Institute. CSIRO, Australia.
ONLINE www.globalccsinstitute.com/publications/social-site-characterisation-concept-application.
Wibberley, L, 2012. MRC-DICE – a game changer for electricity generation. In: Cleaner Fossil Energy Securing a Cleaner
Energy Future, 22-24 February 2012, Gold Coast, Australia.
WorleyParsons, 2012. Survey of carbon capture and storage (CCS) projects in China, prepared for the Global CCS Institute.
Brisbane, Australia.
WorleyParsons, Schlumberger, Baker & McKenzie and EPRI (Electric Power Research Institute), 2009. Strategic analysis of the
global status of CCS, prepared for the Global CCS Institute.
ONLINE www.globalccsinstitute.com/publications/strategic-analysis-global-status-carbon-capture-storage.
WRI, 2010. CCS and community engagement: Guidelines for community engagement in carbon dioxide capture, transport and
storage projects. WRI, Washington D.C., US.
ZEP (European Technology Platform for Zero Emission Fossil Fuel Power Plants), 2011. The costs of CO2 capture, transport
and storage. ZEP.
ONLINE http://www.zeroemissionsplatform.eu/library/publication/165-zep-cost-report-summary.html.
Zoback and Gorelick, 2012. Earthquake triggering and large-scale geologic storage of carbon dioxide. In: Proceedings National
Academy of Sciences of the United States of America (2012), 109, pp.10164-10168.
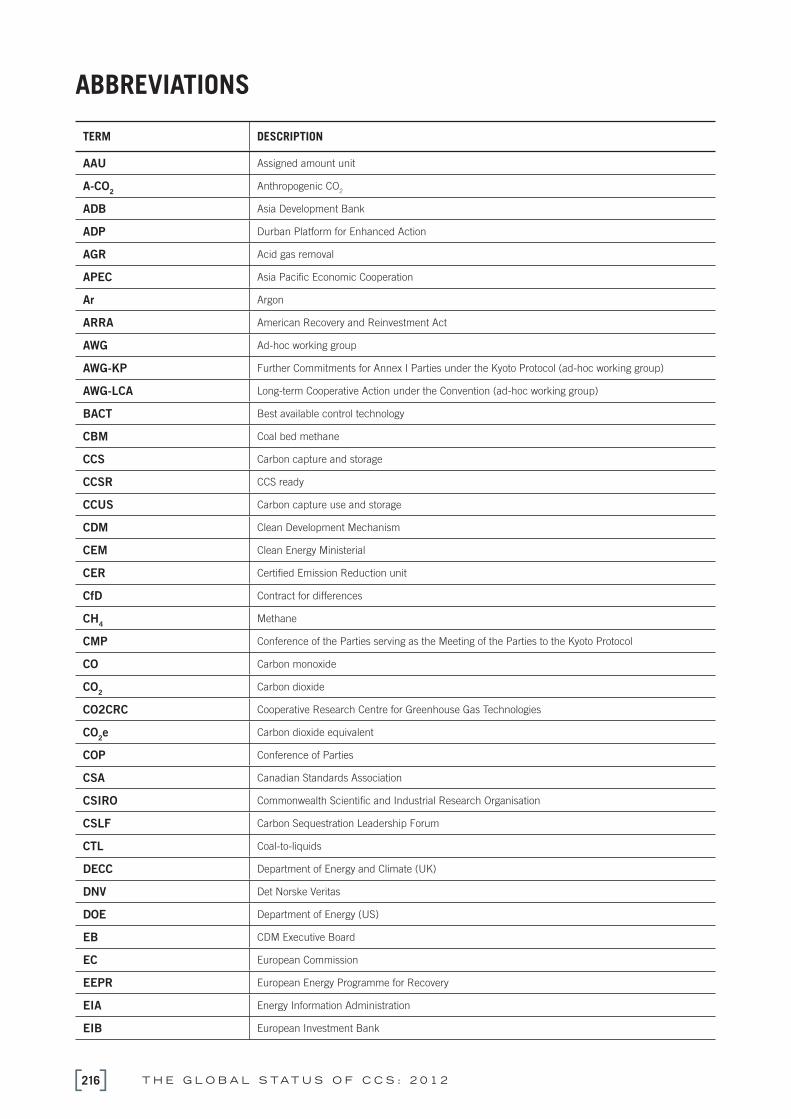
T H E G L O B A L S TAT U S O F C C S : 2 0 1 2216
ABBREVIATIONS
TERM DESCRIPTION
AAU Assigned amount unit
A-CO2
Anthropogenic CO2
ADB Asia Development Bank
ADP Durban Platform for Enhanced Action
AGR Acid gas removal
APEC Asia Pacifi c Economic Cooperation
Ar Argon
ARRA American Recovery and Reinvestment Act
AWG Ad-hoc working group
AWG-KP Further Commitments for Annex I Parties under the Kyoto Protocol (ad-hoc working group)
AWG-LCA Long-term Cooperative Action under the Convention (ad-hoc working group)
BACT Best available control technology
CBM Coal bed methane
CCS Carbon capture and storage
CCSR CCS ready
CCUS Carbon capture use and storage
CDM Clean Development Mechanism
CEM Clean Energy Ministerial
CER Certifi ed Emission Reduction unit
CfD Contract for differences
CH4
Methane
CMP Conference of the Parties serving as the Meeting of the Parties to the Kyoto Protocol
CO Carbon monoxide
CO2
Carbon dioxide
CO2CRC Cooperative Research Centre for Greenhouse Gas Technologies
CO2e Carbon dioxide equivalent
COP Conference of Parties
CSA Canadian Standards Association
CSIRO Commonwealth Scientifi c and Industrial Research Organisation
CSLF Carbon Sequestration Leadership Forum
CTL Coal-to-liquids
DECC Department of Energy and Climate (UK)
DNV Det Norske Veritas
DOE Department of Energy (US)
EB CDM Executive Board
EC European Commission
EEPR European Energy Programme for Recovery
EIA Energy Information Administration
EIB European Investment Bank
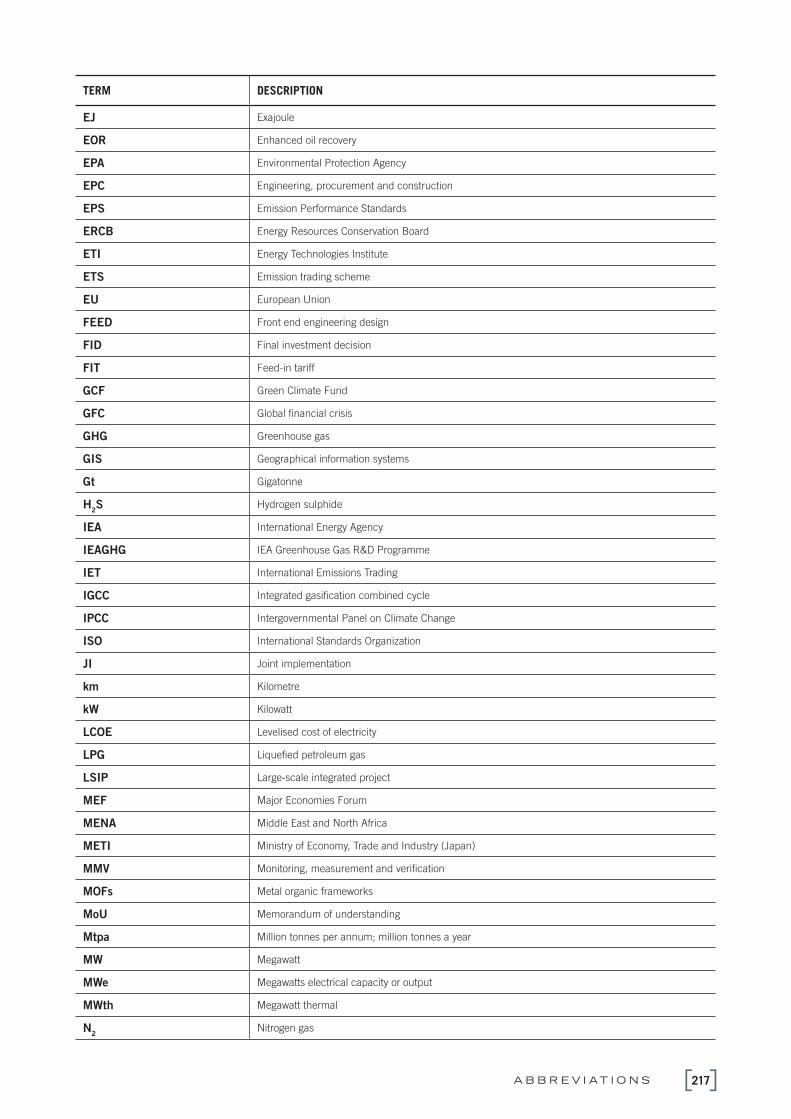
217A B B R E V I AT I O N S
TERM DESCRIPTION
EJ Exajoule
EOR Enhanced oil recovery
EPA Environmental Protection Agency
EPC Engineering, procurement and construction
EPS Emission Performance Standards
ERCB Energy Resources Conservation Board
ETI Energy Technologies Institute
ETS Emission trading scheme
EU European Union
FEED Front end engineering design
FID Final investment decision
FIT Feed-in tariff
GCF Green Climate Fund
GFC Global fi nancial crisis
GHG Greenhouse gas
GIS Geographical information systems
Gt Gigatonne
H2S Hydrogen sulphide
IEA International Energy Agency
IEAGHG IEA Greenhouse Gas R&D Programme
IET International Emissions Trading
IGCC Integrated gasifi cation combined cycle
IPCC Intergovernmental Panel on Climate Change
ISO International Standards Organization
JI Joint implementation
km Kilometre
kW Kilowatt
LCOE Levelised cost of electricity
LPG Liquefi ed petroleum gas
LSIP Large-scale integrated project
MEF Major Economies Forum
MENA Middle East and North Africa
METI Ministry of Economy, Trade and Industry (Japan)
MMV Monitoring, measurement and verifi cation
MOFs Metal organic frameworks
MoU Memorandum of understanding
Mtpa Million tonnes per annum; million tonnes a year
MW Megawatt
MWe Megawatts electrical capacity or output
MWth Megawatt thermal
N2
Nitrogen gas
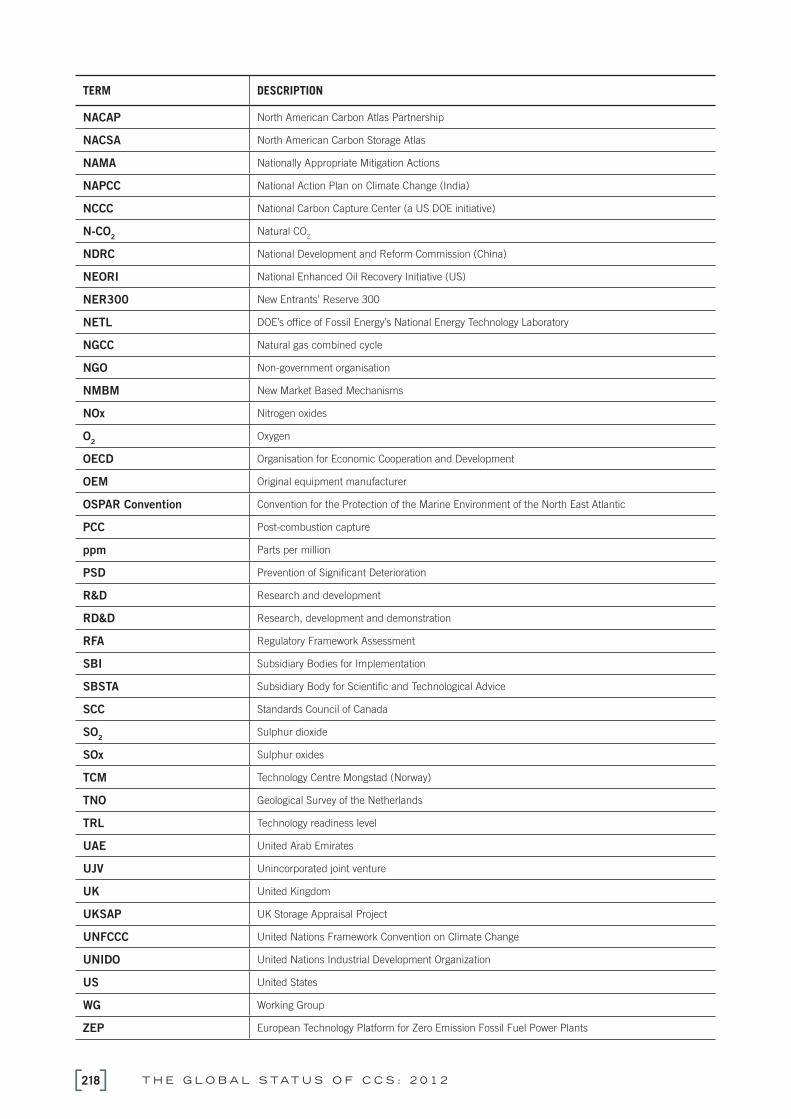
T H E G L O B A L S TAT U S O F C C S : 2 0 1 2218
TERM DESCRIPTION
NACAP North American Carbon Atlas Partnership
NACSA North American Carbon Storage Atlas
NAMA Nationally Appropriate Mitigation Actions
NAPCC National Action Plan on Climate Change (India)
NCCC National Carbon Capture Center (a US DOE initiative)
N-CO2
Natural CO2
NDRC National Development and Reform Commission (China)
NEORI National Enhanced Oil Recovery Initiative (US)
NER300 New Entrants’ Reserve 300
NETL DOE’s offi ce of Fossil Energy’s National Energy Technology Laboratory
NGCC Natural gas combined cycle
NGO Non-government organisation
NMBM New Market Based Mechanisms
NOx Nitrogen oxides
O2
Oxygen
OECD Organisation for Economic Cooperation and Development
OEM Original equipment manufacturer
OSPAR Convention Convention for the Protection of the Marine Environment of the North East Atlantic
PCC Post-combustion capture
ppm Parts per million
PSD Prevention of Signifi cant Deterioration
R&D Research and development
RD&D Research, development and demonstration
RFA Regulatory Framework Assessment
SBI Subsidiary Bodies for Implementation
SBSTA Subsidiary Body for Scientifi c and Technological Advice
SCC Standards Council of Canada
SO2
Sulphur dioxide
SOx Sulphur oxides
TCM Technology Centre Mongstad (Norway)
TNO Geological Survey of the Netherlands
TRL Technology readiness level
UAE United Arab Emirates
UJV Unincorporated joint venture
UK United Kingdom
UKSAP UK Storage Appraisal Project
UNFCCC United Nations Framework Convention on Climate Change
UNIDO United Nations Industrial Development Organization
US United States
WG Working Group
ZEP European Technology Platform for Zero Emission Fossil Fuel Power Plants

Printed on Maine Recycled. Featuring 60% certifi ed recycled (PCW) and 40% certifi ed virgin fi bre sourced from responsibly
managed forests. Certifi ed carbon neutral by The Carbon Neutral Company, Maine Recycled is manufactured process chlorine
free and produced in a facility that operates under world’s best practice ISO 14001 Environment Management System.

LEVEL 2, 64 ALLARA ST, CANBERRA ACT 2601
GPO BOX 828, CANBERRA ACT 2601 AUSTRALIA
TEL: +61 (0)2 6175 5300 | EMAIL: [email protected]
WWW.GLOBALCCSINSTITUTE.COM


