GLOBAL STATUS OF CCS: 2015 Christopher Consoli Senior Adviser – Storage, Asia Pacific Cover image: Overlooking the Quest Capture facility located at Shell - Scotford, near Fort Saskatchewan, Alberta. Image provided by Shell.
Transcript
GLOBAL STATUS OF CCS: 2015Christopher ConsoliSenior Adviser – Storage, Asia Pacific
Cover image: Overlooking the Quest Capture facility located at Shell -Scotford, near Fort Saskatchewan, Alberta. Image provided by Shell.
Fossil fuel demand growing and reserves robust
Source: BP Statistical Review of World Energy 2015
Fossil fuel proved reserves: 6 trillion barrels of oil equivalent
Reserves to production ratio: ~75 years
Source: IEA World Energy Outlook, 2015 (New policies scenario)
IEA long-term energy scenarios
Reserves to production ratio: ~75 years
0
10
20
30
40
50
1 2 3 4
New policies scenario
Current policies scenario[~6DS]
450 scenario [~2DS]
Gt C
O2
emis
sion
s
Source: IEA World Energy Outlook (2015).
A substantial transformation in energy systems is required to achieve 2° C
Mitigation costs more than double in scenarios with limited availability of CCS
Source: IPCC Fifth Assessment Synthesis Report, Summary for Policymakers, November 2014.
IPCC 2014 Percentage increase in total discounted mitigation costs (2015-2100) relative to default technology assumptions – median estimate
450 138% 7% 6% 64%
2100 concentrations
(ppm CO2eq)no CCS nuclear
phase outlimited
solar/windlimited
bioenergy
4 / 11 8 / 11 8 / 11 8 / 11
Symbol legend – fraction of models successful in producing scenarios (numbers indicate number of successful models)
All models successful
Between 80 and 100% of models successful
Between 50 and 80% of models successful
Less than 50% of models successful
CCS is a vital element of a low-carbon energy future
Source: IEA Energy Technology Perspectives (2015)
A transformation in how we generate and use energy is needed
Gt C
O2
emis
sion
s
6DS
2DS
2050 technology breakdown
Non-OECD
OECD
Power
Industry
Source: IEA, Energy Technology Perspectives (2015).
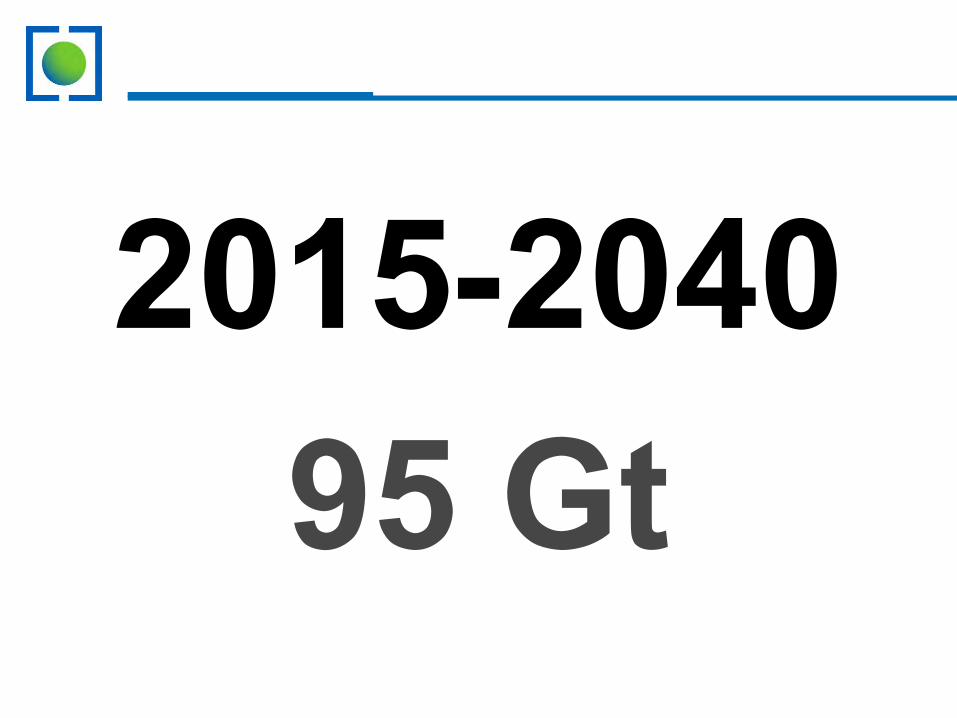
CCS contributes 13% of cumulative reductions required through 2050 in a 2DS world compared to ‘business as usual’
2015-204095 Gt
A significant task within one generation
45 large-scale CCS projects -combined capture capacity of 80 Mtpa*:
• 22 projects in operation or construction (40 Mtpa)
• 11 projects in advanced planning, five nearing FID (15 Mtpa)
• 12 projects in earlier stages of planning (25 Mtpa)
OECDNon-OECD
4,000 Mtpa of CO2captured by CCS by 2040
(IEA 450 Scenario)**
40 Mtpa
Global Status
of CCS: 2015
*Mtpa = million tonnes per annum **Source: IEA, Energy Technology Perspectives (2015).
GLOBAL STATUS OF CCS PROJECTS
Large-scale CCS projects by region or country
North America (with 13 in the US and 6 in Canada), China (with 9) and UK (with 5) have the most projects
Americas 1 3 5 11 20
Early planning
Advanced planning Construction Operation Total
China 5 4 - - 9
Europe 2 4 - 2 8
Gulf Cooperation Council - - 1 1 2
Rest of World 4 - 1 1 6
Total 12 11 7 15 45
Much to look forward to over the next 18 months
7 8 812 13
15 15 15
47
-
5
10
15
20
25
1 2 3 4 5 6 7 8
Num
ber o
f pro
ject
s
Series2 Series1
A global portfolio of operating CCS projects is emerging
Source: Global Status of CCS: 2015, Global CCS Institute (2015)
2015
EOR
Dedicated Geological
Power Generation
*** Institute estimate
Actual and expected operation dates for projects in
Operating 20172016
Hydrogen production
Natural gas processing
Chemicalproduction
Iron and steel production
Synthetic natural gas
Fertiliser production
Oil refining
2018 2019 2020
= 1Mtpa of CO2 (areas of circle are proportional to capacity)
Coal-to-liquids
* Injection currently suspended
Boundary Dam
Kemper
Petra Nova
ROAD
Sargas Texas
Sinopec Shengli Peterhead
HECA**Illinois Industrial
YanchangSinopec
Qilu
Abu Dhabi
ACTL Agrium Coffeyville
Century Plant
Enid Fertilizer
Val Verde
Air Products
Lost Cabin
Lula
SnøhvitSleipner
Shute Creek
In Salah*
Uthmaniyah
Quest
Gorgon***
Spectra***
ACTL Sturgeon
Petro China Jilin
Great Plains
operation, construction and advanced planning
Don Valley
White Rose
** Storage options under evaluation
TCEP
A substantial number of ‘notable’ pilot and demonstration projects globally
Illinois Basin Decatur Project –Large-scale CO2 injection test into a deep saline aquifer (the Mount Simon Sandstone formation)
Global Status of CCS: 2015 presents almost 40 notable projects in operation or under construction around the world, demonstrating all elements of the CCS chain.
A selection of these projects are presented in this slide.
Technology Centre Mongstad –Operational test facility for amine and ammonia based post-combustion capture technologies
Norway
Tomakomai - Full chain CCS project will demonstrate carbon capture from a hydrogen production unit and storage in deep saline formations
Japan
US
• Shand Carbon CaptureShand Test Facility (CCTF) –Operational test facility for amine based post-combustion capture technologies
CanadaSinopec Shengli – Operational full chain CCS power sector project utilising EOR storage
China
Lacq – Full chain CCS project with storage in the Rousse resevoir. Montoring continues
France
WHAT IS NEEDED TO PROGRESS CCS
Strong policy drives investment
Data source: Bloomberg New Energy Finance as shown in IEA presentation “Carbon Capture and Storage: Perspectives from the International Energy Agency”, presented at National CCS week in Australia, September 2014.
20
1929
0
400
800
1200
1600
2000
1 2
USD billion
• Scale of renewables investment is instructive
• CCS has not enjoyed commensurate policy support
• EOR has provided impetus in North America
• Policy parity is essential
• How do we get CCS onto a similar curve?
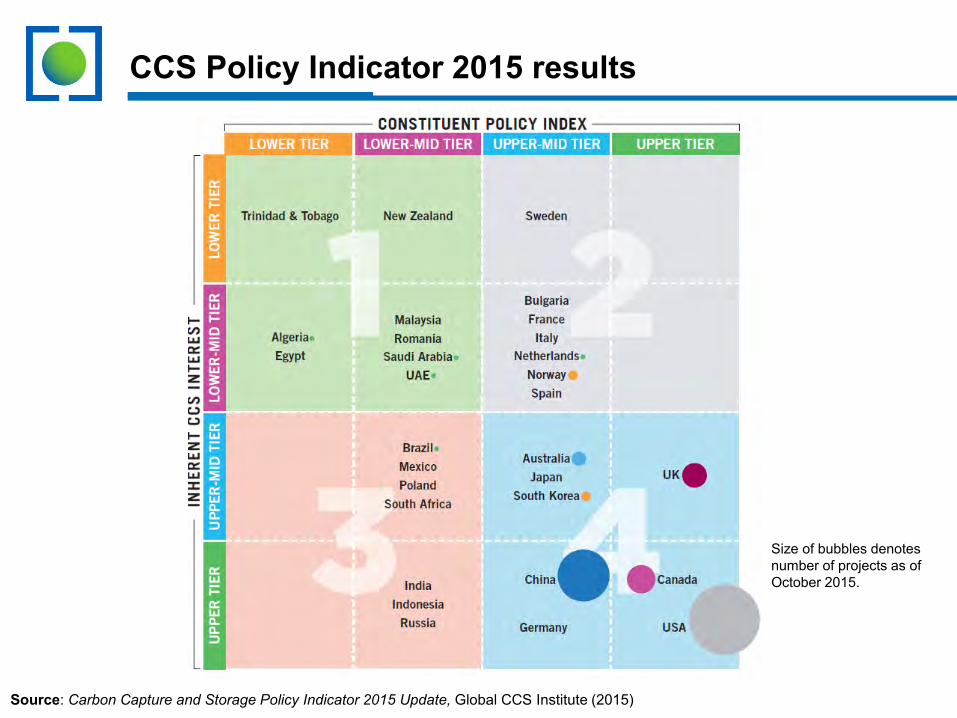
CCS Policy Indicator 2015 results
Source: Carbon Capture and Storage Policy Indicator 2015 Update, Global CCS Institute (2015)
Size of bubbles denotes number of projects as of October 2015.
Relative US DOE cost reduction targets and timing for second generation and transformational carbon capture technologies
Source: Fueling the Future: Safe, affordable, secure energy, Plasynski (2015)
Power generation costs of CO2 avoided
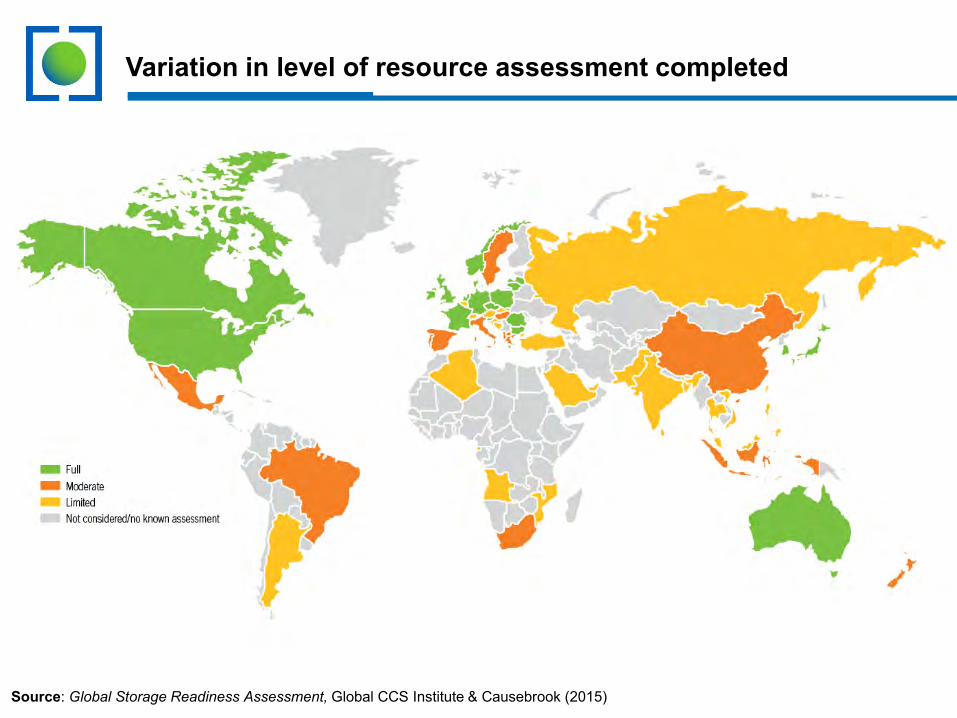
Variation in level of resource assessment completed
Source: Global Storage Readiness Assessment, Global CCS Institute & Causebrook (2015)
Global storage readiness indicator
CCS Legal and Regulatory Indicator results
Source: Global CCS Institute CCS Legal and Regulatory Indicator, Global CCS Institute (2015)
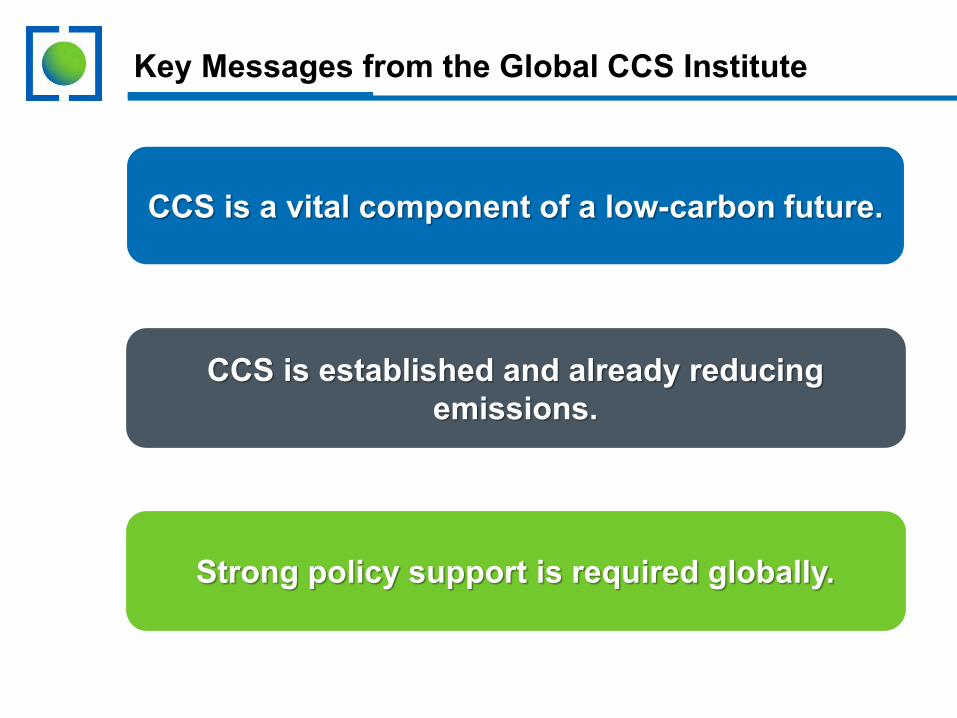
Key Messages from the Global CCS Institute
CCS is a vital component of a low-carbon future.
CCS is established and already reducing emissions.
Strong policy support is required globally.
The Global Status of CCS: 2015
The Institute’s key publication
Summary Report, Key Findings and other advocacy materials can be found at:
http://status.globalccsinstitute.com/
Full report is available online at the Institute’s Members Portal.