HYDROLOGICAL PROCESSES Hydrol. Process. 20, 3335–3370 (2006) Published online in Wiley InterScience (www.interscience.wiley.com) DOI: 10.1002/hyp.6335 Global synthesis of groundwater recharge in semiarid and arid regions Bridget R. Scanlon, 1 * Kelley E. Keese, 1 Alan L. Flint, 2 Lorraine E. Flint, 2 Cheikh B. Gaye, 3 W. Michael Edmunds 4 and Ian Simmers 5 1 The University of Texas at Austin, Bureau of Economic Geology, Jackson School of Geosciences, Austin, TX, 78713-8924, USA 2 US Geological Survey, Sacramento, California 95819-6129, USA 3 Universit´ e Cheikh Anta Diop, D´ epartement de G´ eologie, Dakar, Sen´ egal 4 Oxford Center for Water Research, Oxford University Center for the Environment, Oxford OX1 3QY, UK 5 Vrije Universiteit, Faculty of Earth- and Life Sciences, Amsterdam, The Netherlands Abstract: Global synthesis of the findings from ¾140 recharge study areas in semiarid and arid regions provides important information on recharge rates, controls, and processes, which are critical for sustainable water development. Water resource evaluation, dryland salinity assessment (Australia), and radioactive waste disposal (US) are among the primary goals of many of these recharge studies. The chloride mass balance (CMB) technique is widely used to estimate recharge. Average recharge rates estimated over large areas (40–374 000 km 2 ) range from 0Ð2 to 35 mm year 1 , representing 0Ð1–5% of long-term average annual precipitation. Extreme local variability in recharge, with rates up to ¾720 m year 1 , results from focussed recharge beneath ephemeral streams and lakes and preferential flow mostly in fractured systems. System response to climate variability and land use/land cover (LU/LC) changes is archived in unsaturated zone tracer profiles and in groundwater level fluctuations. Inter-annual climate variability related to El Ni˜ no Southern Oscillation (ENSO) results in up to three times higher recharge in regions within the SW US during periods of frequent El Ni˜ nos (1977–1998) relative to periods dominated by La Ni˜ nas (1941–1957). Enhanced recharge related to ENSO is also documented in Argentina. Climate variability at decadal to century scales recorded in chloride profiles in Africa results in recharge rates of 30 mm year 1 during the Sahel drought (1970–1986) to 150 mm year 1 during non-drought periods. Variations in climate at millennial scales in the SW US changed systems from recharge during the Pleistocene glacial period (½10 000 years ago) to discharge during the Holocene semiarid period. LU/LC changes such as deforestation in Australia increased recharge up to about 2 orders of magnitude. Changes from natural grassland and shrublands to dryland (rain-fed) agriculture altered systems from discharge (evapotranspiration, ET) to recharge in the SW US. The impact of LU change was much greater than climate variability in Niger (Africa), where replacement of savanna by crops increased recharge by about an order of magnitude even during severe droughts. Sensitivity of recharge to LU/LC changes suggests that recharge may be controlled through management of LU. In irrigated areas, recharge varies from 10 to 485 mm year 1 , representing 1–25% of irrigation plus precipitation. However, irrigation pumpage in groundwater-fed irrigated areas greatly exceeds recharge rates, resulting in groundwater mining. Increased recharge related to cultivation has mobilized salts that accumulated in the unsaturated zone over millennia, resulting in widespread groundwater and surface water contamination, particularly in Australia. The synthesis of recharge rates provided in this study contains valuable information for developing sustainable groundwater resource programmes within the context of climate variability and LU/LC change. Copyright 2006 John Wiley & Sons, Ltd. KEY WORDS groundwater recharge; water resources; climate variability; land use/land cover change Received 5 July 2005; Accepted 1 March 2006 * Correspondence to: Bridget R. Scanlon, The University of Texas at Austin, Bureau of Economic Geology, Jackson School of Geosciences, Austin, TX, 78713-8924, USA. E-mail: [email protected]Copyright 2006 John Wiley & Sons, Ltd.
Global synthesis of groundwater recharge in semiaridand arid regions
Bridget R. Scanlon,1* Kelley E. Keese,1 Alan L. Flint,2 Lorraine E. Flint,2
Cheikh B. Gaye,3 W. Michael Edmunds4 and Ian Simmers5
1 The University of Texas at Austin, Bureau of Economic Geology, Jackson School of Geosciences, Austin, TX, 78713-8924, USA2 US Geological Survey, Sacramento, California 95819-6129, USA
3 Universite Cheikh Anta Diop, Departement de Geologie, Dakar, Senegal4 Oxford Center for Water Research, Oxford University Center for the Environment, Oxford OX1 3QY, UK
5 Vrije Universiteit, Faculty of Earth- and Life Sciences, Amsterdam, The Netherlands
Abstract:
Global synthesis of the findings from ¾140 recharge study areas in semiarid and arid regions provides importantinformation on recharge rates, controls, and processes, which are critical for sustainable water development. Waterresource evaluation, dryland salinity assessment (Australia), and radioactive waste disposal (US) are among the primarygoals of many of these recharge studies. The chloride mass balance (CMB) technique is widely used to estimaterecharge. Average recharge rates estimated over large areas (40–374 000 km2) range from 0Ð2 to 35 mm year�1,representing 0Ð1–5% of long-term average annual precipitation. Extreme local variability in recharge, with rates upto ¾720 m year�1, results from focussed recharge beneath ephemeral streams and lakes and preferential flow mostlyin fractured systems. System response to climate variability and land use/land cover (LU/LC) changes is archived inunsaturated zone tracer profiles and in groundwater level fluctuations. Inter-annual climate variability related to El NinoSouthern Oscillation (ENSO) results in up to three times higher recharge in regions within the SW US during periodsof frequent El Ninos (1977–1998) relative to periods dominated by La Ninas (1941–1957). Enhanced recharge relatedto ENSO is also documented in Argentina. Climate variability at decadal to century scales recorded in chloride profilesin Africa results in recharge rates of 30 mm year�1 during the Sahel drought (1970–1986) to 150 mm year�1 duringnon-drought periods. Variations in climate at millennial scales in the SW US changed systems from recharge during thePleistocene glacial period (½10 000 years ago) to discharge during the Holocene semiarid period. LU/LC changes suchas deforestation in Australia increased recharge up to about 2 orders of magnitude. Changes from natural grasslandand shrublands to dryland (rain-fed) agriculture altered systems from discharge (evapotranspiration, ET) to recharge inthe SW US. The impact of LU change was much greater than climate variability in Niger (Africa), where replacementof savanna by crops increased recharge by about an order of magnitude even during severe droughts. Sensitivity ofrecharge to LU/LC changes suggests that recharge may be controlled through management of LU. In irrigated areas,recharge varies from 10 to 485 mm year�1, representing 1–25% of irrigation plus precipitation. However, irrigationpumpage in groundwater-fed irrigated areas greatly exceeds recharge rates, resulting in groundwater mining. Increasedrecharge related to cultivation has mobilized salts that accumulated in the unsaturated zone over millennia, resultingin widespread groundwater and surface water contamination, particularly in Australia. The synthesis of recharge ratesprovided in this study contains valuable information for developing sustainable groundwater resource programmeswithin the context of climate variability and LU/LC change. Copyright 2006 John Wiley & Sons, Ltd.
KEY WORDS groundwater recharge; water resources; climate variability; land use/land cover change
Received 5 July 2005; Accepted 1 March 2006
* Correspondence to: Bridget R. Scanlon, The University of Texas at Austin, Bureau of Economic Geology, Jackson School of Geosciences,Austin, TX, 78713-8924, USA. E-mail: [email protected]
Copyright 2006 John Wiley & Sons, Ltd.
3336 B. R. SCANLON ET AL.
INTRODUCTION
Increasing demands on limited water supplies in semiarid and arid [(semi-) arid] regions result in a criticalstatus of groundwater recharge. (Semi-) arid regions are expanding and represent 30% of global terrestrialsurface area (Dregne, 1991). Currently, an estimated 1Ð1 billion of the 6 billion world population lacks accessto sources of clean drinking water (WHO, 2003). Water scarcity will become more critical in the future aspopulation growth in (semi-) arid regions surpasses that in more humid settings. For example, population inSub-Saharan Africa was one-third that of China in 1950, one-half in 2002, and is projected to surpass it in 2050(US Census Bureau, 2004). Approximately 40% of the US population growth between 1960 and 2000 occurredin (semi-) arid states in the SW US (US Census Bureau, 2004). Surface water resources are generally scarceand highly unreliable in (semi-) arid regions, with the result that groundwater is the primary source of waterin these regions. The International Atomic Energy Agency (IAEA) estimates that much of the groundwaterbeing developed in (semi-) arid regions is fossil water and is not sustainable. Sustainable management ofthese aquifers to meet human and ecosystem needs will require accurate estimates of groundwater recharge.
Recharge has been estimated in (semi-) arid regions using a variety of techniques, including physical,chemical, isotopic, and modelling techniques. These techniques have been described in previous studies andreviews (Lerner et al., 1990; Hendrickx and Walker, 1997; Zhang and Walker, 1998; Kinzelbach et al., 2002;Scanlon et al., 2002). The purpose of recharge studies has dictated to some extent the method used to estimaterecharge and the scale of the studies. Regional recharge estimation for water resources evaluation has reliedmostly on groundwater-based approaches, which integrate over large spatial scales and generally cannot beused to estimate local variability in recharge. In contrast, recharge estimation for water quality studies focusseson spatial variability in recharge, which is critical for contaminant transport.
Various reviews of recharge have been conducted in the past, focussing primarily on (semi-) arid regions.Simmers (1988) edited a volume on recharge that focusses primarily on techniques for estimating rechargeand provides applications and case studies in (semi-) arid regions. Papers from a symposium on groundwaterrecharge that was held in Australia in 1987 are compiled in an edited volume by Sharma (1989) and describevarious techniques for estimating recharge, emphasizing recharge processes and mechanisms on the basisof data from Australia. The International Association of Hydrogeologists published a volume on rechargeedited by Lerner et al. (1990) that includes descriptions of recharge in different hydrogeologic settings. Acompilation of papers by IAEA (2001) providing valuable information on recharge in water-scarce areas isbased on field studies that estimate recharge at 44 benchmark sites. These studies showed that rainfall below200 mm usually results in negligible recharge. A special volume of the Hydrogeology Journal devoted torecharge includes papers on recharge processes and methods of estimating recharge, including remote sensing,ground-based and modelling approaches, artificial and urban recharge, and case studies in (semi-) arid regions(Scanlon and Cook, 2002). Recharge issues related to the SW US are described in Hogan et al. (2004), whichincludes papers on recharge mechanisms, processes, and case studies. Recharge in the SW US is also the focusof a USGS professional paper (Stonestrom and Leake, in press), which describes the climatic and geologicframework and provides information on methodologies and case studies on regional and focussed recharge.Although there are many reviews of recharge studies in (semi-) arid regions, none of the existing reviewscompiles recharge estimates from studies on a global scale. Such information is important for comparisonwith global scale models (e.g. Doll et al., 2003).
The purpose of this paper was to synthesize recharge estimates for (semi-) arid regions globally to evaluaterecharge rates, controls, and processes and to assess the impacts of climate variability and land use/land cover(LU/LC) changes on recharge. The compilation emphasizes regional recharge estimates, where available,which are important for water resources. The baseline data provided in this compilation will be a valuableresource for comparison with future model estimates of recharge based on regional and global scale models.Synthesis of recharge rates from different studies provides valuable insights into recharge processes andcontrols and is essential for developing sustainable water resource management plans in (semi-) arid regionswithin the context of climate variability and LU/LC changes.
GROUNDWATER RECHARGE IN SEMIARID AND ARID REGIONS 3337
Terminology
Infiltration refers to water movement from the surface into the subsurface. Terms such as net infiltration,drainage, or percolation are used to describe water movement below the root zone, and these can be equatedto groundwater recharge as long as climate and LU/LC remain the same while water moves to the watertable. Recharge can be defined generally as addition of water to an aquifer or, more strictly, addition ofwater from the overlying unsaturated zone or surface water body. Diffuse (direct) recharge refers to areallydistributed recharge, such as from precipitation or irrigation over large areas, whereas focussed, indirect, orlocalized recharge refers to concentrated recharge from surface topographic depressions, such as streams,lakes, and playas. Mountain-front and mountain-block recharge have been defined as water entering adjacentinter-mountain basin-fill aquifers, with its source in the mountain front or mountain block (Wilson and Guan,2004). Previous studies distinguish direct mountain-front recharge from indirect mountain-front recharge toinclude transfer of subsurface water from the adjacent mountain block (Wilson and Guan, 2004). Piston flowrefers to uniform downward movement of water through the unsaturated zone that displaces existing waterwithout bypassing it and should be distinguished from preferential flow or non-uniform downward watermovement along preferred pathways, such as fractures and roots.
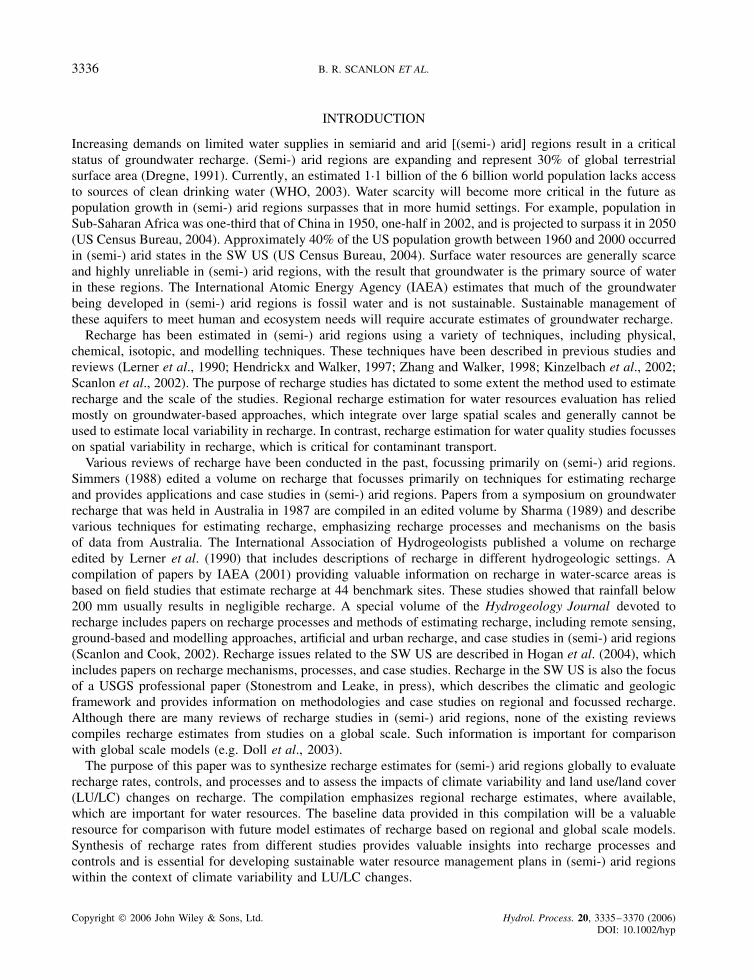
The definition of climate regimes used in this study was developed by United Nations Educational, Scientific,and Cultural Organization (UNESCO, 1979) on the basis of the ratio of mean annual precipitation to potentialevapotranspiration (PET): hyperarid (<0Ð05), arid (0Ð05–0Ð2), semiarid (0Ð2–0Ð5), dry subhumid (0Ð5–0Ð65),and humid (>0 Ð 65) (Figure 1). Extensive (semi-) arid regions are found in the western US and Canada,southern and eastern areas of S. America, northern and southern areas of Africa, the Middle East, centralAsia, and most of Australia. LU varies from natural to cultivated ecosystems. Cultivated areas include dryland(non-irrigated, rain-fed) and irrigated systems.
RECHARGE RATES IN (SEMI-) ARID REGIONS
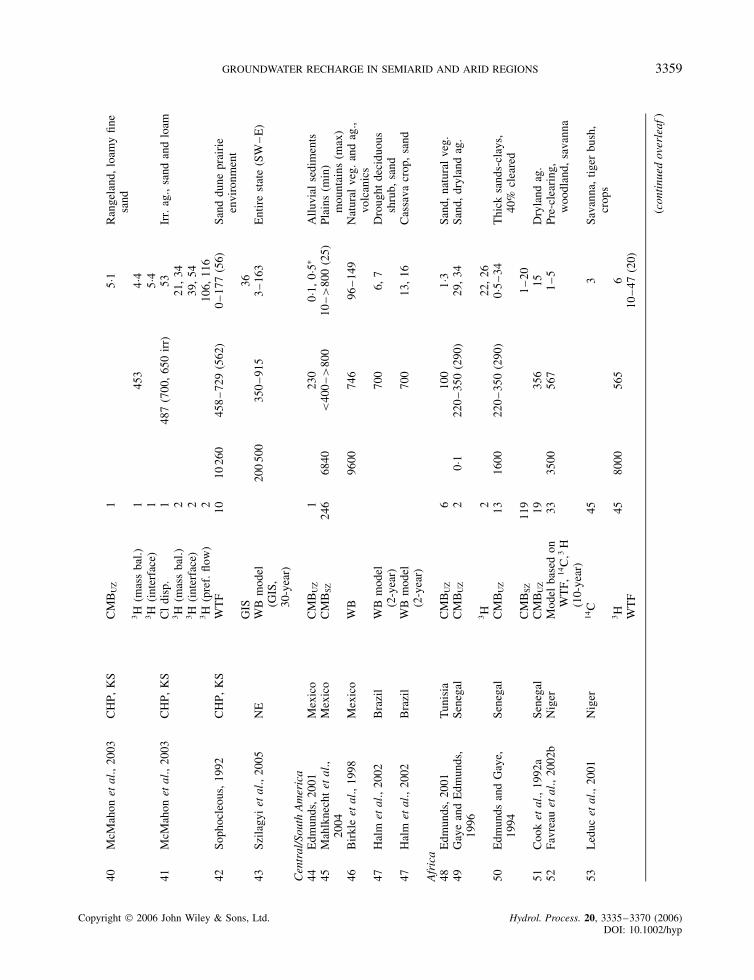
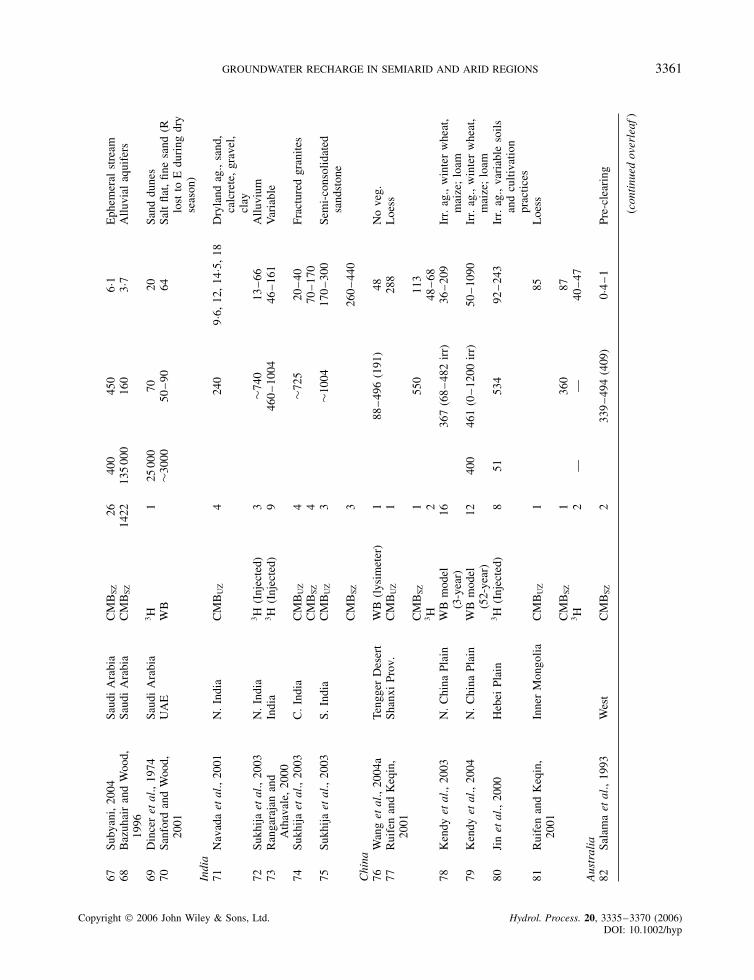
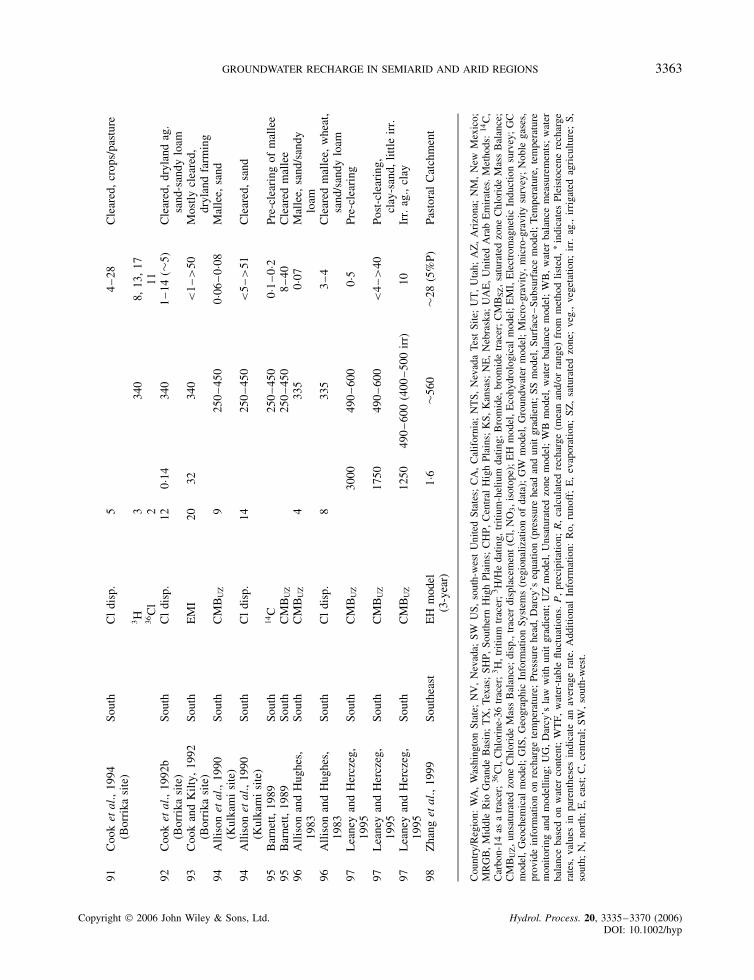
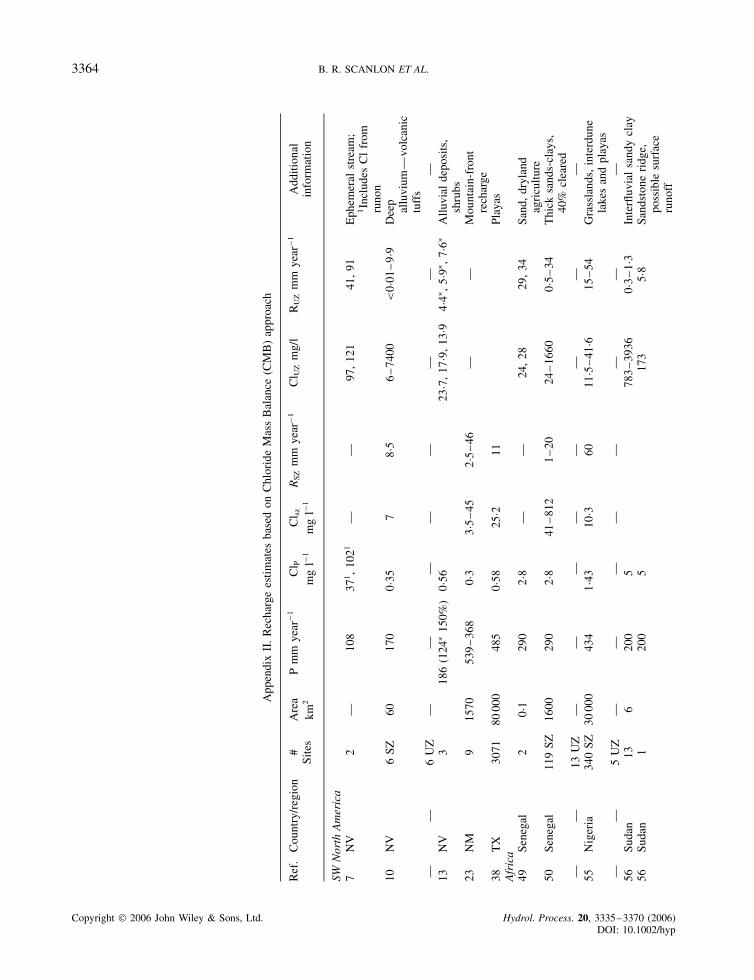
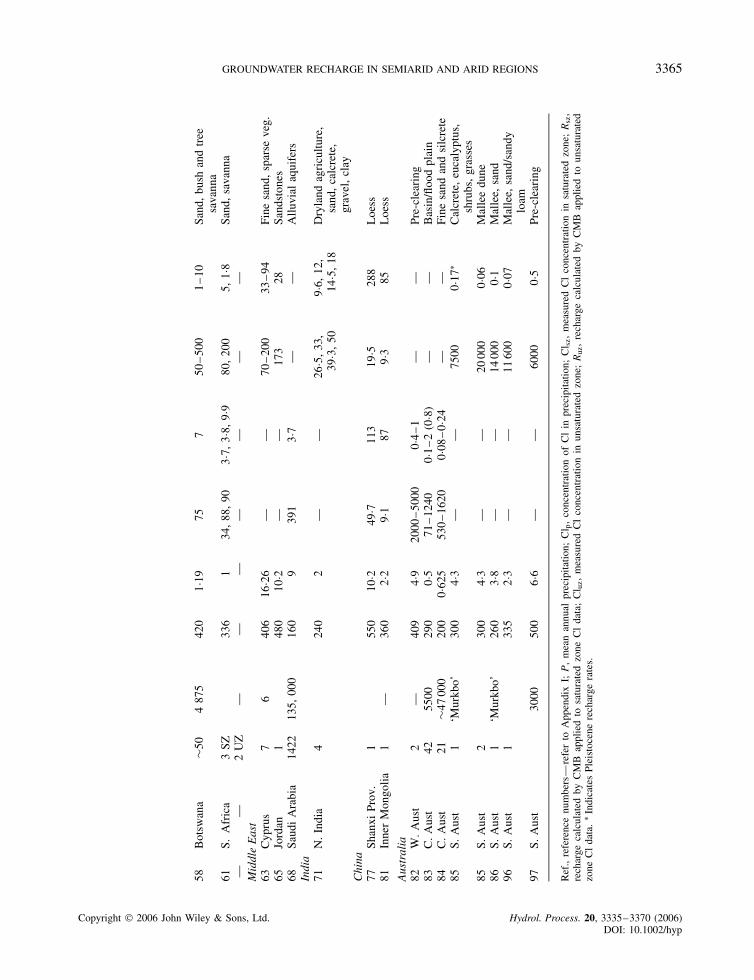
The compilation of recharge rates for each of the major continents allows us to evaluate the range of rechargerates in various settings (Appendices I, II; Table I; Figures 1–4). Different approaches for regionalizing pointrecharge estimates are reviewed because regional estimates are most important for water resources. The relativeimportance of piston and preferential flow is evaluated by comparing recharge rates on the basis of differenttechniques. Appendices I and II and Table I include additional recharge rates beyond those discussed in thefollowing sections on recharge in different regions. The recharge data are synthesized to assess impacts ofclimate variability and LU/LC changes on recharge.
Africa
Intensive recharge studies have been conducted in different countries in Africa (Appendices I, II; Table I;Figure 2). Data from the Sahara/Sahel tend to exhibit piston-flow behaviour and record variations in rechargerates at decadal to century scales in response to climate variability and LU change. In contrast, land surfacesare much older in southern Africa, and preferential flow is apparent particularly in Botswana and South Africa.
Regional recharge estimates in N. Senegal based on groundwater chloride data from 119 dug wells rangedfrom 1 to 20 mm year�1 (Appendices I, II) (Edmunds and Gaye, 1994). These recharge rates are consistentwith estimates based on unsaturated zone chloride from 15 separate sites and tritium from 2 sites, whichsuggest predominantly piston-type flow (Appendices I, II; Table I; Edmunds and Gaye, 1994; Gaye andEdmunds, 1996). Recharge rates are highest (¾20 mm) where Quaternary sands are thickest and decrease tolower values (¾1 mm year�1� where finer textured soils occur.
Recharge studies of the Continental Terminal aquifer (Eocene–Pliocene; silty sandstone) in south-westNiger indicate that cultivation increases recharge by about an order of magnitude. Natural ecosystems consistof patterned woodland termed tiger bush over the lateritic plateaus (banded pattern of alternating rows of
Figure 1. Global distribution of climatic zones (UNESCO, 1979). Information on recharge studies is in Appendix I. Location ID’s for theSW US were omitted owing to the high density of study locations; refer to Figure 4. Detailed site locations and land use/land cover for
Africa and Australia are available in Figures 2 and 3
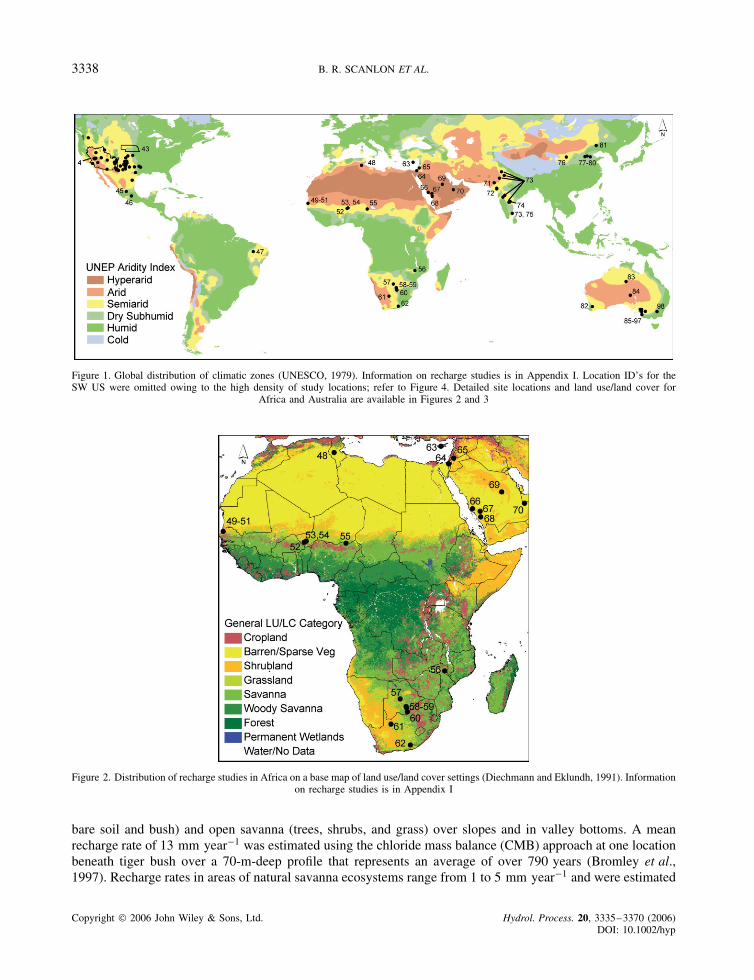
Figure 2. Distribution of recharge studies in Africa on a base map of land use/land cover settings (Diechmann and Eklundh, 1991). Informationon recharge studies is in Appendix I
bare soil and bush) and open savanna (trees, shrubs, and grass) over slopes and in valley bottoms. A meanrecharge rate of 13 mm year�1 was estimated using the chloride mass balance (CMB) approach at one locationbeneath tiger bush over a 70-m-deep profile that represents an average of over 790 years (Bromley et al.,1997). Recharge rates in areas of natural savanna ecosystems range from 1 to 5 mm year�1 and were estimated
GROUNDWATER RECHARGE IN SEMIARID AND ARID REGIONS 3339
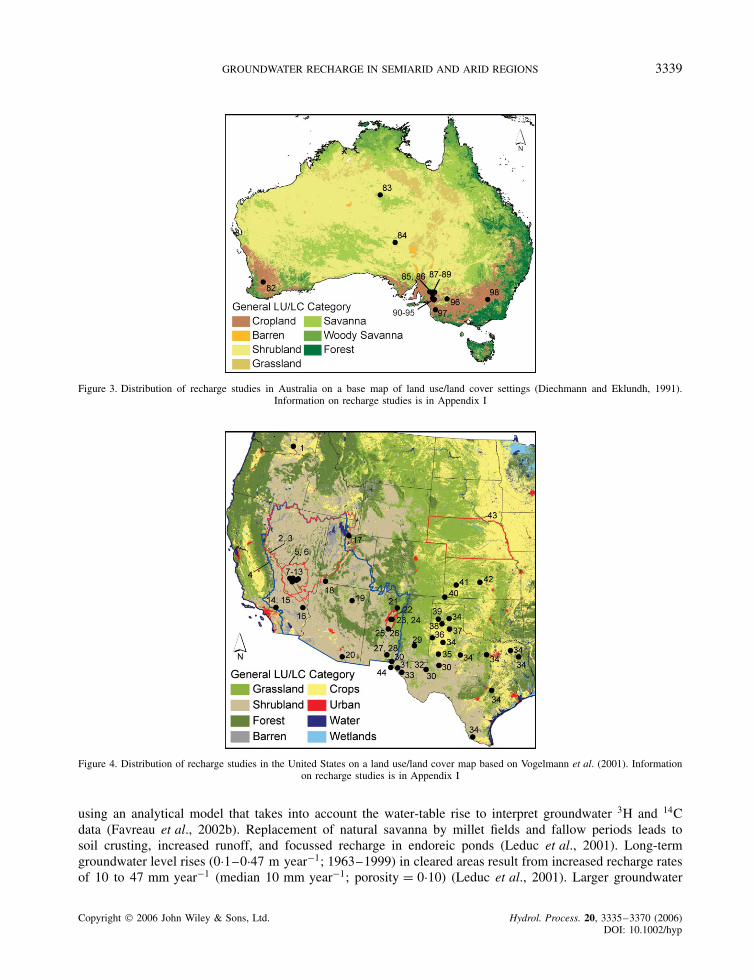
Figure 3. Distribution of recharge studies in Australia on a base map of land use/land cover settings (Diechmann and Eklundh, 1991).Information on recharge studies is in Appendix I
Figure 4. Distribution of recharge studies in the United States on a land use/land cover map based on Vogelmann et al. (2001). Informationon recharge studies is in Appendix I
using an analytical model that takes into account the water-table rise to interpret groundwater 3H and 14Cdata (Favreau et al., 2002b). Replacement of natural savanna by millet fields and fallow periods leads tosoil crusting, increased runoff, and focussed recharge in endoreic ponds (Leduc et al., 2001). Long-termgroundwater level rises (0Ð1–0Ð47 m year�1; 1963–1999) in cleared areas result from increased recharge ratesof 10 to 47 mm year�1 (median 10 mm year�1; porosity D 0Ð10) (Leduc et al., 2001). Larger groundwater
Ref., reference number referring to references in Appendix I; P, precipitation; 3H peak, depth of tritium peak; Value, amount of tritiummeasured in sample; Vel, velocity of tritium (peak/(year sampled-1963)); R, recharge determined using tritium method.
level rises from 1992 to 1999 (median 0Ð2 m year�1) resulted from increased average recharge rates of20 mm year�1 (Appendix I). These groundwater level rises occurred despite severe droughts during the 1970sand 1980s. Increased recharge related to land clearing can be extended to the Iullemmeden basin (Leduc et al.,2001). Therefore, LU/LC changes exert a significant influence on groundwater recharge in these regions.
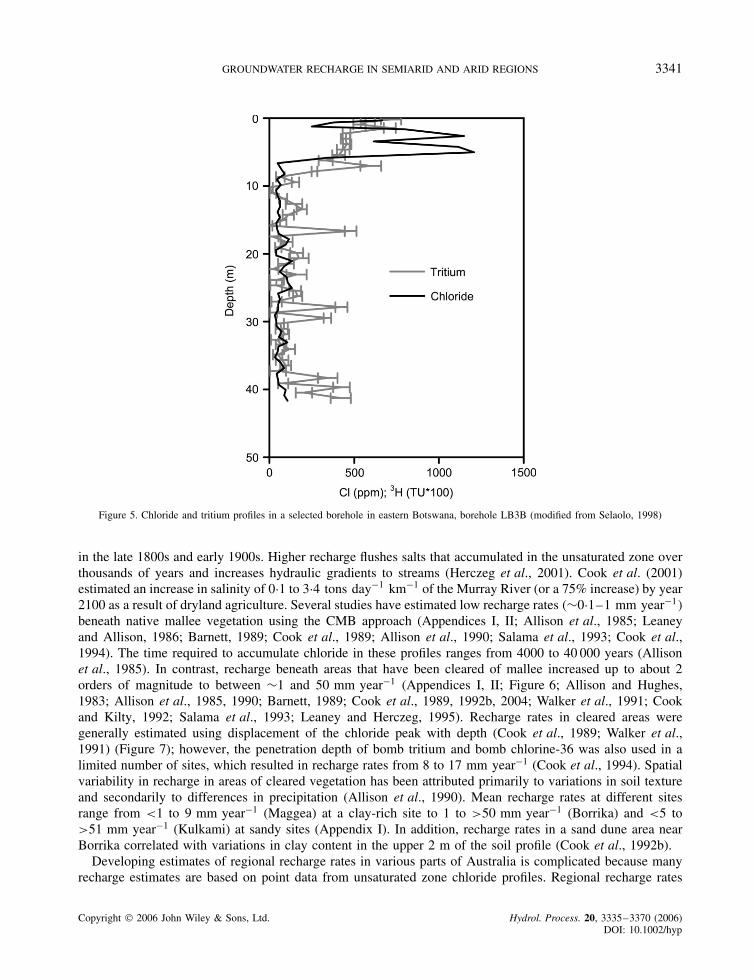
The importance of preferential flow in controlling recharge is shown by many studies in Botswana andS. Africa. Large-scale recharge studies were conducted in central and eastern Botswana in cooperativeprogrammes between the Botswana and Dutch governments (Selaolo et al., 1996; de Vries et al., 2000).Recharge rates in the central Kalahari are extremely low (¾1 mm year�1) where precipitation is low�350–400 mm year�1� (de Vries et al., 2000). Differences in recharge rates based on chloride data in theunsaturated zone (average 3 mm year�1; range 1–10 mm year�1) and saturated zone (average 7 mm year�1)in the eastern Kalahari Desert were attributed to focussed flow and preferential flow (Appendices I, II; deVries et al., 2000). This region is characterized by thick sandy soils with calcrete and silcrete. Evidenceof focussed flow is provided by low chloride concentrations beneath surface pans (e.g. 10 mg l�1 beneathLegape Pan), which result in local recharge rates of 50 mm year�1 (de Vries et al., 2000). Preferential flow isindicated by deep penetration of bomb-pulse tritium (4–5 TU to a depth of 42 m) (Figure 5) (Selaolo, 1998;de Vries et al., 2000). Evidence of preferential flow in the southern Kalahari (S. Africa) is indicated by higherrecharge rates based on tritium distribution (13 mm year�1, Appendix I, Table I) relative to those based onchloride in the unsaturated zone (1Ð8 and 5 mm year�1; Appendices I, II; Table 1) (Butler and Verhagen,2001). The importance of preferential flow should be considered in developing regional recharge estimatesfor water resource assessment.
Australia
Much of the recharge work in Australia focussed on dryland salinity issues (Figure 3). The salinity problemis extreme in the Murray River Basin, which drains a 300 000-km2 area and is a major water source forirrigation and urban areas. Rising salinity in the Murray River has been attributed partly to increased rechargeassociated with replacement of deep-rooted eucalyptus mallee vegetation with shallow-rooted crops and pasture
GROUNDWATER RECHARGE IN SEMIARID AND ARID REGIONS 3341
Figure 5. Chloride and tritium profiles in a selected borehole in eastern Botswana, borehole LB3B (modified from Selaolo, 1998)
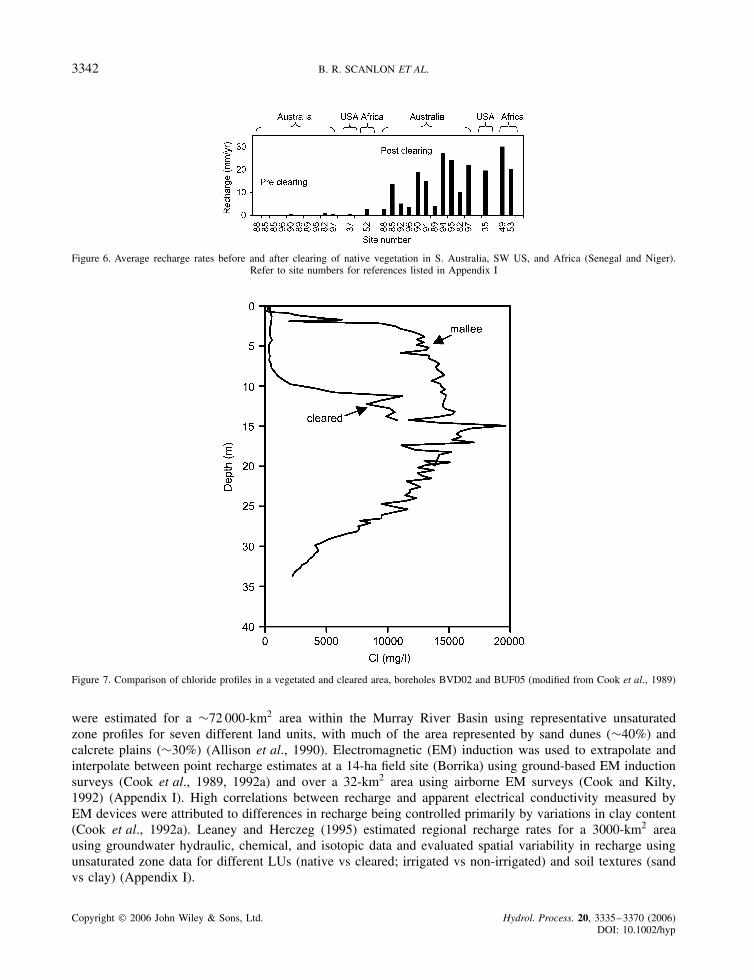
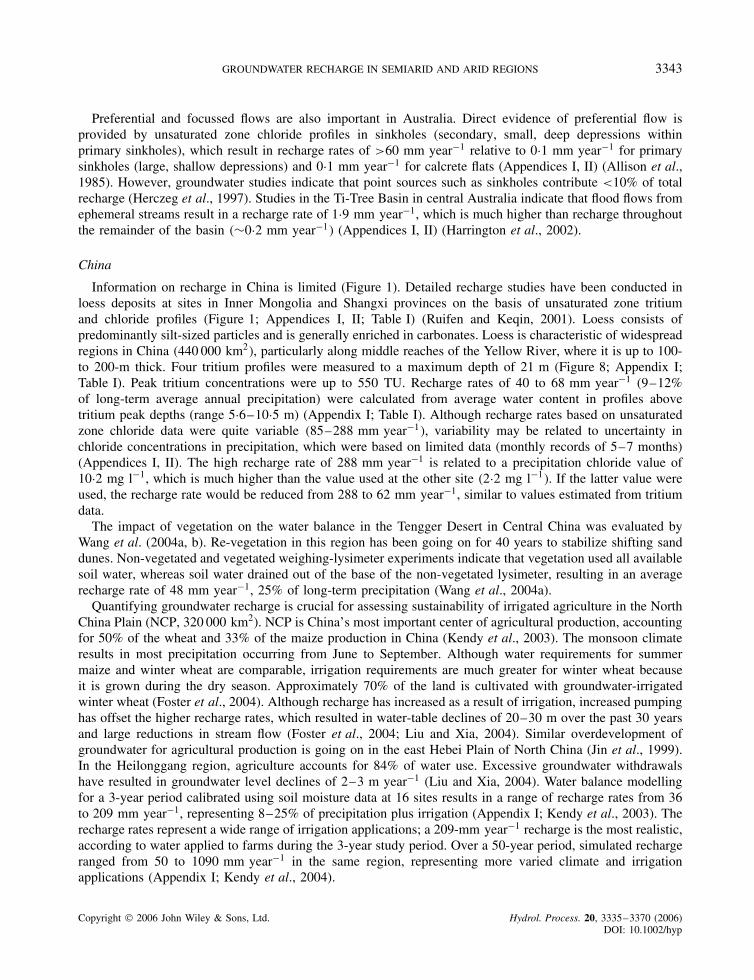
in the late 1800s and early 1900s. Higher recharge flushes salts that accumulated in the unsaturated zone overthousands of years and increases hydraulic gradients to streams (Herczeg et al., 2001). Cook et al. (2001)estimated an increase in salinity of 0Ð1 to 3Ð4 tons day�1 km�1 of the Murray River (or a 75% increase) by year2100 as a result of dryland agriculture. Several studies have estimated low recharge rates �¾0Ð1–1 mm year�1�beneath native mallee vegetation using the CMB approach (Appendices I, II; Allison et al., 1985; Leaneyand Allison, 1986; Barnett, 1989; Cook et al., 1989; Allison et al., 1990; Salama et al., 1993; Cook et al.,1994). The time required to accumulate chloride in these profiles ranges from 4000 to 40 000 years (Allisonet al., 1985). In contrast, recharge beneath areas that have been cleared of mallee increased up to about 2orders of magnitude to between ¾1 and 50 mm year�1 (Appendices I, II; Figure 6; Allison and Hughes,1983; Allison et al., 1985, 1990; Barnett, 1989; Cook et al., 1989, 1992b, 2004; Walker et al., 1991; Cookand Kilty, 1992; Salama et al., 1993; Leaney and Herczeg, 1995). Recharge rates in cleared areas weregenerally estimated using displacement of the chloride peak with depth (Cook et al., 1989; Walker et al.,1991) (Figure 7); however, the penetration depth of bomb tritium and bomb chlorine-36 was also used in alimited number of sites, which resulted in recharge rates from 8 to 17 mm year�1 (Cook et al., 1994). Spatialvariability in recharge in areas of cleared vegetation has been attributed primarily to variations in soil textureand secondarily to differences in precipitation (Allison et al., 1990). Mean recharge rates at different sitesrange from <1 to 9 mm year�1 (Maggea) at a clay-rich site to 1 to >50 mm year�1 (Borrika) and <5 to>51 mm year�1 (Kulkami) at sandy sites (Appendix I). In addition, recharge rates in a sand dune area nearBorrika correlated with variations in clay content in the upper 2 m of the soil profile (Cook et al., 1992b).
Developing estimates of regional recharge rates in various parts of Australia is complicated because manyrecharge estimates are based on point data from unsaturated zone chloride profiles. Regional recharge rates
Figure 6. Average recharge rates before and after clearing of native vegetation in S. Australia, SW US, and Africa (Senegal and Niger).Refer to site numbers for references listed in Appendix I
Figure 7. Comparison of chloride profiles in a vegetated and cleared area, boreholes BVD02 and BUF05 (modified from Cook et al., 1989)
were estimated for a ¾72 000-km2 area within the Murray River Basin using representative unsaturatedzone profiles for seven different land units, with much of the area represented by sand dunes (¾40%) andcalcrete plains (¾30%) (Allison et al., 1990). Electromagnetic (EM) induction was used to extrapolate andinterpolate between point recharge estimates at a 14-ha field site (Borrika) using ground-based EM inductionsurveys (Cook et al., 1989, 1992a) and over a 32-km2 area using airborne EM surveys (Cook and Kilty,1992) (Appendix I). High correlations between recharge and apparent electrical conductivity measured byEM devices were attributed to differences in recharge being controlled primarily by variations in clay content(Cook et al., 1992a). Leaney and Herczeg (1995) estimated regional recharge rates for a 3000-km2 areausing groundwater hydraulic, chemical, and isotopic data and evaluated spatial variability in recharge usingunsaturated zone data for different LUs (native vs cleared; irrigated vs non-irrigated) and soil textures (sandvs clay) (Appendix I).
GROUNDWATER RECHARGE IN SEMIARID AND ARID REGIONS 3343
Preferential and focussed flows are also important in Australia. Direct evidence of preferential flow isprovided by unsaturated zone chloride profiles in sinkholes (secondary, small, deep depressions withinprimary sinkholes), which result in recharge rates of >60 mm year�1 relative to 0Ð1 mm year�1 for primarysinkholes (large, shallow depressions) and 0Ð1 mm year�1 for calcrete flats (Appendices I, II) (Allison et al.,1985). However, groundwater studies indicate that point sources such as sinkholes contribute <10% of totalrecharge (Herczeg et al., 1997). Studies in the Ti-Tree Basin in central Australia indicate that flood flows fromephemeral streams result in a recharge rate of 1Ð9 mm year�1, which is much higher than recharge throughoutthe remainder of the basin �¾0Ð2 mm year�1� (Appendices I, II) (Harrington et al., 2002).
China
Information on recharge in China is limited (Figure 1). Detailed recharge studies have been conducted inloess deposits at sites in Inner Mongolia and Shangxi provinces on the basis of unsaturated zone tritiumand chloride profiles (Figure 1; Appendices I, II; Table I) (Ruifen and Keqin, 2001). Loess consists ofpredominantly silt-sized particles and is generally enriched in carbonates. Loess is characteristic of widespreadregions in China �440 000 km2�, particularly along middle reaches of the Yellow River, where it is up to 100-to 200-m thick. Four tritium profiles were measured to a maximum depth of 21 m (Figure 8; Appendix I;Table I). Peak tritium concentrations were up to 550 TU. Recharge rates of 40 to 68 mm year�1 (9–12%of long-term average annual precipitation) were calculated from average water content in profiles abovetritium peak depths (range 5Ð6–10Ð5 m) (Appendix I; Table I). Although recharge rates based on unsaturatedzone chloride data were quite variable �85–288 mm year�1�, variability may be related to uncertainty inchloride concentrations in precipitation, which were based on limited data (monthly records of 5–7 months)(Appendices I, II). The high recharge rate of 288 mm year�1 is related to a precipitation chloride value of10Ð2 mg l�1, which is much higher than the value used at the other site �2Ð2 mg l�1�. If the latter value wereused, the recharge rate would be reduced from 288 to 62 mm year�1, similar to values estimated from tritiumdata.
The impact of vegetation on the water balance in the Tengger Desert in Central China was evaluated byWang et al. (2004a, b). Re-vegetation in this region has been going on for 40 years to stabilize shifting sanddunes. Non-vegetated and vegetated weighing-lysimeter experiments indicate that vegetation used all availablesoil water, whereas soil water drained out of the base of the non-vegetated lysimeter, resulting in an averagerecharge rate of 48 mm year�1, 25% of long-term precipitation (Wang et al., 2004a).
Quantifying groundwater recharge is crucial for assessing sustainability of irrigated agriculture in the NorthChina Plain (NCP, 320 000 km2). NCP is China’s most important center of agricultural production, accountingfor 50% of the wheat and 33% of the maize production in China (Kendy et al., 2003). The monsoon climateresults in most precipitation occurring from June to September. Although water requirements for summermaize and winter wheat are comparable, irrigation requirements are much greater for winter wheat becauseit is grown during the dry season. Approximately 70% of the land is cultivated with groundwater-irrigatedwinter wheat (Foster et al., 2004). Although recharge has increased as a result of irrigation, increased pumpinghas offset the higher recharge rates, which resulted in water-table declines of 20–30 m over the past 30 yearsand large reductions in stream flow (Foster et al., 2004; Liu and Xia, 2004). Similar overdevelopment ofgroundwater for agricultural production is going on in the east Hebei Plain of North China (Jin et al., 1999).In the Heilonggang region, agriculture accounts for 84% of water use. Excessive groundwater withdrawalshave resulted in groundwater level declines of 2–3 m year�1 (Liu and Xia, 2004). Water balance modellingfor a 3-year period calibrated using soil moisture data at 16 sites results in a range of recharge rates from 36to 209 mm year�1, representing 8–25% of precipitation plus irrigation (Appendix I; Kendy et al., 2003). Therecharge rates represent a wide range of irrigation applications; a 209-mm year�1 recharge is the most realistic,according to water applied to farms during the 3-year study period. Over a 50-year period, simulated rechargeranged from 50 to 1090 mm year�1 in the same region, representing more varied climate and irrigationapplications (Appendix I; Kendy et al., 2004).
Figure 8. Representative tritium profile at a site in China, borehole CHN/88 (modified from Ruifen and Keqin, 2001)
Studies by Jin et al. (1999) suggest ways of harmonizing crop production with water availability to minimizegroundwater pumpage. Because summer maize production coincides with peak rainfall related to summermonsoons in the region, it requires little or no irrigation. Winter wheat has the greatest irrigation requirementsbecause winter precipitation is low. Optimizing crop production (e.g. less winter wheat) relative to precipitationand soil water availability should improve sustainability of agricultural production and reduce impacts ongroundwater. Recharge estimates based on tritium injection ranged from 92 to 243 mm year�1 in mostlyirrigated regions that varied with crop type, cultivation practices, irrigation amounts, and soil types (AppendixI; Jin et al., 2000). Information on recharge is critical for developing sustainable groundwater managementplans in these regions.
India
Natural recharge has been estimated for the four main hydrogeologic provinces in India: (1) alluvium (Indo-Gangetic plain in north India; Quaternary age), (2) basalt (Deccan trap in west and central India; Cretaceousage), (3) granites and gneisses (southern and south-eastern India; Archaean age), and (4) semi-consolidatedsandstones all over the country (Proterozoic, Paleozoic, and Mesozoic ages) (Rangarajan and Athavale, 2000).Recharge was estimated using tritium injection. Tritium was generally injected at depths of 0Ð6 to 0Ð8 m beforethe monsoon period (June–Sept), and soil profiles were sampled to depths of 2 to 6 m (0Ð1-m increments)at the end of the monsoon period, with the exception of dune soil in desert areas, which was sampled atthe end of the year to account for post-monsoon ET (Athavale et al., 1998). Recharge studies were usuallyconducted in grassy dryland (rain-fed) areas. Tritium was generally injected at 25 to 30 locations at eachsite, and an arithmetic average recharge rate was calculated for each site. Average recharge rates at all sitesranged from 24 to 198 mm year�1, representing 4–20% of local average seasonal precipitation (Rangarajan
GROUNDWATER RECHARGE IN SEMIARID AND ARID REGIONS 3345
and Athavale, 2000). Average recharge rates at nine (semi-) arid sites ranged from 46 to 161 mm year�1,representing 9–20% of local average seasonal precipitation (Appendix I). Local variability in recharge at eachsite was high (coefficient of variation 40–90%) and was attributed to soil heterogeneity. Recharge correlatedwith seasonal precipitation for each of the four hydrogeologic provinces (r2 D 0Ð69–0Ð92, 35 sites). Resultsfrom the tritium injection method compared favourably with the water-table fluctuation method (Athavaleet al., 1983; Rangarajan and Athavale, 2000).
The tritium injection approach quantifies piston-flow recharge; however, preferential flow may be significant,particularly in fractured rocks. To assess the importance of preferential flow, different tracer approaches(tritium mass balance and peak penetration and groundwater CMB) were used in three representative settings(alluvium, fractured granite, and semi-consolidated sandstones; Sukhija et al., 2003). Recharge estimates basedon peak tritium and total tritium mass balance in the alluvium were similar, indicating predominantly pistonflow. In contrast, recharge estimates based on saturated zone chloride were four times greater than thosebased on unsaturated zone chloride profiles in the granites and gneisses, indicating significant preferentialflow (Appendix I). Similar results were obtained in semi-consolidated sandstones, indicating 33% preferentialflow. These studies evaluated natural recharge in India but did not estimate recharge from surface water bodiesor irrigation return flow.
United States
Intensive recharge studies have been conducted in (semi-) arid regions of the SW US, primarily tocharacterize sites for low-level and high-level radioactive waste disposal (Prudic, 1994; Scanlon, 1996;Flint et al., 2001) but also to evaluate water resources (Izbicki, 2002; Sanford et al., 2004) (AppendicesI, II; Table I; Figure 4). Much of the SW US is within the Basin and Range physiographic province, whichconsists of linear mountain blocks trending north-northwest separated by broad, fault-bounded basins filledwith alluvial sediments. The aridity index ranges from hyperarid (in Death Valley, California) to humid(north-central Nevada) (Flint et al., 2004).
Detailed field studies were conducted at Yucca Mountain, Nevada (60 km2 area), the proposed site forhigh-level radioactive waste disposal in the US (Flint et al., 2002). The unsaturated zone consists of a550- to 750-m-thick section of volcanic tuffs. Water content monitoring in 69 boreholes over 11 years hasresulted in an average recharge rate of 11Ð6 mm year�1, 20 to 30 mm year�1 in upland areas and 10 to20 mm year�1 in lowland areas (Flint et al., 2002). The volume of water recharged in different settings was:ridge top, 1 109 170 m3 (19% of area); side slope, 4 310 280 m3 (73% of area); terrace, 422 090 m3 (7%);and channel 65 006 m3 (1%) (Flint and Flint, 2000). Channels, despite the large volumes of water availablefrom concentrated runoff, contribute much less water for recharge than all the other settings. Recharge ratesbased on the unsaturated zone chloride data ranged from 0Ð01 to 10 mm year�1, whereas rates based on thechloride in a perched aquifer ranged from 8 to 15 mm year�1 (Appendices I, II; Flint et al., 2002). Higherrecharge rates for the perched aquifer are attributed to increased recharge during the Pleistocene pluvialperiod relative to the Holocene semiarid period. Penetration of bomb-pulse chlorine-36 to depths of 300 m isattributed to preferential flow, related to thin soils �<3 m�, fracture flow as a result of high infiltration rates�1–10 mm year�1�, and continuous fracture pathways (Flint et al., 2002).
The detailed field studies at Yucca Mountain formed the basis for development of a general conceptualmodel (Flint et al., 2001) and numerical model (INFIL) based on water and energy balance processes thatassume that all processes controlling net infiltration (equated to recharge) occur within the top 6 m ofsurficial materials. INFIL is based on daily climate parameters (precipitation, air temperature, PET) andincludes five to seven soil layers and surface water routing. Modelled recharge rates range from ¾0 to80 mm year�1 (average ¾5–10 mm year�1 across the repository block area, 3–6% of average precipitation�170 mm year�1�, (Appendix I)) for the Yucca Mountain region. INFIL was also applied to Death Valley�45 288 km2� and resulted in an average recharge rate for 1950 to 1999 of 2Ð8 mm year�1, correspondingto average precipitation of 170 mm year�1 (Nevada and California) (Appendix I; Hevesi et al., 2003).
However, recharge is highly variable spatially, ranging from 0 to >500 mm year�1. Highest recharge rates�>500 mm year�1� were estimated for active channel locations in mountain-block settings (Spring Mountains),where precipitation is highest �¾550 mm year�1�, soils are thin, and bedrock permeability is high (Paleozoiccarbonates). In contrast, simulated recharge rates in granites at the summit of Paramint Range are much lower�<2 mm year�1� because of low permeability, even though precipitation exceeds 400 mm year�1.
The model area was expanded from Death Valley to the entire Great Basin �374 218 km2� and to the(semi-) arid SW US �km2�, as defined by Stonestrom and Leake (in press) using a newly developed, simpler,Geographic Information Systems (GIS)-based Basin Characterization Model (BCM) (Flint et al., 2004; Flintand Flint, in press) (Figure 9). BCM differs from INFIL in that monthly climate data are used, only onesoil layer is used, and there is no surface water routing. The lack of surface water routing results in BCMsimulating total potential recharge, which is a combination of in-place recharge and runoff, and assumes thatall runoff becomes recharge. Results from the two models compared favourably for Death Valley (INFIL:2Ð8 mm year�1; BCM, 1Ð7 mm year�1). Total potential recharge in the Great Basin averaged 16Ð9 mm year�1
(range: 0–>1300 mm year�1) for 1950 to 1999 and compared well with CMB estimates within the basin (Flintet al., 2004). Field calibration of BCM in the Great Basin indicates that 10% of runoff recharges in the northand 90% in the south, resulting in an average recharge rate of 9Ð7 mm year�1 (Appendix I; Flint et al., 2004).Simulated total potential recharge for the (semi-) arid SW US averaged 11Ð2 mm year�1 (0–1612 mm year�1),corresponding to average annual precipitation of 301 mm year�1 (51–1931 mm year�1) for 1971 to 2000.High recharge rates were estimated beneath ephemeral stream settings in regions of the SW US: 1Ð3 m year�1,Oro Grande Wash, California (Izbicki, 2002), and 41–91 mm year�1, 12–15% of streamflow, AmargosaArroyo, Nevada (Stonestrom et al., 2004) (Appendix I).
Regional recharge studies were also conducted in the Middle Rio Grande Basin (MRGB) in Central NewMexico. An average recharge rate of 8Ð5 mm year�1 (3% of precipitation) was estimated for the MRGB(7900 km2 area) using a steady state, inverse groundwater model based on 200 hydraulic head and 200 14Cmeasurements (Appendix I; Sanford et al., 2004). The 14C age estimates are robust because corrections wereminimal in this siliciclastic system. Recharge occurs primarily in surrounding mountain-block and mountain-front settings through ephemeral streams, with little or no recharge in inter-stream basin-floor settings. Modelrecharge estimates for the eastern mountain-front region (Sandia Mountains and Abo Arroyo) correspond toindependent estimates from the CMB approach (average 8Ð7 mm year�1, 2% of precipitation) (Anderholm,2001). Stream recharge rates up to 720 m year�1 were calculated using temperature monitoring (Appendix I;Constantz and Thomas, 1996; Constantz et al., 2002).
Regional recharge was estimated for the state of Texas �¾700 000 km2� on the basis of 1-D unsaturated zonemodelling for a 30-year period at 13 sites (1152–14 980 km2 area) representing various climate, vegetation,and soil types (Appendix I; Keese et al., 2005). GIS software was used to spatially weight recharge estimatesfor different vegetation and soil types at each site. The relationship between simulated average recharge ratesfor each site and long-term (30-year) average precipitation (r2 D 0Ð81) allowed regionalization of site-specificrecharge estimates to the entire state. A regional recharge rate of 11 mm year�1 (2% of precipitation) wasestimated for the southern High Plains in Texas using groundwater chloride data (Appendices I, II; Wood andSanford, 1995). Unsaturated zone studies indicate that recharge is focussed beneath ephemeral lakes or playas�60–120 mm year�1� and that there is little or no recharge in interplaya settings (Wood and Sanford, 1995;Scanlon and Goldsmith, 1997).
Recharge studies in Utah provide examples of various approaches that can be used to estimate recharge.Kilometer-length trenches (1 m wide, �7 m deep) excavated into the Navajo sandstone in Sand Hollow(50 km2 upland basin; south-west Utah) showed higher diffuse recharge in areas of exposed sandstone bedrockand of coarse-grained soil, and much lower recharge in areas of fine-grained soil (Heilweil and Solomon,2004). Low chloride concentrations in the vicinity of fractures indicate preferential flow. Recharge ratesrange from 2 to 57 mm year�1 according to unsaturated zone tritium data, and from 0Ð5 to 13 mm year�1
according to unsaturated zone chloride data beneath the bulge. Recharge rates based on saturated zone
GROUNDWATER RECHARGE IN SEMIARID AND ARID REGIONS 3347
Figure 9. Map of average annual potential recharge (30-year) using BCM for (semi-) arid SW US, shown within the thick black boundaryline (Flint and Flint, in press)
400
300
200
94
3 300
StrongModerateWeak
200
100
Win
ter
prei
cpita
tion
(% o
f nor
mal
)
210
Mul
tivar
iate
EN
SO
Inde
x
-1
95 96 97 98 99 00 01 02
Soi
l wat
er s
tora
ge (
mm
)
100
P = 28A = 47
A = 130
A = 0
P = 8A = 0
VegetatedIysimeter
NonvegetatedIysimeter
0 0
20
40
60
80
Dai
ly p
reci
pita
tion
(mm
)
100
1994
1995
1996
1997
1998
1999
2000
2001
2002
Figure 10. Measured soil water storage to a depth of 2 m in vegetated and non-vegetated lysimeters and daily precipitation depths at a sitein the SW US. Inset indicates relationship between the Multivariate ENSO Index (blue shading: El Nino, red shading: La Nina) and percent
of normal 1971 to 2000 winter precipitation (normal D 46 mm, Dec–Feb) (columns) at this site (from Scanlon et al., 2005a)
chloride concentrations are similar (mean ¾11 mm year�1, ¾5% of precipitation, range 3–60 mm year�1)(Appendices I, II; Table I; Heilweil et al., 2006). Noble gases and tritium–helium dating in the saturated zonewere used to estimate recharge in eastern Salt Lake Valley in northern Utah (Manning and Solomon, 2004).Noble gases provide information on recharge temperature. Two-component mixing with mean mountain-block temperature (2 °C) and valley-floor temperature (13 °C) indicates that mountain-block recharge from the
adjacent Wasatch Mountains represents ½30% and more likely 50 to 100% of recharge throughout the basin.Increasing ages away from the mountain front result in an age gradient of 5 years km�1. This age gradientgenerally corresponds to an average volumetric recharge rate of 176 000 m3 day�1 (porosity D 0Ð20) and arecharge rate of ¾210 mm year�1, which is based on a recharge area of 300 km2 for the Wasatch Mountains(Appendix I). Knowledge of total recharge from tritium–helium dating and the fraction that is mountain-blockrecharge allowed estimation of mountain-block recharge rates.
Recharge studies were conducted in cold deserts in south-eastern Washington State in the rain shadow ofthe Cascade Mountains. The Hanford site (765 km2 area) was established in 1943 by the US Departmentof Energy for production of nuclear materials; however, the mission changed to waste management in the1980s, and the concern is that natural recharge could transport wastes to underlying aquifers. An averageregional recharge rate of 11 mm year�1 was estimated using GIS and point recharge estimates for varioussoil texture/vegetation combinations (Appendix I; Fayer et al., 1996). Point recharge estimates were based onweighing and non-weighing lysimeter data, water content monitoring, and environmental tracers (chloride and36Cl). Recharge rates ranged from 55Ð4 mm year�1 (lysimeters, 8-year data) for non-vegetated, medium tocoarse sand equivalent to a dune environment; 86Ð7 and 300 mm year�1 (lysimeters) for non-vegetated, gravelover sand; 25Ð4 mm year�1 (water content monitoring) for cheat grass with sandy loam; �0Ð1 mm year�1
(CMB) for shrubs with silt loam; �0Ð3 mm year�1 (CMB) for shrubs in loamy sand; to 0Ð4 to 2Ð0 mm year�1
(CMB) for cheat grass in loamy sand (Appendix I; Fayer et al., 1996; Prych, 1998).
IMPACT OF CLIMATE VARIABILITY ON RECHARGE
Information on the impact of climate variability on recharge at inter-annual to millennial timescales is availablefor many regions. El Nino Southern Oscillation (ENSO) is the primary determinant of inter-annual climatevariability globally. El Nino results in increased precipitation in many regions, including SW US, SE S.America, N. Australia, India, and SE Africa. In contrast, precipitation is reduced in NW US, Gulf of Mexico,NE S. America, most of Australia, and E. Africa (Ropelewski and Halpert, 1987; McCabe and Dettinger,1999). La Nina generally has the opposite effect on precipitation. At decadal timescales, the Pacific DecadalOscillation (PDO) impacts precipitation in the Americas and Australia (Mantua and Hare, 2002). Variationsin precipitation caused by ENSO and PDO generally result in variations in streamflow (Redmond and Koch,1991; Simpson et al., 1993; Kahya and Dracup, 1994; Piechota et al., 1998; Cayan et al., 1999; Lins andSlack, 1999). Studies in mountain-front settings in Arizona (US) indicate that increased stream flow results inup to 3 times higher recharge during periods of frequent El Ninos (1977–1998) relative to periods dominatedby La Ninas (1941–1957) on the basis of water-table fluctuations and gravity data (Pool, 2005). Similarresults were found in California (US) (Hanson et al., 2004) and in Argentina (S. America) (Venencio,2002). Increased precipitation and streamflow related to ENSO may also increase recharge in many otherareas.
Elevated ENSO precipitation could also increase recharge in inter-stream settings through diffuse recharge;however, studies in SW US indicate that increased precipitation results in enhanced biomass productivity,which uses up all excess water, resulting in no net increase in groundwater recharge (Figure 10) (Scanlonet al., 2005a). Strong correlations between normalized difference vegetation index (NDVI, an indicatorof vegetation productivity based on satellite data) and inter-annual precipitation variability related toENSO in deserts in Australia, South America, and Africa (Anyamba and Eastman, 1996; Myneni et al.,1996) indicate that the processes described in SW US may apply to deserts globally, but has not beendocumented.
Climate variability at decadal to century timescales is archived in chloride profiles in N. Senegal (Cook et al.,1992b; Edmunds and Tyler, 2002). Chloride profiles (e.g. Louga 2, 3, and 18 profiles) have high concentrationscorresponding to drought periods (e.g. Sahel drought 1970–1986) and low concentrations corresponding toperiods of high precipitation (1950–1970). Precipitation during the Sahel drought �223 mm year�1� was
GROUNDWATER RECHARGE IN SEMIARID AND ARID REGIONS 3349
much lower than the long-term average �356 mm year�1� (Cook et al., 1992b). Estimated recharge rates fora chloride profile (Louga 18) range from 30 mm year�1 during drought (1970–1986) to >65 mm year�1
(1950–early 1960s) and 150 mm year�1 (1986–1990) during non-drought periods (Cook et al., 1992b).Another chloride profile (Louga 10) in this region contained a longer record (475 years) and correlatedwith variations in reconstructed water levels in Lake Chad, according to sedimentological and palynologicalrecords (Cook et al., 1992b). High chloride concentrations correspond to low water levels in Lake Chad andvice versa.
The impact of paleoclimate variations has been documented in the United States and Africa. Bulge-shapedchloride profiles in inter-stream settings throughout the SW US are attributed to higher recharge at depth(low chloride concentrations generally corresponding to the Pleistocene period 10 000–15 000 years ago) andbuildup of chloride since that time during the Holocene (Figure 11) (Scanlon, 1991; Phillips, 1994; Tyleret al., 1996). The change in chloride concentrations corresponds to a change from humid conditions withmesic vegetation during the Pleistocene to semiarid conditions with xeric vegetation during the Holocene.Current water potential monitoring and modelling analysis indicate that xeric vegetation has been activethroughout the Holocene in maintaining dry conditions in the root zone, resulting in discharge through ETrather than recharge (Walvoord et al., 2002; Scanlon et al., 2003). Therefore, there has been no recharge sincethe Pleistocene in these settings.
Regional evaluation of recharge in N. Africa indicates that recharge occurred during the Pleistocene priorto the Last Glacial Maximum (LGM), about 20 000 years ago in many basins; no recharge occurred duringthe LGM (¾20 000–10 000 years) (suggested by a gap in the 14C record between 5 and 15 pmc (% moderncarbon)); and recharge occurred during the Holocene, mostly beneath river channels. Late Pleistocene recharge(¾20 000–30 000 years) is recorded in confined aquifers in the Sirte and Kufra Basins in Libya (Edmunds andWright, 1979), the Complexe Terminal aquifer in central Algeria (Guendouz et al., 2003), and the ContinentalIntercalcaire aquifer in Niger (Andrews et al., 1994). Noble gas recharge temperatures of Pleistocene waterwere up to 7 °C lower than current temperatures. Recharge during the Holocene was concentrated beneathriver channels, as shown by a fresh-water zone beneath a proposed Holocene river (10 km wide ð 130 kmlong) within the Sirte and Kufra Basins, with ages ranging from 5000 to 7800 years (Edmunds and Wright,1979). Recharge occurred from the Tibesti Mountains to the south along a now-inactive river (Wadi BeharBelama) (Pachur and Kropelin, 1987). Recharge was focussed beneath the Nile River in Sudan, according to
Figure 11. Simulated matric potential and chloride concentrations for selected sites in the SW US (from Scanlon et al., 2003). Time 0 kyrrepresents wet initial conditions (Pleistocene pluvial period). Remaining times represent periods of upward flow to a maximum time basedon the CMB age at the base of the chloride bulge for each site. Measured matric potential and chloride profiles are shown for comparison
isotopic and chemical compositions (Darling et al., 1987). Focussed recharge beneath rivers generally ceasedabout 4000 to 5000 years BP, when the climate shifted to the current arid conditions.
IMPACT OF LAND USE/LAND COVER CHANGE ON RECHARGE
Most recharge studies have been conducted in natural settings. Estimated average recharge rates for 26 studiesin large basins �40–374 000 km2� with predominantly natural ecosystems range from 0Ð2 to 35 mm year�1
(Figure 12). These recharge rates represent 0Ð1–5% of precipitation, and recharge increases with precipitation(r2 D 0Ð46). Previous studies have shown the importance of vegetation in controlling recharge in these naturalecosystems. Lysimeter studies in the Tengger Desert (China) and the Chihuahuan and Mojave Deserts (SWUS) show recharge in non-vegetated areas up to 87 mm year�1 and no recharge in vegetated areas (Geeet al., 1994; Wang et al., 2004a; Scanlon et al., 2005b). Therefore, changing LU/LC from non-vegetated tovegetated conditions reduces recharge to zero.
Impacts of LU/LC changes on recharge are most obvious in Australia. Recharge rates in native malleeeucalyptus vegetation in Australia range from ¾0Ð1 to 1 mm year�1, whereas recharge in deforested areasis up to about 2 orders of magnitude higher (¾1–50 mm year�1) (Figure 6). Changes in recharge resultedfrom reduced interception, reduced ET, shallower rooting depths, and fallow periods. Groundwater tables inremnant eucalyptus vegetation are up to 2–7 m deeper than under adjacent cleared areas (McFarlane andGeorge, 1992; Le Maitre et al., 1999). Increased recharge related to deforestation in Australia has resultedin large increases in groundwater salinity. Field studies and numerical modelling have been used to examinedifferent strategies, including reforestation and various agricultural management options, to control or reversedryland salinity problems. Evaluation of 80 sites in western Australia indicated that reforestation of about70–80% of a catchment would be required to achieve significant reductions in groundwater levels and salinitycontrol (George et al., 1999). Modelling analyses indicate that reforestation of 30 to 45% of catchments ina region in south-eastern Australia would be required to control salinity (Salama et al., 1999; Zhang et al.,1999). Agricultural options include reduction of fallow periods. Studies by O’Connell et al. (2003) indicatethat long fallow periods potentially increase deep drainage by ¾2 mm year�1 relative to fully cropped systemsover a wide rainfall range (134–438 mm year�1). Similar studies have examined cropping intensification andvarious crop rotations to reduce recharge (Latta and O’Leary, 2003; Sadras and Roget, 2004).
There is considerable interest in afforestation for carbon sequestration as a result of the Kyoto protocol;however, potential impacts of these plantations on groundwater recharge should be considered. Studies havebeen conducted in Argentina in areas where pampas grasslands have been replaced by eucalyptus plantations
Figure 12. Relationship between recharge and precipitation from studies of large natural areas �40–374 200 km2� using methods that reflectregional recharge rates (modelling, saturated zone CMB, micro-gravity, and water-table fluctuations) (Leaney and Allison, 1986; Edmundset al., 1988; Bazuhair and Wood, 1996; Sami and Hughes, 1996; de Vries et al., 2000; Love et al., 2000; Anderholm, 2001; Leduc et al.,2001; Flint et al., 2002, 2004; Favreau et al., 2002b; Harrington et al., 2002; Hevesi et al., 2003; Goodrich et al., 2004; Sanford et al., 2004;
GROUNDWATER RECHARGE IN SEMIARID AND ARID REGIONS 3351
(Jobbagy and Jackson, 2004). Detailed studies of the impact of a 40-ha eucalyptus plantation on groundwaterover 2 years indicated that groundwater discharged more than 50% of the days through ET depressing thewater table by >0Ð5 m and increasing groundwater salinity by factors of 2–19, depending on soil texture(Jobbagy and Jackson, 2004; Engel et al., 2005). Studies in S. India suggest that eucalyptus plantations usetwice as much water as millet crops, significantly reducing groundwater recharge (Calder et al., 1993).
Conversion of grassland and shrubland to crops also has significant impacts on recharge. Such conversionsin the southern High Plains (US) changed systems from discharging through ET to recharging, with averagerecharge rates over large areas (up to 3400 km2) of ¾24 mm year�1 (¾5% of precipitation) (Scanlon et al.,2005b). Similar changes in recharge have been documented in the Great Plains, N. America (van der Kampet al., 2003), and in Niger and South Africa (O’Connor, 1985; Le Maitre et al., 1999). In Niger, recharge ratesincrease from 1 to 5 mm year�1 in savanna ecosystems to 10 to 47 mm year�1 in cleared areas (Leduc et al.,2001; Favreau et al., 2002b). Impacts of LU/LC changes on recharge are much greater than those of climatevariability in Niger because water level increases related to cultivation occurred during severe droughts inthe 1970s and 1980s. Cultivation results in increased diffuse recharge in the southern High Plains, similar tocultivated areas in Australia, whereas cultivation results in increased runoff and focussed recharge beneathendoreic ponds in the Great Plains (US). Causes of variations in recharge related to cultivation in the southernHigh Plains may be related to the absence of vegetation during fallow periods, which is consistent withlysimeter studies in the SW US and in China. Increased runoff and reduced infiltrability related to cultivationin the Great Plains are attributed to destruction of preferred pathways in frozen soil (van der Kamp et al.,2003). There is controversy about the impact of cultivation on diffuse versus focussed recharge in Niger(Leduc et al., 2001; Bromley et al., 2002; Favreau et al., 2002a). Bromley et al. (2002) suggested that bothdiffuse and focussed recharge may contribute to increased recharge beneath cultivated fields on the basis ofincreases in soil moisture below the root zone of millet fields based on neutron probe logging. However,Favreau et al. (2002a) argued that (1) millet can dry out soil profiles to 3Ð4 m depth; (2) the time required fordiffuse recharge to reach the water table (¾35 m) is >100 years, whereas clearing took place only 50 yearsago; and (3) the generally low total dissolved solids in groundwater is not consistent with flushing of saltsthat accumulated in the unsaturated zone. Increased runoff has been related to reduced organic matter andcrusting in cultivated soils (Leduc et al., 2001).
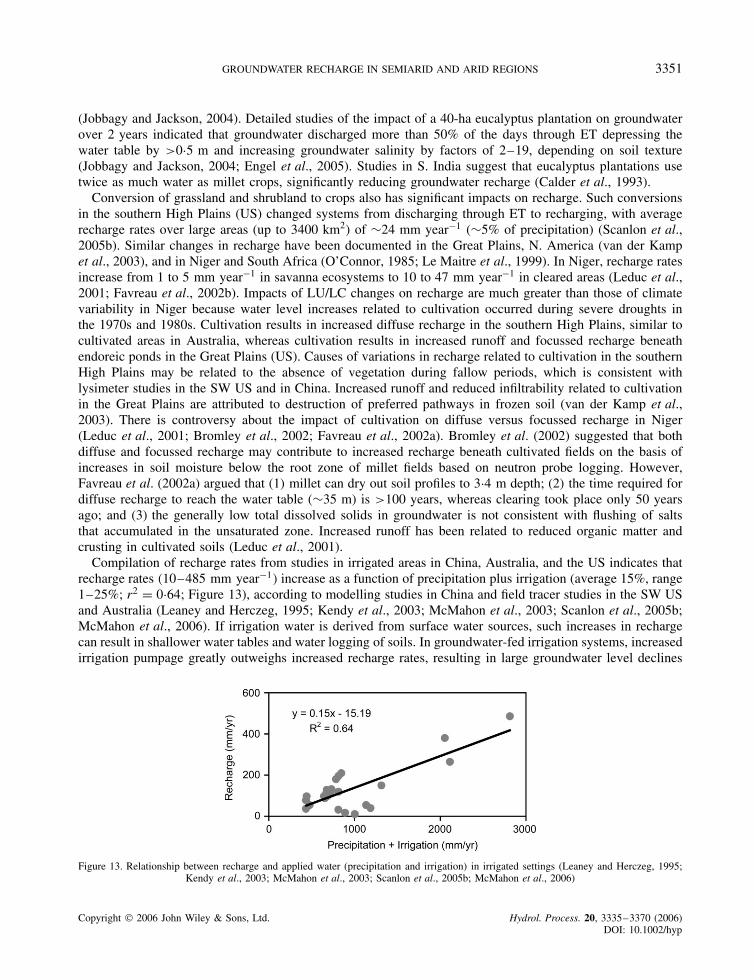
Compilation of recharge rates from studies in irrigated areas in China, Australia, and the US indicates thatrecharge rates �10–485 mm year�1� increase as a function of precipitation plus irrigation (average 15%, range1–25%; r2 D 0Ð64; Figure 13), according to modelling studies in China and field tracer studies in the SW USand Australia (Leaney and Herczeg, 1995; Kendy et al., 2003; McMahon et al., 2003; Scanlon et al., 2005b;McMahon et al., 2006). If irrigation water is derived from surface water sources, such increases in rechargecan result in shallower water tables and water logging of soils. In groundwater-fed irrigation systems, increasedirrigation pumpage greatly outweighs increased recharge rates, resulting in large groundwater level declines
Figure 13. Relationship between recharge and applied water (precipitation and irrigation) in irrigated settings (Leaney and Herczeg, 1995;Kendy et al., 2003; McMahon et al., 2003; Scanlon et al., 2005b; McMahon et al., 2006)
(e.g. ¾20–30 m, China; �25 m, southern High Plains (US), 20–30 m, Spain) (Bromley et al., 2001; Fosteret al., 2004; Liu and Xia, 2004; Scanlon et al., 2005b). Therefore, cultivation (irrigated and non-irrigated) haslarge impacts on groundwater recharge and water resources.
COMPARISON OF RECHARGE ESTIMATION TECHNIQUES
The most widely used approach for estimating recharge is the CMB technique, in both unsaturated andsaturated zones. However, information on spatial and temporal variability in chloride deposition is usuallylimited, generally restricted to 1–3 years of data and often includes only wet deposition. Although uncertaintiesin recharge estimates vary linearly with uncertainties in chloride deposition, more emphasis should be placedon development of long-term records of wet and dry chloride deposition in (semi-) arid regions worldwide.Prebomb 36Cl/Cl ratios have been used to estimate long-term chloride deposition at various sites (Phillipset al., 1988; Scanlon, 1991). Relationships between chloride deposition and distance from the coast havebeen developed for regions in Australia (Hutton, 1976). More data on chloride deposition should reduceuncertainties in recharge estimates based on this approach.
Historical tracers, such as bomb-pulse tritium and chlorine-36, have proved useful in delineating preferentialflow in many regions (Nativ et al., 1995; de Vries et al., 2000; Flint et al., 2002). In some studies, muchdeeper penetration of tritium relative to chlorine-36 has been attributed to vapour transport; however, previousstudies have shown that vapor diffusion of tritium is limited by equilibration of liquid and gas phases becausethe concentration of tritium is 5 orders of magnitude greater in the liquid than in the gas phase (Smiles et al.,1995). The liquid phase therefore acts as a large sink for tritium. Use of chlorine-36 to delineate preferentialflow is also limited by damping of the bomb-pulse signal where high chloride concentrations occur in thematrix (Scanlon, 2000). Tritium has been widely used as an applied tracer in recharge studies in India. Mostof these tracer studies represent a single monsoon season (Rangarajan and Athavale, 2000). The relativelyshort timescale of these experiments may not be representative of long-term mean recharge rates.
Most recharge studies described in this review relied heavily on environmental tracers; however, monitoringphysical parameters, such as soil matric potential or groundwater levels, provides valuable information onflow processes for the duration of the monitoring periods. For example, matric potential profiles in the SW USprovide important information on direction of water movement (Andraski, 1997; Scanlon and Goldsmith 1997).Monitoring matric potential in different settings has also been useful in delineating recharge processes relatedto inter-annual climate variability and LU/LC changes (Scanlon et al., 2005b). Matric potential monitoringhas been limited mostly to the SW US and should be extended to (semi-) arid regions globally.
Modelling is the only technique that can be used to predict future recharge rates and is invaluable forisolating impacts of different controls on groundwater recharge (Salama et al., 1999; Zhang et al., 1999;Keese et al., 2005). The recharge rates compiled in this review will be valuable when compared with modelresults. Future work will probably include much more modelling analyses to assess management options inorder to control groundwater recharge (either increase or decrease recharge). Such modelling analyses arecurrently being conducted in Australia to determine land management approaches to decreasing recharge andassociated dryland salinity problems (Salama et al., 1999; Zhang et al., 1999). Types of models include landatmosphere, watershed, unsaturated zone, and groundwater models, and they can represent a range of scalesfrom point to regional. It will be important for these simulations to include dynamic vegetation and two-waycoupling between vegetation and the water cycle because both play critical roles in controlling soil waterbalance and, ultimately, deep drainage and recharge (Foley et al., 2000).
As many previous reviews on recharge have concluded, it is important to use a variety of differentapproaches to quantify recharge because various techniques complement each other in the range of spaceand time scales that they cover. Factors contributing to recharge in arid and semiarid environments ofteninclude variable precipitation, topography, soil depth, and quite often a thick unsaturated zone with variableproperties. These factors contribute to a spatially variable influence on the timing of recharge to the saturated
GROUNDWATER RECHARGE IN SEMIARID AND ARID REGIONS 3353
zone, from less than a year to thousands of years, and, as a result, reinforce the need to use careful considerationof spatial and temporal scales in selecting approaches used to characterize the recharge or in evaluating orinterpreting recharge data.
IMPLICATIONS FOR GROUNDWATER RESOURCE MANAGERS
Global compilation and evaluation of recharge rates have important implications for groundwater resourcemanagers. Many natural ecosystems are characterized by low recharge rates or by discharge through ET, asin areas of eucalyptus mallee vegetation in Australia or inter-stream basins in the SW US. Cultivation hasgreatly increased recharge relative to that beneath natural ecosystems in many deserts. Increased rechargewas recorded beneath dryland agriculture in areas of Africa, N. America, and Australia. These increasedrecharge rates indicate that future conversion of natural ecosystems to dryland agricultural ecosystems couldresult in increased water resources in desert systems. Recharge beneath irrigated agriculture increases withirrigation application amounts; however, such increases are generally masked by large groundwater leveldeclines caused by irrigation pumpage. Irrigated agriculture is not sustainable in most desert systems, asshown by large groundwater level declines. Increasing efficiency of irrigation systems may improve waterconservation if the increased efficiency is not accompanied by expansion of irrigated areas, as seen in parts ofthe High Plains in the United States (McMahon et al., 2003). However, Foster et al. (2004) warned against‘double water resource accounting’ because irrigation return flow would ultimately return to the aquifer andcould be recovered. In contrast, dryland or rain-fed agriculture is likely to be sustainable because of generallymoderate recharge rates in these regions relative to water use.
Another issue for water resource managers is how climate variability or climate change will impactgroundwater recharge and how we can quantify such impacts. Recharge studies evaluated in this paperindicate that increased winter precipitation related to ENSO in the SW US should not alter recharge in inter-stream desert basins because of negative feedback related to increased vegetation productivity in these regions(McCabe and Dettinger, 1999; Scanlon et al., 2005a). In contrast, elevated winter precipitation enhances streamflow in these regions, which results in focussed recharge beneath streams in desert basins (Redmond and Koch,1991; Cayan and Webb, 1992; Pool, 2005). Therefore, monitoring stream flow related to ENSO can be usedto predict impacts of ENSO on recharge. System response to decadal-scale variations in climate (droughts andfloods) in parts of Africa was archived in unsaturated zone chloride profiles and indicates a direct relationshipbetween precipitation and recharge in these settings (Edmunds and Tyler, 2002). Relationships betweenmillennial-scale changes in climate (glacial interglacial cycles) and recharge are recorded in unsaturatedzone chloride and matric potential profiles in the SW US and indicate a large decrease in recharge related tothe shift from Pleistocene pluvial climate to Holocene arid climate, which is enhanced by the vegetation shiftfrom mesic to xeric (Scanlon, 1991; Phillips, 1994; Tyler et al., 1996). The insights provided by these studiescan be applied to predicting impacts of future climate variability and change on groundwater recharge.
The ultimate goal would be to predict recharge rates related to global environmental change, including cli-mate change and LU/LC changes. The compilation of recharge rates and understanding of recharge processesprovided by this synthesis can be used to assess simulated recharge responses to projected climate and LU/LCchanges. Regional climate models nested within global climate models can provide climate forcing. Land atmo-sphere models that incorporate dynamic vegetation can be used to provide real-time estimates of groundwaterrecharge and projections of future recharge in response to different climate and LU/LC change scenarios.
Water quality issues also affect water resources. Previous studies indicate that increased recharge relatedto conversion of natural to agricultural ecosystems has resulted in large-scale groundwater contaminationcaused by flushing of salts, such as chloride and nitrate, which had accumulated in the unsaturated zone.This mobilization of salts is critical for groundwater quality in many areas, particularly Australia, whereextensive groundwater and surface water salinization has resulted from dryland agriculture (Allison et al.,1990; Cook et al., 2001). Nitrate mobilization is critical in the US High Plains, where a large fraction of the
wells exceed the maximum contaminant level of 10 mg l�1 NO3-N. Therefore, if conversion of rangelandto dryland agriculture is being considered to increase recharge, the reservoir of stored salts in the rangelandsetting should be characterized to assess potential impacts on groundwater quality.
SUMMARY
ž Average recharge rates estimated over large areas �40–374 000 km2� range from 0Ð2 to 35 mm year�1,representing 0Ð1 to 5% of long-term average annual precipitation.
ž Focussed recharge beneath ephemeral streams and lakes and preferential flow mostly in fractured rock resultin highly variable recharge rates, up to 720 m year�1.
ž The CMB approach is the most widely used technique for estimating recharge; however, information onspatial and temporal variability in chloride input is limited, and monitoring of chloride input needs to beexpanded.
ž Impacts of climate variability and LU/LC changes are archived in unsaturated zone tracer profiles andgroundwater level fluctuations.
ž Climate variability at inter-annual timescales related to elevated precipitation and increased streamflowassociated with ENSO results in increased recharge in Arizona, California, and Argentina, as shown byrising water tables. Recharge increased by up to a factor of 3 in Arizona (US). Inter-stream recharge isunlikely, as shown by negative feedback provided by biomass productivity in Nevada (US).
ž Climate variability at decadal timescales results in variations in recharge by a factor of 5 in Africa, relatedto drought and non-drought periods.
ž Variations in paleoclimate at millennial timescales changed systems from recharge during the Pleistocenepluvial period to discharge during the Holocene semiarid period in the SW US. Recharge in N. Africa alsooccurred during the Pleistocene and was generally restricted to river channels during the Holocene.
ž LU/LC changes related to deforestation have increased recharge by up to about 2 orders of magnitude inAustralia and flushed salts into underlying aquifers and adjacent streams.
ž Changes from natural grasslands and shrublands to cultivated ecosystems have altered systems fromdischarge (ET) to diffuse recharge (¾24 mm year�1� in the SW US, related to fallow periods. Cultivationincreased surface runoff and focussed recharge in endoreic ponds in the Great Plains (N. America) and inNiger (Africa).
ž Impact of LU/LC changes exceeds that of climate variability in Niger, as shown by order-of-magnitudeincreases in recharge, even during severe drought periods.
ž Recharge in irrigated areas ranges from 10 to 485 mm year�1 (1–25% of irrigation C precipitation);however, pumpage in groundwater-irrigated systems greatly exceeds recharge, resulting in large water leveldeclines in irrigated areas (China, United States, Europe)
ž Sensitivity of recharge to LU/LC changes indicates that such changes may be managed in the future tocontrol recharge.
ž The compilation of recharge rates in this study and understanding of impacts of past climate and LU/LCchanges are critical to sustainable development of water resources within the context of climate variabilityand LU/LC changes.
ACKNOWLEDGMENTS
The motivation for this recharge review study originated at a meeting related to global mapping of groundwaterrecharge organized by Dr Bill Wallin at the International Atomic Energy Agency in Vienna in 2005. We wouldlike to acknowledge financial support for this study from the Jackson School of Geosciences. The authorsbenefited from discussions with individuals on their recharge studies. Reviews by Brent Newman (Los AlamosNational Laboratory) and an anonymous reviewer greatly improved the paper.
Allison GB, Hughes MW. 1983. The use of natural tracers as indicators of soil-water movement in a temperate semi-arid region. Journalof Hydrology 60: 157–173.
Allison GB, Stone WJ, Hughes MW. 1985. Recharge in karst and dune elements of a semi-arid landscape as indicated by natural isotopesand chloride. Journal of Hydrology 76: 1–26.
Allison GB, Cook PG, Barnett SR, Walker GR, Jolly ID, Hughes MW. 1990. Land clearance and river salinisation in the western MurrayBasin, Australia. Journal of Hydrology 119: 1–20.
Anderholm SK. 2001. Mountain-front recharge along the eastern side of the Middle Rio Grande Basin, Central New Mexico. USGS WaterResources Investigations Report 00–4010, 36.
Andraski BJ. 1997. Soil-water movement under natural-site and waste-site conditions: A multi-year field study in the Mojave Desert, Nevada.Water Resources Research 33: 1901–1916.
Andrews JN, Fontes JC, Aranyossy JF, Dodo A, Edmunds WM, Joseph A, Travi Y. 1994. The evolution of alkaline groundwaters in thecontinental Intercalaire aquifer of the Irhazer-Plain, Niger. Water Resources Research 30: 45–61.
Anyamba A, Eastman JR. 1996. Interannual variability of NDVI over Africa and its relation to El Nino Southern Oscillation. InternationalJournal of Remote Sensing 17: 2533–2548.
Athavale RN, Chand R, Rangarajan R. 1983. Groundwater recharge estimates for two basins in the Deccan Trap basalt formation.Hydrological Sciences Journal-Journal Des Sciences Hydrologiques 28: 525–538.
Athavale RN, Rangarajan R, Muralidharan D. 1998. Influx and efflux of moisture in a desert soil during a 1 year period. Water ResourcesResearch 34: 2871–2877.
Barnett SR. 1989. The effect of land clearance in the Mallee region on River Murray salinity and land salinisation. Journal of AustralianGeology and Geophysics 11: 205–208.
Bazuhair AS, Wood WW. 1996. Chloride mass-balance method for estimating ground water recharge in arid areas: Examples from westernSaudi Arabia. Journal of Hydrology 186: 153–159.
Birkle P, Rodriguez VT, Partida EG. 1998. The water balance for the Basin of the Valley of Mexico and implications for future waterconsumption. Hydrogeology Journal 6: 500–517.
Bromley J, Taylor CM, Gash JHC. 2002. Discussion–Comment on ‘Long-term rise in a Sahelian water-table: the continental terminal inSouth-West Niger’ by Leduc, C., Favreau, G., Schroeter, P., 2001. Journal of Hydrology 243, 43–54. Journal of Hydrology 255: 260–262.
Bromley J, Cruces J, Acreman M, Martinez L, Llamas MR. 2001. Problems of sustainable groundwater management in an area of over-exploitation: The upper Guadiana catchment, central Spain. International Journal of Water Resources Development 17: 379–396.
Bromley J, Edmunds WM, Fellman E, Brouwer J, Gaze SR, Sudlow J, Taupin JD. 1997. Estimation of rainfall inputs and direct rechargeto the deep unsaturated zone of southern Niger using the chloride profile method. Journal of Hydrology 189: 139–154.
Butler MJ, Verhagen BT. 2001. Isotope studies of a thick unsaturated zone in a semi-arid area of Southern Africa. In Isotope BasedAssessment of Groundwater Renewal in Water Scarce Regions , Yurtsever Y (ed.). IAEA-Tecdoc-1246. IAEA: Vienna, 45–70.
Calder IR, Hall RL, Prasanna KT. 1993. Hydrological impact of eucalyptus plantation in India. Journal of Hydrology 150: 635–648.Cayan DR, Webb RH. 1992. El Nino/Southern oscillation and streamflow in the western United States. In El Nino: Historical and
Paleoclimatic Aspects of the Southern Oscillation, Diaz HF, Markgraf V (eds). Cambridge University Press: London; 29–88.Cayan DR, Redmond KT, Riddle LG. 1999. ENSO and hydrologic extremes in the western United States. Journal of Climate 12: 2881–2893.Constantz J, Thomas CL. 1996. The use of streambed temperature profiles to estimate the depth, duration, and rate of percolation beneath
arroyos. Water Resources Research 32: 3597–3602.Constantz J, Stewart AE, Niswonger R, Sarma L. 2002. Analysis of temperature profiles for investigating stream losses beneath ephemeral
channels. Water Resources Research 38: 1316, DOI:10.1029/2001WR001221.Cook PG, Kilty S. 1992. A helicopter-borne electromagnetic survey to delineate groundwater recharge rates. Water Resources Research 28:
2953–2961.Cook PG, Walker GR, Jolly ID. 1989. Spatial variability of groundwater recharge in a semiarid region. Journal of Hydrology 111: 195–212.Cook PG, Edmunds WM, Gaye CB. 1992a. Estimating paleorecharge and paleoclimate from unsaturated zone profiles. Water Resources
Research 28: 2721–2731.Cook PG, Leaney FW, Jolly ID. 2001. Groundwater recharge in the Mallee Region, and salinity implications for the Murray River–A
Review. CSIRO Publishing: Australia; CSIRO Land and Water Technical Report 45/01, 133.Cook PG, Leaney FW, Miles M. 2004. Groundwater Recharge in the North-East Mallee Region, South Australia. CSIRO Publishing:
Australia; CSIRO Land and Water Technical Report No 25/04, 80.Cook PG, Jolly ID, Leaney FW, Walker GR. 1994. Unsaturated zone tritium and chlorine 36 profiles from southern Australia: Their use as
tracers of soil water movement. Water Resources Research 30: 1709–1719.Cook PG, Walker GR, Buselli G, Potts I, Dodds AR. 1992b. The application of electromagnetic techniques to groundwater recharge
investigations. Journal of Hydrology 130: 201–229.Darling WG, Edmunds WM, Kinniburgh DG, Kotoub S. 1987. Sources of Recharge to the Basal Nubian Sandstone Aquifer, Butana Region,
Sudan. IAEA: Vienna; 205–224.de Vries JJ, Selaolo ET, Beekman HE. 2000. Groundwater recharge in the Kalahari, with reference to paleo-hydrologic conditions. Journal
of Hydrology 238: 110–123.Diechmann U, Eklundh L. 1991. Global digital datasets for land degradation studies: a GIS approach. United Nations Environment
Program/Global Resource Information Database, GRID Case Study Series No. 4 , UNEP/GEMS and GRID: Nairobi, Kenya.Dincer T, Al-Mugrin A, Zimmermann U. 1974. Study of the infiltration and recharge through the sand dunes in arid zones with special
reference to stable isotopes and thermonuclear tritium. Journal of Hydrology 23: 79–109.Doll P, Kaspar F, Lehner B. 2003. A global hydrological model for deriving water availability indicators: model tuning and validation.
GROUNDWATER RECHARGE IN SEMIARID AND ARID REGIONS 3367
Dregne HE. 1991. Global status of desertification. Annals of Arid Zone 30: 179–185.Edmunds WM. 2001. Investigation of the unsaturated zone in semi-arid regions using isotopic and chemical methods and applications to
water resource problems. In Isotope Based Assessment of Groundwater Renewal in Water Scarce Regions , IAEA-Tecdoc-1246, Yurtsever Y(ed.). IAEA: Vienna; 7–22.
Edmunds WM, Gaye CB. 1994. Estimating the variability of groundwater recharge in the Sahel using chloride. Journal of Hydrology 156:47–59.
Edmunds WM, Tyler SC. 2002. Unsaturated zones as archives of past climates: toward a new proxy for continental regions. HydrogeologyJournal 10: 216–228.
Edmunds WM, Wright EP. 1979. Groundwater recharge and paleoclimate in the Sirte and Kufra Basins, Libya. Journal of Hydrology 40:215–241.
Edmunds WM, Darling WG, Kinniburgh DG. 1988. Solute profile techniques for recharge estimation in semi-arid and arid terrain. InEstimation of Natural Groundwater Recharge, Simmers I (ed.). Reidel Publishing Co: Higham, MA; 139–157.
Edmunds WM, Fellman E, Goni IB. 1999. Lakes, groundwater and palaeohydrology in the Sahel of NE Nigeria: evidence from hydrogeo-chemistry. Journal of the Geological Society 156: 345–355.
Engel V, Jobbagy EG, Stieglitz M, Williams M, Jackson RB. 2005. Hydrological consequences of eucalyptus afforestation in the argentinepampas. Water Resources Research 41: DOI: 10.1029/2004WR003761.
Favreau G, Leduc C, Schroeter P. 2002a. Discussion–Reply to comment on ‘Long-term rise in a Sahelian water-table: the ContinentalTerminal in South-West Niger’ by Leduc, C., Favreau, G., Schroeter, P., 2001. Journal of Hydrology 243, 43–54. Journal of Hydrology255: 263–265.
Favreau G, Leduc C, Marlin C, Dray M, Taupin JD, Massault M, La Salle CL, Babic M. 2002b. Estimate of recharge of a rising water tablein semiarid Niger from H-3 and C-14 modeling. Ground Water 40: 144–151.
Fayer MJ, Gee GW, Rockhold ML, Freshley MD, Walters TB. 1996. Estimating recharge rates for a groundwater model using a GIS.Journal of Environmental Quality 25: 510–518.
Flint AL, Flint LE. 2000. Near surface infiltration monitoring using neutron moisture logging, Yucca Mountain, Nevada. In Vadose ZoneScience and Technology Solutions , Vol. 1, Looney BB, Falta RW (eds). Columbus, OH, 457–474.
Flint AL, Flint LE. Regional analysis of ground-water recharge. In Ground-Water Recharge in the Arid and Semiarid Southwest, USA. PartA. Overview and Regional Synthesis , Stonestrom DA, Leake SA (ed.). US Geological Survey Professional Paper: Reston, VA (in press) .
Flint AL, Flint LE, Hevesi JA, Blainey JB. 2004. Fundamental concepts of recharge in the Desert Southwest: a regional modeling perspective.In Groundwater Recharge in a Desert Environment: The Southwestern United States , Water Science and Applications Series , Vol. 9,Hogan JF, Phillips FM, Scanlon BR (ed.). American Geophysical Union: Washington, DC; 159–184.
Flint AL, Flint LE, Bodvarsson GS, Kwicklis EM, Fabryka-Martin JT. 2001. Evolution of the conceptual model of vadose zone hydrologyfor Yucca Mountain. Journal of Hydrology 247: 1–30.
Flint AL, Flint LE, Kwicklis EM, Fabryka-Martin JM, Bodvarsson GS. 2002. Estimating recharge at Yucca Mountain, Nevada, USA:comparison of methods. Hydrogeology Journal 10: 180–204.
Foley JA, Levis S, Costa MH, Cramer W, Pollard D. 2000. Incorporating dynamic vegetation cover within global climate models. EcologicalApplications 10: 1620–1632.
Foster S, Garduno H, Evans R, Olson D, Tian Y, Zhang W, Han Z. 2004. Quaternary aquifer of the North China plain—assessing andachieving groundwater resource sustainability. Hydrogeology Journal 12: 81–93.
Gaye CB, Edmunds WM. 1996. Groundwater recharge estimation using chloride, stable isotopes and tritium profiles in the sands ofnorthwestern Senegal. Environmental Geology 27: 246–251.
Gee GW, Wierenga PJ, Andraski BJ, Young MH, Fayer MJ, Rockhold ML. 1994. Variations in water balance and recharge potential at threewestern desert sites. Soil Science Society of America Journal 58: 63–71.
George RJ, Nulsen RA, Ferdowsian R, Raper GP. 1999. Interactions between trees and groundwaters in recharge and discharge areas–Asurvey of Western Australian sites. Agricultural Water Management 39: 91–113.
Gieske ASM, Selaolo ET, Beekman HE. 1995. Tracer interpretation of moisture transport in a Kalahari sand profile. In Application ofTracers in Arid Zone Hydrology , IAHS Publication 232, Adar EM, Leibundgut C (eds). IAHS: Vienna; 373–382.
Goodrich DC, Williams DG, Unkrich CL, Hogan JF, Scott RL, Hultine KR, Pool D, Coes AL, Miller S. 2004. Comparison of methods toestimate ephemeral channel recharge, Walnut Gulch, San Pedro River Basin, Arizona. In Groundwater Recharge in a Desert Environment:The Southwestern United States , Water Science and Applications Series , Vol. 9, edited by Hogan JF, Phillips FM, Scanlon BR, AmericanGeophysical Union: Washington, DC; 77–99.
Guendouz A, Moulla AS, Edmunds WM, Zouari K, Shand P, Mamou A. 2003. Hydrogeochemical and isotopic evolution of water in theComplexe Terminal aquifer in the Algerian Sahara. Hydrogeology Journal 11: 483–495.
Halm D, Gaiser T, Stahr K. 2002. Seepage and groundwater recharge in sandy soils of the semi-arid region of Picos, Northeast Brazil.Neues Jahrbuch Fur Geologie Und Palaontologie-Abhandlungen 225: 85–101.
Hanson RT, Newhouse MW, Dettinger MD. 2004. A methodology to assess relations between climatic variability and variations in hydrologictime series in the southwestern United States. Journal of Hydrology 287: 252–269.
Harrington GA, Cook PG, Herczeg AL. 2002. Spatial and temporal variability of ground water recharge in central Australia: A tracerapproach. Ground Water 40: 518–527.
Heilweil VM, Solomon DK. 2004. Millimeter- to kilometer-scale variations in vadose-zone bedrock solutes: implications for estimatingrecharge in arid settings. In Groundwater Recharge in a Desert Environment: The Southwestern United States , Hogan JF, Phillips FM,Scanlon BR (eds). American Geophysical Union: Washington, DC; 235–254.
Heilweil VM, Solomon DK, Gardner PM. 2006. Borehole environmental tracers for evaluating net infiltration and recharge through desertbedrock. Vadose Zone Journal 5: 98–120.
Hendrickx J, Walker G. 1997. Recharge from precipitation. In Recharge of Phreatic Aquifers in (Semi-) Arid Areas , Simmers I (ed.). A.A.Balkema: Rotterdam, The Netherlands; 19–98.
Herczeg AL, Dogramaci SS, Leaney FWJ. 2001. Origin of dissolved salts in a large, semi-arid groundwater system: Murray Basin, Australia.Marine and Freshwater Research 52: 41–52.
Herczeg AL, Leaney FWJ, Stadter MF, Allan GL, Fifield LK. 1997. Chemical and isotopic indicators of point-source recharge to a karstaquifer, South Australia. Journal of Hydrology 192: 271–299.
Hevesi JA, Flint AL, Flint LE. 2003. Simulation of net infiltration and potential recharge using a distributed-parameter watershed model of thedeath valley region, Nevada and California. US Geological Survey Water-Resources Investigations Report 03–4090, USGS: Sacramento,USA; 171.
Hogan JF, Phillips FM, Scanlon BR. 2004. Groundwater Recharge in a Desert Environment: The Southwestern United States: Water ScienceApplications Series , Vol. 9. American Geophysical Union: Washington, DC; 294.
Hutton JT. 1976. Chloride in rainwater in relation to distance from ocean. Search 7: 207–208.IAEA. 2001. Isotope Based Assessment of Groundwater Renewal in Water Scarce Regions , IAEA TecDoc 1246. IAEA: Vienna; 273.Izbicki JA. 2002. Geologic and hydrologic controls on the movement of water through a thick, heterogeneous unsaturated zone underlying
an intermittent stream in the western Mojave Desert, southern California. Water Resources Research 38: 1–14.Jin M, Zhang R, Sun L, Gao Y. 1999. Temporal and spatial soil water management: a case study in the Heilonggang region, PR China.
Agricultural Water Management 42: 173–187.Jin M, Liang X, Simmers I, Gao Y, Zhang R. 2000. Estimation of Groundwater Recharge Using Artificial Tritium Tracing . China Environ-
mental Science Press: Wuhan; 340–345.Jobbagy EG, Jackson RB. 2004. Groundwater use and salinization with grassland afforestation. Global Change Biology 10: 1299–1312.Kahya E, Dracup JA. 1994. The influences of type 1 El Nino and La Nina events on streamflows in the Pacific Southwest of the United
States. Journal of Climate 6: 965–976.Keese KE, Scanlon BR, Reedy RC. 2005. Assessing controls on diffuse groundwater recharge using unsaturated flow modeling. Water
Resources Research 41: W06010, DOI:06010Ð01029/02004WR003841.Kendy E, Zhang Y, Liu C, Wang J, Steenhuis T. 2004. Groundwater recharge from irrigated cropland in the North China plain: case study
of Luancheng County, Hebei Province, 1949–2000. Hydrological Processes 18: 2289–2302.Kendy E, Gerard-Marchant P, Walter MT, Zhang Y, Liu C, Steenhuis TS. 2003. A soil-water-balance approach to quantify groundwater
recharge from irrigated cropland in the North China Plain. Hydrological Processes 17: 2011–2031.Kinzelbach W, Aeschbach W, Alberich C, Goni IB, Beyerle U, Brunner P, Chiang W-H, Rueedi J, Zoellman K. 2002. A Survey of Methods
for Groundwater Recharge in Arid and Semi-Arid Regions, Early Warning and Assessment Report Series, UNEP/DEWA/RS.02-2 . UnitedNations Environment Programme: Nairobi, ISBN 92-80702131-80702133.
Latta J, O’Leary GJ. 2003. Long-term comparison of rotation and fallow tillage systems of wheat in Australia. Field Crops Research 83:173–190.
Leaney FW, Allison GB. 1986. Carbon-14 and stable isotope data for an area in the Murray Basin: its use in estimating recharge. Journalof Hydrology 88: 129–145.
Leaney FW, Herczeg AL. 1995. Regional recharge to a karst aquifer estimated from chemical and isotopic composition of diffuse andlocalised recharge. Journal of Hydrology 164: 363–387.
Leduc C, Favreau G, Schroeter P. 2001. Long-term rise in a Sahelian water-table: the continental terminal in south-west Niger. Journal ofHydrology 243: 43–54.
Le Maitre DC, Scott DF, Colvin C. 1999. A review of information on interactions between vegetation and groundwater. Water Sa 25:137–152.
Lerner DN, Issar AS, Simmers I. 1990. Groundwater recharge, a guide to understanding and estimating natural recharge. InternationalAssociation of Hydrogeologists, Kenilworth, Rep 8, 345 pp.
Lins HF, Slack JR. 1999. Streamflow trends in the United States. Geophysical Research Letters 26: 227–230.Liu CM, Xia J. 2004. Water problems and hydrological research in the Yellow River and the Huai and Hai River basins of China. Hydrological
Processes 18: 2197–2210.Love AJ, Herczeg AL, Sampson L, Cresswell RG, Fifield LK. 2000. Sources of chloride and implications for 36Cl dating of old groundwater,
southwestern Great Artesian Basin, Australia. Water Resources Research 36: 1561–1574.Mahlknecht J, Schneider J, Merkel B, de Leon IN, Bernasconi S. 2004. Groundwater recharge in a sedimentary basin in semi-arid Mexico.
Hydrogeology Journal 12: 511–530.Manning AH, Solomon DK. 2004. Constraining mountain-block recharge to the eastern Salt Lake Valley, Utah with dissolved noble gas and
tritium data. In Groundwater Recharge in a Desert Environment: The Southwestern United States , Water Science and Applications Series ,Vol. 9, edited by Hogan JF, Phillips FM, Scanlon BR, American Geophysical Union: Washington, DC; 139–158.
Mantua NJ, Hare SR. 2002. The pacific decadal oscillation. Journal of Oceanography 58: 35–44.McCabe GJ, Dettinger MD. 1999. Decadal variations in the strength of ENSO teleconnections with precipitation in the western United
States. International Journal of Climatology 19: 1399–1410.McFarlane DJ, George RJ. 1992. Factors affecting dryland salinity on two wheatbelt catchments in Western Australia. Australian Journal
of Soil Research 30: 85–100.McMahon PB, Dennehy KF, Ellett KM, Sophocleous MA, Michel RL, Hurlbut DB. 2003. Water movement through thick unsaturated zones
overlying the central high plains aquifer, southwestern Kansas, 2000–2001. USGS Water Resources Investigations Report 03–4171, 35.McMahon PB, Dennehy KF, Bruce BW, Bohlke JK, Michel RL, Gurdak JJ, Hurlbut DB. 2006. Storage and transit time of chemicals in thick
unsaturated zones under rangeland and irrigated cropland, High Plains, USA. Water Resources Research 42: DOI: 10.1029/2005WR004417.Myneni RB, Los SO, Tucker CJ. 1996. Satellite-based identification of linked vegetation index and sea surface temperature anomaly areas
from 1982–1990 for Africa, Australia and South America. Geophysical Research Letters 23: 729–732.Nativ R, Adar E, Dahan O, Geyh M. 1995. Water recharge and solute transport through the vadose zone of fractured chalk under desert
GROUNDWATER RECHARGE IN SEMIARID AND ARID REGIONS 3369
Navada SV, Nair AR, Sinha UK, Kulkarni UP, Joseph TB. 2001. Application of isotopes and chemistry in unsaturated zone in arid areas ofRajasthan, India. In Isotope Based Assessment of Groundwater Renewal in Water Scarce Regions , IAEA-Tecdoc-1246, Yurtsever Y (ed.).IAEA: Vienna; 119–130.
Newman BD, Campbell AR, Wilcox BP. 1997. Tracer-based studies of soil water movement in semi-arid forests of New Mexico. Journalof Hydrology 196: 251–270.
Nimmo JR, Deason JA, Izbicki JA. 2002. Evaluation of unsaturated zone water fluxes in heterogeneous alluvium at a Mojave Basin site.Water Resources Research 38: 1215, DOI:1210Ð1029/2001WR000735.
O’Connell MG, O’Learey GJ, Connor DJ. 2003. Drainage and change in soil water storage below the root-zone under long fallow andcontinuous cropping sequences in the Victorian Mallee. Hydrological Processes 54: 663–675.
O’Connor TG. 1985. A synthesis of field experiments concerning the grass layer in the savanna regions of southern Africa. Report No 114.South African National Scientific Programmes, Foundation for Research Development: Pretoria.
Pachur HJ, Kropelin S. 1987. Wadi Howar–Paleoclimatic evidence from an extinct river system in the Southeastern Sahara. Science 237:298–300.
Phillips FM. 1994. Environmental tracers for water movement in desert soils of the American Southwest. Soil Science Society of AmericaJournal 58: 14–24.
Phillips FM, Mattick JL, Duval TA. 1988. Chlorine 36 and tritium from nuclear weapons fallout as tracers for long-term liquid movementin desert soils. Water Resources Research 24: 1877–1891.
Piechota TC, Chiew FHS, Dracup JA, McMahon TA. 1998. Seasonal streamflow forecasting in eastern Australia and the El Nino Southernoscillation. Water Resources Research 34: 3035–3044.
Pool DR. 2005. Variations in climate and ephemeral channel recharge in southeastern Arizona, United States. Water Resources Research41(11): W11403. DOI:10Ð1029/2004WR003255.
Prudic DE. 1994. Estimates of percolation rates and ages of water in unsaturated sediments at two Mojave Desert sites, California-Nevada.US Geological Survey Water Resources Investigations Report 94–4160, 19.
Prych EA. 1998. Using chloride and chlorine-36 as soil-water tracers to estimate deep percolation at selected locations on the US Departmentof Energy Hanford Site. Water Supply Paper 2481. US Geological Survey: Washington, DC; 67.
Rangarajan R, Athavale RN. 2000. Annual replenishable ground water potential of India–an estimate based on injected tritium studies.Journal of Hydrology 234: 35–83.
Redmond KT, Koch RW. 1991. Surface climate and streamflow variability in the western United States and their relationship to large-scalecirculation indices. Water Resources Research 27: 2381–2399.
Roark DM, Healy DF. 1998. Quantification of deep percolation from two flood-irrigated alfalfa fields, Roswell Basin, New Mexico. USGSWater Resources Investigations Report 98–4096, 32.
Ropelewski CF, Halpert MS. 1987. Global and regional precipitation patterns associated with El-Nino Southern Oscillation. Monthly WeatherReview 115: 1606–1626.
Ruifen L, Keqin W. 2001. Environmental isotope profiles of the soil water in loess unsaturated zone in semi-arid areas of China. In IsotopeBased Assessment of Groundwater Renewal in Water Scarce Regions , IAEA Tecdoc-1246, Yurtsever Y (ed.). IAEA: Vienna, 101–118.
Sadras VO, Roget DK. 2004. Production and environmental aspects of cropping intensification in a semiarid environment of southeasternAustralia. Agronomy Journal 96: 236–246.
Salama R, Hatton T, Dawes WR. 1999. Predicting land use impacts on regional scale groundwater recharge and discharge. Journal ofEnvironmental Quality 28: 446–460.
Salama R, Farrington P, Bartle G, Watson G. 1993. Salinity trends in the wheatbelt of Western Australia: results of water and salt balancestudies from Cuballing catchment. Journal of Hydrology 145: 41–63.
Sami K, Hughes DA. 1996. A comparison of recharge estimates to a fractured sedimentary aquifer in South Africa from a chloride massbalance and an integrated surface-subsurface model. Journal of Hydrology 179: 111–136.
Sanford WE, Wood WW. 2001. Hydrology of the coastal sabkhas of Abu Dhabi, United Arab Emirates. Hydrogeology Journal 9: 358–366.Sanford WE, Plummer LN, McAda DP, Bexfield LM, Anderholm SK. 2004. Hydrochemical tracers in the Middle Rio Grande Basin, USA:
2. Calibration of a ground-water flow model. Hydrogeology Journal 12: 389–407.Scanlon BR. 1991. Evaluation of moisture flux from chloride data in desert soils. Journal of Hydrology 128: 137–156.Scanlon BR. 1992. Evaluation of liquid and vapor flow in desert soils based on chlorine-36 and tritium tracers and nonisothermal flow
simulations. Water Resources Research 28: 285–297.Scanlon BR. 1996. Unsaturated-zone characterization for low-level radioactive waste disposal in Texas. Geotimes 41: 22–25.Scanlon BR. 2000. Uncertainties in estimating water fluxes and residence times using environmental tracers in an arid unsaturated zone.
Water Resources Research 36: 395–409.Scanlon BR, Cook PG. 2002. Preface: Theme issue on groundwater recharge. Hydrogeology Journal 10: 3–4.Scanlon BR, Goldsmith RS. 1997. Field study of spatial variability in unsaturated flow beneath and adjacent to playas. Water Resources
Research 33: 2239–2252.Scanlon BR, Langford RP, Goldsmith RS. 1999. Relationship between geomorphic settings and unsaturated flow in an arid setting. Water
Resources Research 35: 983–999.Scanlon BR, Goldsmith RS, Langford RP. 2000. Relationship between arid geomorphic settings and unsaturated zone flow: case study,
Chihuahuan Desert, Texas. Bureau of Economic Geology Report of Investigations No. 261. University Texas Austin: Austin, TX; 133.Scanlon BR, Healy RW, Cook PG. 2002. Choosing appropriate techniques for quantifying groundwater recharge. Hydrogeology Journal 10:
18–39.Scanlon BR, Keese K, Reedy RC, Simunek J, Andraski BJ. 2003. Variations in flow and transport in thick desert vadose zones in
response to paleoclimatic forcing (0–90 kyr): field measurements, modeling, and uncertainties. Water Resources Research 39: 1179,DOI:1110Ð1029/2002WR001604.
Scanlon BR, Levitt DG, Keese KE, Reedy RC, Sully MJ. 2005a. Ecological controls on water-cycle response to climate variability in deserts.Proceedings of the National Academy of Sciences of the United States of America 102: 6033–6038.
Scanlon BR, Reedy RC, Stonestrom DA, Prudic DE, Dennehy KF. 2005b. Impact of land use and land cover change on groundwaterrecharge and quality in the southwestern USA. Global Change Biology 11: 1577–1593.
Selaolo ET. 1998. Tracer studies and groundwater recharge assessment in the eastern fringe of the Botswana Kalahari–The Letlhakeng-Botlhapatlou area. Ph.D. Thesis, Free University, Amsterdam, 229.
Selaolo ET, Beekman HE, Gieske ASM, de Vries JJ. 1996. Multiple tracer profiling in Botswana–GRES findings. In Groundwater RechargeEstimation in Southern Africa, UNESCO IHP Series No. 64 , Xu Y, Beekman HE (ed.). UNESCO: Paris; 33–50.
Sharma ML. 1989. Groundwater Recharge. A.A. Balkema: Rotterdam, 323.Simmers I. 1988. Estimation of Natural Groundwater Recharge. D. Reidel Publishing Co: Boston, MA; 510.Simpson HJ, Cane MA, Herczeg AL, Zebiak SE, Simpson JH. 1993. Annual river discharge in southeastern Australia related to El-Nino
Southern oscillation forecasts of sea-surface temperatures. Water Resources Research 29: 3671–3680.Smiles DE, Gardner WR, Shulz RK. 1995. Diffusion of tritium in arid disposal sites. Water Resources Research 31: 1483–1488.Sophocleous M. 1992. Groundwater recharge estimation and regionalization: the Great Bend Prairie of central Kansas and its recharge
statistics. Journal of Hydrology 137: 113–140.Stephens DB, Knowlton RJ. 1986. Soil water movement and recharge through sand at a semiarid site in New Mexico. Water Resources
Research 22: 881–889.Stonestrom DA, Leake SA. Ground-water recharge in the arid and semiarid southwest, USA. US Geological Survey Professional Paper . US
Geological Survey: Reston, VA (in press).Stonestrom DA, Prudic DE, Laczniak RJ, Akstin KC. 2004. Tectonic, climatic, and land-use controls on groundwater recharge in an arid
alluvial basin: Amargosa Desert, USA. In Groundwater Recharge in a Desert Environment: The Southwestern United States , Water Scienceand Applications Series , Vol. 9, American Geophysical Union: Washington, DC, 29–47.
Subyani AM. 2004. Use of chloride-mass balance and environmental isotopes for evaluation of groundwater recharge in the alluvial aquifer,Wadi Tharad, western Saudi Arabia. Environmental Geology 46: 741–749.
Subyani AM. 2005. Hydrochemical identification and salinity problem of ground-water in Wadi Yalamlam basin, Western Saudi Arabia.Journal of Arid Environments 60: 53–66.
Sukhija BS, Reddy DV, Nagabhushanam P, Hussain S. 2003. Recharge processes: piston flow vs preferential flow in semi-arid aquifers ofIndia. Hydrogeology Journal 11: 387–395.
Szilagyi J, Harvey FE, Ayers JF. 2005. Regional estimation of total recharge to ground water in Nebraska. Ground Water 43: 63–69.Tyler SW, Chapman JB, Conrad SH, Hammermeister DP, Blout DO, Miller JJ, Sully MJ, Ginanni JM. 1996. Soil-water flux in the southern
Great Basin, United States: temporal and spatial variations over the last 120,000 years. Water Resources Research 32: 1481–1499.Tyler SW, McKay WA, Mihevc TM. 1992. Assessment of soil moisture movement in nuclear subsidence craters. Journal of Hydrology 139:
159–181.UNESCO. 1979. Map of the world distribution of arid regions. Man and Biosphere Tech Notes, no. 7, UNESCO: Paris; 54.US Census Bureau. 2004. Global Population Profile: 2002. International Population Reports WP/02. US Government Printing Office:
Washington, DC.van der Kamp G, Hayashi M, Gallen D. 2003. Comparing the hydrology of grassed and cultivated catchments in the semi-arid Canadian
prairies. Hydrological Processes 17: 559–575.Venencio MV. 2002. Climate variability and ground water resources. Sixth International Conference on Southern Hemisphere Meteorology
and Oceanog , Long Beach, CA, Feb. 2002, 142–144.Vogelmann JE, Howard SM, Yang L, Larson CR, Wylie BK, van Driel N. 2001. Completion of the 1990s national land cover data set for
the conterminous United States from Landsat Thematic Mapper data and ancillary data sources. Photogrammetric Engineering and RemoteSensing 67: 650–662.
Walker GR, Jolly ID, Cook PG. 1991. A new chloride leaching approach to the estimation of diffuse recharge following a change in landuse. Journal of Hydrology 128: 49–67.
Walvoord MA, Plummer MA, Phillips FM, Wolfsberg AV. 2002. Deep arid system hydrodynamics, 1, Equilibrium states and response timesin thick desert vadose zones. Water Resources Research 38: 1308, DOI: 1310.1029/2001WR000824.
Wang XP, Berndtsson R, Li XR, Kang ES. 2004a. Water balance change for a re-vegetated xerophyte shrub area. Hydrological SciencesJournal-Journal Des Sciences Hydrologiques 49: 283–295.
Wang XP, Brown-Mitic CM, Kang ES, Zhang JG, Li XR. 2004b. Evapotranspiration of Caragana korshinskii communities in a revegetateddesert area: Tengger Desert, China. Hydrological Processes 18: 3293–3303.
WHO. 2003. Right to Water . Health and Human Rights Publication Series No. 3, World Health Organization: Geneva, Switzerland; 44.Wilson JL, Guan H. 2004. Mountain block hydrology and mountain front recharge. In Groundwater Recharge in a Desert Environment:
The Southwestern United States , Water Science and Applications Series , Vol. 9, edited by Hogan JF, Phillips FM, Scanlon BR. AmericanGeophysical Union: Washington, DC; 113–137.
Wood WW, Sanford WE. 1995. Chemical and isotopic methods for quantifying ground-water recharge in a regional, semiarid environment.Ground Water 33: 458–468.
Zhang L, Walker GR (eds). 1998. The Basics of Recharge and Discharge, CSIRO Publishing: Collingwood.Zhang L, Dawes WR, Hatton TJ, Reece PH, Beale GTH, Packer I. 1999. Estimation of soil moisture and groundwater recharge using the
TOPOG IRM model. Water Resources Research 35: 149–161.Zhu C. 2000. Estimate of recharge from radiocarbon dating of groundwater and numerical flow and transport modeling. Water Resources