27
Global Warming and Climate Sensitivity Professor Dennis L. Hartmann Department of Atmospheric Sciences University of Washington Seattle, Washington
| Date post: | 18-Dec-2015 |
| Category: |
Documents |
| Upload: | albert-thornton |
| View: | 221 times |
| Download: | 2 times |
Global Warming and
Climate Sensitivity
Professor Dennis L. Hartmann
Department of Atmospheric Sciences
University of Washington
Seattle, Washington
Two approaches to understanding climate change.
• Top Down Approach - Take observed climate record and attempt to extrapolate intelligently into the future.
• Bottom Up Approach - Attempt to understand and model the critical climate processes, then use the resulting detailed model to predict how future climates might respond to specified forcing like CO2 increase.
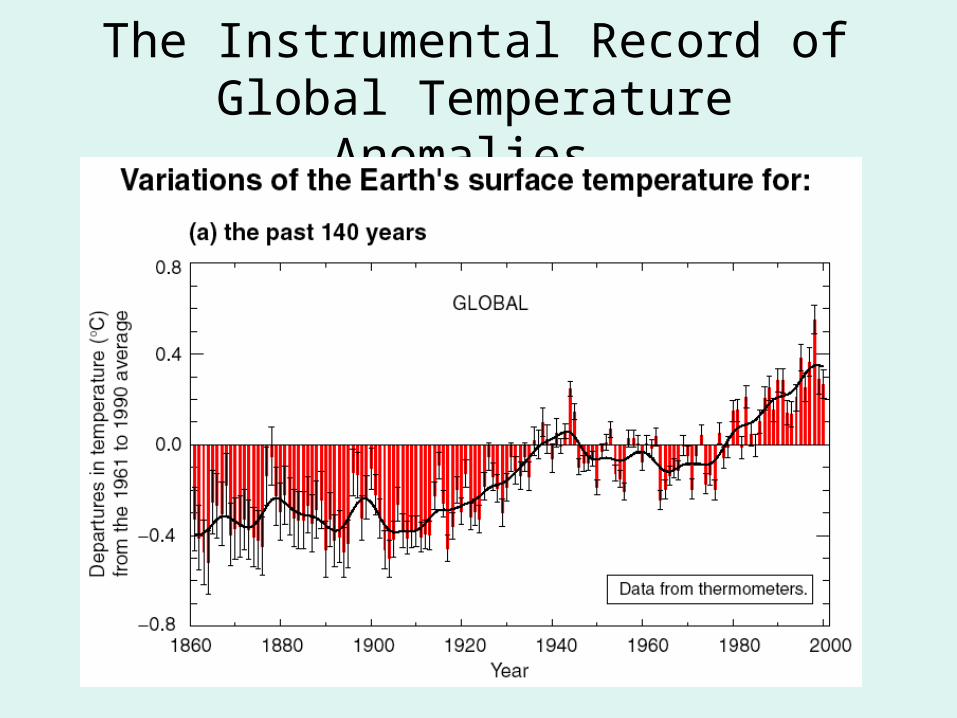
The Instrumental Record of Global Temperature Anomalies.
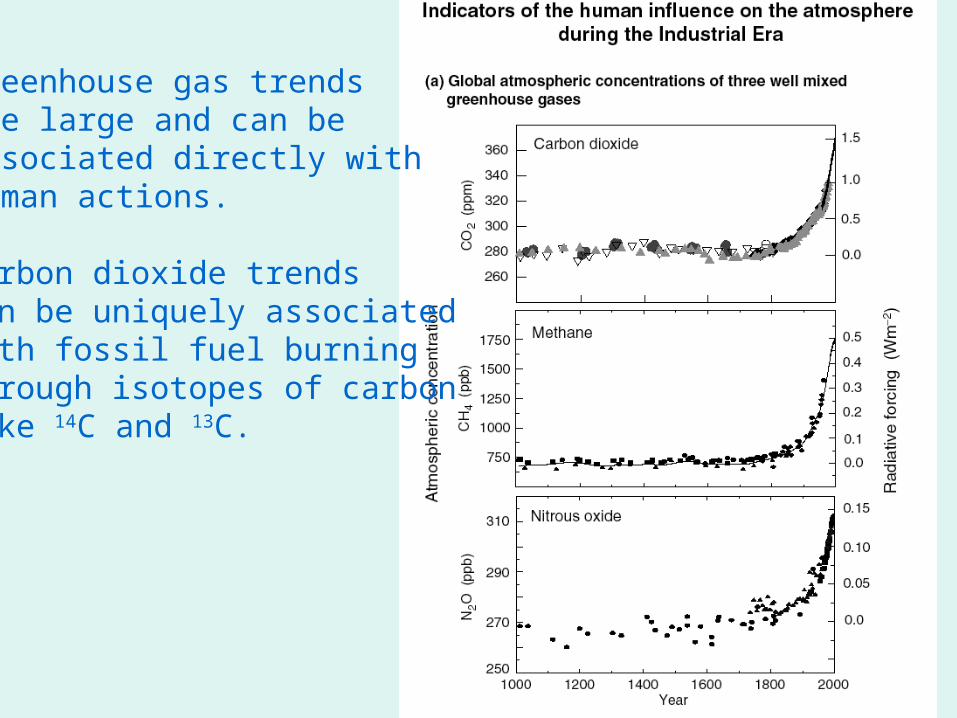
Greenhouse gas trendsare large and can be associated directly withhuman actions.
Carbon dioxide trendsCan be uniquely associatedwith fossil fuel burningthrough isotopes of carbonlike 14C and 13C.

IPCC - 2001
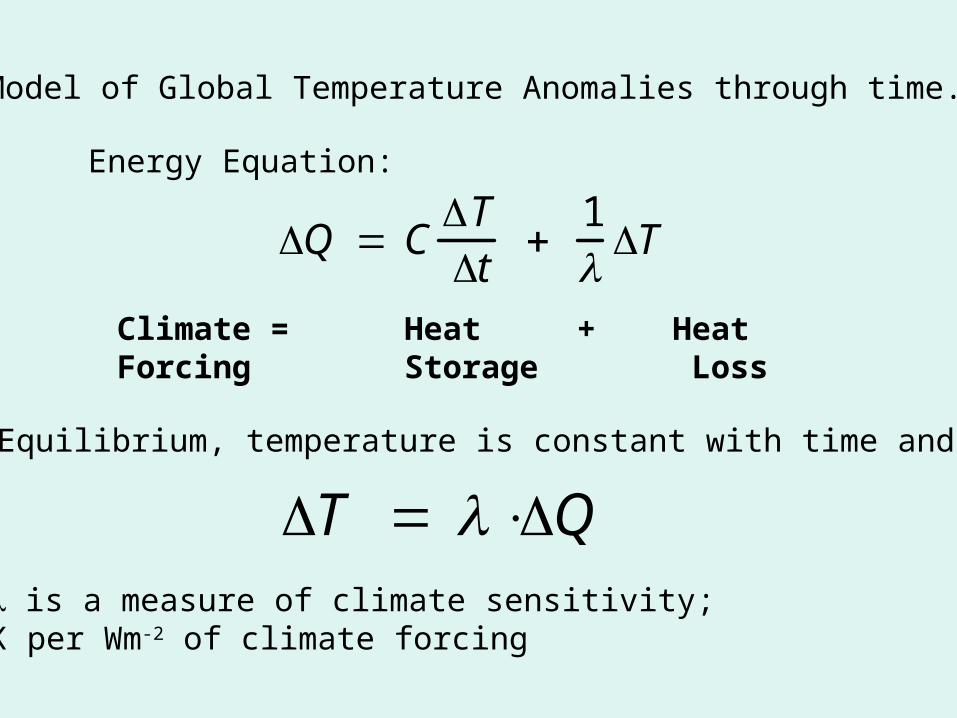
Model of Global Temperature Anomalies through time.
Q CTt
1
T
Energy Equation:
Climate = Heat + HeatForcing Storage Loss
In Equilibrium, temperature is constant with time and so,
is a measure of climate sensitivity; K per Wm-2 of climate forcing
T Q

To Project future climates byusing the observed record of climate over the past century, we need to know three thingsto interpret the temperature time series:
Q CTt
1
T
Climate Forcing = Q (Wm-2)
Heat capacity = C (J oK-1 m -2)
Climate sensitivity = (oK per Wm-2)

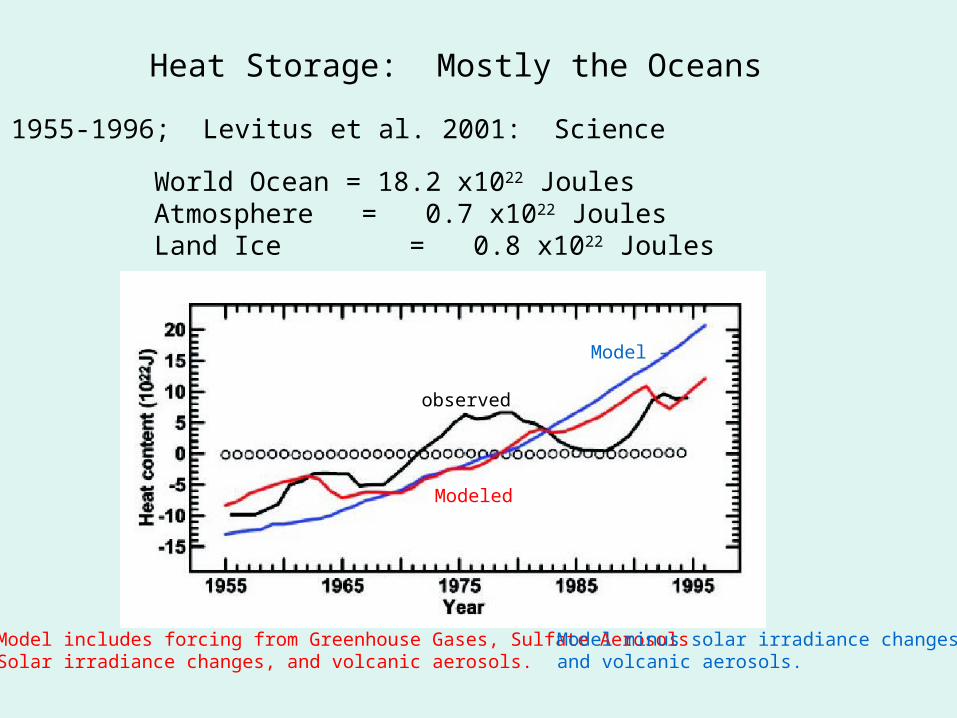
Heat Storage: Mostly the Oceans
1955-1996; Levitus et al. 2001: Science
World Ocean = 18.2 x10²² JoulesAtmosphere = 0.7 x10²² JoulesLand Ice = 0.8 x10²² Joules
observed
Modeled
Model includes forcing from Greenhouse Gases, Sulfate AerosolsSolar irradiance changes, and volcanic aerosols.
Model minus solar irradiance changesand volcanic aerosols.
Model -

Top-Down Approach:
Determine sensitivity of climatefrom observed record over past130 years. Use simple modelto extrapolate into future.
Problems: Need to know:
No two of these are known with enough precision to usefully constrain uncertainty in the third, with the data available, although it is possible to fit the observations with fair precision using even a simple model.
• Climate forcing - uncertain, especially solar and aerosol forcing.
• Heat storage - somewhat uncertain.
• Climate sensitivity - also uncertain.
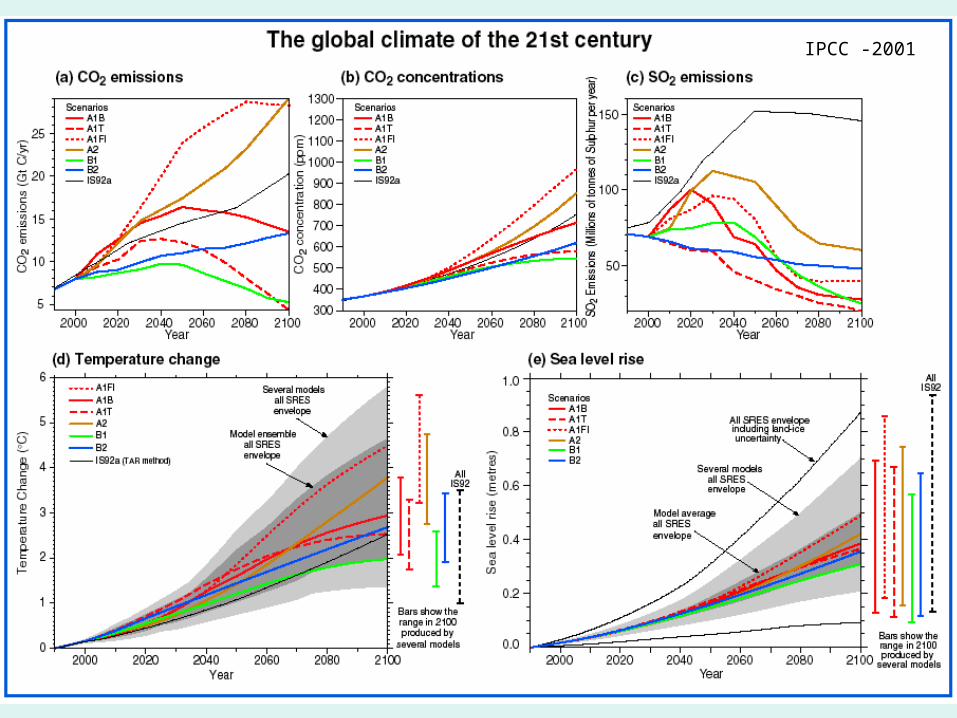
IPCC -2001

IPCC 2001
1850-2000 ~0.6oC Warming; 0.4oC per century
*mostly warming from CO2 already in atmosphere
2000-2030 ~0.6oC Warming; 2.0oC per century*

IPCC - 2001 Predictions for the year 2100
1.4oC < T < 5.8oC
Between 1990 and 2100 global mean surface temperature will increase by
This large range of uncertainty arises in equal measure from two principle sources:
• Uncertainty about how much climate forcing humans will do, principally through fossil fuel consumption. (Depends on political decisions, economic events, technical innovation and diffusion.)
• Uncertainty about how the climate system will respond to climate forcing by humans - Climate Sensitivity. (Depends on natural processes.)

Bottom-up approach
Understand and model keyphysical processes that affectclimate sensitivity.i.e. Feedback Processes
• Water vapor feedback• Cloud feedback
• Ice-albedo feedback
• Many more

Water Vapor Feedback:
• Water vapor is the most important greenhouse gas controlling the relationship between surface temperature and infrared energy emitted from Earth.
• Saturation vapor pressure increases about 20% for each 1% change in temperature (3 oC).
• Therefore, assuming that the relative humidity remains about constant, the strength of the greenhouse effect will increase with surface temperature.
0
10
20
30
40
50
60
70
80
-30 -20 -10 0 10 20 30 40
Saturation Vapor Pressure (hPa)
Sa
tura
tion
Va
po
r P
ress
ure
(h
Pa
)
Temperature (ÞC)

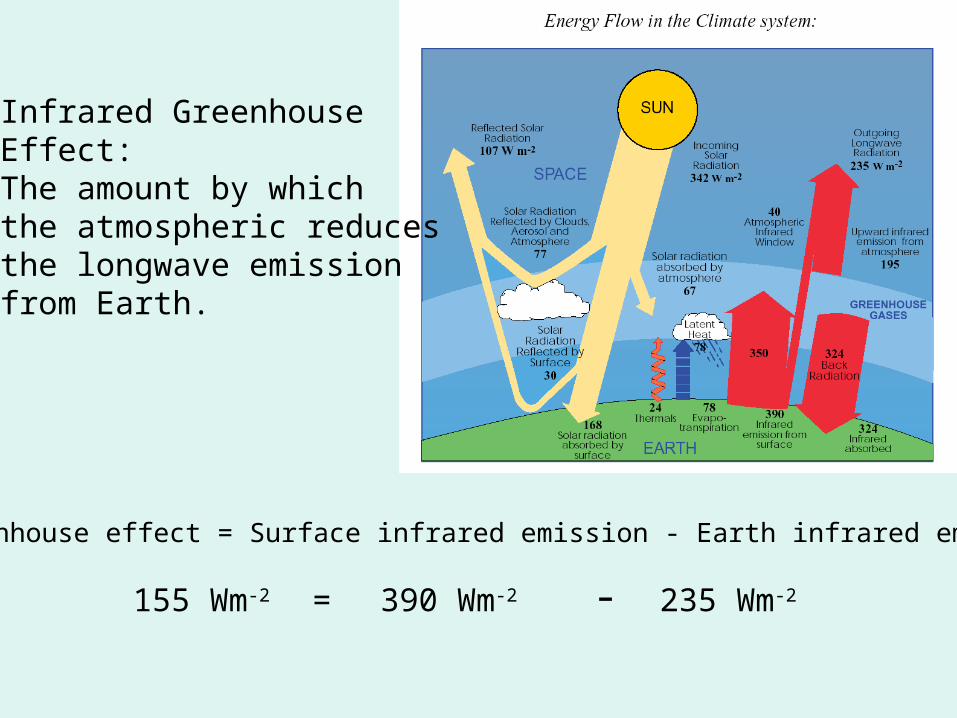
Infrared GreenhouseEffect:The amount by which the atmospheric reduces the longwave emission from Earth.
Greenhouse effect = Surface infrared emission - Earth infrared emission
= 390 Wm-2 235 Wm-2-155 Wm-2

Greenhouse effect = Surface longwave emission - Earth emission

To a first approximation,the clear-sky greenhouseeffect is proportional to the surface temperature.
Greenhouse Effect Ts4 Earth Emission
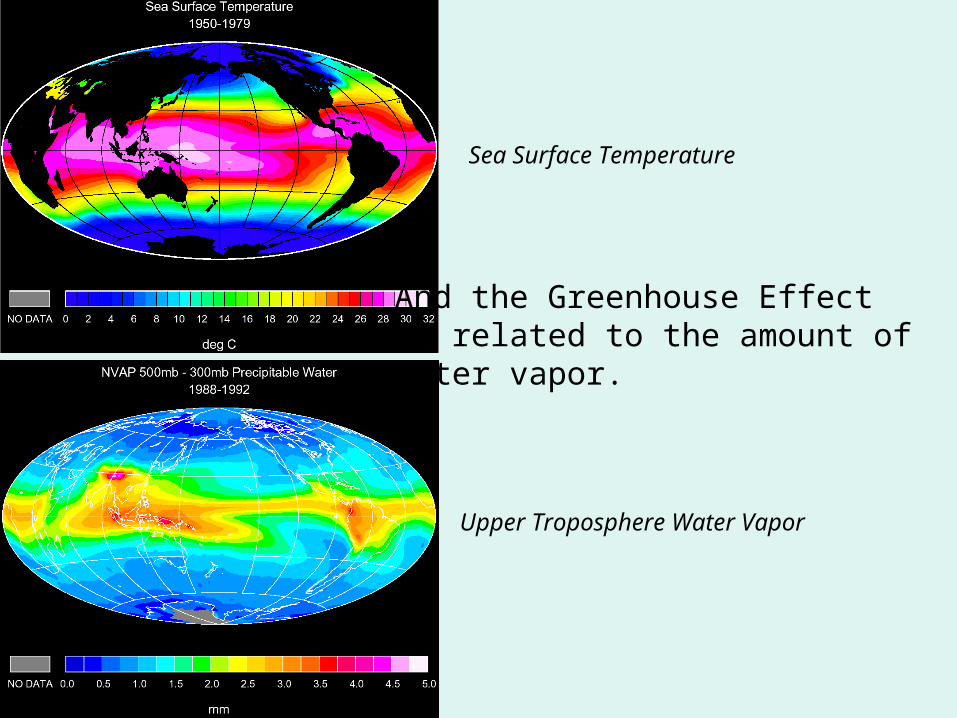
Sea Surface Temperature
Sea Surface Temperature
Upper Troposphere Water Vapor
And the Greenhouse Effectis related to the amount of water vapor.

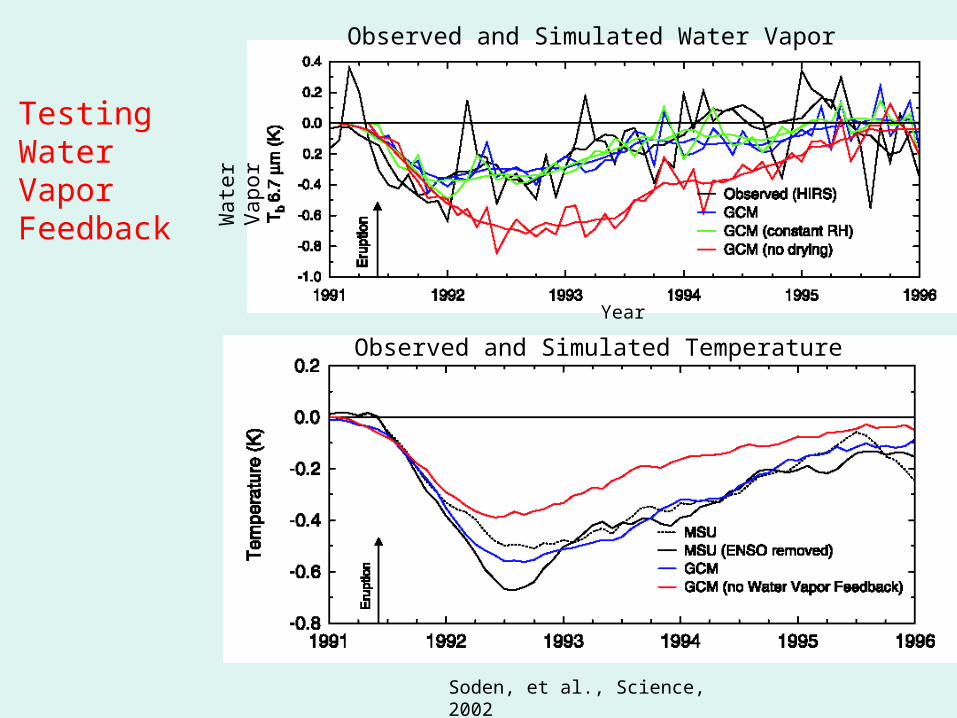
Mount Pinatubo EruptionAs a test of Water Vapor FeedbackSoden, et al., Science, 26 April 2002
PhilippinesJune 1991
Year
Wat
er V
apor
Observed and Simulated Water Vapor
Observed and Simulated Temperature
Soden, et al., Science, 2002
TestingWaterVaporFeedback

Water Vapor Feedback
is a measure of climate sensitivity; oK per Wm-2 of climate forcing
T Q
o = for fixed absolute humidity = 0.25 oK/(Wm-2)
Effect on long-term response to doubled CO2
RH = for fixed relative humidity = 0.50 oK/(Wm-2)
(NRC, 1979, still good?)
Q2CO24Wm 2 gives
1.6C T 2.7C
RH 1 2.0 0.5Wm 2 K 1
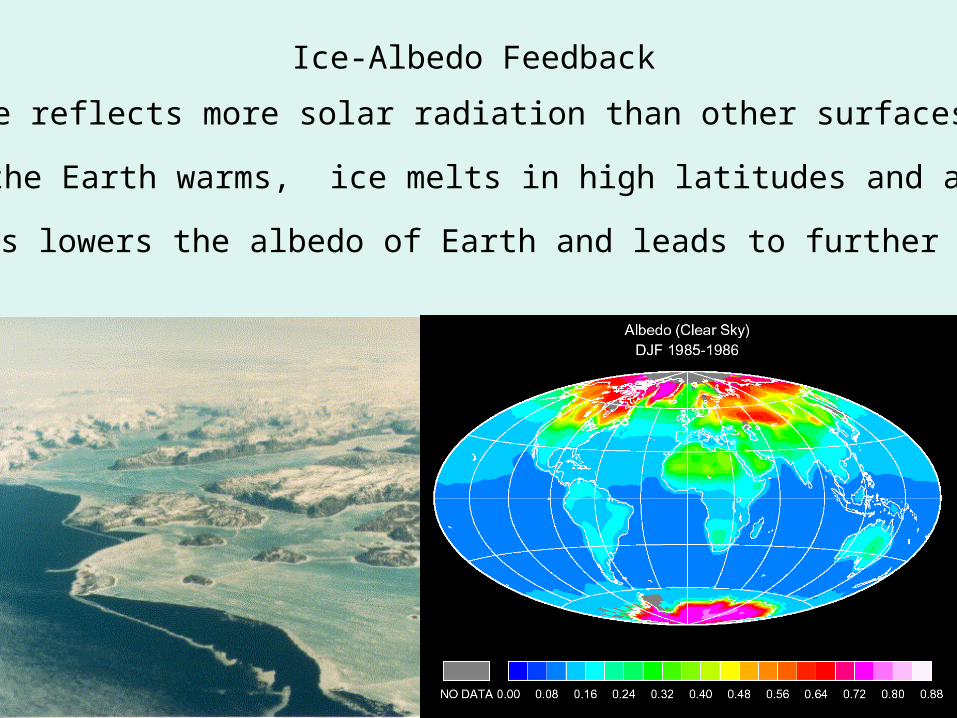
Ice-Albedo Feedback
• As the Earth warms, ice melts in high latitudes and altitudes
• This lowers the albedo of Earth and leads to further warming.
• Ice reflects more solar radiation than other surfaces

Add Ice-Albedo Feedback to Water Vapor Feedback
(NRC, 1979 still good)
Add these changes to the basic relative humidity feedback and get
Q2CO24Wm 2 now gives
as the uncertainty range for the long-term response to CO2 doubling.
IPCC - 2001gives
NRC - 1979 gave
ice 1 0.1 to 0.9 Wm 2 K 1
RH ice 1 0.6 to 2.4 Wm 2 K 1
1.7C T 6.7C
2.1C TRH ice 3.6C
1.5C T 4.5C
T 3.0 1.5 C
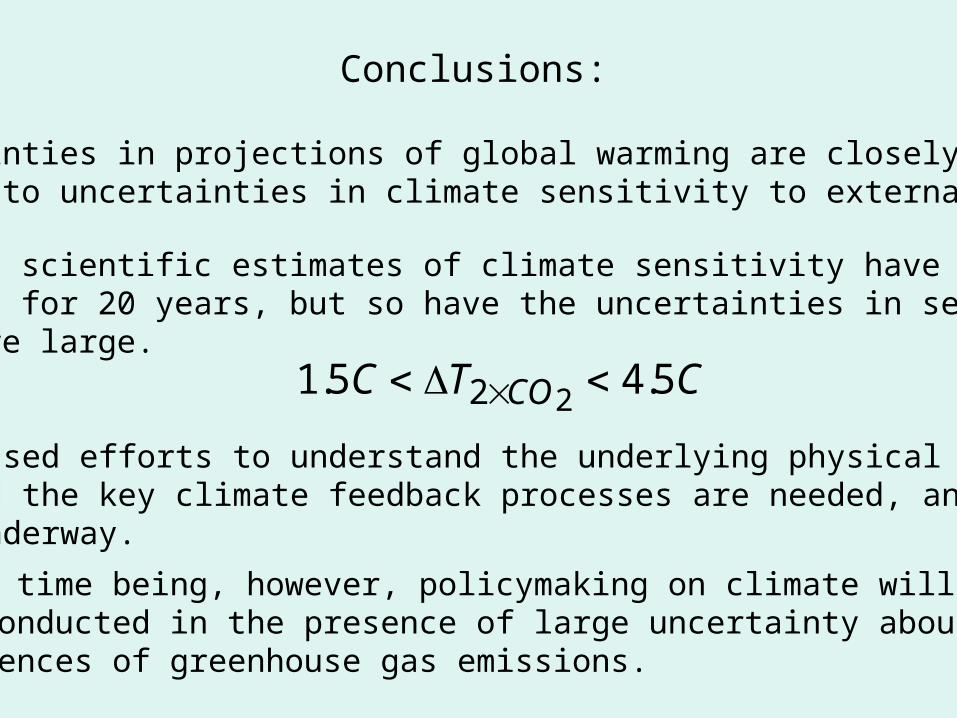
Conclusions:
• Uncertainties in projections of global warming are closely related to uncertainties in climate sensitivity to external forcing.
• Official scientific estimates of climate sensitivity have remained constant for 20 years, but so have the uncertainties in sensitivity, which are large.
• Increased efforts to understand the underlying physical processes behind the key climate feedback processes are needed, and many are underway.
• For the time being, however, policymaking on climate will need to be conducted in the presence of large uncertainty about the exact consequences of greenhouse gas emissions.
1.5C T2CO2 4.5C

Estimated Strength of Water Vapor Feedback
Earliest studies suggest that if the absolute humidity increasesin proportion to the saturation vapor pressure (constant relativehumidity), this will give rise to a water vapor feedback that willdouble the sensitivity of climate compared to an assumption of fixed absolute humidity.
Most observational and modeling studies have supported this conclusion.
0
10
20
30
40
50
60
70
80
-30 -20 -10 0 10 20 30 40
Saturation Vapor Pressure (hPa)
Sa
tura
tion
Va
po
r P
ress
ure
(h
Pa
)
Temperature (ÞC)


