Glycosylation profiling with mass spectrometry: method development and application to cancer biomarker studies Vreeker, G.C.M. Citation Vreeker, G. C. M. (2021, October 28). Glycosylation profiling with mass spectrometry: method development and application to cancer biomarker studies. Retrieved from https://hdl.handle.net/1887/3229692 Version: Publisher's Version License: Licence agreement concerning inclusion of doctoral thesis in the Institutional Repository of the University of Leiden Downloaded from: https://hdl.handle.net/1887/3229692 Note: To cite this publication please use the final published version (if applicable).
Transcript
Glycosylation profiling with mass spectrometry: methoddevelopment and application to cancer biomarker studiesVreeker, G.C.M.
CitationVreeker, G. C. M. (2021, October 28). Glycosylation profiling with massspectrometry: method development and application to cancer biomarkerstudies. Retrieved from https://hdl.handle.net/1887/3229692 Version: Publisher's Version
License:Licence agreement concerning inclusion of doctoralthesis in the Institutional Repository of the Universityof Leiden
Downloaded from: https://hdl.handle.net/1887/3229692 Note: To cite this publication please use the final published version (ifapplicable).
Based on:Vreeker, G.C.M.1,2, Vangangelt, K.M.H.1, Bladergroen, M.R.2, Nicolardi, S.1,2, Mesker, W.E.1, Wuhrer, M.2, Van der Burgt, Y.E.M.2, Tollenaar, R.A.E.M.1: Serum N-glycan profiles differ for various breast cancer subtypes. Glycoconj. J. (2021). doi:10.1007/s10719-021-10001-3. Supplemental info available.
1 Department of Surgery, Leiden University Medical Center, Leiden, The Netherlands
2 Center for Proteomics and Metabolomics, Leiden University Medical Center, Leiden, The Netherlands
Abstract
Breast cancer is the most prevalent cancer in women. Early detection of this disease improves survival and therefore population screenings, based on mammography, are performed. However, the sensitivity of this screening modality is not optimal and new screening methods, such as blood tests, are being explored. Most of the analyses that aim for early detection focus on proteins in the bloodstream. In this study, the biomarker potential of total serum N-glycosylation analysis was explored with regard to detection of breast cancer. In an age-matched case-control setup serum protein N-glycan profiles from 145 breast cancer patients were compared to those from 171 healthy individuals. N-glycans were enzymatically released, chemically derivatized to preserve linkage-specificity of sialic acids and characterized by high resolution mass spectrometry. Logistic regression analysis was used to evaluate associations of specific N-glycan structures as well as N-glycosylation traits with breast cancer. In a case-control comparison three associations were found, namely a lower level of a two triantennary glycans and a higher level of one tetraantennary glycan in cancer patients. Of note, various other N-glycomic signatures that had previously been reported were not replicated in the current cohort. It was further evaluated whether the lack of replication of breast cancer N-glycomic signatures could be partly explained by the heterogenous character of the disease since the studies performed so far were based on cohorts that included diverging subtypes in different numbers. It was found that serum N-glycan profiles differed for the various cancer subtypes that were analyzed in this study.
102
Chapter 6
Introduction
Worldwide 2,089,000 women were diagnosed with breast cancer with an estimated related death of 626,000 in 2018.1 Population-based breast cancer screening reduces mortality and is commonly performed with mammography.2 However, mammography-based screening can be improved with regard sensitivity and specificity levels. It is furthermore known that tumors in dense breast tissue are often missed in a mammogram and although outweighed by mortality reduction low energy X-ray imaging carries a risk of causing radiation-induced tumors.3
Available clinical biomarkers cancer antigen (CA) 15-3, 27-29 and 125 as well as carcinoembryonic antigen (CEA) are only of use to indicate treatment failure and are not recommended for screening, diagnosis, or staging purposes.4 Therefore, discovery of novel biomarkers with improved test performance is widely pursued to potentially provide an add-on diagnostic tool.⁵ Next to genomic markers, proteins that are present in the circulation have received great attention.6,7 Although a large number of mass spectrometry (MS)-based exploratory studies has resulted in breast cancer protein signatures, none of these findings has been translated into a laboratory test.⁸ As a consequence, biomarker strategies have been improved by properly defining the unmet clinical needs and by implementing protocols for standardized body fluid collection, high-throughput sample preparation and robust and precise MS-measurements.5,9–12
At the same time, MS-based proteomics studies demonstrated that post-translation modifications (PTMs) on proteins are often overlooked, although these modulate protein function and are thus an interesting source of functional biomarkers. One of the most, if not the most frequent PTMs is protein glycosylation.13–15 Changes in protein glycosylation may have influence on or may be caused by tumor growth, differentiation, metastasis, transformation, adhesion, pathogen recognition and immune surveillance.16,17 Protein glycosylation and its association with various cancers has been studied for more than half a century, but recent developments have allowed glyco(proteo)mics strategies to join forces with high-throughput cancer proteomics efforts to determine glycomic phenotypes and improve our understanding of the pathophysiology of various cancers.18–24 For example, large-scale glycosylation biomarker studies based on for example immunoglobulin glycosylation and total serum N-glycome (TSNG) have reported changes upon cancer treatment and associations with survival.25,26 Moreover, aberrant glycosylation profiles have been found on the surface of cancer cells with potentially diagnostic value towards evaluating tumor progression.27,28 Breast cancer biomarker signatures have been pursued by analysis of N-glycan profiles in blood-derived or other body fluid samples using ultrahigh performance liquid chromatography (UPLC) methods
103
Serum N-Glycan Profiles Differ for Various Breast Cancer Subtypes
combined with MS identification or detection of fluorescent labels.29–36 These studies reported associations with cancer or treatment regimes, but interestingly did not always corroborate previous findings. In this study we report TSNG profiles from an in-house collected breast cancer cohort and compare our results with the aforementioned reports. Our sample cohort consists of 145 breast cancer patients that are age-matched with 171 healthy control individuals. N-glycan analysis includes linkage-specific derivatization of α2,3- and α2,6-linked sialic acids and MS-profiles are obtained using a matrix-assisted laser desorption/ionization Fourier Transform ion cyclotron resonance (MALDI-FT-ICR) platform. The potential of N-glycan profiles for diagnosis or staging of breast cancer is evaluated.
104
Chapter 6
Materials and methods
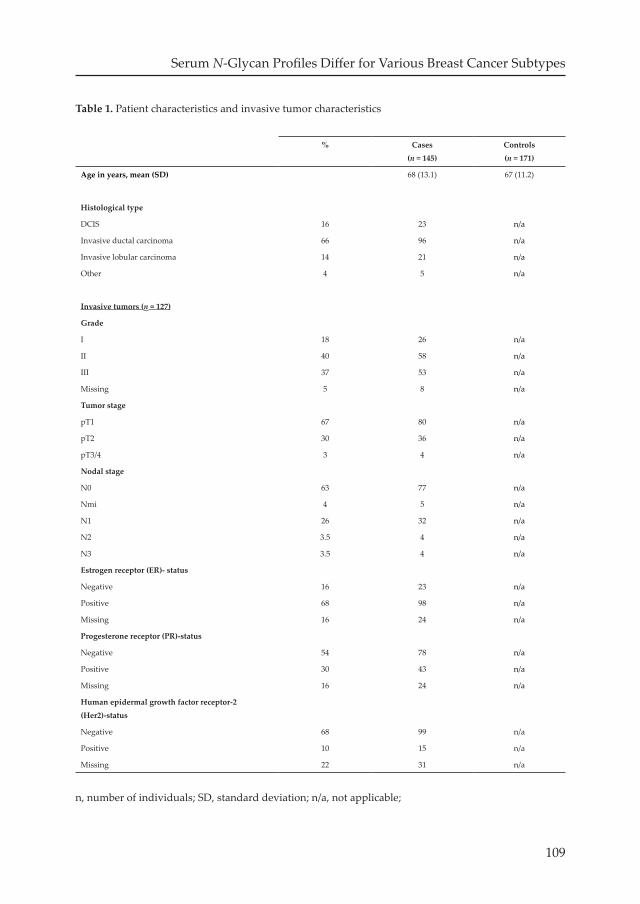
PatientsSerum samples of 159 female patients with breast cancer and 173 female healthy volunteers were collected at the outpatients clinic at Leiden University Medical Center prior to any treatment between 2002 and 2013. The samples of the controls were matched to the cases based on age and date of sample collection. Criteria for case exclusion were; a history of cancer (other than basal cell carcinoma or cervical carcinoma in situ) shorter than 10 years before blood sampling and breast cancer in medical history. From the controls only date of birth was recorded. Table 1 provides an overview of patient characteristics and information on the invasive cancer cases (i.e. excluding ductal carcinoma in situ (DCIS). Written informed consent was obtained from patients and healthy volunteers prior to sample collection. The study was approved by the Medical Ethical Committee of the LUMC.
Serum sample collectionBlood specimens were collected and processed according to a standardized protocol. Blood was collected in a 8.5cc vacutainer serum separator tube and centrifuged for 10 min at 1000g. After centrifugation the serum was divided into 5 mL polystyrene tubes. Within 4 hours after blood collection the serum samples were stored at -80 °C. The samples underwent one freeze-thaw cycle for aliquoting in eight 60-µl tubes. All serum samples were randomly distributed in six 96-well plates, along with plasma standards (Visucon-F frozen normal control plasma, pooled from 20 human donors, citrated and buffered with 0.02 M HEPES, Affinity Biologicals, Ancaster, ON, Canada) as technical quality control samples and blanks.
ChemicalsNonidet P-40 substitute (NP-40), potassium dihydrogenphosphate (KH₂PO₄), disodium hydrogen phosphate dihydrate (Na₂HPO₄ × 2 H₂O), sodium chloride (NaCl), 50% sodium hydroxide (NaOH), 1-hydroxybenzotriazole 97% (HOBt) and super-DHB (9:1 mixture of 2,5-dihydroxybenzoic acid and 2-hydroxy-5-methoxybenzoic acid, sDHB) were obtained from Sigma-Aldrich (Steinheim, Germany). Potassium hydroxide (KOH), sodium dodecyl sulfate (SDS), analytical grade ethanol and trifluoroacetic acid (TFA) were purchased from Merck (Darmstadt, Germany). HPLC-grade acetonitrile (ACN) was purchased from Biosolve (Valkenswaard, The Netherlands) and 1-ethyl-3-(3-(dimethylamino)propyl)carbodiimide (EDC) hydrochloride was obtained from Fluorochem (Hadfield, UK). Recombinant peptide-N-glycosidase F (PNGase F) was purchased from Roche Diagnostics (Mannheim, Germany). From a Millipore Q-Gard 2 system (Amsterdam, The Netherlands)
105
Serum N-Glycan Profiles Differ for Various Breast Cancer Subtypes
maintained at ≥18 MΩ milli-Q water (MQ) was generated.
Sample preparation and MALDI-FTICR-MS measurementEnzymatic N-glycan release was performed as previously described.37 In short, 6 µL sample was added to 12 µL 2% SDS and incubated for 10 min at 60 °C. After incubation 12.6 µL release mixture (6 µL 4% NP40, 6 µL 5× PBS and 0.6 µL PNGase F) was added and the samples were incubated overnight at 37 °C. The samples were stored at -20 °C before further preparation. Ethyl esterification was performed for linkage specific stabilization of the sialic acid moieties of the glycans.38 One microliter of released glycan sample was added to 20 µL of ethyl esterification reagent (0.25 M EDC 0.25 M HOBt in pure ethanol) and incubated for one hour at 37 °C. Subsequently 20 µL ACN was added. Glycan purification was performed using cotton HILIC SPE microtips.38,39
These HILIC tips were prewetted with three times 20 µL MQ and conditioned with three times 20 µL 85% ACN. Next, the sample was pipetted up and down 20 times in the HILIC tip. The HILIC phase was first washed three times with 20 µL 85% ACN with 1% TFA and second three times with 20 µL 85% ACN. Elution was performed by pipetting 10 µL MQ five times up and down. Two microliters of sample was spotted with 1 µL matrix (5 mg/mL sDHB in 50% ACN with 1 mM NaOH) onto a MALDI target (800/384 MTP AnchorChip, Bruker Daltonics, Bremen, Germany) and the spots were allowed to dry. MALDI-FTICR-MS experiments were performed as described before.40 A Bruker 15T solariX XR FTICR MS (Bruker Daltonics) recorded the spectra in the m/z-range from 1011.86 to 5000.00, with 1M data points. The obtained average spectra contained ten acquired scans. The system was operated by ftmsControl (version 2.1.0) software.
Data preprocessing, batch correction and statisticsSerum N-glycosylation profiles were obtained for 159 breast cancer patient samples and 173 healthy volunteer samples, of which respectively 145 and 171 spectra passed the quality criteria.40 The analyte list consisted of 101 analytes which passed the quality criteria (Supporting information Table S-1). The areas of the signals were extracted using MassyTools (version 0.1.8.1). To correct for batch effects from the two MALDI-target batches (number of samples exceed the number of spots on a MALDI-target), the effect was estimated per analyte in a linear model and the values of these analytes were regressed on the MALDI-target batch (categorical variable). The standardized values were normalized to the sum of all analytes for relative quantification. Subsequently, derived traits were calculated (Supporting information Table S-2) and logistic regression was performed for each individual
106
Chapter 6
glycan and each derived trait using R version 3.3.2 (R Foundation for Statistical Computing, Vienna, Austria) and RStudio, version 1.0.136 (RStudio, Boston, MA; released 21 December 2016).41 The odds ratios (ORs) were calculated with their 95% confidence intervals (CIs) assuming a Student’s t-distribution and are referring to an increase of 1 SD in the tested traits. Multivariate (principal component) analysis was performed on both individual glycans and derived traits using the various clinical parameters of the breast cancer subtypes.
107
Serum N-Glycan Profiles Differ for Various Breast Cancer Subtypes
Results and discussion
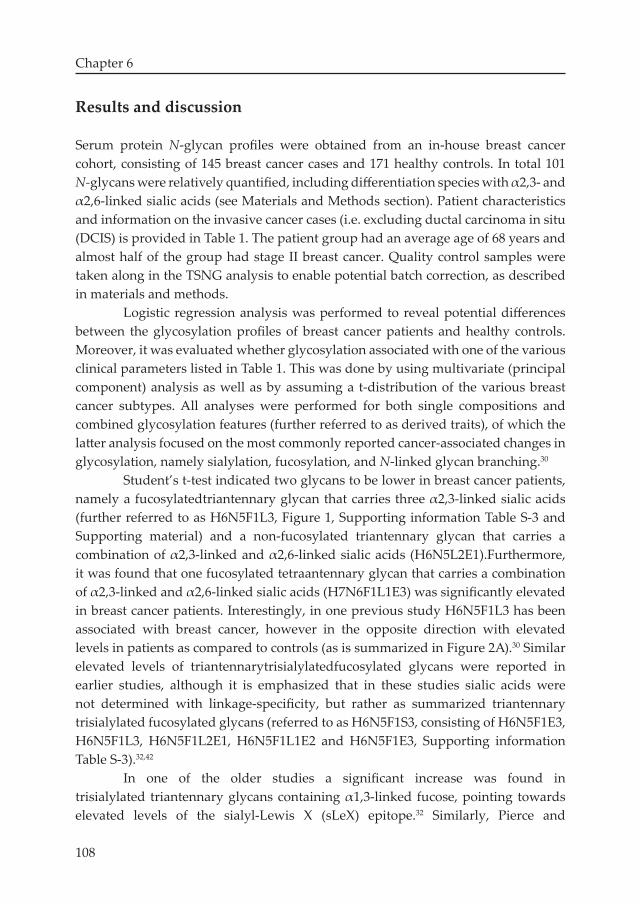
Serum protein N-glycan profiles were obtained from an in-house breast cancer cohort, consisting of 145 breast cancer cases and 171 healthy controls. In total 101 N-glycans were relatively quantified, including differentiation species with α2,3- and α2,6-linked sialic acids (see Materials and Methods section). Patient characteristics and information on the invasive cancer cases (i.e. excluding ductal carcinoma in situ (DCIS) is provided in Table 1. The patient group had an average age of 68 years and almost half of the group had stage II breast cancer. Quality control samples were taken along in the TSNG analysis to enable potential batch correction, as described in materials and methods. Logistic regression analysis was performed to reveal potential differences between the glycosylation profiles of breast cancer patients and healthy controls.Moreover, it was evaluated whether glycosylation associated with one of the various clinical parameters listed in Table 1. This was done by using multivariate (principal component) analysis as well as by assuming a t-distribution of the various breast cancer subtypes. All analyses were performed for both single compositions and combined glycosylation features (further referred to as derived traits), of which the latter analysis focused on the most commonly reported cancer-associated changes in glycosylation, namely sialylation, fucosylation, and N-linked glycan branching.30 Student’s t-test indicated two glycans to be lower in breast cancer patients, namely a fucosylatedtriantennary glycan that carries three α2,3-linked sialic acids (further referred to as H6N5F1L3, Figure 1, Supporting information Table S-3 and Supporting material) and a non-fucosylated triantennary glycan that carries a combination of α2,3-linked and α2,6-linked sialic acids (H6N5L2E1).Furthermore, it was found that one fucosylated tetraantennary glycan that carries a combination of α2,3-linked and α2,6-linked sialic acids (H7N6F1L1E3) was significantly elevated in breast cancer patients. Interestingly, in one previous study H6N5F1L3 has been associated with breast cancer, however in the opposite direction with elevated levels in patients as compared to controls (as is summarized in Figure 2A).30 Similar elevated levels of triantennarytrisialylatedfucosylated glycans were reported in earlier studies, although it is emphasized that in these studies sialic acids were not determined with linkage-specificity, but rather as summarized triantennary trisialylated fucosylated glycans (referred to as H6N5F1S3, consisting of H6N5F1E3, H6N5F1L3, H6N5F1L2E1, H6N5F1L1E2 and H6N5F1E3, Supporting information Table S-3).32,42
In one of the older studies a significant increase was found in trisialylated triantennary glycans containing α1,3-linked fucose, pointing towards elevated levels of the sialyl-Lewis X (sLeX) epitope.32 Similarly, Pierce and
108
Chapter 6
Table 1. Patient characteristics and invasive tumor characteristics
% Cases(n = 145)
Controls(n = 171)
Age in years, mean (SD) 68 (13.1) 67 (11.2)
Histological type
DCIS 16 23 n/a
Invasive ductal carcinoma 66 96 n/a
Invasive lobular carcinoma 14 21 n/a
Other 4 5 n/a
Invasive tumors (n = 127)
Grade
I 18 26 n/a
II 40 58 n/a
III 37 53 n/a
Missing 5 8 n/a
Tumor stage
pT1 67 80 n/a
pT2 30 36 n/a
pT3/4 3 4 n/a
Nodal stage
N0 63 77 n/a
Nmi 4 5 n/a
N1 26 32 n/a
N2 3.5 4 n/a
N3 3.5 4 n/a
Estrogen receptor (ER)- status
Negative 16 23 n/a
Positive 68 98 n/a
Missing 16 24 n/a
Progesterone receptor (PR)-status
Negative 54 78 n/a
Positive 30 43 n/a
Missing 16 24 n/a
Human epidermal growth factor receptor-2 (Her2)-status
Negative 68 99 n/a
Positive 10 15 n/a
Missing 22 31 n/a
n, number of individuals; SD, standard deviation; n/a, not applicable;
109
Serum N-Glycan Profiles Differ for Various Breast Cancer Subtypes
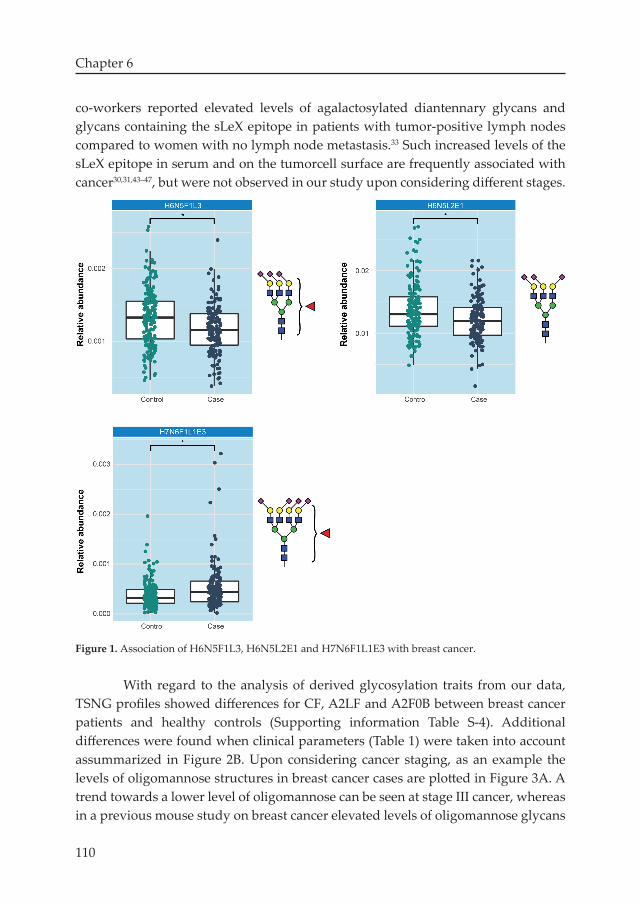
co-workers reported elevated levels of agalactosylated diantennary glycans and glycans containing the sLeX epitope in patients with tumor-positive lymph nodes compared to women with no lymph node metastasis.33 Such increased levels of the sLeX epitope in serum and on the tumorcell surface are frequently associated with cancer30,31,43–47, but were not observed in our study upon considering different stages.
Figure 1. Association of H6N5F1L3, H6N5L2E1 and H7N6F1L1E3 with breast cancer.
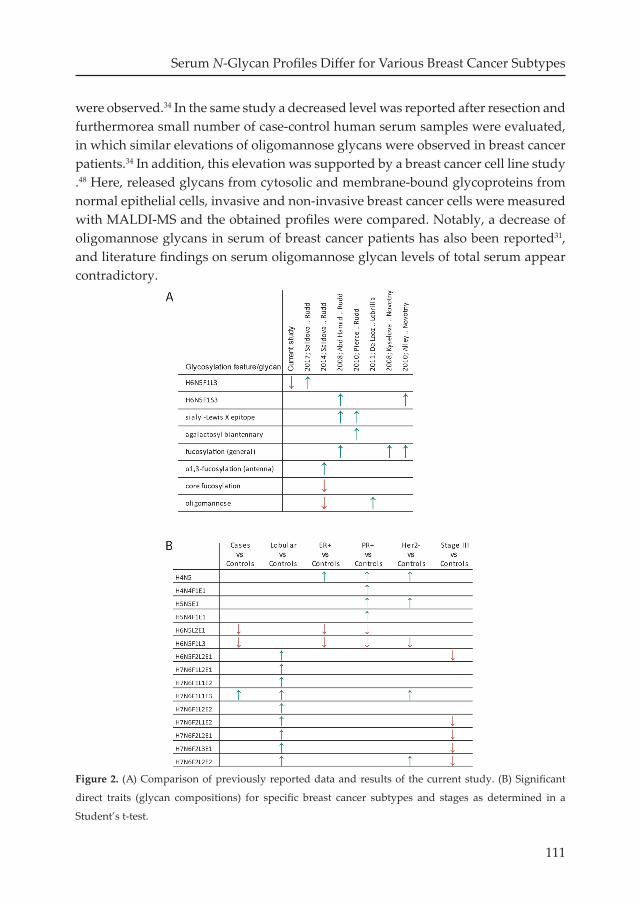
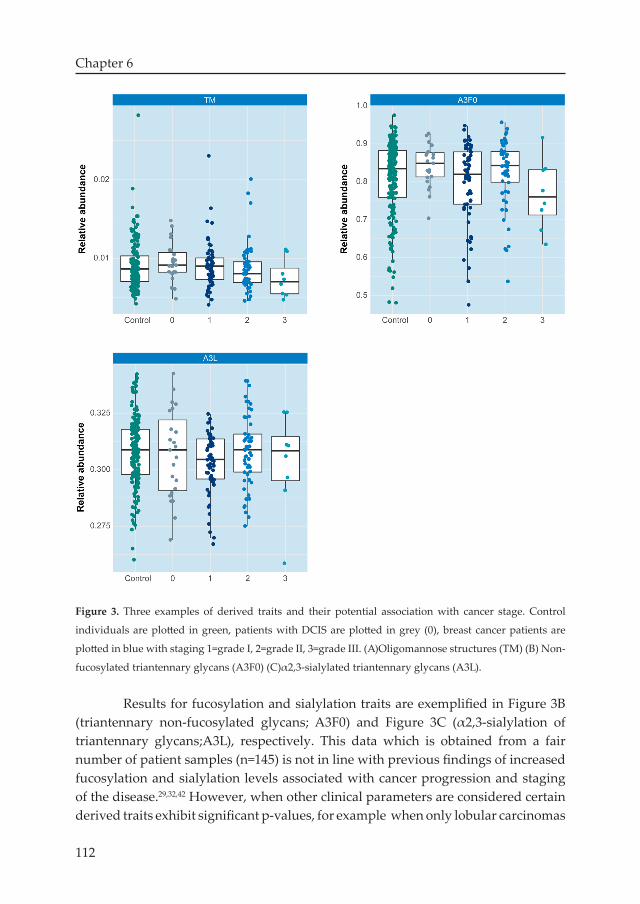
With regard to the analysis of derived glycosylation traits from our data, TSNG profiles showed differences for CF, A2LF and A2F0B between breast cancer patients and healthy controls (Supporting information Table S-4). Additional differences were found when clinical parameters (Table 1) were taken into account assummarized in Figure 2B. Upon considering cancer staging, as an example the levels of oligomannose structures in breast cancer cases are plotted in Figure 3A. A trend towards a lower level of oligomannose can be seen at stage III cancer, whereas in a previous mouse study on breast cancer elevated levels of oligomannose glycans
110
Chapter 6
were observed.34 In the same study a decreased level was reported after resection and furthermorea small number of case-control human serum samples were evaluated, in which similar elevations of oligomannose glycans were observed in breast cancer patients.34 In addition, this elevation was supported by a breast cancer cell line study .48 Here, released glycans from cytosolic and membrane-bound glycoproteins from normal epithelial cells, invasive and non-invasive breast cancer cells were measured with MALDI-MS and the obtained profiles were compared. Notably, a decrease of oligomannose glycans in serum of breast cancer patients has also been reported31, and literature findings on serum oligomannose glycan levels of total serum appear contradictory.
Figure 2. (A) Comparison of previously reported data and results of the current study. (B) Significant
direct traits (glycan compositions) for specific breast cancer subtypes and stages as determined in a
Student’s t-test.
111
Serum N-Glycan Profiles Differ for Various Breast Cancer Subtypes
Figure 3. Three examples of derived traits and their potential association with cancer stage. Control
individuals are plotted in green, patients with DCIS are plotted in grey (0), breast cancer patients are
plotted in blue with staging 1=grade I, 2=grade II, 3=grade III. (A)Oligomannose structures (TM) (B) Non-
Results for fucosylation and sialylation traits are exemplified in Figure 3B (triantennary non-fucosylated glycans; A3F0) and Figure 3C (α2,3-sialylation of triantennary glycans;A3L), respectively. This data which is obtained from a fair number of patient samples (n=145) is not in line with previous findings of increased fucosylation and sialylation levels associated with cancer progression and staging of the disease.29,32,42 However, when other clinical parameters are considered certain derived traits exhibit significant p-values, for example when only lobular carcinomas
112
Chapter 6
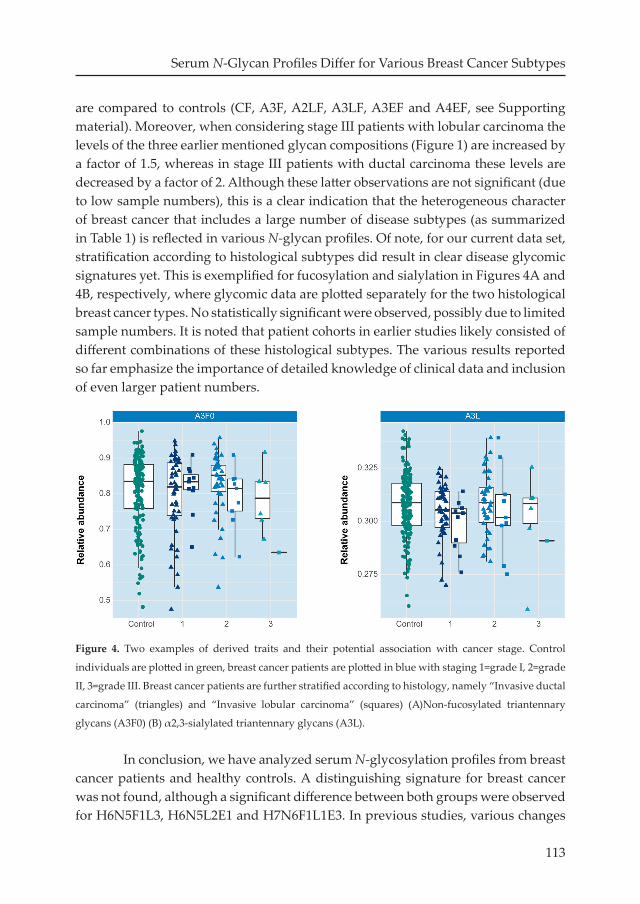
are compared to controls (CF, A3F, A2LF, A3LF, A3EF and A4EF, see Supporting material). Moreover, when considering stage III patients with lobular carcinoma the levels of the three earlier mentioned glycan compositions (Figure 1) are increased by a factor of 1.5, whereas in stage III patients with ductal carcinoma these levels are decreased by a factor of 2. Although these latter observations are not significant (due to low sample numbers), this is a clear indication that the heterogeneous character of breast cancer that includes a large number of disease subtypes (as summarized in Table 1) is reflected in various N-glycan profiles. Of note, for our current data set, stratification according to histological subtypes did result in clear disease glycomic signatures yet. This is exemplified for fucosylation and sialylation in Figures 4A and 4B, respectively, where glycomic data are plotted separately for the two histological breast cancer types. No statistically significant were observed, possibly due to limited sample numbers. It is noted that patient cohorts in earlier studies likely consisted of different combinations of these histological subtypes. The various results reported so far emphasize the importance of detailed knowledge of clinical data and inclusion of even larger patient numbers.
Figure 4. Two examples of derived traits and their potential association with cancer stage. Control
individuals are plotted in green, breast cancer patients are plotted in blue with staging 1=grade I, 2=grade
II, 3=grade III. Breast cancer patients are further stratified according to histology, namely “Invasive ductal
carcinoma” (triangles) and “Invasive lobular carcinoma” (squares) (A)Non-fucosylated triantennary
In conclusion, we have analyzed serum N-glycosylation profiles from breast cancer patients and healthy controls. A distinguishing signature for breast cancer was not found, although a significant difference between both groups were observed for H6N5F1L3, H6N5L2E1 and H7N6F1L1E3. In previous studies, various changes
113
Serum N-Glycan Profiles Differ for Various Breast Cancer Subtypes
in TSNG were reported, but also these results differed from each other and could not be replicated in our study. An evaluation of literature, together with the results of the current study, does not converge into a general breast cancer N-glycomic signature that distinguishes cases from controls. However, the fact that such glycomic markers are not observed can be explained by the heterogeneity of the disease and by the small size of patient cohorts. The heterogeneous character of the disease becomes clear from Table 1 that lists patients that exhibit various combinations of receptor statuses. Furthermore it is known that breast cancer tumors present a variety of histological patterns and biological characteristics.49 In addition, the clinical response of breast cancer tumors is very different per type and up to 25% of the invasive breast cancer tumors is histologically seen a special type.49 It is therefore recommended that in future biomarker discovery studies different subtypes within the breast cancer samples should be taken into account, instead of analyzing all breast cancer tumor subgroups together and aiming for an overarching signature.
Acknowledgements
This work was supported by the society “Genootschap ter ondersteuning van de vroege opsporing van
kanker” (Lisse, The Netherlands) to further endorse the development of a blood-based test for early
detection of cancer (no grant number applicable).
The authors would like to thank ing. Ronald L. van Vlierberghe (Biobank), Linda Verhoeff
(Datacenter) and Elly Krol and Gemma Rankes (Outpatient clinic) from the Leiden University Medical
Center for their assistance. They also would like to thank Dr. Alexia A. Kakourou and Dr. Bart J. A.
Mertens from the department of Biomedical Data Sciences at the Leiden University Medical Center for
performing batch correction.
114
Chapter 6
References(1) Bray, F.; Ferlay, J.; Soerjomataram, I.; Siegel, R. L.; Torre, L. A.; Jemal, A. Global Cancer Statistics 2018: GLOBOCAN
Estimates of Incidence and Mortality Worldwide for 36 Cancers in 185 Countries. CA. Cancer J. Clin. 2018, 68 (6), 394–424. https://doi.org/10.3322/caac.21492.
(2) Paap, E.; Verbeek, A. L. M.; Botterweck, A. A. M.; van Doorne-Nagtegaal, H. J.; Imhof-Tas, M.; de Koning, H. J.; Otto, S. J.; de Munck, L.; van der Steen, A.; Holland, R.; den Heeten, G. J.; Broeders, M. J. M. Breast Cancer Screening Halves the Risk of Breast Cancer Death: A Case-Referent Study. Breast 2014, 23 (4), 439–444. https://doi.org/10.1016/j.breast.2014.03.002.
(3) Warren, L. M.; Dance, D. R.; Young, K. C. Radiation Risk of Breast Screening in England with Digital Mammography. Br. J. Radiol. 2016, 89 (1067). https://doi.org/10.1259/bjr.20150897.
(4) Harris, L.; Fritsche, H.; Mennel, R.; Norton, L.; Ravdin, P.; Taube, S.; Somerfield, M. R.; Hayes, D. F.; Bast, R. C. American Society of Clinical Oncology 2007 Update of Recommendations for the Use of Tumor Markers in Breast Cancer. J. Clin. Oncol. 2007, 25 (33), 5287–5312. https://doi.org/10.1200/JCO.2007.14.2364.
(5) Lord, S. J.; St John, A.; Bossuyt, P. M. M.; Sandberg, S.; Monaghan, P. J.; O’Kane, M.; Cobbaert, C. M.; Röddiger, R.; Lennartz, L.; Gelfi, C.; Horvath, A. R.; Test Evaluation Working Group of the European Federation of Clinical Chemistry and Laboratory Medicine. Setting Clinical Performance Specifications to Develop and Evaluate Biomarkers for Clinical Use. Ann. Clin. Biochem. 2019, 56 (5), 527–535. https://doi.org/10.1177/0004563219842265.
(6) Rontogianni, S.; Synadaki, E.; Li, B.; Liefaard, M. C.; Lips, E. H.; Wesseling, J.; Wu, W.; Altelaar, M. Proteomic Profiling of Extracellular Vesicles Allows for Human Breast Cancer Subtyping. Commun. Biol. 2019, 2 (1), 325. https://doi.org/10.1038/s42003-019-0570-8.
(7) Anderson, L. Within Sight of a Rational Pipeline for Development of Protein Diagnostics. Clin. Chem. 2012, 58 (1), 28–30. https://doi.org/10.1373/clinchem.2011.173377.
(8) Lam, S. W.; Jimenez, C. R.; Boven, E. Breast Cancer Classification by Proteomic Technologies: Current State of Knowledge. Cancer Treat. Rev. 2014, 40 (1), 129–138. https://doi.org/10.1016/j.ctrv.2013.06.006.
(9) Chen, X.; Flynn, G. C. Analysis of N-Glycans from Recombinant Immunoglobulin G by on-Line Reversed-Phase High-Performance Liquid Chromatography/Mass Spectrometry. Anal. Biochem. 2007, 370 (2), 147–161. https://doi.org/10.1016/j.ab.2007.08.012.
(10) Belczacka, I.; Latosinska, A.; Metzger, J.; Marx, D.; Vlahou, A.; Mischak, H.; Frantzi, M. Proteomics Biomarkers for Solid Tumors: Current Status and Future Prospects. Mass Spectrom. Rev. 2019, 38 (1), 49–78. https://doi.org/10.1002/mas.21572.
(11) Abbatiello, S. E.; Schilling, B.; Mani, D. R.; Zimmerman, L. J.; Hall, S. C.; MacLean, B.; Albertolle, M.; Allen, S.; Burgess, M.; Cusack, M. P.; Gosh, M.; Hedrick, V.; Held, J. M.; Inerowicz, H. D.; Jackson, A.; Keshishian, H.; Kinsinger, C. R.; Lyssand, J.; Makowski, L.; Mesri, M.; Rodriguez, H.; Rudnick, P.; Sadowski, P.; Sedransk, N.; Shaddox, K.; Skates, S. J.; Kuhn, E.; Smith, D.; Whiteaker, J. R.; Whitwell, C.; Zhang, S.; Borchers, C. H.; Fisher, S. J.; Gibson, B. W.; Liebler, D. C.; MacCoss, M. J.; Neubert, T. A.; Paulovich, A. G.; Regnier, F. E.; Tempst, P.; Carr, S. A. Large-Scale Interlaboratory Study to Develop, Analytically Validate and Apply Highly Multiplexed, Quantitative Peptide Assays to Measure Cancer-Relevant Proteins in Plasma. Mol. Cell. Proteomics 2015, 14 (9), 2357–2374. https://doi.org/10.1074/mcp.M114.047050.
(12) Wang, H.; Shi, T.; Qian, W. J.; Liu, T.; Kagan, J.; Srivastava, S.; Smith, R. D.; Rodland, K. D.; Camp, D. G. The Clinical Impact of Recent Advances in LC-MS for Cancer Biomarker Discovery and Verification. Expert Rev. Proteomics 2016, 13 (1), 99–114. https://doi.org/10.1586/14789450.2016.1122529.
(13) Varki, A.; Gagneux, P. Biological Functions of Glycans. In Essentials of Glycobiology; Varki, A., Ed.; Cold Spring Harbor: New York, 2017.
(14) Smith, L. M.; Kelleher, N. L. Proteoforms as the next Proteomics Currency. Science (80-. ). 2018, 359 (6380), 1106–1107. https://doi.org/10.1126/science.aat1884.
(15) Aebersold, R.; Agar, J. N.; Amster, I. J.; Baker, M. S.; Bertozzi, C. R.; Boja, E. S.; Costello, C. E.; Cravatt, B. F.; Fenselau, C.; Garcia, B. A.; Ge, Y.; Gunawardena, J.; Hendrickson, R. C.; Hergenrother, P. J.; Huber, C. G.; Ivanov, A. R.; Jensen, O. N.; Jewett, M. C.; Kelleher, N. L.; Kiessling, L. L.; Krogan, N. J.; Larsen, M. R.; Loo, J. A.; Ogorzalek Loo, R. R.; Lundberg, E.; Maccoss, M. J.; Mallick, P.; Mootha, V. K.; Mrksich, M.; Muir, T. W.; Patrie, S. M.; Pesavento, J. J.; Pitteri, S. J.; Rodriguez, H.; Saghatelian, A.; Sandoval, W.; Schlüter, H.; Sechi, S.; Slavoff, S. A.; Smith, L. M.; Snyder, M. P.; Thomas, P. M.; Uhlén, M.; Van Eyk, J. E.; Vidal, M.; Walt, D. R.; White, F. M.; Williams, E. R.; Wohlschlager, T.; Wysocki, V. H.; Yates, N. A.; Young, N. L.; Zhang, B. How Many Human Proteoforms Are There? Nat. Chem. Biol. 2018, 14 (3), 206–214. https://doi.org/10.1038/nchembio.2576.
115
Serum N-Glycan Profiles Differ for Various Breast Cancer Subtypes
(16) Almeida, A.; Kolarich, D. The Promise of Protein Glycosylation for Personalised Medicine. Biochim. Biophys. Acta - Gen. Subj. 2016, 1860 (8), 1583–1595. https://doi.org/10.1016/j.bbagen.2016.03.012.
(17) Dotz, V.; Wuhrer, M. N -glycome Signatures in Human Plasma: Associations with Physiology and Major Diseases . FEBS Lett. 2019, 1–11. https://doi.org/10.1002/1873-3468.13598.
(18) Knežević, A.; Polašek, O.; Gornik, O.; Rudan, I.; Campbell, H.; Hayward, C.; Wright, A.; Kolčić, I.; O’Donoghue, N.; Bones, J.; Rudd, P. M.; Lauc, G. Variability, Heritability and Environmental Determinants of Human Plasma N-Glycome. J. Proteome Res. 2009, 8 (2), 694–701. https://doi.org/10.1021/pr800737u.
(19) Drake, P. M.; Cho, W.; Li, B.; Prakobphol, A.; Johansen, E.; Anderson, N. L.; Regnier, F. E.; Gibson, B. W.; Fisher, S. J. Sweetening the Pot: Adding Glycosylation to the Biomarker Discovery Equation. Clin. Chem. 2010, 56 (2), 223–236. https://doi.org/10.1373/clinchem.2009.136333.
(20) Kirwan, A.; Utratna, M.; O’Dwyer, M. E.; Joshi, L.; Kilcoyne, M. Glycosylation-Based Serum Biomarkers for Cancer Diagnostics and Prognostics. Biomed Res. Int. 2015, 2015, 490531. https://doi.org/10.1155/2015/490531.
(21) Kailemia, M. J.; Park, D.; Lebrilla, C. B. Glycans and Glycoproteins as Specific Biomarkers for Cancer. Anal. Bioanal. Chem. 2017, 409 (2), 395–410. https://doi.org/10.1007/s00216-016-9880-6.
(22) Kailemia, M. J.; Xu, G.; Wong, M.; Li, Q.; Goonatilleke, E.; Leon, F.; Lebrilla, C. B. Recent Advances in the Mass Spectrometry Methods for Glycomics and Cancer. Anal. Chem. 2018, 90 (1), 208–224. https://doi.org/10.1021/acs.analchem.7b04202.
(24) Song, E.; Mechref, Y. Defining Glycoprotein Cancer Biomarkers by MS in Conjunction with Glycoprotein Enrichment. Biomark. Med. 2015, 9 (9), 835–844. https://doi.org/10.2217/bmm.15.55.
(25) Breen, L. D.; Pučić-Baković, M.; Vučković, F.; Reiding, K.; Trbojević-Akmačić, I.; Gajdošik, M. Š.; Cook, M. I.; Lopez, M. J.; Wuhrer, M.; Camara, L. M.; Andjelković, U.; Dupuy, D. E.; Josić, D. IgG and IgM Glycosylation Patterns in Patients Undergoing Image-Guided Tumor Ablation. Biochim. Biophys. Acta - Gen. Subj. 2016, 1860 (8), 1786–1794. https://doi.org/10.1016/j.bbagen.2016.01.011.
(26) de Vroome, S. W.; Holst, S.; Girondo, M. R.; van der Burgt, Y. E. M.; Mesker, W. E.; Tollenaar, R. A. E. M.; Wuhrer, M. Serum N-Glycome Alterations in Colorectal Cancer Associate with Survival. Oncotarget 2018, 9 (55), 30610–30623. https://doi.org/10.18632/oncotarget.25753.
(27) Park, H.; Hwang, M. P.; Kim, Y.; Kim, K. J.; Jin, J. M.; Kim, Y. H.; Yang, Y. H.; Lee, K. H.; Kim, Y. G. Mass Spectrometry-Based N-Linked Glycomic Profiling as a Means for Tracking Pancreatic Cancer Metastasis. Carbohydr. Res. 2015, 413 (1), 5–11. https://doi.org/10.1016/j.carres.2015.04.019.
(28) Lauc, G.; Wuhrer, M. High-Throughput Glycomics and Glycoproteomics; Lauc, G., Wuhrer, M., Eds.; Methods in Molecular Biology; Springer New York: New York, NY, 2017; Vol. 1503. https://doi.org/10.1007/978-1-4939-6493-2.
(29) Kyselova, Z.; Mechref, Y.; Kang, P.; Goetz, J. A.; Dobrolecki, L. E.; Sledge, G. W.; Schnaper, L.; Hickey, R. J.; Malkas, L. H.; Novotny, M. V. Breast Cancer Diagnosis and Prognosis through Quantitative Measurements of Serum Glycan Profiles. Clin. Chem. 2008, 54 (7), 1166–1175. https://doi.org/10.1373/clinchem.2007.087148.
(30) Saldova, R.; Haakensen, V. D.; Rødland, E.; Walsh, I.; Stöckmann, H.; Engebraaten, O.; Børresen-Dale, A. L.; Rudd, P. M. Serum N-Glycome Alterations in Breast Cancer during Multimodal Treatment and Follow-Up. Mol. Oncol. 2017, 11 (10), 1361–1379. https://doi.org/10.1002/1878-0261.12105.
(31) Saldova, R.; Asadi Shehni, A.; Haakensen, V. D.; Steinfeld, I.; Hilliard, M.; Kifer, I.; Helland, Å.; Yakhini, Z.; Børresen-Dale, A. L.; Rudd, P. M. Association of N-Glycosylation with Breast Carcinoma and Systemic Features Using High-Resolution Quantitative UPLC. J. Proteome Res. 2014, 13 (5), 2314–2327. https://doi.org/10.1021/pr401092y.
(32) Abd Hamid, U. M.; Royle, L.; Saldova, R.; Radcliffe, C. M.; Harvey, D. J.; Storr, S. J.; Pardo, M.; Antrobus, R.; Chapman, C. J.; Zitzmann, N.; Robertson, J. F.; Dwek, R. A.; Rudd, P. M. A Strategy to Reveal Potential Glycan Markers from Serum Glycoproteins Associated with Breast Cancer Progression. Glycobiology 2008, 18 (12), 1105–1118. https://doi.org/10.1093/glycob/cwn095.
(33) Pierce, A.; Saldova, R.; Abd Hamid, U. M.; Abrahams, J. L.; McDermott, E. W.; Evoy, D.; Duffy, M. J.; Rudd, P. M. Levels of Specific Glycans Significantly Distinguish Lymph Node-Positive from Lymph Node-Negative Breast Cancer Patients. Glycobiology 2010, 20 (10), 1283–1288. https://doi.org/10.1093/glycob/cwq090.
(34) de Leoz, M. L. A.; Young, L. J. T. T.; An, H. J.; Kronewitter, S. R.; Kim, J.; Miyamoto, S.; Borowsky, A. D.; Chew, H. K.; Lebrilla, C. B. High-Mannose Glycans Are Elevated during Breast Cancer Progression. Mol. Cell. Proteomics 2011, 10 (1), 1–9. https://doi.org/10.1074/mcp.M110.002717-1.
(35) Terkelsen, T.; Haakensen, V. D. V. D.; Saldova, R.; Gromov, P.; Hansen, M. K. M. K.; Stöckmann, H.; Lingjærde, O. C. O. C.; Børresen-Dale, A. L. A.-L. A. L.; Papaleo, E.; Helland, Å.; Rudd, P. M. P. M.; Gromova, I.; Helland,
116
Chapter 6
A.; Rudd, P. M. P. M.; Gromova, I.; Helland, Å.; Rudd, P. M. P. M.; Gromova, I. N-Glycan Signatures Identified in Tumor Interstitial Fluid and Serum of Breast Cancer Patients: Association with Tumor Biology and Clinical Outcome. Mol. Oncol. 2018, 12 (6), 972–990. https://doi.org/10.1002/1878-0261.12312.
(36) Peng, W.; Goli, M.; Mirzaei, P.; Mechref, Y. Revealing the Biological Attributes of N-Glycan Isomers in Breast Cancer Brain Metastasis Using Porous Graphitic Carbon (PGC) Liquid Chromatography-Tandem Mass Spectrometry (LC-MS/MS). J. Proteome Res. 2019, 18 (10), 3731–3740. https://doi.org/10.1021/acs.jproteome.9b00429.
(37) Bladergroen, M. R.; Reiding, K. R.; Hipgrave Ederveen, A. L.; Vreeker, G. C. M.; Clerc, F.; Holst, S.; Bondt, A.; Wuhrer, M.; van der Burgt, Y. E. M. Automation of High-Throughput Mass Spectrometry-Based Plasma N -Glycome Analysis with Linkage-Specific Sialic Acid Esterification. J. Proteome Res. 2015, 14 (9), 4080–4086. https://doi.org/10.1021/acs.jproteome.5b00538.
(38) Reiding, K. R.; Blank, D.; Kuijper, D. M.; Deelder, A. M.; Wuhrer, M. High-Throughput Profiling of Protein N-Glycosylation by MALDI-TOF-MS Employing Linkage-Specific Sialic Acid Esterification. Anal. Chem. 2014, 86 (12), 5784–5793. https://doi.org/10.1021/ac500335t.
(39) Selman, M. H. J.; Hemayatkar, M.; Deelder, A. M. A. M.; Wuhrer, M. Cotton HILIC SPE Microtips for Microscale Purification and Enrichment of Glycans and Glycopeptides. Anal. Chem. 2011, 83 (7), 2492–2499. https://doi.org/10.1021/ac1027116.
(40) Vreeker, G. C. M.; Nicolardi, S.; Bladergroen, M. R.; van der Plas, C. J.; Mesker, W. E.; Tollenaar, R. A. E. M.; van der Burgt, Y. E. M.; Wuhrer, M. Automated Plasma Glycomics with Linkage-Specific Sialic Acid Esterification and Ultrahigh Resolution MS. Anal. Chem. 2018, 90 (20), 11955–11961. https://doi.org/10.1021/acs.analchem.8b02391.
(41) Chong, J.; Xia, J. MetaboAnalystR: An R Package for Flexible and Reproducible Analysis of Metabolomics Data. Bioinformatics 2018, 34 (24), 4313–4314. https://doi.org/10.1093/bioinformatics/bty528.
(42) Alley, W. R.; Madera, M.; Mechref, Y.; Novotny, M. V. Chip-Based Reversed-Phase Liquid Chromatography-Mass Spectrometry of Permethylated N-Linked Glycans: A Potential Methodology for Cancer-Biomarker Discovery. Anal. Chem. 2010, 82 (12), 5095–5106. https://doi.org/10.1021/ac100131e.
(43) Saldova, R.; Reuben, J. M.; Abd Hamid, U. M.; Rudd, P. M.; Cristofanilli, M. Levels of Specific Serum N-Glycans Identify Breast Cancer Patients with Higher Circulating Tumor Cell Counts. Ann. Oncol. 2011, 22 (5), 1113–1119. https://doi.org/10.1093/annonc/mdq570.
(44) Kossowska, B.; Ferens-Sieczkowska, M.; Gancarz, R.; Passowicz-Muszyńska, E.; Jankowska, R. Fucosylation of Serum Glycoproteins in Lung Cancer Patients. Clin. Chem. Lab. Med. 2005, 43 (4), 361–369. https://doi.org/10.1515/CCLM.2005.066.
(45) Reis, C. A.; Osorio, H.; Silva, L.; Gomes, C.; David, L. Alterations in Glycosylation as Biomarkers for Cancer Detection. J. Clin. Pathol. 2010, 63 (4), 322–329. https://doi.org/10.1136/jcp.2009.071035.
(46) Bassagañas, S.; Pérez-Garay, M.; Peracaula, R. Cell Surface Sialic Acid Modulates Extracellular Matrix Adhesion and Migration in Pancreatic Adenocarcinoma Cells. Pancreas 2014, 43 (1), 109–117. https://doi.org/10.1097/MPA.0b013e31829d9090.
(47) Arnold, J. N.; Saldova, R.; Abd Hamid, U. M.; Rudd, P. M. Evaluation of the Serum N-Linked Glycome for the Diagnosis of Cancer and Chronic Inflammation. Proteomics 2008, 8 (16), 3284–3293. https://doi.org/10.1002/pmic.200800163.
(48) Goetz, J. A.; Mechref, Y.; Kang, P.; Jeng, M. H.; Novotny, M. V. Glycomic Profiling of Invasive and Non-Invasive Breast Cancer Cells. Glycoconj. J. 2009, 26 (2), 117–131. https://doi.org/10.1007/s10719-008-9170-4.
(49) Weigelt, B.; Reis-Filho, J. S. Histological and Molecular Types of Breast Cancer: Is There a Unifying Taxonomy? Nat. Rev. Clin. Oncol. 2009, 6 (12), 718–730. https://doi.org/10.1038/nrclinonc.2009.166.
117
Serum N-Glycan Profiles Differ for Various Breast Cancer Subtypes


![Monoclonal antibody N-glycosylation profiling using capillary ...complex-matter.unistra.fr/fileadmin/upload/DUN/umr7140/...However, concerning MS-based methods [22–25], a large panel](https://static.documents.pub/doc/80x56/60b20fcd77a035659211f360/monoclonal-antibody-n-glycosylation-profiling-using-capillary-complex-however.jpg)


